receivables management and shits and shits!
DESCRIPTION
Receivables ManagementTRANSCRIPT
165
CHAPTER:- 6
Analysis of Receivable Management
Particular Page No.
Introduction 166
Meaning and definition 166
Factors affecting the size of receivables 172
Principal of Credit and Management 175
Objectives of Credit Management 177
Aspect of Credit Policy 178
Determination of Credit Policy 179
Collection of Accounts Receivables 186
Types of Collection Efforts 187
Degree of Collection Efforts 187
Collection Follow-up System 188
Credit control 189
Control of receivable 190
Payment Pattern Approach 191
Analysis of Credit Discount Costs 192
Computation 193
Receivables Management in selected steel
companies in India
193
Reference 205

166
INTRODUCTION:
Management of trade credit is commonly known as Management of Receivables.
Receivables are one of the three primary components of working capital, the other being
inventory and cash, the other being inventory and cash. Receivables occupy second important
place after inventories and thereby constitute a substantial portion of current assets in several
firms. The capital invested in receivables is almost of the same amount as that invested in
cash and inventories. Receivables thus, form about one third of current assets in India. Trade
credit is an important market tool. As, it acts like a bridge for mobilization of goods from
production to distribution stages in the field of marketing. Receivables provide protection to
sales from competitions. It acts no less than a magnet in attracting potential customers to buy
the product at terms and conditions favourable to them as well as to the firm. Receivables
management demands due consideration not financial executive not only because cost and
risk are associated with this investment but also for the reason that each rupee can contribute
to firm's net worth.
MEANING AND DEFINITION:
When goods and services are sold under an agreement permitting the customer to pay
for them at a later date, the amount due from the customer is recorded as accounts
receivables; So, receivables are assets accounts representing amounts owed to the firm as a
result of the credit sale of goods and services in the ordinary course of business. The value of
these claims is carried on to the assets side of the balance sheet under titles such as accounts
receivable, trade receivables or customer receivables. This term can be defined as "debt owed
to the firm by customers arising from sale of goods or services in ordinary course of
business." 1 According to Robert N. Anthony, "Accounts receivables are amounts owed to the
business enterprise, usually by its customers. Sometimes it is broken down into trade
accounts receivables; the former refers to amounts owed by customers, and the latter refers to
amounts owed by employees and others". 2
Generally, when a concern does not receive cash payment in respect of ordinary sale
of its products or services immediately in order to allow them a reasonable period of time to
pay for the goods they have received. The firm is said to have granted trade credit. Trade
credit thus, gives rise to certain receivables or book debts expected to be collected by the firm
in the near future. In other words, sale of goods on credit converts finished goods of a selling
firm into receivables or book debts, on their maturity these receivables are realized and cash

167
is generated. According to prasanna Chandra, "The balance in the receivables accounts would
be; average daily credit sales x average collection period." 3
The book debts or receivable arising out of credit has three dimensions:7-
It involves an element of risk, which should be carefully assessed. Unlike cash sales
credit sales are not risk less as the cash payment remains unreceived.
It is based on economics value. The economic value in goods and services passes to
the buyer immediately when the sale is made in return for an equivalent economic
value expected by the seller from him to be received later on.
It implies futurity, as the payment for the goods and services received
by the buyer is made by him to the firm on a future date.
The customer who represent the firm's claim or assets, from whom receivables or
book-debts are to be collected in the near future, are known as debtors or trade debtors. A
receivable originally comes into existence at the very instance when the sale is affected. But
the funds generated as a result of these ales can be of no use until the receivables are actually
collected in the normal course of the business. Receivables may be represented by
acceptance; bills or notes and the like due from others at an assignable date in the due course
of the business. As sale of goods is a contract, receivables too get affected in accordance with
the law of contract e.g. Both the parties (buyer and seller) must have the capacity to contract,
proper consideration and mutual assent must be present to pass the title of goods and above
all contract of sale to be enforceable must be in writing. Moreover, extensive care is needed
to be exercised for differentiating true sales form what may appear to be as sales like
bailment, sales contracts, consignments etc. Receivables, as are forms of investment in any
enterprise manufacturing and selling goods on credit basis, large sums of funds are tied up in
trade debtors. Hence, a great deal of careful analysis and proper management is exercised for
effective and efficient management of Receivables to ensure a positive contribution towards
increase in turnover and profits.
When goods and services are sold under an agreement permitting the customer to pay
for them at a later date, the amount due from the customer is recorded as accounts
receivables; so, receivables are assets accounts representing amounts owed to the firm as a
result of the credit sale of goods and services in the ordinary course of business. The value of
these claims is carried on to the assets side of the balance sheet under titles such as accounts
receivable, trade receivables or customer receivables. This term can be defined as "debt owed
168
to the firm by customers arising from sale of goods or services in ordinary course of
business." 1 According to Robert N. Anthony, "Accounts receivables are amounts owed to the
business enterprise, usually by its customers. Sometimes it is broken down into trade
accounts receivables; the former refers to amounts owed by customers, and the latter refers to
amounts owed by employees and others". 2
Generally, when a concern does not receive cash payment in respect of ordinary sale
of its products or services immediately in order to allow them a reasonable period of time to
pay for the goods they have received. The firm is said to have granted trade credit. Trade
credit thus, gives rise to certain receivables or book debts expected to be collected by the firm
in the near future. In other words, sale of goods on credit converts finished goods of a selling
firm into receivables or book debts, on their maturity these receivables are realized and cash
is generated. According to prasanna Chandra, "The balance in the receivables accounts would
be; average daily credit sales x average collection period." 3
The book debts or receivable arising out of credit has three dimensions:7-
It involves an element of risk, which should be carefully assessed. Unlike cash sales
credit sales are not risk less as the cash payment remains unreceived.
It is based on economics value. The economic value in goods and services passes to
the buyer immediately when the sale is made in return for an equivalent economic
value expected by the seller from him to be received later on.
It implies futurity, as the payment for the goods and services received by the
buyer is made by him to the firm on a future date.
The customer who represent the firm's claim or assets, from whom receivables or
book-debts are to be collected in the near future, are known as debtors or trade debtors. A
receivable originally comes into existence at the very instance when the sale is affected. But
the funds generated as a result of these ales can be of no use until the receivables are actually
collected in the normal course of the business.
Receivables may be represented by acceptance; bills or notes and the like due from
others at an assignable date in the due course of the business. As sale of goods is a contract,
receivables too get affected in accordance with the law of contract e.g. Both the parties
(buyer and seller) must have the capacity to contract, proper consideration and mutual assent
must be present to pass the title of goods and above all contract of sale to be enforceable must
be in writing. Moreover, extensive care is needed to be exercised for differentiating true sales
form what may appear to be as sales like bailment, sales contracts, consignments etc.

169
Receivables, as are forms of investment in any enterprise manufacturing and selling goods on
credit basis, large sums of funds are tied up in trade debtors. Hence, a great deal of careful
analysis and proper management is exercised for effective and efficient management of
Receivables to ensure a positive contribution towards increase in turnover and profits.
Instruments Indicating Receivables
Harry Gross4 has suggested three general instruments in a concern that provide proof
of receivables relationship. They are briefly discussed below: -
Open Book Account
This is an entry in the ledger of a creditor, which indicates a credit transaction. It is no
evidence of the existences of a debt under the Sales of Goods.
Negotiable Promissory Note
It is an unconditional written promise signed by the maker to pay a definite sum of
money to the bearer, or to order at a fixed or determinable time. Promissory notes are used
while granting an extension of time for collection of receivables, and debtors are unlikely to
dishonor its terms.
Increase in Profit
As receivables will increase the sales, the sales expansion would favorably raise the
marginal contribution proportionately more than the additional costs associated with such an
increase. This in turn would ultimately enhance the level of profit of the concern.
Meeting Competition
A concern offering sale of goods on credit basis always falls in the top priority list of
people willing to buy those goods. Therefore, a firm may resort granting of credit facility to
its customers in order to protect sales from losing it to competitors. Receivables acts as an
attracting potential customers and retaining the older ones at the same time by weaning them
away firm the competitors.
Augment Customer's Resources
Receivables are valuable to the customers on the ground that it augments their
resources. It is favoured particularly by those customers, who find it expensive and
cumbersome to borrow from other resources. Thus, not only the present customers but also
the Potential creditors are attracted to buy the firm's product at terms and conditions
favourable to them.
Speedy Distribution
170
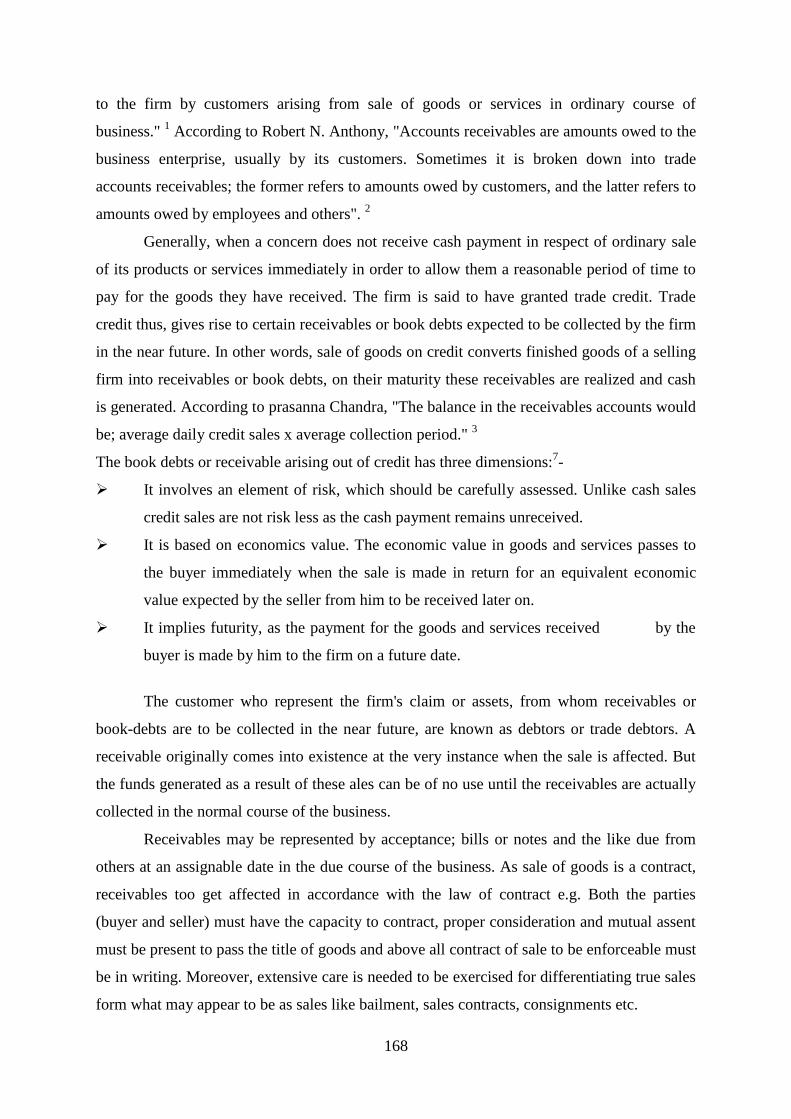
Receivables play a very important role in accelerating the velocity of distributions. As
a middleman would act quickly enough in mobilizing his quota of goods from the
productions place for distribution without any hassle of immediate cash payment. As, he can
pay the full amount after affecting his sales. Similarly, the customers would hurry for
purchasing their needful even if they are not in a position to pay cash instantly. It is for these
receivables are regarded as a bridge for the movement of goods form production to
distributions among the ultimate consumer. ;
Figure No.6.1
Miscellaneous The usual practice companies may resort to credit granting for various other reasons
like industrial practice, dealers relationship, status of buyer, customers requirements, transits
delay etc. In nutshell, the overall objective of making such commitment of funds in the name
of accounts receivables aims at generating a large flow of operating revenue and earning
171
more than what could be possible in the absence of such commitment. Figure 6.1 further
provides an easy explanation to the purpose for which they are maintained.
Cost of Maintaining Receivables Receivables are a type of investment made by a firm. Like other investments,
receivables too feature a drawback, which are required to be maintained for long that it
known as credit sanction. Credit sanction means tie up of funds with no purpose to solve yet
costing certain amount to the firm. Such costs associated with maintaining receivables are
detailed below: -
1. Administrative Cost If a firm liberalizes its credit policy for the good reasons of either maximizing sales or
minimizing erosion of sales, it incurs two types of costs:
(A) Credit Investigation and Supervision Cost. As a result of lenient credit policy, there happens to be a substantial increase in the
number of debtors. As a result the firm is required to analysis and supervises a large volume
of accounts at the cost of expenses related with acquiring credit information either through
outside specialist agencies or form its own staff.
(B) Collection Cost A firm will have to intensify its collection efforts so as to collect the outstanding bills
especially in case of customers who are financially less sound. It includes additional expenses
of credit department incurred on the creation and maintenance of staff, accounting records,
stationary, postage and other related items.
2. Capital Cost There is no denying that maintenance of receivables by a firm leads to blockage of its
financial resources due to the tie log that exists between the date of sale of goods to the
customer and the date of payment made by the customer. But the bitter fact remains that the
firm has to make several payments to the employees, suppliers of raw materials and the like
even during the period of time lag. As a consequence, a firm is liable to make arrangements
for meeting such additional obligations from sources other than sales. Thus, a firm in the
course of expanding sales through receivables makes way for additional capital costs.

172
3. Production and Selling Cost These costs are directly proportionate to the increase in sales volume. In other words,
production and selling cost increase with the very expansion in the quantum of sales. In this
respect, a firm confronts two situations; firstly when the sales expansion takes place within
the range of existing production capacity, in that case only variable costs relating to the
production and sale would increase. Secondly, when the production capacity is added due to
expansion of sales in excess of existing production capacity. In such a case incremental
production and selling costs would increase both variable and fixed costs.
4. Delinquency Cost This type of cost arises on account of delay in payment on customer's part or the
failure of the customers to make payments of the receivables as and when they fall due after
the expiry of the credit period. Such debts are treated as doubtful debts. They involve: -
(i) Blocking of firm's funds for an extended period of time,
(ii) Costs associated with the collection of overheads, remainders legal expenses and on
initiating other collection efforts.
5. Default Cost Similar to delinquency cost is default cost. Delinquency cost arises as a result of
customers delay in payments of cash or his inability to make the full payment from the firm
of the receivables due to him. Default cost emerges a result of complete failure of a defaulter
(customer) to pay anything to the firm in return of the goods purchased by him on credit.
When despite of all the efforts, the firm fails to realize the amount due to its debtors because
of him complete inability to pay for the same. The firm treats such debts as bad debts, which
are to be written off, as cannot be recovers in any case.
FACTORS AFFECTING THE SIZE OF RECEIVABLES: The size of receivables is determined by a number of factors for receivables being a
major component of current assets. As most of them varies from business the business in
accordance with the nature and type of business. Therefore, to discuss all of them would
prove irrelevant and time consuming. Some main and common factors determining the level
of receivable are presented by way of diagram in figure given below and are discuses below :

173
Stability of Sales
Stability of sales refers to the elements of continuity and consistency in the sales. In
other words the seasonal nature of sales violates the continuity of sales in between the year.
So, the sale of such a business in a particular season would be large needing a large a size of
receivables. Similarly, if a firm supplies goods on installment basis it will require a large
investment in receivables.
Terms of Sale
A firm may affect its sales either on cash basis or on credit basis. As a matter of fact
credit is the soul of a business. It also leads to higher profit level through expansion of sales.
The higher the volume of sales made on credit, the higher will be the volume of receivables
and vice-versa.
The Volume of Credit Sales
It plays the most important role in determination of the level of receivables. As the terms
of trade remains more or less similar to most of the industries. So, a firm dealing with a high
level of sales will have large volume of receivables.
Credit Policy
A firm practicing lenient or relatively liberal credit policy its size of receivables will be
comparatively large than the firm with more rigid or signet credit policy. It is because of two
prominent reasons: -
A lenient credit policy leads to greater defaults in payments by financially weak
customers resulting in bigger volume of receivables.
174
A lenient credit policy encourages the financially sound customers to delay payments
again resulting in the increase in the size of receivables.
Terms of Sale The period for which credit is granted to a customer duly brings about increase or
decrease in receivables. The shorter the credit period, the lesser is the amount of receivables.
As short term credit ties the funds for a short period only. Therefore, a company does not
require holding unnecessary investment by way of receivables.
Cash Discount Cash discount on one hand attracts the customers for payments before the lapse of
credit period. As a tempting offer of lesser payments is proposed to the customer in this
system, if a customer succeeds in paying within the stipulated period. On the other hand
reduces the working capital requirements of the concern. Thus, decreasing the receivables
management.
Collection Policy The policy, practice and procedure adopted by a business enterprise in granting credit,
deciding as to the amount of credit and the procedure selected for the collection of the same
also greatly influence the level of receivables of a concern. The more lenient or liberal to
credit and collection policies the more receivables are required for the purpose of investment.
Collection Collected If an enterprise is efficient enough in encasing the payment attached to the receivables
within the stipulated period granted to the customer. Then, it will opt for keeping the level of
receivables low. Whereas, enterprise experiencing undue delay in collection of payments will
always have to maintain large receivables.
Bills Discounting and Endorsement If the firm opts for discounting its bills, with the bank or endorsing the bills to the
third party, for meeting its obligations. In such circumstances, it would lower the level of
receivables required in conducting business.
Quality of Customer If a company deals specifically with financially sound and credit worthy customers
then it would definitely receive all the payments in due time. As a result the firm can
comfortably do with a lesser amount of receivables than in case where a company deals with
customers having financially weaker position.

175
Miscellaneous
There are certain general factors such as price level variations, attitude of
management type and nature of business, availability of funds and the lies that play
considerably important role in determining the quantum of receivables.
PRINCIPLES OF CREDIT MANAGEMENT:
Joseph L. Wood is of the opinion, "The purpose of any commercial enterprise is the
earning of profit, credit in itself is utilized to increase sale, but sales must return a profit."5
The primary objective of management or receivables should not be limited to expansion of
sales but should involve maximization of overall returns on investment. So, receivables
management should not be confined to mere collection or receivables within the shortest
possible period but is required to focus due attention to the benefit-cost trade-off relating to
numerous receivables management.
In order to add profitability, soundness and effectiveness to receivables management,
an enterprise must make it a point to follow certain well-established and duly recognized
principles of credit management."The first of these principles relate to the allocation of
authority pertaining to credit and collections of some specific management. The second
principle puts stress on the selection of proper credit terms. The third principles emphasizes a
through credit investigation before a decision on granting a credit is taken. And the last
principle touches upon the establishment of sound collection policies and procedures."6 In the
light of this quotation the principles of receivables management can be stated as: -
1. Allocation or Authority The determination of sound and effective credit collection policies management. The
efficiency of a credit management in formulation and exestuation of credit and collection
policies largely depends upon the location of credit department in the organizational structure
f the concern. The aspect of authority allocation can be viewed under two concepts. As per
the first concept, it is placed under the direct responsibility of chief finance officer for it
being a function primarily financed by nature. Further, credit and collection policies lay
direct influence on the solvency of the firm. "For these reasons the credit and collection
function should be placed under the direct supervision of the individuals who are responsible
for the firm's financial position." "There are other who suggest that business firms should
strictly enforce upon their sales departments the principles that sales are insolate until the

176
value thereof is realsied8 Those favoring this aspect plead to place the authority of allocation
under the direct charge of the marketing executive or the sales department. To conclude "the
reasonability to administer credit and collections policies may be assigned either to a
financial executive or to a marketing executive or to both of them jointly depending upon the
organizational structure and the objectives of the firm."9
2. Selection of Proper Credit Terms The receivables management of an enterprise is required to determine the terms and
conditions on the basis of which trade credit can be sanctioned to the customers are of vital
importance for an enterprise. As the nature of the credit policy of an enterprise is decided on
the basis of components of credit policy. These components include; credit period, cash
discount and cash discount period. In practice, the credit policy of firms, vary within the
range of lenient and stringent. A firm that tends to grant long period credits and its debtors
include even those customers whose financial position is doubtful. Such a firm is said to be
following lenient credit policy. Contrary to this, a firm providing credit sales for a relatively
short period of time that too on highly selective basis only to those customers who are
financially strong and have proven their credit worthiness is said to be following stringent
credit policy.
3. Credit Investigation A firm if desires to maintain effective and efficient receivables management of
receivables must undertake a thorough investigation before deciding to grant credit to a
customer. The investigation is required to be carried on with respect to the credit worthiness
and financial soundness of the debtors, so as to prevent the receivables for falling into the
category of bad debts later on at the time of collection. Credit investigation is not only carried
on beforehand. But in the case of firms practicing liberal credit policy such investigation may
be required to be conducted when a debtors fails to make payments of receivables due on him
even after the expiry of credit sale so as to save doubtful debts from becoming bad debts.
4. Sound Collection Policies and Procedures Receivables management is linked with a good degree of risk. As a few debtors are
slow payers and some are non-payers. How-so-ever efficient and effective a receivables
management may be the element of risk cannot be avoided altogether but can be minimized
to a great extent, it is for this reason the essence of sound collection policies and procedures
arises. A sound collection policy aims at accelerating collection form slow payer and

177
reducing bad debts losses. As a good collection polices ensures prompt and regular collection
by adopting collection procedures in a clear-cut sequence.
OBJECTIVES OF CREDIT MANAGEMENT: The objective of receivables management is to promote sales and profit until that is
reached where the return on investment in further finding of receivable is less than the cost of
funds raised to finance that additional credit (i.e., cost of capital). The primary aim of
receivables management vet in minimizing the value of the firm while maintaining a
reasonable balance between risk (in the form of liquidity) and profitability. The main purpose
of maintain receivables is not sales maximization not is for minimization of risk involved by
way of bad debts. Had the main objective being growth of sales, the concern, would have
opened credit sales for all sort of customers. Contrary to this, if the aim had been
minimization of risk of bad debts, the firm would not have made any credit sale at all. That
means a firm should indulge in sales expansion by way of receivables only until the extent to
which the risk remains within an acceptably manageable limit.
All in all, the basic target of management of receivables is to enhance the overall
return on the optimum level of investment made by the firm in receivables. The optimum
investment is determined by comparing the benefits to be derived from a particular level of
investment with the cost of maintaining that level. The costs involve not only the funds tied
up in receivables, but also losses from accounts that do not pay. The latter arises from
extending credit too leniently.
A brief inference of objectives of management of receivables may be given as under: -
To attain not maximum possible but optimum volume of sales.
To exercise control over the cost of credit and maintain it on a minimum possible
level.
To keep investments at an optimum level in the form or receivables.
To plan and maintain a short average collection period.
Granting of credit and its proper and effective management is not possible without
involvement of any cost. These costs are credit administrative expenses bad debts losses,
opportunity costs etc. As mentioned before these costs cannot be possibly eliminated
altogether but should essentially be regulated and controlled. Elimination of such costs
simply mean reducing the cost of zero i.e. no credit grant is permitted to the debtors. In that
case firm would no doubt escape form incurring there costs yet the other face of coin would
reflect that the profits foregone on account of expected rise in sales volume made on credit

178
amounts much more than the costs eliminated. Thus, a firm would fail to materialize the
objective of increasing overall return of investment. The period goal of receivables
management is to strike a golden mean among risk, liquidity and profitability turns out to be
effective marketing tool. As it helps in capturing sales volume by winning new customers
besides retaining to old ones.
ASPECT OF CREDIT POLICY: The discharge of the credit function in a company embraces a number of activities for
which the policies have to be clearly laid down. Such a step will ensure consistency in credit
decisions and actions. A credit policy thus, establishes guidelines that govern grant or reject
credit to a customer, what should be the level of credit granted to a customer etc. A credit
policy can be said to have a direct effect on the volume of investment a company desires to
make in receivables.
A company falls prey of many factors pertaining to its credit policy. In addition to
specific industrial attributes like the trend of industry, pattern of demand, pace of technology
changes, factors like financial strength of a company, marketing organization, growth of its
product etc. also influence the credit policy of an enterprise. Certain considerations demand
greater attention while formulating the credit policy like a product of lower price should be
sold to customer bearing greater credit risk. Credit of smaller amounts results, in greater
turnover of credit collection. New customers should be least favored for large credit sales.
The profit margin of a company has direct relationship with the degree or risk. They are said
to be inter-woven. Since, every increase in profit margin would be counterbalanced by
increase in the element of risk. As observed by Harry Gross, "Two very important
considerations involved in incurring additional credit risk are: the market for a company's
product and its capacity to satisfy that market. If the demand for the seller's product is greater
than its capacity to produce, then it would be more selective in granting credit to its
customers. Conversely, if the supply of the product exceeds the demand, the seller would be
more likely to lower credit standards with resulting greater risk."10
Such a conditions would
appear in case of a company having excess capacity coupled with high profitability and
increased sales volume.
Credit policy of every company is at large influenced by two conflicting objectives
irrespective of the native and type of company. They are liquidity and profitability. Liquidity
can be directly linked to book debts. Liquidity position of a firm can be easily improved
without affecting profitability by reducing the duration of the period for which the credit is
179
granted and further by collecting the realized value of receivables as soon as they fails due.
To improve profitability one can resort to lenient credit policy as a booster of sales, but the
implications are: -
1. Changes of extending credit to those with week credit rating.
2. Unduly long credit terms.
3. Tendency to expand credit to suit customer's needs; and
4. Lack of attention to over dues accounts.
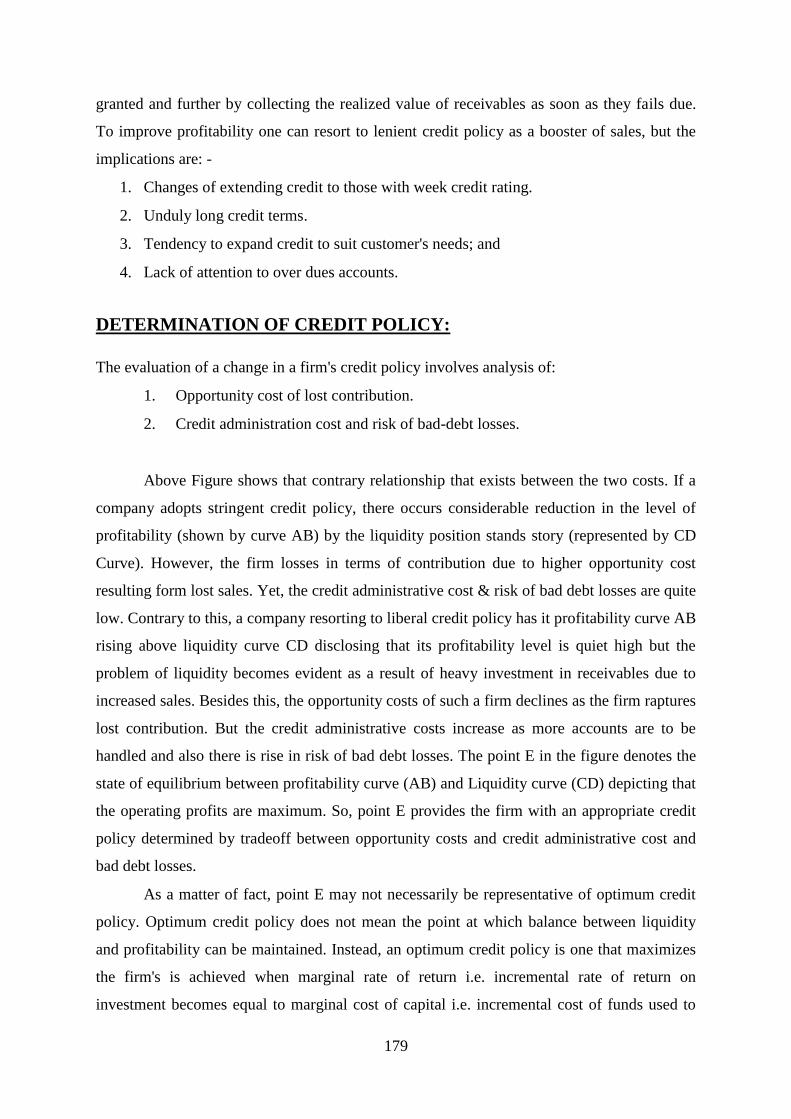
DETERMINATION OF CREDIT POLICY:
The evaluation of a change in a firm's credit policy involves analysis of:
1. Opportunity cost of lost contribution.
2. Credit administration cost and risk of bad-debt losses.
Above Figure shows that contrary relationship that exists between the two costs. If a
company adopts stringent credit policy, there occurs considerable reduction in the level of
profitability (shown by curve AB) by the liquidity position stands story (represented by CD
Curve). However, the firm losses in terms of contribution due to higher opportunity cost
resulting form lost sales. Yet, the credit administrative cost & risk of bad debt losses are quite
low. Contrary to this, a company resorting to liberal credit policy has it profitability curve AB
rising above liquidity curve CD disclosing that its profitability level is quiet high but the
problem of liquidity becomes evident as a result of heavy investment in receivables due to
increased sales. Besides this, the opportunity costs of such a firm declines as the firm raptures
lost contribution. But the credit administrative costs increase as more accounts are to be
handled and also there is rise in risk of bad debt losses. The point E in the figure denotes the
state of equilibrium between profitability curve (AB) and Liquidity curve (CD) depicting that
the operating profits are maximum. So, point E provides the firm with an appropriate credit
policy determined by tradeoff between opportunity costs and credit administrative cost and
bad debt losses.
As a matter of fact, point E may not necessarily be representative of optimum credit
policy. Optimum credit policy does not mean the point at which balance between liquidity
and profitability can be maintained. Instead, an optimum credit policy is one that maximizes
the firm's is achieved when marginal rate of return i.e. incremental rate of return on
investment becomes equal to marginal cost of capital i.e. incremental cost of funds used to
180
finance the investment. The incremental rate of return is obtained by dividing incremental
investment in receivables. While the incremental cost of funds, is the rate of return expected
by firm granting the credit. This rate of return is not equal to borrowing rate. As in case of
firm following loose credit policy, higher rate of return means higher risk of invest in A/c's
receivables due to slow paying and defaulting accounts.
To sum up, in order to achieve the goal of maximizing the value of the firm the
evaluation of investment in receivables accounts should involve the following four steps:
1. Estimation of incremental operating profit,
2. Estimation of incremental investment in accounts receivables,
3. Estimation of the incremental rate of return of investment,
4. Comparison of incremental rate of return with the required rate of return.
The reality, it is rather a different task to establish an optimum credit policy as
the best combination of variables of credit policy is quite difficult to obtain. The important
variables of credit policy should be identified before establishing an optimum credit policy.
The three important decisions variables of credit policy are:
1. Credit terms,
2. Credit standards, and
3. Collection policy.
1. Credit Terms
Credit terms refer to the stipulations recognized by the firms for making credit sale of
the goods to its buyers. In other words, credit terms literally mean the terms of payments of
the receivables. A firm is required to consider various aspects of credit customers, approval
of credit period, acceptance of sales discounts, provisions regarding the instruments of
security for credit to be accepted are a few considerations which need due care and attention
like the selection of credit customers can be made on the basis of firms, capacity to absorb the
bad debt losses during a given period of time. However, a firm may opt for determining the
credit terms in accordance with the established practices in the light of its needs. The amount
of funds tied up in the receivables is directly related to the limits of credit granted to
customers. These limits should never be ascertained on the basis of the subjects own
requirements, they should be based upon the debt paying power of customers and his ledger

181
record of the orders and payments. There are two important components of credit terms
which are detailed below:-
(A) Credit period and
(B) Cash discount terms
(A) Credit period According to Martin H. Seiden, "Credit period is the duration of time for which trade
credit is extended. During this time the overdue amount must be paid by the customers."11
The credit period lays its multi-faced effect on many aspects the volume of investment in
receivables; its indirect influence can be seen on the net worth of the company. A long period
credit term may boost sales but it‘s also increase investment in receivables and lowers the
quality of trade credit. While determining a credit period a company is bound to take into
consideration various factors like buyer's rate of stock turnover, competitors approach, the
nature of commodity, margin of profit and availability of funds etc.
The period of credit diners form industry to industry. In practice, the firms of
same industry grant varied credit period to different individuals. as most of such firms decide
upon the period of credit to be allowed to a customer on the basis of his financial position in
addition to the nature of commodity, quality involved in transaction, the difference in the
economic status of customer that may considerably influence the credit period.
The general way of expressing credit period of a firm is to coin it in terms of
net date that is, if a firm's credit terms are "Net 30", it means that the customer is expected to
repay his credit obligation within 30 days. Generally, a free credit period granted, to pay for
the goods purchased on accounts tends to be tailored in relation to the period required for the
business and in turn, to resale the goods and to collect payments for them.
A firm may tighten its credit period if it confronts fault cases too often and fears
occurrence of bad debt losses. On the other side, it may lengthen the credit period for
enhancing operating profit through sales expansion. Anyhow, the net operating profit would
increase only if the cost of extending credit period will be less than the incremental operating
profit. But the increase in sales alone with extended credit period would increase the
investment in receivables too because of the following two reasons: -
(i) Incremental sales result into incremental receivables,
(ii) The average collection period will get extended, as the customers will be granted
more time to repay credit obligation.

182
Determining the options credit period, therefore, involves locating the period where
marginal profit and increased sales are exactly off set by the cost of carrying the higher
amount of accounts receivables.
(B) Cash Discount Terms
The cash discount is granted by the firm to its debtors, in order to induce them to
make the payment earlier than the expiry of credit period allowed to them. Granting discount
means reduction in prices entitled to the debtors so as to encourage them for early payment
before the time stipulated to the i.e. the credit period. According to Theodore N. Beckman,
"Cash discount is a premium on payment of debts before due date and not a compensation for
the so called prompt payment,'*2 Grant of cash discount beneficial to the debtor is profitable
to the creditor as well. A customer of the firm i.e. debtor would be realized from his
obligation to pay Soon that too at discounted prices. On the other hand, it increases the
turnover rate of working capital and enables the creditor firm to operate a greater volume of
working capital. It also prevents debtors from using trade credit as a source of working
capital.
Cash discount is expressed is a percentage of sales. A cash discount term is
accompanied by (a) the rate of cash discount, (b) the cash discount period, and (c) the net
credit period. For instance, a credit term may be given as "1/10 Net 30" that mean a debtor is
granted 1 percent discount if settles his accounts with the creditor before the tenth day
starting from a day after the date of invoice. But in case the debtor does not opt for discount
he is bound to terminate his obligation within the credit period of thirty days.
Change in cash discount can either have positive or negative implication and at times
both. Any increase in cash discount would directly increase the volume of credits sale. As the
cash discount reduces the price of commodity for sale. So, the demand for the product
ultimately increase leading to more sales. On the other hand, cash discount lures the debtors
for prompt payment so that they can relish the discount facility available to them. This in turn
reduces the average collection period and bad debt expenses thereby, brining about a decline
in the level of investment in receivables. Ultimately the profits would increase. Increase in
discount rate can negatively affect the profit margin per unit of sale due to reduction of
prices. A situation exactly reverse of the one stated above will occur in case of decline in cash
discount.

183
As pointed out by N.K. Agarwal, 'we market out or products through established
dealers. If sometimes payment is not received within the credit period, it is just not possible
to deny discount as it would spoil business relations.'*3 Yet, the management of business
enterprises should always take note of the point that cash discount, as a percentage of invoice
prices, must not be high as to have an uneconomic bearing on the financial position of the
concern. It should be seen in this connection that terms of sales include net credit period so
that cash discount may continue to retain its significance and might be prevented from being
treated by the buyers just like quantity discount. To make cash discount an effective tool of
credit control, a business enterprise should also see that is allowed to only those customers
who make payments at due date. And finally, the credit terms of an enterprise on the receipt
of securities while granting credit to its customers. Credit sales may be got secured by being
furnished with instruments such as trade acceptance, promissory notes or bank
guarantees.
2. Credit Standards
Credit standards refers to the minimum criteria adopted by a firm for the purpose of
short listing its customers for extension of credit during a period of time. Credit rating, credit
reference, average payments periods a quantitative basis for establishing and enforcing credit
standards. The nature of credit standard followed by a firm can be directly linked to changes
in sales and receivables. In the opinion of Van Home, "There is the cost of additional
investment in receivables, resulting from increased sales and a slower average collection
period.‖14
A liberal credit standard always tends to push up the sales by luring customers into
dealings. The firm, as a consequence would have to expand receivables investment along
with sustaining costs of administering credit and bad-debt losses. As a more liberal extension
of credit may cause certain customers to the less conscientious in paying their bills on time.
Contrary, to these strict credit standards would mean extending credit to financially sound
customers only. This saves the firm from bad debt losses and the firm has to spend lesser by a
way of administrative credit cost. But, this reduces investment in receivables besides
depressing sales. In this way profit sacrificed by the firm on account of losing sales amounts
more than the cost saved by the firm.
Prudently, a firm should opt for lowering its credit standard only up to that level
where profitability arising through expansion in sales exceeds the various costs associated

184
with it. That way, optimum credit standards can be determined and maintained by inducing
tradeoff between incremental returns and incremental costs.
Analysis of Customers
The quality of firm's customers largely depends upon credit standards. The quality of
customers can be discussed under too main aspects; average collection period and default
rate.
(i) Average Collection Period: It is the time taken by customers bearing credit
obligation in materializing payment. It is represented in terms of the number of days,
for which the credit sales remains outstanding. A longer collection period always
enlarges the investment in receivables.
(ii) Default Rate: This can be expressed in terms of debt-losses to the proportion of
uncontrolled receivables. Default rate signifies the default risk i.e. profitability of
customers failure to pay back their credit obligation.
I.M. Pandey 15
has cited three Cs of credit termed as character, capacity and
condition that estimate the likelihood of default and its effect on the firms'
management credit standards. Two more Cs have been added35
to the three Cs of
I.M. Pandey, namely; capital and collateral. All the five Cs of credit are discussed
below in brief.
(iii) Character: Character means reputation of debtor for honest and fair dealings. It
refers to the free will or desire of a debtor of a firm to pay the amount of receivables
within the stipulated time i.e. credit period. In practice, the moral of customer is
considered important in valuation of credit. The character of customer losses its
importance if the receivable is secured by way of appropriate and adequate security.
(iv) Capacity: Capacity refers to the experience of the customers and his demonstratal
ability to operate successfully. It is the capacity particularly financial ability of a
customer to borrow from other sources in orders discharges his obligations to honors
contract of the firm.
(v) Capital; Capital refers to the financial standing of a customer. Capital acts as a
guarantee of the customers' capacity to pay. But, it should be noted that a customer
may be capable of paying by means of borrowing even if his capital holding are
scarce.
(vi) Collateral: Collaterals are the assets that a customer readily offers to the creditor (i.e.
firm granting credit) as a security, which should be possessed by the firm in the event

185
of non-payment by the customer. A firm should be particular with regards to the real
worth of assets offered to it as collateral security
(vii) Conditions: Conditions refer to the prevailing economic and other conditions, which
can place their favorable or unfavorable impact on the ability of customer to pay.
A firm must ensure that its customers have completely and accurately furnished with the
above stated information. As a matter of precaution a firm should carry out credit
investigation on its own level. This involves two basic steps:
The first step involves obtaining credit information from internal and external source.
Internal sources includes filling up various documents (pertaining to the financial
details of the credit applicants) and records (that fulfill formalities related with
extension of credit) of a concern. The external sources of information are financial
statements, bank references, sales representatives' report, past experience of the
concern etc.
The second step involves analysis of credit information obtained in respect of the
applicant for deciding the grant of credit as well as its quantum. A concern is free to
adopt any procedure that suits its needs and fulfill the desired requirements, as there
are no established procedures for analysis of information. But, it must be born in mind
that the analysis procedure shall be competent enough to suit both the qualitative and
quantitative aspects of the applicant. Qualitative aspect refers to customer's character,
goodwill and credit worthiness. While the quantitative aspect is based on the factual
information available from the applicants finances statements, his past records and the
like factors. As a matter of fact the ultimate decision of credit extension and the
volume of credit depend upon the subjective interpretations of his credit standing.
No doubt, credit investigation involves cost. So, it shall be conducts as per the
requirements of the situations. But the fact cannot be ignored that a credit decision taken in
the absence of adequate and proper investigation to save costs related with such investigation
proves much more costly due to bad debts, excessive collection costs etc. Thus, credit
investigation is justified on such grounds. A firm can thereby, gainfully empty such
information in classifying the customers in accordance with their credit-worthiness and
estimate the probable default risk. This shall also be referred to while formulating the credit
standards of business enterprises.

186
3. Collection Policy
Collection policy refers to the procedures adopted by a firm (creditor) collect the
amount of from its debtors when such amount becomes due after the expiry of credit period.
R.K. Mishra States, "A collection policy should always emphasize promptness, regulating
and systematization in collection efforts. It will have a psychological effect upon the
customers, in that; it will make them realize the obligation of the seller towards the
obligations granted. "16
The requirements of collection policy arises on account of the
defaulters i.e. the customers not making the payments of receivables in time. As a few
turnouts to be slow payers and some other non-payers. A collection policy shall be
formulated with a whole and sole aim of accelerating collection from bad-debt losses by
ensuring prompt and regular collections. Regular collection on one hand indicates collection
efficiency through control of bad debts and collection costs as well as by inducing velocity to
working capital turnover. On the other hand it keeps debtors alert in respect of prompt
payments of their dues. A credit policy is needed to be framed in context of various
considerations like short-term operations, determinations of level of authority, control
procedures etc. Credit policy of an enterprise shall be reviewed and evaluated periodically
and if necessary amendments shall be made to suit the changing requirements of the business.
It should be designed in such a way that it co-ordinates activities of concerns departments to
achieve the overall objective of the business enterprises.1 finally, poor implementation of
good credit policy will not produce optimal results.
COLLECTION OF ACCOUNTS RECEIVABLES:
Despite of firm's best precautionary efforts in escaping the bad and doubtful debts,
there always exist certain number of unpaid accounts on the due date. Three-well-known
causes of failure of such payments on the part of debtors (i.e. firm's customer) can be sited as:
It may happen at times that the due date of payment slips from debtors mind and he
delays in making good the payments at the right time.
It may incidentally occur at the time of grant of credit that a firm fails to access and
interpret the character, capacity, capital, Collateral and conditions correctly and
appropriately.
There may arise a considerable change in the financial position of a debtor after the
credit has been granted to him by the firm.

187
All the above stated reasons compel a firm to formulate a collection programme to
obtain recovery or receivables from delinquent account. Such progarmme may consist of
following steps:
Monitoring the state of receivables,
Dispatch of letters to customers whose due date is near.
Telegraphic and telephone advice to customers around the due date.
Threat of legal action to overdue accounts, and
Legal actions against overdue accounts.
TYPES OF COLLECTION EFFORTS:
A well-established collection policy always attempts at enlisting a clear-cut guidelines
in order of a sequence that too in precise terms for collection of overdue from the customers.
As a cord of suggestion, the sequence adopted must be capable of brining effectiveness and
efficiency in collection policy. For instance, if the credit period granted to customer lapses
but he does not pay. The firm should begin with a polite letter of reminder reflecting demand
of payment. This may be followed by telegram or telephone or even a personal visit by firm's
representative. After that a firm may proceed for legal action if the amount of receivables will
remains unpaid. It should be noted that as an account becomes more and more overdue, the
collection efforts becomes more personal and strict. But before initiating any legal action, the
financial position of the debtor must be considered. A legal action against a customer, who
bears a wear financial condition would be of no good to the firm, instead will cause
customers bankruptcy reducing the chance of even a marginal amount of payment. Thus, a
concern should face such a situation with patient and try to settle the account by accepting a
reduced payment.
DEGREE OF COLLECTION EFFORTS:
The efforts on collection policy can be better explained by categorizing the collection
efforts of a company as strict, liberal and lenient. Strict collection policy is characterized by
debtor's payment on or before the due date. As a result many times debtor benefits himself
with cash discount. Whereas, a lenient policy is featured by defaulters in payments of
Receivables, forfeiture of cash discount etc. Such customers are often Vied future supplies,
charged with interest for the period of default and May even undergo legal action pertaining
to the payment of overdue amount.
188
A rigorous collection policy shortens the average collection period, pulls down sales
and bad-debt percentage along with increasing collection expenses. A relaxed collection
programme would push up sales and bad-debts percentage, lengthen the average of collection
period and reduce collection expenses but enhances credit administrative cost.
A concern must make use of financial default and risk analysis; it is willing to favour
liberal credit policy. Similarly, a firm can help being cautious while adopting strict collection
policy for, it may offend tie customers forcing them to switch over to the competitors.
Between the two extremes of rigorous and soft collection policies, there also exists flexible
collection policy, which involves reminding the customers through correspondence before the
due date. Optimum collection policy may be achieved by comparing costs and benefits,
which will be consistent with the goal of attaining maximum value of the firm.
COLLECTION FOLLOW-UP SYSTEM: The element of regularity is always desired in connection efforts, which primarily
depends upon two pre-requisites; the development of suitable system of collection and the
establishment of a congenial collection follow-up system.
As far as development and adoption of suitable collection period is concerned, it
varies from industry to industry or at times from firm to firm. Therefore a congenial
collection follow-up system can be established through various practices. Some of them are
mentioned below:
1. Accounts Receivable Report This device is regarded as highly useful in timely collections of receivables from
debtors. It makes a successful attempt at keeping a keen eye over almost all outstanding
accounts of the firm. Hence, enabling a firm to initiate appropriate and timely measure
against defaulters as per the guidelines framed by the collection policy of a concern,
2. Ledger Plan or Card Tickler System In order to establish a sound collection follow-up system ledger plan of the collection
follow-up system is based on the creditor‘s ledger record. The card tickler system involves
maintenance of cards in the name of each delinquent filed date wise in a proper sequence.
The card specifies information regarding the amount, terms due date, collection actions taken
so fat etc. at length in detail.
3. Computer and Credit Management Of late the use of computers has also come in vogue for the purpose or credit
management. Computer helps a great deal in availing essential up-to-date information. For a

189
quick access to various sort of information's of all information's previously placed on
receivable ledger can be placed on punched cards or tapes. Computer can also provide report
on summary of all billings, payments, discount taken, amount still owned etc. In addition
taken, amount still owned etc. In addition to this complete report on delinquent accounts can
be obtained along with timely and accurate information regarding the five Cs of the customer.
Further special reports can be prepared for a particular span of period supplemented with
categorization and comparison of customer as well as adopted credit policies.
CREDIT CONTROL: Credit control is a complex process, which costs both time and administrative costs.
Broadly, speaking, the function of credit control incorporates the following elements: -
1. Checking customer's credit worthiness.
2. Prompt invoicing and follow up
3. Credit insurance,
4. Financial statements, and
5. Use of electronic data processing equipment.
1. Checking Customers Credit Worthiness This step relates to applicants ability to pay for the goods or services opted by him.
The decision pertaining to credit grant and its volume largely depends upon this assessment.
The assessment can be done on the basis of financial soundness, general behavior, past
records, business habits and traits. Trade reference, banker's records available with the
geriatric etc. are a few of certain elements that provide relevant information for conducting
this assessment.
2. Prompt Invoicing and Follow-up This is an executive action involving prompt issue of invoice and equally close
follow-up action. A continuous personal attention is required for reviewing amounts of bills
receivables. Methods are selected among the various possible alternatives available to ensure
that the time period is minimum between realization of payments and converting it into
bank's credit account.
3. Credit Insurance This point pertains to credit exports. As credit sales does not fall under any credit
insurance policy coverage in India. It is export credit guarantee department, which formulates

190
appropriate rules and issues credit insurance policies for exports on payments of a nominal
premium. These facilities are of high importance for credit control of exports.
4. Financial Statements Financial statement is an important document that presents desirable sources of
information to the seller regarding the financial position of customer for credit control. For
the companies carrying out seasonal business, interim statements instead of financial
statements are preferred. For acquiring authenticated information audited financial statement
should be favoured rather than unaudited figures enclosing possibility of fraud. . . .
5. Use of Electronic Data Processing Equipment
In the modern world, the importance of computers cannot be possibly denied.
Electronic data processing equipment holds its own individual importance in providing
timely and accurate information pertaining to the status of accounts. The computer can
provide a vast array of detailed information, previously impractical to obtain that may be
useful not only to the credit manager but to other management as well. In addition to
processing data the computer can be programmed to make certain routine credit decisions.
CONTROL OF RECEIVABLES:
Control or receivables largely depends upon the system of credit control practiced by
a business enterprise. It becomes a part of organization obligation to obtain full and relevant
information complete in all respect before deciding upon the right customer for the right
amount of credit grant. Whenever an order is placed by an applicant financial position and
credit worthiness becomes essential. Only after ensuring the degree of safety an order should
be accepted and delivered.
A firm is expected to prepare sales invoice and credit notes as early as possible; side
by side it should also ensure that they are dispatched at specified regular intervals for
effective control of receivables. It is always considered good on the part of rim it is keep as
separate ledger for the accounts of based and doubtful debtors. Such segregation not only
helps in easy assessment of the position of bad and doubtful debtors in relation to the total
debtor's position. A considerable amount of reduction in debtors can be achieved by offering
cash discount to the customers.
Even in case of export sales, segregation of credit sales into separate ledger adds
effectiveness to control of receivables. Sometimes large contracts, payable by installments,
involve credit for several years. The price fixed in these cases should be sufficiently high not

191
only to cover export credit insurance, but also to cover a satisfactory rate of interest on the
diminishing balances of debt expected to the outstanding during the credit period.
There are two methods of controlling accounts receivables, which are traditional in
nature; days sales outstanding and ageing schedule. Though they are popularly used but they
suffer from a serious deficiency. Both these methods are based on aggregation of sales and
receivables due to which the changes in the pattern of payment cannot be easily detected. In
order to overcome this drawback of traditional methods, a firm can make use of payments
pattern approach.
PAYMENT PATTERN APPROACH: The payment pattern approach is the key issue in controlling accounts receivables as it
focuses on payment behavior. This approach is pioneered by B.R. Stone. 17
W.G. Lewellen
and R.W. Johnson.18
Pattern of payments are expressed mostly in terms of proportions and at
times as percentage. In general:
Pi=P0+ PO+ P2+ P3+ ........................ ...Pn
Here, Pi represent the proportion of credit sales paid in T month and "n" is the
payment horizon. And also,
Po+ P2+ P3+ • .......................... Pn=1
This is the payment pattern which is related to receivables pattern given as
Where, 'Ri' represent the receivables collected at the end of T months and 'n-V
denotes the horizon. Aggregation the receivables and payments, we obtain:
Ri=1-(P0+ PO+ P2+ P3+ .........Pn +Pi
A conversion matrix is prepared to show the credit sales in each month relating it to
the pattern of collection associated with it.
The payment pattern approach is dependent of sales level. It simply involves
matching collections and receivables to sales in the month or origin. As a result this approach
is free from the limitation observed in traditional methods. Moreover, this method is capable
of presenting payment pattern on monthly basis as against combined sales and payment
patterns. The main drawback, which we come across in this method, is that conversion matrix
cannot be prepared only on the basis of published financial statements like traditional
192
methods; it also requires internal financial data. Still payment pattern does not require as
much data as required in case of ageing schedule method.
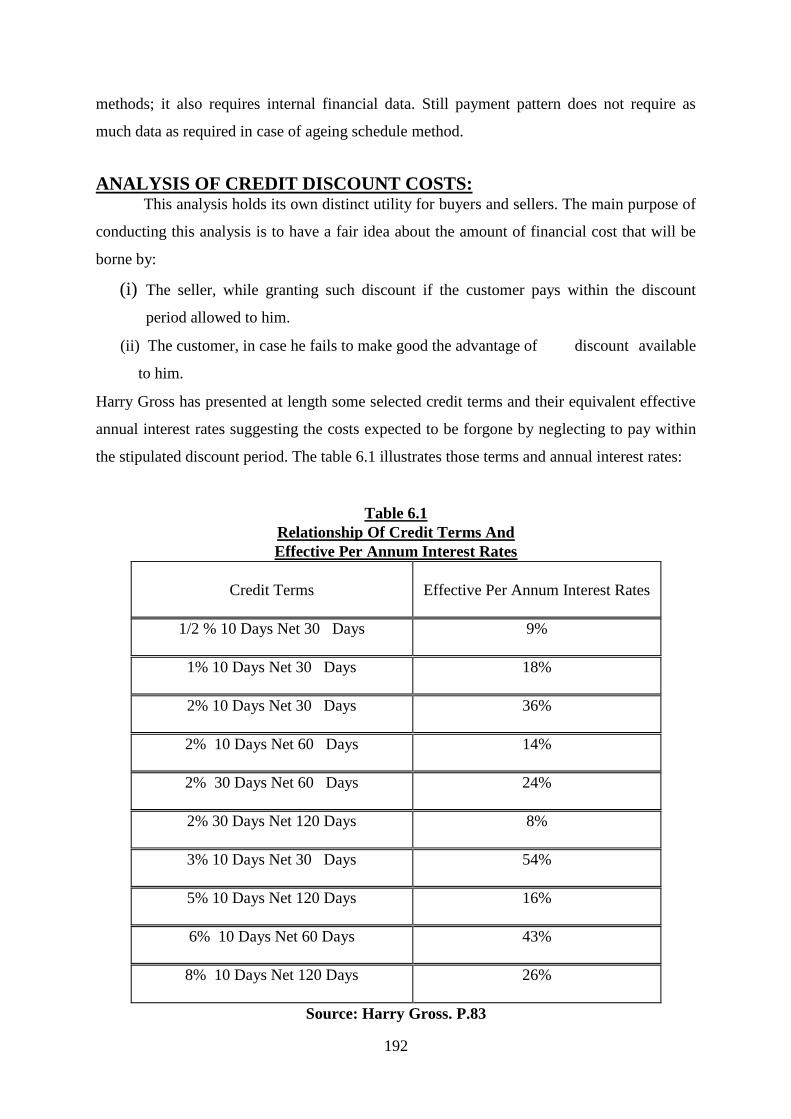
ANALYSIS OF CREDIT DISCOUNT COSTS: This analysis holds its own distinct utility for buyers and sellers. The main purpose of
conducting this analysis is to have a fair idea about the amount of financial cost that will be
borne by:
(i) The seller, while granting such discount if the customer pays within the discount
period allowed to him.
(ii) The customer, in case he fails to make good the advantage of discount available
to him.
Harry Gross has presented at length some selected credit terms and their equivalent effective
annual interest rates suggesting the costs expected to be forgone by neglecting to pay within
the stipulated discount period. The table 6.1 illustrates those terms and annual interest rates:
Table 6.1
Relationship Of Credit Terms And
Effective Per Annum Interest Rates
Credit Terms Effective Per Annum Interest Rates
1/2 % 10 Days Net 30 Days
9%
1% 10 Days Net 30 Days
18%
2% 10 Days Net 30 Days
36%
2% 10 Days Net 60 Days
14%
2% 30 Days Net 60 Days
24%
2% 30 Days Net 120 Days
8%
3% 10 Days Net 30 Days
54%
5% 10 Days Net 120 Days
16%
6% 10 Days Net 60 Days
43%
8% 10 Days Net 120 Days
26%
Source: Harry Gross. P.83

193
COMPUTATION:
The following steps are involved in computation of the effective per annum interest
rates applicable on equivalent credit terms: -
Calculate the number of days occurring between the last days of
Discount period and the end of credit period.
Divide 360 days by the number of days obtained in step.
Multiply the above quotient by the rate of discount
For illustration, if credit terms are "8/10 Net 120", then its effective annual interest
rate will be:
360 x 8 = 26% approximately
(120-10)100
RECEIVABLES MANAGEMENT IN SELECTED STEEL COMPANIES
IN INDIA: For a successful credit management, it is essential for a firm to formulate its credit
and collection policies directed towards the achievement of the objectives of effective use of
the capital invested. For evaluating the extent of success attained by firm in their efforts the
following criteria have been followed:
1.Size of Receivables. As discussed before in this chapter there are many factors influencing the volume of
receivables. But the level of enterprises credit sales is the most important determinant in this
respect. Any increase or decrease in the level of sales would bring about proportionate
increase or decrease in the magnitude of receivables. An efficient credit control, however,
prevents faster growth in receivables vis-a-vis sales. Table 6.2 shows the size of receivables
in selected steel companies during 1999-2000 to 2008-09 along with the percentage of
receivables to current assets.

194
Table 6.2
Size of Receivables Of steel Companies in India.
(From 1999-2000 to 2008-2009)
(Rs. In crores))
compan
y JSWSL JS&AL SAIL TSL
Receivabl
e
% of
C.A
Receivabl
e
% of
C.A
Receivabl
e
% of
C.A
Receivabl
e
% of
C.A
1999-
2000 471.89 72.45 30.53 57.77 2893.38 36.66 1359.45 50.83
2000-01 440.71 69.02 41.41 64.88 2899.01 35.62 1456.1 52.69
2001-02 386.94 59.44 39.64 68.83 2330.68 34.02 1168.55 44.97
2002-03 419.87 57.83 11.59 58.92 2859.49 40.3 1125.9 36.58
2003-04 627.01 62.65 4.37 68.17 2764.57 34.45 838.92 35.27
2004-05 911.9 48.27 4.89 89.56 3095.29 21.81 881.73 28.96
2005-06 1496.61 58.23 6.14 83.88 3132.79 20.18 877.43 25.69
2006-07 1024.45 41.4 6.8 82.22 3940.43 20.06 939.98 8.53
2007-08 885.95 28.94 N.A N.A 5421.04 20.81 913.66 22.58
2008 -
09 1027.88 26.67 N.A N.A 5750.85 16.9 1487.42 22.35
AVG. 769.32 52.49 18.17 71.78 3508.75 28.08 1104.91 32.84
S.D 362.07 15.8 16.21 32.05 1168.86 8.82 252.77 13.97
max 1496.61 72.45 41.41 89.56 5750.85 40.3 1487.42 52.69
min 386.94 26.67 4.37 57.77 2330.68 16.9 838.92 8.53
Sources: Annual Reports of steel Companies From 1999-2000 to 2008-2009
The size of receivable of all the steel companies shows fluctuating trend throughout
study period. The minimum size of receivable in JSWSL is 386.94 (2001-02), JS&AL is 4.37
(2003-04), SAIL is 2330.68 (2001-02), and TSL is 838.92 (2003-0407). The maximum size
of receivable in JSWSL is 1496.61 (2000-01), JS&AL is 41.41 (2003-04), SAIL is 5750.85
(2008-09), and TSL is 1487.4 .The study of the composition of receivable is a very important
tool to evaluate the management of receivables. It assists to show the point where receivables
are concentrated most.
The receivable to current assets of all the steel companies shows fluctuating trend
throughout study period. The minimum size of receivable to current assets in JSWSL is 26.67
(2008 -09), JS&AL is 57.77 (1999-2000), SAIL is 16.9 (2008 -09), and TSL is 8.53 (2006-
07). The maximum size of receivable to current assets in JSWSL is 72.45 (1999-2000),
JS&AL is 89.56 (2004-05), SAIL is 40.3 (2008-09), and TSL is 52.69 in (2000-01 ).The
study of the composition of receivable to current assets is a very important tool to evaluate
the management of receivables. It assists to show the point where receivables are
concentrated most.
195
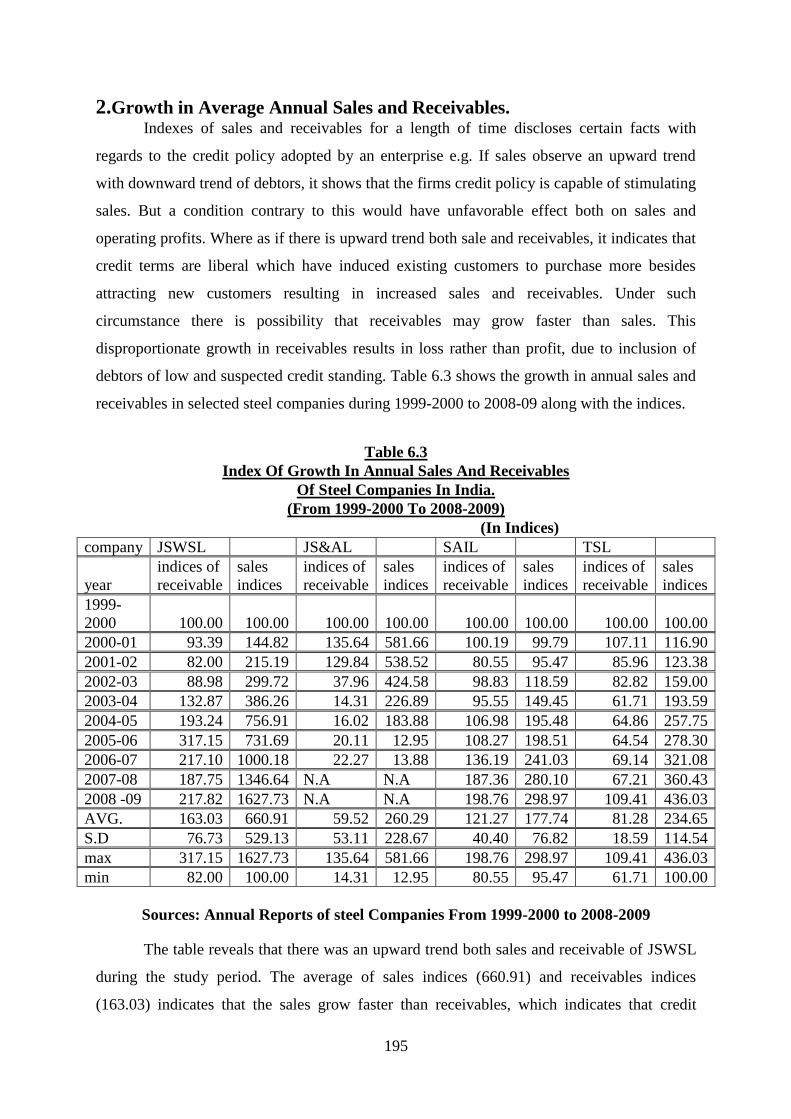
2.Growth in Average Annual Sales and Receivables. Indexes of sales and receivables for a length of time discloses certain facts with
regards to the credit policy adopted by an enterprise e.g. If sales observe an upward trend
with downward trend of debtors, it shows that the firms credit policy is capable of stimulating
sales. But a condition contrary to this would have unfavorable effect both on sales and
operating profits. Where as if there is upward trend both sale and receivables, it indicates that
credit terms are liberal which have induced existing customers to purchase more besides
attracting new customers resulting in increased sales and receivables. Under such
circumstance there is possibility that receivables may grow faster than sales. This
disproportionate growth in receivables results in loss rather than profit, due to inclusion of
debtors of low and suspected credit standing. Table 6.3 shows the growth in annual sales and
receivables in selected steel companies during 1999-2000 to 2008-09 along with the indices.
Table 6.3
Index Of Growth In Annual Sales And Receivables
Of Steel Companies In India.
(From 1999-2000 To 2008-2009)
(In Indices)
company JSWSL JS&AL SAIL TSL
year
indices of
receivable
sales
indices
indices of
receivable
sales
indices
indices of
receivable
sales
indices
indices of
receivable
sales
indices
1999-
2000 100.00 100.00 100.00 100.00 100.00 100.00 100.00 100.00
2000-01 93.39 144.82 135.64 581.66 100.19 99.79 107.11 116.90
2001-02 82.00 215.19 129.84 538.52 80.55 95.47 85.96 123.38
2002-03 88.98 299.72 37.96 424.58 98.83 118.59 82.82 159.00
2003-04 132.87 386.26 14.31 226.89 95.55 149.45 61.71 193.59
2004-05 193.24 756.91 16.02 183.88 106.98 195.48 64.86 257.75
2005-06 317.15 731.69 20.11 12.95 108.27 198.51 64.54 278.30
2006-07 217.10 1000.18 22.27 13.88 136.19 241.03 69.14 321.08
2007-08 187.75 1346.64 N.A N.A 187.36 280.10 67.21 360.43
2008 -09 217.82 1627.73 N.A N.A 198.76 298.97 109.41 436.03
AVG. 163.03 660.91 59.52 260.29 121.27 177.74 81.28 234.65
S.D 76.73 529.13 53.11 228.67 40.40 76.82 18.59 114.54
max 317.15 1627.73 135.64 581.66 198.76 298.97 109.41 436.03
min 82.00 100.00 14.31 12.95 80.55 95.47 61.71 100.00
Sources: Annual Reports of steel Companies From 1999-2000 to 2008-2009
The table reveals that there was an upward trend both sales and receivable of JSWSL
during the study period. The average of sales indices (660.91) and receivables indices
(163.03) indicates that the sales grow faster than receivables, which indicates that credit

196
terms are less liberal. The sales had increasing trend throughout the study period while
receivable also indicates increasing trend having some fluctuations. In the beginning of study
period the receivable grow faster than sales but at the end of the study period the sales grow
faster than receivables which show that the JS&AL‘s credit policy is capable of stimulating
sales. An increasing trend can also be observed in the values of both sales and receivable of
SAIL during study period but the receivables grow faster than sales. This disproportionate
growth in receivables result in loss rather than profit due to inclusion of debtors of low and
suspected credit standing. There was an upward trend both sales and receivable of SAIL
during the study period. The average of sales indices (177.74) and receivables indices
(121.27) indicates that the sales grow faster than receivables, which indicates that credit
terms are less liberal. There was a downward trend both sales and receivable of SAIL during
the study period. The average of sales indices of TSL (234.65) and receivables indices
(81.28) indicates that the sales grow faster than receivables, which indicates that credit terms
are less liberal.
3.Composition of Receivables. This study of components or receivables is considered as a vital tool for solving
purpose of evaluation of management of receivables. Composition of centralization or
contraction of receivables. A careful comparison of these points with the size of receivables
enables us to apprehend the efficiency or inefficiency of the receivables management. The
receivables of steel Industry under the present study are bifurcated into two main heads; trade
debtors and loans and advances as given below:
(A) Sundry Debtors Table 6.4.
The Size Of Sundry’s Debtors And The Percentage Of Sundry Debtors To Current
Assets In Selected Steel Companies During 1999-2000 To 2008-09 Are Also Displayed.
(In crores)
Size of
debtors
J S W Steel Ltd.
Jindal Steel &
Alloys Ltd.
Steel Authority
Of India Ltd.
Tata Steel Ltd.
Ratio
Debtors
in Rs.
% of
C.A
Debtors
in Rs.
% of
C.A
Debtors
in Rs.
% of
C.A
Debtors
in Rs.
% of
C.A
1999-2000 236.4 36.3 26.8 50.6 1817.4 23.0 1182.7 44.2
2000-01 278.3 43.6 36.3 56.9 1687.6 20.7 1279.3 46.3
2001-02 256.9 39.5 26.1 45.3 1389.4 20.3 1073.7 41.3
2002-03 279.6 38.5 6.2 31.6 1660.1 23.4 958.5 31.1
2003-04 406.7 40.6 0.6 10.0 1550.0 19.3 651.3 27.4
2004-05 266.6 14.1 0.1 2.2 1908.5 13.4 581.8 19.1
2005-06 241.3 9.4 0.0 0.1 1881.7 12.1 539.4 15.8
2006-07 245.2 9.9 0.0 0.0 2314.8 11.8 631.6 5.7

197
2007-08 337.4 11.0 0.0 N.A 3048.1 11.7 543.5 13.4
2008 -09 398.1 10.3 3.7 N.A 3024.4 8.9 636.0 9.6
AVG. 294.7 25.3 10.0 24.6 2028.2 16.5 807.8 25.4
S.D 63.7 15.3 14.0 23.8 585.3 5.4 285.6 14.9
max 406.7 43.6 36.3 56.9 3048.1 23.4 1279.3 46.3
min 236.4 9.4 0.0 0.0 1389.4 8.9 539.4 5.7
Sources: Annual Reports of steel Companies From 1999-2000 to 2008-2009
The table indicates that in J S W Steel Ltd. sundry debtors tend to be fluctuating
throughout the study period. The size of debtors ranged between Rs. 406.7 CRORES and Rs.
236.4 CRORES. On an average debtors formed only 025.3 % of the current assets. In Jindal
Steel & Alloys Ltd. the amount of debtors shows a decreasing trend having some
fluctuations. Sundry debtors were Rs. 26.8 crores in 1999-2000 which decreased to Rs. 0.6
crores in 2003-04 and it was 3.7 crores in the last years of study period. The range of
percentage of debtors to current assets had been lowest of 0.00% and the highest of 36.3%. In
Steel Authority Of India Ltd. we can observe a fluctuating and increasing trend of size of
debtors during the period of study. It ranged between Rs. 3048.1 crores and Rs. 1389.4
crores. The percentage of debtors to current assets had declined in 2003-04 and 2004-05
despite rise in the volume of debtors. This discloses the fact that though the size of debtors
had increased but the increase in the size of current assets had been more than that of debtors.
Debtors in Steel Authority Of India Ltd constituted only 16.5 % of current assets. Tata Steel
Ltd. Showed decreasing trend with an average of Rs. 807.8 crores and standard deviation was
Rs. 285.6 crores. The debtor ranged between Rs. 1279.3 and Rs. 539.4. The debtors are
25.4% of current assets
In nutshell, we can conclude that the steel companies had been conservative in nature
as they tend to avoid risk factor as much as possible. The percentage of debtors to current
assets was the lowest in case of Steel Authority Of India Ltd. followed by J S W Steel Ltd.,
Jindal Steel & Alloys Ltd. and Tata Steel Ltd.
(B) Loans and Advances
Table 6.4 displays the size of loans and advances in the selected steel companies
during 1999-2000 to 2008-09. A long with the trend percentage to provide objective analysis
of the data.
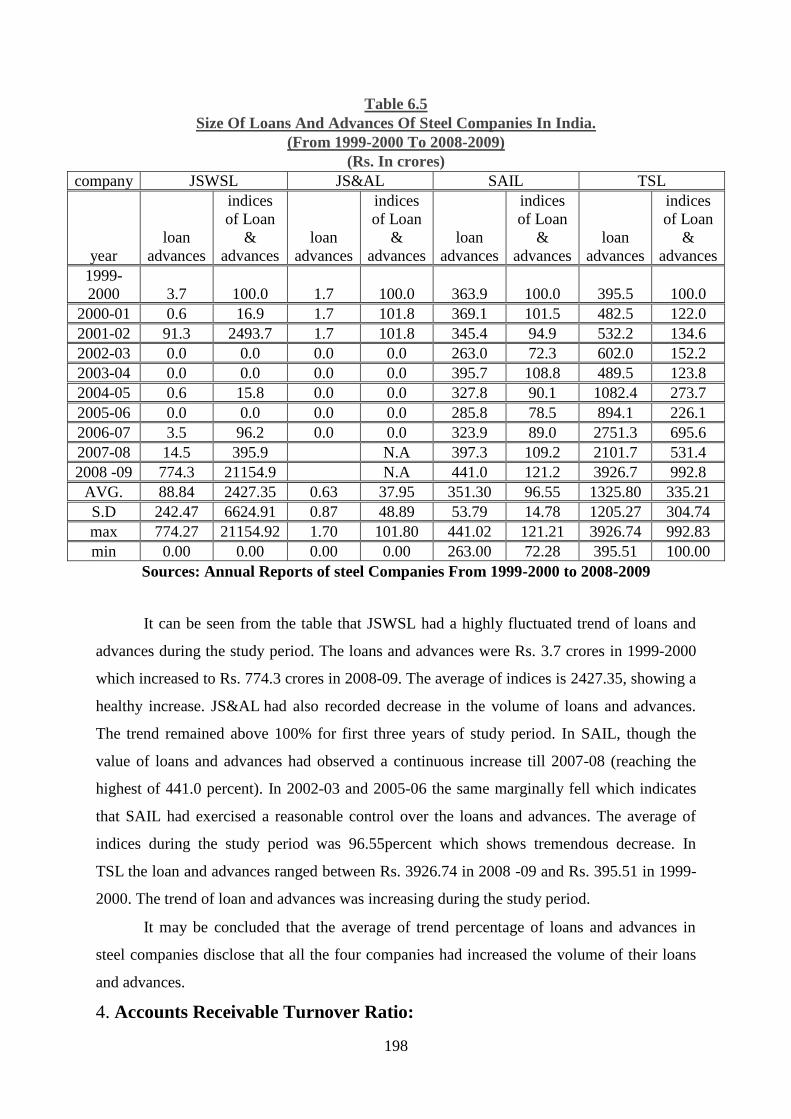
198
Table 6.5
Size Of Loans And Advances Of Steel Companies In India.
(From 1999-2000 To 2008-2009)
(Rs. In crores)
company JSWSL JS&AL SAIL TSL
year
loan
advances
indices
of Loan
&
advances
loan
advances
indices
of Loan
&
advances
loan
advances
indices
of Loan
&
advances
loan
advances
indices
of Loan
&
advances
1999-
2000 3.7 100.0 1.7 100.0 363.9 100.0 395.5 100.0
2000-01 0.6 16.9 1.7 101.8 369.1 101.5 482.5 122.0
2001-02 91.3 2493.7 1.7 101.8 345.4 94.9 532.2 134.6
2002-03 0.0 0.0 0.0 0.0 263.0 72.3 602.0 152.2
2003-04 0.0 0.0 0.0 0.0 395.7 108.8 489.5 123.8
2004-05 0.6 15.8 0.0 0.0 327.8 90.1 1082.4 273.7
2005-06 0.0 0.0 0.0 0.0 285.8 78.5 894.1 226.1
2006-07 3.5 96.2 0.0 0.0 323.9 89.0 2751.3 695.6
2007-08 14.5 395.9 N.A 397.3 109.2 2101.7 531.4
2008 -09 774.3 21154.9 N.A 441.0 121.2 3926.7 992.8
AVG. 88.84 2427.35 0.63 37.95 351.30 96.55 1325.80 335.21
S.D 242.47 6624.91 0.87 48.89 53.79 14.78 1205.27 304.74
max 774.27 21154.92 1.70 101.80 441.02 121.21 3926.74 992.83
min 0.00 0.00 0.00 0.00 263.00 72.28 395.51 100.00
Sources: Annual Reports of steel Companies From 1999-2000 to 2008-2009
It can be seen from the table that JSWSL had a highly fluctuated trend of loans and
advances during the study period. The loans and advances were Rs. 3.7 crores in 1999-2000
which increased to Rs. 774.3 crores in 2008-09. The average of indices is 2427.35, showing a
healthy increase. JS&AL had also recorded decrease in the volume of loans and advances.
The trend remained above 100% for first three years of study period. In SAIL, though the
value of loans and advances had observed a continuous increase till 2007-08 (reaching the
highest of 441.0 percent). In 2002-03 and 2005-06 the same marginally fell which indicates
that SAIL had exercised a reasonable control over the loans and advances. The average of
indices during the study period was 96.55percent which shows tremendous decrease. In
TSL the loan and advances ranged between Rs. 3926.74 in 2008 -09 and Rs. 395.51 in 1999-
2000. The trend of loan and advances was increasing during the study period.
It may be concluded that the average of trend percentage of loans and advances in
steel companies disclose that all the four companies had increased the volume of their loans
and advances.
4. Accounts Receivable Turnover Ratio:

199
The receivables turnover ratio shows the relationship between sales and accounts
receivables of a company. While calculating this ratio some prefer to divide sales by average
book debts for the year (the average of book debts at the beginning and at the end of the year)
to get a more reliable indicator. It can therefore be calculated as:
Receivables Turnover Ratio = Net Sales
Average Accounts Receivables
Where,
Average Accounts Receivables = Opening + Closing Receivables
2
According to Spiller and German, "The turnover of receivables provides information
on liquidity of receivables." It indicates the speed or sloweres with which receivables are
converted into cash. It also serves as a primary indicator of efficiency in this area of
investment." An efficiency of receivables management lies in a higher turnover ratio. The
profitability of the firm can be further maximized through prompt collection of receivables.
An increase in the volume of receivables without corresponding increase in the total
current assets may cause decrease in the volume of investment in other components of current
assets. Jerome and Sidney are of the opinion. "If the investment in inventory is reduced, it
may in turn affect total sales and consequently reduce the profits of the firm.'20
but a total
opposite of this may happen to be true if the investment in receivables is reduced. Table 6.6
carries the figure of accounts receivables turnover ratio in the selected steel companies during
1999-2000 to 2008-09.

200
Table 6.6
Accounts Receivable Turnover Ratio Of Steel Companies In India.
(From 1999-2000 To 2008-2009)
(Ratio In Times)
company JSWSL JS&AL SAIL TSL
ratio
in
times indices
ratio
in
times indices
ratio
in
times indices
ratio
in
times indices
1999-
2000 1.97 100.00 1.52 100.00 5.64 100.00 4.53 100.00
2000-01 3.05 155.07 6.51 428.83 5.61 99.60 4.94 109.14
2001-02 5.17 262.44 6.30 414.76 6.68 118.52 6.50 143.53
2002-03 6.64 336.85 16.98 1118.41 6.76 120.00 8.69 191.98
2003-04 5.73 290.70 24.06 1585.10 8.82 156.42 14.21 313.71
2004-05 7.72 391.68 24.06 1585.10 10.30 182.73 18.00 397.39
2005-06 4.54 230.71 0.98 64.38 10.34 183.34 19.53 431.19
2006-07 9.08 460.71 0.95 62.30 9.98 176.98 21.03 464.36
2007-08 14.13 717.27 N.A N.A 8.43 149.50 24.29 536.30
2008 -09 14.72 747.27 N.A N.A 8.48 150.42 18.05 398.52
AVG. 7.27 369.27 10.17 669.86 8.10 143.75 13.98 308.61
S.D 4.30 218.35 9.83 647.91 1.83 32.48 7.26 160.30
max 14.72 747.27 24.06 1585.10 10.34 183.34 24.29 536.30
min 1.97 100.00 0.95 62.30 5.61 99.60 4.53 100.00
Sources: Annual Reports of steel Companies From 1999-2000 to 2008-2009
It may be observed from the table that the accounts receivables turnover ratio of
JSWSL had fluctuated throughout the period of study from 1999-2000 to 2008-09. The ratio
was 1.97 times in 1999-2000 which increased to 3.05 times in 2000-01. In 2001-02 the ratio
increased to 5.17 times but thereafter it shows increasing trend and increased to 14.72 times
in 2008-09 with an average of 7.27.The average of accounts receivable turnover ratio of
JS&AL was 10.17 times. JS&AL had produced the best of turnover ratio among the selected
steel companies. It ranged between 24.06 times in 2003-04 and 0.95 times in 2006-07.The
receivable turnover ratio of SAIL 4.53 times in 1999-2000 and increased to 18.00 times
2004-05 and then it went down to 8.48 times in 2008 -09. In SAIL there was a fluctuated
trend in accounts receivables turnover ratio during the study period. The average of 8.10
times too discloses a very slow speed with which the company's receivables get converted in
cash. The average of indices of accounts receivable turnover ratio worked out at 143.75
showing poor performance during study period. The average ratio was 8.10 times in which
showed progressive trend during the study period. The ratio was the highest of 10.34 times
and lowest of 5.61 times. The receivable turnover ratio was 4.53 times in 1999-2000 and then

201
it went high to 14.21 times in 2003-04 and then after it has again gone up to 24.29 times in
2007-08 with an average of 13.98 times.
In nut shell, the accounts receivables turnover ratio during the study period was the
highest for TSL followed by JS&AL, SAIL and JSWSL. The TSL displayed very good ratio
while the JSWSL recorded proportionately very low turnover ratio.
5.Receivables to Sales Ratio Another method of analyzing the level of investment in receivables is proportion of
accounts receivables to sales. This ratio holds considerable importance in indicating the credit
and collection policy adopted by a company. A higher ratio indicates greater investment in
receivables and slackness in credit collection policies. While a lower ratio points out that a
company is practicing strict credit and collection policy resulting in effective receivables
management control. Table 6.5 shows the figures indicating receivables to sales ratio in
selected steel companies during 1999-2000 to 2008-09.
Table 6.7
Receivable to Sales Ratio Of steel Companies in India.
(From 1999-2000 to 2008-2009)
(Ratio in Percentage)
company JSWSL JS&AL SAIL TSL JSWSL JS&AL SAIL TSL
Ratio
%of
Receivable indices
%of
Receivable indices
%of
Receivable indices
%of
Receivable indices
1999-
2000 50.76 100.00 65.88 100.00 17.74 100.00 22.08 100.00
2000-01 32.74 64.49 15.36 23.32 17.81 100.40 20.23 91.63
2001-02 19.34 38.10 15.88 24.11 14.97 84.37 15.38 69.67
2002-03 15.07 29.69 5.89 8.94 14.78 83.34 11.50 52.09
2003-04 17.46 34.40 4.16 6.31 11.34 63.93 7.04 31.88
2004-05 12.96 25.53 5.74 8.71 9.71 54.72 5.56 25.16
2005-06 22.00 43.35 102.33 155.33 9.68 54.54 5.12 23.19
2006-07 11.02 21.71 105.75 160.52 10.02 56.50 4.76 21.54
2007-08 7.08 13.94 N.A N.A 11.87 66.89 4.12 18.65
2008 -09 6.79 13.38 N.A N.A 11.79 66.48 5.54 25.09
AVG. 19.52 38.46 40.13 60.90 12.97 73.12 10.13 45.89
S.D 13.39 26.37 42.51 64.53 3.14 17.72 6.80 30.79
max 50.76 100.00 105.75 160.52 17.81 100.40 22.08 100.00
min 6.79 13.38 4.16 6.31 9.68 54.54 4.12 18.65
Sources: Annual Reports of steel Companies From 1999-2000 to 2008-2009
It may be observed from the table that the accounts receivables turnover ratio of
JSWSL had fluctuated throughout the period of study from 1999-2000 to 2008-09. The ratio
was 50.76 percent in 1999-2000 which decreased to 17.46 percent in 2003-04. In 2005-06 the
ratio increased to 22.00 percent but thereafter it shows decreasing trend and reached to 6.79

202
percent in 2008-09 with an average of 19.52 percent. The average of accounts receivable
turnover ratio of JS&AL was 40.13 percent. JS&AL had produced good turnover among the
selected steel companies. It ranged between 105.75 percent in 2006-07 and 4.16 times in
2003-04.The receivable turnover ratio of SAIL 17.74 percent in 1999-2000 and decreased to
11.34 percent 2003-04 and then it went down to 9.68 percent in 2005-06. In SAIL there was
a fluctuated trend in accounts receivables turnover ratio during the study period. The average
of 10.13 percent too discloses a very slow speed with which the company's receivables get
converted in cash. The average of indices of accounts receivable turnover ratio worked out at
45.89 showing poor performance during study period. The average ratio was 10.13 percent
which showed downward trend during the study period. The ratio was the highest of 22.08
percent and lowest of 4.12 percent. The receivable turnover ratio was 22.08 percent in 1999-
2000 and then it went high to 5.56 percent in 2003-04 and then after it has again gone up to
5.54 percent in 2007-08 with standard deviation of 6.80 percent.
In nut shell, the accounts receivables to sales ratio during the study period were the
highest for Jindal Steel & Alloys Ltd followed by Tata Steel Ltd., J S W Steel Ltd. and Steel
Authority Of India Ltd. The TSL displayed very good ratio while the JSWSL recorded
proportionately very low turnover ratio.
6. Average Collection Period
The average collection period refers to the average time lag between sales and
collection measurable in terms of number of days. In other words, it may be regarded as
rough estimate of number of a debtor. Hence, it is a significant measure of the collection
activity and quality of. Collection of book debts is the concluding stage in the function of
sales transaction. It is given as:
Average Collection Period = 365 .
Turnover of Receivables.
Prolonged collection period owing to delays and other reasons creates hazards in the
way of sustaining business operations because of financial scarcity. Thus, slow paying
customers have to be handled. As an old account causes heavy collection expenses and
increase the profitability of bad debt losses. Shorter average collection periods signify better
credit management and liquidity of accounts receivables. As shorter average collection period
means lower of customer. Further, the sooner the firm receives the cash due on sales, the

203
sooner it can put the money to work for earning interest. That is the cost of a long collection
period is a return (interest) lost on these funds. A rule of thumb is that the collection period
should not exceed 1/3 times the regular period; that is if the company's typical terms call for
payment in net 30 days, it is said that average collection period should not exceed 40 days i.e.
[30+ (30x1/3] Table 6.8 presents the average collection period of selected steel companies
during 1999-2000 to 2008-09.
Table 6.8
Average Collection Period Of Steel Companies In India.
(From 1999-2000 To 2008-2009)
(Period in Days)
Comp
anies
1999-
2000
2000
-01
2001
-02
2002
-03
2003
-04
2004
-05
2005
-06
2006
-07
2007
-08
2008
-09
AV
G.
S.D ma
x
mi
n
JSWS
L
185 119 71 55 64 47 80 40 26 25 71.
26
48.
87
185
.29
24.
80
JS&A
L
240 56 58 22 15 15 374 386 N.A N.A. 145
.74
155
.58
386
.00
15.
17
SAIL 65 65 55 54 41 35 35 37 43 43 47.
34
11.
47
65.
01
35.
32
TSL 81 74 56 42 26 20 19 17 15 20 36.
99
24.
82
80.
60
15.
03
avg. 143 79 60 43 36 30 127 120 28 29 75.
33
60.
18
179
.23
22.
58
Sources: Annual Reports of steel Companies From 1999-2000 to 2008-2009

204
Graph No.6.1
It can be observed from the table JSWSL had a long average collection period of
71.26 day on an average tends to increase the possibility of bad debts losses. A wide variation
from 185.29 days to 24.80 days had been registered. JS&AL must be praised for having
longest ten seven years‘s average collection period of 145.74 days. Though during the first
four study year this period the ratio had been more than the recorded ten year average.
JS&AL had failed to prove the liquidity of accounts receivable. SAIL had a short average
collection period of 47.34 days on average indicating towards the solvency of accounts
receivables. , on the whole SAO may be regarded as having better credit management and
liquidity of accounts receivables. The average collection period of TSL was 36.99 days with
standard deviation of 24.8 percent. The ratio showed down ward trend. This indicates that the
company may suffer from financial sacristy if prompt credit collection would not be made a
practice.
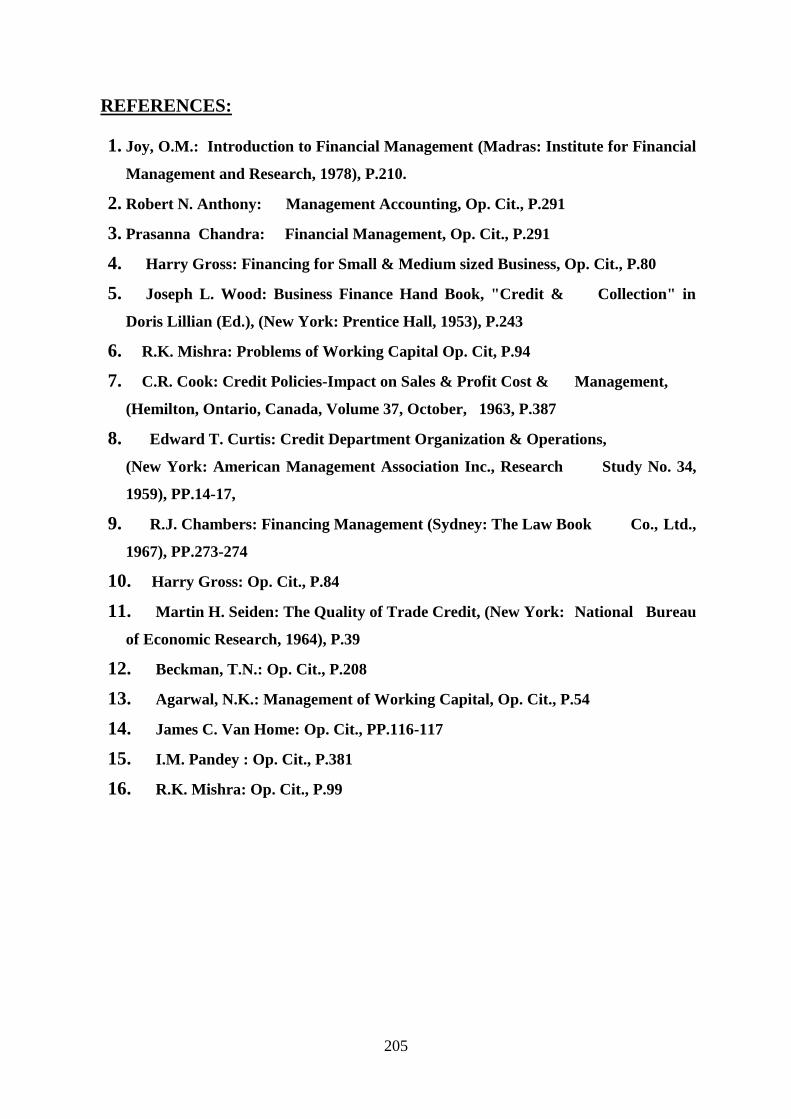
205
REFERENCES:
1. Joy, O.M.: Introduction to Financial Management (Madras: Institute for Financial
Management and Research, 1978), P.210.
2. Robert N. Anthony: Management Accounting, Op. Cit., P.291
3. Prasanna Chandra: Financial Management, Op. Cit., P.291
4. Harry Gross: Financing for Small & Medium sized Business, Op. Cit., P.80
5. Joseph L. Wood: Business Finance Hand Book, "Credit & Collection" in
Doris Lillian (Ed.), (New York: Prentice Hall, 1953), P.243
6. R.K. Mishra: Problems of Working Capital Op. Cit, P.94
7. C.R. Cook: Credit Policies-Impact on Sales & Profit Cost & Management,
(Hemilton, Ontario, Canada, Volume 37, October, 1963, P.387
8. Edward T. Curtis: Credit Department Organization & Operations,
(New York: American Management Association Inc., Research Study No. 34,
1959), PP.14-17,
9. R.J. Chambers: Financing Management (Sydney: The Law Book Co., Ltd.,
1967), PP.273-274
10. Harry Gross: Op. Cit., P.84
11. Martin H. Seiden: The Quality of Trade Credit, (New York: National Bureau
of Economic Research, 1964), P.39
12. Beckman, T.N.: Op. Cit., P.208
13. Agarwal, N.K.: Management of Working Capital, Op. Cit., P.54
14. James C. Van Home: Op. Cit., PP.116-117
15. I.M. Pandey : Op. Cit., P.381
16. R.K. Mishra: Op. Cit., P.99