recap from lecture 2 pinhole camera model perspective projections lenses and their flaws focus depth...
TRANSCRIPT

Recap from Lecture 2
Pinhole camera model
Perspective projections
Lenses and their flaws
Focus
Depth of field
Focal length and field of view
Chapter 2 of Szeliski

What is wrong with this picture?

Capturing Light… in man and machine
CS 129: Computational PhotographyJames Hays, Brown, Spring 2011
Many slides by Alexei A. Efros

Image Formation
Digital Camera
The Eye
Film

Digital camera
A digital camera replaces film with a sensor array• Each cell in the array is light-sensitive diode that converts photons to electrons• Two common types
– Charge Coupled Device (CCD) – CMOS
• http://electronics.howstuffworks.com/digital-camera.htm
Slide by Steve Seitz

Sensor Array
CMOS sensor

Sampling and Quantization
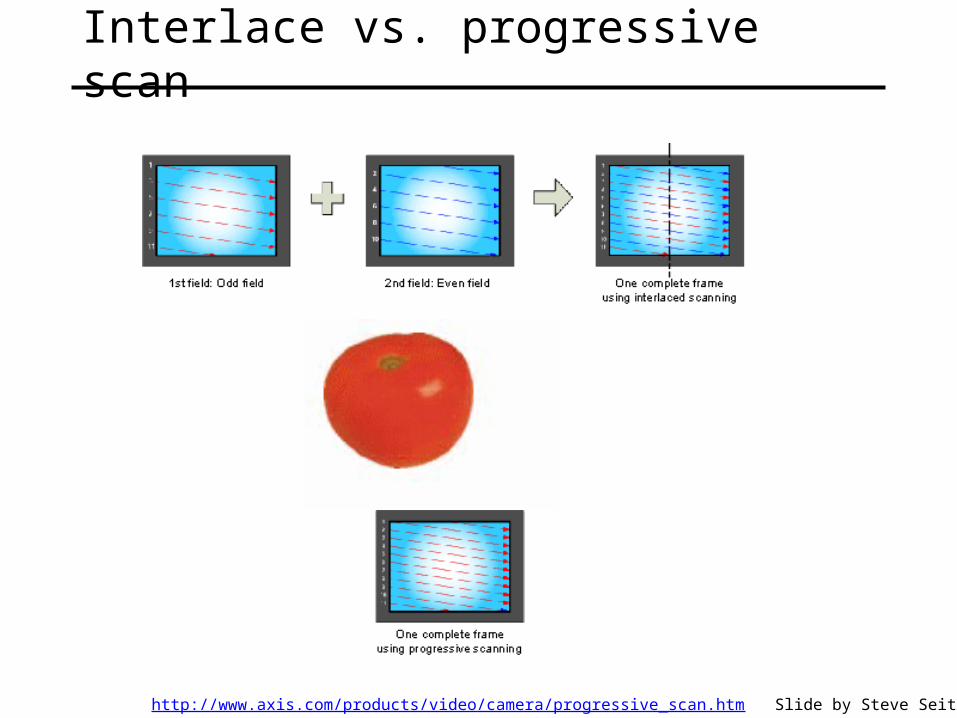
Interlace vs. progressive scan
http://www.axis.com/products/video/camera/progressive_scan.htm Slide by Steve Seitz

Progressive scan
http://www.axis.com/products/video/camera/progressive_scan.htm Slide by Steve Seitz

Interlace
http://www.axis.com/products/video/camera/progressive_scan.htm Slide by Steve Seitz

Rolling Shutter

The Eye
The human eye is a camera!• Iris - colored annulus with radial muscles
• Pupil - the hole (aperture) whose size is controlled by the iris
• What’s the “film”?– photoreceptor cells (rods and cones) in the retina
Slide by Steve Seitz

The Retina
Cross-section of eye
Ganglion cell layer
Bipolar cell layer
Receptor layer
Pigmentedepithelium
Ganglion axons
Cross section of retina
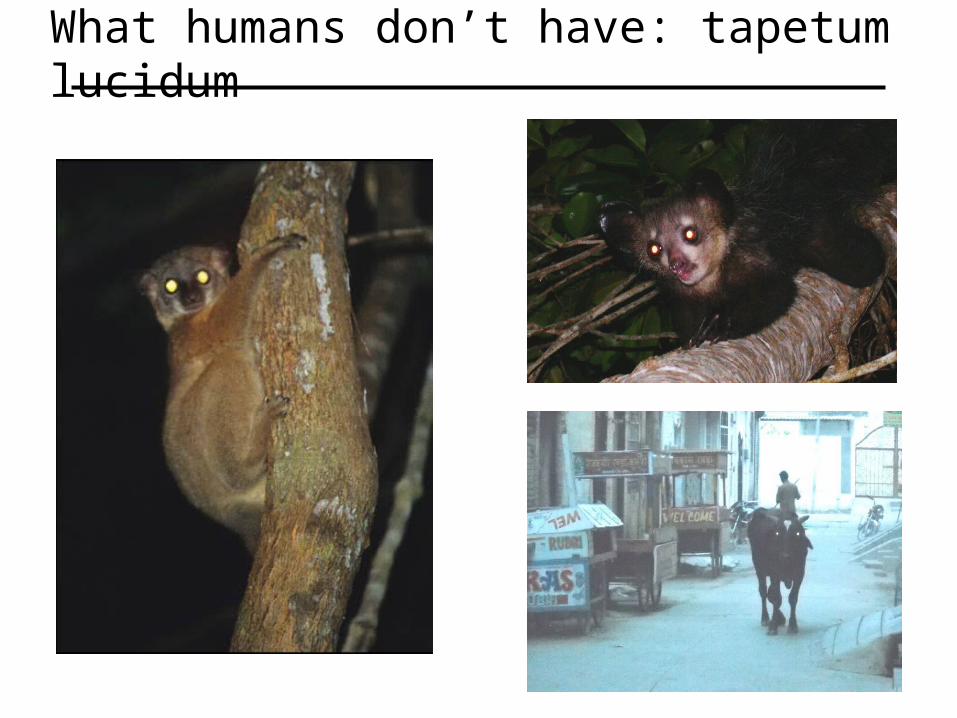
What humans don’t have: tapetum lucidum

© Stephen E. Palmer, 2002
Cones cone-shaped less sensitive operate in high light color vision
Two types of light-sensitive receptors
cone
rod
Rods rod-shaped highly sensitive operate at night gray-scale vision

Rod / Cone sensitivity

© Stephen E. Palmer, 2002
Distribution of Rods and Cones.
0
150,000
100,000
50,000
020 40 60 8020406080
Visual Angle (degrees from fovea)
Rods
Cones Cones
Rods
FoveaBlindSpot
# R
ecep
tors
/mm
2
Night Sky: why are there more stars off-center?Averted vision: http://en.wikipedia.org/wiki/Averted_vision

Eye Movements
SaccadesCan be consciously controlled. Related to perceptual attention.
200ms to initiation, 20 to 200ms to carry out. Large amplitude.
MicrosaccadesInvoluntary. Smaller amplitude. Especially evident during prolonged fixation. Function debated.
Ocular microtremor (OMT)involuntary. high frequency (up to 80Hz), small amplitude.

Electromagnetic Spectrum
http://www.yorku.ca/eye/photopik.htm
Human Luminance Sensitivity Function

Why do we see light of these wavelengths?
© Stephen E. Palmer, 2002
.
0 1000 2000 3000
En
erg
y
Wavelength (nm)
400 700
700 C
2000 C
5000 C
10000 C
VisibleRegion
…because that’s where theSun radiates EM energy
Visible Light

The Physics of Light
Any patch of light can be completely describedphysically by its spectrum: the number of photons (per time unit) at each wavelength 400 - 700 nm.
400 500 600 700
Wavelength (nm.)
# Photons(per ms.)
© Stephen E. Palmer, 2002

The Physics of Light
.
# P
ho
ton
s
D. Normal Daylight
Wavelength (nm.)
B. Gallium Phosphide Crystal
400 500 600 700
# P
ho
ton
s
Wavelength (nm.)
A. Ruby Laser
400 500 600 700
400 500 600 700
# P
ho
ton
s
C. Tungsten Lightbulb
400 500 600 700
# P
ho
ton
s
Some examples of the spectra of light sources
© Stephen E. Palmer, 2002
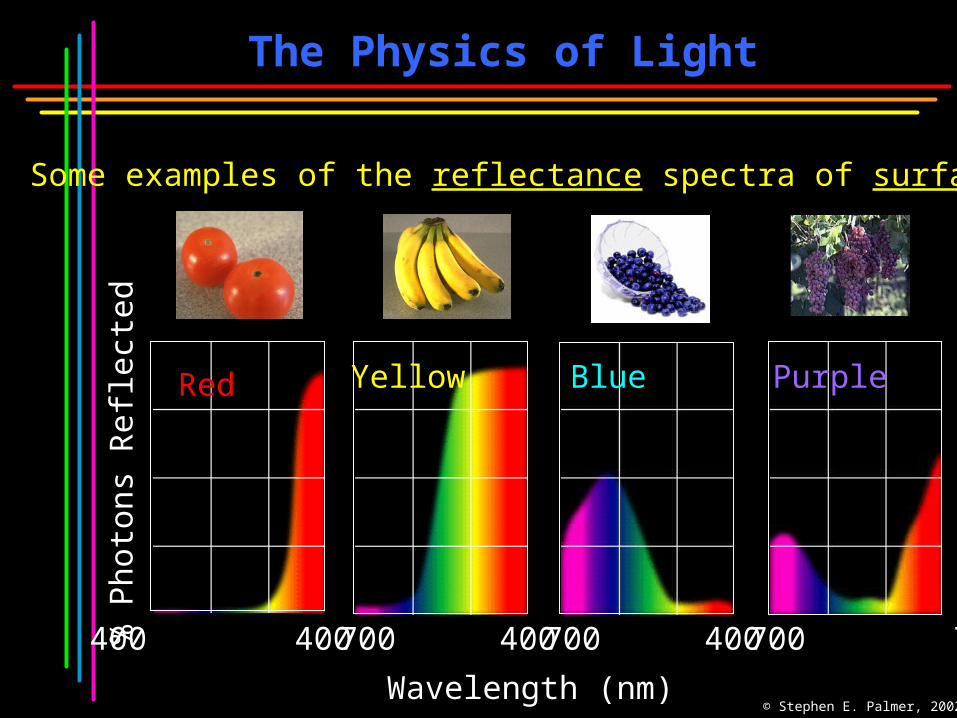
The Physics of Light
Some examples of the reflectance spectra of surfaces
Wavelength (nm)
% P
hoto
ns R
efle
cted
Red
400 700
Yellow
400 700
Blue
400 700
Purple
400 700
© Stephen E. Palmer, 2002

The Psychophysical Correspondence
There is no simple functional description for the perceivedcolor of all lights under all viewing conditions, but …...
A helpful constraint: Consider only physical spectra with normal distributions
area
Wavelength (nm.)
# Photons
400 700500 600
mean
variance
© Stephen E. Palmer, 2002
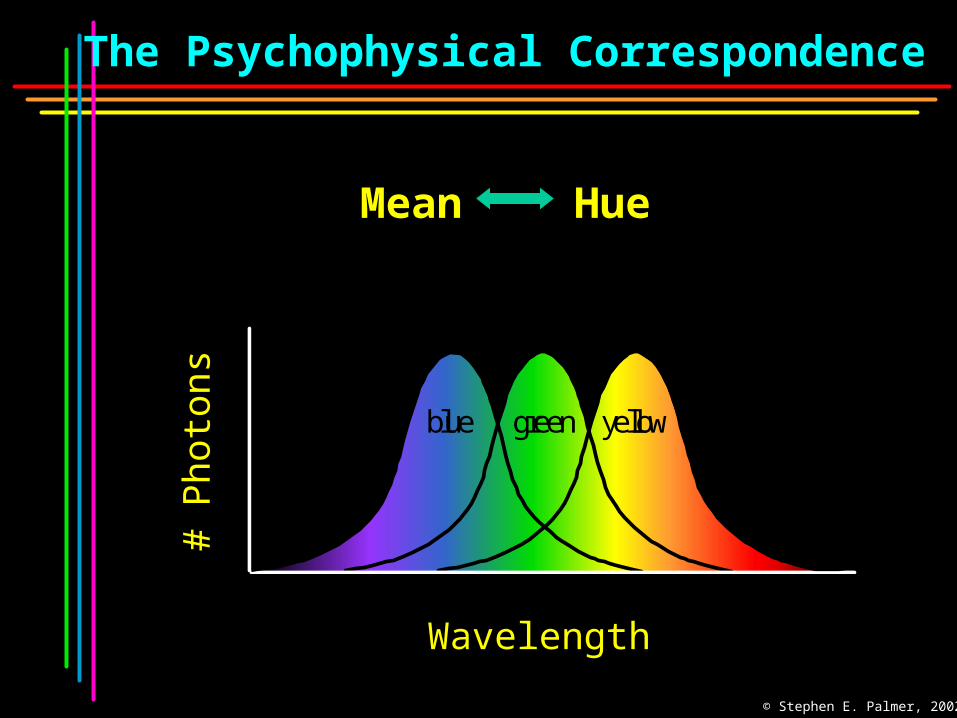
The Psychophysical Correspondence
Mean Hue
yellowgreenblue
# P
hoto
ns
Wavelength
© Stephen E. Palmer, 2002

The Psychophysical Correspondence
Variance Saturation
Wavelength
high
medium
low
hi.
med.
low# P
hoto
ns
© Stephen E. Palmer, 2002
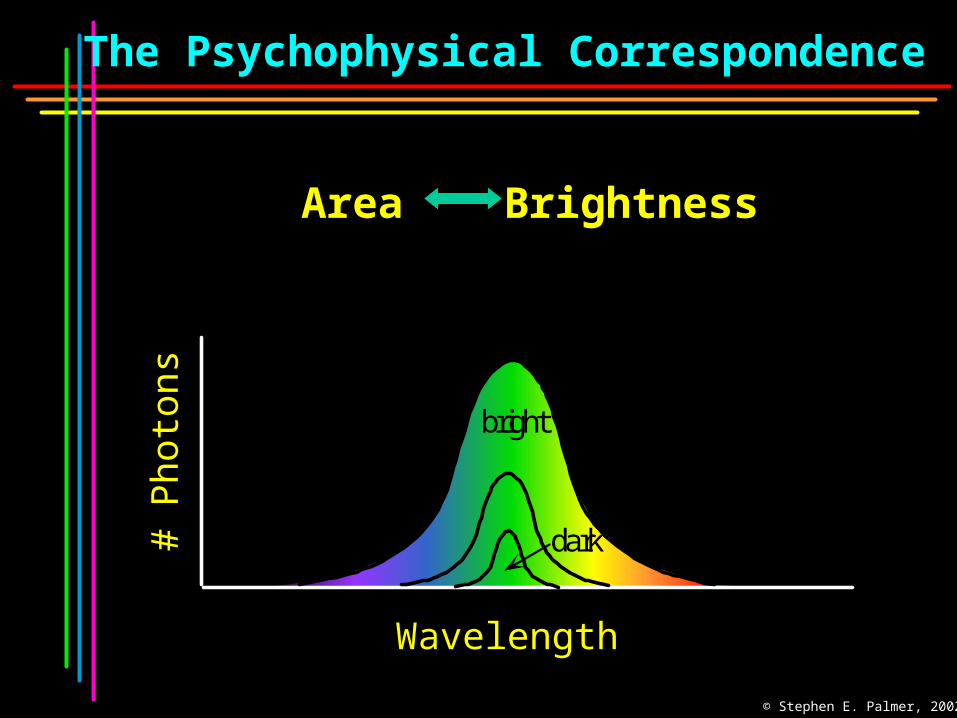
The Psychophysical Correspondence
Area Brightness#
Pho
tons
Wavelength
B. Area Lightness
bright
dark
© Stephen E. Palmer, 2002
© Stephen E. Palmer, 2002
.
400 450 500 550 600 650
RE
LAT
IVE
AB
SO
RB
AN
CE
(%
)
WAVELENGTH (nm.)
100
50
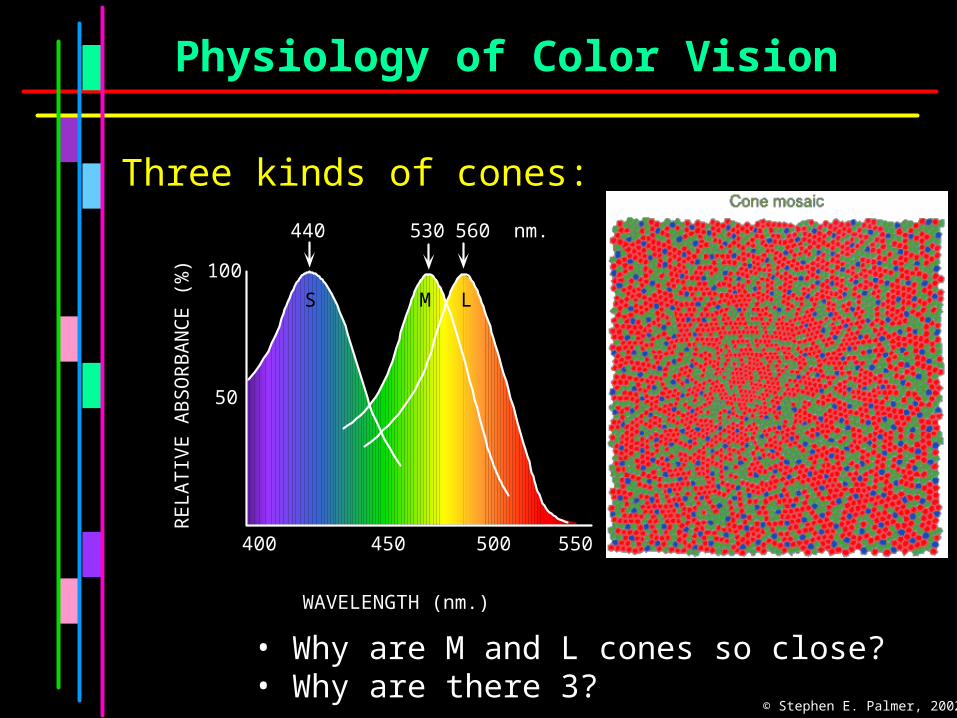
440
S
530 560 nm.
M L
Three kinds of cones:
Physiology of Color Vision
• Why are M and L cones so close?• Why are there 3?

Tetrachromatism
Most birds, and many other animals, have cones for ultraviolet light.
Some humans, mostly female, seem to have slight tetrachromatism.
Bird cone responses
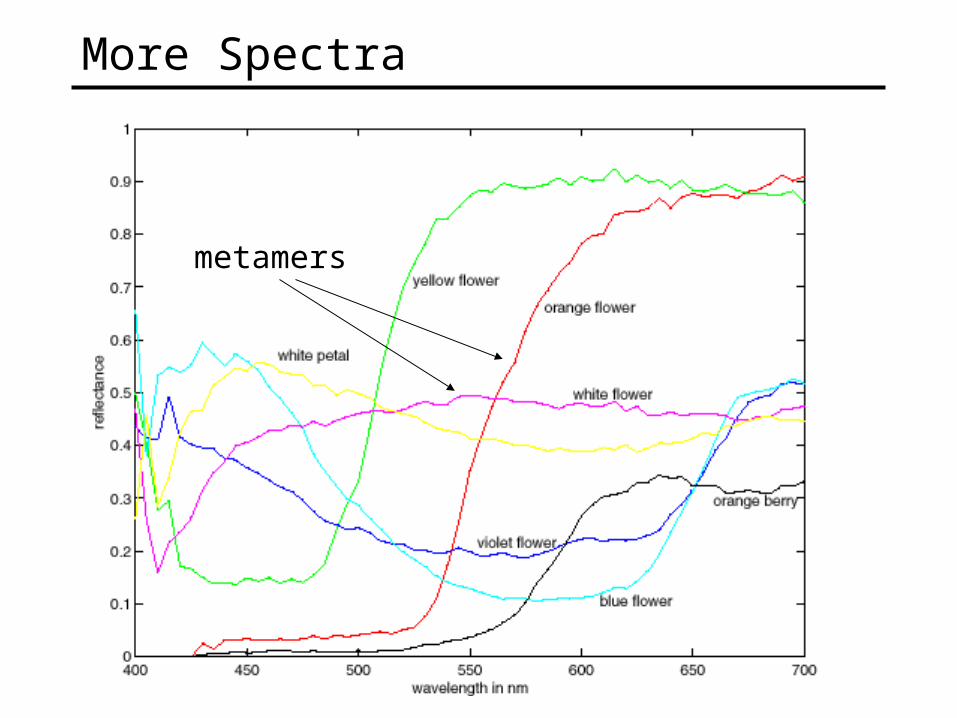
More Spectra
metamers

Practical Color Sensing: Bayer Grid
Estimate RGBat ‘G’ cells from neighboring values
http://www.cooldictionary.com/words/Bayer-filter.wikipedia
Slide by Steve Seitz
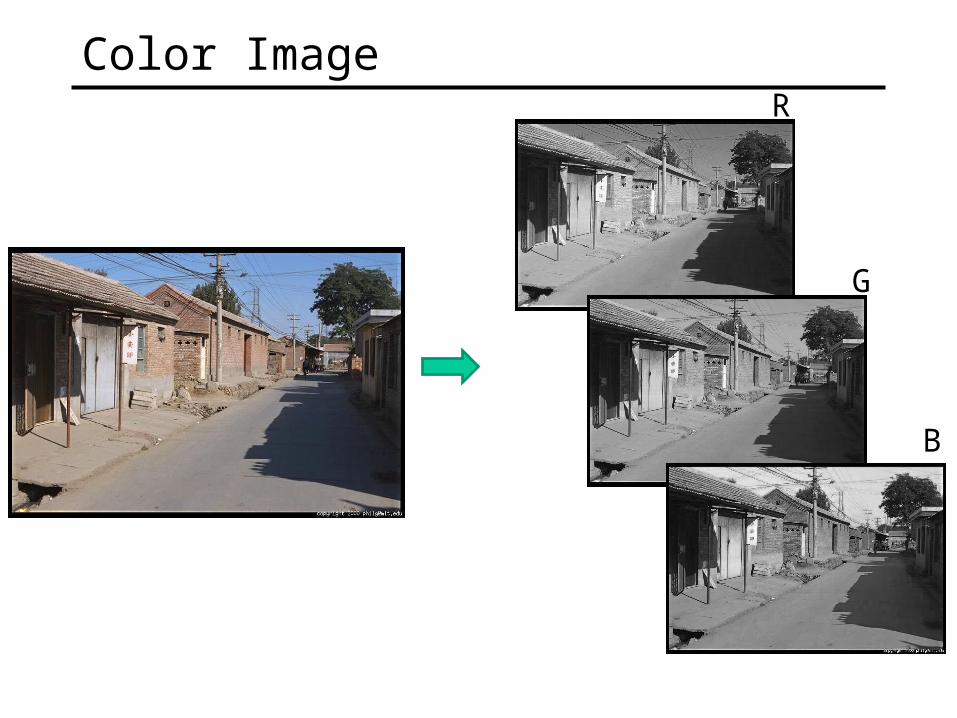
Color ImageR
G
B
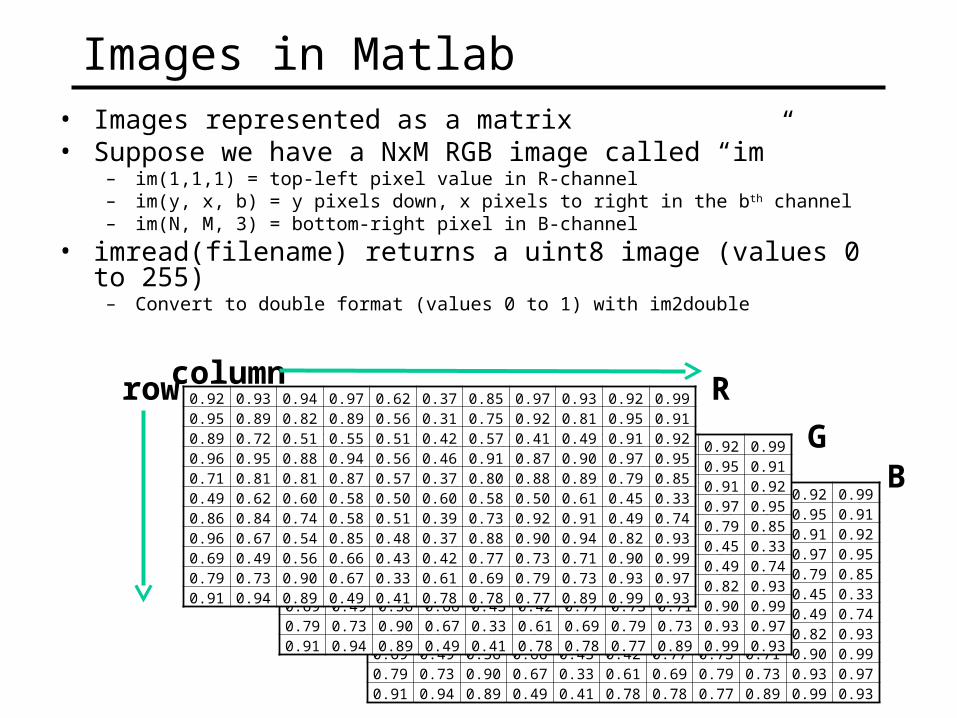
Images in Matlab• Images represented as a matrix• Suppose we have a NxM RGB image called “im”
– im(1,1,1) = top-left pixel value in R-channel– im(y, x, b) = y pixels down, x pixels to right in the b th channel– im(N, M, 3) = bottom-right pixel in B-channel
• imread(filename) returns a uint8 image (values 0 to 255)– Convert to double format (values 0 to 1) with im2double
0.92 0.93 0.94 0.97 0.62 0.37 0.85 0.97 0.93 0.92 0.990.95 0.89 0.82 0.89 0.56 0.31 0.75 0.92 0.81 0.95 0.910.89 0.72 0.51 0.55 0.51 0.42 0.57 0.41 0.49 0.91 0.920.96 0.95 0.88 0.94 0.56 0.46 0.91 0.87 0.90 0.97 0.950.71 0.81 0.81 0.87 0.57 0.37 0.80 0.88 0.89 0.79 0.850.49 0.62 0.60 0.58 0.50 0.60 0.58 0.50 0.61 0.45 0.330.86 0.84 0.74 0.58 0.51 0.39 0.73 0.92 0.91 0.49 0.740.96 0.67 0.54 0.85 0.48 0.37 0.88 0.90 0.94 0.82 0.930.69 0.49 0.56 0.66 0.43 0.42 0.77 0.73 0.71 0.90 0.990.79 0.73 0.90 0.67 0.33 0.61 0.69 0.79 0.73 0.93 0.970.91 0.94 0.89 0.49 0.41 0.78 0.78 0.77 0.89 0.99 0.93
0.92 0.93 0.94 0.97 0.62 0.37 0.85 0.97 0.93 0.92 0.990.95 0.89 0.82 0.89 0.56 0.31 0.75 0.92 0.81 0.95 0.910.89 0.72 0.51 0.55 0.51 0.42 0.57 0.41 0.49 0.91 0.920.96 0.95 0.88 0.94 0.56 0.46 0.91 0.87 0.90 0.97 0.950.71 0.81 0.81 0.87 0.57 0.37 0.80 0.88 0.89 0.79 0.850.49 0.62 0.60 0.58 0.50 0.60 0.58 0.50 0.61 0.45 0.330.86 0.84 0.74 0.58 0.51 0.39 0.73 0.92 0.91 0.49 0.740.96 0.67 0.54 0.85 0.48 0.37 0.88 0.90 0.94 0.82 0.930.69 0.49 0.56 0.66 0.43 0.42 0.77 0.73 0.71 0.90 0.990.79 0.73 0.90 0.67 0.33 0.61 0.69 0.79 0.73 0.93 0.970.91 0.94 0.89 0.49 0.41 0.78 0.78 0.77 0.89 0.99 0.93
0.92 0.93 0.94 0.97 0.62 0.37 0.85 0.97 0.93 0.92 0.990.95 0.89 0.82 0.89 0.56 0.31 0.75 0.92 0.81 0.95 0.910.89 0.72 0.51 0.55 0.51 0.42 0.57 0.41 0.49 0.91 0.920.96 0.95 0.88 0.94 0.56 0.46 0.91 0.87 0.90 0.97 0.950.71 0.81 0.81 0.87 0.57 0.37 0.80 0.88 0.89 0.79 0.850.49 0.62 0.60 0.58 0.50 0.60 0.58 0.50 0.61 0.45 0.330.86 0.84 0.74 0.58 0.51 0.39 0.73 0.92 0.91 0.49 0.740.96 0.67 0.54 0.85 0.48 0.37 0.88 0.90 0.94 0.82 0.930.69 0.49 0.56 0.66 0.43 0.42 0.77 0.73 0.71 0.90 0.990.79 0.73 0.90 0.67 0.33 0.61 0.69 0.79 0.73 0.93 0.970.91 0.94 0.89 0.49 0.41 0.78 0.78 0.77 0.89 0.99 0.93
R
GB
rowcolumn

Color spaces
How can we represent color?
http://en.wikipedia.org/wiki/File:RGB_illumination.jpg

Color spaces: RGB
0,1,0
0,0,1
1,0,0
Image from: http://en.wikipedia.org/wiki/File:RGB_color_solid_cube.png
Some drawbacks• Strongly correlated channels• Non-perceptual
Default color space
R(G=0,B=0)
G(R=0,B=0)
B(R=0,G=0)

Color spaces: HSV
Intuitive color space
H(S=1,V=1)
S(H=1,V=1)
V(H=1,S=0)

Color spaces: YCbCr
Y(Cb=0.5,Cr=0.5)
Cb(Y=0.5,Cr=0.5)
Cr(Y=0.5,Cb=05)
Y=0 Y=0.5
Y=1Cb
Cr
Fast to compute, good for compression, used by TV
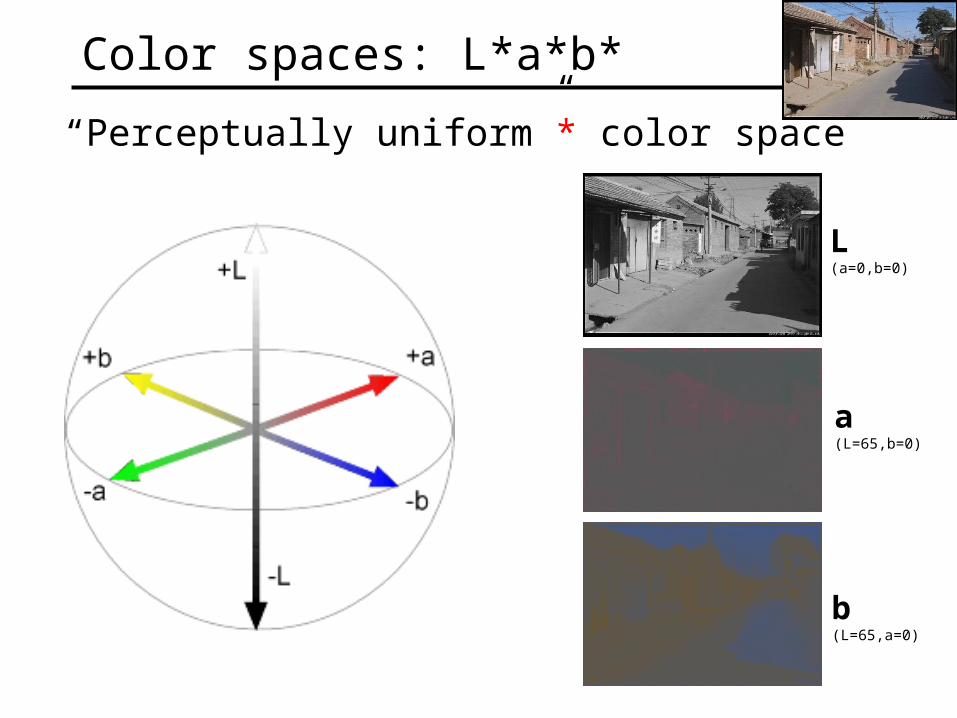
Color spaces: L*a*b*
“Perceptually uniform”* color space
L(a=0,b=0)
a(L=65,b=0)
b(L=65,a=0)
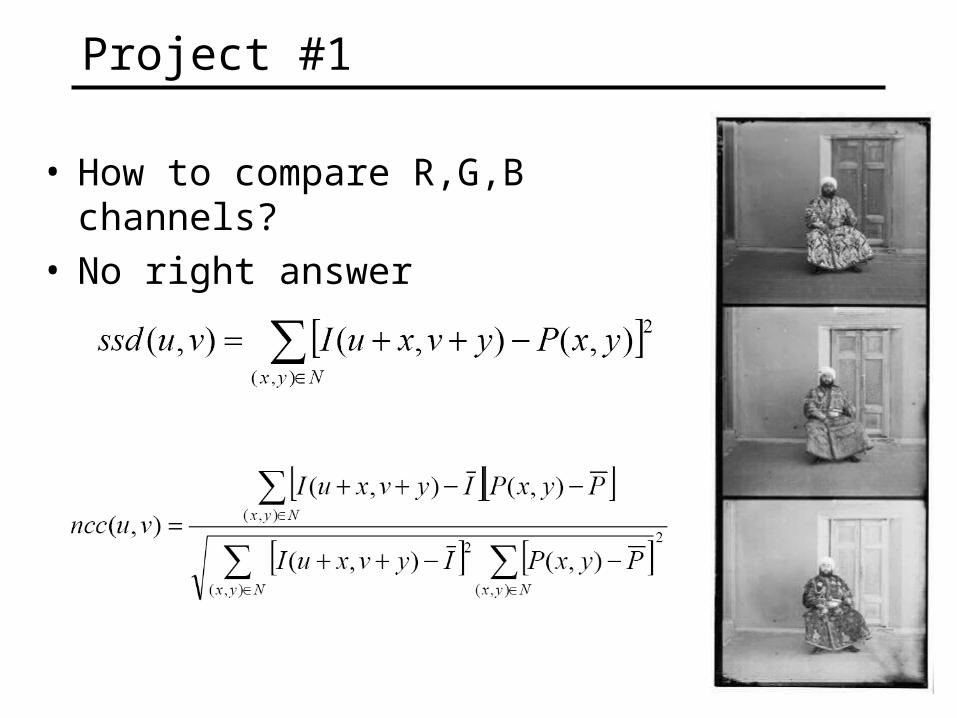
Project #1
• How to compare R,G,B channels?• No right answer
• Sum of Squared Differences (SSD):
• Normalized Correlation (NCC):

Image half-sizing
This image is too big tofit on the screen. Howcan we reduce it?
How to generate a half-sized version?
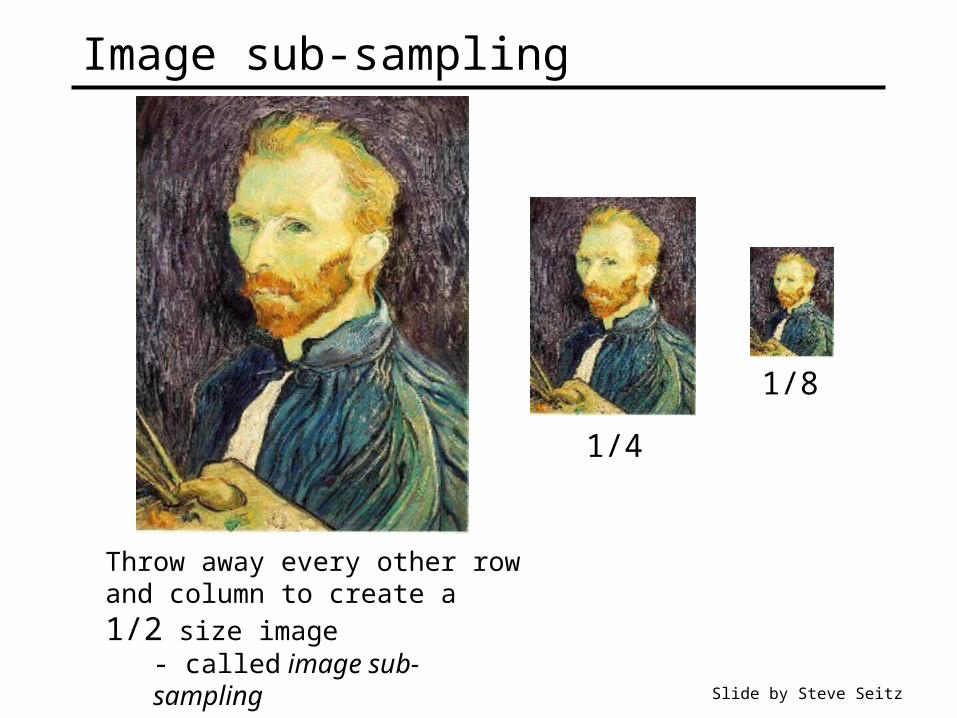
Image sub-sampling
Throw away every other row and
column to create a 1/2 size image- called image sub-sampling
1/4
1/8
Slide by Steve Seitz

Image sub-sampling
1/4 (2x zoom) 1/8 (4x zoom)
Aliasing! What do we do?
1/2
Slide by Steve Seitz

Gaussian (lowpass) pre-filtering
G 1/4
G 1/8
Gaussian 1/2
Solution: filter the image, then subsample• Filter size should double for each ½ size reduction. Why?
Slide by Steve Seitz

Subsampling with Gaussian pre-filtering
G 1/4 G 1/8Gaussian 1/2
Slide by Steve Seitz

Compare with...
1/4 (2x zoom) 1/8 (4x zoom)1/2
Slide by Steve Seitz

Gaussian (lowpass) pre-filtering
G 1/4
G 1/8
Gaussian 1/2
Solution: filter the image, then subsample• Filter size should double for each ½ size reduction. Why?• How can we speed this up? Slide by Steve Seitz
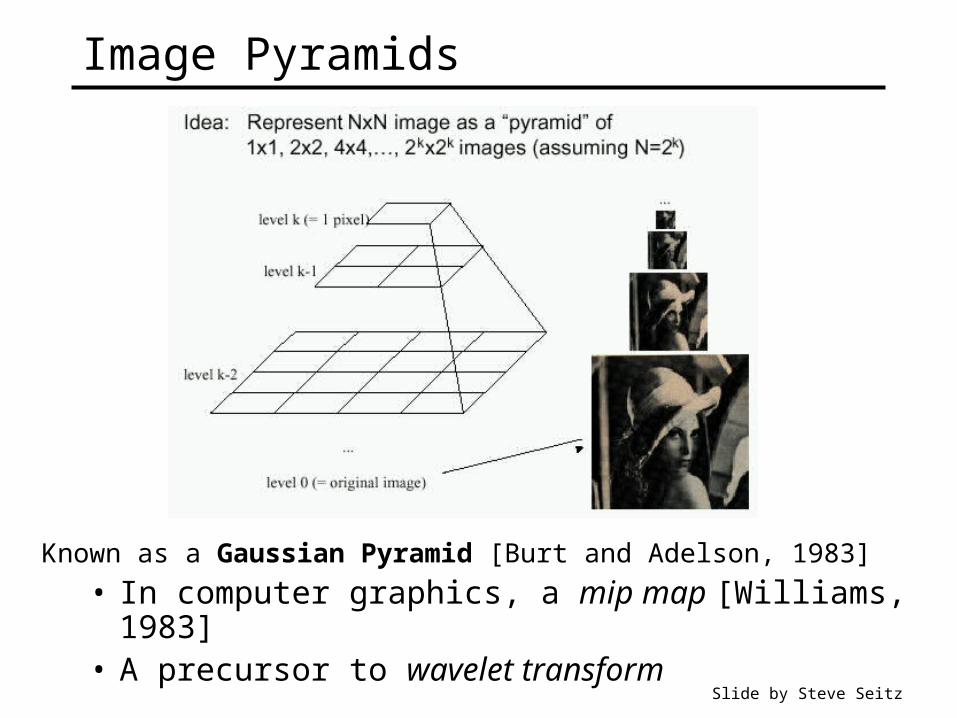
Image Pyramids
Known as a Gaussian Pyramid [Burt and Adelson, 1983]
• In computer graphics, a mip map [Williams, 1983]• A precursor to wavelet transform
Slide by Steve Seitz

A bar in the big images is a hair on the zebra’s nose; in smaller images, a stripe; in the smallest, the animal’s nose
Figure from David Forsyth

What are they good for?
Improve Search• Search over translations
– Like project 1
– Classic coarse-to-fine strategy
• Search over scale– Template matching
– E.g. find a face at different scales
Pre-computation• Need to access image at different blur levels• Useful for texture mapping at different resolutions (called
mip-mapping)

Gaussian pyramid construction
filter mask
Repeat• Filter• Subsample
Until minimum resolution reached • can specify desired number of levels (e.g., 3-level pyramid)
The whole pyramid is only 4/3 the size of the original image!Slide by Steve Seitz