rebalancing the economy sectorally and spatially: an evidence …orca.cf.ac.uk/72065/1/9.pdf ·...
TRANSCRIPT

Evidence Report 33August 2011
Rebalancing the economy sectorally and spatially: An evidence reviewVolume 1 – Main report

Rebalancing the economy sectorally and spatially: An evidence review Volume 1 – Main report
S. Pringle, G. White, R. Pates, J. Cook, V. Seth, R. Beaven, J. Tomaney, P. Marques, and A. Green
SQW Ltd, Cambridge Econometrics Ltd, the Centre for Urban and Regional Development Studies, and the Institute for Employment Research
Katherine Chapman
Policy Analyst
UK Commission for Employment and Skills
August 2011

Foreword
The UK Commission for Employment and Skills is a social partnership, led by
Commissioners from large and small employers, trade unions and the voluntary sector.
Our mission is to raise skill levels to help drive enterprise, create more and better jobs
and promote economic growth. Our strategic objectives are to:
• Provide outstanding labour market intelligence which helps businesses and
people make the best choices for them;
• Work with businesses to develop the best market solutions which leverage
greater investment in skills;
• Maximise the impact of employment and skills policies and employer behaviour
to support jobs and growth and secure an internationally competitive skills
base.
These strategic objectives are supported by a research programme that provides a robust
evidence base for our insights and actions and which draws on good practice and the
most innovative thinking. The research programme is underpinned by a number of core
principles including the importance of: ensuring ‘relevance’ to our most pressing strategic
priorities; ‘salience’ and effectively translating and sharing the key insights we find;
international benchmarking and drawing insights from good practice abroad; high quality analysis which is leading edge, robust and action orientated; being responsive to
immediate needs as well as taking a longer term perspective. We also work closely with
key partners to ensure a co-ordinated approach to research.
In November 2010, The UK Commission contracted a consortium led by SQW including
Cambridge Econometrics, the Centre for Urban and Regional Development Studies, and
the Institute of Employment Research to undertake an evidence review of existing
national and international evidence regarding the rationale for government intervention in
the sectoral and spatial structure of the economy. There has been considerable
discussion concerning the role of the state in helping to build a stronger, more
sustainable and balanced economy in order to ensure long-term competitiveness and in
light of continuing regional disparities within England. This project sought to understand
the existing evidence base around the rationale, impact, effectiveness and relevance of
previous policy interventions in rebalancing the economy both in the UK and abroad, and
to understand, where possible, the role of skills policy in ensuring the required effect. This
main report (Volume 1) summarises the overall findings from the evidence review. A
second report (Volume 2) contains five international case studies which were developed
as part of the research.

Sharing the findings of our research and engaging with our audience is important to
further develop the evidence on which we base our work. Evidence Reports are our chief
means of reporting our detailed analytical work. Each Evidence Report is accompanied
by an executive summary. All of our outputs can be accessed on the UK Commission’s
website at www.ukces.org.uk
But these outputs are only the beginning of the process and we will be continually looking
for mechanisms to share our findings, debate the issues they raise and extend their reach
and impact.
We hope you find this report useful and informative. If you would like to provide any
feedback or comments, or have any queries please e-mail [email protected]
, quoting
the report title or series number.
Lesley Giles Deputy Director UK Commission for Employment and Skills

Table of Contents
Foreword ............................................................................................................... 2
Executive Summary .............................................................................................. i Nature and scale of the ‘rebalancing’ challenge................................................................ ii
Rationales for intervention .................................................................................................. iv
What works? .......................................................................................................................... v
Role of employment and skills ........................................................................................... vi
Towards a future ‘rebalancing’ framework’ ...................................................................... vii
1 Introduction .................................................................................................. 1
1.1 Aims and objectives of the study........................................................................... 1
1.2 An introduction to ‘rebalancing’ ............................................................................ 2
1.3 Approach and methodology ................................................................................... 3
1.4 Report structure ....................................................................................................... 4
2 The scale and nature of the ‘rebalancing’ challenge in the UK ............... 6
2.1 Introduction .............................................................................................................. 6
2.2 Macroeconomic balance ......................................................................................... 6
2.3 Sectoral balance .................................................................................................... 11
2.4 Public–private balance .......................................................................................... 15
2.5 Spatial balance ....................................................................................................... 15
2.6 Defining the ‘rebalancing’ challenge – an ‘optimal’ balance? .......................... 19
2.7 Defining sectoral ‘rebalancing’ ............................................................................ 21
2.8 Defining public-private ‘rebalancing’................................................................... 22
2.9 Defining spatial ‘rebalancing’ ............................................................................... 23
2.10 Drivers and causes of the ‘rebalancing’ challenge ............................................ 24
2.11 Summary ................................................................................................................. 26
3 ‘Rebalancing’: The rationales for state intervention .............................. 27
3.1 Introduction ............................................................................................................ 27
3.2 Rationales for ‘rebalancing’ interventions .......................................................... 27
3.3 Underpinning theories of growth ......................................................................... 27
3.4 Market and other failures ...................................................................................... 29
3.5 Approaches to spatial ‘rebalancing’ .................................................................... 30
3.6 Spatial levels for intervention ............................................................................... 33
3.7 Approaches to sectoral ‘rebalancing’.................................................................. 35
3.8 Summary ................................................................................................................. 37

Rebalancing the economy sectorally and spatially: An evidence review
2
4 Practical types of ‘rebalancing’ actions .................................................. 38
4.1 Introduction ............................................................................................................ 38
4.2 Headline observations on the population of ‘rebalancing’ actions .................. 38
4.3 Approaches to ‘rebalancing’ over time ............................................................... 39
4.4 Relevant policy areas ............................................................................................ 40
4.5 Towards an organising typology for ‘rebalancing’ interventions .................... 41
4.6 Summary ................................................................................................................. 52
5 Towards a ‘rebalanced’ future – what works? ........................................ 53
5.1 Introduction ............................................................................................................ 53
5.2 Human capital and labour markets ...................................................................... 53
5.2.1 Human capital: Setting the ground rules ............................................................ 54
5.2.2 Human capital: Building enablers ........................................................................ 56
5.2.3 Human capital: Tilting the playing field ............................................................... 58
5.2.4 Human capital: Key lessons ................................................................................. 59
5.3 Business creation and development ................................................................... 60
5.3.1 Business: Setting the ground rules ..................................................................... 61
5.3.2 Business: Building enablers ................................................................................ 62
5.3.3 Business: Tilting the playing field ....................................................................... 63
‘Rebalancing’ the economy: The case of the UK’s offshore wind sector ..................... 65
The Context.......................................................................................................................... 65
The Opportunity .................................................................................................................. 65
The enablers of ‘rebalancing’ ............................................................................................ 66
Issues 66
5.3.4 Business: Key lessons .......................................................................................... 66
5.4 Science, innovation and knowledge .................................................................... 67
5.4.1 Science and innovation: Setting the ground rules ............................................. 67
5.4.2 Science and innovation: Building enablers ........................................................ 69
5.4.3 Science and innovation: Tilting the playing field ............................................... 72
5.4.4 Science and innovation: Key lessons ................................................................. 73
5.5 Land use, transport and infrastructure ............................................................... 73
5.5.1 Infrastructure: Setting the ground rules.............................................................. 74
5.5.2 Infrastructure: Building enablers ......................................................................... 75
5.5.3 Infrastructure: Tilting the playing field ................................................................ 77
5.5.4 Infrastructure: Key lessons .................................................................................. 78
5.6 Fiscal and regulatory regimes .............................................................................. 78
5.6.1 Fiscal and regulatory: Setting the ground rules ................................................. 79
5.6.2 Fiscal and regulatory: Key lessons ..................................................................... 80

Rebalancing the economy sectorally and spatially: An evidence review
3
5.7 Governance ............................................................................................................ 81
5.7.1 Governance: Setting the ground rules ................................................................ 82
5.7.2 Governance: Building enablers ............................................................................ 83
5.7.3 Governance: Tilting the playing field................................................................... 85
5.7.4 Governance: Key lessons ..................................................................................... 86
5.8 Summary ................................................................................................................. 86
6 Towards a rebalanced future – the economic feasibility ...................... 88
6.1 Introduction ............................................................................................................ 88
6.2 Explaining the projections analysis..................................................................... 88
6.3 Projection 1 - The Reference Case....................................................................... 89
6.3.1 Reference Case results ......................................................................................... 90
6.3.2 Sectoral balance .................................................................................................... 91
6.3.3 Spatial balance ....................................................................................................... 91
6.3.4 Employment and skills .......................................................................................... 91
6.4 Projection 2 - Dynamic Growth ............................................................................ 92
6.5 Projection 3 – Comparative Advantage ............................................................... 97
6.6 Summary ............................................................................................................... 100
7 Conclusions ............................................................................................. 104
7.1 Nature and scale of the ‘rebalancing’ challenge .............................................. 104
7.2 Rationales for intervention ................................................................................. 106
7.3 What works? ......................................................................................................... 106
7.4 Role of employment and skills ........................................................................... 108
7.5 Towards a future ‘rebalancing’ framework ....................................................... 109
7.6 Suggestions for further research ....................................................................... 112
Bibliography ..................................................................................................... 114
Appendix A: Towards a typology of ‘rebalancing’ interventions................. 127
Appendix B: Description of the MDM-E3 Model ............................................ 142
List of previous publications .......................................................................... 154

Table of Graphs and Charts Defining the focus of ‘rebalancing’ interventions going forward ............................................. ix
Figure 2.1 Expenditure components of GDP, 2009 ................................................................ 7
Figure 2.2 Current account balances, per cent of GDP (average 2005-09) .......................... 8
Figure 2.3 The composition of UK GDP growth 1990-2010 ................................................... 9
Figure 2.4 The external and government balances 1990-2010 ............................................ 10
Figure 2.5 Shares of employment by sector, 2006 ............................................................... 12
Figure 2.6 UK value added output by broad sector, 1971-2009 (per cent of total output) 14
Figure 2.7 UK employment by broad sector, 1971-2009 (per cent of total jobs) ............... 14
Figure 2.8 Sub-regional variation in GDP per capita, 2005 .................................................. 16
Figure 2.9 Regional shares of UK GVA .................................................................................. 17
Figure 2.10 Regional shares of UK jobs .................................................................................. 18
Figure 2.11 Public versus private sector jobs growth 1998-2006 by region ........................ 18
Figure 2.12 Regional GVA per head ......................................................................................... 19
Table 4.1 An organising typology for ‘rebalancing’ interventions .................................... 43
Table 4.2: Summary of types of actions employed to address sectoral and/or spatial ‘rebalancing’ ........................................................................................................... 44
Table 5.1 Summary of human capital and labour market actions ..................................... 54
Table 5.2 Summary of business creation and development actions ................................ 60
Table 5.3 ‘Rebalancing’ the economy: The case of the UK’s offshore wind sector ........ 65
Table 5.4 Summary of science, innovation and knowledge actions ................................. 67
Table 5.5 Centres of Expertise in Finland ............................................................................ 71
Table 5.6 Summary of Land Use, Transport and Infrastructure actions .......................... 74
Table 5.7 Summary of Fiscal and Regulatory actions ........................................................ 79
Table 5.8 Summary of Governance actions......................................................................... 81
Table 5.9 The ‘rebalancing’ experience in the Netherlands ............................................... 83
Figure 6.1 Reference Case employment growth 2010-2020 by broad sector (thousands) . ................................................................................................................................. 90
Figure 6.2 Occupational structure of employment by broad sector, 2009 ........................ 90
Figure 6.3 Reference Case employment growth 2010-2020 by UK regions (thousands) 92
Table 6.1 Projection 2 - The nature and scale of Dynamic Growth ................................... 93
Figure 6.4 Dynamic Growth Projection - employment growth 2010-2020 by broad sector (thousands) ............................................................................................................ 95
Figure 6.5 Dynamic Growth Projection - employment growth 2010-2020 by region (thousands) ............................................................................................................ 96
Table 6.2 Projection 3 - The nature and scale of promoting sectors of comparative advantage ............................................................................................................... 97
Figure 6.6 Comparative Advantage Projection - employment growth 2010-2020 by broad sector (thousands)................................................................................................. 99
Figure 6.7 Comparative Advantage Projection - employment growth 2010-2020 by UK nation/ region (thousands) ................................................................................. 100
Figure 6.8 Broad sector shares of UK GVA ......................................................................... 101
Figure 6.9 Broad sector shares of UK jobs ......................................................................... 102
Figure 6.10 National and regional shares of UK GVA .......................................................... 103
Figure 6.11 National and regional shares of UK jobs .......................................................... 103

Rebalancing the economy sectorally and spatially: An evidence review
2
Table 7.1 Defining the focus of ‘rebalancing’ interventions going forward ................... 111

Rebalancing the economy sectorally and spatially: An evidence review
i
Executive Summary
Study objectives and approach
The need to ‘rebalance’ the economy as the UK recovers from recession is a high priority
for the coalition government. As set out in the Plan for Growth published on 23 March
2011, the government aims “to achieve strong, sustainable and balanced growth that is
more evenly shared across the country and between industries” going forward. Whilst
there is substantial commentary on the intent to achieve ‘rebalancing’, there remains a
lack of clarity and agreement on what ‘rebalancing’ means: some commentators refer to
the balance between public and private employment, sectors (especially manufacturing
and services) and London/the South East and elsewhere in the UK; others refer to
‘rebalancing’ in the context of public spending and receipts, imports and exports, and
domestic/public consumption and business investment, and, most generically of all,
between economic, social and environmental outcomes. Furthermore, there appears to
be limited formal articulation of the rationale for the government to intervene in the
‘rebalancing’ process, how ‘rebalancing’ might be achieved most effectively, and how the
inherent tensions and trade-offs in addressing different elements of the ‘rebalancing’
challenge should be managed.
Against this background, this study explores the issue of ‘rebalancing the economy,
sectorally and spatially’, identifying where possible the role of, and implications for, skills
and employment policy. The work collated and reviewed UK and international literature
in order to better understand the following issues:
• the nature and scale of the ‘rebalancing’ challenge in the UK, and its causes;
• the rationale for state intervention in the sectoral and spatial structure of the
economy, both in the UK and abroad;
• types of interventions that have been employed by governments to influence
the sectoral and geographical structure of the economy, particularly in terms of
skills and employment interventions;
• what works and why in ‘rebalancing’ economies sectorally and spatially;
• what might be done in the UK to create a more (re)balanced economy, and the
implications for, and on, skills policy in supporting this process.

Rebalancing the economy sectorally and spatially: An evidence review
ii
The study involved an extensive review of relevant conceptual, empirical, policy and
evaluation literature from the UK and abroad, complementary case studies on
‘rebalancing’ in Finland, Germany, Korea, Netherlands and Germany, and formal
projections of the amenability of the UK economy to ‘rebalancing’. As part of the study, a
typology of interventions was also developed to help classify the different types of actions
that had been introduced to assist in
economic ‘rebalancing’, reflecting the
intensity of intervention by the public
sector, and the extent to which resulting
outcomes were tangible and/or
intangible. The research took place
between January and early March 2011,
with subsequent analysis and reporting in
late March and early April.
The research was undertaken by SQW Ltd, in collaboration with Cambridge
Econometrics Ltd (CE), the Centre for Urban and Regional Development Studies
(CURDS), and the Institute for Employment Research (IER).
Overview of findings
Nature and scale of the ‘rebalancing’ challenge
The term ‘rebalancing’ has become used increasingly as a metaphor for a wide variety of
changes seen to be required in the UK economy relating to its sectoral structure, shifts
from public to private sector activity, differences in economic performance across spatial
areas, and/or the balance between economic, social and environmental considerations.
The first conclusion of the study is that, even though the term is of recent origin and has
multiple interpretations, ‘rebalancing’ matters in a substantive sense.
That said, clarity is needed about what the term ‘rebalancing’ the economy means
in particular contexts. The wide nature of the ‘rebalancing’ challenge means that policy
makers need to take integrating approaches to ‘rebalancing’ action in their policy areas
and in links with other policy areas. In the skills and employment arena, this might mean,
for example, taking a holistic view of actions to address the issue of the general skills
needed for trading overseas, as opposed to focusing narrowly on a specific tradeable
sector.

Rebalancing the economy sectorally and spatially: An evidence review
iii
The evidence also unambiguously shows that there is little common agreement on the detail of what an ‘optimal balance’ might be in the sectoral and spatial sense, and
there are very few examples of direct relevance to UK’s governance and planning
contexts where ‘sustained rebalancing’ has been realised. It is legitimate,
nevertheless, to be concerned about the need for ‘rebalancing’ even though it may not be
possible, or even appropriate, to paint a detailed endpoint of what balance looks like at
the microeconomic level. Indeed, the endpoint itself is a moving target. For policy
makers in general, this means acknowledging there is no ‘silver bullet’, and ‘rebalancing’
objectives and actions need to be considered in process terms rather than as a well-
defined endpoint.
There is a related and important definitional point here, that microeconomic ‘balance’ does not necessarily equal growth, and is not necessarily desirable in all contexts.
For example, achieving a balanced low-skills equilibrium of low value added, low skills
and low wage employment, is not a desirable outcome .
Whilst there may be definitional issues about what constitutes microeconomic ‘balance’,
the evidence and economic data confirm clearly that the ‘rebalancing’ challenge,
in all forms, is a long-standing one. Sectoral change over the last 40 years has been
driven by globalisation and resulting market and technological change, and this will
continue to be the case. Western economies have shifted from manufacturing towards
services and knowledge-based economies seeking to compete on content rather than
price. Concerns about ‘deindustrialisation’ have been around for several years and, in
the UK, these have been strengthened by more recent specialisation on financial services
and the lack of resilience that this was seen to provide to global shocks and uncertainty.
Growing spatial imbalances reflect patterns of agglomeration, and have led over many
decades to some places being significantly and persistently more vulnerable to, and less
capable of responding to, these sectoral shifts.
Consequently, the challenges of imbalance and ‘rebalancing’ are widely experienced by
the UK’s competitors, and economies more generally worldwide. Decomposing GDP by
its components of expenditure, the UK’s broad balance is typical of several other large
developed economies such as Canada, France, Italy, and further afield in New Zealand.
Therefore, whilst the UK’s ‘rebalancing’ challenges are significant, they are not unusual internationally. Differences in productivity growth have also played a major
role in the widening imbalances in economic performance, and skills disparities are a key
factor in explaining national and regional productivity differences. Whilst the label may be
new, the issue of ‘rebalancing’ is not unique to the UK, and one in which skills and
employment issues in particular are key elements. This provides a strong general
argument for interventions designed to assist ‘rebalancing’.

Rebalancing the economy sectorally and spatially: An evidence review
iv
The study has also found that there are significant tensions and trade-offs involved
in addressing the ‘rebalancing’ challenge, with potential negative feedback effects
between the macro and microeconomic ‘rebalancing’ dimensions. Interventions to
support ‘rebalancing’ on one dimension may have unintended adverse consequences for
balance elsewhere. In particular, and drawing from the study’s macro scenario
projections, achieving macroeconomic balance at national level and shifting from the
public to the private sector as a source of employment is almost certain to lead to greater
spatial imbalances. These have not always been articulated fully in recent UK policy
debates. The Office of Budget Responsibility’s forecasts expect private sector job growth
to compensate for the loss of public jobs nationally. This will go some way to rectify the
public-private sector imbalance at an aggregate level. But, at the sub-national levels at
which most labour, skills, and enterprise markets work, the private sector may find it very difficult to compensate for lack of public sector job growth in areas where it has performed poorly in the past. This potential negative feedback loop of
macroeconomic action on the microeconomic context needs to be considered in the
design of any ‘rebalancing’ interventions.
Rationales for intervention
There is considerable debate in the literature as to whether government can and should
intervene with respect to ‘rebalancing’ in a sectoral and spatial sense, which has
clustered around the following issues:
• Deadweight public sector costs (expenditure that does not result in additional
activity)
• The risks that such interventions are not sustainable without on-going support
• Distortive effects caused by the allocation of resources and unintended
adverse effects elsewhere and/or at a later date.
These concerns are most obviously evident within a neoclassical growth framework, in
which spatial and sectoral differences in productivity are expected to reduce if market
forces are allowed to operate. These issues are also a concern within a theoretical
framework based on more recent thinking about new economic or functional geographies,
where spatial differences can be expected to persist long-term because of agglomeration
economies. Over time, endogenous growth and new economic geographies theories
have become more influential in economic development policy, which focus on improving
the adaptive capacity, productivity and utilisation of resources in places and maximising
positive externalities.

Rebalancing the economy sectorally and spatially: An evidence review
v
The evidence has shown that the rationales for specific government intervention in
support of ‘rebalancing’ activity have generally moved towards the need to
address the underutilisation of resources and improve the competitiveness of places, focusing on place-based growth rather than redistribution.
What works?
The evidence suggests that there are a number of factors which appear to be linked with
‘rebalancing’ impact and success:
• ‘Packages’ of interventions that span policy areas have better chances of success than single silo actions. For example, interventions linking housing
and transport are key to enabling agglomeration benefits in urban centres. The
study’s projections also highlight that mixed interventions can help mitigate
against the trade-offs and inherent tensions within ‘rebalancing’.
• In general terms, interventions that go with the sectoral and cultural grain
of places and are designed to sustain growth tend to be the more successful.
For example, this could be to relieve congestion in growth areas to sustain the
advantages of agglomeration, which has been an important factor in the
development of the UK’s financial service sector.
• Certainty and predictability going forward matters, especially where the
public sector is working with the private sector and where the market needs to
have confidence in the future direction of travel if it is to invest meaningfully, as
it takes time to achieve shifts in balance (especially spatial). This was, for
example, a key factor in the long-run success of industrialisation initiatives in
Asia. Continuous change in funding streams, qualifications, systems,
governance structures, and policy disrupt the ‘rebalancing’ process. Similarly,
‘rebalancing’ is more successful where there is simplicity in ‘enabling’ environments, such as tax incentives and regulations.
• Autonomy at the ‘right’ spatial level is key, along with local, city regional,
regional and national actors working in co-ordinated and reinforcing ways. This
is especially the case in the wider European context, where the capacity and
autonomy of regional institutions to develop regional spaces appears to have
been a very significant factor in ‘rebalancing’ effects in Sweden and the
Netherlands. It seems to be the case that certain policy areas require a
broader spatial perspective than the local area, because infrastructural policy
issues relating to ‘rebalancing’ (e.g. innovation, strategic transport, energy
planning, and supply chains) tend to operate at spatial footprints that extend
beyond local and sub-regional boundaries.

Rebalancing the economy sectorally and spatially: An evidence review
vi
• Capable and competent governance and oversight is key. This not only
provides the certainty and predictability referred to above, but the calibre of
thinking and accountability for performance are important factors in driving
‘rebalancing’ action forward. Linked to this, as illustrated in the international
case studies, institutional context is critical in considering what works where,
and how. The international evidence provided by the literature also shows that
any significant role for the public sector (generally) works best in collaboration with the private sector.
• Dialogue between employers, unions, workers and other organisations builds co-operation and co-ordination in ways of working across different spatial
scales, and between organisations within sectors. This can yield successful
outcomes when faced with challenges of sectoral restructuring, although it
takes time for trust to build.
• Investments targeting human capital and soft infrastructures have had positive results, although their impact varies from context to context. Skills
development is a particularly effective form of investment, although it does
need to be integrated with the local economic base. The existence of a varied
set of institutions offering both highly qualified knowledge workers and
provision for medium skilled workers also supports ‘rebalancing’ interventions.
Employers, as both individual organisations and within employer networks,
should be part of this institutional fabric, and their products and business
strategies more generally play a crucial role in shaping skills demand.
Role of employment and skills
Skills and employment initiatives are an important part of the ‘intervention mix’ and very
much a critical part of the long-term ‘rebalancing’ process. There have been a range of
skills and employment-specific interventions in the UK and abroad that have been
designed to address:
• the causes of imbalance, for example to raise skills levels, as part of a broader
programme to create the conditions for growth to address spatial imbalances;
• the consequences of imbalance, for example the public sector as a job-creator
in areas where the private sector under-performs;
• the consequences of the sectoral ‘rebalancing’ process, for example, in helping
people to adapt to changing skills or occupational requirements as the sectoral
structure of an economy changes.

Rebalancing the economy sectorally and spatially: An evidence review
vii
Turning now to ‘what works’ in terms of employment and skills policy in ‘rebalancing’
initiatives, the key messages are:
• Interventions supporting the development of the educational infrastructure and
hybrid people and skills interventions have provided some of the highest returns of any human capital and skills interventions which have assisted in
‘rebalancing’ economies sectorally and spatially in the UK and abroad.
• International evidence suggests that the expansion of higher education,
including specific targeting of applied sciences in some regions, has provided
skills of value to sector ‘rebalancing’.
• Intermediary organisations can play useful roles in working with employers
and education and training providers to ensure employers’ demand for skills
are met, particularly as an economy rebalances sectorally.
• Skills development and investment in training to aid the ‘rebalancing’ process
needs to be shared between employers, individuals, and government. Multi-stakeholder approaches can help achieve better skills provision.
• ‘Flexicurity’ approaches, emphasising lifelong learning and the skills for
sustaining and progressing in work, can yield positive outcomes for individuals
and can assist in the ‘rebalancing’ process between sectors (including
potentially the public-private sector).
• Lifelong learning is important in helping to deal with sectoral ‘rebalancing’ and
in responding to sectoral change. Information, advice, and guidance (IAG) is a
crucial component of lifelong learning.
• There is international evidence on the success of labour market policies in
helping to deal with restructuring and in responding to change, both sectorally
and spatially, especially when targeted at sectors with prospects for growth.
This suggests that anticipating skills change is crucial.
Towards a future ‘rebalancing’ framework’
Drawing on the evidence as a whole, the key overall conclusion is that sectoral and spatial imbalances matter where they constrain the ability of an economy to increase and realise its growth and development potential. This can happen in a
number of ways:
• Persistent spatial imbalances will be associated with unemployed and
underutilised resources that could be used more productively.

Rebalancing the economy sectorally and spatially: An evidence review
viii
• Sectoral imbalances can restrict growth if they cause underinvestment in
technological opportunity and change, and constrain its dissemination
throughout the wider economy (e.g. because of fractured supply chains, wider
activity that gets in the way of open innovation).
• Spatial and sectoral imbalances can make an economy, at local, city-region,
regional or national levels, less resilient to the increased shocks and
uncertainties that come from globalisation, be this in the form of market or
technology change.
Reviewing the macro and microeconomic data, the unavoidable conclusion is that the UK
has been, and is, an imbalanced economy in these three senses and that, therefore,
‘rebalancing’ is an important concern for policy makers. The long-standing nature of what
we now call the ‘rebalancing’ challenge re-emphasises this imperative. At the same time
it should also be acknowledged that in some ways ‘imbalance’ is a natural state of affairs.
Reducing the UK’s dependence on financial services, on London and the South East and
on the public sector as a source of employment and income have already been
highlighted in policy as integral elements of the ‘rebalancing’ process. So, too, will be
increasing private sector investment in R&D and innovation, in skills development, and in
overseas trade, as the Plan for Growth touches on.
But how this ‘rebalancing’ will, or should, manifest itself in the changing patterns
of economic activity, and to what extent, is less easy to specify. This is not just
because of uncertainties and idiosyncrasies at the microeconomic level, but also because
government’s macroeconomic ‘rebalancing’ policies will influence the sectoral and spatial
distribution of UK activity, as will the changes taking place in the global balances of trade
and investment, and the relentlessly differentiating impacts of market and technology
change. Throughout this process, there is a challenging conflict between government’s
policy objectives and the likely outcomes of powerful market forces, especially in terms of
spatial ‘rebalancing’, and a need for realism in what policy can achieve in this context,
particularly in the short-term and when addressing spatial imbalance.
Despite the uncertainties about the precise shape that sectoral and spatial ‘rebalancing’ can or should take, the evidence that we have drawn from UK and international experience tells us that appropriate government microeconomic interventions can
contribute to this ‘rebalancing’ and help overcome the constraints that imbalance
places on growth and development. However, the evidence also suggests the need for
caution about what can be achieved by these means. Overall, the evidence emphasises:
• the importance of working as far as possible with the grain of market forces to
prompt the private sector to realise the full potential of ‘rebalancing’;

Rebalancing the economy sectorally and spatially: An evidence review
ix
• the care that must be taken to avoid distortive effects which displace or crowd
out other sectoral or spatial economic activity, especially private sector activity;
• the need to build on existing strengths and capacities at sectoral and spatial
levels, acknowledging the importance of intangible assets, including knowledge
networks and assets, place and business cultures, or wider clustering effects
between principal actors including those in the skills and employment arena.
This might mean using ‘old skills’ in ‘new ways’ in places with sectorally
relevant antecedents;
• that combinations of interventions (particularly from mainstream service
providers such as local authorities) required to induce sustained changes in the
behaviour and practice of people, businesses, and networks, but bearing in
mind that relevant geographies are increasingly not co-terminus with
administrative boundaries;
• the investments that are often required to improve access to markets, both in
tangible (e.g. transport and housing) and intangible forms (e.g. supply chains
and links between universities and businesses).
Referring back to the typology of ‘rebalancing’ actions developed in this study,
interventions that are most likely to be effective are those that fall above the line shown in
the diagram below. Generally, these interventions tend not to have high unit costs in
terms of public expenditure, and hence would be consistent with the current austere
environment for public spending, which can be anticipated as lasting for some time.
Defining the focus of ‘rebalancing’ interventions going forward
7
4
1
Tangible
98Tilting the playing field, playing the role of principal
actor/agent
65Building enablers and conditions for
growth
32Setting the ground
rules and direction / promoting the
efficient operation of the market
IntangibleMixed
7
4
1
Tangible
98Tilting the playing field, playing the role of principal
actor/agent
65Building enablers and conditions for
growth
32Setting the ground
rules and direction / promoting the
efficient operation of the market
IntangibleMixed

Rebalancing the economy sectorally and spatially: An evidence review
x
As well as the need for caution in implementing microeconomic ‘rebalancing’
interventions, it is important to be realistic about the extent of ‘rebalancing’ that
interventions might actually achieve certainly over the short term. In particular, no
matter what success is achieved in macroeconomic and sectoral ‘rebalancing’, addressing spatial imbalance is likely to prove a sustained long-term project. Significant
shifts will be required to reverse imbalances in the geographical distribution of economic
activity that have been caused by deep-seated historical legacies handed down from one
generation to the next. Whatever the rationale, the long-term nature of such interventions
will undoubtedly require the maintenance of continuity and stability in governance and
management arrangements, all highlighted above as critical factors in effective
‘rebalancing’.

Rebalancing the economy sectorally and spatially: An evidence review
1
1 Introduction
1.1 Aims and objectives of the study
In November 2010, the UK Commission for Employment and Skills (the UK Commission)
commissioned research on ‘rebalancing the Economy, sectorally and spatially’, identifying
where possible the role of, and implications for, skills and employment. At its core, the
study sought to “review existing national and international evidence regarding the
rationale for government intervention in the structure of the economy with the intention of
building a strong and sustainable economy, balanced geographically and sectorally”1
The study’s emphases were on providing conceptual, empirical, and policy perspectives
on the ‘rebalancing’ issue, and analysing what might assist in ‘rebalancing’ the UK
economy, particularly from a skills and employment policy perspective. More specifically,
the research questions were as follows:
.
• What is the nature and scale of the ‘rebalancing’ challenge in the UK, and its
causes?
• What has been the rationale for government intervention in the sectoral and
spatial structure of the economy, both at home and abroad?
• What types of interventions have been employed by governments to influence
the sectoral and geographical structure of the economy, particularly in terms of
skills and employment interventions?
• What works and why? What have been the relevance, effectiveness and
impacts of previous policy initiatives in ‘rebalancing’ the economy sectorally
and spatially?
• What might be done in the UK to create a more (re)balanced economy, help
create the new economic circumstances, sectors, products and services on
which a successful, sustainable and competitive economy can be built? And
what are the implications for, and on, skills policy in supporting this process?
The research has been undertaken by SQW Ltd, in collaboration with Cambridge
Econometrics Ltd (CE), the Centre for Urban and Regional Development Studies
(CURDS), and the Institute for Employment Research (IER).
1 Sourced from UKCES study brief, 2010.

Rebalancing the economy sectorally and spatially: An evidence review
2
1.2 An introduction to ‘rebalancing’
The term ‘rebalancing’ has recently come to mean many things in the UK context: the
balance between sectors (especially manufacturing and services), private and public
economic activity, London/the South East and elsewhere in the UK, exports and imports,
public spending and receipts, domestic/public consumption and business
investment/exports and, most generically of all, between economic, social and
environmental outcomes.
Against this wide ranging background, the main focus of this study has been on the
sectoral (including public and private sector) and spatial dimensions of the ‘rebalancing’
debate. However, throughout the study, it was recognised that different aspects of the
‘rebalancing’ challenge are interconnected. These interconnections are both positive, so
for example any ‘rebalancing’ towards manufacturing is likely to be associated with
growth of exports, and negative, whereby balanced growth in the economy as a whole
could be consistent and even driven by apparent imbalances between high and low
growth sectors, and/or places.
At a macroeconomic level, the concept of ‘rebalancing’ is more readily understood and
defined in terms of a specific balance to be achieved (for example, in relation to fiscal
balances), and this is reflected in the published literature, including the recent
government Budget published on 23 March 2011. At the microeconomic level, the term
‘rebalancing’ has entered into the political discourse in the UK over the last year or so,
referring to a preferred ‘direction of travel’ (for example, from financial services to higher
research and development (R&D) intensive manufacturing, or from the public to the
private sector), but with limited clarity or agreement on what the resulting balanced
endpoint might look like. Moreover, whilst there has been substantial commentary on the
current policy intent to secure ‘rebalancing’, there is limited detail on specific interventions
to achieve this. More recently, the ‘Plan for Growth’ published alongside the Budget in
March 2011 does outline some interventions to achieve ‘balanced growth’, such as
introducing Enterprise Zones.
Given this broad context, the purpose of this study was to collate and review literature
that explicitly or implicitly referred to the ‘rebalancing’ challenge, to better understand
government intervention in this area, and to characterise where and how spatial and
sectoral ‘rebalancing’ or ‘balance’ has (or has not) been achieved in the past.

Rebalancing the economy sectorally and spatially: An evidence review
3
1.3 Approach and methodology
This study was based on an extensive review of relevant conceptual, empirical, policy
and evaluation literature from the UK and abroad, complementary international case
study work, and formal projection analyses using an established econometric model. As
part of the study, a typology of interventions was also developed to help classify the
different types of actions that had been introduced to assist in economic ‘rebalancing’,
reflecting the intensity of intervention by the public sector, and the extent to which actions
were tangible, intangible or a mix of both.
The first stage of the work, completed during December 2010, involved a detailed
Scoping Phase to establish the dimensions of the evidence base for review, and potential
international case study candidates from which learning might be usefully gained. A set
of search terms and search engines, agreed with the UK Commission, was used
systematically to generate a ‘long list’ of relevant written evidence, which was
subsequently concentrated into a ‘short list’ of 80 key sources of literature for review and
analysis. Further details of the sources included are provided in the bibliography at the
end of this report. At the same time, a review proforma was developed in consultation
with the UK Commission by which each piece of literature could be reviewed on a
consistent basis against the study’s research questions, as set out above.
A Scoping Paper was produced and agreed with the UK Commission in early January
2011, characterising in headline terms the proposed evidence base for review, the review
proforma to be used, and the international case studies ultimately chosen for exploration2
The Main Research Phase, completed during January and February 2011, comprised five
complementary strands of work:
• Formal, detailed review of approximately 80 key documents, which was
completed prior to the publication of the government’s Budget and Plan for
Growth in March 2011;
• International case studies of ‘rebalancing’ experiences in Finland, Germany,
Korea, Netherlands and Sweden3
• Development of a typology of interventions to classify and organise the various
types of ‘rebalancing’ interventions generated from the literature review and
case studies;
;
• A detailed assessment of the scale and nature of the ‘rebalancing’ challenge in
the UK and international case study countries;
2 Volume 2 of this report contains an explanation of how the case studies were selected. 3 Many of the international examples or comparisons provided in the report are drawn from these case studies, but this is not to say that other countries could not be used as comparators.

Rebalancing the economy sectorally and spatially: An evidence review
4
• Finally, the development of three projections of the impact on the sectoral and
spatial balance of the UK under different policy scenarios.
1.4 Report structure
This Volume 1 main report is structured as follows:
• Section 2 characterises the scale and nature of the ‘rebalancing’ challenge in
the UK. It presents the quantitative and qualitative evidence on the dimensions
of the challenge and how it has changed over time, and highlights the extent to
which the UK’s ‘rebalancing’ challenge is shared by other countries. It also
explores how ‘rebalancing’ is variously defined, and summarises views on the
drivers and causes of imbalance in the literature.
• Section 3 considers the rationales and policy arguments for active public sector
intervention to address sectoral and spatial rebalancing, and the various spatial
level(s) at which past interventions have been introduced.
• Section 4 presents a summary of the practical types of ‘rebalancing’ actions
yielded by the literature review and the international case studies that have
been implemented in the UK and abroad. The findings are organised using the
typology of interventions developed for this study.
• Section 5 considers how moves towards a ‘rebalancing’ future might be
practically achieved, based on evidence of past interventions to address
sectoral and spatial imbalances. It discusses what works (or not) in achieving
better balance, and why, with an emphasis on practical and relevant learning
for skills and other policy and interventions.
• Section 6 models the potential impacts on spatial and sectoral ‘rebalancing’
arising from three different policy scenarios at the level of the UK as a whole.
The section illustrates the extent to which a microeconomic ‘rebalancing’
challenge may still remain, even where macroeconomic ‘rebalancing’ has been
achieved.
• Finally, Section 7 presents the study’s conclusions, implications for action,
particularly for skills and employment policy, and highlights potential future
research to further fill gaps in understanding.
Following the Bibilography, the report is supported by two appendices:
• Appendix A sets out our approach to devising a typology of ‘rebalancing’
interventions, and offers more detail on the types of actions that fall into each
category of the typology.

Rebalancing the economy sectorally and spatially: An evidence review
5
• Appendix B provides a description of CE’s Multisectoral (MDM – E3) Model.
In Volume 2 of this report, we present the five international case studies on the nature of
the ‘rebalancing’ challenge and how it has been addressed in those countries. This
includes a summary of how, and why, the case study countries were selected.

Rebalancing the economy sectorally and spatially: An evidence review
6
2 The scale and nature of the ‘rebalancing’ challenge in the UK
2.1 Introduction
To set the scene for the wider report, this section characterises the scale of the
‘rebalancing’ challenge that the UK faces. It opens with a quantitative analysis of key
economic and data variables to characterise the scale of the ‘rebalancing’ challenge in
the UK. Indicators of macroeconomic balance are first reviewed, followed by indicators of
sectoral and spatial balance This is followed by a qualitative discussion of the causes of
sectoral and spatial imbalance in the UK. Both the qualitative analysis and the reflective
discussion that follows are based on the data sets and literature reviewed for the study.
2.2 Macroeconomic balance
Recent trends in particular macroeconomic indicators have prompted the current political
discussion of ‘rebalancing’ the UK economy. The following are the key dimensions of
macro imbalance identified by the government (see BIS, 2010k) and a wide range of
expert commentators:
• According to the Organisation for Economic Co-Operation and Development
(OECD) by 2007 the UK had the largest government structural deficit of any G7
economy. The government deficit widened to more than 12 per cent of GDP by
2009; one of the largest government deficits of the OECD countries.
• Relatively large shares of UK Gross Domestic Product (GDP) are accounted for
by household and government consumption, 64 per cent and 22 per cent
respectively on average during the 2000s. Similarly large shares of household
and government consumption are typical of several other developed economies
such as Canada, New Zealand, and in Europe, France and Italy (see Figure
2.1). Brazil also has a relatively high contribution to GDP from household and
government consumption. Government consumption typically accounts for a
large component of GDP in Scandinavian countries, but in countries such as
Luxembourg, Norway, Finland and Korea household consumption as a
proportion of GDP is comparatively low.
• Business investment as a share of GDP fell to 10.5 per cent in 2000-08
(compared to 11.7 per cent during 1990-99), which is below the share in the
US, Canada, Japan, Germany and France. Furthermore, the contribution of
business investment to GDP growth has also declined (to 1/8 of GDP growth in
2000-08, which compares to 1/3 in Germany) (BIS, 2010 l).

Rebalancing the economy sectorally and spatially: An evidence review
7
• There has been a persistent trend (since the early 1970s) for net trade4
Figure 2.1 Expenditure components of GDP, 2009
to
make a negative contribution to UK growth and this is reflected in its sustained
current account deficit. During 2005-09, the UK current account deficit
averaged 2.3 per cent of GDP per annum (pa), a slightly higher proportion than
the OECD average (see Figure 2.2). Net trade made a substantial positive
contribution to GDP growth in many of those OECD countries that achieved the
highest GDP growth over the past 10-15 years (e.g. Ireland, Slovakia,
Luxembourg, Korea, Israel, and Iceland).
Source: Cambridge Econometrics analysis of OECD, 2010h
4 Net trade is the difference between exports and imports.

Rebalancing the economy sectorally and spatially: An evidence review
8
Figure 2.2 Current account balances, per cent of GDP (average 2005-09)
Source: Cambridge Econometrics analysis of OECD, 2010h

Rebalancing the economy sectorally and spatially: An evidence review
9
Some aspects of imbalance are not new. Indeed, some have persisted for decades (e.g.
the large proportion of GDP accounted for by household expenditure and the current
account deficit). Others have shifted and changed over time in response to policy, global
trends and/or other drivers of growth, and specifically in response to the global financial
crisis of 2008. Such changes are illustrated by Figure 2.3, which shows UK GDP growth
in the 1990-2010 period and the contributions that each economic component made to
overall GDP growth. The larger the component’s share in overall GDP and the faster the
growth of that component, the greater was its contribution to GDP growth. The current
account and government balances are shown for the same period of time in Figure 2.4.
In the early 1990s, the UK’s recovery from the recession was aided by the depreciation of
sterling in 1992. The international competitiveness of UK exports was consequentially
boosted so that net trade made a positive contribution to GDP growth. The current
account deficit narrowed from 4-5 per cent of GDP at the end of the 1980s to around 1
per cent by the mid-1990s (see Figure 2.4). The small contribution to GDP growth made
by government consumption (see Figure 2.3) reflects the tight stance of fiscal policy
during the early 1990s; however, the aftermath of the early 1990s recession exacerbated
public borrowing (see Figure 2.4).
Figure 2.3 The composition of UK GDP growth 1990-2010
Source: Cambridge Econometrics analysis of ONS, 2010

Rebalancing the economy sectorally and spatially: An evidence review
10
Figure 2.4 The external and government balances 1990-2010
Source: Cambridge Econometrics analysis of ONS, 2010
In the 1995-2000 period, the strong growth of household spending and investment drove
robust GDP growth of 3.5 per cent pa. Household and business confidence was
bolstered by rising property and stock market prices, and domestic expenditure increased
more rapidly than did income. The household saving ratio fell from more than 10 per cent
in 1995 to less than 5 per cent by 2000. Export growth continued at pace, but import
growth accelerated to satisfy the strength of domestic demand; consequently the
contribution of net trade became negative and the current account deficit began to widen
once again. Strong economic growth and tight fiscal policy contributed to an improvement
in the public finances; a surplus was achieved by 2000.
During the 2000-2007 phase, GDP growth moderated but was sustained, interest rates
remained relatively low, and the deficits widened on the balance sheets of households,
government and the current account. Through expansive fiscal policy, government
spending was a significant driver of GDP growth and public borrowing began to grow
gradually. Export growth slowed, net trade continued to be a drag on GDP growth and
the current account remained in deficit. In an environment of relatively low interest rates
and steady growth, households funded their continued spending by drawing further on
savings and expanding debt; by 2008, the saving ratio had fallen to its lowest level since
the 1950s.

Rebalancing the economy sectorally and spatially: An evidence review
11
The financial crisis brought about large shifts in the balance sheets of the corporate
sector, households, government and the current account during 2007-09. Already in
healthy surplus at the outset of the crisis, the collapse of corporate investment has further
boosted the surplus on the balance sheets of (non-financial) companies. There was a
sharp shift from deficit to surplus of household finances, because households swiftly cut
spending to rebuild their savings. Following the policy measures implemented in the
aftermath of the global financial crisis, the government deficit widened markedly. The
initial support to financial markets (such as asset purchases, Asset Protection and Credit
Guarantee Schemes) amounted to substantial expenditures and the temporary cut in the
rate of Value Added Tax (VAT) put a squeeze on revenues. Subsequently, the current
account deficit has narrowed a little. The balance of trade improved, partly because the
fall of imports (due to weaker UK demand) was larger than that of exports (resulting from
the collapse of global demand).
2.3 Sectoral balance
Against this long run macroeconomic context, this section turns to issues of balance in
the UK’s sectoral structure. The following key points have been extracted from the
evidence:
• The public sector accounts for a relatively large share of the UK economy, both
as a share of total (value added) output (19 per cent), and even more so as a
share of the total number of jobs (27 per cent, see Figure 2.5). This is
comparable to the share of public sector employment in the USA. Those
countries with the largest share of employment in the public sector (more than
one-third of all employment) include the Scandinavian countries, France,
Belgium, and the Netherlands. Public sector employment is comparatively
lower in places such as Luxembourg, Brazil, Czech Republic and Poland.
• Financial services also accounts for a relatively large proportion of economic
activity: 22 per cent of output and 24 per cent of jobs. Financial services’ share
of employment in the UK is only exceeded in Luxembourg amongst European
Union (EU) Member States and comparable to that of the Netherlands.
• Manufacturing accounts for a diminishing and now relatively small proportion of
economic activity: 11 per cent of output and 9 per cent of jobs, lower than in all
other EU countries. The more recent accession states continue to have a
relatively high share of manufacturing employment, as do several long-standing
Member States such as Italy (20 per cent) and Germany (19 per cent).

Rebalancing the economy sectorally and spatially: An evidence review
12
Figure 2.5 Shares of employment by sector, 2006
Source: Cambridge Econometrics, 2010

Rebalancing the economy sectorally and spatially: An evidence review
13
Changes in the sectoral structure of the UK economy, reflecting some of the macroeconomic trends described above, have persisted over the last 30 years or so. In decomposing these changes, the following points are noteworthy:
• Since the early 1970s the share of output accounted for by the UK public sector
has shrunk a little, but the share of employment has increased (see Figures 2.6
and 2.7). At the time of expansionary fiscal policy from the late 1990s to the
mid-2000s, the number of jobs in the public sector increased more rapidly than
did the number of jobs in the private sector.
• Reflected in the sustained deficit in the balance of trade in goods, the share of
manufacturing (a highly traded sector) in the UK economy has been falling
persistently since the early 1970s; the share of employment has fallen faster
than that of output because those manufacturing activities that remain have
made increasing gains in productivity.
• The output of financial services grew rapidly during the latter half of the 1980s
attributed by many commentators at least in part to financial deregulation.
Through the 1990s until the financial crisis, the UK had a growing surplus in the
balance of trade in services, brought about through the growth of exports in
tradable services. The exports of financial services picked up from the late
1990s and the share of this sector in total output expanded further. Although
financial services have made a strong contribution to output growth since the
1990s, its share of total jobs has not increased.
• According to BIS (2010j), the UK stands out compared to the EU average as
having a disproportionately large contribution to output growth in recent years
from the financial and business services sectors. In addition, the UK is now the
world’s second largest exporter of services (HM Treasury and BIS, 2011).
• Other business and personal services have been growth sectors with regards
to jobs; taking the two sectors together, the share of output has risen from 18
per cent to 22 per cent between 1990 and 2009 and the share of jobs from 17
per cent to 24 per cent. Other business services (including professional
services such as architecture, accounting, real estate, and support services
such as security, cleaning) have been boosted by activity in the property
market, the increased demand from financial services, outsourcing and
overseas demand. Personal services (and also retailing, distribution, hotels &
catering) have benefitted from the sustained growth of UK household spending.

Rebalancing the economy sectorally and spatially: An evidence review
14
Figure 2.6 UK value added output by broad sector, 1971-2009 (per cent of total output)
Source: Cambridge Econometrics analysis of ONS, 2010
Figure 2.7 UK employment by broad sector, 1971-2009 (per cent of total jobs)
Source: Cambridge Econometrics analysis of ONS, 2010

Rebalancing the economy sectorally and spatially: An evidence review
15
2.4 Public–private balance
The previous section highlighted that in the UK the public sector accounts for a relatively
large share of the economy. Figures 2.6 and 2.7 show that since the early 1970s, the
public sector (government services) share of output had shrunk from 25 per cent to 20
per cent by 2009, but the share of employment increased from 17 per cent to 27 per cent.
This indicates that productivity (as measured by value added output per job) of government services declined over this period. The growth of the public sector, in terms of employment, has largely taken place over the last decade, although some
(such as CRESC, 2011) argue that the incapacity of the private sector to create jobs has
occurred since the 1980s.
2.5 Spatial balance
Looking at balance from a spatial perspective, the UK can be characterised as follows:
• Spatial variation in prosperity5
• Much growth and prosperity is concentrated in London and the adjoining
regions together forming the Greater South East. This has been the case for
many decades and the long-term trend is that regional disparities have
continued to widen. London’s role as one of the three world cities globally will
always mean that its position in the specific UK context is different.
across the UK remains high compared to that in
many other EU countries.
• Those nations and regions with the highest proportion of high-skilled workers
have relatively high Gross Value Added (GVA) per capita, productivity and
earnings; those with high proportions of no or low-skilled workers have
relatively low employment rates.
• The variation in productivity rates across the UK’s nations and regions reflects
industrial specialisation, for example the concentration of high value-added
financial and business services contributes to high productivity in London, but
also a wide range of agglomeration effects that contribute to spatial
concentrations of economic activity6
• At the sub-regional level, the disparities in prosperity and labour market
outcomes are even more pronounced than at the national and regional level,
with areas of very significant wealth often being side by side with locales
experiencing deprivation and need. This is especially so in the major cities (for
.
5 Spatial variation in prosperity is measured by the variation in wealth (GDP per capita) across the different (NUTS3) sub-regions within each EU member state. 6 Agglomeration effects refer to the economic benefits that firms obtain when locating near to each other. Agglomeration is further discussed in 3.3 Underpinning theories of growth.

Rebalancing the economy sectorally and spatially: An evidence review
16
example, localities within London) and this significant variation has persisted
over a long period of time.
The following paragraphs discuss some of these overarching characteristics of spatial
balance in more detail.
The headline indicators of economic inequality show that income distribution in the UK is less equal than that in the euro-zone and the OECD average (see Figure 2.8) and has not improved in recent years. This contrasts with the EU117
Figure 2.8 Sub-regional variation in GDP per capita, 2005
(core euro-
zone countries, which exclude the most recent accession countries) as a whole, where
the variation in sub-regional GDP per capita diminished between 1995 and 2005, but is
likely to have widened during the recent recession. At the end of the 1990s, sub-regional
variation in GDP per capita in the UK became more pronounced than the euro-zone
average, and remained so until the mid-2000s.
Source: Cambridge Econometrics analysis of Eurostat, 2010a
Reflecting its world city status, much growth and prosperity is concentrated in London
and the adjoining regions, a situation which has persisted for many decades. Indeed, BIS
(2010j) notes that London’s GVA per head has consistently been higher than the rest of
the country for the last 140 years. Some other world cities, for example the capital region
of Seoul in South Korea8
7 The EU11 is Belgium, Germany, Ireland, Spain, France, Italy, Luxembourg, Netherlands, Austria, Portugal, Finland.
, have similarly dominant concentrations of population and
economic activity.
8 See case study for Korea in the Volume 2 report.

Rebalancing the economy sectorally and spatially: An evidence review
17
London and the South East now account for almost one-third of UK GVA and this share has grown steadily since the early 1990s (see Figure 2.9). The general trend
since 1971 has been faster than UK average growth in the economies in the south of
England and the East Midlands so that their shares of UK GVA have expanded at the
expense of the northern regions, Wales and Scotland. The notable recovery in London’s
share of the UK economy since 1990 has been driven by the expansion of financial and
business services. Also notable is the upward trend in the relative size of the South East
economy alongside the decline in the share of the North West economy (and more
recently the West Midlands, North East and Wales). The same general trends are
present in the changes in the regional pattern of jobs (see Figure 2.10), although the
recent growth in London’s relative position is less pronounced (because of the scale of in-
commuting to London). The productivity gap has also been growing strongly and, as BIS
(2010j) reports, the gap between London and the least productive region expanded from
55 per cent to 80 per cent between 1993 and 2008.
Figure 2.9 Regional shares of UK GVA
Source: Cambridge Econometrics analysis of ONS, 2010

Rebalancing the economy sectorally and spatially: An evidence review
18
Figure 2.10 Regional shares of UK jobs
Source: Cambridge Econometrics analysis of ONS, 2010
Private sector jobs growth has also been concentrated in London and the South East. As noted by the Centre for Cities (2010b) ‘for every private sector job generated in
the North and Midlands between 1998 and 2008 ten were created in London and the
South9
Figure 2.11 Public versus private sector jobs growth 1998-2006 by region
’. As a result, the share of private sector jobs in London and the South East has
been rising (whereas in the North and Midlands it has been falling) and London has
generated 34 per cent of new private sector jobs since 1998 (ibid). Figure 2.11 shows
that, during 1998-2006 when employment growth in the public sector was particularly
strong, much of the employment growth in English regions outside of London/the South
and Scotland was attributable to jobs created in the public sector.
Source: Cambridge Econometrics analysis of ONS, 2010 9 The South here refers to the South East, East and South West regions of England.

Rebalancing the economy sectorally and spatially: An evidence review
19
These patterns of GVA and employment growth feed through into the relative levels of
national and regional GVA per head (see Figure 2.12). Over the last two decades, only
London and the South East have achieved GVA per head at or above the UK average.
Elsewhere, since 1989 only Scotland and Northern Ireland have made any gains to
narrow the gap.
Figure 2.12 Regional GVA per head
Source: Cambridge Econometrics analysis of ONS, 2010
2.6 Defining the ‘rebalancing’ challenge – an ‘optimal’ balance?
We now turn to the evidence base to see how ‘rebalancing’ is defined, whether an
‘optimal balance’ is possible, and what the key drivers and causes of imbalance are
assessed to be. Our focus here is on sectoral and spatial ‘rebalancing’, but it should be
noted that the challenge around the balance of economic, social and environmental
outcomes is seen by some commentators as equally important.
‘Balance’ is far easier to define and measure at the macroeconomic level, and there is
broad agreement across the literature reviewed for this study that correcting fiscal and
trade deficits towards some kind of ‘equilibrium’ will lead to positive outcomes for an
economy.
At the microeconomic level, however, there is no single definition of ‘rebalancing’, or
common agreement on what this means. The concept is often used as a metaphor for a
preferred ‘direction of travel’, rather than a condition or ‘end point’ that can be achieved,
across a wide myriad of economic measures, including GVA growth or GVA shares, job
creation, prosperity and even incomes depending on the protagonist’s perspective. The

Rebalancing the economy sectorally and spatially: An evidence review
20
Department for Business, Innovation and Skills (BIS) expressed the challenge in its
recent White Paper on Local Growth (2010f, p.5) in the following terms:
to create a fairer and more balanced economy, where we are not so dependent on a narrow range of economic sectors, and where new businesses and economic opportunities are more evenly shared between regions and industries...
More recently, the government’s Budget in March 2011 aims to “support balanced
economic growth and job creation” and The Plan for Growth (published alongside the
Budget) again sets out the government’s economic policy objective “to achieve strong,
sustainable and balanced growth that is more evenly shared across the country and
between industries”. As above, the emphasis is on achieving a more balanced economy,
but this Plan clearly anticipates that investment and exports will play a central role in
achieving this objective, through attracting Foreign Direct Investment (FDI) and
trade/exports, increasing private sector employment outside London and the South East,
and increasing investment in low carbon technologies.
At the same time, BIS acknowledges that it is not possible to specify exactly what a
‘rebalanced’ economy might look like or how long it might take to achieve. This is
generally the case across the reviewed literature which does not provide a rigorous
definition of ‘optimal balance’ in the micro context. On the contrary, the literature contains
more discussion on what an optimal balance is not. This is reflected in the government’s
Strategy for Sustainable Growth (BIS, 2010k, p.8):
There is no wide agreement on what the optimal balance between regions and sectors should be.
It w ould be unrealistic to expect regions to all have the same level of income per head, and both structural and w ider geographical and sociological forces w ill mean that dif ferent regions enjoy dif fering periods of grow th over t ime. But the extent and persistence of present imbalances mean w e are not maximizing our overall potential...
This suggests that the government sees the need for ‘rebalancing’ without necessarily being in a position to be able to, or want to, define what a balanced economy looks like in any sectoral or spatial detail. However, clearly the view is that
persistent imbalances need to be addressed because they restrict the growth and
development of the economy and (in terms of spatial ‘rebalancing’) represent the under-
utilisation of assets across nations, regions and localities. ‘Rebalancing’ is therefore a legitimate concern to ensure that the potential for growth and development is maximised.

Rebalancing the economy sectorally and spatially: An evidence review
21
2.7 Defining sectoral ‘rebalancing’
In terms of sectors, there is some consensus on the need for diversification of the UK
economic base, but there is considerable debate over which direction the ‘rebalancing’
process should take.
BIS argue that the economy needs to shift from non-traded to tradeable goods and
services, and from financial services towards manufacturing and the production of ‘real
goods and services’, with the expectation that this will contribute to current account
balance and GVA growth. A shift towards knowledge and innovation intensive activities
is referred to as ‘industrial upgrading’ or ‘reindustrialisation’ by some (Chowdhury, 2009;
CEPR, 2010). In some countries, such as France, the need for this kind of sectoral shift
has been embedded in policy aspirations. For example, the French government has set
an explicit growth target of 25 per cent for manufacturing over the next five years
(NESTA, 2010). Other countries prioritise particular sectors (e.g. green energy in
Germany, and telecoms in Finland and Sweden) but few have set such explicit targets as
France.
That said, some commentators argue that such shifts and reversals of trend are unlikely
to be achieved at the scale required. For example, an article by Groom for the Financial
Times (2010) quotes Tim Leunig’s view (LSE) that “the idea that Britain is going to turn
round a global secular trend in manufacturing employment rates is just not credible”.
Others, like Patrick Minford of Cardiff Business School, argue that contemplating such a
shift would be to deny the UK’s comparative advantage, which lies primarily in services
(ibid).
BIS (2010 l) and others, such as McKinsey (2010b), Oxford Economics (2009), and IPPR
(2009), argue that the economy should not become over-reliant on a narrow sector base
(whatever sector(s) these might be) because that makes the economy more vulnerable to
the shocks and uncertainties of the globalised economy. Rather, the argument is made
that places should diversify into ‘productive, broad-based and resilient’ economies
(McKinsey, 2010b). Even in countries that some commentators perceive to have better
balance (such as in Finland and Germany, where the share of manufacturing jobs is
considerably higher than the UK), there remain concerns about the vulnerability of
economies which are significantly dependent on any one sector or employer.
A further strand in the argument about sectoral balance is that certain segments of the
economic base matter more than others from a growth perspective, an argument which is
made in some academic studies and embodied in the policies of some overseas
governments. This relates back to debates in the economic literature about the role of
technology in the growth of advanced economies (e.g. NESTA, 2010), and the potential

Rebalancing the economy sectorally and spatially: An evidence review
22
that some sectors have for generating innovations and disseminating them through the
rest of the economy. The sectors often identified as playing this role are those that are
high skilled in content and R&D/innovation intensive, operating in competitive conditions
with an influence that percolates through the economy, typically through supply chains.
They are usually seen to be associated with Information Technology and other enabling
technologies (such as materials and life sciences).
In summary, there appear to be two particular arguments that suggest that sectoral balance matters, even in an economy with fully utilised resources. The first is that a highly specialised sectoral economy is less likely to be resilient to shocks, and the second is that an advanced economy that has specialised in sectors that do not generate much by way of innovation that benefits other sectors is likely to have constrained its longer term growth potential.
Cutting across both of the arguments above, some commentators (e.g. McKinsey, 2010c)
believe that, regardless of the sectoral balance, what really matters is the quality of resource that is committed to the workplace, and its management in whichever sector they happen to be located. This is linked to the argument for ‘rebalancing’ the
economy from low to high value functions, products and services in order to maximise the
utilisation of skills and improve the productivity of the workforce, without specifying a
preference in sectoral terms. The EC (2008b) emphasises the need to restructure the
workforce in qualitative terms (i.e. skills and qualifications required) and quantitative
terms (the number of jobs) to remain competitive, particularly in higher-skilled activities
where the EU has a comparative advantage. The key imperative from the EC’s view is
the need to anticipate and manage change, especially in the capability and skills of the
workforce, in order to limit any negative effects of sectoral restructuring.
2.8 Defining public-private ‘rebalancing’
The debate on ‘rebalancing’ between public and private sectors is more clear cut. This
predominantly relates to the redistribution of jobs between public and private sectors, i.e.
expanding private sector job opportunities and a moving away from over-reliance on the
public sector for job creation. This has been the focus of recent work by the Centre for
Cities (2010c), which reflects on how private sector employment generation varies greatly
across England, and some cities are now much better placed to create private sector jobs
than others.

Rebalancing the economy sectorally and spatially: An evidence review
23
2.9 Defining spatial ‘rebalancing’
In terms of spatial ‘rebalancing’, addressing regional disparities, gaps, inequality, and
uneven development in issues such as GVA growth, GVA per head, accessing economic
opportunities and the quantity and quality of employment are now rearticulated as matters
of ‘balance’. However there is some difference in terminology between:
• redistributing growth, inferring a shift from one place to another, for example
the World Bank refers to the spatial distribution of growth;
• convergence, BIS talks about convergence in productivity and employment
levels between regions (and convergence in GVA per head under the previous
government), and the EC refers to convergence to reduce the gaps in GDP per
head, employment and unemployment rates;
• raising the performance of particular places to address issues of
underutilisation of economic potential and resources compared to the
productive capacity of the economy, and enabling all regions to realise their
potential according to the EC, OECD and BIS (whether this results in
convergence or not).
The concern about the asset underutilisation consequences of spatial imbalance appears
to be shared across countries, although, as above, not always described in these terms.
Spatial policies are increasingly focused on growth, competitiveness and balanced
development, rather than redistribution (OECD, 2010d). Some countries have a
constitutional commitment to territorial balance. For example, Germany has a
constitutional commitment to ensure the ‘uniformity of living standards’ on the basis that
improving the performance of weaker regions will benefit the national economy, and so
ensures that macroeconomic conditions, policies and specific micro level assistance are
conducive to this aim. In Korea, the Fourth Territorial Plan (2000–2020) refers explicitly
to the objective of balanced territory as a basic goal, together with an open territory,
sustainable territory and reunified territory (see Case Study in Volume 2), and in Italy, the
aim of socio-economic ‘rebalancing’ has been an explicit objective of the Italian
Constitution since 1947 (OECD, 2010d). Others have developed policies that improve
regional balance in terms of social and economic development, such as Ireland, Mexico,
Finland, and Poland).

Rebalancing the economy sectorally and spatially: An evidence review
24
Overall, there appears to be some shift in thinking from spatial redistribution and convergence towards overall competitiveness and resource utilisation, and the need to raise the performance of all places. The EC, for example, argues that targets
should not be to rebalance, but to provide the framework and infrastructure to support the
competitiveness of industry and support growth and jobs, and that ‘rebalancing’ will occur
as a consequence of policies to improve competitiveness. Similarly, the OECD (2010d)
argues that competitiveness and equity is the new paradigm of regional policy, with a
focus on “tapping underutilised regional potential” through proactive regional
programmes.
2.10 Drivers and causes of the ‘rebalancing’ challenge
There is general agreement across the literature that the main drivers of apparent
sectoral imbalance have been globalisation, specialisation, deindustrialisation, off-
shoring, and technological change which has resulted in a shift from manufacturing
towards services and a knowledge-based economy10
The World Bank (2009) highlights the importance of specialisation linked to globalisation
and falling transport costs. As well as contributing to spatial agglomeration, falling
transport costs (allowing for easier trade and flow of goods and services) have meant that
there has been increased specialisation in particular activities within spatial
agglomerations.
. Free trade and increased
globalisation require nations to adjust to their areas of comparative advantage. However,
whether places can do so at the same time as maintaining full utilisation of resources and
maximising growth potential is the real issue. The skills and flexibility of the labour
market influence whether places are able to adapt. Failure to do this may manifest itself
in the form of imbalances.
BIS (2010c) argues that globalisation has been skills-biased so new technologies have
required higher proportions of skilled rather than unskilled workers, and this has led to
concerns of a potential ‘hollowing out’ of the UK workforce as the proportion of medium
skills jobs in the economy declines. Universities UK argues that, from a skills perspective,
universities have not responded sufficiently to the skills requirements of employers,
prepared students for a rapidly developing and changing economy, and have focused
research strategy on only a few subject areas (i.e. having too simplistic a divide between
science, technology, engineering and mathematics (STEM) and other subjects) rather
than having a breadth of knowledge that will be needed to allow for future ‘rebalancing’.
10 Examples of such literature includes recent economic growth documents produced by BIS (2010c, 2010j, 2010k), other government departments such as CLG (2008), the European Commission (2008b) and wider research organisations including JRF (2010), Centre for Cities (2010c) and the Smith Institute (2009)..

Rebalancing the economy sectorally and spatially: An evidence review
25
An inability to create a culture of innovation is also cited as a key driver of under-
performance in some areas (IPPR, 2009).
A key reason for the lack of private sector activity in some places is considered to be
inadequate qualifications and skills, and the tendency for the private sector to be
attracted to areas where there is a strong workforce. According to the Centre for Cities
(2010c, p.12) “skilled workers tend to sort themselves across an economy according to
where the best job opportunities are being generated” and this sorting has resulted in the
share of those educated to degree level being concentrated in London and the South
East. Furthermore, the lack of private sector jobs is a self-perpetuating problem because
the private sector will continue to invest where it can secure the best return on
investment, and will locate where there is already a strong private sector workforce (ibid).
There are also strands in the literature that argue that the role of the public sector in
creating jobs in lagging regions has crowded out the private sector leading to further
imbalance. Again, this emphasises the close links between public/private and spatial
‘rebalancing’ challenges, and the tensions and trade-offs between achieving different
types of balance. Whilst a shift from the public to private sector might be regarded as
‘optimal’, due to forces of agglomeration, this is likely to have negative consequences for
spatial balance in the UK.
The adequacy or otherwise of the responses to globalisation and technological progress,
and the implications for sectors, whose distribution varies across the UK, is also a key
driver of spatial imbalances. BIS (2010j) argues that London and the surrounding
regions have disproportionately gained from globalisation and technological processes,
and benefit from its better international connectivity and more skilled workforce, as might
be expected given London’s status as a world city. As a result, sectoral composition has
determined the performance of different places, highlighting the inherent inter-relatedness
of sectoral and spatial imbalances. The Department for Communities and Local
Government (CLG, 2008) also argues that changes in economic circumstances of an
area, such as restructuring away from traditional industries, results in the more mobile
moving away and others become trapped, leading to a concentration of deprivation in the
area.
Widening spatial imbalances in economic performance are also attributed to faster
productivity growth in well-performing areas. While differences in employment rates
across the country have been declining, productivity differences are growing strongly,
with London in particular seeing strong productivity growth (linked partly to the types of
functions undertaken in the capital, and the benefits of agglomeration). Skills disparities are a key factor in explaining productivity differences across regions and, according
to the Spatial Economics Research Centre, the skills composition of the workforce

Rebalancing the economy sectorally and spatially: An evidence review
26
explains more than half, and in some cases much more than half, of the apparent
differences in wage disparities (Overman et al, 2010).
2.11 Summary
The data analysis above shows that imbalance between sectors (including public-private)
and places is significant and not new. At the minimum, it has been around for a decade,
and at the extreme, 140 years. The nature of London as a world city means its
performance is quite atypical for the UK, and so makes the national ‘rebalancing’ job yet
harder. Furthermore, the observed shifts in macroeconomic, sectoral, private-public and
spatial balance can be compounding and conflicting. The UK’s diminishing reliance on
net exports and business investment for growth can be attributed in part to the long-term
decline in the share of manufacturing, and this itself has exacerbated spatial disparities in
growth. At the same time, the growing importance of the public sector which some
consider has contributed to sectoral imbalance has also helped to offset spatial
disparities in employment growth.
Across the literature, the concept of ‘rebalancing’ is defined in many ways. At the micro
level, there is little consensus on what ‘rebalancing’ means and the term has become a
metaphor for the preferred direction of travel towards ‘better balance’. In terms of
sectors, there is considerable debate over the direction in which the ‘rebalancing’ process
should move: to high-value manufacturing and away from an over-dependence on
financial services, to sectors that offer competitive advantage or most growth potential, or
to a more diversified, broad economic base to ensure the economy is resilient to shocks.
For some, the most important aspect of sectoral ‘rebalancing’ is shifting from low to high
value activities, and ensuring that a high quality, skilled workforce is available to do so. In
terms of spatial ‘rebalancing’, the focus is increasingly on the need to improve the
competitiveness, performance and resource utilisation of all places. For both sectoral
and spatial ‘rebalancing’, globalisation and technological advances, and the ability of
specific sectors and places to respond, which is in part linked to skills and labour market
flexibility, have been key drivers of growing imbalance in the UK.

Rebalancing the economy sectorally and spatially: An evidence review
27
3 ‘Rebalancing’: The rationales for state intervention
3.1 Introduction
In the previous section, the scope and scale of the ‘rebalancing’ challenge facing the UK
was described, together with the qualitative arguments evidenced in the literature as to
why, and how, imbalance presents itself. Against this background, this section examines
the evidence of the rationales for ‘rebalancing’ action by the state, drawing on both the
UK and international experience highlighted by the study’s literature review and case
studies.
3.2 Rationales for ‘rebalancing’ interventions
It is important to situate the rationales for ‘rebalancing’ interventions in the context of
theories of economic growth. Economic growth theory is not discussed in detail here;
analysis is restricted to consider how key drivers of economic growth have affected
political thinking, and how they may influence approaches to sectoral and spatial balance.
3.3 Underpinning theories of growth
There are three main theories of economic growth, against which any discussion of the
rationales for state intervention to ‘rebalance’ the economy need to be set:
• The first is neoclassical growth theory. As more recently summarised by BIS
(2010j), this theory argues that there will over time be convergence in regional
economic performance, assuming that markets operate efficiently and that
resources and technology remain mobile. People will move to areas with high
capital and high productivity in order to receive higher wages; firms on the other
hand will move to low capital and low cost places in order to receive a higher
return on their capital investment. The theory anticipates that, with the free
movement of capital and people and perfect information, productivity across
places will converge as supply is brought into line with demand in different
parts of the economy. Persistent differences in performance are attributed to
failures in the market, which may provide a case for state intervention.

Rebalancing the economy sectorally and spatially: An evidence review
28
• Counterpoised to neoclassical growth theory, which was popularised in the
1970s and 1980s, endogenous growth theory, alternatively argues that
growth depends on the adaptive capacity and productivity of an economy. This
in turn depends to a large extent on the skills and quality of the workforce, the
propensity of firms to innovate, the capability of firms and workers to absorb
new technologies and local knowledge spillovers (as a positive externality).
Places that possess these capacities can establish ‘first mover’ advantage, with
the associated benefits for local productivity and economic growth. Under this
theory, it is assumed that regions will diverge progressively rather than
converge, as factors such as highly skilled workers and innovation are
unevenly distributed across spaces, and places with these assets are more
likely to attract further skills and capital (Simmie and Carpenter, 2008; Roberts
and Setterfield, 2007).
• A further strand of economic theory more recently developed is that of New Economic Geography. This acknowledges that spatial differences will persist
even under neoclassical assumptions because businesses and people will
locate in particular places of high productivity so that they benefit from, for
example, thick labour markets, easier access to inputs and suppliers, and
knowledge sources and sharing (BIS, 2010j). Technically, these benefits are
known as agglomeration externalities, and themselves can drive further
agglomeration. Consequential factors, such as congestion, or higher house
prices, may act as constraints to these effects, unless they can be overcome
through, for instance, efficient transport networks or mixed housing markets.
The stances that the state or public sector agencies take to these differing theories of
growth play an important role in shaping what they do in terms of ‘rebalancing’. Taking
the debate outside the UK for example, the European Union’s view has historically been
focused on regional redistribution and the key need to tackle market failures that prevent
economic growth in all places, aligned with neoclassical thinking. This found its form in
the deployment of Structural Funds and Community Initiatives. Through its access to
European Regional Development Fund (ERDF) and European Social Fund (ESF)
resources, the UK’s lagging regions have benefitted significantly in financial terms. More
recently, the stance has changed to a policy of encouraging economic growth in all
regions.

Rebalancing the economy sectorally and spatially: An evidence review
29
By contrast, the World Bank (2009) view of spatial disparities in economic activity is
based on the theory of new economic geography, with unbalanced growth an inevitable
consequence of successful economic development because as economies grow,
production becomes more spatially concentrated through agglomeration effects. This
approach is consistent with the development of growth centres in the UK, with the
development of the ‘mega region’ based around London, and centres such as
Manchester, Leeds and Glasgow benefiting from agglomeration effects. In the specific
context of how skills relate to spatial concentrations, it is argued by Centre for Cities
(2010c) that higher skilled workers tend to locate according to where the best job
opportunities are being generated, resulting in differences in skills levels being embedded
across places.
3.4 Market and other failures
The failures in the operation of markets and/or the extent to which other elements of the
state system do not effectively coordinate their policies and interventions are vital in
framing the justification for intervention by the state. In the UK context, the current
guidance (as per HM Treasury’s Green Book) is that the state has a potential role to
intervene where the market does not, on its own, generate the most efficient outcome
(i.e. as a result of market failures), or the outcome is not desirable (in particular because
of equity considerations) and where the state can intervene cost-effectively and without
introducing adverse distortions elsewhere.
Based on the economic growth theories outlined above, addressing market failures is
critical in achieving spatial ‘rebalancing’ under the neoclassical theory. In the case of
endogenous growth theory and the new economic geography, addressing market failures
could be relevant if these are preventing economic growth. However, this may well apply
to high performing places or dominant sectors, and so may not necessarily lead to
greater balance. Given that endogenous growth theory and the new economic
geography imply divergence (rather than convergence), the pursuit of ‘rebalancing’
interventions could still be made on the grounds of equity arguments and/or where it was
associated with major and persistent underutilisation of resources.
BIS (2010j) describes the rationale for encouraging economic growth, though not
specifically ‘rebalancing’, using the standard typology of market failures and particularly
emphasises that intervention by the public sector should focus on activities the market
will not do by itself. The resulting market rationales are based on standard
microeconomic theory, which can apply in the UK or internationally, and include:
• public and club ‘goods’ which will be under supplied by the market because of
the difficulties private sector investors have in appropriating the benefits;

Rebalancing the economy sectorally and spatially: An evidence review
30
• externality arguments, for example government funding for basic research,
infrastructure and skills;
• information asymmetries, for example between borrowers and lenders, which
could justify action on access to finance;
• risks that are unacceptably high to individuals (which may justify regulation) or
risk aversion/credit constraints on employers (justifying funding for skills).
The BIS report also refers to the importance of creating a favourable business
environment through competitive taxes and a culture of enterprise. Equity arguments are
emphasised in other literature, for example, with reference to regional policy interventions
under the previous UK government (BERR, 2009b), along with efficiency arguments. The
shift in the rhetoric in the UK is interesting, with both efficiency and equity arguments
highlighted under the previous government giving way to more emphasis on efficiency
arguments under the new coalition government. Equity arguments are implicit in some
documents and announcements under the new UK government however; for example,
policy documents state that all businesses and places should be able to realise their
potential with government wanting to “foster a thriving and more balanced economy so
that no region or community gets left behind” (Cabinet Office, 2010, p.1). Internationally,
the OECD (2010a) highlights the shift in attitudes from regional redistribution in the 1980s
to economic growth in all regions. Coutts et al. (2007) particularly highlight an equity-
based argument for government action on ‘rebalancing’, to which we return below.
A fundamental point in considering the rationale is the extent to which state intervention
to address one set of problems causes distortions and has potential adverse effects
elsewhere, the so-called ‘unintended consequences’ effect. The basis for state
intervention is often related to the concern about significant and persistent
underutilisation of resources. The key question that follows is whether action by
government can make the necessary difference at all and without distorting resource
allocation and use elsewhere.
3.5 Approaches to spatial ‘rebalancing’
Reflecting the point made earlier about the ways in which different theories of growth
favour particular standpoints, it is interesting to observe from the literature, and the
international case studies, how these stances are drawn through into approaches to
spatial ‘rebalancing’. Taking the evidence as a whole, three standpoints are evident:

Rebalancing the economy sectorally and spatially: An evidence review
31
• The World Bank (2009) argues that, because of agglomeration effects and
specialisation, state-led attempts at spatial ‘rebalancing’ of economic activity
are likely to be ineffective. In the UK, therefore, it is perhaps unsurprising that
Regional Development Agencies (RDAs) could not close the gap between the
richest and poorest regions. The World Bank indicates that the rationale for
intervention is very much around economic integration that addresses spatial
disparities in quality of life, not spatial disparities in economic activity. This
provides a case for improving connectivity to dynamic areas for the purpose of
access to markets and to opportunities, and also for infrastructures and/or
incentives that help relocation to dynamic areas. This rationale is echoed by
the Centre for Cities (2010c) which indicates that government can have little
influence on spatial ‘rebalancing’, in particular in the context of private sector
growth. As a result, the argument is made for market-based spatial policy that
can further enhance private sector-led growth in those cities that are the
strongest performers. BIS (2010a) also acknowledges that there are
substantial limits to achieving geographical balance, partly because of
agglomeration forces.
• The second standpoint is represented by the EU and OECD (Barca, 2009;
OECD, 2010a) which argues that spatial policy should be about growth in all
regions, in order to maximise their potential. Implicitly this means an objective
based around addressing disparities in economic activity. The agenda set here
is, however, very much about regional growth (and efficiency arguments within
regions), not regional redistribution, which was favoured as the key argument
until the 1980s (OECD, 2010a). Recent presentations made by the OECD (see
OECD, 2007a and 2010b) particularly highlight wealth creation, the role of
innovation, and upgrading of regional assets as key imperatives. In many
ways, these arguments are not dissimilar from the rationales underpinning
some RDA activities which focussed on capitalising on underutilised regional
strengths and assets, especially innovation assets, and also interventions
identified in the international case studies on Finland and Sweden. This
implicitly may mean concentrating resources to support particular places, which
may mean higher performing places if they have the existing assets and
strengths, where agglomeration benefits can be achieved and leveraged.
• The third view suggests that the public sector does have a role in spatial
‘rebalancing’, in particular from an equity perspective. This argument
recognises that, like the first perspective, the market does not bring about
private sector-led economic growth in certain places. As a result, the public
sector actually has a role in job creation (i.e. by creating public sector jobs) in

Rebalancing the economy sectorally and spatially: An evidence review
32
these lagging places in order to make use of underutilised labour. Coutts et al.
(2007), Green (2009) and the Centre for Cities (2010b, 2010c) all highlight the
role that public sector job creation has had since the late 1990s in alleviating
increasing regional disparities in the UK, with the first of these authors
indicating that this presents a case for an important role for the state. In
Denmark and Germany, the public sector is identified as having a clear role in
job creation (as well as in active labour market policies), in particular as this
often creates jobs for lower skilled workers and there is an incentive for the
state to then help increase skill levels (Martin and Thelen, 2007).
It seems that all three of these views may start from the new economic geography
perspective. However, the conclusion on the role for the state in ‘rebalancing’ is very
different, with the World Bank view indicating that spatial ‘rebalancing’, as we have
defined it, would be ineffective. The EU and OECD view suggests that growth should still
be an objective in all regions, though this may mean focusing on those places or assets
within regions with the most potential. The final view implies the public sector should step
in where the market will not create sufficient jobs.
The current government’s position appears to draw on elements from these different
views, whilst not aligning entirely with any one of them. On the one hand BIS (2010a)
accepts that there are limits to what can be achieved in terms of spatial ‘rebalancing’ of
economic activity, agreeing to some extent with the first view, but on the other hand, as
noted in Section 2, The Plan for Growth sets an objective for ‘balanced growth that is
more evenly shared across the country and between industries’ (HM Treasury and BIS,
2011). This objective is perhaps most clearly aligned with the second view.
Similarly, the policy instruments announced so far by the coalition government to help
bring about more balanced growth vary in terms of their alignment with the three views
set out above. For example, the creation of Enterprise Zones focuses on areas with
genuine economic opportunity to derive benefits for the wider economic area (CLG, 2011)
possibly with a view, though not explicitly stated, to building on existing assets and
seeking to bring about agglomeration benefits. However, the fundamental rationale for
Enterprise Zones is that the costs of doing business are too high in a particular area and
require subsidy, which may be the type of intervention that the World Bank would argue
to be ineffective. Only time will tell as to the balance of Enterprise Zone locations and the
way in which these locations can be used to leverage agglomeration effects. More
consistent with the second view cited above are other policies set out in HM Treasury and
BIS (2011), such as the investment in infrastructure (e.g. various investments in the rail
infrastructure) and Technology and Innovation Centres (TICs). Whilst TICs are not cited
under the ambition for more balanced growth, the first of these, on Advanced

Rebalancing the economy sectorally and spatially: An evidence review
33
Manufacturing, ought to help capitalise on innovation assets in regions outside of London
and the South East.
The international case studies provide some further insights around these debates. The
rationale in Sweden, for instance, has followed the transition signalled by OECD (2010a),
with regional policy originally focused on a distributional rationale, but more latterly on
growth in all regions. In Germany, the aim of regional policy is similar though leaning
more to distributional arguments, specifically to help reduce the regional disadvantages
faced by structurally weak regions. In South Korea, there is also an objective for
balanced growth because of the desire to increase competitiveness of regions outside of
the capital region and the fact that the capital region is on the border with North Korea,
with associated worries of a military attack. In the Netherlands, it is interesting that the
national policy is to focus explicitly on those areas of growth potential, aligning most
closely with the World Bank view and agglomeration arguments. The Northern region in
the Netherlands has resisted this (given that it is not a growth centre) and created its own
policy for economic growth, seeking funding and support from other sources such as the
European Union.
The debate on spatial ‘rebalancing’ is pertinent to public-private sector ‘rebalancing’.
Based on the arguments made in relation to spatial ‘rebalancing’, it would seem that the
rationale for private sector growth exists mainly in already high performing places, in
particular leading regions of the UK. The third view on the spatial ‘rebalancing’ debate
actually implies that there is a rationale for public sector job creation, or at least retention,
in lagging places.
3.6 Spatial levels for intervention
A related issue to the wider rationale for spatial ‘rebalancing’ is the geographical level at
which policy is undertaken. The then Department for Business, Enterprise and
Regulatory Reform (BERR, 2009b) indicated that regions were the right level for
intervention:
The rationale underpinning the establishment of the RDAs was that account needed to be taken of variations in regional and sub-regional economies when developing and delivering some aspects of economic policy. In particular, the RDAs were created to enable market failures and other impediments to better economic performance to be tackled at the appropriate spatial level. (BERR, 2009, p.4)

Rebalancing the economy sectorally and spatially: An evidence review
34
Current UK government policy identifies that centralised decision-making can create
bottlenecks, but regions are unnatural geographies. A policy of devolving to the local level
has therefore been adopted as, it is argued, this more appropriately reflects the operation
of the relevant markets (BIS, 2010j). This has included ‘City Regions’ in the past (for
example, in 2009 the Labour Government announced Greater Manchester and Leeds as
pilot statutory city regions, which would receive delegated powers from central
government) and more recently Local Enterprise Partnerships (LEPs), which the coalition
government envisages will reflect functional economic geographies.
Whilst the international evidence needs to be treated with caution because of the
differences in scale and geography to the UK, radically different approaches have been
taken. Of the case studies, Germany is perhaps most relevant in these terms but has a
much more federal model to begin with. In Germany, the 16 Lander have a key role in
regional policy. Others, such as Sweden and Korea, have steadily recognised the role of
regions, especially in the context of innovation systems and wider regional attractiveness.
Sweden, historically, has had a weak regional tier with national and municipal tiers
dominating. It has recently introduced pilot regional initiatives to support regional
economic growth. In the case of the Netherlands, spatial policy is nationally driven,
though a set of Northern provinces have established their own sub-national structure for
economic development in their own geography. This aligns more with the attempt to
reflect the market and natural geographies, and is notable given the complete absence of
national politics in its establishment. In many ways therefore, the downplaying of the
regional tier in England at least, runs counter to past practice in other countries.
It is important to mention a third spatial level, namely the pan-regional dimension. The
OECD (2010b) indicates the value in bringing northern cities in the UK into a cohesive
economic unit because this can aid collaboration between different types of partner and
also help to build a critical mass. Through the Northern Way, which was in operation
from 2004 to 2011, England’s northern regions have developed considerable experience
of working through innovation, strategic transport and energy as policy areas functionally
operating at a supra-regional level.
In practice, the geography of policy areas and appropriate structures is multi-layered. For
labour markets, the region is too big a scale and a local geography is more appropriate.
For sector-based policies, for example the visitor economy, the region may be a more
appropriate geography. For yet others, such as strategic transport infrastructure and
supply chains and innovation, the most appropriate geography is pan-regional or national.
Therefore, it is important to retain flexibility on the appropriate spatial level with an
emphasis on functional economic relationships, rather than inherited constructs dictated
by administrative or institutional boundaries whether regional or local. This does have

Rebalancing the economy sectorally and spatially: An evidence review
35
some important implications for the new Local Enterprise Partnerships, which tend to be
based around local authority and county level administrative geographies. The same
argument would apply to considering the appropriate sectoral level for intervention, as in
some cases the relevant functional relationships may extend across supply chains. It is
to the question of sectoral balance that we now turn.
3.7 Approaches to sectoral ‘rebalancing’
Various arguments are evident from the study’s literature review and case studies in
support of influencing the sectoral structure of an economy, with a balance between
generic support (e.g. for start-ups and access to finance) and support for specific sectors.
Objectives of such support include:
• Ensuring a diverse economic base, including avoiding undue reliance on one or
two sectors such as financial services (NESTA, 2010), with recognition that
green sectors are particularly important (The Economist, 2010b). For example,
the coalition government’s Strategy for Sustainable Growth (BIS, 2010k) set out
aims to ensure that all sectors are performing to their maximum capacity
and to aid the transit ion to a green economy. More recently, The Plan for
Growth highlights the business opportunities in tackling environmental
challenges in the UK and abroad with the potential of also attracting inward
investment (HM Treasury and BIS, 2011).
• Helping to restructure struggling sectors towards more appropriate futures
(European Commission, 2010a) or restructuring more generally to a
technology-based future (OECD, 2009c; NESTA, 2010), which will require the
development and use of STEM (science, technology, engineering and
mathematics) skills in particular (Work Foundation, 2010). For example, the
previous government’s New Industry, New Jobs policy (HM Government, 2009)
focused on encouraging commercially successful innovation science and
technology within industry, and the importance of strengthening STEM skills
(especially in graduates) to enable this.
• Supporting manufacturing as a real wealth creator or because it is strategically
important (ERA Foundation, 2010; Policy Exchange, 2010).
Some commentators argue that there is a need for interventions that will lead to an
improved net trade balance (Wolf, 2010; Martin, 2010a), and that this requires a shift in
activity from the non-traded to the traded sector. Wolf (2010) in particular identifies
nurturing manufacturing on these grounds. The Plan for Growth (HM Treasury and BIS,
2011) particularly highlights the role of the traded sector, contributing simultaneously to
more balanced growth between industries and an improved net trade balance. Whilst in

Rebalancing the economy sectorally and spatially: An evidence review
36
BIS (2010k), there is reference to the Office for Budgetary Responsibility (OBR)
expecting that the economy will rebalance away from consumption towards investment
and net exports naturally, the Plan for Growth outlines a series of government actions to
help support and accelerate the process, e.g. through increased exports (HM Treasury
and BIS, 2011).
UK policy on sectoral ‘rebalancing’ has, since the recent recession, emphasised the
importance of removing barriers for businesses, investing in infrastructure, growth of a
range of sectors, capitalising on the green economy and encouraging export potential.
All of these are cited in both New Industry New Jobs (HM Government, 2009) and the
Plan for Growth (HM Treasury and BIS, 2011). Indeed the identification of specific
sectors in both of these strategies is almost identical: advanced manufacturing;
healthcare and life sciences; digital and creative industries; professional and business
services; and construction/engineering construction. The latter Plan for Growth also cites
the retail, tourism and space sectors.
In addition, some proponents of sectoral ‘rebalancing’, and of manufacturing more
specifically, suggest that this may aid spatial ‘rebalancing’. This is presumably because
sectors such as manufacturing might be potentially important economic drivers in some
lagging regions with an industrial heritage both in terms of their skills bases and supply
chain infrastructure.
The arguments proposed imply three broad grounds for sectoral ‘rebalancing’:
• the market does not seem to create a diverse economic base itself;
• certain sectors require support to upgrade to retain competitiveness and
overcome path dependency issues;
• it is important to other objectives, such as developing the green economy, and
contributing to net trade balances and spatial ‘rebalancing’.
Referring back to the original drivers of economic growth and the arguments about
specialisation, it may well be expected that the market would lead to concentration in
particular sectors. Therefore, the rationales for supporting particular sectors, as opposed
to supporting an environment for a range of sectors to become competitive, need to be
well grounded and evidenced. Indeed, sectoral balance might imply that economies
could not specialise in their more productive industries, as implied by Ricardo’s theory of
comparative advantage (Scitovsky, 1959). Dutt (1989) suggests that sectoral linkages
complicate this matter however. He suggests that more developed countries have
comparative advantage in the production of goods and services that have more potential

Rebalancing the economy sectorally and spatially: An evidence review
37
for generating technological change due to learning. He indicates that these may have
spin-off effects on other sectors as well.
There are some potential question marks on the extent to which there is a rationale for
government intervention on the net trade balance (where the OBR suggests this may
occur naturally in any case), and also on the extent to which sectoral ‘rebalancing’ might
be consistent with spatial ‘rebalancing’. We return to this latter point in Section 6 of this
report, in which different scenarios are modelled.
3.8 Summary
Across the literature reviewed and case studies produced for this study, there is
considerable debate on the rationale for state intervention in sectoral and/or spatial
‘rebalancing’, depending on the commentator’s theoretical perspective. Over time, the
argument for state intervention has moved from neoclassical theories, whereby
convergence will occur if market failures that prevent the efficient operation of the market
are removed, through to new economic geography and agglomeration theories, such as
those advocated by the World Bank, which suggest that unbalanced growth is a
consequence of economic growth and development.
Over time, the rationale for spatial intervention has shifted from one of regional
redistribution to one that is based on addressing underutilisation of resources and
improving the competitiveness of all places, including those that already perform well.
Whilst this is consistent with seeking to ‘go with the grain’ of the market, policy responses
also reflect the need to be seen to do something to address disparities in economic
activity. The spatial level at which policy is undertaken varies, from the level of local
geographies (such as LEPs in the UK), through to the regional level in many of the
international case study areas, and up to pan-regional levels (for example, The Northern
Way in England). In practice, functional geographies are multi-layered, and so the
appropriate geography will depend on the issue and policy area.
The rationale for sectoral ‘rebalancing’ focuses on ensuring an economy has a diverse
base, helping struggling sectors to more productive futures, and supporting specific
sectors (such as manufacturing) because of their strategic importance as ‘wealth
creators’. Intervening to encourage sectoral ‘ rebalancing’ is also justified on the basis
that it helps to rebalance the economy at a macro level, for example, through developing
tradable and exportable goods/services that will contribute to the net trade balance, and
reduce the vulnerability of the economy to the shocks and uncertainties of the globalised
economy. Furthermore, there is also an equity argument that suggests some elements of
sectoral ‘rebalancing’ may assist in spatial ‘rebalancing’, particularly in places that suffer
from path dependency issues.

Rebalancing the economy sectorally and spatially: An evidence review
38
4 Practical types of ‘rebalancing’ actions
4.1 Introduction
In the previous section, the different stances that authorities and agencies take to
‘rebalancing’ issues were discussed. Against such a background, this section sets out
the range, type and reach of ‘rebalancing’ actions that the literature review and
international case studies have yielded, both in the UK and abroad. The emphasis of the
section is on providing a description of the breadth of activity and is a precursor to a more
reflective discussion as to ‘what works’ (or does not) in the next section.
The presentation of material in this section is assisted by a typology of interventions,
which has been specifically developed for this research.
4.2 Headline observations on the population of ‘rebalancing’ actions
There has been a rich variety of policies, specific interventions and complementary
packages and programmes that have been implemented over the years in the UK and
abroad to address issues of sectoral and/or spatial imbalance, even though most were
not described as ‘rebalancing interventions’ at the time they were introduced. These
actions range from broad reach, generic activities, for example those pursued by the
RDAs (BIS, 2009a), to more specifically targeted interventions such as tightly-focused
accelerator or mentoring initiatives for young entrepreneurs or firms with international
potential (NESTA, 2010). The entry points for intervention and the role of the state also
differ, from the direct role of the public sector in creating jobs in lagging regions through
to activities where employers take a direct and leading role in addressing barriers to the
skills of their own workers.
Not only is the range of types of action significant, but the timescales and geographical scales for interventions are also highly varied. Some actions adopt a long-term
approach. For example, in Germany the key emphasis of the governance of intervention
has been on a medium-term funding arrangement of five to 10 years; in Finland,
education to enhance technological change has been the focus of government since the
1960s and 1970s; and long-term planning horizons of up to 40 years exist in Korea and
elsewhere in Asia. Other interventions are shorter-term such as City Challenge Teams
which operated for around five years across the UK in the 1990s, and more recently the
Regional Growth Fund which will provide funding over the next three year period to aid
public to private sector ‘rebalancing’.

Rebalancing the economy sectorally and spatially: An evidence review
39
4.3 Approaches to ‘rebalancing’ over time
The approaches taken to address sectoral and spatial imbalances have also evolved over time. For example, sector policies in the 1960s and 1970s (in the UK and
elsewhere in Europe) tended to focus on industrial activism, selective interventions for
specific sectors (such as aerospace, shipbuilding and automotives in the UK), ‘picking
winners’, and investment subsidies, especially to attract Foreign Direct Investment (FDI).
In terms of spatial ‘rebalancing’, until around the 1980s, many governments across the
EU heavily targeted aid at regions designated as ‘problem’ or ‘lagging’ areas11
However, programme-based and governance-focused approaches are now becoming
mainstreamed in spatial policy, with measures to promote the conditions for growth and
competitiveness of domestic firms through a combination of hard and soft measures to
improve enterprise, innovation, education and training, and to encourage networks and
clustering. The focus is increasingly on enabling the private sector to drive growth, and
encouraging growth based on regional assets (linked to the concept of endogenous
growth). This is emerging strongly in current UK policy, for example through the Regional
Growth Fund, expansion of apprenticeships and The Work Programme, and proposals to
expand University Technical Colleges through partnerships between universities,
colleges and businesses. According to the OECD (ibid), these types of policies have also
become increasingly favoured in other countries such as France, the Netherlands,
Sweden, Finland and Korea.
. This
often involved offering subsidies and state aid to compensate firms for the locational
disadvantages of such regions, and/or to help areas that had suffered from economic
shocks, such as industrial decline (OECD, 2010d).
There has also been a move towards place-based approaches to intervention, especially
within the EU (Barca, 2009) that are sensitive to the peculiarities of places and their
regions (with knock on implications for multi-governance and multi-sectoral approaches)
and interventions that are better adapted to the requirements of different regions (OECD,
2010d). Examples of such approaches include Øresund Science Region, Centres of
Expertise in Finland, clusters in Germany and growth poles in France.
11 Although targeted aid at ‘problem’ or’ lagging’ areas remain significant in some countries such as Germany and Italy according to the OECD, 2010d.
Rebalancing the economy sectorally and spatially: An evidence review
40
4.4 Relevant policy areas
The literature demonstrates how the actions implemented to address ‘rebalancing’ cover an extremely broad spread of policy areas, including human capital, skills and education, transport and infrastructure, enterprise and business development, innovation and R&D, and regulation. In terms of infrastructure policy, ‘rebalancing’
interventions include investments in strategic transport infrastructure, R&D facilities and
other physical innovation infrastructures such as science parks and industrial complexes.
Interventions also cover business enterprise and growth policy, which are designed to
encourage business development in specific sectors/places or across all areas, such as
the UK’s Enterprise Investment Scheme and Early Growth Funds, the Phoenix Fund and
the Coalfields Programme. Innovation activities include the development of ‘innovation
clusters’ (e.g. the Peaks approach in the Netherlands), encouraging collaboration
between Higher Education Institutions (HEIs) and businesses (e.g. Centres of Expertise
in Finland) and innovation funds to encourage innovation in specific sectors (e.g.
Germany’s Hydrogen and Fuel Cell Technology Innovation Programme).
Skills and employment initiatives are an important part of the ‘intervention mix’ and
very much a critical part of the long-term ‘rebalancing’ process. There have been a range
of skills and employment-specific interventions in the UK and abroad that have been
designed to address:
• the causes of imbalance, for example to raise skills levels, as part of a broader
programme to create the conditions for growth to address spatial imbalances;
• the consequences of imbalance, for example the public sector as a job-creator
in areas where the private sector under-performs;
• the consequences of the sectoral ‘rebalancing’ process, for example, in helping
people to adapt to changing skills or occupational requirements as the sectoral
structure of an economy changes.
Overlaying this, there is a role for human capital policy in ensuring that cultures and
attitudes are supportive of and enable ‘rebalancing’. Where they are not, experience
suggests this can be a major barrier to the ‘rebalancing’ process as evidenced by the
case of Daegu in Korea where attempts to create a new design cluster failed because the
indigenous textile base did not buy into the policy approach.
Even within the sectoral ‘rebalancing’ field, there is a wide array of different types of skills
interventions that have been adopted to manage sectoral skills transfer issues, either in
response to the collapse of specific sectors or in anticipation of changing sectoral needs.
Examples highlighted in the literature include the RECHAR and RESIDER European
programmes design to assist in the restructuring of areas previously dependent upon coal

Rebalancing the economy sectorally and spatially: An evidence review
41
mining and steel industries, through to more proactive Labour Market Boards in Sweden
which have pursued policies to train people in the appropriate skills for the types of jobs
that are forecast to grow.
The role of the public sector in managing the skills transfer process either in sectoral or
spatial ‘rebalancing’ varies. ‘Lighter touch’ government interventions include establishing
employer-led sector skills councils in New Zealand and the Netherlands, and flexicurity
policies in Finland and Sweden, and indirect interventions that aid labour market mobility
in Germany. The public sector has also played a role in creating conditions for growth in
the delivery of hard and soft infrastructures, such as the provision of educational
infrastructures (e.g. building new schools and universities in Germany), skills and training
support through programmes (such as Train to Gain in the UK) and encouraging ‘social
dialogue’ between employers and employees. There is also evidence amongst the
literature reviewed for this study of where the public sector has played a more
interventionist role in skills and employment issues, for example by relocating
government functions to lagging areas in order to create jobs (e.g. Sweden, Korea).
Furthermore, the way in which the skills transfer issue has been managed has also
evolved over time. For example, Martin and Thelen (2007) argue that training institutions
that served industrial sectors do not function as well for services, and that labour tends to
be more fragmented in service sectors making collective agreements on career and
development paths much more fragmented (with implications that follow in terms of the
types of interventions that are suitable).
4.5 Towards an organising typology for ‘rebalancing’ interventions
In order to organise and characterise the wide variety of interventions that our literature
review and international case studies have identified, a simple and pragmatic typology
has been developed to help frame the analysis. It provides a way of characterising the
interventions to facilitate the identification of systematic differences between the
interventions over time in different contexts, and in terms of their relative success and
failure, which is the focus of the next section of the report. The typology potentially also
provides a useful organising framework to help understand the types of interventions, and combinations of interventions, that might be most effective to address sectoral and/or spatial ‘rebalancing’ challenges.
The literature itself contains a wider variety of frameworks for categorising state
interventions, and these have been drawn on to develop the typology set out below, in
particular, the report by Barca to the European Commission (2009). This work contrasts
two paradigms of policy intervention:

Rebalancing the economy sectorally and spatially: An evidence review
42
• a ‘traditional spatial paradigm’, where the government seeks to deal with
market failures and equity issues as the rationale for intervention, aiming to
compensate for locational disadvantage, intervening through existing
administrative units with spatially focused support, and placing an emphasis on
advice, subsidies and state aids.
• the ‘new spatial paradigm’, which places less emphasis on market failures
and more on public goods and internalising externalities as the rationale,
aiming to tap underutilised potential across functional economic areas, and
focusing interventions on creating conditions (especially human and hard
capital) for growth.
The typology developed for this study seeks to incorporate Barca’s ‘new paradigm’, and
seeks to move it on through two other pieces of work. The first piece of work is by
McKinsey (2010c) which differentiates between the role of the state, from setting the
ground rules and promoting the efficient operation of the market, through to creating
conditions for growth and tilting the playing field or playing the role of principal actor. The
second is a framework developed by Campagni (2008), which reflects the degree to
which outcomes of an intervention are tangible and intangible, set against the extent of
competition and rivalry involved in the intervention.
The resulting typology is presented in Table 4.1 below. Its development is explained
more fully in Appendix A to this Main Report. The typology has two axes:
• The vertical axis sets out the extent and nature of the state’s interventions in ‘rebalancing’, and depends on the perceived rationale for intervention (and
associated views on the role of the public sector), drawing on the work
developed by McKinsey (2010c). As we move down this axis, the intensity of
state intervention increases.
• The horizontal axis follows Campagni (2008) in distinguishing between the
tangible outcomes from an intervention (i.e. the development of land,
buildings, plant and machinery) and the intangible (i.e. outcomes which are
less concrete, more subtle and relate to changing behaviour and practices
rather than the development of physical assets), and those which are a
combination of the two (e.g. the generation of intellectual property as
embedded in prototypes).

Rebalancing the economy sectorally and spatially: An evidence review
43
Table 4.1 An organising typology for ‘rebalancing’ interventions Tangible Mixed Intangible
Setting the ground rules and direction/
promoting the efficient operation of
the market
1 2 3
Building enablers and conditions for growth 4 5 6
Tilting the playing field, playing the role
of principal actor/agent
7 8 9
To organise the myriad ‘rebalancing’ actions and interventions identified in the literature
and the international case studies, we have sought to map them onto the nine cells of the
organising typology above. In practice some interventions neatly fit into one cell of the
typology, whereas others (especially place-based interventions) tend to cut across more
than one cell. Some interventions are specifically designed to address sectoral or spatial
‘rebalancing’ challenges, but many address both.
Table 4.2 below summarises the types of actions employed in the UK and abroad to
address sectoral and/or spatial ‘rebalancing’, allocated to each cell of the typology.
Actions to address sectoral and spatial ‘rebalancing’ issues appear in all cells given their
wide ranging natures. It is important to note that many of the actions that aim to create
the conditions for growth are complementary and in practice are delivered in parallel
(such as infrastructure, innovation, skills and networking), particularly where the rationale
for intervention is based around raising the competitiveness of all places. More details on
specific interventions are available in the full case studies in the Volume 2 report and
supplementary tables in Appendix A. Section 5 provides more details on what has
worked to date (or not).

Rebalancing the economy sectorally and spatially: An evidence review
44
Table 4.2: Summary of types of actions employed to address sectoral and/or spatial ‘rebalancing’
Description Rationale for action
Cell 1 - Setting the ground rules – tangible actions
Under this type of action, the primary purpose of government intervention is to encourage the
private sector to invest. However, it is important to note that such interventions are often part of a
wider package of actions where the public sector is involved in investing in infrastructure and/or
developing skills and innovation. Examples include:
• Øresund Science Region is highlighted in the literature as an example of where the
government has set the ‘ground rules’ but where the private sector has taken a leading role.
This is a trans-national technology-focused collaboration between southern Sweden and
eastern Denmark across an area with significant autonomy. The overarching objective at a
national level was to achieve economic growth in all regions by creating well-functioning and
sustainable labour market regions, with a good level of services in all parts of the country.
• Enterprise Zones also fall under this category, which were introduced in the UK in the 1980s,
with the purpose of encouraging investment in tangible assets in specific areas by removing
or reducing taxes in local areas to stimulate property development and industrial/commercial
investment. Enterprise Zones have also been implemented in the US and France (Centre for
Cities, 2011), and have recently been re-introduced in the UK as part of the government’s
Plan for Growth (HM Treasury and BIS, 2011).
• In East Asia, the focus of government has been on regional innovation policy and regional
innovation networks, and regional clusters of Small and Medium Sized Enterprises (SMEs) in
• These types of interventions are
designed to remove barriers faced by
businesses and address any market
failures to enable businesses to thrive.
By encouraging the private sector to
invest (for example in R&D), it is
envisaged that this would generate
positive and significant spillover effects.
• The rationale for intervention also relates
to capitalising on underutilised regional
strengths and assets.

Rebalancing the economy sectorally and spatially: An evidence review
45
Description Rationale for action technology intensive sectors (which generally falls under the ‘building enablers’ cells) but
since the 1980s the major actor and lead in R&D and innovation has shifted from government
to private firms (World Bank, 2009)
These types of actions tend to address both spatial and sectoral ‘rebalancing’.
Cell 2 - Setting the ground rules – mixed actions
Government (or a government-funded body) plays a co-ordination role to aid ‘rebalancing’, for example in:
• Creating the ground rules to facilitate co-operation and interaction between firms and other
organisations, e.g. HEIs and businesses. Finland’s Centres of Expertise are an example of
this (although there are other supportive policies that feature under ‘building
enablers/conditions for growth’ that run alongside the government’s co-ordination role here),
as are some of England’s RDA science, R&D and innovation interventions that focused
specifically on encouraging collaboration between HEIs and businesses and the
commercialisation of HEI Intellectual Property (IP).
• Creating the ground rules for active labour market policies, for example, by giving local or
regional entities (both public and private) the capacity to influence skills and training policies.
An example where the private sector plays an important role in ‘rebalancing’ is the
Netherlands’ employer-led vocational education system, where employers identify skills
required for their sector and communicates this directly to Knowledge Centres, which
subsequently inform regional colleges who in turn develop their curriculum directly in
response to employer needs. In return, employers provide workplace-based training. New
Zealand has also implemented strongly employer-led Sector Skills Councils, which have been
There has been some shift in the rationale and
policy context underpinning these types of
interventions from one largely characterised by a
distributional rationale, i.e. providing aid to
historically peripheral and weaker regions, to one
focussed on economic growth in all places and
addressing the excessive reliance of economies
on one sector. The interventions are also linked
to market failures, especially in terms of co-
ordination and information failures between HEIs
and business.

Rebalancing the economy sectorally and spatially: An evidence review
46
Description Rationale for action directly in control of substantial funding for training. The UK also has networks of business-
led Sector Skills Councils and National Skills Academies.
• Establishing fiscal policies and regulation that stimulate growth in particular areas (e.g.
growth areas, lagging regions), sectors (e.g. manufacturing) or outcomes (e.g. reduction in
carbon footprints and the more efficient use of energy).
Some of these actions focus on sectoral ‘rebalancing’ (such as Sector Skills Councils or employer-
led vocational systems), whereas others have a predominantly spatial focus (e.g. fiscal policies to
stimulate growth in lagging areas, or actions to facilitate co-operation between partners in specific
places).
Cell 3 – Setting the ground rules – intangible actions
Intangible actions that set the ground rules and promote the efficient operation of the market include
the following types of interventions:
• Creation of legal/policy frameworks to facilitate labour market adjustments and designing
employment and housing benefits to promote mobility. Interventions to encourage labour
market mobility also include changing land planning rules (i.e. liberalising land use) and
reducing real estate transaction costs.
• Establishment of a business-friendly regulatory environment that facilitates economic growth
and competitiveness, including protection of IP rights, financial regulation, exchange rates
and the promotion of exports/production of tradable goods, taxation.
• Provision of clear and efficient governance mechanisms to enable horizontal co-operation
The overarching rationales for these types of
interventions focus on overcoming market
failures (which mean the cost of doing business
in some areas is too high) and bottlenecks to
enable the efficient operation of
markets/allocation of resources, encouraging
long-term investment by business via a
favourable business environment (for example,
through competitive taxes) and generally
enabling businesses to be competitive.

Rebalancing the economy sectorally and spatially: An evidence review
47
Description Rationale for action between ministries, support for regional or local institutions and promotion of pan-regional
coordination.
Some actions are focused on ‘rebalancing’ growth spatially (such as the Northern Way), but others
focus on sectoral ‘rebalancing’ to aid economic growth (wherever growth might be).
Cell 4 – Enablers and conditions for growth – tangible actions
The most prominent tangible actions to create conditions for growth are as follows:
• Transport actions, which includes investing in new transport infrastructures (including those to
allow for mobility of people and those in lagging areas to connect to high performing places)
and addressing congestion costs.
• Educational infrastructures, R&D facilities and other physical innovation infrastructures.
• Business and science parks, industrial complexes.
• Housing, including social housing provision and building housing to enable labour market
mobility or spatial ‘rebalancing’.
• Bringing land back into use, for example through remediation, and public realm investments.
These types of actions tend to simultaneously address both spatial and sectoral ‘rebalancing’.
The overarching rationales for these actions are:
to improve competitiveness and utilisation of
resources; to address the failure of the market to
invest (due to risk/high sunk costs, public goods
arguments); the need to reduce negative
externalities (e.g. congestion) or the opportunity
to realise positive externalities (e.g. reducing
journey times so more time for productive work).
Whether these actions are implemented in a
country depends on whether governments
accept the agglomeration argument, and
therefore invest in growth areas to enable
agglomeration alongside investment elsewhere,
or support equity imperatives, and therefore
focus investment in lagging or peripheral regions
(e.g. Denmark, Finland, Norway, and France).

Rebalancing the economy sectorally and spatially: An evidence review
48
Description Rationale for action Cell 5 – Enablers and conditions for growth – mixed actions
Mixed actions to create the conditions for growth have addressed both sectoral and spatial
‘rebalancing’ (and many are designed to address both). These include:
• Science, R&D and innovation actions, which have re-invigorated the idea of clusters and
growth poles and according to the OECD (2010d) have been expected to endogenously
develop their hinterland in places such as France, Hungary, Portugal.
• Raising skills and the provision of education and training to ensure the availability of high
quality human capital, which include actions to integrate those outside of the labour market
and lifelong learning.
• Business development and enterprise support, aiming to stimulate business creation and
business growth.
Clusters and ‘the regional innovation approach’ incorporate all three types of actions above, and are
strongly linked to building co-operation and sharing knowledge between firms, especially SMEs (see
below for intangible actions to enable growth). Many of the current UK government’s proposals fall
under this type of ‘rebalancing’ action, which include measures for better business support and
improving access to diverse sources of finance, the establishment of growth hubs in cooperation with
technology and innovation centres, and investment in skills apprenticeships.
These types of actions address both spatial and sectoral ‘rebalancing’.
These types of actions focus on promoting
growth in all regions (rather than redistributing
growth), reducing disparities in economic activity,
exploiting the potential of endogenous assets
and local networks, encouraging spillover effects
from innovation, and removing obstacles to
growth, adaptability and competitiveness.
Market failure arguments also come into play, for
example, in the business support and the under-
investment by employers in skills (such as
information failures, externalities, and credit
constraints/risk aversion), as do equity rationales
(for example, enhancing social inclusion by
improving skills).

Rebalancing the economy sectorally and spatially: An evidence review
49
Description Rationale for action Cell 6- Enablers and conditions for growth – intangible actions
Intangible actions designed to build the conditions for growth tend to focus on developing co-
operative networks and building relationships and social capital at different spatial scales (including
the local, city-regional, cluster, (pan) regional, national and international level). These actions often
work hand-in-hand with the more tangible interventions to enable growth (such as business
development, skills and innovation) and represent a step towards an approach where actors co-
operate in order to rebalance an economy without public sector intervention. Such actions focus
on four areas:
• strong networking and collaboration between firms in the industry and with public research
institutes both nationally and internationally.
• mentoring networks, particularly business networks.
• local capacity building.
• social dialogue, which refers to the co-operation between employers and employees on
restructuring in order to anticipate and manage change, identify future skills needs, influence
national/regional policy that is aimed at the development of that sector (EC, 2008).
These types of actions tend to simultaneously address both spatial and sectoral ‘rebalancing’.
Again, the rationale for these actions focuses on
exploiting the potential of endogenous assets
and local networks, encouraging spillover effects
and positive externalities resulting from
networking. Market failures also form part of the
argument, and the need to address information
failures and co-ordination failures.
Cell 7 – Tilting the playing field – tangible actions
At the interventionist end of the spectrum, there are examples where the public sector has sought
directly to support specific sectors, businesses and spatial areas. This was particularly prominent
between the 1960s and 1980s in the UK, but also features in more recent policy in the UK (to a
lesser extent) and in countries such as Korea, Finland, Sweden, Italy and Germany. Broadly,
The main rationale for such interventions is one
of overcoming market failure, particularly the
private sector’s reluctance to invest where there
is little information on which to base a risk

Rebalancing the economy sectorally and spatially: An evidence review
50
Description Rationale for action tangible interventions where the public sector plays the role of principal actor can be seen in the
following types of interventions:
• Direct subsidies and incentives to firms to influence industrial location decisions (of FDI and
inward investment) and compensate temporarily for location disadvantages in lagging regions
and areas of high unemployment.
• Creating place-specific, state-subsidised bodies to stimulate urban development and
revitalise derelict areas.
• Relocation of government functions, HEI functions or government owned industries to lagging
regions, mainly to create employment and utilise skills, but also to stimulate supply
chain/procurement opportunities.
The majority of these interventions are designed to address sectoral and spatial ‘rebalancing’ issues
simultaneously, and are supported by other interventions that fall into other cells in the typology (such
as ‘picking winners’, discussed below).
assessment (e.g. the degree of site
contamination) and where there are opportunities
for positive externalities and spillover effects of
encouraging inward investment or relocating
government functions. As noted above under the
neoclassical growth approach, addressing these
market failures is designed to lead to
convergence in regional performance.
Cell 8 – Tilting the playing field – mixed actions
‘Mixed’ actions where the public sector tilt the playing field to encourage ‘rebalancing’ generally cover
two types of intervention:
• Programmes designed to encourage the restructuring of economies away from specific
sectors, such as the EU’s RECHAR, RESIDER, KONVER, RETEX programmes. They
therefore cut across both sectoral and spatial ‘rebalancing’ objectives.
• Industrial policies that favour particular sectors to aid the ‘rebalancing’ process, ranging from
The rationale for the interventions to restructure
economies centre around the far-reaching
impacts of restructuring ‘which people,
companies, sectors and regions should not be
left to deal with alone’ (EU, 2008).
The rationale for targeting specific sectors with
support is to develop specific sectors regarded to

Rebalancing the economy sectorally and spatially: An evidence review
51
Description Rationale for action encouraging investment and innovation in specific sectors (such as green technology) to
explicitly picking of winning sectors and businesses, which was prominent in the UK in the
1960s and 1970s. These tend to be sector (rather than place) specific interventions,
designed to assist with sectoral ‘rebalancing’.
These actions focus on sectoral, spatial or both types of ‘rebalancing’.
be of strategic importance or to unlock
competitive advantage in global markets.
According to BIS (2010d), competing in overseas
markets will attract inward investment and lead to
further growth. Equity arguments are also at play
since governments are under pressure to reduce
unemployment and stimulate growth, so
‘supporting chosen industries is seen a way of
saving jobs and helping local firms fight foreign
competitors’ (The Economist, 2010b).
Cell 9 – Tilting the playing field – intangible actions
The protection or promotion of specific sectors (through subsidies and/or trade protection) has been
adopted in the UK and elsewhere historically, either defensively (as in the case of some traditional
sectors such as coal and steel) or to promote infant industries (as in the case of some renewable
energy sources).
A recent example is provided by the UK’s creative industries sector. Here, the sector was protected
in order to allow UK production to survive, and the film industry in particular has depended heavily on
selective interventions to protect a share of the home market for UK based film production. Different
policy instruments have been used over time to protect the sector, including quotas, levies and tax
credits. There are examples of protectionism elsewhere, although many of these policies are thought
to distort the market and reduce competitiveness (The Economist, 2010b).
These actions focus predominantly on sectoral ‘rebalancing’.
The main rationale for the interventions to
promote infant industries is that new growth
sectors may struggle to compete, but once
established could provide a source of competitive
advantage and therefore help to rebalance the
economy sectorally, and in terms of its trade
balance.

Rebalancing the economy sectorally and spatially: An evidence review
52
4.6 Summary
The typology of interventions was designed to provide a useful framework to help policy
makers better understand the different types of interventions that might be implemented to
address the ‘rebalancing’ challenge, with varying degrees of state intervention and a range
of tangible and intangible outcomes resulting from the intervention.
The literature demonstrates a wide variety of policies, interventions and actions that have
been implemented in the UK and abroad to address sectoral and spatial ‘rebalancing’
challenges, although most were not described as ‘rebalancing’ interventions at the time they
were introduced. Interventions cover an extremely broad spread of policy areas, including
human capital, skills and education, transport and infrastructure, enterprise and business
development, innovation and R&D, and regulation, which demonstrates how addressing
‘rebalancing’ challenges requires the contribution of interventions that cut across many
policy areas. Furthermore, in practice, many of the interventions are part of ‘packages’ that
cut across more than one policy area and more than one cell in the typology.
Skills and employment initiatives have played an important part of the intervention mix to
address the causes and consequences of imbalance, and enable the ‘rebalancing’ process.
The evidence points to a range of examples in the UK and abroad of interventions that have
been implemented to help manage the ‘rebalancing’ process, where the level of state
intervention varies from setting the playing field by establishing employer-led skills bodies,
through to creating the conditions for growth via hard and soft education and training
infrastructures, and more interventionist approaches where governments have re-located
functions to lagging areas to create employment opportunities.
There also appears to be a shift over time in the UK from interventions primarily focused on
generating tangible assets (bottom left of the typology matrix) towards interventions that
build enablers, create conditions for growth and set the ground rules, especially those which
are less tangible, such as encouraging networks and setting broad national strategies (top
right of the typology matrix). The government’s recently published Plan for Growth (HM
Treasury and BIS, 2011) also demonstrates this shift, with proposed interventions that focus
on enabling growth (for example, through mixed interventions such as the Regional Growth
Fund, ensuring finance for business start-ups and growth, and supporting apprenticeships)
and setting the ground rules, for example, through re-introducing Enterprise Zones,
simplifying tax systems and removing regulatory barriers to growth, creating incentives such
as the Green Investment Bank, and reforming the land planning system.

Rebalancing the economy sectorally and spatially: An evidence review
53
5 Towards a ‘rebalanced’ future – what works?
5.1 Introduction
The previous section set out a typology to organise the variety of interventions yielded by the
literature review and case studies, and outlined the types of actions that feature in each of
the typology’s cells. This section will now use the typology to focus on what has worked (well
or otherwise) in terms of ‘rebalancing’ actions and, as a consequence, what the lessons are
for skills and other policy makers. This section seeks to provide practical and applied
suggestions by looking at the actions allocated to each of the typology’s cells (noting that
many interventions cut across more than one cell) using the following policy areas as
thematic filters:
• Human capital and labour markets.
• Business creation and development.
• Science, innovation and knowledge.
• Land use, transport and infrastructure.
• Fiscal and regulatory regimes.
• Governance.
It is important to stress that these six policy themes are not in any way definitive. Rather,
they are lenses through which to examine the types of interventions in order to build up a
broader picture of what works in terms of ‘rebalancing’ the economy. Each of these policy
themes is presented sequentially below, with a summary of learning messages at the end of
each theme, and the section overall.
5.2 Human capital and labour markets
Human capital and labour market interventions identified in the literature feature in six of the
nine cells of the typology. Exemplar interventions in each of these cells are identified in
Table 5.1 below (although in practice, some interventions span two or more cells). At the
outset a significant finding to note is the relative lack of emphasis in the policy literature
reviewed on the role of employers in enhancing utilisation and development of skills to boost
productivity (with the exception of work by the UK Commission on high performance
working).

Rebalancing the economy sectorally and spatially: An evidence review
54
1 2 34 5 67 8 9
1 2 34 5 67 8 9
Table 5.1 Summary of human capital and labour market actions Tangible Mixed Intangible
Setting the ground rules and direction/
promoting the efficient operation
of the market
Active labour market policies. e.g. Netherlands’ employer led vocational education system.
Sector Skills Councils; New Zealand’s employer led sector skills councils; sector skills councils in the UK.
Legal and policy frameworks to facilitate labour market adjustments e.g. flexicurity in Sweden and Finland; reducing real estate transaction costs; designing employment and housing benefits to promote mobility in Germany and Sweden
Labour market deregulation
Building enablers and conditions for
growth
Investment in educational infrastructures e.g. new secondary schools and universities in Germany
English Coalfields programme’s human capital elements
Skills, education and training to ensure high quality human capital e.g. for the UK’s creative and pharmaceutical industries; European Globalisation Adjustment Fund, European Cohesion Policy; Labour Market Boards in Sweden; Malaysia’s Human Resources Fund; Train to Gain and Skills Accounts in the UK; Action Zones in peripheral North Norway, linking skills, business environment, infrastructure and skills offers
Actions to integrate unemployed people e.g. ESF
Lifelong learning, part of the Lisbon Strategy
Social dialogue between employers/employees
Tilting the playing field, playing the role of principal
actor/agent
Relocation of government owned industries e.g. construction of new Air Force base in north of Sweden
Creation of public sector jobs in lagging regions e.g. UK
In the following paragraphs, we take each row of the typology matrix, and then each cell
within it to highlight some of the types of interventions that have worked well (or less well)
and why in achieving sectoral/spatial ‘rebalancing’.
5.2.1 Human capital: Setting the ground rules
Cell 2 includes a broad mix of actions relating to the labour
market, for instance by giving regional, local or sectoral bodies
the capacity to influence skills and learning policies, both
spatially and sectorally. The networks of business-led Sector
Skills Councils and National Skills Academies represent such
interventions. The recent Plan for Growth outlined how Cogent, one of the UK Sector Skills
2 1 3
4 5 6
7 8 9

Rebalancing the economy sectorally and spatially: An evidence review
55
Councils, will support the supply of skilled labour to the life sciences sector (a key growth
sector) by bringing employers and educators together to help ensure that biology training
meets employer needs (HM Treasury and BIS, 2011). More generally, sectoral, regional and
local bodies have been active in policies designed to:
• develop workforce skills to increase the supply of skilled workers, for instance by
focusing on demand led training programmes and skills for particular sectors;
• match people to jobs to improve the alignment between the supply and demand of
workers and by helping marginalised workers to access opportunities for skills
development, particularly in the context of sectoral ‘rebalancing’;
• support the development of educational infrastructure, often as part of a funding
package to help an existing educational institution to develop facilities. These can
assist sectoral ‘rebalancing’, or spatial ‘rebalancing’ to improve the economic
potential of resources. Analyses of the impact of RDA spending (Price
Waterhouse Coopers, 2009) indicate that interventions supporting development of
the educational infrastructure and hybrid people/skills interventions have amongst
the highest returns, with returns to regional GVA (allowing for persistence effects)
of £5.2 and £4.1, respectively, for every £1 spent.
Cell 3 comprises the design of ground rules with intangible outcomes. These can help create
a legal and policy framework that facilitates labour market adjustments. Flexicurity is an
example. It is an attempt to combine flexibility with security in the labour market. It marks a
change in emphasis from job security to employment security through comprehensive
lifelong learning strategies, effective active labour market policies, and adequate and
sustainable social security systems. It is important in that it places emphasis on skills
development to sustain and progress in employment, rather than focusing exclusively on
getting into employment. An example of flexicurity policy from Sweden is the Career
Transitions Agreements, designed to support workers made redundant by providing
counselling, careers guidance, education and training. Survey evidence suggests that these
have benefitted the individuals concerned. Likewise, in Finland, a similar concept of ‘change
security’ was adopted which provided redundant workers with financial security during the
period of transition from one job or sector to another and which aimed to increase
cooperation between employers, employees and public authorities to support a quick return
to work for those made redundant through sectoral restructuring (European Commission,
2008b).
Another important example of setting the ground rules relates to the treatment of benefits
and mobility. There is widespread use of active labour market policies to tackle
unemployment and imposition of requirements for geographical mobility (in terms of
commuting to work) on unemployment benefit receipt. With the introduction of the Work

Rebalancing the economy sectorally and spatially: An evidence review
56
1 2 34 5 67 8 9
1 2 34 5 67 8 9
Programme and of ‘payment by results’, it will be in the interests of providers to develop
relationships with local partners in skills and employment, transport, health and other policy
domains, to help those out of the labour market to access employment. Evidence on the
extent to which active labour market policies and benefit requirements encourage
geographical mobility is mixed; although with job search and mobility support (through
transport initiatives) mobility can be enhanced (OECD, 2005a). There have also been
policies to encourage longer distance mobility through residential mobility. In the UK,
attempts have been made to make it easier for tenants in the social rented sector to move by
centralising information about housing and job opportunities, but these tend to have been
small scale and are hampered by pressures on housing stock in more economically buoyant
areas (ibid).
5.2.2 Human capital: Building enablers
Cell 4 includes tangible enablers such as measures
targeting lagging regions, including coalfields and older
industrial areas, in order to restructure the economy by
building on accumulated competencies and promoting new
business growth. It also includes approaches encompassing
a general approach of investment in more and better human
capital, adapted to business needs. In the UK, one example of the former has been the
English Coalfields programme, which focused primarily on physical renewal, but which also
involved human capital development and the promotion of enterprise and business growth,
underpinned with venture capital. These human capital elements became more prominent,
once their neglect was recognised. Likewise, investing in human capital has been part of a
package of interventions in the Ruhr in Germany which also included support for research-
and technology-based businesses and tax subsidies to promote inward investment. There,
the investment in human capital has been substantial, including investment in new
secondary schools and a fundamental expansion of the higher education system with a
focus on applied sciences (i.e. STEM subjects). The evidence suggests that these
interventions have played a role in providing skills to facilitate restructuring towards higher
value added sectors.
In the UK, the current government budget outlines several interventions for skill
enhancement. Of particular relevance to this theme is the expansion of University Technical
Colleges, with the aim of creating 24 new institutions by 2014. Together with the continued
growth of the UK Higher Education System that has been witnessed in recent years, this is
likely to have a significant impact on the provision of STEM skills. The key issue is
guaranteeing that the implementation of these policies links and integrates the supply of
skills with the demand from businesses.

Rebalancing the economy sectorally and spatially: An evidence review
57
Cell 5 encompasses a raft of actions, including programmes for low skilled people,
investments in lifelong learning, programmes to enhance intermediate skills, programmes to
maximise the contribution of highly skilled people, and measures to enhance the flexibility of
labour markets. The rationale for improving skills is to enhance social inclusion and to
achieve sustainable growth and consistent competitive advantage (BIS, 2010c). Lifelong
learning is recognised as key to helping economies deal with restructuring and respond to
change and there is growing emphasis on making good information, advice and guidance a
component of lifelong learning.
The European Social Fund is a key vehicle for helping those groups with poor skills and
there is evidence that it has helped boost employment rates for older people and for women
(European Commission, 2008b). At the intermediate skills level, there is increased funding in
England for apprenticeships, with the aim of increasing numbers and reshaping provision to
focus more on the technician level. In Germany, the long-established ‘dual system’ helps
provide a strong base of technicians, through the integration of theoretical learning in
vocational schools and practical workplace training. As a consequence, young people
develop workplace skills before they leave school, with the state and the private sector
involved. It aims to enable people to draw on theory and experience to solve a range of
actual problems, and to develop the abilities to think analytically and creatively. The design
and delivery of the policy are supported by social partners and employers and the system is
well-resourced combining public and private funding (Hoeckel and Schwartz, 2010). The
international case studies point to success in active policies to train people in the appropriate
skills for the types of jobs forecast to grow. This is the case in Sweden, where Labour Market
Boards, which are funded nationally but which operate regionally and locally, pursue such
policies.
Cell 6 comprises intangible enablers, which are policies concerned with strategic
coordination between different organisations (including both public and private) to achieve
better skills provision, enhanced labour mobility and higher employment rates. The evidence
suggests that skills development and investment in training need to be shared between
employers, individuals and government. Evidence from the European Commission (2008b)
indicates that social dialogue (i.e. consultation between employers and employees, and
between social partners representing management and labour) can yield successful
outcomes when faced with challenges of sectoral restructuring. There are examples from
diverse sectors, including electricity, shipbuilding, the furniture industry, civil aviation, hotels
and catering, of social partners identifying best practice and developing tools to anticipate
and manage change. Underlining the importance of partnership-based approaches in
dealing with sectoral restructuring (including in specific geographical areas), the European
Commission (ibid, p.121) concludes that ‘multi-stakeholder approaches are essential in
finding effective and sustainable solutions to economic change’.

Rebalancing the economy sectorally and spatially: An evidence review
58
1 2 34 5 67 8 9
1 2 34 5 67 8 9
Interventions to promote high-performance working practices are also of relevance here.
They highlight the important role played by employers, and more specifically the leadership
of managers, in job design, promoting ongoing learning and development, and establishing
performance management systems and effective communication processes which promote
better quality employment, with positive outcomes for overall productivity, business
performance and employee well-being. The evidence suggests that the most meaningful
‘bundles’ of factors are context-specific (UK Commission, 2010).
An evaluation of options to stimulate employer investment in skills (UK Commission, 2010)
suggests that levies can be successful but careful design is key to this, and individual rights
to take-up training often have relatively low rates of take up. There is limited evidence on
public procurement policies on training overall, although such policies may enable targeting
on those groups least likely to receive training. Improving dialogue on training between
employer and employee is, as noted above, identified as a potentially powerful means of
stimulating investment and take-up of training, especially when incorporated as part of
institutionalised collective bargaining. There is also positive evidence on the role of inter-
employer networks, with the proviso that these need to have considerable support from
employers operating in similar sectors and/or with similar interests.
Assessment of the training system in the UK in terms of lessons from international
comparators (Ashton, 2006) indicates that the UK is hampered by complexity and change in
systems of funding and qualification frameworks.
5.2.3 Human capital: Tilting the playing field
Cell 7 encompasses interventions such as the creation of
public sector jobs to help struggling areas and to reduce the
jobs deficit (which is contrary to ‘rebalancing’ from the public
to the private sector), and policies to respond to demand
from growth sectors.
Historically, one policy response to help disadvantaged people into work and to address jobs
deficits in particular regions and cities has been to create public sector jobs. This includes
for example, the large relocation of government agencies in South Korea from Seoul to a
lagging region, although it is too soon to evaluate the effectiveness of this policy. A similar
process occurred in the UK, as demonstrated by the fact that most growth in peripheral
regions in the 21st century was achieved through public sector growth. Most of these jobs
were not necessarily moved from London and the South East, but were instead created to
deliver new services. Nevertheless considering the pattern of wealth creation in the UK, this
process can be characterised as a form of regional redistribution of resources. It had a
positive impact in stopping regional divergence, but according to the current government

Rebalancing the economy sectorally and spatially: An evidence review
59
projections it was unsustainable in the long-term. Also, while this has increased employment
in parts of the north of England, private sector employment creation has continued to favour
London and southern England (Centre for Cities, 2010c).
There are differences between governments in the extent to which they see a valid role for
the public sector in providing employment to disadvantaged people to address spatial
imbalances in employment. For instance, the Future Jobs Fund which paid employers to
create six-month jobs, especially for young people or those in unemployment ‘hot spots’, has
been discontinued by the coalition government, and more emphasis has been placed on
investing in apprenticeships. The Plan for Growth published in March 2011 also made
provision for additional work experience placements for young people. As noted above (in
Cell 5), there has been greater success internationally where Labour Market Boards have
focused attention on sectors where employment opportunities are likely to grow.
5.2.4 Human capital: Key lessons
• Skills play an important role in wider packages of interventions, and in facilitating sectoral
‘rebalancing’.
• Interventions supporting the development of educational infrastructure and hybrid
people/skills interventions have provided some of the highest returns of any human
capital and skills interventions.
• The expansion of higher education, including specific targeting of applied sciences in
some regions, has provided skills of value to sectoral ‘rebalancing’.
• Intermediary organisations can play a useful role in working with employers and
education and training providers to ensure employers’ demands for skills are identified
and met, particularly during the process of sectoral ‘rebalancing’ but also in specific
places to ensure that capacity of local economies is maximised.
• Skills development and investment in training to enable the ‘rebalancing’ process need to
be shared between employers, individuals and government. Multi-stakeholder
approaches can help achieve better skills provision.
• A flexicurity approach, emphasising lifelong learning and skills for sustaining and
progressing in work, can yield positive outcomes for individuals, and create sectoral and
spatial resilience.
• Lifelong learning is important in helping to deal with sectoral ‘rebalancing’ and in
responding to sectoral change. Information, advice and guidance (IAG) is a crucial
component of lifelong learning.

Rebalancing the economy sectorally and spatially: An evidence review
60
• There is international evidence for the success of labour market policies in helping to
deal with restructuring and in responding to change, both sectorally and spatially,
especially when targeted at sectors with prospects for growth. This suggests that
anticipating skills change is crucial.
• Public sector expansion in lagging regions can provide an important contribution to
employment growth in these areas, but there can be doubts about its sustainability.
5.3 Business creation and development
Business creation and the development of existing businesses has been a core focus of
economic policy for many decades. It is, therefore, the most represented theme amongst the
population of interventions mapped onto the typology, with identified interventions occurring
in almost every cell, as illustrated below.
Table 5.2 Summary of business creation and development actions Tangible Mixed Intangible
Setting the ground rules and direction/
promoting the efficient operation
of the market
Enterprise zones Øresund science
region Private sector
leadership and investment to support ‘rebalancing’ (e.g. by investing in R&D in East Asia)
Building enablers and conditions for
growth
Business and science parks, industrial complexes (discussed under the Science theme below)
England’s Coalfields programme
Business development and enterprise support to stimulate business creation and growth e.g. Manufacturing Advisory Services (MAS) in the UK, ‘Seedcamp’ in the UK; the UK’s Enterprise Investment Scheme, Enterprise Management Scheme and Early Growth Funds; Coalfields programme; the Phoenix Fund
Strong networking and collaboration between firms in the industry and with public research institutes nationally and internationally.
Mentoring networks (discussed under the Science theme below)
1 2 3
4 5 6

Rebalancing the economy sectorally and spatially: An evidence review
61
1 2 34 5 67 8 9
1 2 34 5 67 8 9
Tangible Mixed Intangible
Tilting the playing field, playing the role of principal
actor/agent
Direct subsidies and incentives to firms to influence industrial locations of FDI and inward investment e.g. UK policy in the 1960s and 1970s, Regional Selective Assistance (RSA) and Selective Finance for Inequalities in England (SFIE)
Launch investment e.g. to attract/determine the location of investments in the UK civil aerospace industry
Relocation of government functions e.g. relocation of Government functions in Korea
Government procurement i.e. Government as the ‘smart purchaser’
Programmes designed to encourage restructuring of economies away from specific sectors e.g. the EU’s RECHAR, RESIDER, KONVER, RETEX programmes
Picking winners e.g. identification of ‘spearhead’ sectors in the northern provinces of the Netherlands; targeted support for specific sectors such as renewable energies or carbon efficient automobiles in Germany; innovation in green goods and services in Munich and Korea; manufacturing in France; telecoms in Sweden and Finland; UK policy in the 1960s and 1970s
Trade protectionism from global competition, e.g. in the UK film sector
5.3.1 Business: Setting the ground rules
In Cell 1 are tangible measures that seek to set the
ground rules and direct or promote the efficient operation
of the market. The key UK intervention identified here is
the creation of Enterprise Zones, which were introduced
in the UK in the 1980s and offered a package of tax
benefits and other incentives to firms that located within
these areas. The policy has both a sectoral and a spatial emphasis, since it is aimed at
manufacturing activities in specific parts of the country. Drawing on previous evaluation
evidence, these policies had a limited impact on business creation for a number of reasons
(Sissons and Brown, 2011): a high proportion of the jobs created (perhaps as high as 80%)
were displaced from other areas and so the policies therefore did not deliver a net increase
in employment; and their impacts tended to be shorter-term (around three years) and did
little to change the long term economic prospects of the depressed areas in which they were
located. They were also relatively expensive policies with a high cost attached to the new
jobs created. They did, however, stimulate rapid investment from the private sector in the
short term, but as argued by Sissons and Brown (2011), this momentum needs to be
sustained. The reintroduction of Enterprise Zones by the current government will need to
make sure that benefits are secured and sustainable, and care is taken to avoid some of the
costs associated with this approach in the past.
7 8 9

Rebalancing the economy sectorally and spatially: An evidence review
62
1 2 34 5 67 8 9
1 2 34 5 67 8 9
5.3.2 Business: Building enablers
In Cell 4, there are a range of tangible spatially-directed
measures targeting both lagging regions (such as old
industrial or coal mining areas) and growth centres. The
objective of the first is to restructure the local/regional
economy by building on accumulated competencies and
promoting new business growth, and to bring underutilised
resources back into productive use. These measures are, as a result, expected to have an
impact on spatial ‘rebalancing’. Nevertheless, success in this area is difficult, since the
evidence from the UK and the case studies shows that the reversal of long-term regional
decline is seldom achieved (Tomaney, 2009). The construction of science and business
parks is covered under the Science theme below.
The mixed interventions in Cell 5 emphasise the interaction between tangible investments
and the intangible/soft links that emerge from agglomeration economies, and that generate
knowledge externalities. Regarding the soft links, there are two distinct types.
• The spatial or sectoral intervention usually supported by regional or local
authorities, such as the creation of platforms for business support. As our case
studies in Germany (Munich region), Netherlands (Northern Provinces) or Sweden
(Øresund region) demonstrate, these are most effective when delivered on a long-
term basis by relatively autonomous administrations (see the Governance theme
below for an example). They also benefit from an enabling social environment
based on trust and opportunities for collaboration. However trust and collaboration
tend to emerge from distinct sources: in countries such as Italy for instance, family
and community are key institutions sustaining social cohesion, whereas in
Northern Europe these soft links are mostly maintained through a close interaction
between government, labour and the private sector (Hancké et al., 2007). This
indicates that any successful policy at this level must take into consideration the
social structures and cultures underpinning relations between individuals and
organisations in any given context.

Rebalancing the economy sectorally and spatially: An evidence review
63
1 2 34 5 67 8 9
1 2 34 5 67 8 9
• The second type is more generic, and forms part of a general trend towards better
government and governance to support economic growth. Mixed interventions of
this type also include the use of regional growth funds and other forms of financial
aid to support targeted investments. The effectiveness of regional funds is a
complicated issue. Using the example of cohesion policies, Barca (2009) argues
that there are mixed results regarding the positive or negative impacts of regional
transfers. Some programmes have been more effective than others but, in
general, the trends towards growing inter-regional disparities have not been
reversed. As a result, it is difficult to argue that they have a transformational
impact, even if they might help ease the economic transformation of lagging
regions.
Cell 6 contains intangible interventions for business creation and development, such as
investments in cluster renewal and development, better business support, promotion of
trade, addressing capital market failures and investments in skills. According to Barca (2009)
econometric analyses of EU cohesion policies suggest that in the past there was an
excessive investment in infrastructure, with ambiguous results. However the same studies
indicate that investment in human capital has generally led to positive results, which
highlights the importance and effectiveness of such policies. Barca (2009) also argued that
success in any public policy is dependent on the existence and quality of strategic planning,
the policy and institutional context, and the existence of administrative capacity. These
factors are dependent on the adoption of medium-to-long term strategies, and they require
an investment in the skills of the policy makers themselves, who must capable of learning
from previous experience and of fine tuning policy instruments.
5.3.3 Business: Tilting the playing field
The interventions in Cell 7 include targeted support for
specific economic activities (e.g. renewable energies,
carbon efficient automobiles), and the promotion of a
de-concentration of Universities. Similar to interventions
discussed earlier, success in such interventions
depends on the existence of a whole package for
investment, including a governance structure that remains stable over time, opportunities for
testing and learning from past experience, and a combination of different types of investment
(such as physical infrastructure, human capital or business support). Failure of such
interventions tends to arise from decisions that are not supported by careful planning and a
refinement of policy instruments. They also tend to fail when the political decision to invest is
not backed up by a sufficient amount of resources, as was the case with the failed attempts
at decentralisation highlighted in the South Korea case study.

Rebalancing the economy sectorally and spatially: An evidence review
64
Cell 7 also includes interventions designed to influence business location decisions through
incentives and subsidies, and the shifting of resources towards particular sectors, regions or
outcomes. These interventions further subdivide:
• The first type of intervention (influencing business locations) is similar to the
creation of Enterprise Zones and therefore the challenges are the same: firms
might be convinced to locate in new areas, but this does not automatically lead to
a net creation of jobs. A different approach is represented by the attraction of FDI.
This type of intervention can be very successful in prompting economic growth,
generating technology and knowledge effects and increasing the number of jobs
available, as seen by the cases of both China and Ireland over the last few
decades. They do, however, have two potential drawbacks (Pike et al., 2006). The
first is that countries or regions receiving the investment may become branch-plant
economies, where the existence of big production units does not generate high
levels of spillover effects that trickle down to the local economy because their
value chains are located elsewhere. A second problem is the lack of control over
location decisions which means that, in the long-term, local, regional or national
authorities have very little capacity to prevent the closure of these production units.
Northern Ireland, Wales and Scotland have suffered from these effects over the
past decade.
• The second type of intervention, shifting of resources, can be very successful if it
allows current growth centres (both on a regional and sectoral level) to achieve
their full potential. This was the case in most of our case studies, where pivotal
government investments have led to the growth of particular sectors and places
where the country had a comparative advantage. It can however fail to achieve its
proposed outcomes, particularly when government authorities attempt to create
economic sectors in places where there are no accumulated skills or expertise
(Tomaney, 2009).
Cell 8 includes interventions that explicitly ‘pick winners’, which has demonstrated varying
levels of success in different countries and contexts. For example, Germany has placed an
emphasis on shipbuilding, despite market forces, through very extensive dock investment,
but this generally appears to have been unsuccessful; as have attempts to create a new
fashion and design cluster in Daegu in Korea, which fell foul of the indigenous textile base
(Hassink, 2005). Picking winners also featured strongly in UK policy in the 1970s, through
selective industrial policies. However, these have been heavily criticised for providing
disproportionate support to sunset rather than sunrise industries a tendency to ‘cushion
sleepy management’ and reflecting a lack of political will to ‘eliminate productive inefficiency’
(BIS, 2010m). By contrast, East Asia has a long and focused emphasis on strategic
industries, successfully managing over time the shift from labour- to technology-intensive

Rebalancing the economy sectorally and spatially: An evidence review
65
industries, with export-orientated industrialisation a major element of the strategy (Huang
and Bocchi, 2009). Also, Sweden and Finland have effectively ‘picked winners’ in focusing
on the telecoms sector, which has generally been a success although there is now concern,
especially in Finland, around over-dependence on the sector, and specifically on one firm,
Nokia. What is clear from this evidence is that these types of interventions must build on
pre-existing strengths rather than transplanting sectors to areas where there is no previous
history of related activities, and having the local community (employees and businesses) on
board is critical.
Finally, Cell 9 refers to protectionism, and gives the example of the UK’s film industry. These
types of measures also exist for other sectors, such as agriculture, although they did not
feature in the literature reviewed. It is usually acknowledged by economists that protection
from competition has negative long-term impacts in productivity growth and innovation, even
if in the short-term it might facilitate growth. The British film industry has been successful at
achieving growth by attracting foreign investment in the short-term, but the question is
whether the industry can survive in the long-term, particularly if it suffers more intense
competition from other markets.
Table 5.3 ‘Rebalancing’ the economy: The case of the UK’s offshore wind sector
‘Rebalancing’ the economy: The case of the UK’s offshore wind sector
The UK’s offshore wind sector potentially provides an example of sectoral (and potentially spatial) ‘rebalancing’ in
practice, and is relevant to the Business and Human Capital themes in this section of the report.
The Context
The UK economy is de-carbonising. The recent electricity market reform consultation paper highlighted that
around 30 per cent of the UK’s electricity needs to be provided by renewable sources by 2020 (principally
onshore and offshore wind), up from seven per cent currently. With project roll-out beginning to gather pace, the
UK currently represents the largest global market for offshore wind. Offshore wind in the UK is currently a
nascent sector, and in international terms ‘a follower with increasing momentum’. Between 2007 and 2010, the
sector quadrupled in employment terms to just over 3,000 jobs.
The Opportunity
There are a range of employment forecasts in the current literature, with more due to be published later in 2011.
Based on the existing forecasts, the upper end of employment growth forecasts are for around 40,000 jobs in the
five stages of the supply chain for offshore wind by 2020. A significant amount of this growth is expected to take
place from around 2015 onwards. A large proportion of jobs are expected to be in higher level occupations
requiring degree level qualifications. In addition, a significant number of technicians (NQF Level 3) will be
required. The location of jobs is dependent on a number of factors, including access to facilities such as ports
and the location of existing industry suited to supplying offshore wind. Indicative mapping suggests the potential
for clusters of activity in the following areas: the east coast of Scotland, the Glasgow-Edinburgh belt, the North of
England (notably around Leeds, Sheffield, Manchester, Hull and Humber, Cumbria and parts of the North East),
the Midlands (especially around Birmingham) and the South West and South Wales. The sector offers some
potential for employment of former public sector workers from the armed forces (where state action as an
employer may be desirable) as well as contributing to net trade balance as a result of import substitution and the

Rebalancing the economy sectorally and spatially: An evidence review
66
potential for export to international markets.
The enablers of ‘rebalancing’
A key issue highlighted is the need for government to give certainty in the regulatory and pricing framework
affecting offshore wind, as this will feed into improved confidence in terms of investments, workforce planning
and skills. The state could also intervene through investment in physical and softer infrastructure, such as ports
and other facilities (including for research and development) and supply chain initiatives. This will help to give
confidence to the sector, highlight the opportunities to UK businesses and attract foreign investment. The skills
requirements are characterised as using ‘old skills’ in ‘new ways’. As a result, a major emphasis will be on
recruiting individuals from other sectors (in particular from manufacturing and engineering) and topping up
existing skills, including addressing specific offshore skill requirements such as survival training.
Issues
There are major challenges in terms of uncertainty and timing for the recruitment, training and induction of new
staff. High levels of absorption of recruits are expected to be needed from around 2015. There is also an issue in
terms of how many apprentices employers might need and the long lead times of training these. Government can
help address this through introducing more flexible criteria in relation to apprenticeships. Coordinated action
sectorally and spatially has been identified as being important to ensuring opportunities are capitalised on.
However, whilst the devolved administrations are in a position to do this and have already made progress, the
state of flux in sub-national arrangements in England presents a challenge. There is a risk that if the UK
workforce cannot respond to up-skilling requirements and/or cannot be attracted to the sector in sufficient
numbers, then opportunities will be lost to international (in particular European) labour and businesses.
Source: Dickinson et al. (2011)
5.3.4 Business: Key lessons
• Reversal of long term regional and sectoral economic decline is difficult to achieve.
It is most likely to happen through long-term, contextual policy making, delivered
by organisations that have built capacity over time.
• Investments in growth centres can achieve very positive results and may
contribute to greater sectoral balance, even if they do not solve spatial disparities.
• Investment in human capital and skills is a key component of the ‘rebalancing’
process.
• Good results in skills development are achieved when there is an alignment
between skills provision and demand from business at the local and sectoral
levels. This area of intervention also benefits from the existence of a varied set of
institutions delivering different types of qualifications.

Rebalancing the economy sectorally and spatially: An evidence review
67
1 2 34 5 67 8 9
1 2 34 5 67 8 9
5.4 Science, innovation and knowledge
Science and innovation have been at the forefront of national and regional policy making in
recent years. For that reason, a large number of interventions have been identified from the
study’s literature, covering seven of the nine cells of the typology.
Table 5.4 Summary of science, innovation and knowledge actions Tangible Mixed Intangible
Setting the ground rules and direction/
promoting the efficient operation
of the market
Øresund science region
Facilitation of co-operation and interaction between firms and other organisations. e.g. England’s RDA science, R&D and innovation interventions to increase collaboration between HEIs and businesses; Finland’s Centres of Expertise, Øresund science region
Business friendly regulatory environments e.g. protection of IP rights (e.g. in the UK Life Sciences sector), financial regulation, taxation and exchange rates
Øresund science region, Finland’s Centres of Expertise
Building enablers and conditions for
growth
Investment in R&D facilities and other physical innovation infrastructures e.g. RDA programmes
Science and Business Parks, industrial complexes e.g. in Belgium, Netherlands, East Asia, Korea, and via Regional Development Agency activity in England
Science, R&D and innovation support e.g. Korea; Swedish innovation policies such as VINNOVA, the Swedish Research Council
Clusters and growth poles, including regional innovation clusters e.g. Peaks approach in Netherlands, Centres of Expertise in Finland; competitive poles in France; cluster approach in Germany; Sweden’s NUTEK Agency, Øresund
Mentoring networks, particularly business networks e.g. Business Volunteer Mentoring Association (part of the Phoenix Fund), Creative Business Network in the UK, Danish Gazelles, Finland’s Centres of Expertise, Øresund science region
Tilting the playing field, playing the role of principal
actor/agent
Relocation of HEI functions e.g. deconcentration of HEIs in Sweden and Finland
Targeted support for specific sectors
5.4.1 Science and innovation: Setting the ground rules
Cell 1 includes tangible measures that set the ground rules,
and that direct or promote the efficient operation of the
market. The creation of the Øresund Science Region, a
collaboration between southern Sweden and eastern
Denmark fits into this category. This type of measure is
concerned with creating the conditions that allow
organisations, both public and private, to generate an environment conducive to science and
innovation collaboration. It is a tangible example because there is a specific outcome (the
1 2 3
4 5 6
7 8 9

Rebalancing the economy sectorally and spatially: An evidence review
68
creation of a cross-national region) that is likely to have an impact on the area’s economic
performance.
In Cell 2 are mixed interventions that create the ground rules that facilitate cooperation and
interaction between firms and other organisations such as the creation of regional policy
networks involving businesses, higher education institutions and research organisations.
Regional innovation systems fall into this category, including those created by the RDAs in
the UK. These are classified as mixed interventions because they include the creation of
organisations but also an investment in intangible factors such as networking and the
generation of knowledge externalities.
Cell 3 refers to the intangible elements of these interventions. Their broad objective is the
promotion of networking and closer interactions between firms, HE and other organisations
with the aim of stimulating innovation. The Cell includes some of the interventions mentioned
in Cells 1 and 2, plus the creation of Centres of Expertise in Finland, but the focus here is on
the intangible elements of science and innovation: networks and collaboration between
private, semi-private and public organisations. As demonstrated by the fact that the Øresund
Science Region is in all three Cells of this row, a regional or local policy that aims to
stimulate science and innovation is likely to comprise tangible, mixed and intangible
elements. The reason for this is that research has shown that innovation and science benefit
from the existence of organisations with the capacity to produce and exploit knowledge, but
also from the existence of a social environment conducive to the exchange of ideas,
entrepreneurialism and experimentation (OECD, 2010f).
Two examples of regional innovation systems that span the ‘Setting the Ground Rules’ row
are the Øresund Science Region mentioned above and the Assembly of the Northern
Netherlands Provinces. Both interventions have had a positive effect on their respective local
economies and, in particular, integrated regional innovation systems have played an
important role in developing the capacity to support entrepreneurialism and business
development (Lundquist and Trippl 2009; SNN, 2011; Dühr, 2009). Examples such as these
have also been central in EU policy for spatial development. The pre-requisites for their
success were that:
• they exist within a national governance system where local and regional
authorities have considerable autonomy from central government. Therefore there
are ample opportunities for developing an effective bottom-up approach that
responds in a flexible way to the needs of the local economic, scientific and
research base;

Rebalancing the economy sectorally and spatially: An evidence review
69
1 2 34 5 67 8 9
1 2 34 5 67 8 9
• they build on accumulated competencies in their economic and research base. In
both these regions, there is a strong presence of higher education institutions
which can be geared towards serving the needs of businesses and can be
integrated into public-private networks;
• they are the product of medium to long-term political relationships that are allowed
to remain over time as a result of their autonomy from central government. The
Øresund Science Region is more than 10 years old, and grew out of political
networks that date back to the early 1990s. The Northern Assembly was created in
1994 and has already passed through several stages of planning and
implementation that allowed it to accumulate capacity and learn from previous
experiences.
Both these examples have influenced the thinking behind the creation of RDAs in the UK.
However, the latter differed in important ways:
• RDAs did not emerge organically out of local and regional links and were instead
designed largely from above;
• RDAs remained dependent on state funding and decision making, and therefore
lacked the autonomy to pursue fully their own agendas;
• RDAs would have likely benefited from a more stable and long term existence,
since it would have allowed them to build capacity and improve their policy
delivery.
5.4.2 Science and innovation: Building enablers
In Cell 4, the actions comprise targeted investments in
physical infrastructures such as industrial estates and
science parks, investments in human capital and support for
research and technology-based businesses, and the use of
both fiscal transfers (such as the European structural funds)
and tax breaks to promote business investment. The recent
announcement by the UK government in the Plan for Growth that it would increase tax
credits for SME investment in R&D fits into this category. The objective of these measures
is to create the conditions that allow firms and other organisations to generate and absorb
the knowledge necessary to innovate and grow.
Research cited by the OECD (2010f) indicates that investment in physical infrastructure
tends to have a limited impact on innovation capacity. For example, the proliferation of
science and technology parks in the 1990s and early 2000s in developed and developing
countries has tended to deliver results below expectations. This was particularly the case

Rebalancing the economy sectorally and spatially: An evidence review
70
when the new technology-based sectors did not have any relation with previous local
economic specialisations. Investment in research organisations has also often delivered
limited results, particularly when these are not integrated into a wider governance structure
that can create the links between these organisations and the private sector. In some cases,
these organisations end up serving the economic base elsewhere, where there are
entrepreneurs and businesses with the skills to take advantage of the knowledge being
generated.
Another important dimension of these interventions is the provision of tax credits and other
incentives to stimulate R&D. The evidence reviewed identified limits to the effectiveness of
R&D tax incentives. Firstly, R&D tax credits do not recognise the importance of ‘hidden
innovation’ in several sectors that contribute significantly to employment in the UK (NESTA,
2007). ‘Hidden innovation’ occurs when new ideas are explored and implemented as part of
the productive process, and not as a separate activity that can be measured as R&D
investment. Therefore, a significant amount of firms are likely to find it difficult to claim tax
credits, even if they are innovative. A second problem is that tax credits do not deal with the
lack of capacity in less competitive SMEs, and instead privilege those that are already
innovative. They therefore do not deal with long-term issues of increasing innovation
capacity, even if in the short-term they might have a significant impact in supporting some
SMEs.
Cell 5 refers to mixed interventions that combine both an investment in physical or
organisation infrastructures, but also the more intangible elements of human capital and
R&D potential. It includes actions such as creating world-class research departments at elite
universities, the provision of highly trained workers, an increase or protection of R&D
spending, and the identification of sectors or regions with growth potential that should
receive targeted support. An example of such an intervention is the recently announced
Technology and Innovation Centres in high value manufacturing that is part of the UK
government’s current growth strategy. Its objective is to integrate the activities of a number
of existing research centres in Rotherham, Coventry, Strathclyde, Sedgefield, Redcar and
Bristol.
Cell 5 also includes science and innovation clusters or growth poles. An example here is the
concept of Centres of Expertise in Finland, which are summarised in the Table below.
Please turn to Volume 2 for the full case study report.

Rebalancing the economy sectorally and spatially: An evidence review
71
Table 5.5 Centres of Expertise in Finland
Centres of Expertise in Finland
Following an economic crisis and major fiscal consolidation in the early 1990s, Finland made a strong recovery
and successfully ‘rebalanced’ the economy at a macro level (led by growth in exports) and saw rapid growth in
the share of GVA generated by manufacturing, specifically, high value added, innovative manufacturing.
Alongside the fiscal consolidation of the early 1990s, the Finnish government introduced supplementary long-
term measures to improve the competitiveness of Finland’s economy. This included creating Centres of
Expertise geared towards technological innovation and specialist clusters, which built upon Finland’s strong
engineering inheritance. The Centres of Expertise aimed to enhance collaboration between businesses,
research institutes, universities and polytechnics and other partners, encourage SME growth and the
commercialisation of innovation, and increase exports. Centres of Expertise were self-selected regional hubs,
received relatively small funding incentives from central government (despite the Centres having high status in
Finland’s innovation policy) and employed science parks as operational platforms. The Centres generated
public-private project collaborations, which focused on the diversification and renewal of the industrial structure
within each region.
Evaluation evidence of the eight Centres of Expertise active between 1994 and 1998 shows that the programme
resulted in the creation of around 8,000 new jobs, contributed to the renewal of 7,000 jobs, established 290 new
high-technology enterprises and attracted 130 businesses to areas in which Centre of Expertise are located
(Hamalainen et al., 2000). Following expansion of the programme to smaller regional centres between 1999 and
2005, the Centres of Expertise created an additional 12,000 knowledge intensive jobs, safeguarded a further
23,000 jobs, set up 1,100 new high technology businesses and trained 90,000 people (IRE, 2011). The
programme has encouraged businesses to export, enabled close working between educational institutions and
business (to ensure skills met the changing needs of businesses) and successfully directed limited resources
towards exploiting regional strengths and opportunities. Creating a decentralised network of HEIs in regions and
having skilled resources available has been an important factor in the success of Centres of Expertise.
Other key factors that contributed to the success of ‘rebalancing’ the economy following the economic crisis were
as follows:
• Policies were consistent over the long-term and focused on creating the conditions for
growth at the micro level.
• High educational achievement, especially in subjects that enabled technological change,
had been a priority for three decades preceding the economy’s ‘rebalancing’ period.
Consequently, Finland had a strong platform to build on.
• During fiscal consolidation, the government protected spend on R&D and tertiary
education, introduced polytechnics and apprenticeships, and quickly increased the number
of HEI places in response to skills shortages in growing sectors.
Cell 6 refers to the intangible elements that allow regions to grow. The emphasis of these
interventions is similar to those in Cell 3 and is about investing in the immaterial elements
that constitute an innovation system, such as networking and inter-firm linkages. However, in
this case policies aim to stimulate these elements in a proactive fashion, rather than just

Rebalancing the economy sectorally and spatially: An evidence review
72
1 2 34 5 67 8 9
1 2 34 5 67 8 9
creating the conditions that allow them to develop of their own right. Interventions include:
the introduction of new economic actors into an innovation system (for example research
institutes or design schools); active promotion of innovation networks and platforms, that
might include public organisations, in order to generate the positive externalities that are
typical in clusters; and promoting the creation of centres of expertise, that lead to regional
specialisations, innovation networks, and interactions between research organisations and
businesses.
Investments targeting human capital and soft infrastructures in the context of science,
innovation and knowledge, have had some positive results, although their impact has varied
from context to context. According to the OECD (2010f), skills development is the most
effective form of investment, although as with science parks, it needs to be integrated with
the grain of the local economic base. Skills development also benefits from the existence of
a varied set of institutions offering both highly qualified scientists and technical courses for
medium skilled workers.
The focus on the soft features of innovation and science (networks, entrepreneurialism) has
had more mixed results (Tödtling and Trippl, 2005). These policies are less effective when
they are implemented without the appropriate resources to fund and build capacity in the
different organisations that comprise the local or regional innovation system. Such networks
can also be appropriated by rent-seekers who are mostly concerned with maintaining their
position within the economic or political system, which might lead to a situation of lock-in and
negative path dependency. These policies have also underdelivered when they have not
paid sufficient attention to local specificities and have instead attempted to implement one-
size-fits-all approaches. This was the case with the Silicon-Valley replicas that emerged in
many parts of the world (Hospers, 2006) and tried to imitate the socio-economic conditions
that underpinned the success of the Californian region. As Tödtling and Trippl (2005)
explain, different regions will manifest different strengths and shortcomings, depending on
their economic structure, urban-rural composition, and governance traditions. In order to
intervene at this level it is, therefore, necessary to identify the specific conditions that sustain
or hinder networking and entrepreneurship in particular places.
5.4.3 Science and innovation: Tilting the playing field
In Cell 7 are the tangible interventions that tilt the playing
field, or where the government plays the role of the principal
agent. Interventions include targeted support for specific
areas (such as renewable energies or carbon efficient
automobiles), and more specific actions like the
deconcentration of university clusters. Interventions such as

Rebalancing the economy sectorally and spatially: An evidence review
73
these are created to steer the progress of innovation and science production in a certain
direction that might have sectoral and/or regional impacts. For example, in Finland the
deconcentration of universities has played an important role in providing the skills and
knowledge required at the Centres of Expertise as noted above. The objective has been to
generate critical mass in different parts of the country that can help businesses and labour
markets in generating the necessary skills and R&D to support innovation, and has generally
been successful.
5.4.4 Science and innovation: Key lessons
• Developing innovation capacity in lagging regions requires a long-term strategy of
reconversion of traditional sectors and developing new areas of activity in related
activities.
• The existence of strong research centres (namely higher education institutions) is
a crucial asset, although their skill provision and research output might need to be
realigned along the needs of the local/regional economy.
• Integrated approaches are the most effective. They involve the private and public
sectors, the provision of appropriate skills, the creation of platforms for
collaboration between businesses and other organisations, and a stable political
environment that can sustain the long-term delivery of infrastructure and other
public goods.
5.5 Land use, transport and infrastructure
There is a relatively long history of land use, transport and infrastructure interventions having
been used either on their own, or in tandem with other interventions, to stimulate growth and
to help address spatial and/or sectoral ‘rebalancing’. In general, the study’s literature
suggests that there has been a general shift away from a narrow focus primarily on large
scale physical infrastructure interventions towards interventions that are broader in scope,
incorporating socio-economic elements relating to education and employment. Moreover,
there has been a trend towards more targeted interventions, aimed at fostering regional
potential and capabilities (OECD, 2010d). In part, at least, this direction of change reflects
the experience of success and failure of different interventions.
Land use, transportation and infrastructure actions are found in four of the nine cells of the
typology.

Rebalancing the economy sectorally and spatially: An evidence review
74
1 2 34 5 67 8 9
1 2 34 5 67 8 9
Table 5.6 Summary of Land Use, Transport and Infrastructure actions Tangible Mixed Intangible Setting the ground rules and direction/
promoting the efficient operation
of the market
Liberalising planning rules to enable agglomeration or promoting house-building to create new centres of growth (e.g. Korea)
Building enablers and conditions for
growth
Transport actions e.g. investment in strategic transport infrastructures in Germany; investment in transport to promote economic development in large countries such as Canada, Australia, Nordic Countries; addressing congestion in London
Business and science parks, industrial complexes e.g. in Belgium, Netherlands, East Asia, Korea, and via RDA activity in England
Housing construction, including social housing provision in Germany
Land remediation, public realm investments e.g. RDA investments to enable redevelopment, English Coalfields programme
Tilting the playing field, playing the role of principal
actor/agent
Creating place-specific, state subsidised bodies to stimulate urban development and revitalise derelict areas e.g. Urban Development Corporations (1980s-1990s); City Challenge programme (1990s)
Planning decisions that favour specific sectors/places for physical development
5.5.1 Infrastructure: Setting the ground rules
As shown in Cell 3, actions here include land use and
planning regulations to encourage investment in specific
areas. In the UK, Industrial Development Certificates
represented a negative control over the location of
industry, designed to shift industrial expansion away from
congested areas in London to Development Areas by
requiring anyone wishing to construct an industrial building over a certain size to obtain an
Industrial Development Certificate from the Board of Trade before doing so. Evidence
suggests that if it came to a choice between granting a certificate for expansion in London
and such expansion not taking place, then a Certificate would be granted. Moreover,
loopholes in the legislation allowed the conversion of smaller structures into a single factory,
and conversion of land use types from non-industrial to industrial. While Industrial
1 2 3
4 5 6
7 8 9

Rebalancing the economy sectorally and spatially: An evidence review
75
1 2 34 5 67 8 9
1 2 34 5 67 8 9
Development Certificate policy had some effect upon the location of industry, it had limited
impact on spatial imbalances in unemployment rates (Miernyk, 1969). This suggests that
policies exerting negative control in some areas are limited in the extent to which they
necessarily encourage growth elsewhere.
The planning system has been identified as a focus of attention in the March 2011 Plan for
Growth (HM Treasury and BIS, 2011). The aim of coalition government initiatives is to reform
the planning system so that it promotes economic growth and jobs. Amongst the measures
announced is a new presumption in favour of sustainable development, and a streamlining
of planning guidelines and consents to speed up the decision-making process. The idea is to
increase available land supply, for both commercial and residential uses.
Cell 3 also includes providing appropriate infrastructures to sustain growth centres. It is
salient to note that some of the most successful interventions have been those providing
appropriate infrastructures to sustain growth centres and support them in achieving
agglomeration advantages for business (BIS, 2010m). At the local level, the UK government
is keen to create a framework of incentives for local authorities to help them to deliver
sustainable economic development through additional investment locally by introducing new
borrowing powers to enable them to take a more active role.
5.5.2 Infrastructure: Building enablers
Cell 4 includes interventions concerned with identifying
strategic areas for infrastructure investment. In Korea, for
example, the first territorial plan (1972-1981) was concerned
with the construction of key basic infrastructure and
improvements to the living environment. The second
territorial plan (1981-1992) included construction and
expansion of the transport infrastructure. Investment in high speed rail, the mass transit
system, maritime and aviation infrastructure stimulated economic development. It was only
later that the emphasis shifted towards quality of life and enhancing competitiveness (see
Korea case study for further details). Korea is exceptional in terms of its speed of
industrialisation and change, but a similar trend away from a specific focus on physical
infrastructure towards a more general concern with social improvements is evident at a more
localised scale in city planning in the Netherlands and Germany (Leuing and Swaffield,
2008).
Cell 4 also includes investment in physical infrastructure as a tool to enable further growth
and address congestion in growth areas and/or to develop poorer regions. Reference is
made in Cell 3 actions to the importance of infrastructure to sustain growth. In the case of
London, investment in enhancing integration of the transport infrastructure so as to reduce

Rebalancing the economy sectorally and spatially: An evidence review
76
congestion (Centre for Cities, 2010c) and enhance the development of the city as a business
hub has been important in sustaining the agglomeration economies that are important for the
financial service sector (BIS, 2010m). This highlights the fact that infrastructure plays a key
role in supporting agglomeration. Plans for a second high speed railway in the UK (HS2 from
London to the Midlands and the north) is designed to enhance connectivity and so stimulate
economic development, while at regional and inter-regional scales investment announced in
March 2011 for rail projects such as a new train link between Manchester Piccadilly and
Victoria stations are designed to alleviate bottlenecks in the transport system and reduce
journey times.
There is a long history of investment in physical infrastructure in poorer regions, or regions
experiencing the demise of traditional sectors. In the Ruhr in Germany, there was huge
investment in physical infrastructure to provide foundations for sectoral restructuring away
from coal and steel. Crucial here, as in coalfields in the UK, was addressing physical
degradation of the landscape as a foundation for bringing land back into use and stimulating
regeneration, including the development of business parks, which helped in attracting and
growing alternative employment. In the case of the Ruhr, an added bonus has been the
opportunity to showcase the transformation that has been achieved as part of the Ruhr 2010
European Capital of Culture. In those parts of England which were also previously
dependent on coal and steel, there has been an emphasis on addressing physical
degradation and investment in infrastructure. Evidence from the RDA evaluation (Price
Waterhouse Coopers, 2009) indicates that relatively high returns from investment can be
expected from cross-cutting regeneration interventions including a physical infrastructure
component. Public realm interventions have lower returns on investment at the outset, but
are likely to build and so improve over time.
Cell 4 also encompasses investment in public services and accessibility, including
construction of housing. The experience of the Netherlands points to success in investing in
upgrading the physical environment, especially in relation to housing and transport. There
has been particular emphasis on matching labour market access to public transport and
infrastructure at city level (Leuing and Swaffield, 2008) so such interventions fit into Cell 5
(mixed interventions) of the typology as well. This suggests that investment in public
transport can help facilitate access to employment opportunities. At local level there is scope
for employers to work with the public employment service and transport providers to help
encourage worker mobility and enhance awareness of services available. In England outside
London, Merseytravel (in Merseyside) and Centro (in the metropolitan West Midlands) have
strong track records in this regard (PTEG, 2010).
Whilst transport matters in facilitating access to employment, the housing market also plays
an important role. Inter-regional house price differentials can discourage mobility for owner-

Rebalancing the economy sectorally and spatially: An evidence review
77
1 2 34 5 67 8 9
1 2 34 5 67 8 9
occupiers, and spatial mobility (except at the very local level) is limited amongst tenants in
the social rented sector. While attempts to centralise information about social housing and
job opportunities are helpful in fostering mobility, the shortage of housing in some areas is
an obstacle to mobility. Except in Germany, the tendency across most OECD countries has
been to neglect investment in social housing.
In Germany (in both the Ruhr and in Munich) targeted investments in strategic transport and
in science parks and higher education facilities have taken place alongside investments to
help foster innovation and particular sectors in human capital and innovation policy with
some success. This illustrates the value of intervention ‘packages’ across policy themes. As
noted elsewhere, strong governance structures at city region and state level have been
important here in setting the framework for such investments.
5.5.3 Infrastructure: Tilting the playing field
Cell 7 incorporates interventions concerned with stimulating
urban regeneration to revitalise derelict areas and
modernisation of transport systems. In general, there is
some similarity here with the policy initiatives outlined in
Cell 4. Urban Development Corporations are an example of
this type of intervention as part of the emphasis was on
enabling expansion of business into more modern premises, and in Sheffield and Tyne/Wear
there was some success in this regard. Likewise, City Challenge and the New Deal for
Communities sought to support the regeneration of disadvantaged areas through locally
devised and time limited plans. Improvements to the physical environment took place
alongside interventions to stimulate an enterprise culture. In the case of New Deal for
Communities, the evidence suggests that, among comparator areas, improvements to
housing and the physical environment are easier to achieve than improvements in education
(Batty et al., 2010).
Cell 8 includes planning decisions and actions that favour particular areas or sectors. The
Netherlands has been relatively successful in sustaining the key economic growth centres in
the centre of the country, such as Schipol airport and the port of Rotterdam, as investment is
explicitly favoured towards these areas in the spatial strategy (see the Netherlands case
study for further details). The UK renewable energy sector, and more specifically wind
energy, is also an example where green energy is prioritised. Please Table 5.3 for further
information on the UK offshore wind sector.

Rebalancing the economy sectorally and spatially: An evidence review
78
5.5.4 Infrastructure: Key lessons
• In some areas, investment in physical infrastructure is a necessary precursor to
sectoral ‘rebalancing’.
• In general, there are benefits from making investments in physical infrastructure to
support policy interventions in other domains (i.e. from broad policy approaches).
• Investment in public transport infrastructure can assist people in accessing
employment opportunities, so assisting both spatial and sectoral ‘rebalancing’.
• There have been successful interventions to sustain comparative advantage and
strategically important sectors in growth areas (i.e. supporting growth, but
countering sectoral and spatial ‘rebalancing’ objectives).
• It is easier to sustain existing growth through land use, transport and planning
interventions than to encourage balanced growth.
5.6 Fiscal and regulatory regimes
Interventions relating to fiscal and regulatory policy are sometimes features of mixed and
intangible interventions. Such interventions are less prominent than those relating to science
and innovation, business creation and development, and human capital and the labour
market. The interventions the literature and case studies have highlighted all fall under
‘promoting the efficient operation of the market’ row of the typology.

Rebalancing the economy sectorally and spatially: An evidence review
79
1 2 34 5 67 8 9
1 2 34 5 67 8 9
Table 5.7 Summary of Fiscal and Regulatory actions Tangible Mixed Intangible
Setting the ground rules and direction/
promoting the efficient operation
of the market
Fiscal transfer policies such as subsidy schemes that stimulate growth in particular sectors/places e.g. Green Investment Bank in the UK
Tax allowances for investment and R&D
Business friendly environments, such as National Insurance Tax Breaks for employers in lagging regions in the UK
Legal and policy frameworks to facilitate labour market adjustments e.g. flexicurity in Sweden and Finland; reducing real estate transaction costs; designing employment and housing benefits to promote mobility in Germany and Sweden
Labour market deregulation
Liberalising planning rules to enable agglomeration or promoting house-building to create new centres of growth (e.g. Korea)
Business friendly regulatory environments e.g. protection of IP rights (e.g.the UK Life Sciences sector), financial regulation, taxation and exchange rates
Currency depreciation to aide export growth (e.g. Finland, Korea)
Regulation such as carbon pricing
Building enablers and conditions for
growth
Tilting the playing field, playing the role of principal
actor/agent
5.6.1 Fiscal and regulatory: Setting the ground rules
Cell 2 includes a range of actions intended to promote the
efficient operation of the market. As well as macro policies
to achieve economic stability, measures here might be
designed to set up a business friendly regulatory
environment (such as National Insurance breaks for
employers in certain lagging regions), the adoption of fiscal
transfer policies that stimulate growth in particular regions or sectors, and more focused
fiscal policies and regulations which aim to achieve similar objectives or specific outcomes
(such as more efficient energy use). It has been argued on the basis of past experience that
a more sophisticated policy is needed than primarily macro adjustments (Claessens et al.,
2010). On the other hand, tax breaks and subsidies may complicate the tax system and
distort incentives (The Economist, 2010a). The implication is that clarity in the tax system,
and streamlined regulation, are desirable.
1 2 3
4 5 6
7 8 9

Rebalancing the economy sectorally and spatially: An evidence review
80
There is considerable interest internationally in fiscal incentives to promote investment in
certain sectors, such as manufacturing and green technology where the Green Investment
Bank announced in the March 2011 Budget is a case in point. As yet, there is no strong
evidence on the success of measures to promote green technology. Subsidy schemes can
build up huge liabilities if not carefully thought through, as in the case of a fixed price subsidy
scheme for solar energy in Spain where the government picked up the extra cost to
consumers and placed no cap on the number of plants that could claim subsidies (The
Economist, 2010b; Agosti and Padilla, 2010). More generally, there is a danger that subsidy
regimes focused on particular sectors can distort the market and reduce competitiveness of
those receiving subsidies (Frondel et al., 2010). A more effective approach is likely to involve
using pricing mechanisms (e.g. setting a carbon price) to stimulate demand for certain types
of products and services and then leaving individual products to emerge from the market
(The Economist, 2010b).
The objective in Cell 3 is to set up a regulatory environment that facilitates economic growth
and competitiveness, including the protection of intellectual property rights, financial
regulation, promotion of exports and reduced real estate transaction costs. In the UK, a well-
established intellectual property rights regime has been identified as giving the life sciences
a comparative advantage (BIS, 2010m). Similarly, the UK regulatory environment has been
identified as a contributory factor to the growth of financial services in London in the 1980s.
That said, the fact that there was already a strong agglomeration on which to build, and that
the more general policy environment favoured globalisation and deregulation were also
contributory.
These examples illustrate how a positive regulatory environment can allow already strong
sectors to flourish. In a more challenging context, the example of Finland above (see Table
5.5) shows how a strategy of fiscal consolidation in response to economic crisis in the mid
1990s, while protecting and increasing spending in R&D and maintaining spending on
tertiary education, has yielded long-term benefits for the economy by building and
developing fundamental strengths in the knowledge base. Supplementary measures to
improve the competitiveness of Finland’s economy involved a greater emphasis on
microeconomic policies to create conditions for growth, by prioritising skills and
entrepreneurship interventions.
5.6.2 Fiscal and regulatory: Key lessons
• Subsidies may not be successful in the long-term because they distort incentives and
suppress competitiveness.
• Pricing mechanisms may have some success in stimulating demand for certain types of
products and services.

Rebalancing the economy sectorally and spatially: An evidence review
81
• For longer-term success a strategy of fiscal consolidation needs to be accompanied by
investment in R&D and skills to provide a foundation for growth.
• Fiscal and regulatory policies can play some role, albeit generally indirect, in fostering
employment and in the development of skills in particular sectors and places.
• A favourable regulatory environment can help foster success where other conditions are
conducive to growth.
5.7 Governance
Governance is the final theme that has been used to understand what works in terms of
practical ‘rebalancing’. The role of governance systems and regional policy is central to
almost all interventions aimed at ‘rebalancing’ national economies. At the same time, the
impacts of governance and regional policy on economic growth are hotly contested and
difficult to demonstrate conclusively. In that respect, governance and regional policy might
be said to be an inherently intangible intervention, focused on coordination and mobilisation
of actors and resources. Moreover, in England, many interventions that in other countries
would be initiatives of sub-national jurisdictions tend to be enacted by central government.
In this regard, regions with high levels of political autonomy are able to be early movers in
new industries by creating distinctive regulatory regimes. For instance, the State of California
has become a national and world leader in the generation of green jobs and at least part of
the story has been attributed to regulatory interventions, notably the California Global
Warming Solutions Act (AB 32) signed into law by Governor Schwarzenegger in 2006,
although the direct effects are difficult to prove.
Table 5.8 Summary of Governance actions Tangible Mixed Intangible
Setting the ground rules and direction/
promoting the efficient operation
of the market
Provision of clear and efficient governance mechanisms to enable horizontal co-operation between Ministries in Finland and Korea; support for pan-regional co-ordination such as The Northern Way; enable vertical co-ordination (e.g. Denmark’s Regional Growth Forum)
Regional Governance to establish guidelines for investment priorities, manage co-ordination mechanisms e.g. Swedish Growth Agreements, Northern Netherlands Assembly
1 2 3

Rebalancing the economy sectorally and spatially: An evidence review
82
1 2 34 5 67 8 9
1 2 34 5 67 8 9
Tangible Mixed Intangible
Building enablers and conditions for
growth
Role of regional institutions in co-ordinating programmes
Property elements of programmes such as RECHAR, RESIDER, KONVER, RETEX
Local partnerships as governance structures e.g. LEPs and SRB
Local capacity building and cohesion e.g. coalfields programme; ESF, ERDF and Cohesion Funds
Tilting the playing field, playing the role of principal
actor/agent
RDAs as governance structures
Subsidies and incentives to influence the location of businesses
Informal/semi-formal governance arrangements for city regions
5.7.1 Governance: Setting the ground rules
Cell 3 contains intangible interventions of a regulatory type.
Regional governance systems typically provide an overarching
framework for regional development policies, establishing
guidelines for investment priorities, managing co-ordination
mechanisms and dealing with challenging cross-thematic
issues that remote central governments find difficult to address. Emerging city region
structures, in cooperation with Lander governments, appear to have played this role
effectively in Germany. The regional tier has also proven to be useful for achieving horizontal
cooperation between ministries as demonstrated by the Swedish Regional Growth
Agreements which align the investment priorities of central, regional and local government,
and in the Netherlands where a Northern Netherlands Assembly has been created which
represents regional interests at national and European levels (see Table 5.9). Governments
can also play a national role in framing policies for sectors of national importance, such as
the South Korean government’s standard setting policies aimed at stimulating the
development of world class IT industry, which can be said to have been successful to date.
Pan-regional initiatives, such as England’s Northern Way initiative illustrate the advantages
of co-operation and co-ordination between places, especially on policy areas such as
innovation, strategic transport and energy which all span administrative regions.
4 5 6
7 8 9
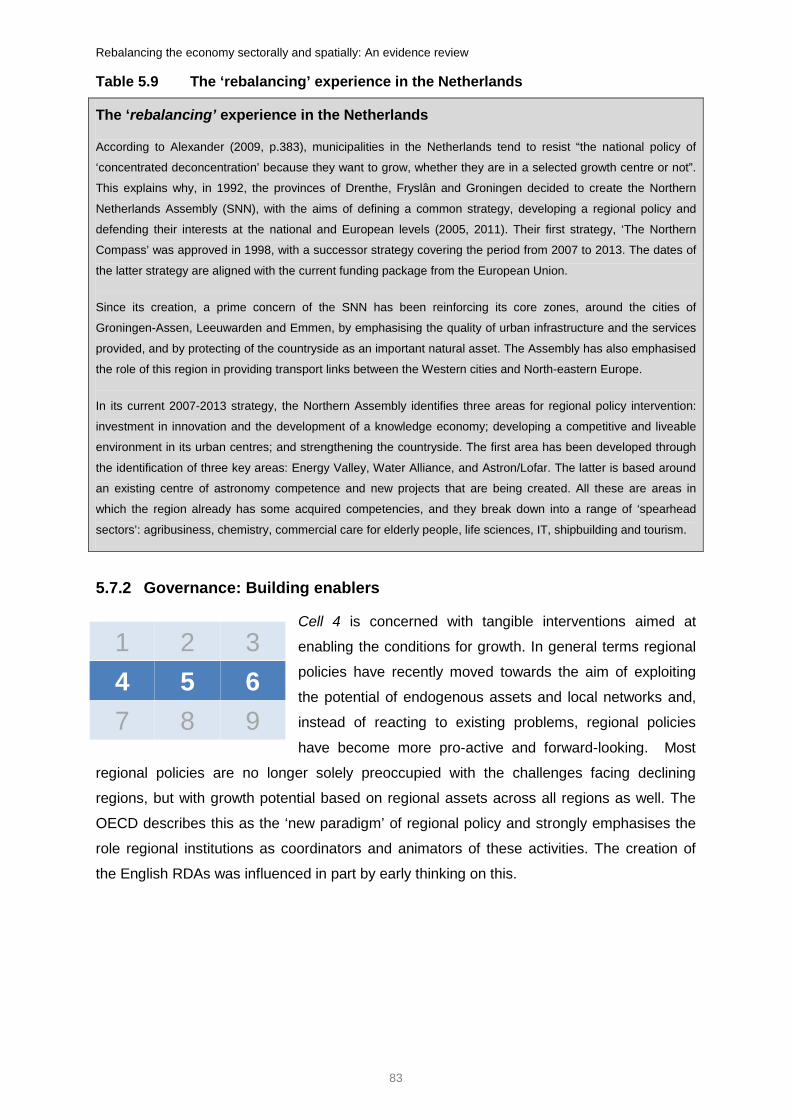
Rebalancing the economy sectorally and spatially: An evidence review
83
1 2 34 5 67 8 9
1 2 34 5 67 8 9
Table 5.9 The ‘rebalancing’ experience in the Netherlands
The ‘rebalancing’ experience in the Netherlands
According to Alexander (2009, p.383), municipalities in the Netherlands tend to resist “the national policy of
‘concentrated deconcentration’ because they want to grow, whether they are in a selected growth centre or not”.
This explains why, in 1992, the provinces of Drenthe, Fryslân and Groningen decided to create the Northern
Netherlands Assembly (SNN), with the aims of defining a common strategy, developing a regional policy and
defending their interests at the national and European levels (2005, 2011). Their first strategy, ‘The Northern
Compass’ was approved in 1998, with a successor strategy covering the period from 2007 to 2013. The dates of
the latter strategy are aligned with the current funding package from the European Union.
Since its creation, a prime concern of the SNN has been reinforcing its core zones, around the cities of
Groningen-Assen, Leeuwarden and Emmen, by emphasising the quality of urban infrastructure and the services
provided, and by protecting of the countryside as an important natural asset. The Assembly has also emphasised
the role of this region in providing transport links between the Western cities and North-eastern Europe.
In its current 2007-2013 strategy, the Northern Assembly identifies three areas for regional policy intervention:
investment in innovation and the development of a knowledge economy; developing a competitive and liveable
environment in its urban centres; and strengthening the countryside. The first area has been developed through
the identification of three key areas: Energy Valley, Water Alliance, and Astron/Lofar. The latter is based around
an existing centre of astronomy competence and new projects that are being created. All these are areas in
which the region already has some acquired competencies, and they break down into a range of ‘spearhead
sectors’: agribusiness, chemistry, commercial care for elderly people, life sciences, IT, shipbuilding and tourism.
5.7.2 Governance: Building enablers
Cell 4 is concerned with tangible interventions aimed at
enabling the conditions for growth. In general terms regional
policies have recently moved towards the aim of exploiting
the potential of endogenous assets and local networks and,
instead of reacting to existing problems, regional policies
have become more pro-active and forward-looking. Most
regional policies are no longer solely preoccupied with the challenges facing declining
regions, but with growth potential based on regional assets across all regions as well. The
OECD describes this as the ‘new paradigm’ of regional policy and strongly emphasises the
role regional institutions as coordinators and animators of these activities. The creation of
the English RDAs was influenced in part by early thinking on this.

Rebalancing the economy sectorally and spatially: An evidence review
84
The ‘new paradigm’ is arguably codification and iteration of insights gained from ‘best
practice’ interventions enacted through the European Structural Funds and Cohesion Funds
which were intended to establish new growth trajectories in lagging regions. Community
initiatives such as RECHAR (for coal dependent regions) RESIDER (for steel dependent
regions) KONVER (for defence dependent industry regions) and RETEX (for clothing and
textile dependent regions) supported a range of intervention such as the conversion of
buildings, support for new economic activities, promoting tourism, organisations supporting
regional development, support for training and employment, interest subsidies on loans for
small businesses, economic diversification, advisory services, networking and partnership
schemes, business audits, training for employees made redundant.
Cell 5 concerns mixed interventions aimed at enabling growth. These might include the
centrally promoted local partnerships that have been introduced in the UK, such as City
Challenge, Single Regeneration Budget and, latterly, Local Economic Partnerships.
Interventions by regional authorities vary considerably reflecting the level of jurisdictional
authority, but might include the science and innovation policies enacted by the cross-border
Øresund Science Region, involving Swedish and Danish policy makers and private sector
actors which has promoted heavy investments in higher education and the science, which
appear to have underpinned the region’s designation as one of Europe’s top knowledge
regions. Such interventions are replicated by regions across Europe through the trend
toward the creation of Regional Innovations Systems, involving significant, if diverse,
investments in human capital.
Cell 6 is concerned with intangible interventions aimed at enabling the conditions for growth.
The EU’s regional policy, enacted through Structural Funds, emphasises the importance of
integrated, placed-based approaches that seek to mix soft and hard forms of policy
intervention in systems of multi-level governance. These approaches are seen as crucial to
the identification, assessment, and exploitation of local assets with growth potential,
especially those relating to skills and innovation capacity. This mixed approach is also
endorsed in recent work by the OECD, which suggests that regions with diverse spatial and
sectoral characteristics are capable of growth based on well-founded strategies. The
Swedish Regional Growth Agreements exemplify this approach aimed at coordinating the
activities of a range of public and private actors in the region including regional and central
governments and their agencies, often including targeted investments in high level skills.

Rebalancing the economy sectorally and spatially: An evidence review
85
1 2 34 5 67 8 9
1 2 34 5 67 8 9
5.7.3 Governance: Tilting the playing field
Cell 7 is concerned with tangible interventions to tilt the playing field or adopt a principle-
agent approach. The English RDAs could be seen as expression of this type of intervention.
At arm’s length from government, the RDAs were charged
with meeting central government targets. They have
generally been regarded as having failed in their objectives
but a more balanced assessment might acknowledge their
contribution to urban regeneration in northern cities and to
the emergence of new industries and new jobs. RDAs take
many forms around the world and are typically accountable to regional rather than national
authorities; their scope and remit varies considerable. However, the common trend is for
them to lead integrated regional innovation strategies, often supporting key local sectors and
clusters.
Cell 8 is concerned with mixed interventions to tilt the playing field or play the role of a
principle-agent. The use of policies aimed at influencing industrial location decisions through
the provision of subsidies and incentives (controls on investment in faster growing regions)
were widely used until the 1980s. Reflecting the principles of what the OECD terms the ‘old
paradigm’, it has often been forgotten that they were in some respects highly effective. In the
UK lasting and productive investments, such as Nissan’s plants at Sunderland, were the
product of this type of intervention. The current approach in the Netherlands, in which the
national spatial planning systems favours some sectors and regions, typically in ways that
benefit the Randstad, might be said to reflect more the principles of the ‘new paradigm’.
Governments can also play a national role in framing policies for sectors of national
importance, such as the South Korean government’s standard setting policies aimed at
stimulating the development of world class IT industry, which can be said to have been
successful to date.
Finally, Cell 9 is concerned with intangible interventions to tilt the playing field or play the role
of a principle-agent. The contribution of governance and regional policy interventions in
relation to these criteria are the informal and semi-informal arrangements for the governance
of city regions that are visible around the world and exemplified in the Ruhr and Munich.
Pan regional cooperation networks such as The Northern Way and the Øresund (cross-
border) region are informal or semi-formal mechanism for developing shared understandings
and actions. Whilst the Øresund region continues to develop and progress, The Northern
Way ceased formally on 31 March 2011 as a result of the abolition of the RDAs, the loss of
the wider regional tier in the infrastructure of English economic development, and austerity in
the public finances. The recently published evaluation of The Northern Way comments
favourably on the economy, efficiency, and effectiveness of the initiative.

Rebalancing the economy sectorally and spatially: An evidence review
86
5.7.4 Governance: Key lessons
• In the majority of case studies and other examples cited in the literature, the
regional level is often the chosen scale for of intervention for spatial ‘rebalancing’.
• The integration of different administrative scales (local, regional, pan-regional,
national) is important for effective governance.
• The ‘new paradigm’ of regional governance is focused on taking advantage of
underutilised resources, in contrast with the ‘old paradigm’, which put greater
emphasis on redistribution.
5.8 Summary
The purpose of this section has been to provide an overview from the literature and case
studies of the effectiveness of practical actions taken in the UK and abroad to ‘rebalance’
places and sectors. As the various examples above show, these interventions are wide-
ranging and extensive and many actions cut across policy ‘themes’ and ‘types’, even
conflicting in places. This is one of the study’s key findings; there is not a single, defined
and clearly articulated solution to the ‘rebalancing’ challenge. ‘Rebalancing’ is multifaceted,
variable over time, and not in any sense guaranteed.
That said, when reviewed as a whole the section does contain nine common findings which
to a greater or lesser extent appear to be linked to successful ‘rebalancing’ action. They are
as follows:
• Long-term certainty and predictability in policy, governance and funding all matter.
Continuous change in funding streams, qualifications, systems, governance
structures and policy tends to confuse and disrupt the ‘rebalancing’ process.
• Resourcing at an appropriate scale and in appropriate forms is important.
• Simplicity in enabling environments, such as tax incentives and regulations, helps;
by contrast, complexity acts as a barrier to ‘rebalancing’.
• Interventions that go with the sectoral and/or cultural grain of places and sustain
growth (e.g. to sustain advantages of agglomeration) tend to be more successful
in ‘rebalancing’ terms.
• ‘Packages’ of interventions (that cut across cells of the typology and the thematic
areas) have better chances of success than single ‘silo’ actions. Integration of
interventions matters, such as between housing and transport to enable
agglomeration benefits. The modelling (in the next Chapter) highlights the
conflicts inherent in ‘rebalancing’, and mixed interventions help, to some extent,
mitigate against these trade-offs.

Rebalancing the economy sectorally and spatially: An evidence review
87
• Interventions that solely focus on bringing old assets into productive use or that
add to capital accumulation tend not to be effective unless intangible assets are
enhanced at the same time, for example by raising people’s skills and aspirations
and improving quality of life.
• Long-term investment in innovation in the widest sense, including human capital,
is important.
• Autonomy at the ‘right’ spatial level is key, as is the city region, state/region and
nation working co-operatively in co-ordinated and reinforcing ways. Social
dialogue between employers, unions, workers and other organisations builds co-
operation and co-ordination in ways of working across different spatial scales, but
takes time for trust to build.
• Finally, context is critical. For example, ‘picking winners’ does not work
everywhere all of the time, therefore interventions need to be tailored to each
context.

Rebalancing the economy sectorally and spatially: An evidence review
88
6 Towards a rebalanced future – the economic feasibility
6.1 Introduction
In the previous section, specific actions to rebalance the economy were categorised and
reviewed, and the lessons for policy makers were drawn out. In this section, we put the
knowledge of these actions into a broader economic context, using an economic model to
examine the likely implications for the UK of macroeconomic and sectoral microeconomic
‘rebalancing’ actions. Three projections have been developed to explore the economic
feasibility of ‘rebalancing’, and the results highlight the degree of challenge that
‘rebalancing’ represents in terms of what would need to be done to achieve better macro and
sectoral balance and, in particular, to address the remaining spatial disparities.
6.2 Explaining the projections analysis
Using its regional multi-sectoral economic model, MDM-E312
Three alternative projections through to 2020 are analysed, for which the key assumptions
and outcomes are discussed below:
, CE has projected the likely
economic feasibility and consequences of policies designed to alter the balance of the UK
economy. The nature and scale of the projections modelled has been informed by the
review of literature and data. The review of literature and the case studies provided very
limited evidence to inform the specific scale of preferred balance, and so by assessing past
trends in UK balance alongside the literature, we have made informed assumptions as to
what scale of balance to represent in the projections.
• Reference Case - a baseline forecast for the UK economy.
• Dynamic Growth - in which the UK benefits from a broad-based resurgence in
export and innovation-led growth.
• Promoting sectors of Comparative Advantage - in which a selection of industry
sectors achieve stronger output growth.
12 See Appendix B.

Rebalancing the economy sectorally and spatially: An evidence review
89
6.3 Projection 1 - The Reference Case
The Reference Case paints a picture of a weak recovery of GDP growth in the medium term, but with some degree of macroeconomic ‘rebalancing’ compared with the pattern
of growth in the preceding ten years13
• GDP growth is forecast to average around 2 per cent pa to 2015, picking up to 2.5
per cent pa during 2015-20. Employment is forecast to grow on average by 0.5
per cent pa, generating 1.7 million jobs.
:
• The deficit on the fiscal balance will narrow from almost 10 per cent of GDP in
2010 to about 2 per cent by 2020.
• The contribution to growth of government spending will become negative.
Government consumption is expected to shave -0.4 percentage points (pp) off
GDP growth during 2010-15, compared with the positive contribution of 0.5pp that
it made during 2000-0714
• Net trade (the difference between exports and imports) will make a positive
contribution to GDP growth. Net trade is expected to contribute 0.4pp pa to GDP
growth during 2010-15 compared with a negative contribution of -0.4pp during
2000-07.
.
• The improvement in the trade performance will be reflected in a gradual and
modest narrowing of the balance of payments deficit. The deficit on the current
account averaged -2.25 per cent of GDP during 2000-07; it is forecast to narrow to
1-1.5 per cent of GDP by 2015.
• The growth of business investment will recover modestly compared to previous
recoveries and government investment will be cut. Overall investment will
contribute around 0.6pp to GDP growth 2010-15, a similar contribution to that
made during 2000-07.
• The outlook over the next five years is one of subdued consumer spending as
households rebuild savings. Since falling to a low of only 1.5 per cent in 2008, the
saving ratio has risen sharply and is forecast to remain around 4.5-5 per cent.
Household spending’s contribution to GDP growth is forecast to moderate to
around 1.1pp of GDP compared with 1.7pp during 2000-07.
13 CE’s Reference Case differs to the forecasts of OBR, but it is similar in that OBR (March 2011) judges that “the composition of the recovery we forecast is broadly as we expected in the November Outlook” when (November 2010) their “expectation [was] for the economy to rebalance away from consumption and towards investment and net exports”. 14 CE exclude the period of recession 2008-09.

Rebalancing the economy sectorally and spatially: An evidence review
90
6.3.1 Reference Case results
When the sectoral and spatial results are analysed, the Reference Case illustrates that this
extent of macroeconomic ‘rebalancing’ will not be sufficient to ‘improve’ the sectoral and spatial balance of the UK economy by 2020. The results for the Reference Case
point to the continuation of trends in the previous patterns of imbalance.
Figure 6.1 Reference Case employment growth 2010-2020 by broad sector (thousands)
Source: Cambridge Econometrics, 2011
Figure 6.2 Occupational structure of employment by broad sector, 2009
Source: LFS/IER, 2011

Rebalancing the economy sectorally and spatially: An evidence review
91
6.3.2 Sectoral balance
• Financial services are expected to account for a larger share of output in 2020
than in 2010, but the share of jobs will not change.
• The key growth sector for jobs will be business & personal services (see
Figure 6.1) which is forecast to increase its shares of jobs and output.
• The sectors for output growth will be distribution and transport & communications, but, like financial services, these sectors are not expected to
increase their shares of jobs.
• The improvement in trade performance is forecast to halt the long-term decline in manufacturing’s share of output. Even so, manufacturing’s share of
output in 2020 is forecast to remain a little lower than it was in 2007, before the
recession started, and its share of jobs is expected to fall.
• The cut-backs in government consumption will shrink the public sector’s shares of
output and jobs.
6.3.3 Spatial balance
• Faster than UK-average growth is forecast to persist in London, the South East,
the East of England and the South West, further boosting these regions existing
shares of UK output and jobs (See Figure 6.3 below).
6.3.4 Employment and skills
The outcomes for employment and skills will be driven by the pattern of sectoral output and
productivity growth (see Figure 6.1) and the occupational structures of those sectors (see
Figure 6.2). The projections suggest that the largest growth of jobs will be accounted for by managerial and professional, and personal, sales & customer services occupations:
• In business & personal services, the 1.1 million jobs expected to be generated
comprise a relatively large proportion of higher-level occupations (amongst
professional services) but also a large proportion of lower-level occupations such
as personal service occupations and (amongst supporting business services)
administrative & secretarial occupations.
• The 310,000 jobs projected to be generated in distribution comprise a large
proportion of sales & customer services occupations.
• Construction jobs are forecast to increase by 251,000 and these comprise a large
proportion of skilled trade occupations.

Rebalancing the economy sectorally and spatially: An evidence review
92
• The number of manufacturing jobs is expected to fall by 142,000; these jobs
comprise a large proportion of skilled trades and process, plant & machine
operatives occupations.
• In government services, 85,000 jobs are forecast to be lost during 2010-2020;
these jobs comprise a large proportion of managers & senior officials,
professional, associate professional & technical and personal services
occupations.
• Figure 6.3 shows that the largest numbers of jobs are forecast to be generated in
those regions in which output is projected to grow the fastest, namely, London, the
South East, the East of England and the South West.
Figure 6.3 Reference Case employment growth 2010-2020 by UK regions (thousands)
Source: Cambridge Econometrics, 2011
6.4 Projection 2 - Dynamic Growth
In the Dynamic Growth projection, we assume that successful ‘rebalancing’ interventions are implemented to achieve a broad-based resurgence in export and innovation-led growth, reflecting recent thinking by central government. Table 6.1
summarises the evidence that has informed the design of the projections, the assumed
nature and scale of change represented in the projections, and the key results.

Rebalancing the economy sectorally and spatially: An evidence review
93
Table 6.1 Projection 2 - The nature and scale of Dynamic Growth
Findings of the evidence review
UK economy currently vulnerable because of financial imbalances:
• Households and the corporate sector financial surpluses
• Persistent current account deficit
• Large government deficit
Current account deficit of larger than 4-5 per cent is considered to be unsustainable (Coutts et al.,
2010)
Surplus of corporate sector is ‘abnormally’ high (Martin, 2010a)
‘Unsustainable’ recent developments: government spending second most important driver of growth
2000-07; household saving ratio 2008 lowest since 1950s; household debt >100 per cent of GDP;
business investment has been particularly low; net trade dragged down GDP growth 2000-07;
government structural deficit highest in OECD (BIS, 2010k).
Preferred pattern of growth – stronger export and investment growth but would be optimistic to think
that investment share of GDP could rise by as much as 5 percentage points (pp) (Wolf, 2010).
Assumptions for modelling projection 2
Investment Stronger than reference growth of investment
Average growth of +1.5 pp pa (compared to Reference Case) over 2010-20
Exports Stronger than reference growth of exports
Average growth of +1.75 pp pa (compared to Reference Case) over 2010-20
Policies The same fiscal and monetary policies as in Reference Case
Headline results
GDP growth Faster than Reference Case GDP growth
Average growth of +0.75-1pp pa (compared to Reference Case) over 2010-20
Households Stronger than Reference Case rebuilding of the saving ratio
Saving ratio +1.5 pp (compared to Reference Case) by 2020
Government Stronger than Reference Case narrowing of the public deficit
Public Sector Net Cash Requirement as per cent of GDP -3.5 pp (compared to
Reference Case) by 2020
Trade Improved balance of payments
Balance of payment as per cent of GDP +4.25 pp (compared to Reference
Case) by 2020
Employment Faster than Reference Case employment growth
Average increase of +159 thousand pa (compared to Reference Case) over
2010-20
Average growth of +0.5 pp pa (compared to Reference Case) over 2010-20

Rebalancing the economy sectorally and spatially: An evidence review
94
We assume that interventions such as those to ‘support universities, science and research in
building a strong, innovative economy’, to ‘stimulate exports and inward investment’ and ‘to
encourage investment and exports as a route to a more balanced economy’ are successful
in achieving stronger growth of economy-wide investment and exports (BIS, 2010a; HM
Treasury and BIS, 2011). Export growth of 8 per cent pa for 2010-15 and around 6 per cent
pa for 2015-20 is assumed: this growth is around 1.75 pp pa faster than in the Reference
Case and of a rate comparable to that achieved during the mid to late 1990s (following the
deprecation of sterling in 1992). Investment growth for 2010-20 is assumed to pick up to
around 5.5 per cent pa, 1.5pp pa faster than the Reference Case, but still more modest than
the growth achieved during the late 1990s.
In the Dynamic Growth projection, overall GDP growth 2010-20 is boosted to 3 per cent pa,
0.75-1pp faster than in the Reference Case. Employment growth of 1 per cent (332,000
jobs) pa is achieved, compared with 0.5 per cent (173,000 jobs) pa in the Reference Case.
The economy shifts towards greater macroeconomic balance than the Reference Case (see Table 6.1).
On this basis, the sectoral balance of the economy is projected to change as follows (see
Figures 6.4 and 6.5):
• The long-term decline in manufacturing’s share of output is projected to be turned
around: it is expected to rise from 11.7 per cent in 2010 to 13.6 per cent in 2020, a
share last seen in the early 2000s. In order to achieve this turnaround,
manufacturing output would need to grow at a sustained rate of 4.75-5 per cent
pa, around 1.5pp faster than GDP growth (and 3 per cent pa faster than in the
Reference Case). This would be a radical turnaround in the performance of UK
manufacturing, growth of which has exceeded GDP growth in only a handful of
years during the last four decades. Even if such output growth were achieved, it
would not be sufficient to halt the decline in manufacturing’s share of jobs because
productivity growth in manufacturing is relatively fast; manufacturing employment
is forecast to increase modestly (see Figure 6.4) but this is a radical departure
from the preceding long-term decline.
• The assumed boost to export and innovation-led growth stimulates activity in the
rest of the private sector, so that output growth (excluding manufacturing) picks up
by around 1-1.5 per cent pa (compared with the Reference Case). The output and
employment shares of the other broad private sectors remain similar to those
projected by the Reference Case. Employment growth is boosted most in
construction, distribution and business and personal services.

Rebalancing the economy sectorally and spatially: An evidence review
95
• We assume that the growth of government spending will be the same as in the
Reference Case, but overall GDP growth is faster, so the shares of government
services output and employment are forecast to be smaller by 2020 than in the
Reference Case.
Figure 6.4 Dynamic Growth Projection - employment growth 2010-2020 by broad sector (thousands)
Source: Cambridge Econometrics, 2011
The outcomes for the nations and regions of the UK are determined principally by their
sector specialisations. In the Dynamic Growth projections, compared with the Reference
Case manufacturing growth is boosted most, followed by growth of other private sectors, and
relative to overall GDP growth, the growth of government services lags further behind. The
key implications are as follows:
• Output and employment growth (see Figure 6.5) are boosted in all the regions. Compared with the Reference Case the largest gains in jobs are in
London and the South East, but also the East of England and the North West.
Nonetheless, the changes in the spatial shares of output and of employment are
marginal compared with the Reference Case.
• The East Midlands and the North West, regions which have a relatively high share
of manufacturing, see a small increase in their shares of UK output but fail to make
gains in their shares of employment (because manufacturing growth generates
relative few jobs).

Rebalancing the economy sectorally and spatially: An evidence review
96
• Although Scotland and Northern Ireland also have relatively large shares of
manufacturing output, government services also account for a relatively large
share and so these regions’ shares of total output (and employment) are projected
to be lower than in the Reference Case.
• London’s share of UK output (by 2020) falls slightly compared to the Reference Case; the shares of the South East, East of England and South West
increase marginally.
Figure 6.5 Dynamic Growth Projection - employment growth 2010-2020 by region (thousands)
Source: Cambridge Econometrics, 2011
The Dynamic Growth projection illustrates the outcomes for a broad-based resurgence in
export and innovation-led growth. The assumed boost to overall export growth is unlikely to
be sustained over the coming years given the weakness of demand in many of the UK’s key
trading partners. If such export and innovation-led growth were to be achieved it would contribute to a greater degree of macroeconomic ‘rebalancing’. It would also halt the
long-term decline in manufacturing’s share of output and the level of manufacturing
employment. This would be a radical turnaround in the performance of UK manufacturing, but still insufficient to halt the decline in manufacturing’s share of jobs because productivity growth in manufacturing is relatively fast.
Those sectors in which employment growth (in terms of the number of jobs generated) is
boosted most compared to the Reference Case are manufacturing, construction, distribution
and business and personal services. Dynamic Growth would therefore likely further boost the numbers employed in sales & customer services, personal services, elementary, managerial and professional occupations, and to a lesser extent skilled trades, and process, plant & machine operatives occupations.

Rebalancing the economy sectorally and spatially: An evidence review
97
Shifts in spatial balance take time to achieve given the nature of imbalance at the starting
point. Even the considerable scale of macroeconomic and sectoral ‘rebalancing’ achieved in the Dynamic Growth projection is sufficient to contribute to only marginal shifts in spatial balance in the period to 2020.
6.5 Projection 3 – Comparative Advantage
Whilst recognising the need to achieve a diverse and broad-based sectoral mix, current
policy states a commitment to promote competitiveness in areas of comparative advantage
(BIS, 2010a; BIS, 2011). In this third projection, the Comparative Advantage Projection, we
boost demand (through exports and investment) of specific activities in which the UK is
considered to have comparative advantage, e.g. digital & creative and low carbon activities,
tradable services and advanced manufacturing (see Table 6.2). Output growth of the
targeted industries is boosted from 4 per cent pa 2010-20 in the Reference Case to 4.75 per
cent pa. Note that the targeted industries typically see faster than average productivity
growth; in the Reference Case employment growth is forecast to average 1 per cent
(102,000 jobs) pa for 2010-20. In response to faster output growth in the comparative
advantage projections, this is boosted to 1.3 per cent (132,000 jobs) pa growth.
Table 6.2 Projection 3 - The nature and scale of promoting sectors of comparative advantage
Findings of the literature review
References to achieving a ‘mixed’, ‘diversified’ and ‘broad-based’ economy, with a wide variety of
industries.
The past shift to services reflects the UK’s comparative advantage in this area (NESTA, 2010)
• Promote evenly shared economic opportunities and support growth and a low-carbon
economy (BIS, 2010a)
• Promote competitiveness in areas of comparative advantage (BIS and Government Office
for Science, 2010; HM Treasury and BIS, 2011)
• Boost enterprise and make this the decade of the entrepreneur; stimulate exports and
inward investment (BIS, 2010a)
Assumptions for modelling projection 3
Targeted
industries15
Printing & Publishing; Pharmaceuticals; Mechanical Engineering; Electronics;
Electrical Engineering & Instruments; Motor Vehicles; Other Transport
Equipment; Manufacturing not elsewhere specified; Electricity; Construction;
Banking & Finance; Insurance; Computing Services; Professional Services;
Miscellaneous Services
15 These industries are those distinguished in CE’s MDM-E3 industry classification. For the SIC definitions of the MDM-E3 industries, and the mapping of comparative advantage activities to these industries, see MDM Industry Classification in Appendix D.

Rebalancing the economy sectorally and spatially: An evidence review
98
Increase demand Stronger than reference growth of export and investment demand for the
targeted industries.
Headline results
GDP growth Faster than Reference Case GDP growth
Average growth of +0.5pp pa (compared to Reference Case) over 2010-20
Households Stronger than Reference Case rebuilding of the saving ratio
Saving ratio +0.5 pp (compared to Reference Case) by 2020
Government Stronger than Reference Case narrowing of the public deficit
PSNCR as per cent of GDP -1.5 pp (compared to Reference Case) by 2020
Trade Improved balance of payments
Balance of payment as per cent of GDP +2.25 pp (compared to Reference
Case) by 2020
Employment Faster than Reference Case employment growth
Average increase of +54 thousand pa (compared to Reference Case) over
2010-20
Average growth of +0.25 pp pa (compared to Reference Case) over 2010-20
Results for targeted industries
Output Average GVA growth of +0.75 pp pa (compared to Reference Case) over 2010-
20
Employment Average increase of +30 thousand pa (compared to Reference Case) over
2010-20
Overall GDP growth 2010-20 is boosted to 2.5 per cent pa, 0.5 pp faster than in the
Reference Case and slower than in the case of dynamic growth. Employment growth of 0.7
per cent (227,000 jobs) pa is achieved, compared with 0.5 per cent (173,000) pa in the
Reference Case. The economy shifts towards greater macroeconomic balance than the
Reference Case, but less so than in the case of Dynamic Growth (see Table 6.2).
Under this third projection, the sectoral balance of the economy is projected to change as
follows:
• Compared to the Reference Case, the share of manufacturing output in 2020 is
slightly higher because of the boost to advanced manufacturing sectors. The share of manufacturing employment is marginally higher, but manufacturing employment is forecast to decline (see Figure 6.6).

Rebalancing the economy sectorally and spatially: An evidence review
99
• The shares of financial, business & personal services output are projected to be larger than in the Reference Case because these sectors include digital &
creative, low carbon activities and tradable services that have been promoted.
Business & personal services employment is boosted by the largest number of
jobs compared to the Reference Case and their share of jobs is increased.
Because of high productivity growth, financial services do not increase their share
of jobs.
• As in the dynamic growth projections, the share of government services by 2020 is
lower than in the Reference Case.
Figure 6.6 Comparative Advantage Projection - employment growth 2010-2020 by broad sector (thousands)
Source: Original analysis by Cambridge Econometrics for this project, 2011
London and the South East and, to a lesser extent, the East of England and the South West
see larger than Reference Case increases in their share of output and employment by 2020,
at the cost of the nations and other English regions. The promotion of activities in which the UK has comparative advantage contributes to a further divergence of spatial balance; those regions that have benefitted previously from relatively strong growth have
done so because they have a concentration of sectors in which the UK has a comparative
advantage. Figure 6.7 shows that the numbers of jobs will be boosted most (compared to
Reference Case) in London and the South East.

Rebalancing the economy sectorally and spatially: An evidence review
100
Figure 6.7 Comparative Advantage Projection - employment growth 2010-2020 by UK nation/ region (thousands)
Source: Original analysis by Cambridge Econometrics for this project, 2011
6.6 Summary
The following Figures 6.8-6.9 plot broad sector shares of total output16
The results for the Reference Case show some degree of macroeconomic ‘rebalancing’
compared with the pattern of growth in the preceding ten years, but this extent of macro-economic ‘rebalancing’ will not be sufficient to ‘improve’ sectoral and spatial balance by 2020. The results suggest that skills demand will be further polarised: the largest
growth of jobs will be accounted for by managerial and professional, and personal, sales &
customer services occupations.
and jobs in 2010 and,
for each of the three sets of projections, in 2020. Figures 6.10 and 6.11 plot the regional
shares of UK output and jobs.
The alternative projections (Dynamic Growth and Comparative Advantage) show what would
need to be done to achieve better than Reference Case macro and sectoral balance, and
the remaining spatial challenges that would need to be addressed.
The analysis shows that shifts in balance take time to achieve and that there can be tensions between macroeconomic, sectoral and spatial balance.
16 GVA is gross value added output.

Rebalancing the economy sectorally and spatially: An evidence review
101
Interventions to improve macroeconomic balance (by transferring the UK’s dependence on
growth away from household and public spending towards exports and innovation, improving
the current account and public deficits) can bring about shifts in the sectoral balance of the
economy. However, even with the current competitive advantage of relatively weak sterling,
the UK’s ability to boost exports sufficiently to achieve such shifts will be hindered in the coming years by the expected weakness of demand in our key export markets.
If export and innovation-led growth, and the associated shifts in the sectoral balance, can
be achieved it would likely further boost the numbers employed in sales & customer services, personal services, and elementary, managerial and professional occupations. Associated with technological and innovation-led growth will be a requirement
for specific STEM skills. In addition, many of the successful interventions summarised in the
previous section involve strategic coordination between different organisations, investment in
innovation and skills, and effective and creative decision-making, all of which will require
strong management and leadership skills.
Figure 6.8 Broad sector shares of UK GVA
Source: Original analysis by Cambridge Econometrics for this project, 2011

Rebalancing the economy sectorally and spatially: An evidence review
102
Figure 6.9 Broad sector shares of UK jobs
Source: Original analysis by Cambridge Econometrics for this project, 2011
Even if significant shifts in macro and sectoral balance can be achieved, the impact on spatial balance will tend to be smaller because of the existing nature of balance in the UK. London and the South East already account for one-third of UK output; in order to
‘catch up’, the other nations and regions would need to achieve considerably faster than
average growth sustained over a long period of time17
Moreover, favourable shifts in macroeconomic and sectoral balance can exacerbate existing spatial disparities. For example, the forecast cuts in public sector employment (to
reduce the public deficit) will hit regions and nations with relatively high concentrations of
public services, some of which are already less prosperous areas.
.
If policies to promote the UK’s sectors of comparative advantage are successfully pursued, these will likely benefit macroeconomic balance, but potentially exacerbate sectoral and spatial disparities. Successful regions tend to have a larger than average
share of the comparative advantage sectors and so boosting growth in these sectors will
tend to further widen spatial disparities. Several comparative advantage sectors (such as
financial services, advanced manufacturing) comprise relatively large proportions of
professional and skilled occupations but they also have relatively high productivity and so
their higher output growth does not create many jobs.
17 If output growth in London and the South East averaged just 1per cent pa over the next ten years, and all other regions and the nations sustained growth of 3per cent pa, then London and the South East’s share of UK output would shrink from 34 per cent in 2010 to 30 per cent by 2020. Overall UK growth would be 2.5 per cent pa.

Rebalancing the economy sectorally and spatially: An evidence review
103
Figure 6.10 National and regional shares of UK GVA
Source: Original analysis by Cambridge Econometrics for this project, 2011
Figure 6.11 National and regional shares of UK jobs
Source: Original analysis by Cambridge Econometrics for this project, 2011

Rebalancing the economy sectorally and spatially: An evidence review
104
7 Conclusions What then in the light of the evidence, data, and modelling perspectives are the key
messages emerging from the study? Recognising that the core purpose of this study is to
provide evidence and analysis to help understand ‘rebalancing’ objectives and actions, this
closing section sets out the main conclusions. The material is organised under four broad
headings:
• The nature and scale of the ‘rebalancing’ challenge.
• The rationales for intervention and the types of interventions employed.
• Towards a future ‘rebalancing framework’ for skills and other policy makers.
• Suggestions for further research.
7.1 Nature and scale of the ‘rebalancing’ challenge
The term ‘rebalancing’ has become used increasingly as a metaphor for a variety of
important changes seen to be required in the UK economy relating to its sectoral structure,
shifts from public to private sector activity, differences in economic performance across
spatial areas, and/or the balance between economic, social and environmental
considerations. The first conclusion of the study is that, even though the term is of recent
origin and often used as a political imperative, ‘rebalancing’ matters in a substantive
sense, notwithstanding that its perceived scope is both wide-ranging and open to broad interpretation.
‘Rebalancing’ the economy is an important part of many policy agendas, but clarity is
needed about what the term ‘rebalancing’ means in particular contexts. The wide
nature of the ‘rebalancing’ challenge means that it is appropriate for policy makers to take
‘integrating’ approaches to ‘rebalancing’ action in their policy fields and in links with adjacent
fields. In the skills and employment arena, this might mean, for example, taking an holistic
view of actions to address the issue of the general skills needed for trading overseas, as
opposed to focusing narrowly on a specific tradeable sector.
The evidence also unambiguously shows, that there is little common agreement on the detail of what an ‘optimal balance’ might be in the sectoral and spatial sense, and
there are very few examples of direct relevance to UK’s governance and planning
contexts where ‘sustained rebalancing’ has been realised. That said, the evidence
reviewed suggests that it is legitimate to be concerned about the need for ‘rebalancing’ even
though it may not be possible, or even appropriate, to paint a detailed endpoint of what
balance looks like at the microeconomic level. Indeed, the endpoint itself is a moving target.

Rebalancing the economy sectorally and spatially: An evidence review
105
For policy makers in general, this means acknowledging there is no ‘silver bullet’, and
‘rebalancing’ objectives and actions need to be considered in process terms rather than as a
well-defined endpoint.
There is a related and important definitional point here, namely that microeconomic ‘balance’ does not necessarily equal growth, and is not necessarily desirable in all contexts. For example, achieving a balanced low-skills equilibrium of low value added, low
skills and low wage employment, is not a desirable outcome.
Whilst there may be definitional issues about what constitutes microeconomic ‘balance’, the
study’s evidence and economic data confirm clearly that the ‘rebalancing’ challenge,
in all forms, is a long-standing one. Sectoral change over the last 40 years or so has
been driven by globalisation and resulting market and technological change, and this will
continue to be the case. This has resulted in western economies shifting from
manufacturing towards services/knowledge-based economies seeking to compete on
content rather than price. Concerns about ‘deindustrialisation’ have been around for several
years and, in the UK, have been strengthened by more recent specialisation on financial
services and the lack of resilience that this was seen to provide to global shocks and
uncertainty. Growing spatial imbalances reflect patterns of agglomeration, and have led
over many decades to some places being significantly and persistently more vulnerable, and
less capable of responding, to these sectoral shifts.
Consequently, the challenges of imbalance and ‘rebalancing’ are widely experienced by the
UK’s competitors, and economies more generally worldwide. Decomposing GDP by its
components of expenditure, the UK’s broad balance is typical of several other large
developed economies such as Canada, France, Italy, and further afield in New Zealand.
Therefore, whilst the UK’s ‘rebalancing’ challenges are significant, they are not unusual
internationally. Differences in productivity growth have also played a major role in the
widening imbalances in economic performance, and skills disparities are a key factor in
explaining national and regional productivity differences. In conclusion, whilst the label may
be new, the issue of ‘rebalancing’ is not unique to the UK, and one in which skills and
employment issues in particular are key elements. This provides a strong general
argument for interventions designed to assist ‘rebalancing’
There are significant tensions and trade-offs involved in addressing the ‘rebalancing’ challenge, with potential negative feedback effects between the macro and
microeconomic ‘rebalancing’ dimensions. Interventions to support ‘rebalancing’ on one
dimension may have unintended adverse consequences for balance elsewhere. In
particular, and drawing from the study’s macro scenario projections, achieving
macroeconomic balance at national level and shifting from the public to the private sector as

Rebalancing the economy sectorally and spatially: An evidence review
106
a source of employment is almost certain to lead to greater spatial imbalances. These have
not always been articulated fully in recent UK policy debates. The Office of Budget
Responsibility’s forecasts expect private sector job growth to compensate for the loss of
public jobs nationally. This will go some way to rectify the public-private sector imbalance at
an aggregate level. But, at the sub-national levels at which most labour, skills, and
enterprise markets work, the private sector may well find it very difficult to compensate for lack of public sector job growth in areas where it has performed poorly in the past. This potential negative feedback loop of macroeconomic action on the microeconomic
context is a key issue for consideration in the design of any‘rebalancing’ interventions.
7.2 Rationales for intervention
Against this background, there is considerable debate in the literature reviewed for the study
as to whether government can and should intervene with respect to ‘rebalancing’ in a
sectoral and spatial sense. This has clustered around the following issues:
• Deadweight public sector costs (expenditure that does not result in additional
activity).
• The risks that such interventions are not sustainable without on-going support.
• Distortive effects cause by the allocation of resources and unintended adverse
effects elsewhere and/or later.
These concerns are most obviously evident within a neoclassical growth framework, in which
spatial and sectoral differences in productivity are expected to reduce if market forces are
allowed to operate. These issues are also a concern within a theoretical framework based
on more recent thinking about new economic or functional geographies, where spatial
differences can be expected to persist long-term because of agglomeration economies.
Over time, endogenous growth and new economic geographies theories have become more
influential in economic development policy, which focus on improving the adaptive capacity,
productivity and utilisation of resources in places and maximising positive externalities.
The evidence has shown that the rationales for specific government intervention in
support of ‘rebalancing’ activity have generally moved towards the need to address
the underutilisation of resources and improve the competitiveness of places, focusing on place-based growth rather than redistribution.
7.3 What works?
Drawing from the study’s review of the evidence, there are a number of factors which appear
to be linked with ‘rebalancing’ impact and ‘success’. In headline terms, these are as follows:

Rebalancing the economy sectorally and spatially: An evidence review
107
• ‘Packages’ of interventions that span policy areas have better chances of success than single silo actions. For example, interventions linking housing
and transport are key to enabling agglomeration benefits in urban centres.
Moreover, as the study’s projections highlight, mixed interventions can help
mitigate against the trade-offs and inherent tensions within ‘rebalancing’..
Interventions that go with the sectoral and/or cultural grain of places and are designed to sustain growth also tend to be the more successful.
• Certainty and predictability going forward matters, especially where the public
sector is working with the private sector and where the market needs to have
confidence in the future direction of travel if it is to invest meaningfully, as it takes
time to achieve shifts in balance (especially spatial). This was, for example, a key
factor in the long-run success of industrialisation initiatives in Asia. Continuous change in funding streams, qualifications, systems, governance structures,
and policy tends to confuse and disrupt the ‘rebalancing’ process. Similarly,
simplicity in ‘enabling’ environments, such as tax incentives and regulations,
helps ‘rebalancing’.
• Autonomy at the ‘right’ spatial level is key, along with local, city regional,
regional and national actors working in co-ordinated and reinforcing ways. This is
especially so in the wider European context. For example, the capacity and
autonomy of regional institutions in Sweden and the Netherlands to take charge of
developing their regional spaces appears to have been a very significant factor in
‘rebalancing’ effects. Whilst stipulating what constitutes a ‘region’ is difficult and of
limited value, it does seem to be the case that certain policy areas require a
broader spatial perspective than the local area. This is because some of the
infrastructural policy issues relating to ‘rebalancing’ (e.g. innovation, strategic
transport, energy planning, and supply chains) tend to operate at spatial footprints
that extend beyond local and sub-regional boundaries. It is important that
appropriate consideration is given to how these issues which may operate at
larger geographies should be managed.
• Capable and competent governance and oversight is key. This not only
provides the certainty and predictability referred to above, but the calibre of
thinking and accountability for performance are important factors in driving
‘rebalancing’ action forward. Linked to this, as the international case studies make
clear, institutional context is a key consideration in considering what works where,
and how. The international evidence provided by the literature shows that any
significant role for the public sector (generally) works best when in collaboration with the private sector.

Rebalancing the economy sectorally and spatially: An evidence review
108
• Dialogue between employers, unions, workers and other organisations builds co-operation and co-ordination in ways of working across different spatial
scales, and between organisations within sectors. This can yield successful
outcomes when faced with challenges of sectoral restructuring, although it takes
time for trust to build.
• Investments targeting human capital and soft infrastructures have had positive results, although their impact varies from context to context. According
to the OECD (2010f), skills development is the most effective form of investment,
although reflecting the point above it does need to be integrated with the local
economic base. Skills development in particular also benefits from the existence
of a varied set of institutions offering both highly qualified knowledge workers and
provision for medium skilled workers. Employers, as both individual organisations
and perhaps acting in employer networks, should be part of this institutional fabric
and their products and business strategies more generally play a crucial role in
shaping skills demand.
7.4 Role of employment and skills
Skills and employment initiatives are an important part of the ‘intervention mix’ and very
much a critical part of the long-term ‘rebalancing’ process. There have been a range of skills
and employment-specific interventions in the UK and abroad that have been designed to
address:
• the causes of imbalance, for example to raise skills levels, as part of a broader
programme to create the conditions for growth to address spatial imbalances;
• the consequences of imbalance, for example the public sector as a job-creator in
areas where the private sector under-performs;
• the consequences of the sectoral ‘rebalancing’ process, for example, in helping
people to adapt to changing skills or occupational requirements as the sectoral
structure of an economy changes.
Turning now to ’what works’ in terms of employment and skills policy in ‘rebalancing’
initiatives, the key messages are:
• Interventions supporting the development of the educational infrastructure and
hybrid people and skills interventions have provided some of the highest returns of any human capital and skills interventions which have assisted in
‘rebalancing’ economies sectorally and spatially in the UK and abroad.

Rebalancing the economy sectorally and spatially: An evidence review
109
• International evidence suggests that the expansion of higher education,
including specific targeting of applied sciences in some regions, has provided skills
of value to sector ‘rebalancing’.
• Intermediary organisations can play useful roles in working with employers and
education and training providers to ensure employers’ demand for skills are met.
• Skills development and investment in training needs to be shared between employers, individuals, and government. Multi-stakeholder approaches can
help achieve better skills provision.
• ‘Flexicurity’ approaches, emphasising lifelong learning and the skills for
sustaining and progressing in work, can yield positive outcomes for individuals and
can assist in the ‘rebalancing’ process between sectors (including potentially the
public-private sector).
• Lifelong learning is important in helping to deal with sectoral ‘rebalancing’ and in
responding to sectoral change. Information, advice, and guidance (IAG) is a
crucial component of lifelong learning.
• There is international evidence on the success of labour market policies in
helping to deal with restructuring and in responding to change, both sectorally and
spatially, especially when targeted at sectors with prospects for growth. This
suggests that anticipating skills change is crucial.
7.5 Towards a future ‘rebalancing’ framework
Drawing on the evidence as whole, the key overall conclusion of our study is that sectoral and spatial imbalances matter where they constrain the ability of an economy to increase and realise its growth and development potential. This can happen in a
number of ways:
• Persistent spatial imbalances will be associated with unemployed and
underutilised resources that could be used more productively.
• Sectoral imbalances can restrict growth if they cause underinvestment in
technological opportunity and change, and constrain its dissemination throughout
the wider economy (e.g. because of fractured supply chains, wider activity that
gets in the way of open innovation).
• Spatial and sectoral imbalances can make an economy, at local, city-region,
regional or national levels, less resilient to the increased shocks and uncertainties
that come from globalisation, be this in the form of market or technology change.

Rebalancing the economy sectorally and spatially: An evidence review
110
Reviewing the data, the unavoidable conclusion is that the UK has been, and is, an
imbalanced economy in these three senses and that, therefore, ‘rebalancing’ is a
important concern of policy makers. The long-standing nature of what we now call the
‘rebalancing’ challenge re-emphasises this imperative. At the same time it should also be
acknowledged that there is no widespread agreement as to what a balanced economy would
look like in terms of the detail of its sectoral and spatial distribution of economic activity, and
that in some senses ‘imbalance’ is a natural state of affairs. Reducing the UK’s dependence
on financial services, on London and the South East and on the public sector as a source of
employment and income have already been highlighted in policy as integral elements of the
‘rebalancing’ process. So, too, will be increasing private sector investment in R&D and
innovation, in skills development, and in overseas trade, as the Plan for Growth touches on.
But how this ‘rebalancing’ will, or should, manifest itself in the changing patterns of
economic activity, and to what extent, is very much less easy to specify, predict and plan. This is not just because of the uncertainties and idiosyncrasies at the microeconomic
level but because the government’s macroeconomic ‘rebalancing’ policies will
influence the sectoral and spatial distribution of UK activity, as will the changes taking place in the global balances of trade and investment, and the relentlessly differentiating impacts of market and technology change. Throughout this process,
there is a challenging conflict between government’s policy objectives and the likely
outcomes of powerful market forces, especially in terms of spatial ‘rebalancing’, and a need
for realism in what policy can achieve in this context.
Despite the uncertainties about the precise shape that sectoral and spatial ‘rebalancing’ can
or should take, the evidence that we have drawn from UK and international experience tells us that appropriate government microeconomic interventions can contribute to
this ‘rebalancing’ and help overcome the constraints that imbalance places on growth and
development. However, the evidence also suggests the need for caution about what can be
achieved by these means. Overall the evidence emphasises:
• The importance of working as far as possible with the grain of market forces to
prompt the private sector to realise the full potential of ‘rebalancing’.
• The care that must be taken to avoid distortive effects which displace or crowd out
other sectoral or spatial economic activity, especially private sector activity.
• The need to build on existing strengths and capacities at sectoral and spatial
levels, acknowledging the importance of intangible assets, including knowledge
networks and assets, place and business cultures, or wider clustering effects
between principal actors including those in the skills and employment arena. As
the case study on the ‘rebalancing’ opportunity afforded by the Offshore Wind

Rebalancing the economy sectorally and spatially: An evidence review
111
sector in Section 5 highlights, this might mean using ‘old skills’ in ‘new ways’ in
places with sectorally relevant antecedents.
• That combinations of interventions (particularly from mainstream service providers
such as local authorities) are required to induce sustained changes in the
behaviour and practice of people, businesses, and networks, but bearing in mind
that relevant geographies are increasingly not co-terminus with administrative
boundaries.
• The investments that are often required to improve access to markets, both in
tangible (e.g. transport and housing) and intangible forms (e.g. supply chains and
links between universities and businesses).
Given these points, and referring back to the typology of ‘rebalancing’ interventions
developed in this study, those actions interventions that are most likely to be effective in the
above terms are those that fall above the line shown in Table 7.1. These interventions tend
not to have high unit costs in terms of public expenditure, and hence would be consistent
with the more austere environment for public spending, which can be anticipated for some
time.
Table 7.1 Defining the focus of ‘rebalancing’ interventions going forward
7
4
1
Tangible
98Tilting the playing field, playing the role of principal
actor/agent
65Building enablers and conditions for
growth
32Setting the ground
rules and direction / promoting the
efficient operation of the market
IntangibleMixed
7
4
1
Tangible
98Tilting the playing field, playing the role of principal
actor/agent
65Building enablers and conditions for
growth
32Setting the ground
rules and direction / promoting the
efficient operation of the market
IntangibleMixed
As well as the need for caution in implementing microeconomic ‘rebalancing’ interventions, it
is important to be realistic about the extent of ‘rebalancing’ that interventions might
actually achieve, certainly over the short term. In particular, no matter what success is
achieved in macroeconomic and sectoral ‘rebalancing’, the addressing spatial imbalance is
likely to prove a sustained long-term project. Significant shifts will be required to reverse
imbalances in the geographical distribution of economic activity that have been caused by
deep-seated historical legacies handed down from one generation to the next. Whatever the
rationale, the long-term nature of such interventions will require the maintenance of

Rebalancing the economy sectorally and spatially: An evidence review
112
continuity and stability in governance and management arrangements, all highlighted above
as critical factors in effective ‘rebalancing’.
Finally, the evidence to date suggests that spatial distribution policies designed to increase
the demand for labour and capital in disadvantaged areas and to improve the quality of life
infrastructure are necessary but not sufficient, and are likely to fail unless accompanied by
policies to:
• enhance the willingness, capacity and networks of local people, businesses and
other organisations (e.g. Higher Educational Institutions and the now emerging
Technology and Innovation centres) to engage in growth and development;
• secure the further engagement of employers, both in their business development
and recruitment activities, and in their in-company skills utilisation and
development practices;
• improve transport and other less tangible means of accessing employment and
other markets (e.g. housing);
• engage mainstream service providers (e.g. education, health, and housing) in
giving priority to the people living in deprived areas to link to opportunities.
7.6 Suggestions for further research
In the course of its work, the study has assembled a wide body of evidence, both in terms of
literature sources and case studies material, on which its findings and messages have been
built. It has been possible only to present the core headlines of the literature review in
particular in this report, and there is much valuable and insightful detail in the study’s
underpinning working papers and analyses.
In terms of ‘new’ research, there are three areas where future work would be helpful, both to fill evidence gaps and to build understanding of ‘rebalancing’ the economy:
• Since the study’s conclusion (i) reinforces the view that spatial imbalances are
likely to remain, even where macroeconomic balance is restored and sectoral
imbalances have been reduced and (ii) the arguments that such spatial
imbalances need to be addressed are accepted (not by redistribution
interventions, but by actions that strengthen the underutilised resource bases of
places), then more evidence is needed on how this can be accomplished both
effectively and cost-effectively. Linked to this, the research on the role, for
example, of transport, housing and utilities planning (e.g. water, energy, waste) in
bringing about ‘rebalancing’ in a UK context is not well developed, so that these

Rebalancing the economy sectorally and spatially: An evidence review
113
considerations do not always enter into decision making about investments in
infrastructure.
• In terms of sectors, in a ‘rebalancing’ context some clearly matter more than
others because of the innovation they can lever elsewhere in the economy.
Research on this is, again, relatively limited and less than conclusive. Further
research would be helpful to better understand the relative importance of growth
sectors in this respect, and their ability to lever innovation through the wider
economy.
• This study has found that skills and human capital interventions have an important
role to play in the success of certain ‘rebalancing’ interventions. There is limited
evidence from the literature reviewed about the specific skills implications of
‘rebalancing’ activity. Relating to the two points above, further research into how
skills interventions can support spatial ‘rebalancing’, especially linked to
investments in infrastructure, and also how skills interventions can support the
development of sectors which are important for ‘rebalancing’ would be valuable.

Rebalancing the economy sectorally and spatially: An evidence review
114
Bibliography Alexander, E. (2009) ‘Book Review: Barrie Needham, Dutch Land Use Planning: Planning
and Managing Land Use in the Netherlands, the Principles and Practice’, in Planning
Theory, Vol. 8, No. 4, pp. 382-384.
Anderson, R., Quigley, J. and Wilhelmson, M. (2004) ‘University decentralisation as regional
policy: the Swedish experiment’, in Journal of Economic Geography, Issue 4, pp. 371-
388.
Ashton, D. (2006) Lessons from Abroad: Developing sector based approaches to skills.
Sector Skills Development Agency, South Yorkshire.
Baker, R. (2010) Growing Lagging Regions: Case Study: North of England. Presentation
presented at OECD Seminar, 28th June 2010. OECD, Paris.
Barca, F. (2009) An Agenda for a Reformed Cohesion Policy. A place-based approach to
meeting European Union challenges and expectations. Independent Report prepared
at the request of Danuta Hübner, Commissioner for Regional Policy. DG Regio,
Brussels.
Batty, E., Beatty, C., Foden, M., Lawless, P., Pearson, S. and Wilson I. (2010) The New
Deal for Communities Experience: A final assessment; The New Deal for Communities
Evaluation: Final Report – Volume 7. Department for Communities and Local
Government.
Bavarian Ministry of Economic Affairs, Infrastructure, Transport and Technology (2009)
Bavaria’s clusters campaign: Networking success. Bavarian Ministry of Economic
Affairs, Infrastructure, Transport and Technology, Munich.
Bergh, A. and Erlingsson, G. (2006) Resilience through Restructuring: Swedish Policy-
Making Style and the Consensus on Liberalizations 1980-2000, Ratio Working Paper
No. 110. The Ratio Institute, Stockholm.
Blotevogel, H.H. and Schmitt, P. (2006) ‘”European Metropolitan Regions” as a new
discursive frame in strategic spatial planning and policies in Germany’, in DIE ERDE,
Vol. 137, No. 1-2, pp. 55-74.
Bomer, H. (2001) ‘New economy and new projects in old industrial areas – do they slow
down the trend of decline? The case of the Ruhr area and the City of Dortmund’,
Paper presented to the First World Planning Schools Congress, Shanghai 11th to 15th
July 2001.

Rebalancing the economy sectorally and spatially: An evidence review
115
Cabinet Office (2010) £1billion fund to help regional business. Available:
http://www.cabinetoffice.gov.uk/news/%C2%A31-billion-fund-help-regional-business.
[Accessed 9th March 2011].
Cadell, C. (2008) Regeneration in European Cities: Making Connections. Case Study of
Norra Älvstranden, Gothenburg (Sweden). Joseph Rowntree Foundation, London.
Cambridge Econometrics (2010) E3ME and E3MG models, Cambridge Econometrics,
Cambridge.
Campagni, R. (2008) ‘Regional Competitiveness: Towards a Concept of Territorial Capital’,
in Capello, R. et al. (eds.) Modelling Regional Scenarios for the Enlarged Europe.
Springer, Heidelberg, pp. 33-47.
Centre for Cities (2010a) Better rail services vital to ‘rebalancing’ the economy. Centre for
Cities, London.
Centre for Cities (2010b) For every extra private sector job generated in the North &
Midlands ten were created in London & the South. Centre for Cities, London.
Centre for Cities (2010c) Private sector cities: A new geography of opportunity. Centre for
Cities, London.
Centre for Cities (2011) What would Maggie do? Why the Government’s policy on Enterprise
Zones needs to be radically different to the failed policy of the 1980s. Centre for Cities,
London.
Chowhury, A. (2008) ‘Labor Market Policies as Instruments of Industry Policy What Can
Europe Learn from Southeast Asia?’, in The American Journal of Economics and
Sociology, Vol. 64, No 4, pp.661-681.
Claessens, S., Evenett, S. and Hoekman, B. (eds.) (2010) ‘Rebalancing’ the Global
Economy: A Primer for Policymaking. Centre for Economic Policy Research, London.
Clifton, J. (2009) ‘Rebalancing our shaky economy’, in The Guardian, 15th July 2009.
Clifton, J., Dolphin, T. and Reeves, R. (2010) Building a better balanced UK economy:
Where will jobs be created in the next economic cycle? Institute for Public Policy
Research, London.
Cohen, N. (2010a) ‘Demand from abroad helps ‘rebalancing’ act’, in The Financial Times, 3rd
December 2010.

Rebalancing the economy sectorally and spatially: An evidence review
116
Cohen, N. (2010b) ‘Drive to rebalance demand faces risks’, in The Financial Times, 24th
March 2010.
Coutts, K., Glyn, A. and Rowthorn, R. (2007) ‘Structural Change under New Labour’, in
Cambridge Journal of Economics, Vol. 31, No. 6, pp. 845-861.
Coutts, K. and Rowthorn, R. (2010) Prospects for the UK Balance of Payments. Civitas,
London.
CPPR (2010) Comparative Government responses to recessions: lessons to be learnt from
fiscal consolidation, CPPR, Glasgow.
Crossick, G. (2010) The Future is more than just tomorrow; higher education, the economy
and the longer term. Universities UK, London.
Dahlman, C. J., Routti, J., and Yla-Anttile, P. (eds.) (2006) Finland as a knowledge economy
– elements of success and lessons learned, The International Bank for Reconstruction
and Development / The World Bank, Washington.
Department for Business, Enterprise and Regulatory Reform (2009a) Synthesis of evaluation
evidence, Department for Business, Enterprise and Regulatory Reform, London.
Department for Business, Enterprise and Regulatory Reform (2009b) Impact of RDA
Spending. National Report Volume 1. Department for Business, Enterprise and
Regulatory Reform, London.
Department for Business, Innovation and Skills (2008a) Evaluation of Regional Selective
Assistance (RSA) and its successor, Selective Finance for Investment in England
(SFIE). Department for Business, Innovation and Skills, London.
Department for Business, Innovation and Skills (2008b) Manufacturing: New Challenges,
New Opportunities. Department for Business, Innovation and Skills, London.
Department for Business, Innovation and Skills (2009a) Impact of RDA Spending.
Department for Business, Innovation and Skills, London.
Department for Business, Innovation and Skills (2009b) New Industry New Jobs: What next
to secure Britain’s economic success – Conference Report. Department for Business,
Innovation and Skills, London.
Department for Business, Innovation and Skills (2010a) Business Plan 2011-15. Department
for Business, Innovation and Skills, London.

Rebalancing the economy sectorally and spatially: An evidence review
117
Department for Business, Innovation and Skills (2010b) Consultation on the future direction
of skills policy. Department for Business, Innovation and Skills, London.
Department for Business, Innovation and Skills (2010c) Economic Growth. BIS Economics
Paper No. 9. Department for Business, Innovation and Skills, London.
Department for Business, Innovation and Skills (2010d) Going for growth – our future
prosperity. Department for Business, Innovation and Skills, London.
Department for Business, Innovation and Skills (2010e) Government response to the
consultation on RGF – October 2010. Department for Business, Innovation and Skills,
London.
Department for Business, Innovation and Skills (2010f) Local Growth – realising every
place’s potential. Department for Business, Innovation and Skills, London.
Department for Business, Innovation and Skills (2010g) Skills for Growth – The National
Strategy. Department for Business, Innovation and Skills, London.
Department for Business, Innovation and Skills (2010h) The path to strong, sustainable and
balanced growth. Department for Business, Innovation and Skills, London.
Department for Business, Innovation and Skills (2010i) UK Trade Performance: Patterns in
UK global trade and growth. Department for Business, Innovation and Skills, London.
Department for Business, Innovation and Skills (2010j) Understanding Local Growth. BIS
Economics Paper No. 7. Department for Business, Innovation and Skills, London.
Department for Business, Innovation and Skills (2010k) A Strategy for Sustainable Growth.
Department for Business, Innovation and Skills, London.
Department for Business, Innovation and Skills (2010L) A Strategy for Sustainable Growth –
Economic Annex. Department for Business, Innovation and Skills, London.
Department for Business, Innovation and Skills (2010m) Learning from Britain’s successful
sectors: a historical example of the role of Government, BIS Economics Paper No. 6.
Department for Business, Innovation and Skills, London.
Department for Business, Innovation and Skills, Foresight Horizon Scanning Centre,
Government Office for Science (2010) Technology and Innovation Futures: UK Growth
Opportunities for the 2020s. Department for Business, Innovation and Skills, London.

Rebalancing the economy sectorally and spatially: An evidence review
118
Department for Communities and Local Government (2008) Why Place Matters and
Implications for the Role of Central, Regional and Local Government. Department for
Communities and Local Government, London.
Department for Communities and Local Government (2010) £1billion fund to help regional
business. Cabinet Office, London.
Available:http://www.cabinetoffice.gov.uk/news/%C2%A31-billion-fund-help-regional-
business. [Accessed 9th March 2011].
Department for Communities and Local Government (2011) Enterprise Zone Prospectus.
Department for Communities and Local Government, London.
Dickinson, S., Cook, J., Welstead, J., Thompson, G. and Yuille, A. (2011) Maximising skills
and employment in the offshore wind supply chain. UK Commission for Employment
and Skills, Wath Upon Dearne.
Dore, R. (2008) ‘Financialisation of the global economy’, in Industrial and Corporate Change.
Vol. 17, No. 6, pp. 1097-1112.
Dühr, S. (2009) ‘Regional development and regional policy in the Netherlands: are there
peripheral regions?’ in Raumforschung und Raumordnung, Vol. 67, No. 4, pp. 300-
307.
Dutt, A. (1989) Sectoral Balance: A Survey. Wider Working Papers. World Institute for
Development Economics Research of the United Nations University, Helsinki.
ERA Foundation (2010) The Sustainability of the UK Economy in an Era of Declining
Productive Capability. 4th Report. Leatherhead: The ERA Foundation.
European Commission (2006) Constructing Regional Advantage. European Commission,
Brussels.
European Commission (2008a) Fifth progress on economic and social cohesion: Growing
regions, Growing Europe. European Commission, Brussels.
European Commisson (2008b) Restructuring in Europe: A review of EU action to anticipate
and manage employment change. European Commission, Brussels.
European Commission (2010a) Europe 2020 – ‘the EU’s growth strategy for the coming
decade. European Commission, Belfast.

Rebalancing the economy sectorally and spatially: An evidence review
119
European Commission (2010b) An Integrated Industrial Policy for the Globalisation Era:
Putting Competitiveness and Sustainability at Centre Stage. European Commission,
Brussels.
European Union: The Committee of the Regions (2010) Consultation of European regions
and Cities on a New Strategy for Sustainable Growth. European Union: The
Committee of the Regions, Brussels.
Eurostat (2010a) Data on Income and Living Conditions Available:
http://epp.eurostat.ec.europa.eu/portal/page/portal/income_social_inclusion_living_con
ditions/data [Accessed 21 February 2011]
Eurostat (2010b) Data on economy and finance, Available:
http://epp.eurostat.ec.europa.eu/portal/page/portal/statistics/themes [Accessed 21
February 2011]
Eurostat (2010c) Data on labour markets, Available:
http://epp.eurostat.ec.europa.eu/portal/page/portal/statistics/themes [Accessed 21
February 2011]
Freedman, C. et al. (2010) ‘Policies to Rebalance the Global Economy After the Financial
Crisis’, in International Journal of Central Banking, Vol. 6, No.1, pp. 215-252.
Froud, J., et al. (2011) ‘rebalancing’ the economy (or buyer’s remorse). CRESC Working
Paper Series, Working Paper No.87. Centre for Research on Socio-Cultural Change,
Manchester.
Garlick, S., Kresl, P. and Vaessen, P. (2006) The Oresund Science Region: A crossborder
partnership between Denmark and Sweden. Peer Review Report. OECD, Paris.
Gartner S. (2009) Balanced Structural Policy: German Savings Banks from a Regional
Economic Perspective. World Savings Banks Institute and European Savings Banks
Group, Brussels.
Goddard, J. et al (2006) Supporting the contribution of HEIs to regional development – peer
review report on the Jyvaskyla region of Finland. OECD, Paris.
Green, A. (2009) Geography matters: The importance of sub-national perspectives on skills
and employment. UK Commission for Employment and Skills, Wath Upon Dearne.
Groom, B. (2010) ‘Britain: Balance and power’, in The Financial Times, 21st July 2010.

Rebalancing the economy sectorally and spatially: An evidence review
120
Gylfason, T. et al. (2010) Nordics in crisis: vulnerability and resilience. The Research
Institute of the Finnish Economy. Taloustieto Oy, Helsinki.
Hamalainen, J., Schienstock, G. and Pentikainen, T (2000) Policy case studies Finland –
prepared for the OECD Focus Group on Innovation Networks. OECD, Paris.
Hassink, R. (2005) ‘How to unlock regional economies from path dependency? From
learning region to learning cluster’, in European Planning Studies, Vol.13, No. 4, pp.
521-535.
Haugh, H. and Kitson, M. (2007) ‘The Third Way and the third sector: New Labour’s
economic policy and the social economy’, in Cambridge Journal of Economics, Vol. 31,
No. 6, pp. 973-994.
Heiland, F. (2004) ‘Trends in East-West German migration from 1989 to 2002’, in
Demographic Research, Vol. 11, No. 7., pp. 173-194.
HM Government (2009) New Industry, New Jobs: Building Britain’s future. Department for
Business, Enterprise and Regulatory Reform, London.
HM Treasury (2009) International examples of spending consolidations. HM Treasury,
London.
HM Treasury (2011) Budget 2011. HM Treasury London.
HM Treasury and Department for Business, Innovation and Skills (2011) The Plan for
Growth. HM Treasury, London.
Hoeckel, K. and Scwartz, R. (2010) Learning for Jobs OECD Reviews of Vocational
Education and Training: Germany. OECD, Paris.
Hospers, G. (2006) 'Silicon Somewhere?' in Policy Studies, Vol. 27, No. 1, pp. 1-15.
Huang, Y. and Bocchi, A., (eds.) (2009) Reshaping Economic Geography in East Asia. The
World Bank, Washington DC.
Hyytinen, A. et al. (2004) Finland’s emergence as a global ICT player: lessons from the
Finnish wireless cluster. The Research Institute for the Finnish Economy, Helsinki.
Institute for Public Policy Research (2010) Unemployment figures: manufacturing jobs need
boost for export-led recovery. Institute for Public Policy Research, London.

Rebalancing the economy sectorally and spatially: An evidence review
121
Institute for Public Policy Research and Joseph Rowntree Foundation (2010) ‘rebalancing’
Local Economies: Widening economic opportunities for people in deprived
communities. Institute for Public Policy Research, London.
IRE (2011) Finnish Centres of Expertise Programme. Available:
http://ec.europa.eu/enterprise/ire/Innovating-regions/www.innovating-
regions.org/schemes/scheme6c4b.html?publication_id=3563&display=byCountry
[Accessed 19th January 2011].
Kavonius, V. Deputy Director General (2004) Developing regional and local innovation
systems. Available:
http://info.worldbank.org/etools/docs/library/232514/Developing%20Regional%20and%
20Local%20Innovation%20Systems%20-%20Kavonius.pdf [Accessed 19th January
2011].
Kiander, J. (2009) The great depression of Finland 1990-1993: causes and consequences.
Labour Institute for Research, Helsinki.
Lee, Y. (2009) ‘Balanced Development in Globalizing Regional Development? Unpacking
the New Regional Policy of South Korea’ in Regional Studies, Vol. 43, No. 3, pp. 353-
367.
Leuing T. and Swaffield J. (2007) Cities unlimited – Making urban regeneration work. Policy
Exchange, London.
Leuing T. and Swaffield J. (2008) Success and the City: Learning from international urban
policies. Policy Exchange, London.
LFS/IER (2011) Occupational structure of employment by broad sector. Available:
http://almanac.ukces.org.uk/employment/C2/Forms/AllItems.aspx [Accessed 21
February 2011]
Lindberg, I. (2005) The Swedish welfare state model – effects of globalisation and economic
restructuring; discussion of social democratic and union strategies. Paper prepared for
the conference Governance of Welfare for the 21st Century: New Social Risks and
Renewal of Social Democracy, Tokyo 18th and 19th February 2005.
Lundquist, K. and Trippl, M. (2009) Towards Cross-Border Innovation Spaces. A theoretical
analysis and empirical comparison of the Öresund region and the Centrope area. SRE
Discussion Papers, 2009/05. Institut für Regional- und Umweltwirtschaft, WU Vienna
University of Economics and Business, Vienna.

Rebalancing the economy sectorally and spatially: An evidence review
122
Lurig (2007) The evolution of regional structural policy – the case of North Rhine
Westphalia’. Department of Regional and Urban Economics, University of Dortmund.
Manninen, H. (2006) Regional Innovation Systems – Finnish, Greek and Italian perspectives.
Paper for Interregional seminar. Rovaniemi.
Marshall, T. (2009) Infrastructure and Spatial Planning. Netherlands Working Paper, Oxford
Brooks University, Oxfordshire. Available:
http://www.brookes.ac.uk/schools/be/about/planning/projects/resources/NLWPmay182
009final.pdf [Accessed 9th March 2011].
Martin, B. (2010a) ‘rebalancing’ in the Dark. Centre for Business Research, University of
Cambridge, Cambridgeshire.
Martin, B. (2010b) ‘rebalancing’ the British Economy – a strategic assessment. Centre for
Business Research, University of Cambridge, Cambridgeshire.
Martin, C. and Thelen, K. (2007) ‘The state and coordinated capitalism - Contributions of the
public sector to social solidarity in postindustrial societies’, in World Politics, Vol. 60,
No. 1, pp. 1-36.
McKinsey Global Institute (2010a) Debt and Deleveraging: the global credit bubble and its
economic consequences. McKinsey Global Institute, London.
McKinsey Global Institute (2010b) From austerity to prosperity: Seven priorities for the long
term. McKinsey Global Institute, London.
McKinsey Global Institute (2010c) How to compete and grow: A sector guide to policy.
McKinsey Global Institute, London.
Miernyk, W. H. (1969) ‘British Regional Development Policy’ in Journal of Economic Issues,
Vol. 3, pp. 33-42.
Ministry of Employment and the Economy (2010) Press release “Evaluation: Centre of
Expertise Programme promoting innovation activity in the regions”. Available:
http://www.tem.fi/?89518_m=99795&l=en&s=2470. [Accessed 19th January 2011].
Monaghan, A. and Conway, E. (2010) ‘A historical guide for David Cameron to public-sector
bonfires’, in The Telegraph, 7 June 2010.
Mosley H. and Bouche P. (2008) ‘Germany: the local impact of labour market reforms’ in
Giguère, S. (ed.) More than Just Jobs: Workforce Development in a Skills-Based
Economy. OECD, Paris, pp. 111-143.

Rebalancing the economy sectorally and spatially: An evidence review
123
NESTA (2008) Attacking the recession: how innovation can fight the downturn. NESTA,
London.
NESTA and Oxford Economics (2010) ‘Rebalancing’ Act. NESTA, London.
Northern Ireland Assembly (2010) Re-balancing Public Finances: Lessons from Past
Experiences. Northern Ireland Assembly, Belfast.
Nuur, C. and Laestadius, S. (2010) ‘Development in peripheral regions: Case studies in
Sweden’ in European Urban and Regional Studies, Vol. 17, No. 3, pp. 293-307.
OECD (1999) Thematic review of the transition from initial education to working life –
Finland. OECD, Paris.
OECD (2001) Knowledge and skills for Life: First results from PISA 2000. OECD, Paris.
OECD (2002) Global Industrial Restructuring. OECD, Paris.
OECD (2004) Developing highly skilled workers: review of Finland. OECD, Paris.
OECD (2005a) How Persistent are Regional Disparities in Employment? The Role of
Geographic Mobility. OECD, Paris.
OECD (2005b) Factbook 2005. OECD, Paris.
OECD (2007a) Globalising Cities and Regions - Rethinking the Urban and Regional Policy
Agenda. OECD, Paris. Available:
http://www.oecd.org/document/45/0,3746,en_21571361_37673954_37966061_1_1_1
_1,00.html. [Accessed 9th March 2011].
OECD (2007b) Higher education and regions: globally competitive, locally engaged. OECD,
Paris.
OECD (2009a) OECD Regions at a Glance 2009. OECD, Paris.
OECD (2009b) OECD Reviews of Tertiary Education. OECD, Paris.
OECD (2009c) Responding to the Economic Crisis - fostering industrial restructuring and
renewal. OECD, Paris.
OECD (2009d) Economic Survey of Brazil 2009: Reaping the benefits of macroeconomic
consolidation. OECD, Paris.
OECD (2010a) Green Growth Strategy (Interim report) - rationale for green strategy, lessons
learned from some initiatives. OECD, Paris.

Rebalancing the economy sectorally and spatially: An evidence review
124
OECD (2010b) Innovation for a sustainable recovery: the crucial role of regions. OECD,
Paris. Available: www.leeds.ac.uk/download/296/angel_gurra_keynote_speech.
[Accessed 9th March 2011].
OECD (2010c) Regional Development Policies – 2010. OECD, Paris.
OECD (2010d) Regional development policy trends in OECD countries. OECD, Paris.
OECD (2010e) Strong Performers and Successful Reformers in Education: Lessons from
PISA for the United States. OECD, Paris.
OECD (2010f) Innovation to strengthen growth and address global and social challenges.
OECD, Paris
OECD (2010g) Regulatory reform for recovery: Lessons from implementation during crises.
OECD, Paris.
OECD (2010h) Economic Outlook 88 database, OECD, Paris. Available:
http://stats.oecd.org/index.aspx [Accessed 13th December 2010]
ONS (2010) Time Series Data, ONS, London. Available:
http://www.statistics.gov.uk/statbase/tsdtimezone.asp [Accessed 21 February 2011]
Overman, H. Gibbons, S. and Pelkonen, P. (2010) Wage Disparities in Britain, People or
Place? SERC Discussion Paper 60.
Oxford Economics (2009) ‘Will the Recession Bring About a Rebalance of the UK
Economy?’ in Economic Outlook, Vol. 33, No. 3, pp. 18-27.
Pike, A., Rodríguez-Pose, A. and Tomaney, J. (2006) Local and Regional Development.
Routledge, Oxfordshire.
Policy Exchange (2009) Controlling Government Spending and Government Deficits:
lessons from history and international experience. Policy Exchange, London.
Policy Exchange (2010) Innovation and Industry: A Manifesto for Manufacturing. Policy
Exchange, London.
PriceWaterhouseCoopers (2009) Impact of RDA spending: National Report, Vol. 1, Main
Report. Department for Business, Industry and Skills, London.
Passenger Transport Executive Group, PTEG (2010) Transport and Social Inclusion: Have
we made the connections in our cities? Leeds: pteg.

Rebalancing the economy sectorally and spatially: An evidence review
125
Roberts, M. and Setterfield, M. (2007) Endogenous regional growth: a critical survey. Centre
for Economic and Public Policy, University of Cambridge.
Rode, P. et al. (2010) Munich Metropolitan Region: Staying ahead on innovation. LSE Cities.
LSE, London.
Sakong, I. and Koh, Y. (eds.) (2010) The Korean Economy: Six decades of growth and
development. Korea Development Institute, Seoul.
SCDI (2010) Blueprint for Scotland: Action plan for growth, SCDI, Glasgow.
Scitovsky, T. (1959) ‘Growth – Balanced or Unbalanced?’ in Abramovitz et al. (eds.) The
Allocation of Economic Resources. Stanford University Press, Stanford.
Seldadyo, H., Nugroho, E. and De Haan, J. (2007) 'Governance and Growth Revisited', in
Kyklos, Vol. 60, No. 2, pp. 279-290.
Sissons, A. and Brown, C. (2011) Do Enterprise Zones Work? An Ideopolis Policy Paper.
The Work Foundation, London.
Simmie, J. and Carpenter, J. (2008) ‘Towards an evolutionary and endogenous growth
theory explanation of why regional and urban economies in England are diverging’, in
Planning, Practice and Research, Vol. 23, No. 1, pp. 101–124.
SNN (2005) Strategic Agenda for the Northern Netherlands 2007 – 2013. Northern
Netherlands Provinces, Groningen.
SNN (2011) Position Paper: The Northern Netherlands and the EU 2020. Northern
Netherlands Provinces, Groningen.
Social Policy Research Centre (1996) Economic crisis and social policy in Finland in the
1990s, University of New South Wales, Sydney.
Spitz-Oener A. (2007) ‘Human capital, job tasks and technology in East Germany after
reunification’, in National Institute Economic Review, Vol. 201, No. 1, pp. 97-106.
Suonpera, R. (2009) Lessons for Ireland from the Finnish Crisis – a paper for the Dublin
Economic Workshop. Kenmare, 16 October 2009.
Swinney P., Larkin K. and Webber C. (2010) Firm Intentions: Cities, Private Sector Jobs and
the Coalition. Centre for Cities, London.
The Economic and Social Research Council (2010) ‘rebalancing’ Britain’s Public Finances.
The Economic and Social Research Council. London.

Rebalancing the economy sectorally and spatially: An evidence review
126
The Economist (2010a) ‘Rebalancing Act’ in The Economist, 7th April 2010.
The Economist (2010b) ‘The global revival of industrial policy - Picking winners, saving
losers’, in The Economist, 5th August 2010.
The Economist (2011) ‘Gaponomics – regional disparities’, in The Economist, March 12th-
18th 2011.
The ERA Foundation (2010) The Sustainability of the UK Economy in an Era of Declining
Productive Capability. 4th Report. The ERA Foundation, Surrey.
The Korea Herald, Korea Research Institute for Human Settlements (2010) Korea’s
Territorial Policy. The Korea Herald and Korea Research Institute for Human
Settlements, Seoul.
The Work Foundation (2010) Shaping up For Innovation: Are We Delivering the Right Skills
for the 2020 Knowledge Economy. A Knowledge Economy Programme Report. The
Work Foundation, London.
Tödtling, F. and Trippl, M. (2005) 'One size fits all? Towards a differentiated regional
innovation policy approach', in Research Policy, Vol. 34, No. 8, pp. 1203-1219.
Tomaney, J. (2009) The future of regional policy. The Smith Institute, London.
Uhlig J. (2006) ‘Regional labor markets, network externalities and migration: the case of
German reunification’, in American Economic Review, Vol. 96, No. 2, pp. 383-387.
UK Commission for Employment and Skills (2010) Ambition 2020: World Class Skills and
Jobs for the UK. UK Commission for Skills and employment, Wath Upon Dearne.
Van Ravesteyn, N. and Evers, D. (2004) A survey of EU politics and its impact on spatial
development in the Netherlands. Netherlands Institute for Spatial Research, The
Hague.
Ward, M. (2011) Rrebalancing’ the economy: prospects for the North. The Smith Institute,
London.
Wolf, M. (2010) ‘Only ‘rebalancing’ will revive Britain’s precarious economy’, in The Financial
Times, April 14th 2010.
World Bank (2009) World Development Report 2009: Reshaping Economic Geography.
World Bank, Washington DC.
World Economic Forum (2010) The Global Competitiveness Report 2010–2011, Geneva Switzerland.

Rebalancing the economy sectorally and spatially: An evidence review
127
Appendix A: Towards a typology of ‘rebalancing’ interventions Typology purpose
As highlighted in the main body of the report, there has been a wide variety of policies and
interventions implemented over the years in the UK and abroad to address issues of sectoral
and/or spatial imbalance even though most were not described as ‘rebalancing’ interventions
at the time they were introduced.
The first purpose of a typology was therefore to enable the wide variety of interventions
reviewed by this study to be summarised. In addition, the typology also needed to
characterise interventions in ways that would facilitate the identification of systematic
differences between the interventions a) over time and in different political or national contexts
and b) in terms of their relative success or failure.
Key features
The literature provides many examples of typology designs and these have been drawn on to
develop the typology adopted for this study. What is clear from the literature is that there are
many factors that could be taken into account in designing a typology and that the selection of
the key factors has changed as our understanding of what makes interventions effective
improves.
In particular, there has been a shift in recent times to what has been described as a new
paradigm for thinking about policy interventions and the actions that flow from them. This has
been emerging for a while but found most recent and full expression in the Barca report to the
European Commission on its social cohesion policy (Barca, 2009). The contrast between the
new and the traditional paradigm of policy intervention has been adapted in a summary form
in the figure below.
Intervention features
Traditional spatial paradigm New spatial paradigm
Rationale Government seeks to deal with market failures and equity issues directly where they arise - sectorally, spatially
Less emphasis on dealing directly with failures; more emphasis on providing public goods, internalising externalities and addressing uncertainties
Objectives Compensating for locational disadvantage
Tapping underutilised potential to build local capacities to choose and develop – e.g. through supply chains

Rebalancing the economy sectorally and spatially: An evidence review
128
Intervention features
Traditional spatial paradigm New spatial paradigm
Unit of intervention
Administrative units – e.g. LAs, RDAs
Functional economic areas
Strategies Spatially focused support Integrated strategies including regulation as well as other incentives
Tools Emphasis on advice and support provision, subsidies and state aids
Creating conditions, in particular human and hard capital infrastructure. Coordination between actors. Reduced emphasis on subsidies and more on incentives.
Actors Central government and their agencies
Appropriate spatial or sectoral level through partnerships and engagement of private and voluntary sectors
The table also demonstrates the number of dimensions by which policy interventions might be
characterised from their rationale and objectives to the intervention tools and actors. In
addition, account needs to be given to the ways in which the target beneficiaries of
interventions can be characterised.
Thus, the rationale for the new paradigm suggested by Barca is that local economies and
communities, defined in terms of functional economic and social geographies, may have
become locked in to path dependency. Areas may lack the capacity to innovate, they may lack
the willingness to innovate and, even where they have both, it may not be sufficient to bring
about change. But, according to Barca, there is a balance to be struck between subsidiarity
(tailoring interventions to the relevant local context) and what he calls conditionality; the need
for the intervention to break up local institutional traps and promote innovation.
This new paradigm was also reflected in novel ways of thinking about sectors of economic
activity. McKinsey (2010) suggests that sectors can be organised into six groups according to
their degree of tradeability and product differentiation: infrastructure, local services, business
services, resource intensive sectors, manufacturing and R&D intensive manufacturing. A
related line of argument in the literature is that sectors of the economy can be differentiated by
the way they use and generate technological change with activity in some sectors being more
likely to result in learning and spin-off effects for other sectors. These sectoral groupings can
be subject to path dependency and, following the distinction that Barca draws between
subsidiarity and conditionality in spatial interventions, there is a balance to be struck between
tailoring interventions to specific sectoral circumstances and ensuring that they disrupt
inherited institutional and innovative barriers within the sectors.

Rebalancing the economy sectorally and spatially: An evidence review
129
Final typology
Given these developments in the thinking about spatial and sectoral interventions, and their
multi-dimensional complexities, it is difficult to develop a typology based on just a few
dimensions. However, two such typologies have been proposed in recent literature that have
sought to take on board the new paradigm.
The first was developed by Campagni in Regional Competitiveness: Towards a Concept of
Territorial Capital (Campagni, 2008) and is summarised (in slightly modified form) in the figure
below.
Deg
ree
of ri
valry
Private goods
Private sector fixed capital
Private sector R&D and HEI links Human capital
Externalities and club goods
Supply chains, science parks Cooperative networks Relationship capital
Public goods Public sector infrastructure investments
Agglomeration economies Social capital
Tangible Mixed Intangible
Degree of materiality
The vertical axis of the matrix denotes the extent of competition and rivalry involved in the
intervention. So, the provision of public goods represents the lowest degree of rivalry and
provision of private ‘goods’ the highest. The horizontal axis reflects the degree to which the
outcomes from the intervention are tangible (easily specified and measurable) and intangible.
Territorial capital is represented according to Campagni by the shaded cross in the matrix,
acknowledging the important role played by effective interventions in developing more
intangible cooperative networks and social capital at local levels.
The second typology is drawn from McKinsey (2010), where the approach is developed in the
context of sectors rather than spatial areas. McKinsey depicts the vertical axis in a way that is
similar to Campagni in that it differentiates between the role of the public sector relative to the
private sector. Whilst, Campagni describes this in terms of degrees of rivalry, McKinsey sees
it in terms of the relative role and purpose of public sector intervention, as follows:
• Setting the ground rules, and strategic direction and promoting the efficient
operation of the market - providing a framework of regulation and taxation within
which the market is allowed to operate freely (e.g. a tax credit for investment).

Rebalancing the economy sectorally and spatially: An evidence review
130
• Building enablers and the conditions for growth - investing in public goods or where
supply of market goods and services involve substantial externalities - either by
direct provision or funding of others to provide (e.g. provision of training or funding
of business R&D).
• Tilting the playing field and/or playing the role of principal actor or agent - supporting
or protecting certain market players by virtue of their sector and/or location and/or
by who they happen to be (e.g. a specific firm) and/or providing the market goods
and services itself (e.g. public ownership).
McKinsey then plots these categories of intervention against the six sectoral categories,
suggesting for example that the public sector might be justified in tilting the playing field/acting
as principal agent with regard to infrastructure sectors and building enabling conditions with
regard to manufacturing.
For the purposes of this study, we have adopted a typology that combines the Campagni and
McKinsey approach by joining the vertical axis from McKinsey and the horizontal axis from
Campagni. The resultant typology, which has been used to frame the study’s thinking, is as
follows:
Tangible Mixed Intangible
Setting the ground rules and strategic direction promoting the efficient operation of the market
Building enablers and the conditions for growth
Tilting the playing field/ playing the role of principal actor/agent
This matrix distinguishes the different roles that can be played by the public sector and
acknowledges that its influence can take an intangible form that can often be as powerful as
its more tangible manifestations. The matrix can be populated by different types of
intervention.

Rebalancing the economy sectorally and spatially: An evidence review
131
Examples of ‘rebalancing’ interventions
The Section below provides more detailed descriptions of actions from the literature reviewed
for this study which could not be summarised in the main report. This includes six of the nine
cells of the typology matrix. However, three cells have been covered sufficiently in the main
report and therefore we do not provide additional material here.
Table B.1 Setting the ground rules – intangible actions
Examples
• Flexicurity – in order to achieve objectives of the Lisbon Strategy new forms of
flexibility and security around the labour market are needed which are mutually
supportive. Emphasis needs to change from job security to employment
security, flexible and reliable contractual arrangements, comprehensive lifelong
learning (LLL) strategies, effective active labour market policies (ALMP), and
modern, adequate, and sustainable social security systems. In Sweden,
flexicurity policy involved Career Transition Agreements to support workers who
are made redundant by providing counselling, career guidance, education and
training and business start-up advice. In Finland, the government introduced
the concept of ‘change security’ which provided redundant workers with greater
financial security during the transition period and aimed to increase cooperation
between employers, employees and labour authorities to support a quick return
to work.
• Well established intellectual property (IP) rights systems have been established
to support the UK’s Life Sciences sector.
• In the Netherlands, a tax refund of 15 per cent of a trainee’s wage is available
for employers which have their workplaces accredited by the sector council.
• Planning rules that influence a city size to encourage external economies of
scale/agglomeration. This has been important in the development of the UK’s
financial and creative sectors.
• Labour market deregulation has been adopted in New Zealand, although this
reduced productivity by increasing job insecurity and reducing morale.

Rebalancing the economy sectorally and spatially: An evidence review
132
• According to the OECD, the role of the central government is increasingly
important for providing an overarching and co-ordinating framework for regional
development policies. Examples include: creating the Ministry of Employment
and Economy in Finland, merging the units for regional development from the
Ministries of Trade and Industry, Labour, and the Interior; the Comprehensive
National Territorial Plan in Korea which covers strategic planning and
programming to co-ordinate diverse issues and interests across sectors; the
Spatial Economic Policy Directorate of the Ministry of Economic Affairs in the
Netherlands which provides planning and advisory support to help ensure
policy coherence across sectors at the central level.
• Currency depreciation to aide export growth and therefore assisting in macro
level rebalancing, e.g. Finland.
• Regulation e.g. carbon pricing.
• Attempts to encourage residential mobility have included making it easier for
the social rented sector to move by centralising information about housing and
job opportunities in the UK and the experience in Germany and Sweden of
including requirements on geographic mobility as part of unemployment
benefits eligibility criteria.
• Curbing rising prices in land and real estate, promoting construction of housing
to create new cities, deregulation of land use policies, e.g. Korea.
• Korean government ‘provided’ favourable exchange rate to drive exports.
• Denmark’s Regional Growth Forum, which improved governance structure
between levels of government and across sectors.
• Pan-regional / joint co-operation and co-ordination between places, e.g.
Northern Way and city regions.
• Regional Economic Performance Public Service Agreements in England.
Source: Various

Rebalancing the economy sectorally and spatially: An evidence review
133
Table B.2 Building enablers/conditions for growth – tangible actions Examples
• A wider German fiscal stimulus package which includes infrastructure
investment in schools and roads.
• In tandem with sectoral policies, the East Asian governments established
several large industrial estates in lagging areas to create ‘production
agglomerations’.
• The provision of targeted infrastructure in the form of industrial estates, science
parks and technology centres has also been traditional in many countries (e.g.
Belgium, the Netherlands).
• Germany has invested heavily in strategic transport infrastructure, following the
modernisation of transportation systems and upgrading derelict sites for new
inward investment companies during the mid 1960s to mid 1970s.
• Substantial investment in human resources through the foundation of 40 new
secondary schools in the Ruhr in Germany and investment in five new
universities (Dortmund, Bochum, Essen, Duisburg and Hagen), providing a
fundamental expansion of the higher education system with a focus on applied
sciences.
• Early territorial plans in Korea which included investments in large industrial
complexes/parks and transport infrastructure.
• The work of England’s RDAs included infrastructure on inward investment sites,
development of physical innovation infrastructure, and the development of
science parks (under their business development and competitiveness theme).
The RDAs also engaged in bringing land lack into use (e.g. to enable
redevelopment for offices, business parks, entertainment, leisure facilities,
housing and other uses, and address contaminated land, fragmented land
ownership/develop partnerships), improving the public realm (for example,
improving build environment, streetscape, quality of physical infrastructure),
and transport and community transport projects.

Rebalancing the economy sectorally and spatially: An evidence review
134
• The English Coalfields programme involved physical reclamation and renewal
(alongside community capacity rebuilding and human capital development, and
the promotion of enterprise and business growth).
• The provision of transport infrastructure to promote economic development has
long been an important element of regional policy in countries characterised by
long distances and difficult topologies such as Australia, Canada, Greece,
Japan and the Nordic countries.
• Germany invested in social housing in 1990s in contrast to most countries.
Source: Various
Table B.3 Building enablers/conditions for growth – mixed actions
Examples
• Provision of elite research universities with world class departments in the key
sciences, together with public funding for research has been an important
aspect of UK government intervention in the pharmaceuticals industry.
• Skills policies have played an important role in the development of the UK’s
creative sector. Businesses have benefitted from graduates of part-funded
government courses in specialist videogames fields and broader STEM and
Arts degrees.
• Manufacturing Advisory Service in UK, which assists businesses to achieve
improvements in productivity by overcoming limited access to affordable best
practice information and advice.
• Seedcamp, a technology accelerator vehicle created to ‘jumpstart’ the
entrepreneurial community in the UK, where young entrepreneurs get advice
and input from experienced mentors, and combine this with seed funding in
exchange for equity.
• British Library’s Business and IP centre, launched in 2006 with £1m investment
from LDA, was a source of information on IP, helping entrepreneurs to identify
how novel their idea is, as well as market potential and competition base. The
centre also offers training courses and meeting space.

Rebalancing the economy sectorally and spatially: An evidence review
135
• In the US, the rebirth of old industries is now organised around clusters of
SMEs producing for high value added niche markets, which has been a product
of investments in research and development and in the workforce.
• The Netherlands’ Peaks approach, which promotes regional innovation clusters
of national significance.
• Cluster policies, growth poles and similar instruments to build cooperation and
share knowledge between firms, especially SMEs. Examples include Finland’s
Centres of Expertise, which focuses on regional specialisation, innovation
networks, and collaboration between research/HE and businesses. Finland has
also made a long-term commitment to education (especially in natural
sciences/engineering), apprenticeships and on the job training, and increased
HE places to address skills shortage in the country’s priority sector.
Competitive Poles have also been favoured in France, and Germany has
placed an emphasis on a cluster-based approach designed to “make strengths
stronger”.
• In Norway, ‘narrow’ regional policy focuses on competitiveness factors such as
entrepreneurship, innovation, competences and networks, while ‘broad’
regional policy focuses on public service provision and related accessibility.
• The European Social Fund is targeted at removing barriers to employment
amongst unemployed and inactive people, particularly women, young people,
older and low-skilled workers.
• Lifelong learning Policy, an element of the Lisbon Strategy, is designed to help
economies deal with restructuring and respond to change through increasing
the quality and availability of education and training in lagging regions. This
promotes strong links between training and businesses so that training reflects
labour market demand.
• European Globalisation Adjustment Fund helps those having to adjust to the
consequences of globalisation, which supports active labour market policies.
• European Cohesion Policy supports a shift towards higher value added
activities and more knowledge-based work through investments in business
infrastructure and services and training, investments in R&D and innovation.

Rebalancing the economy sectorally and spatially: An evidence review
136
• UK programmes such as Enterprise Investment Scheme, the Enterprise
Management Incentive and the Early Growth Funds provided financial support
arrangements for start-ups.
• Investment in regional innovation systems that aim to build innovation capacity
at the local level has been implemented in Korea.
• Labour Market Boards and Active labour market policies have been adopted in
Sweden (funded nationally, but operating regionally and locally) which pursue
active policies to train people in the appropriate skills for the types of jobs
forecast to grow.
• Swedish innovation policies include VINNOVA (the Swedish Innovation
Agency), the Swedish Research Council, incorporating humanities, social
sciences, natural sciences and technology and medicine, the Swedish Defence
Research Agency, with the remit of driving R&D as a way to encourage
innovation, and NUTEK, the Swedish Business Development Agency, which
aims to keep regulation simple and practical so that it encourages effective and
efficient competition, but also has an important role in defining and progressing
cluster programmes.
• Malaysia has focused education and training on higher levels of knowledge and
entrepreneurial skills and technical and engineering education. The government
has established two technical universities and community colleges to
encourage lifelong learning and introduced a Human Resources Development
Fund (HRDF) which provides subsidised training of workforce, funded by low
skill, low wage industries to encourage employers to retrain workers.
• Øresund Science Region (as mentioned above).
• England’s Coalfields Programme involves community capacity rebuilding and
human capital development, and the promotion of enterprise and business
growth (alongside physical reclamation and renewal, mentioned above).
• The Phoenix Fund which includes the Development Fund, the Challenge Fund
and Loan Guarantees to help resource local Community Development Finance
Initiatives.

Rebalancing the economy sectorally and spatially: An evidence review
137
• UK policies including ‘Train to Gain’ (government assisted firms to fund their
training plans), Skills Accounts (where individuals have set amounts to ‘spend’
on training in the workplace), and the establishment of the National
Apprenticeship Service.
Source: Various
Table B.4 Building enablers/conditions for growth – intangible actions
Examples
• The Business Volunteer Mentoring Association (BVMA) element of the Phoenix
Fund which is a national network of volunteer mentors for pre- and early stage
business start-ups.
• Creative Business Mentor Network was set up in the UK to nurture creative
businesses in the TV production, advertising and digital media sectors with an
appetite for growth. Companies benefit from one-to-one mentoring by some of
the most successful business people in the sector. Experienced mentors share
practical advice on overcoming challenges of growing businesses in the sector.
Participation in the programme is free for mentees and the mentors are unpaid.
• Danish Gazelles programme was established in 2007 by Danish Agency for
Science, Technology and Innovation to identify 40-50 start-ups or small
enterprises with international growth potential, and help them reach it.
Companies are teamed up with expert international mentors from the private
sector, and take part in a series of training and development camps. These
focus on particular aspects of growth strategies, from business model
development to market testing, and creating international networks to monitor
and adjust growth strategies over time.
• In Daegu, Korea, the Milano Project was introduced which aimed to promote
new activities (fashion and design), and introduce new economic actors to the
region such as research institutes, universities, design schools, and banks.
• In Finland, the government has helped to foster strong local links to the wireless
industry to create favourable demand conditions.

Rebalancing the economy sectorally and spatially: An evidence review
138
• ESF, ERDF and cohesion funds aim to support economic and social cohesion
during sectoral restructuring processes.
• Korea’s fourth territorial plan (2000 – 2020) refers explicitly to the objective of
balanced territory and includes investment in regional innovation systems that
aim to build innovation capacity at the local level.
• Networks also form a key feature in Finland’s Centres of Expertise and
Øresund Science Region.
• Cross-border cooperation, including cultural connections and business links in
the identified growth sectors, are an important feature of policy in the
Netherlands.
• Pan-regional / joint co-operation and co-ordination between places – the
Northern Way and city regions.
Source: Various
Table B.5 Tilting the playing field/playing role of principal actor – tangible actions
Examples
• Government as a ‘smart purchaser’ e.g. stimulating demand in lagging regions.
• Expansion of public services and creation of public sector jobs e.g. historical
experiences in UK since 1980s.
• Investment subsidies to attract FDI and inward investment e.g. UK in the 1960s
and 1970s; Germany, Finland and Italy today.
• Regional Selective Assistance and Selective Finance for Investment in England
from 2000 onwards, which provided financial assistance to establish new
businesses, expand/modernise/rationalise a business, set up R&D facilities,
enable businesses to take the next step from development to production. The
size of the scheme in the regions is skewed towards lagging regions.

Rebalancing the economy sectorally and spatially: An evidence review
139
• Building government owned industries in lagging regions e.g. The Swedish
government attempted to address the north-south imbalance by building a new
Swedish Air Force in the north of the country, helping counteract the defence
cuts seen in the area.
• Relocation of government functions to lagging regions e.g. Korea.
• Deconcentration of quasi-public functions e.g. deconcentration of university
clusters in Sweden.
• Urban Development Corporations e.g. UK in the 1980s and 1990s.
• Provision of ‘launch investment’ to attract/determine the location of investments
e.g. UK civil aerospace industry.
• Government subsidised sectors e.g. shipbuilding in Germany, and the
associated government investment of more than DM 6 billion in the construction
of new docks over a five year period.
• City Challenge in the UK in the 1990s, which was designed to attract outside
investment, and create a climate of environmental quality and enterprise
culture.
Source: Various
Table B.6 Tilting the playing field/playing role of principal actor – mixed actions Examples
• The RECHAR programme, adopted in 1989 to support coal mining areas hit by
the decline of the industry and the RESIDER programme supported areas
where the steel industry had lost more than 1,000 jobs. In both programmes
funding was available for conversion of buildings, support for new economic
activities, promoting tourism, organisations supporting regional development,
support for training and employment, interest subsidies on loans for small
businesses.

Rebalancing the economy sectorally and spatially: An evidence review
140
• The KONVER programme supported regions where there had been a decline in
the defence industry and RETEX supported areas dependent on textiles and
clothing industries. Both supported economic diversification, advisory services,
networking and partnership schemes, business audits, and training for
employees made redundant.
• Germany has earmarked €500 million support for research programmes in new
energies in the automobile industry (with a focus on electro-mobility) and
another €500 million for the Hydrogen and Fuel Cell Technology Innovation
Programme (launched in 2006).
• Within Germany’s construction sector, from 2006 to 2009, a total of €5.6 billion
of federal funding was destined for the energy-conserving refurbishment of the
housing sector, including €200 million investments a year earmarked for the
building refurbishment programme to reduce CO2 emissions.
• In the Northern provinces of the Netherlands, ‘spearhead sectors’ have been
identified for targeted support, which include agribusiness, chemistry,
commercial care for elderly people, life sciences, IT, shipbuilding and tourism
(areas in which this region already has some acquired competencies).
• The UK’s £750 million Strategic Investment Fund, which will focus investment in
a range of growth sectors and areas of strength, such as advanced
manufacturing, life sciences, low carbon energy, vehicles and construction,
creative and digital industries.
• Munich’s approach to ‘picking winners’, and greening the economy by
promoting innovation in green goods and services.
• France launched a heavily interventionist policy in March 2010, aiming to
increase manufacturing output by a quarter over five years. Prior to this, there
are examples of the French government stepping in to preserve specific firms
and sectors.
• The Swedish government encouraged the relocation of telecoms firms to the
Northern periphery.

Rebalancing the economy sectorally and spatially: An evidence review
141
• Part of Korea’s fourth territorial plan (2000 – 2020) refers explicitly to the
objective of balanced territory, and achieving this through growth in green
sectors. The government also attempted to create a new fashion and design
cluster in Daegu (South Korea) to encourage a shift up the value chain for the
existing textile sector.
• The British policy of ‘picking winners’ through selective industrial policies of the
1960s and 1970s.
Source: Various

Rebalancing the economy sectorally and spatially: An evidence review
142
Appendix B: Description of the MDM-E3 Model Introduction
MDM-E3, the Multisectoral Dynamic Model of the UK economy, is maintained and developed
by Cambridge Econometrics (CE) as a framework for generating forecasts and alternative
scenarios, analysing changes in economic structure and assessing energy-environment-
economy (E3) issues and other policies. MDM-E3 provides a one-model approach in which
the detailed industry and regional analysis is consistent with the macroeconomic analysis: in
MDM-E3, the key indicators are modelled separately for each industry sector, and for each
region, yielding the results for the UK as a whole. MDM-E3 is one of a family of models which
share the same framework, general design, methodology and supporting software; the scope
of the E3ME model is European; that of E3MG is global.
MDM-E3 is highly disaggregated to analyse structure
To analyse structure, the E3 models disaggregate industries, commodities, and household
and government expenditures, as well as foreign trade and investment, and the models
incorporate an input-output framework to identify the inter-relationships between industry
sectors. The E3 models combine the features of an annual short and medium-term sectoral
model estimated by formal econometric methods with the detail and structure of input-output
models, providing analysis of the movement of the long-term outcomes for key E3 indicators in
response to economic developments and policy changes. The models are essentially dynamic
simulation models estimated by econometric methods.
An essentially Keynesian logic determines output and employment
MDM-E3 retains an essentially Keynesian logic for determining final expenditure, output and
employment. The principal difference, compared with purely macroeconomic models, is the
level of disaggregation and the complete specification of the accounting relationships in supply
and use tables required to model output by disaggregated industry.
Time-series econometric equations estimate behavioural relationships
The parameters of the behavioural relationships in MDM-E3 are estimated econometrically
over time, within limits suggested by theory, rather than imposed from theory. The economy is
represented as being in a continual state of dynamic adjustment, and the speed of adjustment
to changes (in, for example, world conditions or UK policies) is based on empirical evidence.
There is therefore no assumption that the economy is in equilibrium in any given year, or that
there is any automatic tendency for the economy to return to full employment of resources.

Rebalancing the economy sectorally and spatially: An evidence review
143
In summary MDM-E3 provides:
• annual comprehensive forecasts to the year 2030
for industry output, prices, exports, imports and employment at an industry level
for household expenditure by 51 categories
for investment by 27 investing sectors
output, employment and aggregate components of expenditure for the nine Government Office Regions, Wales, Scotland and Northern Ireland
• projections of energy demand and emissions, by 25 fuel users and eight main fuel
types (in all, 11 fuels are distinguished)
• full macro top-down and industrial bottom-up simulation analysis of the economy,
allowing industrial factors to influence the macro picture
• an in-depth treatment of changes in the input-output structure of the economy over
the forecast period to incorporate the effects of technological change, relative price
movements and changes in the composition of each industry's output
• scenario analysis, to inform the investigation of alternative economic futures and the
analysis of policy
Economy
The purpose of MDM-E3 is to abstract the underlying patterns of behaviour from the detail of
economic life in the UK and represent them in the form of a key set of identities and equations.
In a complex system, such as the UK economic system, the abstraction is very great. In any
economic model the initiatives, responses and behaviour of millions of individuals are
aggregated over geographical areas, institutions, periods of time and millions of
heterogeneous goods and services into just a few thousand statistics of varying reliability.
The aim of MDM-E3, then, is to best explain movements in the data and to predict future
movements under given sets of assumptions.
A key contribution of the approach to modelling the UK economy in MDM-E3 is the level of
disaggregation. The macroeconomic aggregates for GDP, household expenditure, fixed
investment, exports, imports, etc are disaggregated as far as possible without compromising
the available data.
One reason for disaggregation is simply that it is necessary to answer certain questions of
economic interest. Some macroeconomic questions are intrinsically structural and if they are
to be answered using a model then it must be disaggregated in some way. The

Rebalancing the economy sectorally and spatially: An evidence review
144
disaggregation of agents and products is crucial in trying to understanding the behavioural
responses of heterogeneous agents as it reduces the bias encountered in estimating
aggregate relationships.
The principal economic variables in MDM-E3 are:
• the final expenditure macroeconomic aggregates, disaggregated by product,
together with their prices
• intermediate demand for products by industries, disaggregated by product and
industry, and their prices
• value added, disaggregated by industries, and distinguishing operating surplus and
compensation of employees
• employment, disaggregated by industries, and the associated average earnings
• taxes on incomes and production, disaggregated by tax type
• flows of income and spending between institutions sectors in the economy
(households, companies, government, the rest of the world)
Some variables are also disaggregated by Government Office Region and Devolved
Administrations. This applies particularly to value added, employment, wages, household
incomes and final expenditures. Prices are not disaggregated by region, because of data
limitations.
National accounts
A social accounting framework is essential in a large-scale disaggregated economic model.
The early versions of MDM were based on the definitions and estimation of a Social
Accounting Matrix (SAM) for the UK and its associated input-output tables and time-series
data. The principles of SAM have been extended and elaborated in detail in the UN’s revised
System of National Accounts (SNA). Accordingly we now use the SNA for the accounting
framework for the data and the model.
The national accounts provide a central framework for the presentation and measurement of
the stocks and flows within the economy. This framework contains many key economic
statistics including Gross Domestic Product (GDP) and gross value added (GVA) as well as
information on, for example, saving and disposable income.

Rebalancing the economy sectorally and spatially: An evidence review
145
The national accounts framework makes sense of the complex activity in the economy by
focusing on two main groupings: the participants of the economy and their transactions with
one another.
Units are the individual households or legal entities, such as companies, which participate in
the economy. These units are grouped into sectors, for example the Financial Corporations
sector, the Government sector and the Household sector. The economic transactions
between these units are also defined and grouped within the accounts. Examples of
transactions include government expenditure, interest payments, capital expenditure and a
company issuing shares.
The national accounts framework brings these units and transactions together to provide a
simple and understandable description of production, income, consumption, accumulation and
wealth. These accounts are constructed for the UK economy as a whole, as well as for the
individual sectors in the Sector Accounts.
Since 1998 the National Accounts have been consistent with the European System of National
Accounts 1995 (ESA95). The ESA95 is the European implementation of the International
System of National Accounts 1993 (SNA93) developed by the UN to ensure a common
framework and standards for national accounts, including input-output analyses, sector
accounts and constant-price analyses. The ESA95 was developed to reflect the changing role
of government, the increased importance of service industries and the increased diversity of
financial instruments. It recognises the wider scope of capital formation, by using concepts
such as intangible assets.
The determination of output
The determination of output in MDM-E3 can be divided into three main flows of economic
dependence:
• The output-investment loop includes industrial demand for goods and services
and runs from total demand to output and then to investment and back to total
demand. Total demand for the gross output of goods and services is formed from
industrial demand, household expenditure, government demand, investment (fixed
domestic capital formation and stockbuilding) and exports. These totals are divided
between imports and output depending on relative prices, levels of activity and
utilisation of capacity.
• The income loop, industrial output generates employment and incomes, which
boosts household expenditure, thereby adding to total demand. Changes in output

Rebalancing the economy sectorally and spatially: An evidence review
146
are used to determine changes in employment, along with changes in real wage
costs (explained by price levels and conditions in the labour market), interest rates
and energy costs.
• The export loop links the UK (regional) economy to the rest of the world (UK). For
example, an increase in export demand for UK-produced cars (most cars
manufactured in the UK are for export) leads to an increase in total demand,
resulting in both an increase in imports (eg of component parts) and an increase in
UK output. The increase in domestic output will be reflected in increased
employment (depending on the extent to which the demand can be met by boosting
productivity), which in turn leads to increased incomes, generating higher household
expenditure on goods and services and growth in total demand. Some of this
demand will be met by imports and some by domestic suppliers, and so on.
Household expenditure
Household expenditure is estimated at an aggregated level for each of the 12 UK regions
covered in MDM-E3 and then further disaggregated to the 51 expenditure categories which
relate to the COICOP classification. At the aggregate level regional consumption in real terms
is predominantly a function of regional real income.

Rebalancing the economy sectorally and spatially: An evidence review
147
This relationship is constrained to reflect the idea that expenditure cannot outgrow income
levels in the long term, although it is possible in the short term. The other key drivers of
regional consumption as defined in the equations are:
• the adjusted dwellings stock
• the OAP dependency ratio
• inflation
In the short run we also consider the effects of:
• unemployment - in the literature high levels of unemployment are linked to sharp
falls in household spending beyond the fall in household spending which can be
explained by an associated fall in real gross disposable income that the
unemployment would cause; this is explained in the literature by the uncertainty that
unemployment induces across a region
• real house prices - we assume here that there is a positive (negative) wealth effect
caused by increasing (decreasing) real house prices which causes consumption to
increase (decrease) in the short run
Regional consumption is then disaggregated further in the disaggregated regional equations
which take the main independent variable as regional consumption, which effectively reflects
the income effect on consumption (the parameter is restricted to be positive). The other
explanatory variables are relative prices in the form of the price of each category of household
spending compared to the overall price index for all items, this captures the price effect (the
parameter is restricted to be negative). The OAP and child dependency ratios are also
considered so as to reflect differing consumption patterns arising from changing demographic
structure in the different regions.
For the consumption categories that represent energy products, consumption in each region is
determined by applying the growth rate in UK fuel consumption (in energy units) from the fuel
user 'households' (or in the case of petrol - road transport) to the real consumption of gas,
electricity, coal, petrol and manufactured fuels. The fuel used by households and road
transport is derived from the energy and transport sub-models described later. Disaggregated
consumption is then scaled to match regional consumption at the aggregate level.
Household expenditure by expenditure category is then mapped to the 41 product categories
to derive domestic household demand by product category.

Rebalancing the economy sectorally and spatially: An evidence review
148
Investment
Among other elements such as social-capital formation, public and private sector dwellings
and legal fees, the most important element of gross fixed capital formation is the acquisition of
new buildings, plant and machinery and vehicles by industry.
Investment in MDM-E3 is treated quite differently to the neoclassical framework which relies
on the production function of firms and net present welfare maximisation based on equating
the user cost of capital with the marginal product of capital.
However, the neoclassical treatment leads to an unresolved conflict between the implied
costless switch between capital and employment and the observation that capital stock
adjustments are subject to significant time lags.
In MDM-E3 investment data are divided into 27 investing sector categories at the national
level. The national investment equations depend on industry output, which is converted from
the 41 industry sectors to the 27 investing sectors. The equations yield the result that an
increase in output will lead to an increase in investment. Typically, the investing sectors which
are most responsive to changes in output are the capital-intensive manufacturing-based
investment sectors such as Transport Equipment.
The investment equations are specified in the Engle-Granger co-integrating form and
therefore allow for the impact of the lagged investment and an error correction term allowing
adjustment to the long-term trend.
Government consumption and investment
Assumptions for government capital spending are used to forecast gross fixed capital
formation in the investing sectors relating to Health, Education and Public Administration.
Government final consumption expenditure is treated exogenously in MDM-E3 and is based
on the plans announced in the Comprehensive Spending Review and Budget statements.
Government transfers
Government revenues from taxes on income and production are inherently endogenous as
they rely on consumption and incomes. This duality is an important consideration in scenario
analysis. Increased tax revenues are not automatically recycled into the economy. Model
operators must decide where additional revenue should be spent. If additional tax revenues
are not spent they will, by definition, simply reduce the Public Sector Net Cash Requirement
(PSNCR), but this has no further effects on behaviour (for example, it is not assumed that

Rebalancing the economy sectorally and spatially: An evidence review
149
household spending responds to the prospect of higher or lower taxation in future as indicated
by the extent of government borrowing in the present).
Export demand
MDM-E3 has assumptions for 19 world regions, covering (among other factors) activity (GDP),
price levels and exchange rates. The world activity indices are the key drivers of export
demand, which is estimated across the 41 product categories. The result is that an assumed
change in US GDP growth will affect the products that are most traded with the US, depending
on the weighting of US demand in the world demand for UK exports and the responsiveness
of UK export demand to the change in the world activity index. The price of exports also
affects the level of export demand. To explain historical export volumes two dummy terms for
integration with the EU internal market are significant for 1974 and 1978.
Import supply
Import volumes are determined by domestic demand and import prices relative to domestic
prices. A capacity utilisation constraint is also considered in the short term.
Interdependencies between industry sectors: the input-output framework
Input-output supply and use tables (SUTS) provide a framework to make consistent estimates
of economic activity by amalgamating all the available information on inputs, outputs, gross
value added, income and expenditure. For a given year, the input-output framework breaks
the economy down to display transactions of all goods and services between industries and
final consumers (eg households, government) in the UK. Since 1992, ONS has used the
input-output process to set a single estimate of annual GDP and ONS has published the
detailed analyses in the SUTS.
The information from the regular releases of SUTS are used in conjunction with the more
detailed analytical tables (last published for 1995) to construct the inputs that are required for
the MDM model. An input-output table has been estimated from official data to provide the
detail needed to model inter-industry purchases and sales.
The input-output coefficients derived from the SUTS allow intermediate demand to be derived
for each product given the final demand at the product level of disaggregation.
Employment
The employment equations for MDM-E3 are based on a headcount measure of employment
rather than on a full-time equivalent basis. The employment equations are specified by region

Rebalancing the economy sectorally and spatially: An evidence review
150
and industry. The two main drivers of employment are gross output and the relative wage
costs as measured by industry wages relative to industry prices.
The determination of prices
In MDM-E3 assumptions are made for world prices and exchange rates. These are then used
to determine import prices, which are one element of the cost to the UK’s industries of bought-
in inputs. The other element is, of course, the cost of the UK’s own production. Unit material
and labour costs determine industry output prices. Consumer prices, then, depend partly on
import prices and partly on UK industry prices, together with taxes on products. Consumer
prices have an influence on average wage rates, as do labour market factors. Average
earnings and productivity are then used to determine unit labour costs. Export prices depend
partly on unit labour costs in the UK and partly on world prices (reflecting the extent to which
prices are set in world markets).
Previous versions of MDM have sought to include endogenous treatments for interest rates
and exchange rates but the inclusion of these specifications often led to increased instability
within the model. Recent versions of the model therefore rely on an exogenous treatment for
both exchange rates and interest rates. This has important consequences for scenario
analysis. For instance, unilateral UK action on carbon taxes might push domestic consumer
price inflation to a position where the Bank of England might take deflationary action by
increasing the repo rate. Similarly, exchange rates do not change in response to domestic
prices, the balance of payments, world prices, Treasury bill rates and so on.
Industry prices
Industrial prices are formed as a mark-up on unit costs with an allowance for the effect of the
price of competitive imports, technological progress and, in the short run part of the equation,
the effect of expected consumer price inflation. The supply side comes in through the
utilisation of capacity as measured by the ratio of actual output to normal output.
For many of the industries the dominant effect is industrial unit costs. However, import prices
can affect domestic prices in three different ways. First, by directly increasing industrial unit
costs, to the extent that industry inputs are imported. Second, as competitor prices so that
domestic prices tend to rise with import prices over and above any effect on costs. Third, as
import prices directly affect consumer price inflation and therefore the expectation of future
increases in import prices.

Rebalancing the economy sectorally and spatially: An evidence review
151
Import and export prices
Import and export prices play the role of transmitting world inflation to the UK economy
through its effect on export and import prices. Import and export prices are determined by
world product prices, the exchange rate, world commodity prices and unit cost. For export
prices in the short term there is also a supply-side effect which comes through the increases in
the utilisation of capacity. A measure of technical progress is also included to cope with the
quality effect on prices caused by increased levels of investment and R&D. Restrictions are
imposed to force price homogeneity and exchange rate symmetry on the long-term equations.
Consumer prices
Consumer prices are determined by import prices and industry prices and the respective
weighting of imports and domestic purchases in consumers’ expenditure, together with the
application of product taxes.
The aggregate consumer price index is assumed to have a positive relationship with wages,
such that an increase in prices should lead to an increase in wages. Productivity also has a
positive relationship with wages: if employees in an industry are able to increase value added
by increasing output for the same input then they are able to command higher wage rates.
Wages
The treatment of wages in MDM partly follows the typical wage bargaining model. The
opportunity from not working as expressed by unemployment benefit has a positive
relationship with wages as the benefit rate will mean that workers will want to gain sufficiently
more than the available benefit transfer to justify employment. In MDM-E3, again following the
wage bargaining models, unemployment levels also have an impact on wages: if
unemployment is high it follows that wages will be low as there is no incentive for employers to
pay an individual more when there are a large number of unemployed willing to work for a
lower salary.
The retention ratio term identifies the average real take-home pay for any given salary level.
The purpose of this is to simulate the characteristic of individuals operating in a way to make
sure that their net pay means they are equally well off following a change in tax. If income tax
increases, the retention ratio falls and wages rise to (fully or partially) compensate for the
higher tax rate.
In an attempt to understand relationships between wages within one industry but across
regions, or within one region but across industries, MDM-E3 also uses external industry wage

Rebalancing the economy sectorally and spatially: An evidence review
152
rates and external regional wage rates to estimate wage rates as a system. The idea is that if
wages in a region are increasing for all other industries that are not industry Y, then this
should drive an increase in industry Y wages, within the specified region. This argument is
then extended for one industry’s wages across all the regions. If the oil and gas industry
increases wage rates in all non-X regions, this will have an impact on the oil and gas industry
wages in region X.
Wage bills are calculated across region and industry by multiplying the average wage by the
number of full time equivalent (FTE) employees. Further key variables, such as the total wage
bill, average wage, average wage for a region and average wage for an industry are also
calculated.
MDM-E3 Industry Classification
MDM SIC07 SIC03 'Target' industry
1 Agriculture etc 01,02,03 01,02,05 2 Coal 5 10 3 Oil & Gas etc 06,09.2 11,12 4 Other Mining 07,08,09.1 13,14 5 Food, Drink & Tob. 10,11,12 15,16
6 Text., Cloth. & Leath. 13-15 17,18,19
7 Wood & Paper 16,17 20,21
8 Printing & Publishing 18 22 Digital & creative industries
9 Manuf. Fuels 19 23 10 Pharmaceuticals 21 24.4 Advanced manufacturing 11 Chemicals nes 20 24(ex24.4) 12 Rubber & Plastics 22 25
13 Non-Met. Min. Prods. 23 26
14 Basic Metals 24 27 15 Metal Goods 25 28
16 Mech. Engineering 27.4,27.5,28 29 Advanced manufacturing; low carbon
17 Electronics 26 excl. 26.5-26.7 30,32 Advanced manufacturing;
low carbon
18 Elec. Eng. & Instrum.
26.5 - 26.7,27,32.5 excl. 27.4,27.5
31,33 Advanced manufacturing; low carbon
19 Motor Vehicles 29 34 Advanced manufacturing
20 Oth. Transp. Equip. 30 35 Advanced manufacturing
21 Manuf. Nes 31,32,38.3 36,37 Low carbon 22 Electricity 35.1 40.1 Low carbon

Rebalancing the economy sectorally and spatially: An evidence review
153
MDM SIC07 SIC03 'Target' industry
23 Gas Supply 35.2,35.3 40.2,40.3 24 Water Supply 36 41 25 Construction 41-43 45 Low carbon 26 Distribution 45,46 50,51 27 Retailing 47 52 28 Hotels & Catering 55,56 55 29 Land Transport etc 49,52,79 60,63 30 Water Transport 50 61 31 Air Transport 51 62 32 Communications 53,61 64
33 Banking & Finance 64,66 65,67 Tradable services/Low carbon
34 Insurance 65 66 Tradable services
35 Computing Services 62,63 72
Tradable services/Digital & creative industries/Low carbon
36 Prof. Services 68-74 excl. 74.2,74.3
70,71,73,74.1-74.4
Tradable services/Digital & creative industries/Low carbon
37 Other Bus. Services
74.2,74.3,78,80-82 74.5-74.8
38 Public Admin. & Def. 84 75
39 Education 85 80
40 Health & Social Work 75,86-88 85
41 Misc. Services 37-39,94,96-98, excl. 38.3 90 to 93,95,99 Digital & creative
industries/Low carbon 42 Unallocated

Rebalancing the economy sectorally and spatially: An evidence review
154
List of previous publications Executive summaries and full versions of all these reports are available from www.ukces.org.uk Evidence Report 1 Skills for the Workplace: Employer Perspectives Evidence Report 2 Working Futures 2007-2017 Evidence Report 3 Employee Demand for Skills: A Review of Evidence & Policy Evidence Report 4 High Performance Working: A Synthesis of Key Literature Evidence Report 5 High Performance Working: Developing a Survey Tool Evidence Report 6 Review of Employer Collective Measures: A Conceptual Review from a Public Policy Perspective Evidence Report 7 Review of Employer Collective Measures: Empirical Review Evidence Report 8 Review of Employer Collective Measures: Policy Review Evidence Report 9 Review of Employer Collective Measures: Policy Prioritisation Evidence Report 10 Review of Employer Collective Measures: Final Report Evidence Report 11 The Economic Value of Intermediate Vocational Education and Qualifications Evidence Report 12 UK Employment and Skills Almanac 2009 Evidence Report 13 National Employer Skills Survey 2009: Key Findings Evidence Report 14 Strategic Skills Needs in the Biomedical Sector: A Report for the National Strategic Skills Audit for England, 2010 Evidence Report 15 Strategic Skills Needs in the Financial Services Sector: A Report for the National Strategic Skills Audit for England, 2010

Rebalancing the economy sectorally and spatially: An evidence review
155
Evidence Report 16 Strategic Skills Needs in the Low carbon Energy generation Sector: A Report for the National Strategic Skills Audit for England, 2010 Evidence Report 17 Horizon Scanning and Scenario Building: Scenarios for Skills 2020 Evidence Report 18 High Performance Working: A Policy Review Evidence Report 19 High Performance Working: Employer Case Studies Evidence Report 20 A Theoretical Review of Skill Shortages and Skill Needs Evidence Report 21 High Performance Working: Case Studies Analytical Report Evidence Report 22 The Value of Skills: An Evidence Review Evidence Report 23 National Employer Skills Survey for England 2009: Main Report Evidence Report 24 Perspectives and Performance of Investors in People: A Literature Review Evidence Report 25 UK Employer Perspectives Survey 2010 Evidence Report 26 UK Employment and Skills Almanac 2010 Evidence Report 27 Exploring Employer Behaviour in relation to Investors in People Evidence Report 28 Investors in People - Research on the New Choices Approach Evidence Report 29 Defining and Measuring Training Activity Evidence Report 30 Product strategies, skills shortages and skill updating needs in England: New evidence from the National Employer Skills Survey, 2009 Evidence Report 31 Skills for Self-Employment Evidence Report 32 The Impact of Student and Migrant Employment on Opportunities for Low Skilled People

Evidence Reports present detailed
the UK Commission for Employment and Skills. The reports contribute to the accumulation of knowledge and intelligence on skills and employment issues through the review of existing evidence or through primary research. All of the outputs of the UK Commission can be accessed on our website at www.ukces.org.uk
Produced by SQW for the UK Commission for Employment and Skills.
UKCES
Golden Smithies LaneWath-upon-DearneSouth YorkshireS63 7ERT +44 (0)1709 774 800F +44 (0)1709 774 801
UKCES28-30 Grosvenor GardensLondonSW1W 0TTT +44 (0)20 7881 8900F +44 (0)20 7881 8999
This document is available atwww.ukces.org.uk under ‘Publications’
ISBN 978-1-906597-87-0
© UKCES 1st Ed/08.11