reassessing giant panda habitat with satellite-derived ...€¦ · reassessing giant panda habitat...
TRANSCRIPT

Reassessing Giant Panda Habitat with Satellite-derived Bamboo Information: A Case Study in the Qinling Mountains, China
YIWEN SUN Enschede, The Netherlands, March, 2011

Reassessing Giant Panda Habitat with Satellite-derived Bamboo Information: A Case Study in the Qinling Mountains, China
YIWEN SUN Enschede, The Netherlands, March, 2011
Thesis submitted to the Faculty of Geo-Information Science and Earth Observation of the University of Twente and the School of Resources and Environmental Sciences of Wuhan University in partial fulfilment of the requirements for the degree of Master of Science in Geo-information Science and Earth Observation. Specialization: Geographic Information for Natural Resource and Environmental Management
SUPERVISORS:
Dr. Tiejun Wang (Department of Natural Resources, ITC, University of Twente) Prof. Dr. Qingsheng Guo (School of Resources and Environmental Sciences,
Wuhan University)
THESIS ASSESSMENT BOARD: Prof. Wouter Verhoef (Chair, Department of Natural Resources, ITC, University of Twente) Prof. Zhan Qingming (External examiner, School of Urban Studies, Wuhan University)

DISCLAIMER
This document describes work undertaken as part of a pr ogramme of study at the Faculty of Geo-Information Science and Earth Observation of the University of Twente and the School of R esources and Environmental Sciences of Wuhan University. All views and opi nions expressed therein remain the sole responsibility of t he author, and do not necessarily represent those of either university.
i
ABSTRACT
Estimating and mapping suitable habitat play a critical role in endangered species conservation planning and policy. Serving as the essential food source of giant pandas, bamboo is the most important ecological variable in giant panda habitat assessment. However, lack or inadequate information about understory bamboo distribution in previous studies has led to the variety in both quantity and quality of panda habitat.
In this study, the understory bamboo was mapped using Maxent model based on giant panda occurrence data and multi-temporal MODIS EVI data. By incorporating this satellite-derived bamboo information, together with topography and human factors, the suitability of giant panda habitats in the Qinling Mountains were reassessed. Consequently, the conservation status of the current nature reserve network for giant pandas in the Qinling Mountains was also evaluated.
The study results indicated that the panda occurrence data may be used as a surrogate for bamboo distribution modeling at a spatial resolution of 250m with an accuracy of kappa 0.74 and AUC 0.92. The study also showed that deficiency of bamboo information and human disturbance factor may bring about a huge overestimation of the total suitable panda habitat as well as a serious underestimation of the degree of habitat fragmentation. The sharp drop in habitat area with bamboo information indicated overestimations of more than 70% and 80% in suitable habitat and marginally suitable habitat respectively. Human disturbances further led to a reduction of 33% in suitable habitat and a decrease of 63% in marginally suitable habitat, as well as more severe habitat fragmentation. The reassessed giant panda habitat in the Qinling Mountains covers a total area of 1808 km2, which is much less than the area of 3475 km2 that estimated from the third national panda survey. About 54% of the habitat area consisting of large patches with good quality is under protection of the current panda nature reserve network, which is lower than the expected number of 72%.
The study suggests that it is necessary to incorporate more accurate bamboo distribution information that derived from remotely sensed data into large-scale giant panda habitat research and management and to avoid overestimation of habitat. Moreover, the protective efficiency of panda habitats varies among different nature reserves; while some suitable habitats outside the nature reserves need further investigation for habitat expansion and linkage. All in all, this study facilitates understory bamboo mapping and has important implications for the long-term and sustainable development of giant panda conservation.

ii
ACKNOWLEDGEMENTS
I appreciate the opportunity of 8-month study in the faculty of Geo-information Science and Earth Observation (ITC) of the University of Twente, which absolutely expanded my horizons, broadened and deepened my knowledge in the field of ecology, remote sensing and geographic information. At the time of finishing my thesis, I would like to express my gratitude to all the people who helped and supported me during this research.
First and foremost, I tender my deepest thanks to Dr. Tiejun Wang, my ITC supervisor, for introducing me such an interesting topic and teaching me how to conduct a scientific research independently. I have benefited a great deal from every discussion we had, and thanks very much for your advice and encouragement that cleared away my difficulties both in study and life.
My special thanks are addressed to Dr. Michael Weir for removing so many obstacles to let me keep my mind on this research and to Prof. Qingsheng Guo for providing a relaxed studying environment when I have been back to Wuhan University to proceed with this study.
I am grateful to Ms. Bei Tong, and some staff in the nature reserves for the company and help during the fieldwork. I also thank Ms. Loise Wandera, Ms. Theresa Adjaye, Ms. Weili Wang and Ms. Dan Yuan for the useful discussion and advice.
Finally, I would like to thank my parents as well as Mr. Zhong Du for sparing no effort to support my study at ITC and this research.
iii
TABLE OF CONTENTS 1. Introduction ........................................................................................................................................................... 1
1.1. Background .............................................................................................................................................................. 11.2. Problem statement .................................................................................................................................................. 31.3. Research objectives ................................................................................................................................................. 31.4. Research questions .................................................................................................................................................. 41.5. Research hypotheses ............................................................................................................................................... 41.6. Organization of the thesis and research approach ............................................................................................. 4
2. Materials and Methods ......................................................................................................................................... 72.1. Study area ................................................................................................................................................................. 72.2. Data preparation and pre-processing ................................................................................................................. 102.3. Mapping bamboo distribution ............................................................................................................................ 182.4. Habitat assessment ................................................................................................................................................ 20
3. Results .................................................................................................................................................................. 273.1. Bamboo distribution ............................................................................................................................................. 273.2. Habitat suitability and comparison study ........................................................................................................... 303.3. Spatial distribution of reassessed giant panda habitat ...................................................................................... 333.4. Current conservation in the nature reserves ...................................................................................................... 36
4. Disscussion ......................................................................................................................................................... 414.1. Mapping bamboo distribution with Maxent ..................................................................................................... 414.2. Habitat suitability analysis .................................................................................................................................... 424.3. Quantification of the habitat status and conservation implications ............................................................... 44
5. Conclusions and Recommendations .............................................................................................................. 475.1. Conclusions ........................................................................................................................................................... 475.2. Recommendations ................................................................................................................................................ 47

iv
LIST OF FIGURES Figure 1 A giant panda in the bamboo forest (photographed by Yange Yong) ........................................ 2Figure 2 Framework of the research approaches ............................................................................................ 5Figure 3 Location of the study area of ten counties in Shaanxi Province, China, and the existing giant
panda habitats (resulted from the third national giant panda survey) in the Qinling Mountains .. 7Figure 4 Three-dimensional topographic display of the Qinling Mountains ............................................. 8Figure 5 Geographic distribution of established nature reserves in the Qinling Mountains ................. 10Figure 6 Forest with understory bamboo in the Qinling Mountains (photographed by Yiwen Sun) .. 10Figure 7 (a) sample plots of bamboo presence and absence data; (b) sample plots of forest and non-
forest data ................................................................................................................................................... 12Figure 8 One of the 69 MODIS EVI images within the study area (acquired on January 1, 2008) ..... 13Figure 9 Seasonality plots of the original data (blue line) and smoothed data (brown line) loaded in
TIMESAT .................................................................................................................................................. 13Figure 10 (a) Elevation distribution in the study area; (b) Slope distribution in the study area ............ 14Figure 11 (a) Panda occurrence data of the year 2000 from the third national giant panda survey; (b)
Panda occurrence data of the year 2008 provided by nature reserves ............................................. 15Figure 12 Distribution of human population density in the study area .................................................... 16Figure 13 A confusion matrix .......................................................................................................................... 17Figure 14 Forest and non-forest classification map ..................................................................................... 18Figure 15 Structure of environmental factors used in giant panda habitat reassessment in the Qinling
Mountains ................................................................................................................................................... 21Figure 16 Utilization of slope by giant pandas in the Qinling Mountains ................................................ 23Figure 17 Kernel density of giant pandas and two isopleths of 90% and 100% of the density ............ 24Figure 18 Logistic output of bamboo distribution from Maxent ............................................................... 27Figure 19 Bamboo distribution map ............................................................................................................... 28Figure 20 ROC plot for the prediction of bamboo distribution using Maxent ....................................... 29Figure 21 Ratios of bamboo area in each county to the county area ........................................................ 30Figure 22 Suitability classification map of giant panda habitat without bamboo information .............. 31Figure 23 Suitability classification map of giant panda habitat with bamboo information .................... 31Figure 24 Suitability classification map of giant panda habitat with bamboo and human disturbance
information ................................................................................................................................................ 32Figure 25 Habitat area comparison between the three estimations resulted from difference criteria .. 32Figure 26 Bar plots of the six landscape metrics (the number of 1, 2 and 3 plotted below each bar
stands for habitat estimation without bamboo, with bamboo, and with bamboo and human factors, respectively) ................................................................................................................................. 33
Figure 27 Suitable and marginally suitable habitat area in each county ..................................................... 34Figure 28 Proportions of giant panda habitat at different elevations among the total habitat area ..... 35Figure 29 Locations of the nature reserves and the status of giant panda habitat conservation .......... 36Figure 30 Area of suitable and marginally suitable habitat in each nature reserve .................................. 38Figure 31 Proportions of habitat area among the area of nature reserves ................................................ 38Figure 32 Habitat area inside and outside the nature reserves .................................................................... 39Figure 33 Spatial distribution of the giant panda habitat suitability index modeled by Maxent based
on time series MODIS EVI, elevation, slope and human population density ................................ 43Figure 34 Binary result of habitat and non-habitat distribution ................................................................. 43Figure 35 Important areas (A-D) for new nature reserves or ecological corridors ................................. 46
v
LIST OF TABLES Table 1 Basic information of the established giant panda nature reserves in the Qinling Mountains ... 9Table 2 Description of other GIS data and their usage .............................................................................. 16Table 3 Reference data for forest and non-forest classification ................................................................ 17Table 4 Confusion matrix derived measures of classification accuracy (N is the sum of a, b, c and d) 17Table 5 Criteria of suitability assessment for the abiotic and biotic factors ............................................ 22Table 6 Assessment criteria for the impact of human on giant panda habitat ........................................ 22Table 7 Habitat suitability combined with the impact of human disturbances (Liu et al., 1999) .......... 24Table 8 Thresholds optimized by 12 methods from PresenceAbsence package .................................... 28Table 9 Area of predicted bamboo in each county ...................................................................................... 29Table 10 Area of suitable, marginally suitable and unsuitable habitat of the three kinds of habitat
distribution resulted from different criteria ......................................................................................... 32Table 11 Landscape characteristics of the three giant panda habitat results ........................................... 33Table 12 Giant panda habitat in the ten counties in the Qinling Mountains .......................................... 34Table 13 Giant panda habitat in different elevation ranges in the Qinling Mountains .......................... 35Table 14 Basic information of the nature reserves, the area of suitable and marginally suitable habitat
as well as the proportion of habitat area in total habitat in the study area ...................................... 37Table 15 Landscape characteristics of habitat inside and outside the nature reserves ........................... 39


REASSESSING GIANT PANDA HABITAT WITH SATELLITE-DERIVED BAMBOO INFORMATION: A CASE STUDY IN THE QINLING MOUNTAINS, CHINA
1
1. INTRODUCTION
1.1. Background
1.1.1. Conservation of giant panda habitat The giant panda (Ailuropoda melanoleuca), as the national symbol of China, is one of the most endangered mammals in the world due to its small population size and continued decline of its habitat (IUCN, 2007). Giant pandas originally inhabited most of southern and eastern China, but by 1900 they were found living only in the Qinling Mountains and along the eastern edge of Tibetan plateau. Today giant pandas are restricted to temperate montane forests across five separate mountain regions (i.e., Qinling, Minshan, Qionglai, Xiangling and Liangshan) where bamboo dominates the forest understory (Hu, 1985). Giant panda habitat has been greatly decreased and fragmented caused by agricultural expansion, increasing demand for timber products and infrastructure construction (Wang et al., 2009c). The intense fragmentation of the habitat may lead to reduced gene flow, inbreeding and subsequent population differentiation of giant pandas in these regions (Zhu et al., 2010). The long-term viability of giant pandas will be undoubtedly in jeopardy if the fragmentation continues or gets worse.
The Qinling Mountain region is the northernmost part of the five existing mountain regions where giant pandas inhabit. According to the third national giant panda survey, there are approximately 300 giant pandas in this area with the highest panda population density. Eighteen nature reserves have been established and proposed in the Qinling Mountains to protect the giant panda and its habitat since 1970s. In addition, some conservation programs have been corporately carried out by World Wide Fund for Nature (WWF) and Chinese government, aiming to protect, expand and restore the panda habitat. According to the objective of the Qinling giant panda focal project (WWF China), the protected habitats are expected to increase by at least 80% by 2012. For both conservation and restoration of the habitat in the long run, habitat assessment is needed to provide information about habitat status and distribution, which are necessary for decision making and management.
1.1.2. Bamboo and giant panda Among the main four constituent elements of giant panda habitat (i.e. elevation, slope, forest cover and understory bamboo) in large scale (Liu et al., 2001), bamboo is the single most important characteristic (Viña et al., 2007). Bamboo is the dominant understory vegetation in giant panda habitat (Figure 1), playing an important role in the structure and composition of forest ecosystems. Bamboo leaves, culms and shoots are the essential food resources for giant pandas, which make up over 99% of the giant panda’s diet (Schaller et al., 1985). Bamboo does not have much nutrition, and leaves are more digestible by giant pandas than culms or branches. Although giant pandas are very specialized for bamboo, they are inefficient in digesting bamboo, so that giant pandas have to spend more than 14 hours per day on foraging and eating (Schaller et al., 1985)as much as 40 pounds (Dierenfeld et al., 1982).
Obviously, giant pandas have to increase efficiency to speed up the time that it takes them to search for bamboo, in other words, the dependence on bamboo indicates that the presence of giant panda is supposed to be closely related to the occurrence of sufficient understory bamboo. It has been studied that the daily activity range of giant pandas’ movement in Qinling Mountain region is about 300 to 500 meters (Liu et al., 2002), therefore, the occurrences of understory bamboo with biologically meaningful amount are expected to be found within the areas of 300m×300m around the presence locations of giant pandas. In reverse, the presence of understory bamboo is not able to represent the presence of giant pandas

REASSESSING GIANT PANDA HABITAT WITH SATELLITE-DERIVED BAMBOO INFORMATION: A CASE STUDY IN THE QINLING MOUNTAINS, CHINA
2
regardless whether the bamboo is well-grown, because habitat selection and utilization by giant pandas also depend on other factors, such as topography and human disturbances.
Figure 1 A giant panda in the bamboo forest (photographed by Yange Yong)
1.1.3. Research review Traditional ground survey to obtain the bamboo distribution is time-consuming, labor-intensive and the results could not be continuing in space. Many studies applying remote sensing (RS) and geographic information system (GIS) techniques for giant panda habitat assessment have been made inside nature reserves or within mountain regions. Take examples in Qinling Mountains, Loucks et al. (2003) identified a landscape with a total habitat area of approximately 2300 km2 based on elevation and forest cover to meet the long-term, elevational requirements for giant pandas; Xu et al. (2006b) analyzed spatial patterns and protection condition of panda habitat with an area of about 4400 km2 based on elevation, slope, vegetation types and bamboo cover; Feng et al. (2009) used Mahalanobis distance model and 11 habitat factors in terms of vegetation, topography, human influence to determine the habitat use for giant pandas; Gong et al. (2010) modeled the giant panda habitat with an area of 1600 km2 from biotic, abiotic and human factors and assessed conservation efficiency of the nature reserve network. It is surprising that the assessed total giant panda habitat area in the Qinling Mountains differed greatly from one study to another due to data inconsistency, as well as the differences of the assessment criteria. Importantly, however, these methods are nothing inappropriate except that the information of bamboo distribution is either missing or inadequate.
Understory bamboo could not be identified from satellite images in a straightforward manner due to the interference of overstory canopies. Because of the lack of detailed information about its spatial distribution and dynamics, some researchers estimated the habitat with continuously distributed bamboo based on an assumed relationship between the occurrence of forests and understory bamboo. However, Linderman et al. (2004) assessed the habitat in Wolong Nature Reserve with bamboo distribution derived from satellite image using artificial neural networks, the area shrunk by 40%. Therefore, it is probably to overestimate the suitable habitat without adequate information about bamboo distribution in previous habitat assessments.
Many efforts have been made to overcome the difficulties in detecting understory bamboo. For instance, Wang et al. (2009b) discriminated understory bamboo using a leaf-off Landsat image, and improved

REASSESSING GIANT PANDA HABITAT WITH SATELLITE-DERIVED BAMBOO INFORMATION: A CASE STUDY IN THE QINLING MOUNTAINS, CHINA
3
understory bamboo mapping based on Advanced Spaceborne Thermal Emission and Reflection Radiometer (ASTER) image using an artificial neural network and a GIS expert system(Wang et al., 2009a). However, the low sun elevation angle and the resultant shadows of mountains in winter might affect the classification results, and when coming to a larger spatial extent, these methods might be limited by the data availability of cloud-free images with high spatial resolutions and optimal date for separating overstory and understory components.
It has been studied that forests with and without evergreen understory bamboo have temporal profiles that could be statistically separated (Viña et al., 2008), which points out an alternative way to map understory bamboo distribution. Recently, Tuanmu et al. (2010) successfully modeled bamboo distribution based on the phenological variability of vegetation indices derived from a time series of Moderate Resolution Imaging Spectroradiometer (MODIS) surface reflectance data.
MODIS has two high temporal resolution products of Normalized Difference Vegetation Index (NDVI) and Enhanced Vegetation Index (EVI), which are derived from atmosphere corrected, bidirectional red, near-infrared, and blue surface reflectances that are masked for water, clouds and cloud shadow (NASA). They are not only able to reduce the problem of cloud but also provide information about the spatial and temporal dynamics of land surface across large areas. NDVI has been widely used to monitor and map temporal and spatial distributions of physiological and biophysical characteristics of vegetation, but it is unavoidable to encounter the saturation problem under moderate-to-high biomass conditions (Gitelson, 2004). EVI has improved sensitivity into high biomass regions and reduces both atmospheric and soil background influences simultaneously (Matsushita et al., 2007) to better characterize seasonality.
1.2. Problem statement It has to be admitted that modeling understory bamboo distribution based on phenological characteristics using MODIS data is novel and creditable. However, it was not very appropriate to use 20m×20m bamboo presence data from the third national giant panda survey (State Forestry Administration, 2006) to estimate the presence pixels of 250m MODIS imagery; while collecting bamboo occurrence data with sample plot size of at least 250m×250m in mountain region is a challenging and tough work. As the presence data of giant pandas are more convenient to obtain by the daily work in the reserves, they could be probably used as a surrogate of bamboo occurrence data based on the close relationship between the occurrences of bamboo and giant pandas.
Although the technique of mapping understory bamboo distribution is no longer a difficult problem, the resulting bamboo distribution has not been well-integrated into the habitat assessments. In addition, previous habitat assessments mostly considered natural environmental factors but ignored human factors, which are the main cause of giant panda habitat loss and fragmentation. Therefore, with bamboo distribution derived from the improved mapping technique, as well as human factors, giant panda habitat can be evaluated more precisely, which is expected to rank the habitat to protect the suitable areas and restore the damaged areas. Giant panda conservation and sustainable habitat management will benefit from this study.
1.3. Research objectives
1.3.1. General objective This research aims at reassessing giant panda habitat with satellite-derived bamboo information in the Qinling Mountains, China.
1.3.2. Specific objectives To map the spatial distribution of understory bamboo using panda presence data and time series
MODIS 250m EVI data

REASSESSING GIANT PANDA HABITAT WITH SATELLITE-DERIVED BAMBOO INFORMATION: A CASE STUDY IN THE QINLING MOUNTAINS, CHINA
4
To model the giant panda habitat with the satellite-derived bamboo information
To examine the spatial distribution characteristics of the reassessed giant panda habitat
To quantify and evaluate the conservation status of current giant panda habitat
1.4. Research questions Can panda presence data be used as a surrogate for the prediction of understory bamboo based on
time series MODIS 250m EVI data?
Are there any differences in terms of area and fragmentation between the panda habitats resulted from the estimations with and without satellite-derived bamboo information?
What are the distribution characteristics of reassessed giant panda habitat from the horizontal and vertical spatial perspectives?
What is the area and proportion of the suitable panda habitat within each nature reserve? And how much potential habitat is available outside the reserves?
1.5. Research hypotheses Giant panda presence data can be used as a surrogate of bamboo presence data to map bamboo
distribution.
Reassessed giant panda habitat with satellite-derived bamboo information has smaller area and is more fragmented than the estimated habitat without bamboo information.
1.6. Organization of the thesis and research approach Chapter 1 provides a general research background, explains the research problem, defines the research objectives, questions and hypotheses, and describes the general outline of the research. Chapter 2 introduces the study area with respect to nature and society, expounds the collection and pre-processing of research data and the research approaches. Chapter 3 lists and explains the research findings relevant to specific research questions stated in Chapter 1. Chapter 4 discusses the methods taken in this study, the practical relevance of the results and the implications of giant panda conservation. Chapter 5 summarizes the research and makes recommendations for further in-depth studies.
Figure 2 demonstrates the overall framework of the research approaches. The whole research was mainly composed of two steps, namely mapping bamboo distribution and habitat assessment. In the first step, bamboo distribution was predicted by Maxent from giant panda occurrence data and multi-temporal MODIS EVI data. In the second step, habitat suitability was evaluated based on different criteria systems with and without bamboo information and human disturbance factor. The different habitat estimations were compared to each other in the respects of area and fragmentation, and the final habitat was taken further analyses to explore its distributional characteristics and the conservation status.

REASSESSING GIANT PANDA HABITAT WITH SATELLITE-DERIVED BAMBOO INFORMATION: A CASE STUDY IN THE QINLING MOUNTAINS, CHINA
5
Field data Time series MODIS EVI
Panda occurrence data
Topography Bamboo distributionForest cover
Habitat with bamboo
MLC
Nature reserves
Reassessment results
Validation
Habitat without bamboo
Human disturbances
Suitability analysis Suitability analysis
Habitat with bamboo&human
factor
Suitability analysis
Maxent
Zonal analysis
Comparisons
FRAGSTATS
Figure 2 Framework of the research approaches
Mapping bamboo distribution
Habitat Reassessment
REASSESSING GIANT PANDA HABITAT WITH SATELLITE-DERIVED BAMBOO INFORMATION: A CASE STUDY IN THE QINLING MOUNTAINS, CHINA
6
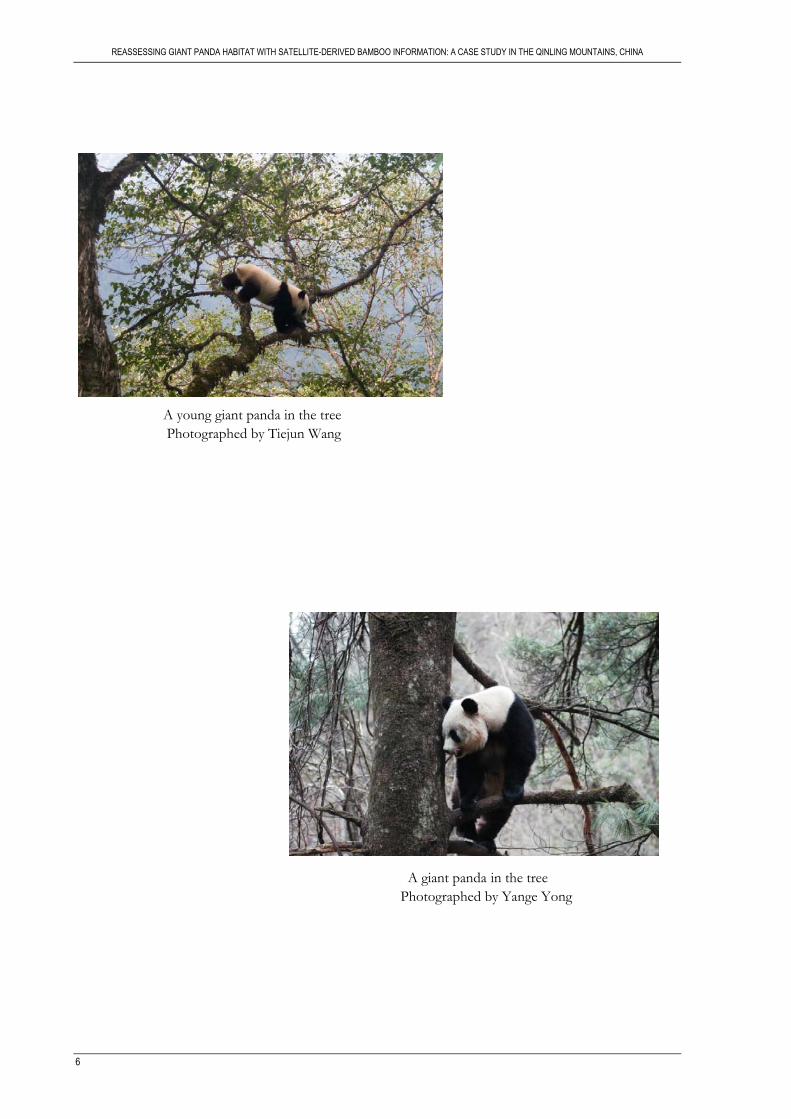
A young giant panda in the tree Photographed by Tiejun Wang
A giant panda in the tree Photographed by Yange Yong

REASSESSING GIANT PANDA HABITAT WITH SATELLITE-DERIVED BAMBOO INFORMATION: A CASE STUDY IN THE QINLING MOUNTAINS, CHINA
7
2. MATERIALS AND METHODS
2.1. Study area
2.1.1. Geographic conditions The Qinling Mountains are a special natural geographic system in terms of topography and climate; they form the watershed between two river systems of the Yangtze River and the Yellow River, as well as the boundary of the temperate zone and subtropical zone (Nie, 1981). Therefore, the Qinling Mountains play an important role in the differentiation of biogeographic regions. As one of the biodiversity hotspots in China, there are rich resources of flora and fauna especially on the southern slope of the middle part of the Qinling Mountains (Pan et al., 2001). The study area (Figure 3) locates between 32o42’-34o16’N, 106o18’-109o44’E in the middle part of the Qinling Mountains, which is also considered as the Qinling Mountains in the narrow sense. The study area consists of ten county territories in Shaanxi Province in China, and covers a total area of 25859 km2 with an elevation range from 222m to 3734m. These ten counties are defined as the existing and potential areas with giant pandas distribution by the third national giant panda survey (State Forestry Administration, 2006).
Figure 3 Location of the study area of ten counties in Shaanxi Province, China, and the existing giant panda habitats (resulted from the third national giant panda survey) in the Qinling Mountains
The Qinling Mountains are towering and magnificent with a varied topography, as shown in Figure 4. The mountains rise to over 3000m by an easy gradient on the southern slope but the northern slopes are generally steep. There are several peaks higher than 3000m among the northern mountains, making up the alpine type of relief in the Qinling Mountains. Flowing water cuts off the mountains running from east to west and forms many valleys.

REASSESSING GIANT PANDA HABITAT WITH SATELLITE-DERIVED BAMBOO INFORMATION: A CASE STUDY IN THE QINLING MOUNTAINS, CHINA
8
Figure 4 Three-dimensional topographic display of the Qinling Mountains
As the climatic division between the north and south, the Qinling Mountains run along the zero isotherm in January, the 800mm isohyet and the 2000 hours sunshine isoline on the whole, and the south area is warmer and moister than the north area. Owning to the great differences of elevation, climate shows vertical zonality obviously. It is temperate in the area with an elevation from 800m to 2000m, where the average annual temperature ranges between 9 and 13 degrees Celsius and the annual precipitation is from 850mm to 900mm. In the area above 2000m, the average annual temperature drops to below 9 degrees Celsius while the annual precipitation ranges from 900m to 950mm, and it changes to cold moist climate when the elevation is more than 2500m.
The vegetation in the study area is also characterized by the vertical distribution transformation, from the montane vegetation landscape of warm temperate zone to northern subtropics. It is mainly covered with deciduous broadleaf and subtropical evergreen forests at low-elevation, temperate deciduous broadleaf and subalpine coniferous forests at mid-elevation, and subalpine scrub meadow at high-elevation (State Forestry Administration, 2006).
According to the third national giant panda survey and some literatures (Pan et al., 2001; State Forestry Administration, 2006), there are five genera and seven species of bamboo growing in this area, among which four species are the main food for giant pandas. The genus Fargesia has the largest distribution with the genus Bashania next to it, and Fargesia qinlingensis and Bashania fargessi are the dominant two species on the southern slope of the middle part of the Qinling Mountians. Bashania fargessi concentrates in the area from 800m to 1800m, while Fargesia qinlingensis is present from 900m until about 3000m, but it is mainly distributed within the range of 2000-2900m. Fargesia dracocephala is distributed in mid and low elevation areas in Foping county and Ningshan county, serving as food for giant pandas in this areas together with other bamboo species.
In addition to the giant panda, there are many species of rare wild animals, birds and fish, such as golden monkey (Rhinopithecus), takin (Budorcas taxicolor), musk deear (Moschus berezovskii), crested ibis (Nipponia nippon), giant salamander (Andrias davianus) and Qinling lenok (Brachymystax lenok tsinlingensis) (Zhang, 2000).
The division between forest ecosystems and agro-ecosystems is around 550-780m on the northern slope and 1000m on the southern slope of the Qinling Mountains. However, there are still some villagers living in the area above 1000m, which forms the spatial configurations of forest ecosystems alternating with agro-ecosystems.

REASSESSING GIANT PANDA HABITAT WITH SATELLITE-DERIVED BAMBOO INFORMATION: A CASE STUDY IN THE QINLING MOUNTAINS, CHINA
9
2.1.2. Socioeconomic conditions The level of urbanization in the Qinling Mountain region is very low, and the population living in the rural areas account for about 87% in 2001, much higher than the average proportions of 62.3% and 69.2% across the country and in the province, respectively (State Forestry Administration, 2006). According to the community survey by some nature reserves, the mountain areas are depopulated year by year due to marriage, study, egress laboring, ecological migration and death. Moreover, the undertakings in science, education, culture and hygiene are backward especially in some villages and towns with giant panda distributed, compared with those relatively developed surrounding areas.
The Qinling Mountain region possesses rich mineral resources of coal, iron, copper, uranium, gold, manganese and other dozens of kinds, and mining has become the chief source of finance in some counties. Water resources are also rich and have a large potentiality to be exploited. There are a great variety of forest by-products with high economic values under the high forest coverage. In recent years, forest eco-tourism resources have become new growth engine in some counties. Nevertheless, the natural resources in these counties are exploited at a fairly low level in general, restricted by transportation, technology, funding and other factors.
Most of the regions with giant panda distributed are under the poor conditions of nature and infrastructure facilities, which have a negative influence on the sustainable and rapid development of local economy. The traditional crop-plantation, livestock breeding and forestry are still the main income sources of local people. The resultant dependency on forest resources put huge pressure on giant panda conservation. Therefore, Chinese government has implemented a logging ban since 1999 to protect natural forests and reforest formerly cultivated land.
2.1.3. Giant panda nature reserves There are 15 established nature reserves associated with or especially for giant panda and its habitat in the study area (Figure 5) with another three under construction or in the planning stage, which have formed a group of reserves to effectively protect giant pandas and other rare species. The details of the established giant panda nature reserves are listed in Table 1.
Table 1 Basic information of the established giant panda nature reserves in the Qinling Mountains
Name Level Established year Affiliated county Area (km2)
Changqing National 1995 Yangxian 299.1 Foping National 1978 Foping 292.4 Guanyinshan Provincial 2002 Foping 135.7 Huangbaiyuan Provincial 2006 Taibai 219.7 Huangguanshan Provincial 2001 Ningshan 208.6 Laoxiancheng Provincial 1993 Zhouzhi 126.1 Motianling Provincial 2002 Liuba 81.6 Niuweihe Provincial 2006 Taibai 148.3 Pingheliang Provincial 2006 Ningshan 223.6 Sangyuan National 2002 Liuba 145.0 Taibaishan National 1965 Taibai 563.3 Tianhuashan National 2002 Ningshan 276.2 Wuliangshan Provincial 2002 Fengxian 179.8 Yingzuishi Provincial 2004 Zhenan 117.7 Zhouzhi National 1988 Zhouzhi 563.9

REASSESSING GIANT PANDA HABITAT WITH SATELLITE-DERIVED BAMBOO INFORMATION: A CASE STUDY IN THE QINLING MOUNTAINS, CHINA
10
Figure 5 Geographic distribution of established nature reserves in the Qinling Mountains
2.2. Data preparation and pre-processing
2.2.1. Field data collection Fieldwork was carried out from September 18 to October 2, 2010. According to the research requirements, two types of data were collected in the field; one is bamboo presence and absence data for the validation procedures of bamboo distribution modeling, the other is ground truth data of training and testing samples for forest and non-forest classification. The size of the sample plots was 300m×300m so that it is large enough to represent the information of the corresponding 250m×250m pixel.
Figure 6 Forest with understory bamboo in the Qinling Mountains (photographed by Yiwen Sun)

REASSESSING GIANT PANDA HABITAT WITH SATELLITE-DERIVED BAMBOO INFORMATION: A CASE STUDY IN THE QINLING MOUNTAINS, CHINA
11
The bamboo presence was defined as the bamboo coverage was more than 10%, and the bamboo absence was defined contrariwise. The 10% demarcation was a reference to the previous research of Linderman et al. (2004), because the cover less than 10% is insignificant to provide enough spectral signature that received by the remote sensing scanner, at the same time, it cannot provide giant pandas with enough edible biomass either. The forest and non-forest were determined based on the international forest definition by the United Nations Food and Agricultural Organization (FAO), that is, land of at least 0.5 hectare with potential canopy cover over 10% and potential tree height of at least five meters (FAO, 2000). Figure 6 is a photo taken during the fieldwork showing the forest with understory bamboo in the Qinling Mountains.
The instruments used during the fieldwork included handheld Global Position System (GPS), topographic maps, measuring tape, compass and digital camera.
The selection of sample site based on random sampling is suggested to avoid bias, but it was impractical to take simple random sampling strategy in the study area. Considering the complexity of the mountainous natural environment and time costs, it was difficult even impossible to access to some areas. Therefore, a kind of purposive sampling was adopted. The sampling routes were designed along the roads from the east to the west in the middle part of the Qinling Mountains based on the information from the third national giant panda survey and expert knowledge. These routes covered a wide range of elevation variation to accord with the vertical zonality of vegetation.
Sample plots located on either side of the road with a distance of 1000m to it, and kept a distance of 2-3 km from each other in case of spatial autocorrelation. The plot of 300m×300m was undoubtedly very difficult to measure in the mountainous area, therefore, bamboo cover and forest cover were measured based on visual estimations within five circular subsamples with a radius of 15m. These five subsamples were fixed in the center and about 100m away from the center in four directions of east, west, north and south. The average cover percentage of the five subsamples was assumed to represent the situation of the whole plot.
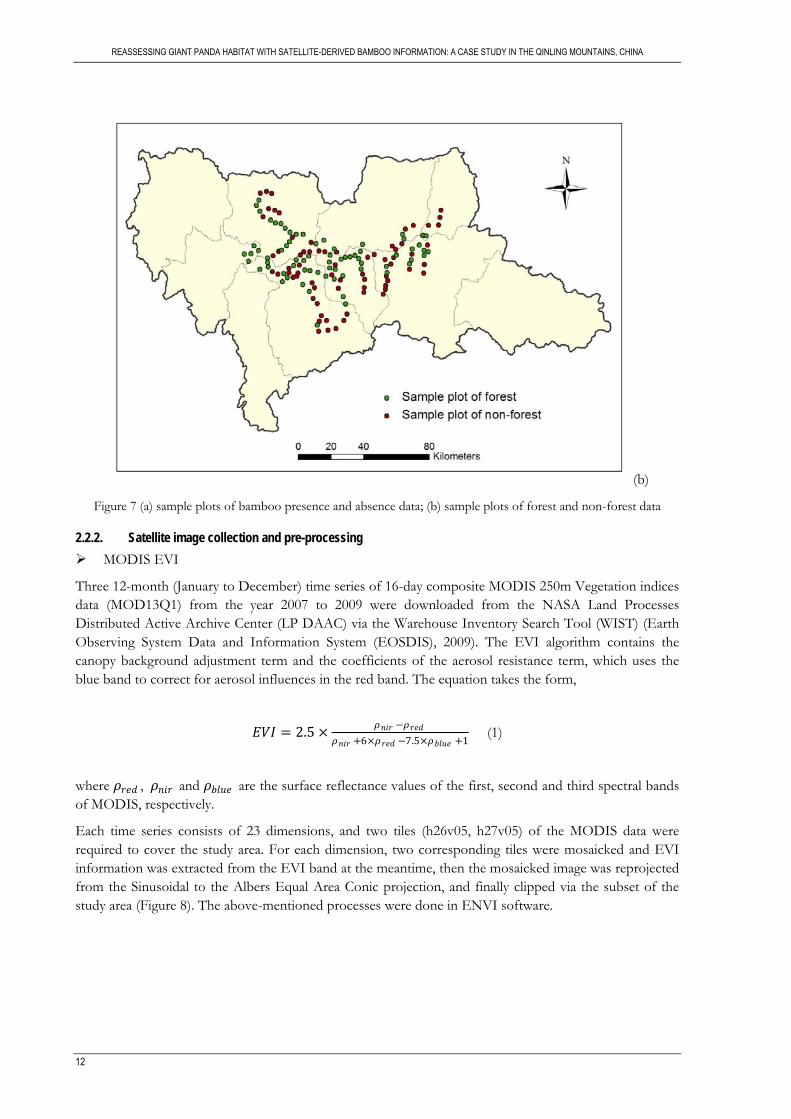
Finally, 65 samples of bamboo presence, 68 samples of bamboo absence, 70 samples of forest and 69 samples of non-forest were collected. Figure 7 shows the spatial distribution of the sample plots.
(a)
REASSESSING GIANT PANDA HABITAT WITH SATELLITE-DERIVED BAMBOO INFORMATION: A CASE STUDY IN THE QINLING MOUNTAINS, CHINA
12
(b)
Figure 7 (a) sample plots of bamboo presence and absence data; (b) sample plots of forest and non-forest data
2.2.2. Satellite image collection and pre-processing MODIS EVI
Three 12-month (January to December) time series of 16-day composite MODIS 250m Vegetation indices data (MOD13Q1) from the year 2007 to 2009 were downloaded from the NASA Land Processes Distributed Active Archive Center (LP DAAC) via the Warehouse Inventory Search Tool (WIST) (Earth Observing System Data and Information System (EOSDIS), 2009). The EVI algorithm contains the canopy background adjustment term and the coefficients of the aerosol resistance term, which uses the blue band to correct for aerosol influences in the red band. The equation takes the form,
𝐸𝐸𝐸𝐸𝐸𝐸 = 2.5 × 𝜌𝜌𝑛𝑛𝑛𝑛𝑛𝑛 −𝜌𝜌𝑛𝑛𝑟𝑟𝑟𝑟𝜌𝜌𝑛𝑛𝑛𝑛𝑛𝑛 +6×𝜌𝜌𝑛𝑛𝑟𝑟𝑟𝑟 −7.5×𝜌𝜌𝑏𝑏𝑏𝑏𝑏𝑏𝑟𝑟 +1
(1)
where 𝜌𝜌𝑛𝑛𝑟𝑟𝑟𝑟 , 𝜌𝜌𝑛𝑛𝑛𝑛𝑛𝑛 and 𝜌𝜌𝑏𝑏𝑏𝑏𝑏𝑏𝑟𝑟 are the surface reflectance values of the first, second and third spectral bands of MODIS, respectively.
Each time series consists of 23 dimensions, and two tiles (h26v05, h27v05) of the MODIS data were required to cover the study area. For each dimension, two corresponding tiles were mosaicked and EVI information was extracted from the EVI band at the meantime, then the mosaicked image was reprojected from the Sinusoidal to the Albers Equal Area Conic projection, and finally clipped via the subset of the study area (Figure 8). The above-mentioned processes were done in ENVI software.

REASSESSING GIANT PANDA HABITAT WITH SATELLITE-DERIVED BAMBOO INFORMATION: A CASE STUDY IN THE QINLING MOUNTAINS, CHINA
13
Figure 8 One of the 69 MODIS EVI images within the study area (acquired on January 1, 2008)
In order to reduce the potential noise of cloudiness but also keep high fidelity of the data, MODIS EVI data were cleaned and smoothed using an adaptive Savitzky-Golay filter in TIMESAT program (Jönsson & Eklundh, 2004). The seasonal characteristics of three full phenological cycles were reconstructed based on the three time series EVI data (Figure 9), and one time series of the resulting smoothed data of the year 2008 were used as environmental variables of bamboo distribution modeling.
Figure 9 Seasonality plots of the original data (blue line) and smoothed data (brown line) loaded in TIMESAT
In addition, the smoothed 12-month multi-temporal EVI data was combined to one image with 23 bands and transformed into principal components by a principle component analysis (PCA) (Byrne et al., 1980) in ENVI software. The first five principal components, which accounted for more than 99.1% of variance of the total 23 bands, were retained for forest and non-forest classification.

REASSESSING GIANT PANDA HABITAT WITH SATELLITE-DERIVED BAMBOO INFORMATION: A CASE STUDY IN THE QINLING MOUNTAINS, CHINA
14
ASTER DEM
ASTER 30m Digital Elevation Model (DEM) product was also obtained from LP DAAC and taken the processes of mosaicking, reprojection and clipping as MODIS data. Elevation information was directly extracted from DEM using extraction tool, while slope information was computed using surface tool in ArcGIS software (Figure 10). Both topographic layers were resampled to the pixel size of 250m×250m using nearest neighbor algorithm so as to keep the resolution consistent with MODIS data.
(a)
(b)
Figure 10 (a) Elevation distribution in the study area; (b) Slope distribution in the study area

REASSESSING GIANT PANDA HABITAT WITH SATELLITE-DERIVED BAMBOO INFORMATION: A CASE STUDY IN THE QINLING MOUNTAINS, CHINA
15
2.2.3. GIS data Giant panda occurrence data
Giant panda occurrence data were recorded based on observations of individuals or traces (i.e., tracks, droppings, dens) from the national giant panda survey and the routines of the nature reserves. Data from the third national giant panda survey (1075 plots), as shown in Figure 11(a), were used as basic information of giant panda distribution for pre-analysis. The field observations of the year 2008 (239 plots) were provided by nature reserves, as shown in Figure 11(b), which were used as a surrogate of bamboo presences for model prediction.
(a)
(b)
Figure 11 (a) Panda occurrence data of the year 2000 from the third national giant panda survey; (b) Panda occurrence data of the year 2008 provided by nature reserves
Other second-hand data
Table 2 lists some second-hand data and their derived data, as well as the purposes that these data used for.
REASSESSING GIANT PANDA HABITAT WITH SATELLITE-DERIVED BAMBOO INFORMATION: A CASE STUDY IN THE QINLING MOUNTAINS, CHINA
Table 2 Description of other GIS data and their usage
Data Purpose
Boundaries of counties Mapping and zonal analysis
Boundaries of nature reserves Zonal analysis
Human population density Habitat suitability analysis
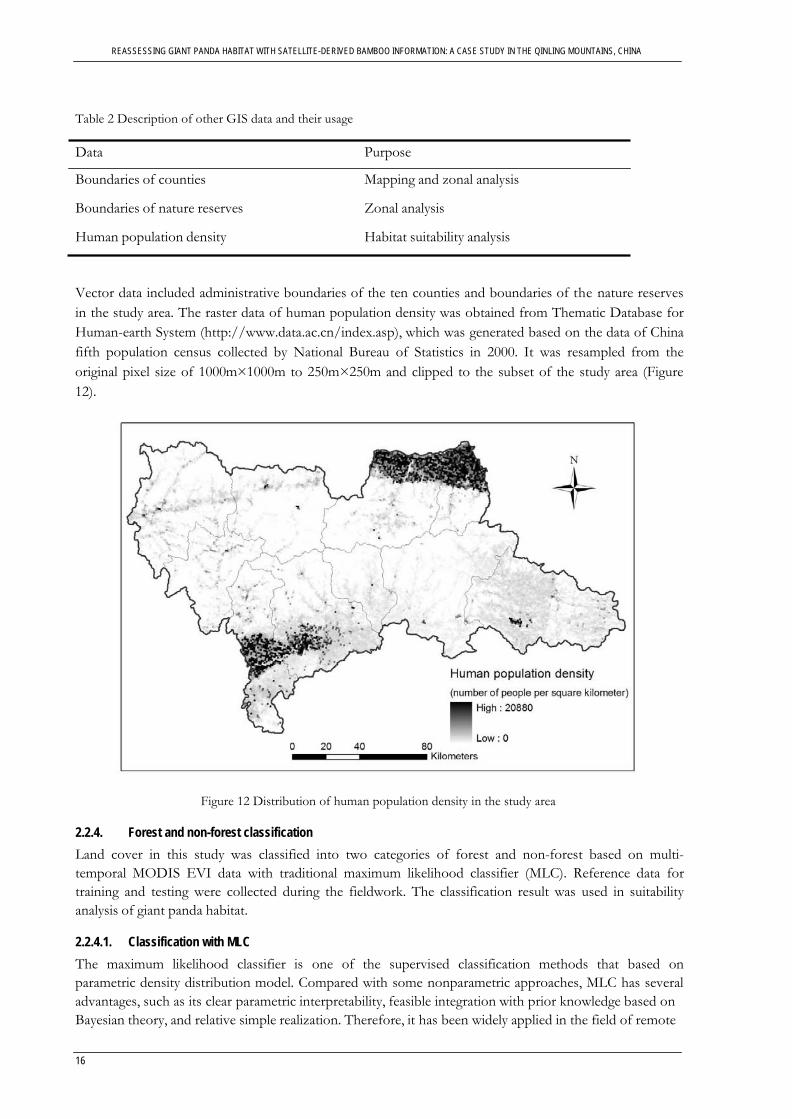
Vector data included administrative boundaries of the ten counties and boundaries of the nature reserves in the study area. The raster data of human population density was obtained from Thematic Database for Human-earth System (http://www.data.ac.cn/index.asp), which was generated based on the data of China fifth population census collected by National Bureau of Statistics in 2000. It was resampled from the original pixel size of 1000m×1000m to 250m×250m and clipped to the subset of the study area (Figure 12).
Figure 12 Distribution of human population density in the study area
2.2.4. Forest and non-forest classification Land cover in this study was classified into two categories of forest and non-forest based on multi- temporal MODIS EVI data with traditional maximum likelihood classifier (MLC). Reference data for training and testing were collected during the fieldwork. The classification result was used in suitability analysis of giant panda habitat.
2.2.4.1. Classification with MLC The maximum likelihood classifier is one of the supervised classification methods that based on parametric density distribution model. Compared with some nonparametric approaches, MLC has several advantages, such as its clear parametric interpretability, feasible integration with prior knowledge based on Bayesian theory, and relative simple realization. Therefore, it has been widely applied in the field of remote
16

REASSESSING GIANT PANDA HABITAT WITH SATELLITE-DERIVED BAMBOO INFORMATION: A CASE STUDY IN THE QINLING MOUNTAINS, CHINA
17
sensing. MLC assumes that the training samples are normally distributed in spectrum feature space, and calculates the probability that a given pixel belongs to a specific class, which is also defined as likelihood. Each pixel with the maximum likelihood is classified into the corresponding class.
Table 3 Reference data for forest and non-forest classification
Class Training samples Testing samples Total
Forest 35 35 70
Non-forest 35 34 69
Total 70 69 139
Half of the reference data for each class were randomly selected for training, and the remaining half were reserved for validation (Table 3). Principal component analysis and normal distribution test have been taken care of before applying MLC so as to follow the suggestions (Japanese Association of Remote Sensing, 1999) listed as follows:
Sufficient ground truth data should be sampled to allow estimation of the mean vector and the variance-covariance matrix of population.
The inverse matrix of the variance-covariance matrix becomes unstable in the case where there exists very high correlation between two bands or the ground truth data are very homogeneous. In such cases, the number of bands should be reduced by a principal component analysis.
When the distribution of the population does not follow the normal distribution, the maximum likelihood method cannot be applied.
2.2.4.2. Accuracy assessment The accuracy of the classification was assessed based on the confusion matrix (Figure 13) and its derived measures (Table 4) with an assumption that data are counts rather than percentages. Overall accuracy is a basic index to measure the error or accuracy of the classification, but sometimes it is not persuasive enough. Therefore, the Cohen’s kappa was also employed to assess the classification accuracy.
Figure 13 A confusion matrix
Table 4 Confusion matrix derived measures of classification accuracy (N is the sum of a, b, c and d)
Measure Calculation Overall accuracy (𝑎𝑎 + 𝑟𝑟)/𝑁𝑁
Sensitivity 𝑎𝑎/(𝑎𝑎 + 𝑐𝑐)
Specificity 𝑏𝑏/(𝑏𝑏 + 𝑟𝑟)
Kappa (𝑎𝑎 + 𝑟𝑟) − [(𝑎𝑎 + 𝑐𝑐)(𝑎𝑎 + 𝑏𝑏) + (𝑏𝑏 + 𝑟𝑟)(𝑐𝑐 + 𝑟𝑟)]/𝑁𝑁𝑁𝑁 − [(𝑎𝑎 + 𝑐𝑐)(𝑎𝑎 + 𝑏𝑏) + (𝑏𝑏 + 𝑟𝑟)(𝑐𝑐 + 𝑟𝑟)]/𝑁𝑁

REASSESSING GIANT PANDA HABITAT WITH SATELLITE-DERIVED BAMBOO INFORMATION: A CASE STUDY IN THE QINLING MOUNTAINS, CHINA
18
The Cohen’s kappa statistic is a chance-corrected measure of agreement (Cohen, 1960). It is one of suitable confusion matrix derived measures and makes full use of the information contained in the confusion matrix (Fielding & Bell, 1997). It is a common choice for accuracy assessment of image classification. Kappa coefficient ranges from 0 to 1 and higher value indicates better performance (Cohen, 1960). Although magnitude guidelines of kappa coefficient appeared in some literatures, there was no evidence to support them and they were not universally accepted. Landis and Koch (1977) suggested that model performance could be judged as excellent (kappa>0.75), fair to good (0.75>kappa>0.4), or poor (kappa<0.4).
2.2.4.3. Classification result Figure 14 displays the forest and non-forest classification result. From the visual interpretation, there are large areas of non-forest cover in the northeast and southwest of the study area, which are settlement places according to the field investigation. Besides, the signs of human activities along the valleys are obvious on this map. The classification result obtained an overall accuracy of 88.4% and a kappa coefficient of 0.77. According to the judge rule, this classification of forest and non-forest was excellent and accurate enough to be involved in the further suitability analysis of giant panda habitat.
Figure 14 Forest and non-forest classification map
2.3. Mapping bamboo distribution Geographic distribution of species plays a crucial role in biodiversity conservation and management, analyzing the pattern of species distribution and dealing with all kinds of ecological, biogeographic and evolutionary problems (Guisan & Thuiller, 2005). For most regions and species, however, detailed information of geographic distribution is usually lacking. Field investigation is not practical and may be subjectively influenced by sampling routes or records so that the distribution records may not represent actual species distribution. In last two decades, mathematic techniques have been applied to design predictive models to estimate the geographic distributions of all kinds of species. For instance, ecological

REASSESSING GIANT PANDA HABITAT WITH SATELLITE-DERIVED BAMBOO INFORMATION: A CASE STUDY IN THE QINLING MOUNTAINS, CHINA
19
niche models rely on known occurrence data of species and series of environmental variables to approximate species’ ecological niches, which consist of all conditions that allow for long-term survival, yielding the predicted geographic area of species presence (Phillips et al., 2006).
Usually tools used to perform distributional estimations require information about absence of species, and some general-purpose statistical methods, such as logistic models, can be used when both presence and absence occurrence data are available. However, absence data are more difficult to obtain so that rarely available for many species and regions, and absence in one particular place does not necessarily represent unsuitable niche. Therefore, several methods especially dealing with presence-only data has been well-developed and widely-used, such as Maxent, HABITAT, LIVES and BIOCLIM (Elith et al., 2006; Ward et al., 2009).
2.3.1. Modeling approach – Maxent Maxent is a general-purpose statistical machine-learning method with a simple and precise mathematical formulation and well-suited for species distribution modeling (Phillips et al., 2006). It is one of the novel methods that outperform many established methods in prediction of species’ distribution from presence-only data (Elith et al., 2006). The algorithm of Maxent estimates the occurrence probability of each pixel by finding the probability distribution of maximum entropy (i.e. closest to uniform), respecting a set of constraints, which are derived from comparisons between the multi-dimensional environmental conditions in species presence locations and the conditions in background locations (Phillips & Dudı´k, 2008).
The software of Maxent was chosen as the modeling framework for mapping understory bamboo distribution because it offers several advantages. First, Maxent requires only presence data rather than both presence and absence data. It is very helpful not only because true absence data of giant panda are almost impossible to obtain, but also because the absence of giant panda does not necessarily mean the absence of bamboo. Secondly, Maxent has very good predictive performance particularly when using sparse or noisy input information. As a generative method, Maxent may give better predictions than discriminative methods when the amount of training data is small (Ng & Jordan, 2001); while as a machine-learning method, Maxent is able to model non-linear responses to the environment even with noisy input data (Elith et al., 2006). What’s more, Maxent outputs fuzzy classification with more detailed information and allows the conversion of binary results with flexible choices of threshold (Phillips et al., 2006). In some recent studies, Maxent has been successfully applied in mapping spatial distribution of understory bamboo and giant panda habitat in Wolong Nature Reserve, China (Tuanmu et al., 2010; Viña et al., 2010).
The smoothed time series MODIS EVI of the year 2008 (23 dimensions) as environmental layers, together with the locations of 75 giant panda occurrence plots were used to generate the model for bamboo distribution mapping. The 75 sample plots with giant panda occurrences were kept a minimum distance of 3 km from each other to reduce the effects of spatial autocorrelation. Ten thousand background points were randomly selected from the entire study area, and other parameters were also set following the default settings.
2.3.2. Model evaluation A threshold-dependent method and a threshold-independent method were performed to evaluate the performance of the model using an independent validation dataset of 65 presence samples and 68 absence samples collected in the field. Both validation procedures were conducted by PresenceAbsence package (Freeman & Moisen, 2008) in R program. The PresenceAbsence package provides a collection of tools for evaluating the performance of binary classification models and determining the optimum threshold for translating a probability distribution of presence to a simple presence-absence result, and it also includes functions to conduct the receiver operating characteristic (ROC) analysis.

REASSESSING GIANT PANDA HABITAT WITH SATELLITE-DERIVED BAMBOO INFORMATION: A CASE STUDY IN THE QINLING MOUNTAINS, CHINA
20
Threshold-dependent evaluation
The Cohen’s kappa, a threshold-dependent method, has been already used in previous study on mapping understory bamboo (Wang et al., 2009a; Tuanmu et al., 2010). The details of kappa statistic have been elaborated in the section of accuracy assessment of forest and non-forest classification.
In order to convert the continuous output from Maxent to a binary one, an optimal threshold value was selected. Subjective determinations, such as the value of 0.5, are widely used in ecology; but this kind of dichotomy without any ecological basis seem very arbitrary (Osborne et al., 2001). PresenceAbsence package provide 12 threshold determination approaches in case of the dramatic effects on model accuracy from arbitrary selections of thresholds. For instance, kappa maximization approach, which determines the threshold corresponding to the maximum kappa value, is commonly used in ecology. However, according to comparisons of threshold determine approaches by Liu et al.(2005), kappa maximization may not be as good as some other approaches, such as sensitivity-specificity-combined approaches, which were also taken into consideration in this study, together with kappa maximization approach.
Threshold-independent evaluation
ROC analysis, a threshold-independent method, was originally used in clinical medicine and has been applied in the evaluation of species distribution models (Fielding & Bell, 1997; Elith, 2000). ROC curve is a plot of the sensitivity (proportion of true positives, Table 4) of the model prediction against the complement of its specificity (proportion of false positives, Table 4) for all possible thresholds. The associated area under the ROC curve (AUC) as an important index provides a single measure of overall accuracy of the model, which is not dependent upon a particular threshold and comparable between models. AUC value of 1 indicates a perfect model, while 0.5 indicates a random model. Model performance can be graded based on AUC values (Swets, 1988; Araújo et al., 2005) as excellent (AUC>0.9), good (0.9>AUC>0.8), fair (0.8>AUC>0.7), poor (0.7>AUC>0.6), or failed (0.6>AUC>0.5).
2.4. Habitat assessment Giant panda habitat is an ecological or environmental area that is inhabited by giant panda, which provides sufficient food and covers daily activities and reproduction. Based on the matching relationship between the ecological niche of giant pandas and the environmental conditions, habitat assessment delineates the characteristics of the suitable habitat and its geographic distribution, to support efficient habitat ranking (Goodall & Naudé, 1998) for the limited resources of conservation and management. It is suggested to conduct giant panda habitat assessment across the mountain range or at the level of even larger scale to make the research and conservation more significant in the long run (Loucks et al., 2003; Xu et al., 2006a).
According to Ouyang et al. (2001), the general procedures of giant panda habitat assessment include understanding of the factors that have influences on giant pandas’ activities, determination of the evaluation criteria system, single factor and multifactor suitability analysis and exploration of the characteristics of suitable habitat within each space unit.
Along with the development of computer and GIS techniques, GIS has become popular in giant panda habitat assessment in the respects of ecological-niche factor analysis, habitat pattern and fragmentation analysis and so forth (Wang & Chen, 2004). For instance, GIS stores the attributes of factors that have effects on the distribution of species as well as the associated geographic information in difference data layers, and overlay analysis provides a quality evaluation resulted from the combination of all the factors, which is commonly used in the studies of giant panda habitat assessment (Ouyang et al., 2001; Xu et al., 2006b).
REASSESSING GIANT PANDA HABITAT WITH SATELLITE-DERIVED BAMBOO INFORMATION: A CASE STUDY IN THE QINLING MOUNTAINS, CHINA
21
2.4.1. Habitat suitability analysis
2.4.1.1. Selection and analysis of environmental factorsGiant panda habitat consists of natural environment and social environment, and the quality of giant panda habitat is restricted to many kinds of environmental factors. Suitability of the habitat depends on both physical and biotic conditions; physical environmental factors include elevation, slope and aspect, and biotic environmental factors include forest origin, forest canopy density, shrub coverage, bamboo coverage and its growth status. In addition to the natural environmental factors, there are some social environmental factors, such as forest harvesting, cultivation, mining, infrastructure construction, poaching and tourist activities, which can be classified as social-economic factors and human disturbance factors (Li et al., 2005b; State Forestry Administration, 2006).
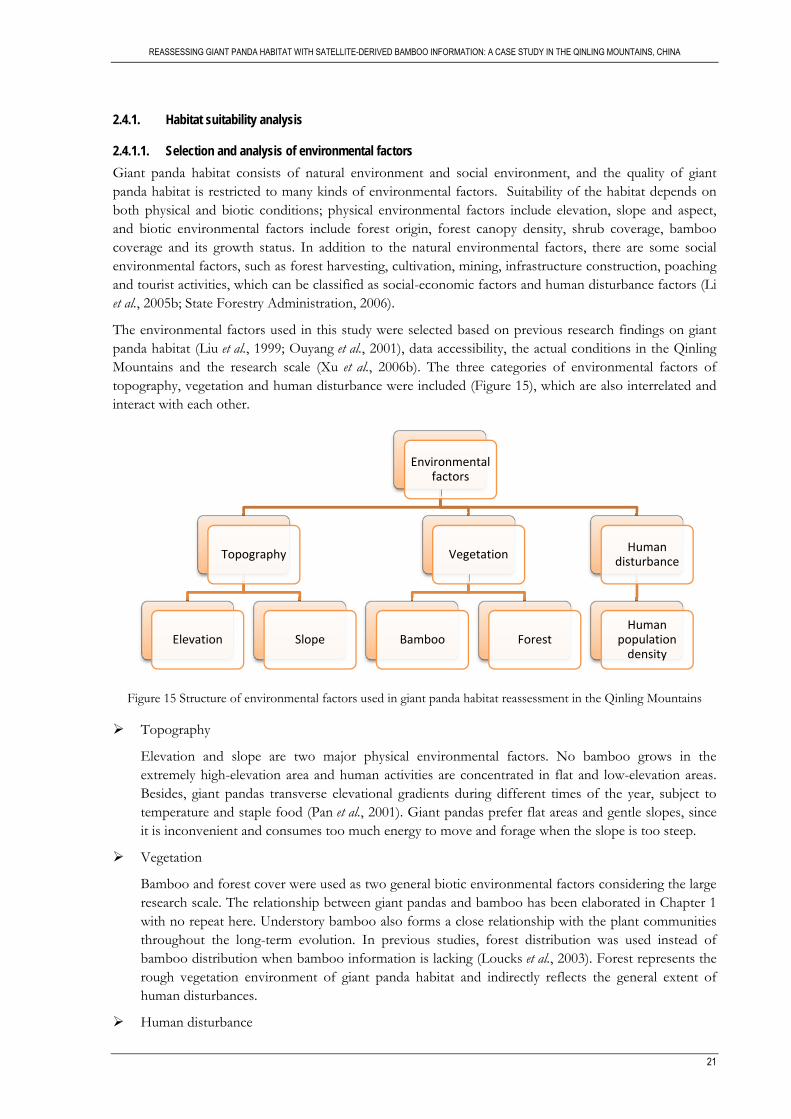
The environmental factors used in this study were selected based on previous research findings on giant panda habitat (Liu et al., 1999; Ouyang et al., 2001), data accessibility, the actual conditions in the Qinling Mountains and the research scale (Xu et al., 2006b). The three categories of environmental factors of topography, vegetation and human disturbance were included (Figure 15), which are also interrelated and interact with each other.
Figure 15 Structure of environmental factors used in giant panda habitat reassessment in the Qinling Mountains
Topography
Elevation and slope are two major physical environmental factors. No bamboo grows in the extremely high-elevation area and human activities are concentrated in flat and low-elevation areas. Besides, giant pandas transverse elevational gradients during different times of the year, subject to temperature and staple food (Pan et al., 2001). Giant pandas prefer flat areas and gentle slopes, since it is inconvenient and consumes too much energy to move and forage when the slope is too steep.
Vegetation
Bamboo and forest cover were used as two general biotic environmental factors considering the large research scale. The relationship between giant pandas and bamboo has been elaborated in Chapter 1 with no repeat here. Understory bamboo also forms a close relationship with the plant communities throughout the long-term evolution. In previous studies, forest distribution was used instead of bamboo distribution when bamboo information is lacking (Loucks et al., 2003). Forest represents the rough vegetation environment of giant panda habitat and indirectly reflects the general extent of human disturbances.
Human disturbance
Environmental factors
Topography
Elevation Slope
Vegetation
Bamboo Forest
Human disturbance
Human population
density
REASSESSING GIANT PANDA HABITAT WITH SATELLITE-DERIVED BAMBOO INFORMATION: A CASE STUDY IN THE QINLING MOUNTAINS, CHINA
22
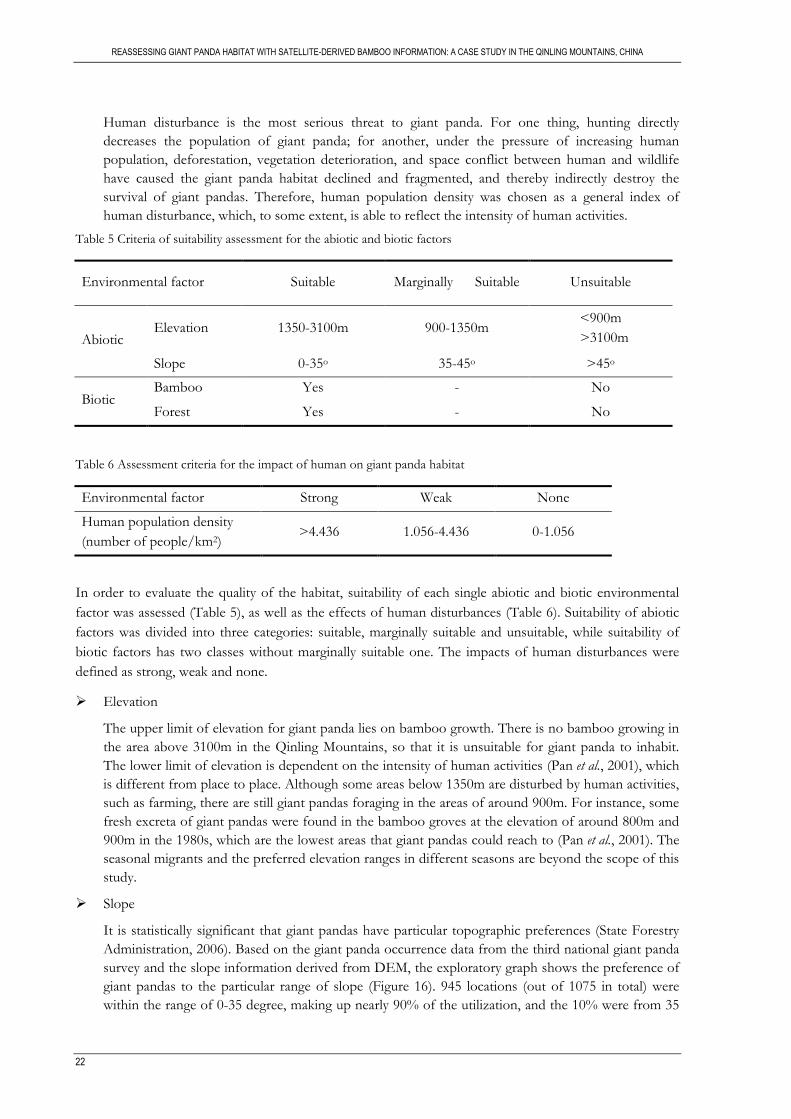
Human disturbance is the most serious threat to giant panda. For one thing, hunting directly decreases the population of giant panda; for another, under the pressure of increasing human population, deforestation, vegetation deterioration, and space conflict between human and wildlife have caused the giant panda habitat declined and fragmented, and thereby indirectly destroy the survival of giant pandas. Therefore, human population density was chosen as a general index of human disturbance, which, to some extent, is able to reflect the intensity of human activities.
Table 5 Criteria of suitability assessment for the abiotic and biotic factors
Environmental factor Suitable Marginally Suitable Unsuitable
Abiotic Elevation 1350-3100m 900-1350m
<900m >3100m
Slope 0-35o 35-45o >45o
Biotic Bamboo Yes - No
Forest Yes - No
Table 6 Assessment criteria for the impact of human on giant panda habitat
Environmental factor Strong Weak None
Human population density (number of people/km2)
>4.436 1.056-4.436 0-1.056
In order to evaluate the quality of the habitat, suitability of each single abiotic and biotic environmental factor was assessed (Table 5), as well as the effects of human disturbances (Table 6). Suitability of abiotic factors was divided into three categories: suitable, marginally suitable and unsuitable, while suitability of biotic factors has two classes without marginally suitable one. The impacts of human disturbances were defined as strong, weak and none.
Elevation
The upper limit of elevation for giant panda lies on bamboo growth. There is no bamboo growing in the area above 3100m in the Qinling Mountains, so that it is unsuitable for giant panda to inhabit. The lower limit of elevation is dependent on the intensity of human activities (Pan et al., 2001), which is different from place to place. Although some areas below 1350m are disturbed by human activities, such as farming, there are still giant pandas foraging in the areas of around 900m. For instance, some fresh excreta of giant pandas were found in the bamboo groves at the elevation of around 800m and 900m in the 1980s, which are the lowest areas that giant pandas could reach to (Pan et al., 2001). The seasonal migrants and the preferred elevation ranges in different seasons are beyond the scope of this study.
Slope
It is statistically significant that giant pandas have particular topographic preferences (State Forestry Administration, 2006). Based on the giant panda occurrence data from the third national giant panda survey and the slope information derived from DEM, the exploratory graph shows the preference of giant pandas to the particular range of slope (Figure 16). 945 locations (out of 1075 in total) were within the range of 0-35 degree, making up nearly 90% of the utilization, and the 10% were from 35

REASSESSING GIANT PANDA HABITAT WITH SATELLITE-DERIVED BAMBOO INFORMATION: A CASE STUDY IN THE QINLING MOUNTAINS, CHINA
23
to 45 degree. Therefore, 35 degree and 45 degree (Viña et al., 2010)were chosen to be the thresholds to separate the suitability levels.
Figure 16 Utilization of slope by giant pandas in the Qinling Mountains
Bamboo/Forest
The occurrence of bamboo can directly determine the habitat suitability. Since most of bamboos in the Qinling Mountains are understory, bamboo distribution contains adequate information of forest distribution. Additionally, giant pandas are also active in the bamboo grove in the brush; hence, the factor of forest was not considered when satellite-derived bamboo information had become available.
Human population density
There are no existing criteria for the impacts of human population density in literatures to refer to. In order to incorporate this human factor into giant panda habitat assessment scientifically, the corresponding intervals of different degrees of impact were computed based on the analysis of panda population density and human population density. Panda population density was generated from the panda occurrence data from the third national giant panda survey using kernel density tool in ArcGIS software, with a search radius of 3 km as a theoretical action radius of individuals (based on the maximum territory size of the giant panda which is around 30 km2 (Pan et al., 2001)). The isopleths of 90% and 100% were drawn by the kernel tool of percent volume contour in Hawths tools, which plotted out the 90% and 10% density zones (Figure 17). The average values of human population density in these two zones were calculated by means of zonal statistics. The results of 1.056 km-2 in 90% density zone and 4.436 km-2 in 10% density zone were used as thresholds to divide the three levels of human disturbances.

REASSESSING GIANT PANDA HABITAT WITH SATELLITE-DERIVED BAMBOO INFORMATION: A CASE STUDY IN THE QINLING MOUNTAINS, CHINA
24
Figure 17 Kernel density of giant pandas and two isopleths of 90% and 100% of the density
2.4.1.2. Spatial multi-criteria evaluation The quality of the habitat was also divided into three categories: suitable, marginally suitable and unsuitable. The spatial analysis of habitat suitability estimation was conducted in ArcGIS software. Based on the criteria, each layer of environmental factors was classified and assigned the value of 0, 1 and 2, to represent unsuitable, marginally suitable and suitable (or strong, weak and none), respectively. All of the selected layers were multiplied in raster calculator, and the maximum and minimum values were reclassified as suitable and unsuitable respectively, with all the other values as marginally suitable.
The suitable habitat in this study was resulted from a combination of four factors of elevation, slope, bamboo distribution and human population density. Besides, another two habitat results were generated for comparisons. First, three factors of elevation, slope and forest were used to model the quality of giant panda habitat, to display the similar result in previous studies without bamboo information. Then satellite-derived bamboo distribution was used to replace forest distribution. Finally, the effects of human disturbances were added to the habitat estimation with bamboo information (Table 7). These three habitat estimations were to be compared to analyze the influences of bamboo and human factors on giant panda habitat suitability evaluation with respect to area and fragmentation degree.
Table 7 Habitat suitability combined with the impact of human disturbances (Liu et al., 1999)
Habitat suitability Human disturbances
Strong Weak None
Suitable Unsuitable Marginally Suitable Suitable
Marginally Suitable Unsuitable Marginally Suitable Marginally Suitable
Unsuitable Unsuitable Unsuitable Unsuitable

REASSESSING GIANT PANDA HABITAT WITH SATELLITE-DERIVED BAMBOO INFORMATION: A CASE STUDY IN THE QINLING MOUNTAINS, CHINA
25
2.4.2. Fragmentation analysis and zonal analysis Before quantifying and comparing the three habitat results, a procedure involving post-classification smoothing was taken to remove the “salt and pepper” and speckles which did not make much sense to giant pandas. Majority analysis in ENVI was used with the filter of 3×3 pixels according to the pixel size of 250m×250m and the average activity range of 3 km2 for giant pandas in the Qinling Mountains (Liu et al., 2002).
Area is a fundamental index as it defines the extent of the habitat, and it is important in terms of maintaining the stability of endangered species in landscape ecological construction. The area of suitable, marginally suitable and unsuitable habitat in each of the three habitat results was counted in ArcGIS software. Apart from the comparison of the area among three estimates based on different criteria, the situations of habitat fragmentation were also compared.
Habitat fragmentation is a process at landscape level in which a habitat is progressively subdivided into smaller and more isolated fragments, with the changes in landscape composition, structure and functions (McGarigal & Cushman, 2002). For more reasonable evaluation of fragmentation degree, suitable and marginally suitable habitats were merged to one class as habitat area, and unsuitable habitat was assigned to non-habitat area. Quantification of the composition and configuration of habitat fragments was conducted using FRAGSTATS software.
FRAGSTATS is a spatial pattern analysis program for categorical maps, which has been widely used to measure and filter each landscape with respect to the variables of concern. Some simple and commonly-used landscape metrics were selected after reviewing some habitat fragmentation studies (McAlpine & Eyre, 2002; Zhang et al., 2008; Xu et al., 2009; Wang et al., 2010). The descriptions and ecological meanings of the selected indices set forth in the technical document of FRAGSTATS (McGarigal et al., 2002) are listed as follows:
Number of patches (NP)
Number of patches is probably most valuable as the basis for computing other more interpretable metrics. It can be used as an index of heterogeneity, and its value is positively correlated to the degree of fragmentation.
Patch density (PD)
Patch density expresses number of patches on a per unit area, which has the similar information to the index of NP but facilitates comparisons among landscapes of varying size. As a good index of habitat fragmentation, patch density with a greater value in a landscape might indicate more intense fragmentation. A related index is mean patch size, which is obtained by dividing the sum of the areas of all patches of one specific patch type by the number of patches of the same type. As the reduction in the size of habitat fragments is a key indicant of habitat fragmentation, a landscape with a smaller mean patch size for the target patch type could be considered more fragmented. These two indices describe the same information so that they are perfectly correlated.
Largest patch index (LPI)
Largest patch index equals the percent of the landscape that the largest patch comprises. It is also an indicator of the degree of habitat fragmentation. Large segments are rare and valuable in the fragmented habitat.
Edge density (ED)
Edge density is a function of the amount of border between patches, which standardizes edge to a per unit area basis. It contained the same information as total edge length except in applications that involve comparing landscapes of varying size.

REASSESSING GIANT PANDA HABITAT WITH SATELLITE-DERIVED BAMBOO INFORMATION: A CASE STUDY IN THE QINLING MOUNTAINS, CHINA
26
Mean proximity index (PROX_MN)
The proximity index quantifies the spatial context of a habitat patch in relation to its neighbors, which distinguishes sparse distributions of small habitat patches from configurations where the habitat forms a complex cluster of larger patches. The mean proximity index at the landscape level averaging the proximity index across all patches and measures the degree of isolation and fragmentation.
More comprehensive analyses were conducted, aiming towards further characterization and assessment of the final giant panda habitat. Zonal analysis was applied in two aspects: one is to extract the distribution characteristics of giant panda habitat, and the other is to assess the status of current giant panda conservation. For the horizontal distribution characteristics, the areas of suitable and marginally suitable habitat within each county were quantified using tabulate area tool in ArcGIS software based on the final giant panda habitat distribution map and the vector data of county boundaries. For the vertical distribution characteristics, the habitat areas were statistically analyzed based on the subsets of the elevation range. The area of the habitats with two different suitability levels both inside and outside the nature reserves were also counted as the habitat area statistics of counties. Landscape characteristics of the habitat inside and outside the nature reserves were also examined to compare the habitat quality in term of fragmentation.

REASSESSING GIANT PANDA HABITAT WITH SATELLITE-DERIVED BAMBOO INFORMATION: A CASE STUDY IN THE QINLING MOUNTAINS, CHINA
27
3. RESULTS
3.1. Bamboo distribution There are three kinds of outputs of Maxent: raw format, cumulative format and logistic format. The primary output of Maxent is the exponential function that assigns a probability to each site used during model training, which was referred to as raw values. Since the raw output is difficult to interpret, it is then converted to the cumulative format, which defines in terms of omission rates predicted by the Maxent distribution. The cumulative format is easily interpreted but unnecessarily proportional to probability of presence (Phillips & Dudı´k, 2008). Therefore, the logistic output format was chosen for this study, which gives an estimation of probability of bamboo presence, with the range between 0 and 1 (Figure 18).
Figure 18 Logistic output of bamboo distribution from Maxent
For model validation and further analysis based on the binary result, PresenceAbsence package optimized the threshold by a choice of 12 different methods. As shown in Table 8, the threshold obtained by kappa maximization approach is 0.465, and the sensitivity-specificity sum maximization approach, as the third approach listed in the table, also gets the optimal threshold of 0.465. Sensitivity-specificity sum maximization is one of the sensitivity-specificity-combined methods, which maximizes the sum of sensitivity and specificity to give the threshold (Manel et al., 2001). Since these two threshold determination methods obtained the same results, the value of 0.465 was used as the optimal threshold.

REASSESSING GIANT PANDA HABITAT WITH SATELLITE-DERIVED BAMBOO INFORMATION: A CASE STUDY IN THE QINLING MOUNTAINS, CHINA
28
Table 8 Thresholds optimized by 12 methods from PresenceAbsence package
Method Threshold
1 Default 0.500000
2 Sens=Spec 0.530000
3 MaxSens+Spec 0.465000
4 MaxKappa 0.465000
5 MaxPCC 0.465000
6 PredPrev=Obs 0.530000
7 ObsPrev 0.488722
8 MeanProb 0.467360
9 MinROCdist 0.520000
10 ReqSens 0.530000
11 ReqSpec 0.520000
12 Cost 0.465000
The continuous logistic output was reclassified into bamboo presence with the probability higher than 0.465 and bamboo absence with the probability lower than 0.465. Figure 19 illustrates the predicted bamboo distribution in the study area. It is clear that the overwhelming majority of the bamboo grows in the counties of Taibai, Foping, Ningshan, Zhouzhi and Yangxian, which are generally in accord with the actual conditions.
Figure 19 Bamboo distribution map

REASSESSING GIANT PANDA HABITAT WITH SATELLITE-DERIVED BAMBOO INFORMATION: A CASE STUDY IN THE QINLING MOUNTAINS, CHINA
29
With respect to the quantitative evaluation of the model performance, the ROC curve was not close to the diagonal with the AUC value of 0.92 (Figure 20), and kappa coefficient achieved the value of 0.74. According to the relevant judgment standards, both values indicate a good predictive performance of bamboo distribution modeling.
Figure 20 ROC plot for the prediction of bamboo distribution using Maxent
The exact areas of bamboo distributed in the ten counties are listed in Table 9 and the bar chart describes the proportion of predicted bamboo area in each county (Figure 21). Taibai is the top while Zhenan goes to the bottom in terms of both area and proportion. Ningshan and Zhouzhi have the second and third largest area of bamboo. Although Foping has much less area of bamboo distribution than Taibai, Ningshan and Zhouzhi, the proportion of bamboo area is the second only to Taibai.
Table 9 Area of predicted bamboo in each county
County Area of county (km2) Area of bamboo distribution (km2)
Taibai 2666.4 1039.1 Ningshan 3676.0 874.6 Zhouzhi 2993.0 712.6 Foping 1258.7 477.0 Yangxian 3202.6 339.6 Liuba 1944.3 310.4 Fengxian 3149.9 231.8 Chenggu 2215.6 206.7 Huxian 1281.0 109.1 Zhenan 3470.7 70.9
0.0 0.2 0.4 0.6 0.8 1.0
0.0
0.2
0.4
0.6
0.8
1.0
ROC Plot
1-Specificity (false positives)
Sens
itivi
ty (t
rue
posi
tives
)
AUC:0.92 Maxent

REASSESSING GIANT PANDA HABITAT WITH SATELLITE-DERIVED BAMBOO INFORMATION: A CASE STUDY IN THE QINLING MOUNTAINS, CHINA
30
Figure 21 Ratios of bamboo area in each county to the county area
3.2. Habitat suitability and comparison studyBased on the three assessment criteria systems, suitability classification maps of giant panda habitat resulted from the estimations without bamboo information (Figure 22), with bamboo information (Figure 23) and with both bamboo and human disturbance information (Figure 24) were obtained. From visual interpretation, the giant panda habitat without bamboo information covers a very large area except the northeast and southwest corners of the study area, among which the suitable habitats almost link up into a single stretch and the marginally suitable habitats are mainly distributed on either side of the mountain valleys and in Zhenan county in the east of the study area; when satellite-derived bamboo information is incorporated, the area of both suitable and marginally suitable habitats reduces sharply, the habitat fragments are apparently much more and basically centralized in the middle part of the study area; when human disturbance factor is taken into consideration, the habitat area further decreases and many patches that scattered around disappear.
The quantification results (Table 10, Table 11) provides some interesting data regarding the comparisons of area and other landscape characteristics between three estimations of giant panda habitat. Significant decreases both in suitable and marginally suitable habitat area come out in the wake of incorporation of bamboo and human factors (Figure 25). The suitability evaluation with bamboo information obtains the suitable habitat area of about 2388 km2, which is much smaller than that resulted from the estimation using forest rather than bamboo by 8553 km2; meanwhile, the marginally suitable habitat decreases by 4099 km2. Compared to the second habitat estimation, human factor results in decreases of about 788 km2
and 351 km2 in suitable habitat and marginally suitable habitat, respectively.
Apart from the area shrink, bamboo information and human disturbance factor result in a distinct increase in habitat fragmentation, as shown in Figure 26. Bamboo data increase the patch density by fourteen-fold, which is further raised up by another 27% by human disturbances. The largest patch reduces from 90% of the total habitat area to 20% when bamboo information is brought in. As the number of patches increases in per unit area, the edge density also increases accordingly. Moreover, the patch connectivity gets worse and worse indicated by the declines of the mean proximity index.
38.97% 37.90%
23.81% 23.79%
15.96%10.60% 9.33% 8.51% 7.36%
2.04%

REASSESSING GIANT PANDA HABITAT WITH SATELLITE-DERIVED BAMBOO INFORMATION: A CASE STUDY IN THE QINLING MOUNTAINS, CHINA
31
Figure 22 Suitability classification map of giant panda habitat without bamboo information
Figure 23 Suitability classification map of giant panda habitat with bamboo information
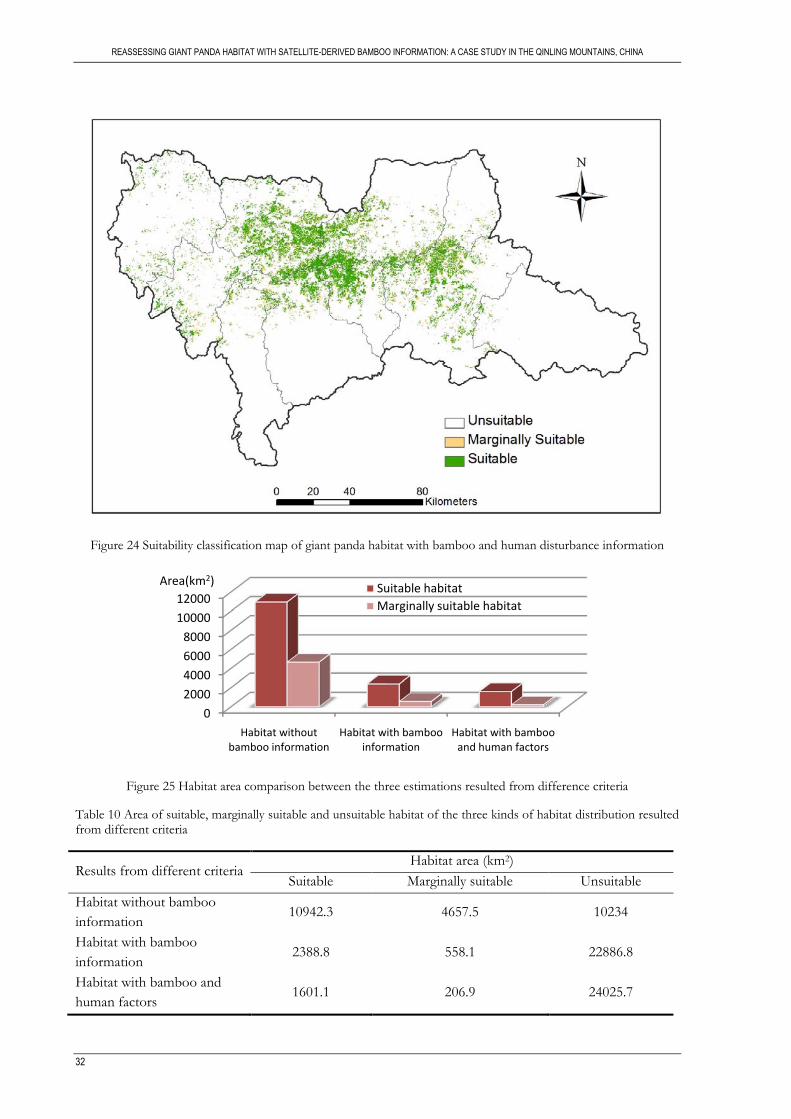
REASSESSING GIANT PANDA HABITAT WITH SATELLITE-DERIVED BAMBOO INFORMATION: A CASE STUDY IN THE QINLING MOUNTAINS, CHINA
32
Figure 24 Suitability classification map of giant panda habitat with bamboo and human disturbance information
Figure 25 Habitat area comparison between the three estimations resulted from difference criteria
Table 10 Area of suitable, marginally suitable and unsuitable habitat of the three kinds of habitat distribution resulted from different criteria
Results from different criteria Habitat area (km2)
Suitable Marginally suitable Unsuitable Habitat without bamboo information
10942.3 4657.5 10234
Habitat with bamboo information
2388.8 558.1 22886.8
Habitat with bamboo and human factors
1601.1 206.9 24025.7
02000400060008000
1000012000
Habitat without bamboo information
Habitat with bamboo information
Habitat with bamboo and human factors
Suitable habitatMarginally suitable habitat
Area(km2)

REASSESSING GIANT PANDA HABITAT WITH SATELLITE-DERIVED BAMBOO INFORMATION: A CASE STUDY IN THE QINLING MOUNTAINS, CHINA
33
Figure 26 Bar plots of the six landscape metrics (the number of 1, 2 and 3 plotted below each bar stands for habitat estimation without bamboo, with bamboo, and with bamboo and human factors, respectively)
Table 11 Landscape characteristics of the three giant panda habitat results
Results from different criteria
Landscape metrics
Area (km2) NP PD (km-2) LPI (%) ED (m/ha) PROX_MN
Habitat without bamboo information
15599.8 448 0.03 91.84 9.04 9828.23
Habitat with bamboo information
2946.9 1239 0.42 21.66 30.16 178.65
Habitat with bamboo and human factors
1808.1 967 0.53 22.95 45.37 72.66
3.3. Spatial distribution of reassessed giant panda habitat As regards the final giant panda habitat in this study, the total habitat is about 1808 km2, among which suitable area accounts for 88.6% and marginally suitable area accounts for the remaining 11.4%. The total habitat consists of 967 fragments, and the largest one comprises 22% of the total habitat area.
3.3.1. Horizontal distribution characteristics of giant panda habitat As for the habitat area in each county, the ten counties are ranked by the habitat area in the bar chart (Figure 27), and the details are listed in Table 12. Taibai has far more area of giant panda habitat than
1 2 3
Area
(a)
squa
re k
ilom
eter
050
0010
000
1500
0
1 2 3
NP
(b)0
200
600
1000
1 2 3
PD
(c)
per s
quar
e ki
lom
eter
0.0
0.1
0.2
0.3
0.4
0.5
1 2 3
LPI
(d)
perc
enta
ge
020
4060
80
1 2 3
ED
(e)
met
er p
er h
ecta
re
010
2030
40
1 2 3
PROX_MN
(f)
020
0060
00

REASSESSING GIANT PANDA HABITAT WITH SATELLITE-DERIVED BAMBOO INFORMATION: A CASE STUDY IN THE QINLING MOUNTAINS, CHINA
34
other counties, which accounts for 31% of the total habitat. Zhouzhi and Ningshan rank second and third respectively, with much the same habitat area more or less than 330 km2. Foping and Yangxian have relatively large area of suitable habitat, while the other five counties have much smaller habitat areas.
Figure 27 Suitable and marginally suitable habitat area in each county
Table 12 Giant panda habitat in the ten counties in the Qinling Mountains
County Habitat area (km2) & Percentage
Suitable Marginally suitable Total
Taibai 504.8 31.52% 54.9 26.55% 559.7 30.96% Zhouzhi 304.5 19.01% 28.6 13.83% 333.1 18.42% Ningshan 285.8 17.85% 40.8 19.69% 326.6 18.06% Foping 209.0 13.05% 16.3 7.88% 225.3 12.46% Yangxian 140.3 8.76% 22.8 10.99% 163.0 9.02% Liuba 56.6 3.54% 15.1 7.28% 71.7 3.96%Chenggu 41.9 2.62% 20.9 10.09% 62.8 3.47% Huxian 34.2 2.14% 3.4 1.63% 37.6 2.08% Fengxian 18.2 1.14% 2.9 1.42% 21.1 1.17% Zhenan 6.0 0.37% 1.3 0.63% 7.3 0.40%
Total 1601.1 100.00% 206.9 100.00% 1808.1 100.00%
From the map of the final habitat distribution (Figure 24), it is apparent that giant panda habitats are mainly distributed in three parts: Taibai, Ningshan and the mountain area near the border of Taibai, Zhouzhi, Foping and Yangxian. These three parts account for 90% of the total habitat.
3.3.2. Vertical distribution characteristics of giant panda habitatAs for the habitat distribution in different elevation ranges on the whole, the pie graph (Figure 28) depicts that more than three quarter of the giant panda habitats are within the elevation range from 1500m to 2400m while only 6% of the habitats are below 1200m or above 2700m. As is exhibited in Table 13, nearly 80% of the suitable habitats are in the range of 1500-2400m, among which the range of 1800-2100m
0.0
100.0
200.0
300.0
400.0
500.0
600.0
Area
(km
2 )
Marginally suitable habitat
Suitable habitat

REASSESSING GIANT PANDA HABITAT WITH SATELLITE-DERIVED BAMBOO INFORMATION: A CASE STUDY IN THE QINLING MOUNTAINS, CHINA
35
accounts for the largest proportion of 32.76%; about 75% of the marginally suitable habitats are in the range from 1200m to 2100m, and the greatest proportion of 34.28% falls into the range of 1200-1500m.
Figure 28 Proportions of giant panda habitat at different elevations among the total habitat area
Table 13 Giant panda habitat in different elevation ranges in the Qinling Mountains
Elevation (m)
Habitat area (km2) & Percentage
Suitable Marginally suitable Total
<1200 0.0 0.00% 22.3 10.78% 22.3 1.23% 1200-1500 95.5 5.96% 70.9 34.28% 166.4 9.21% 1500-1800 418.6 26.15% 46.9 22.65% 465.5 25.75% 1800-2100 524.5 32.76% 36.6 17.70% 561.1 31.03% 2100-2400 328.9 20.54% 13.4 6.46% 342.3 18.93% 2400-2700 154.9 9.67% 10.9 5.29% 165.8 9.17% 2700-3000 67.1 4.19% 5.6 2.69% 72.6 4.02% >3000 11.6 0.73% 0.3 0.15% 11.9 0.66%
Total 1601.1 100.00% 206.9 100.00% 1808.1 100.00%
1.23%
9.21%
25.75%
31.03%18.93%
9.17%
4.02%
0.66%
Elevation range (m)
<12001200-15001500-18001800-21002100-24002400-27002700-3000>3000

REASSESSING GIANT PANDA HABITAT WITH SATELLITE-DERIVED BAMBOO INFORMATION: A CASE STUDY IN THE QINLING MOUNTAINS, CHINA
36
3.4. Current conservation in the nature reserves
Figure 29 Locations of the nature reserves and the status of giant panda habitat conservation
Currently, there are 15 established nature reserves and another three planned to build, and the distribution of these nature reserves and giant panda habitats inside and outside the reserves are exhibited in Figure 29. Most of the nature reserves are connected and formed a group of nature reserves. The six national nature reserves of Taibaishan, Foping, Changqing, Zhouzhi, Tianhuashan and Sangyuan protect a total area of about 2140 km2.
From the statistical results listed in Table 14, it is clear that the giant panda habitats protected in nature reserves are not balanced. If the nature reserves are ranked by the inside habitat area (Figure 30), Foping Nature Reserve has the largest habitat area of over 150 km2, account for more than 8% of the total habitat, and the following nature reserves with large habitat area are Taibaishan, Zhouzhi, Huangbaiyuan and Changqing Nature Reserves, all of which conserve more than 100 km2 of the habitat area; while some of the nature reserves only cover tiny habitat areas, such as two parts of the proposed reserve of Niangniangsha, as well as Motianling and Yinzuishi Nature Reserves. As regards the ratios of the habitat area to the nature reserve area (Figure 31), about half of the area in Foping Nature Reserve can be used by giant pandas, which is ranked second only to Huangbaiyuan Nature Reserve with the ratio of 56.48%; Laoxiancheng Nature Reserve is the third for 46% of the its area used as giant panda habitat; those nature reserves with tiny habitat area also have lower ratios of habitat area to reserve area. On the whole, the habitat area account for 23% of the total protected area of nature reserves.

REAS
SESS
ING
GIAN
T PA
NDA
HABI
TAT
WIT
H SA
TELL
ITE-
DERI
VED
BAMB
OO IN
FORM
ATIO
N: A
CAS
E ST
UDY
IN T
HE Q
INLIN
G MO
UNTA
INS,
CHI
NA
37
Tabl
e 14
Bas
ic in
form
atio
n of
the
natu
re re
serv
es, t
he a
rea
of su
itabl
e an
d m
argi
nally
suita
ble
habi
tat a
s wel
l as t
he p
ropo
rtion
of h
abita
t are
a in
tota
l hab
itat i
n th
e st
udy
area
Nam
e
Leve
l C
lass
A
rea
of n
atur
e re
serv
e (k
m2 )
Are
a of
suita
ble
habi
tat (
km2 )
Are
a of
mar
gina
lly
suita
ble
habi
tat (
km2 )
Prop
ortio
n of
ha
bita
t are
a
Banq
iao
Prov
inci
al
Prop
osed
35
2.9
33
.1
13.5
2.
58%
C
hang
qing
N
atio
nal
Est
ablis
hed
299.
1
96.4
6.
3
5.68
%
Fopi
ng
Nat
iona
l E
stab
lishe
d 29
2.4
14
2.7
7.
6
8.31
%
Gua
nyin
shan
Pr
ovin
cial
E
stab
lishe
d 13
5.7
44
.3
2.9
2.
61%
H
uang
baiy
uan
Prov
inci
al
Est
ablis
hed
219.
7
117.
1
7.0
6.
86%
H
uang
guan
shan
Pr
ovin
cial
E
stab
lishe
d 20
8.6
61
.6
3.6
3.
61%
La
oxia
ncch
eng
Prov
inci
al
Est
ablis
hed
126.
1
55.6
0.
5
3.10
%
Mot
ianl
ing
Prov
inci
al
Est
ablis
hed
81.6
2.
6
0.0
0.
14%
N
iang
nian
gsha
n Pr
ovin
cial
Pr
opos
ed
177.
4
6.3
0.
4
0.26
%
Niu
wei
he
Prov
inci
al
Est
ablis
hed
148.
3
18.3
8.
7
1.12
%
Panl
ong
Prov
inci
al
Prop
osed
18
9.9
16
.4
6.1
1.
24%
Pi
nghe
liang
Pr
ovin
cial
E
stab
lishe
d 22
3.6
16
.9
1.8
1.
03%
Sa
ngyu
an
Nat
iona
l E
stab
lishe
d 14
5.0
20
.8
0.2
1.
16%
Ta
ibai
shan
N
atio
nal
Est
ablis
hed
563.
3
124.
0
17.8
7.
84%
Ti
anhu
asha
n N
atio
nal
Est
ablis
hed
276.
2
28.3
2.
4
1.70
%
Wul
iang
shan
Pr
ovin
cial
E
stab
lishe
d 17
9.8
4.
9
1.0
0.
32%
Y
ingz
uish
i Pr
ovin
cial
E
stab
lishe
d 11
7.7
3.
1
0.1
0.
17%
Z
houz
hi
Nat
iona
l E
stab
lishe
d 56
3.9
10
3.5
5.
5
6.03
%
Tota
l —
—
43
01.2
89
5.7
85
.3
54.2
5%

REASSESSING GIANT PANDA HABITAT WITH SATELLITE-DERIVED BAMBOO INFORMATION: A CASE STUDY IN THE QINLING MOUNTAINS, CHINA
38
Figure 30 Area of suitable and marginally suitable habitat in each nature reserve
Figure 31 Proportions of habitat area among the area of nature reserves
In summary, there are about 896 km2 suitable habitats and 85 km2 marginally suitable habitats protected by nature reserves, which accounted for over 54% of the total habitat in the study area. The remnant 705 km2 suitable habitats and 122 km2 marginally suitable habitats are outside the nature reserves (Figure 32). However, habitats inside and outside the nature reserves have quite distinct landscape characteristics, as listed in Table 15; the habitat outside the nature reserves obviously consists of much more patches than the habitat inside the nature reserves, and the much larger values of patch density and edge density of the unprotected area reveals that the habitat outside the nature reserves is more fragmented and the quality is not as good as the habitat under protection of the nature reserves.
0.0 20.0 40.0 60.0 80.0 100.0 120.0 140.0 160.0
FopingTaibaishan
HuangbaiyuanZhouzhi
ChangqingHuangguanshan
LaoxiancchengGuanyinshan
BanqiaoTianhuashan
SangyuanNiuweihe
PingheliangPanlong
NiangniangshanWuliangshan
YingzuishiMotianling
Area (km2)
Suitable habitat
Marginally suitable habitat
0%10%20%30%40%50%60%

REASSESSING GIANT PANDA HABITAT WITH SATELLITE-DERIVED BAMBOO INFORMATION: A CASE STUDY IN THE QINLING MOUNTAINS, CHINA
39
Figure 32 Habitat area inside and outside the nature reserves
Table 15 Landscape characteristics of habitat inside and outside the nature reserves
Habitat NP PD (km-2) ED (m/ha)
Inside nature reserves 391 0.3988 42.0092
Outside nature reserves 683 0.8259 53.0774

REASSESSING GIANT PANDA HABITAT WITH SATELLITE-DERIVED BAMBOO INFORMATION: A CASE STUDY IN THE QINLING MOUNTAINS, CHINA
40
The landscape in the Qinling Mountains Photographed by Tiejun Wang

REASSESSING GIANT PANDA HABITAT WITH SATELLITE-DERIVED BAMBOO INFORMATION: A CASE STUDY IN THE QINLING MOUNTAINS, CHINA
41
4. DISSCUSSION
4.1. Mapping bamboo distribution with Maxent In this study, bamboo distribution across large spatial extents was successfully predicted using remotely sensed data. MODIS EVI data with high temporal resolution reveals phenological characteristics of forests with understory bamboo, based on which the species-environment relationship is used for effective prediction in Maxent. MODIS data with a relatively coarse spatial resolution, which can be compensated by finer temporal resolution, is suitable for the study across the mountain range but may not suitable at smaller research scales, such as a single nature reserve. The series of the results of this study are not directly comparable to those produced by imageries with higher spatial resolutions. Maxent modeling based on the phenological characteristics derived from remotely sensed data is not an absolute innovation in understory vegetation mapping, or even bamboo mapping, but the approach taken in this study still has its own features.
It is a new idea to use panda presence data as a surrogate of bamboo presence samples for the input of Maxent modeling. This surrogate approach is employed based on a reasonable assumption that ecologically meaningful amount of bamboo must be present in the place for 300m round where individuals and traces of giant pandas have been observed. Without the replacement from the surrogate and this assumption, the prediction of Maxent based on giant panda occurrence data and multi-temporal EVI data ought to be explained as the possibility distribution of vegetational conditions that meet the needs of giant pandas, and it may be confusing and unconvincing to convert the Maxent output to bamboo distribution in a straightforward manner, though bamboo is the most important component of the vegetational conditions for giant pandas.
The environmental lays input to Maxent were one time series EVI data with 23 dimensions, while the same time series were taken a principle component analysis before they were used to classify the forest with MLC. The principle component analysis is needed to reduce the number of bands in case MLC is not able to handle the high correlation between bands; however, it is the subtle changes of the phenological characteristics of the time series that separate the understory bamboo from the overstory canopy without understory bamboo.
The 11 phenological metrics, such as base and maximum levels, start of season, and large and small integrals (Tuanmu et al., 2010), which were calculated based on three full phenological cycles in TIMESAT, were also tried as environmental variables for Maxent modeling. According to the previous study results, higher base and maximum levels, earlier start and middle of the season, higher integrals could reflect the difference from background and forest pixels with understory bamboo. However, this approach might not fit into this study; the predicted output from the 11 phenological metrics gets a kappa value of 0.56 and an AUC value of 0.83, which are not as good as the accuracy achieved using one time series EVI with 23 dimensions.
Maxent has been shown to work well in estimating species distribution from presence-only data in practice beyond any doubt. Meanwhile, Maxent also suffers many problems because of its log link structure. For instance, this model can result in estimated probabilities greater than one and the probability distribution estimated may be invalid (Phillips & Dudı´k, 2008; Ward et al., 2009). Therefore, Maxent is probably more powerful to rare species with small prevalence, which bamboo could not be in the Qinling Mountains. Another good model named boosted regression tree (BRT), which could avoid the above-mentioned problems, was once taken into consideration but unfortunately abandoned because the presence-only implementation of BRT had not released yet. However, the kappa value and AUC value for the prediction

REASSESSING GIANT PANDA HABITAT WITH SATELLITE-DERIVED BAMBOO INFORMATION: A CASE STUDY IN THE QINLING MOUNTAINS, CHINA
42
of bamboo distribution achieve 0.74 and 0.92 respectively, which prove the good predictive performance of Maxent in this study.
Additionally, due to the difference of main elevation ranges where Fargesia qinlingensis and Bashania fargessi grows, the two main bamboo species may be roughly separated with the help of the auxiliary data of elevation (Tuanmu et al., 2010). Mapping bamboo species distributions is not considered in this study since the main objective is to incorporate the bamboo information to assess the habitat quality for giant panda without seasonal migrants rather than mapping understory vegetation distributions, thus the overall bamboo distribution is considered having provided enough information.
4.2. Habitat suitability analysis Compared to some previous giant panda assessment studies in the Qinling Mountains (Xu et al., 2006b; Gong et al., 2010), the restrictions of the two topographic criteria, elevation and slope, are relaxed a bit. As interpreted in the section of selection and analysis of environmental factors, elevation range for giant panda is restricted to bamboo distribution and human activities. Now that bamboo and human factors are both used to evaluate the habitat suitability, the intervals of suitable and marginally suitable elevation range can be properly broadened; therefore, the lowest elevation that giant panda have reached in the historical records was chosen as the lower limit of elevation, which was also adopted in the research of quality factors and habitat assessment by Li et al. (2005a; 2005b). In this way, bamboo and human factors may amply demonstrate their influences on habitat use by giant pandas and play an effective role in habitat suitability analysis. As for topographic slope, latest research shows that this frequently used variable in habitat models for giant pandas is less important (Zhang et al., 2011), so that it is unnecessary to limit the suitable and marginally suitable intervals of slope too much. It is probably a better way to induct the intervals from the distributional characteristics of the preference of giant pandas to slope in this study.
It is no surprise that bamboo could predict the habitat use by giant pandas, but it is also said that there is a positive relationship between forest age and panda presence, possibly owning to the reasons that bamboo grows better underneath the old-growth forest and old-growth trees area large enough to form the cavities (Zhang et al., 2011). It is conceivable that the incorporation of the factor of forest age may achieve more accurate habitat suitability assessment. However, this attempt is excluded from this study due to the inaccessibility of ground true data and the big challenge to classify the old growth and secondary growth forests across the large spatial extent.
The suitability assessment of multiple factors employs the traditional framework of three suitability levels using overlay analysis and the resulted habitat distribution also has three corresponding suitability levels. This is not the only way to evaluate the habitat suitability; in recent years, ecological niche models have been commonly used to predict the locations of suitable habitat and help to understand niche requirements. It is feasible to use Maxent to model the habitat suitability distribution directly based on all the environmental layers of elevation, slope, time series MODIS EVI and human population density (Figure 33). Binarization of the continuous suitability distribution results habitat and non-habitat distribution (Figure 34) base on the optimal threshold of 0.38, which achieved a kappa value of 0.62 and an AUC value of 0.89. However, how to interpret the continuous output properly and link it with the traditional assessment models of grading the suitability levels is a thorny issue worth considering carefully.
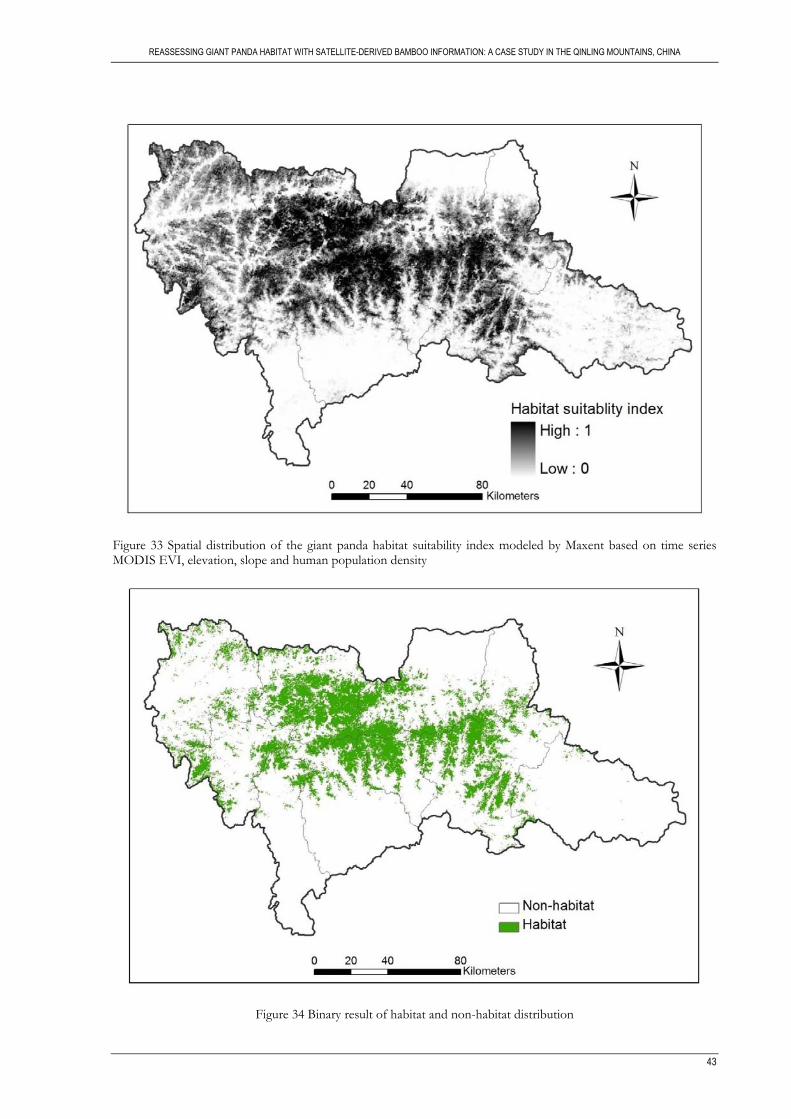
REASSESSING GIANT PANDA HABITAT WITH SATELLITE-DERIVED BAMBOO INFORMATION: A CASE STUDY IN THE QINLING MOUNTAINS, CHINA
43
Figure 33 Spatial distribution of the giant panda habitat suitability index modeled by Maxent based on time series MODIS EVI, elevation, slope and human population density
Figure 34 Binary result of habitat and non-habitat distribution

REASSESSING GIANT PANDA HABITAT WITH SATELLITE-DERIVED BAMBOO INFORMATION: A CASE STUDY IN THE QINLING MOUNTAINS, CHINA
44
The comparison study focuses on the changes of area and fragmentation degree in the three habitat estimations using bamboo and human factors step by step. The sharp drop in habitat area with bamboo information indicates overestimations of more than 70% and 80% in suitable habitat and marginally suitable habitat respectively, and the changes in all the fragmentation indicators point to more fragmented circumstances with bamboo information. When human factor is incorporated, some marginally suitable habitats changes to unsuitable habitats, and some suitable habitats degraded to marginally suitable or even unsuitable habitats. Human disturbances lead to a reduction of 33% in suitable habitat and a decrease of 63% in marginally suitable habitat, as well as more severe habitat fragmentation. The influence of human disturbances may be underestimated because the intensity of human activities could have been partly reflected in the vegetation information derived from the remotely sensed data. The three habitat estimations transform from pure natural ecology to natural-social ecology, from exaggerated estimation to more realistic situations, displaying the decisive effect of bamboo and the circumstance of humans advancing while pandas retreating.
4.3. Quantification of the habitat status and conservation implications The distribution and quality of giant panda habitat were obtained based on remote sensing and GIS techniques, combined with biological characteristics of giant pandas. Results from habitat reassessment show that the total area of giant panda habitat in the Qinling Mountains is about 1808 km2, consisting of suitable habitat and marginally suitable habitat. According to the investigation results from the third national giant panda survey, the existing habitat covered about 3437 km2; while the potential habitat, which defined as natural forests with the possibility of habitat restoration in the future, was not the same type of habitat results of this study to be compared with. Obviously, the area of the reassessed giant panda habitat with bamboo information reduces a lot as expected, and the investigation result from ground survey assisted by visual interpretation of vegetation information from imagery overmeasured the habitat area by 47%, mainly because the bamboo information was imprecise and contiguous on a large scale.
Among the ten counties with giant panda distributed potentially, Taibai, Zhouzhi and Ningshan have the largest habitat area, in accord with the investigation results of the third national giant panda survey in Shaanxi Province; some counties have small habitat area where the traces of giant panda presence have not been found, among which the very few patches scattered in Fengxian and Zhenan have rarely ecological meanings to giant pandas. These two counties were also excluded from existing habitat in the third national giant panda survey. Regarding the vertical distribution, giant panda habitat primarily distributed in mid-elevation areas, which have been protected by the nature reserve network; whereas habitat also exists at lower elevations in Foping and Guanyinshan Nature Reserves and some other places with low influence of human disturbances (Feng et al., 2009). Therefore, it is also demonstrated that the elevation lower limit of giant panda habitat is closely tied to the intense of human activities, and it is a proper way to broaden the elevation range and use human population density to assess the habitat suitability instead of making the lower limit rigidly uniform.
Among the 18 nature reserves, the first five with protecting the largest habitat area are Foping National Nature Reserve, Huangbaiyuan Nature Reserve, Taibaishan National Nature Reserve, Zhouzhi National Nature Reserve and Changqing National Nature Reserve. It can be seen that the above-mentioned four national nature reserves play the most important role in giant panda conservation, while Sangyuan and Tianhuashan Nature Reserves, which were promoted to national level in recent years, seem weaker in the protective capability. Meanwhile, some nature reserves with small habitat area inside do not have enough natural resources to provide good inhabiting conditions to giant pandas. It is suggested that the limited resources of conservation management and funding should lean to those reserves that have significant meanings to giant pandas and put habitat restoration in force in those reserves that could not effectively protect giant pandas.
REASSESSING GIANT PANDA HABITAT WITH SATELLITE-DERIVED BAMBOO INFORMATION: A CASE STUDY IN THE QINLING MOUNTAINS, CHINA
45
Through protracted and unremitting efforts put into giant panda conservation, some nature reserves have made achievements in protecting giant pandas, but the imbalance of giant panda population exists in these nature reserves. Some reserves may not capable to carry so many individuals and some reserves still have much protecting space. The theoretical carry capacity of each nature reserve can be calculated as the habitat area inside the nature reserve divided by the average home range of giant pandas, which is about 3 km2 in the Qinling Mountain region (Liu et al., 2002). Hence, the theoretical carrying capacity of Foping Nature Reserve is 50, but the current number of giant pandas is about 76; while there are 21 and 11 giant pandas in Zhouzhi Nature Reserve and Taibaishan Nature Reserve with the carrying capacity of 36 and 47, respectively. High population densities may increase intraspecies competition and lead to disease epidemics, then restrict giant panda population growth and sustainability (Zhou & Pan, 1997). Therefore, giant pandas need to expand their territories to those usable habitats to keep the balanced and sustainable development for the long-term survival; meanwhile, reforestation and bamboo plantation may help to increase the habitat area and improve the carrying capacity.
The Chinese government has kept on focusing on reforestation, natural forests protection and wildlife conservation within the period of current five-year plan (2011-2015) for national economic and social development of China in the respect of forestry ecology construction. The common strategy for species conservation in fragmented landscapes is to establish new reserves or corridors to connect isolated habitat patches and nature reserves (Beier & Noss, 1998). The countrywide nature reserve system was reportedly to be increased by about 180000 km2 of land area between 2010 and 2020, so that there are opportunities to establish new nature reserves and ecological corridors to expand giant panda habitat and increase the connectivity among them (Viña et al., 2010), such as Niangniangshan Nature Reserve in Foping and Panlong Nature Reserve in Chenggu, two wildlife protection construction projects in the five-year plan.
From the point of view of habitat area, little more than half of the giant panda habitat in the Qinling Mountains is under protection, which is lower than the released number of 72% (Cao, 2006) from the provincial government of Shaanxi Province. There is still a large amount of giant panda habitat outside the nature reserves, accounting for 46% of the total habitat area. However, the current conservation is not as inadequate and inefficient as it seems, considering the differences of the fragmentation configuration of the habitat inside and outside the nature reserves; most of large patches of the core habitat are mainly protected by the nature reserves, and a mass of small, scattered and fragmentary patches are left outside. In this case, it is not practical to set up new nature reserves or extend the established nature reserves blindly so as to cover the entire habitat in the Qinling Mountains. For those unprotected habitats with small and isolated patches, it is more important to restore the damaged area and improve the habitat quality in order to meet long-term survival needs of giant pandas.
Some important areas deserving of attentions as candidates for new nature reserves and ecological corridors are indentified in Figure 35. These areas cover more or less suitable and marginally suitable habitats, and more importantly, they are able to link up the segregated nature reserves to form a better and more complete network of conservation. Particularly, Area A connects Taibaishan and Niuweihe Nature Reserves, Area B links up Niuweihe to Changqing and Huangbaiyuan Nature Reserves, Area C improves the connectivity of the nature reserves between Taibaishan, Laoxiancheng and Zhouzhi, and Area D fills the gap in Ningshan between the east group of nature reserves and the main part. Moreover, lots of suitable habitat patches all round Area A and Area D extending northeast should be protected maybe by new nature reserves after the practical investigation of habitat use by giant pandas in these areas. It is also suggested to establish a dispersal corridor spreading to the southwest of the study area through bamboo plantation to encourage gene flow with the giant pandas in area linking up the Qinling Mountains and the Minshan Mountains, which also has a positive effect on protecting other rare and endangered species.

REASSESSING GIANT PANDA HABITAT WITH SATELLITE-DERIVED BAMBOO INFORMATION: A CASE STUDY IN THE QINLING MOUNTAINS, CHINA
46
Figure 35 Important areas (A-D) for new nature reserves or ecological corridors

REASSESSING GIANT PANDA HABITAT WITH SATELLITE-DERIVED BAMBOO INFORMATION: A CASE STUDY IN THE QINLING MOUNTAINS, CHINA
5. CONCLUSIONS AND RECOMMENDATIONS
5.1. Conclusions This study fulfills the habitat reassessment for giant pandas in the Qinling Mountains based on the techniques of remote sensing and geographic information system. The analyses within single reserve in most cases are not adequate to monitor the habitat for the long-term survival of giant pandas, while the analysis across the entire geographic range is likely to lump the different criteria in different mountains together, which may go against the division of suitability levels of the habitat. The mountain range, by contrast, is a suitable research scale to assess giant panda habitat for decision-making of conservation management. In this study, three aspects have been explored corresponding to the research objectives: a) distribution of understory bamboo, which is most important factor to giant panda habitat, was predicted from panda presence data and multi-temporal EVI data; b) habitat estimations with and without satellite- derived bamboo information and human impact were compared; c) habitat distribution and conservation status were evaluated. The specific conclusions drawn from this study can be summarized as follows:
Giant panda occurrence data can be used as a surrogate of bamboo occurrence data and to successfully predict the spatial distribution of bamboo based on the phenological characteristics contained in time series MODIS EVI data (kappa: 0.74; AUC: 0.92), and the amount of predicted bamboo ought to be considered adequate food supplies for giant pandas. There have been relatively complete panda occurrence data collected during the routine conservation work and national giant panda survey, which are much easier to obtain compared to collecting large bamboo samples. Therefore, the surrogate approach in this study is supposed to facilitate understory bamboo mapping and improve giant panda habitat assessment in other mountain regions.
Comparisons of the three habitat estimations highlight the influences of bamboo information and human impacts on giant panda habitat suitability classification. Deficiency of bamboo information may bring about a huge overestimation of the total habitat area and a serious underestimation of the habitat fragmentation degree. Incorporation of human impact will lead to a further decrease in total habitat area and more fragmented living conditions, which is of utmost importance to the long-term viability of giant pandas.
The total area of giant panda habitat in the Qinling Mountains is approximately 1808 km2, which is mostly distributed within the territories of Taibai, Zhouzhi, Ningshan, Foping and Yangxian at middle elevation range from 1500m to 2400m. By and large, around 54% of the total habitat is inside the nature reserves, and most of the large habitat patches with good quality are under protection, but the habitat area and its proportion in the nature reserve make a great difference from each other, among which Foping National Nature Reserve has the highest conservation efficiency. Some habitat areas outside the nature reserves are the important ecological corridors connecting the isolated nature reserves, and there are still some unprotected suitable habitats demand attention and conservation in the future.
5.2. Recommendations Nature is common but complicated, and models, which reflect the characteristics and behaviors of nature system rather than its actual structure, are not able to fully disclosure the objective laws and internal relations of the components in nature. Human disturbances have a significant effect on habitat selection of giant panda, which are just indicated by a general index of human population density in this study. In order to further understand the impacts of human activities, it is suggested to choose some specific
47

REASSESSING GIANT PANDA HABITAT WITH SATELLITE-DERIVED BAMBOO INFORMATION: A CASE STUDY IN THE QINLING MOUNTAINS, CHINA
48
indicators for habitat suitability analysis, such as the distances to hierarchical roads. However, it is worth emphasizing that the more indices taken into consideration in the evaluation system to simulate the reality, the more complicated the model will turn to be, which needs more computational cost.
The combination of RS and GIS techniques provides a more scientific basis for giant panda conservation and management, and this advantage should be better utilized. The routines of spatial information collection are restricted to each nature reserve, while it is better to integrate the information and build a database of the entire mountain range. It is also suggested to develop giant panda habitat evaluation systems based on the actual situations of different mountains to implement habitat assessment in each mountain region faster and more convenient. The GIS platforms with consensus standards within mountain range will facilitate later research work and improve the conservation management of giant pandas and their habitats.
At the time of protecting giant panda and other wildlife, it requires consideration to make a strategic decision with an eye to the demands of local social and economic development. There have been some contradictions between the protection of ecological environment and the development of society and economy; nature reserves ensure the security of species’ living environment by shutting off all human activities that may have an adverse effect, which undoubtedly hampers the local economic development. Obviously, it is not infeasible to establish nature reserves at will, and only through habitat ranking based on habitat assessment in accord with reality, actions could be taken to suit the local circumstances and the optimal strategy could be work out to balance ecological conservation and social economic development.

49
LIST OF REFERENCES Araújo, M. B., Pearson, R. G., Thuiller, W., & Erhard, M. (2005). Validation of species–climate impact
models under climate change. Global Change Biology, 11(9), 1504-1513. Beier, P., & Noss, R. F. (1998). Do habitat corridors provide connectivity? Conservation Biology, 12, 1241-
1252. Byrne, G. F., Crapper, P. F., & Mayo, K. K. (1980). Monitoring land-cover change by principal
component analysis of multitemporal landsat data. Remote Sensing of Environment, 10(3), 175-184. Cao, L. (2006). The nature reserve network system for the giant panda in the Qinling Mountains will be
formed in 15 years (in Chinese). Retrieved 13, March, 2011, from http://www.gov.cn/gzdt/2006-06/18/content_313644.htm
Cohen, J. (1960). A coefficient of agreement for nominal scales. Education and Psychological Measurement, 20, 37-46.
Dierenfeld, E. S., Hints, H. F., Robertson, J. B., van Soest, P. J., & T., O. O. (1982). Utilization of bamboo by the giant panda. Journal of Nutrition, 112, 636-641.
Earth Observing System Data and Information System (EOSDIS). (2009). Earth Observing System ClearingHOuse (ECHO) / Warehouse Inventory Search Tool (WIST). from EOSDIS, Goddard Space Flight Center (GSFC) National Aeronautics and Space Administration (NASA): https://wist.echo.nasa.gov/api/
Elith, J. (2000). Quantitative Methods for Modeling Species Habitat: Comparative Performance and an Application to Australian Plants. In S. Ferson & M. Burgman (Eds.), Quantitative Methods for Conservation Biology (pp. 39-58). New York: Springer-Verlag.
Elith, J., Graham, C. H., Anderson, R. P., Dudik, M., Ferries, S., Guisan, A., et al. (2006). Novel methods improve prediction of species' distributions from occurrence data. Ecography, 29, 129-151.
FAO. (2000). On definitions of forest and forest change (Forest Resources Assessment Programme, Working Paper No. 33). Rome, Italy: FAO.
Feng, T.-T., van Manen, F. T., Zhao, N.-X., Li, M., & Wei, F.-W. (2009). Habitat assessment for giant pandas in the Qinling Mountain region of China. Journal of Wildlife Management, 73(6), 852-858.
Fielding, A. H., & Bell, J. F. (1997). A review of methods for the assessment of prediction errors in conservation presence/absence models. Environmental Conservation, 24(1), 38-49.
Freeman, E. A., & Moisen, G. (2008). PresenceAbsence: An R Package for Presence Absence Analysis. Journal of Statistical Software, 23(11 ), 1-31.
Gitelson, A. A. (2004). Wide Dynamic Range Vegetation Index for Remote Quantification of Biophysical Characteristics of Vegetation. Journal of Plant Physiology, 161, 165-173.
Gong, M., Yang, Z., Yang, W., & Song, Y. (2010). Giant panda habitat networks and conservation: is this species adequately protected? Wildlife Research, 37, 531-538.
Goodall, J. M., & Naudé, D. C. (1998). An ecosystem approach for planning sustainable management of environmental weeds in South Africa. Agriculture, Ecosystems & Environment, 68(1-2), 109-123.
Guisan, A., & Thuiller, W. (2005). Predicting species distribution: offering more than simple habitat models. Ecology Letters, 8(9), 993-1009.
Hu, J. C. (1985). Geographic and ecological distribution of the giant panda (in Chinese). Journal of Sichuan Normal College, 6, 7-15.
IUCN. (2007). 2007 IUCN Red List of Threatened Species. In World Conservation Union (Ed.). Gland, Swizerland.
Jönsson, P., & Eklundh, L. (2004). TIMESAT--a program for analyzing time-series of satellite sensor data. Computers & Geosciences, 30(8), 833-845.
Japanese Association of Remote Sensing. (1999). Remote Sensing Notes. Text books on Remote Sensing and GIS Retrieved January 26, 2011, from http://sar.kangwon.ac.kr/etc/rs_note/rsnote/cp11/cp11-7.htm
Landis, J. R., & Koch, G. G. (1977). The Measurement of Observer Agreement for Categorical Data. Biometrics, 33(1), 159-174.
Li, J., Li, T., Jin, X., Liu, X., & Tang, G. (2005a). The Quality Evaluation of Giant Panda's Habitat Based on Analytic Hierarchy Process (in Chinese with English abstract). Journal of Moutain Science, 23(6), 694-701.

50
Li, J., Li, T., Jin, X., Liu, X., & Wu, L. (2005b). Research on quality factors of giant panda's habitat in Qinling area based on GIS (in Chinese with English abstract). Geography and Geo-Information Science, 21(1), 38-42.
Linderman, M., Liu, J., Qi, J., An, L., Ouyang, Z., Yang, J., et al. (2004). Using artificial neural networks to map the spatial distribution of understorey bamboo from remote sensing data. International Journal of Remote Sensing, 25(9), 1685-1700.
Liu, C., Berry, P. M., Dawson, T. P., & Pearson, R. G. (2005). Selecting thresholds of occurrence in the prediction of species distributions. Ecography, 28, 385-393.
Liu, J., Linderman, M., Ouyang, Z., An, L., Yang, J., & Zhang, H. (2001). Ecological degradation in protected areas: the case of Wolong Nature Reserve for giant pandas. Science, 292, 98-101.
Liu, J., Ouyang, Z., Taylor, W., Groop, R., Tan, Y., & Zhang, H. (1999). A Framework for Evaluating the Effects of Human Factors on Wildlife Habitat: the Case of Giant Pandas. Conservation Biology, 13(6), 1360-1370.
Liu, X., Skidmore, A. K., Wang, T., Yong, Y., & Prins, H. H. T. (2002). Giant panda movements in Foping Nature Reserve, China. The Journal of Wildlife Management, 66(4), 1179-1188.
Loucks, C. J., Lu, Z., Dinerstein, E., Wang, D. J., Fu, D. L., & Wang, H. (2003). The giant pandas of the Qinling Mountains, China: a case study in designing conservation landscapes for elevational migrants. Conservation Biology, 17(2), 558-565.
Manel, S., Williams, H. C., & Ormerod, S. J. (2001). Evaluating presence–absence models in ecology: the need to account for prevalence. Journal of Applied Ecology, 38, 921-931.
Matsushita, B., Yang, W., Chen, J., Onda, Y., & Qiu, G. (2007). Sensitivity of the Enhanced Vegetation Index (EVI) and Normalized Difference Vegetation Index (NDVI) to Topographic Effects: A Case Study in High-Density Cypress Forest. Sensors, 7, 2636-2651.
McAlpine, C. A., & Eyre, T. J. (2002). Testing landscape metrics as indicators of habitat loss and fragmentation in continuous eucalypt forests (Queensland, Australia). Landscape Ecology, 17(8), 711-728.
McGarigal, K., & Cushman, S. A. (2002). Comparative Evaluation of Experimental Approaches to the Study of Habitat Fragmentation Effects. Ecological Applications, 12(2), 335-345.
McGarigal, K., Cushman, S. A., Neel, M., & Ene., E. (2002). FRAGSTATS: Spatial Pattern Analysis Program for Categorical Maps (Version 3.3 for Raster). Amherst, Massachusetts: UMass Landscape Ecology Lab.
NASA. Vegetation Indices. Retrieved 12, January, 2011, from http://modis-land.gsfc.nasa.gov/vi.htm Ng, A. Y., & Jordan, M. I. (2001). On Discriminative vs. Generative classifiers: A comparison of logistic
regression and naive Bayes Advances in Neural Information Processing Systems 14, 605-610. Nie, S. (1981). Physical geography in Shaanxi Province. Xi'an: Shaanxi People's Press. Osborne, P. E., Alonso, J. C., & Bryant, R. G. (2001). Modelling landscape-scale habitat use using GIS and
remote sensing: a case study with great bustards. Journal of Applied Ecology, 38, 458-471. Ouyang, Z., Liu, J., Xiao, H., Tan, Y., & Zhang, H. (2001). An assessment of giant panda habitat in
Wolong Nature Reserve (in Chinese with English abstract). Acta Ecologica Sinica, 21(11). Pan, W., Lü, Z., Zhu, X., Wang, D., & et al. (2001). A chance for lasting survival (in Chinese). Beijing: Beijing
University Press. Phillips, S. J., Anderson, R. P., & Schapire, R. E. (2006). Maximum entropy modeling of species
geographic distributions. Ecological Modelling, 190(3-4), 231-259. Phillips, S. J., & Dudı´k, M. (2008). Modeling of species distributions with Maxent: new extensions and a
comprehensive evaluation. Ecography, 31, 161-175. Schaller, G. B., Hu, J., Pan, W., & Zhu, J. (1985). The giant pandas of Wolong. Chicago: University of Chicago
Press. State Forestry Administration. (2006). The Third National Survey Report on Giant Panda in China (in Chinese).
Beijing: Science Press. Swets, J. A. (1988). Measuring the Accuracy of Diagnostic Systems. Science, 240(4857), 1285-1293. Tuanmu, M.-N., Viña, A., Bearer, S., Xu, W., Ouyang, Z., Zhang, H., et al. (2010). Mapping understory
vegetation using phenological characteristics derived from remotely sensed data. Remote Sensing of Environment, 114(8), 1833-1844.
Viña, A., Bearer, S., Chen, X., He, G., Linderman, M., An, L., et al. (2007). Temporal changes in giant panda habitat connectivity across boundaries of Wolong Nature Reserve, China. Ecological Applications, 17(4), 1019-1030.

51
Viña, A., Bearer, S., Zhang, H. M., Ouyang, Z. Y., & Liu, J. G. (2008). Evaluating MODIS data for mapping wildlife habitat distribution. Remote Sensing of Environment, 112(5), 2160-2169.
Viña, A., Tuanmu, M.-N., Xu, W., Li, Y., Ouyang, Z., DeFries, R., et al. (2010). Range-wide analysis of wildlife habitat: Implications for conservation. Biological Conservation, 143(9), 1960-1969.
Wang, J., & Chen, Y. (2004). Applications of 3S Technology in Wildlife Habitat Researches (in Chinese with English abstract). Geography and Geo-Information Science, 20(6), 44-47.
Wang, T., Skidmore, A. K., & Toxopeus, A. G. (2009a). Improved understorey bamboo cover mapping using a novel hybrid neural netwok and expert system. International Journal of Remote Sensing, 30(4), 965-981.
Wang, T., Skidmore, A. K., Toxopeus, A. G., & Liu, X. (2009b). Understorey bamboo discrimination using a winter image. Photogrammetric Engineering & Remote Sensing, 75(1), 37-47.
Wang, T., Ye, X., Skidmore, A. K., & Toxopeus, A. G. (2010). Characterizing the spatial distribution of giant pandas (Ailuropoda melanoleuca) in fragmented forest landscapes. Journal of Biogeography, 37, 865-878.
Wang, X., Xu, W., & Ouyang, Z. (2009c). Impacts of spatio-temporal changes in agricultural land on giant panda habitat: A case study in the Baicaohe watershed of the mid-Minshan Mountains (in Chinese with English abstract). Biodiversity Science, 17(1), 10-18.
Ward, G., Hastie, T., Barry, S. C., Elith, J., & Leathwick, J. R. (2009). Presence-only data and the EM algorithm. Biometrics, 65, 554-563.
WWF China. Conservation programmes. Retrieved 10, August, 2010, from http://www.wwfchina.org/english/sub_loca.php?loca=27&sub=90#c
Xu, W., Ouyang, Z., Jiang, Z., Zheng, H., & Liu, J. (2006a). Assessment of giant panda habitat in the Daxiangling Mountain Range, Sichuan, China (in Chinese with English abstract). Biodiversity Science, 14(3), 223-231.
Xu, W., Ouyang, Z., Li, Y., & Liu, J. (2006b). Habitat assessment on giant panda's in Qinling Mountain range based on RS and GIS (in Chinese with English abstract). Remote Sensing Technology and Application, 21(3), 238-242.
Xu, W., Wang, X., Ouyang, Z., Zhang, J., Li, Z., Xiao, Y., et al. (2009). Conservation of giant panda habitat in South Minshan, China, after the May 2008 earthquake. Frontiers in Ecology and the Environment, 7(7), 353-358.
Zhang, S., Ran, J., Zhang, M., Du, P., Yang, Q., & Liu, S. (2008). Landscape pattern analysis of red panda habita t in Liangshan Mountains (in Chinese with English abstract). Acta Ecologica Sinica, 28(10), 4787-4795.
Zhang, Z., Swaisgood, R. R., Zhang, S., Nordstrom, L. A., Wang, H., Gu, X., et al. (2011). Old-growth forest is what giant pandas really need. Biology Letters, 1-4.
Zhou, Z., & Pan, W. (1997). Analysis of the Viability of a Giant Panda Population. Journal of Applied Ecology, 34(2), 363-374.
Zhu, L., Zhan, X., Meng, T., Zhang, S., & Wei, F. (2010). Landscape features influence gene flow as measured by cost-distance and genetic analyses: a case study for giant pandas in the Daxiangling and Xiaoxiangling Mountains. BMC Genetics, 11(1), 72.