reanalysis datasets for solar resource assessment - 2014 spi
TRANSCRIPT
Page Internal use © Vaisala
How Good Are the Second Generation Reanalysis Datasets?
Gwendalyn Bender, Product Manager for Energy Assessment William Gustafson, Scientific Programmer
Louise Leahy Ph.D, Resource Assessment Analyst Mark Stoelinga Ph.D, Senior Scientist
Vaisala
INTRODUCTION The best satellite datasets in the solar industry don’t go back more than 15 or so years, but we must make a 20+ year investment in our solar projects. Can we use an alternative to satellite modeled resource data, such as reanalysis datasets that go back more than 30 years, to get a more accurate picture of future performance?
WHAT ARE REANALYSIS DATASETS? Global, gridded, 3-dimensional descriptions of all weather variables at sub-daily time resolution over a period of several decades produced by governmental agencies
Produced by feeding all available observations (ground and satellite) into a data assimilation (DA) system, which uses a global numerical weather prediction model to “fill in the gaps” while retaining fidelity to the available observations.
The modeling and DA are performed consistently over the entire period of record, to ensure that at least the DA method does not introduce discontinuities in the data.
Reanalysis datasets have multiple sources of observation collection, such as tower networks and satellite data, to inform numerical weather prediction simulations. What makes a reanalysis dataset is that the data is consistently and continuously processed providing multiple decades of data to work with. This means that the data may have bias but because it is consistent it can be removed on a site-by-site basis.
The the solar resource information coming out of the reanalysis datasets is not widely used because it is generally accepted that early reanalysis models did not properly resolve the cloud layers. Due to Vaisala’s work in the wind energy space, we were inspired to look at these datasets for solar resource assessment. Our aim was to see if advances in the production of the second generation datasets would improve their usability in solar as they have in the wind space.
First-Generation: NCAR/NCEP Reanalysis Project (NNRP) Produced in the mid-1990’s with a course resolution (2.5 deg) underlying model and data from 1948 up to the past few days. Older DA system. Other follow-up datasets, with slight improvements: ERA-15, ERA-40, JRA-25, R2
Second-Generation: CFSR (NOAA / National Weather Service / NCEP) ERA-Interim (European Centre for Med. Range Weather Forecasts) MERRA (NASA) Produced in mid to late-2000’s with a 34-year record with a high-resolution (~0.5 degree) underlying model. Updated DA system. Updates lag a few weeks. More output variables, vertical levels, and temporal frequency
RECORD EXTENSION Can we use a correction to ground observations to adjust for the reanalysis data’s inability to resolve clouds properly? If we can confidently bias correct time series from reanalysis data, our energy estimates could be made from a 30+ year record. In addition, satellite algorithms currently in use don’t always resolve all climates equally well, notably desert environments are challenging, and having another option could be useful.
5 sample sites with multiple years of high quality publicly available GHI observations Selected sites represent a variety of climates, some of which the satellite data does well in and some that provide challenges
Model Output Statistics (MOS) is the method used for bias correction 1 year of the observational data used for training Compared results to ~2 years outside the training period (i.e. not used for correction) Corrected the satellite data as a baseline for what we were trying to achieve Corrected the MERRA data as it performed the best in the prior validation
All results shown in Figure 4 are for the years outside the training period
CONCLUSIONS
In conclusion, using the reanalysis data for a long-term record extension in solar is not an option at this time. It is simply not better than the methods we already have established. However, if the market shows interest in a record extension, there is more work that could be done. For example, we could use available satellite data as a training period, use other variables (particularly temperature) to inform the correction, or try custom NWP modeling to see if that would improve results.
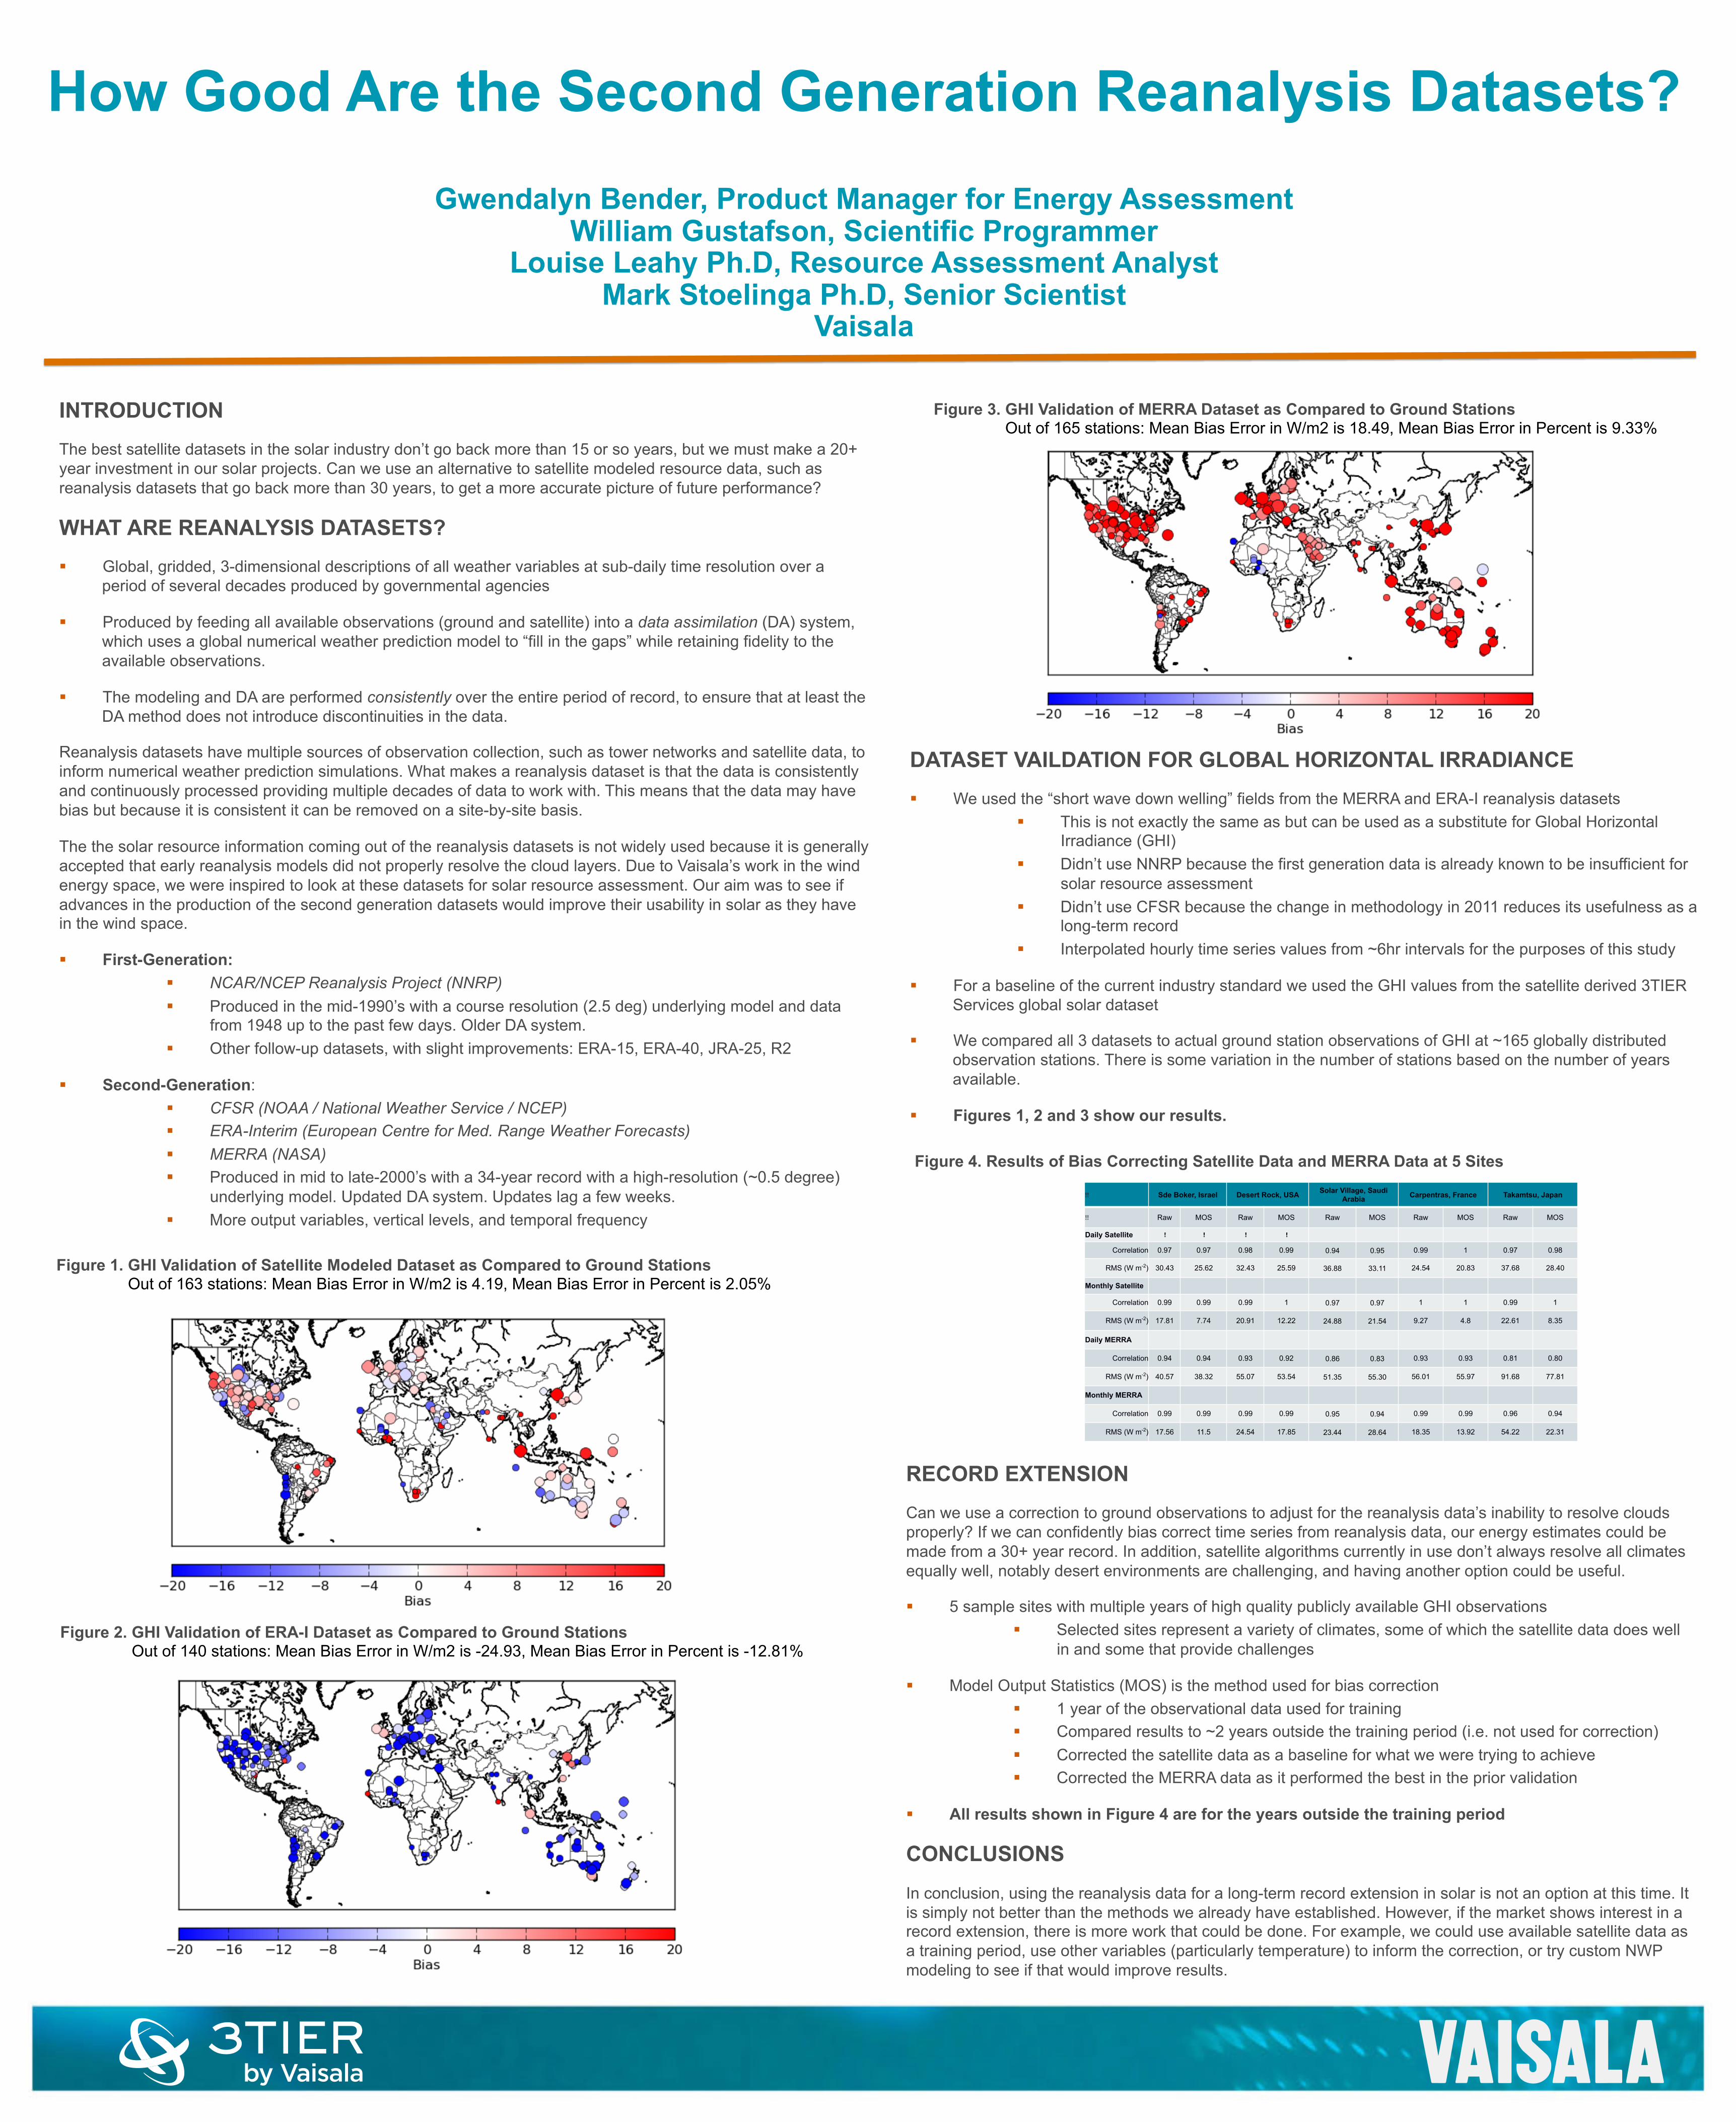
DATASET VAILDATION FOR GLOBAL HORIZONTAL IRRADIANCE We used the “short wave down welling” fields from the MERRA and ERA-I reanalysis datasets
This is not exactly the same as but can be used as a substitute for Global Horizontal Irradiance (GHI) Didn’t use NNRP because the first generation data is already known to be insufficient for solar resource assessment Didn’t use CFSR because the change in methodology in 2011 reduces its usefulness as a long-term record Interpolated hourly time series values from ~6hr intervals for the purposes of this study
For a baseline of the current industry standard we used the GHI values from the satellite derived 3TIER Services global solar dataset
We compared all 3 datasets to actual ground station observations of GHI at ~165 globally distributed observation stations. There is some variation in the number of stations based on the number of years available.
Figures 1, 2 and 3 show our results.
Figure 1. GHI Validation of Satellite Modeled Dataset as Compared to Ground Stations Out of 163 stations: Mean Bias Error in W/m2 is 4.19, Mean Bias Error in Percent is 2.05%
Figure 2. GHI Validation of ERA-I Dataset as Compared to Ground Stations Out of 140 stations: Mean Bias Error in W/m2 is -24.93, Mean Bias Error in Percent is -12.81%
Figure 3. GHI Validation of MERRA Dataset as Compared to Ground Stations Out of 165 stations: Mean Bias Error in W/m2 is 18.49, Mean Bias Error in Percent is 9.33%
!! Sde Boker, Israel Desert Rock, USA Solar Village, Saudi Arabia Carpentras, France Takamtsu, Japan
!! Raw MOS Raw MOS Raw MOS Raw MOS Raw MOS
Daily Satellite !! !! !! !!
Correlation 0.97 0.97 0.98 0.99 0.94 0.95 0.99 1 0.97 0.98
RMS (W m-2) 30.43 25.62 32.43 25.59 36.88 33.11 24.54 20.83 37.68 28.40
Monthly Satellite
Correlation 0.99 0.99 0.99 1 0.97 0.97 1 1 0.99 1
RMS (W m-2) 17.81 7.74 20.91 12.22 24.88 21.54 9.27 4.8 22.61 8.35
Daily MERRA
Correlation 0.94 0.94 0.93 0.92 0.86 0.83 0.93 0.93 0.81 0.80
RMS (W m-2) 40.57 38.32 55.07 53.54 51.35 55.30 56.01 55.97 91.68 77.81
Monthly MERRA
Correlation 0.99 0.99 0.99 0.99 0.95 0.94 0.99 0.99 0.96 0.94
RMS (W m-2) 17.56 11.5 24.54 17.85 23.44 28.64 18.35 13.92 54.22 22.31
Figure 4. Results of Bias Correcting Satellite Data and MERRA Data at 5 Sites