realizing the 15 percent solution...realizing the 15 percent solution: reforms to establish a...
TRANSCRIPT

Realizing the 15 Percent Solution:Reforms to Establish a Pro-Growth Budget
Wayne Winegarden
BEYOND the NEW NORMALHow Much Should We Spend?
PART TWO
FEBRUARY 2019

Realizing the 15 Percent Solution: Reforms to Establish a Pro-Growth BudgetWayne Winegarden
Pacific Research Institute 101 Montgomery Street, Suite 1300San Francisco, CA 94104 Tel: 415-989-0833 Fax: 415-989-2411 www.pacificresearch.org
Download copies of this study at www.pacificresearch.org.
Nothing contained in this report is to be construed as necessarily reflecting the views of the Pacific Research Institute or as an attempt to thwart or aid the passage of any legislation.
©2019 Pacific Research Institute. All rights reserved. No part of this publication may be re-produced, stored in a retrieval system, or transmitted in any form or by any means, electronic, mechanical, photocopy, recording, or otherwise, without prior written consent of the publisher.

CONTENTSExecutive Summary................................................................................................................4Introduction .............................................................................................................................7Why an Affordable Expenditure Path? ............................................................................10Comparing the Current Budget Path to the Affordable Budget ...............................13Establishing an Affordable Budget .................................................................................. 17Reforming Social Security .................................................................................................19Reforming Medicare, Medicaid and Other Health Programs .....................................21Making Transfer Payments Affordable ............................................................................26Prioritizing Defense Expenditures ................................................................................. 30Addressing the Threat from Interest Costs ..................................................................33Imposing Budget Discipline on the Remaining Discretionary Expenditures ........ 36Conclusion ............................................................................................................................. 38Endnotes .................................................................................................................................41About the Author ................................................................................................................. 45About PRI ............................................................................................................................... 46
4 Beyond the New Normal: How Much Should We Spend?
Executive SummaryThe federal government currently spends an unaffordable amount of money. Based on the re-search developed in Part 5 of the Pacific Research Institute’s Beyond the New Normal series, the affordable size of government is defined as the level of spending that maximizes the economy’s growth rate – or when the federal government is spending between 14 percent and 16 percent of national income. As of 2018, federal spending was 23.8 percent of national income, or sig-nificantly above the affordability threshold. Even more troubling, if the current trends are not altered, then total federal government spending will grow to 32.8 percent of national income by 2044. The consequence from our unaffordable government is diminished current, and future, economic prosperity.
A slow-growth economic future is not inevitable, but avoiding this outcome requires transfor-mational reforms to the government’s finances. The purpose of this paper, Part 6 of the Pacific Research Institute’s Beyond the New Normal series, is to demonstrate that comprehensive budget reforms can transition the federal government to an affordable size. By making the federal gov-ernment affordable, the economy’s prospects will brighten, and broad-based income growth will flourish.
The analysis demonstrates that creating an affordable government is possible by imposing a hard budget constraint, and then implementing key expenditure reforms that will significantly slow the growth in government spending while still adequately funding vital public programs (e.g. income support, Medicare, and Social Security). These expenditure reforms illustrate that an affordable federal government is a realistic goal.
The study suggests reforms in six broad areas.
Social Security Reforms: The government currently spends nearly $1 on Social Security for every $4 it spends. Future Social Security benefits will subsume an even larger share of the budget, indicating that Social Security is a major driver of the government’s unaffordability problem. There are commonsense reforms that could alter this outcome, however. The growth in Social Security expenditures can be significantly reduced if the current practice of over-adjusting ben-efits for inflation is eliminated and the full retirement age is adjusted to reflect the reality that people live longer and healthier lives. Compared to the baseline spending patterns, these reforms can directly reduce Social Security expenditures by 13.5 percent by 2044. These reforms do not impact the core function of Social Security, and only eliminate excessively generous benefits, therefore Social Security’s ability to serve its primary function of ensuring a secure retirement for elderly persons is not jeopardized.
Reforms to Health Care Programs: The federal expenditures on health care (mainly through Medicare and Medicaid) are another primary driver of the government’s unaffordability problem. This growth can be significantly reduced through a two-part strategy. First, by implementing broad-based health care reforms that remove the government-created barriers to practicing med-icine and improve how health care is financed. Second, by reforming Medicare and Medicaid.

5Realizing the 15 Percent Solution: Reforms to Establish a Pro-Growth Budget
Medicare reforms should eliminate the fee-for-service model and move toward a market-based system where payments directly support seniors, which would make Medicare more like Social Security. Medicaid should be turned into a block grant program to the states, or, like Medicare, Medicaid payments should be directly made to recipients. In combination, this strategy will slow the growth in health care costs and empower the federal government to control future outlays. Constraining the growth in federal health care outlays to 4.0 percent per year can reduce Medi-care expenditures by 43.8 percent relative to the baseline and other health expenditures by 42.0 percent.
Income Transfer Programs: Outside of Social Security and health care, there are many other gov-ernment programs whose primary function is to take money away from some people and give that money to others. Some of these programs, such as all corporate welfare programs, are un-justifiable and should be eliminated. Other programs, particularly the billions of dollars spent on income support programs, are worthy, but require reforms. The government currently operates more than 72 income support programs, these should be consolidated, preferably to a cash-based system, that eliminates the current disincentives to work. Such a system would improve low-in-come families’ ability to obtain a middle-class lifestyle and would enable the federal government to regain control over future outlays. Given the current high expenditure levels (the federal government alone spends $26,073 per household below $30,000), the growth in income support expenditures should be capped at inflation, ensuring that the purchasing power of the income support programs are maintained while improving the affordability of the federal income sup-port programs. Relative to national income, such a cap would decrease income support expen-ditures by more than half (from 1.8 percent of national income in 2020 to 0.7 percent in 2044).
Defense Savings: Due to the recent erratic funding of defense programs, coupled with political-ly-motivated expenditure prioritizations, there is an opportunity to cap the growth in military spending while improving the military’s effectiveness. Taking advantage of this opportunity requires a long-term commitment to a defined growth level (a 5 percent growth cap is considered below), while enabling expenditure reprioritizations such as the potential $2 billion in annual savings enabled by closing down underutilized or unwanted military bases. These savings could reduce defense expenditures as a share of national income to 3.0 percent (from 3.7 percent cur-rently) while still improving our military effectiveness.
Interest Rate Savings: Without changes, interest costs relative to national income are expected to nearly triple by 2044. Managing these costs is, by necessity, a top priority if the goal of an affordable government is to be reached. While future expenditure control is important, offset-ting the growth in debt with federal asset sales until the budget is balanced is another important component. If executed well, an orderly sale of federal assets (which include gold, oil reserves, unused buildings, land holdings, and mineral rights) can stabilize the debt level at the expected 2020 debt level and, consequently, stabilize interest rate costs. These savings could reduce inter-est expenditures relative to national income from 6.2 percent to 0.6 percent.
Imposing a Hard Budget Cap on the Remaining Discretionary Programs: The five spending areas covered above account for more than 82-cents of every dollar the U.S. government spends. The remaining 18-cents of every dollar spent (a total of $733 billion in 2018) pays for every other function of government. Given the spending paths for the previous five areas, reaching an af-fordable budget by 2044 would require that these expenditures be capped, in aggregate, to a 3.7

6 Beyond the New Normal: How Much Should We Spend?
percent annual growth rate. This cap should not be applied equally, however. Programs without merit should be completely eliminated, while programs with merit need to be prioritized such that some programs (e.g. infrastructure) receive more funding while other programs (e.g. Am-trak) receive less, or are eliminated. In total, this cap would reduce these expenditures from 4.1 percent of national income in 2020 to 2.3 percent in 2044.
All together, these spending reforms will cause federal expenditures to decline relative to na-tional income. The extent of the decline depends on the increased economic growth rate that results. Should economic growth return to the 1960 – 2017 average of 3.0 percent inflation ad-justed growth, then total government expenditures would fall to 18.3 percent of national income. While not yet in the affordability range, such an expenditure level is below the long run average for revenues relative to national income so the budget would be structurally balanced. If growth could return to the average rate between 1983 and 2000 (3.9 percent real growth), federal expen-ditures would reach the goal of 15.0 percent of national income. The federal budget would not only be balanced, it would be affordable to the private sector as well.
The previous research in the Beyond the New Normal program has indicated that excessive gov-ernment expenditures are a significant obstacle to economic growth. Based on these results, a return to the strong growth of the 1980s and 1990s is not unreasonable. Consequently, the U.S. economy will reap large economic benefits from transitioning to a pro-growth affordable budget.
These growth benefits are the ultimate justification for undertaking the reforms. Poor fiscal pol-icies have been impeding the U.S. economy’s growth potential for most of the 21st century. If left unaddressed, these impediments will continue to grow over time reducing the general welfare of Americans. On the other hand, undertaking the difficult process of creating an affordable government will create significant benefits in terms of higher incomes, greater prosperity, and a more effective public sector. These benefits more than justify the effort required.

7Realizing the 15 Percent Solution: Reforms to Establish a Pro-Growth Budget
IntroductionThe same weaknesses that have plagued the federal budget for the past half century persist. And, despite politicians’ repeated promises to change their wasteful ways, the federal government con-tinues to spend an unaffordable amount of money. When families spend more money than they can afford, a day of reckoning comes relatively quickly. Families can delay this ultimate outcome by borrowing money on their credit cards and draining their savings accounts, but these sources soon run out. Eventually, incessant profligate spending leads to financial ruin.
The federal government has more options than families – they face what is called a soft budget constraint. Unlike families, the federal government can use the power to tax, and it can borrow money from the credit markets with fewer short-term constraints. Thus, the federal government can establish a desired level of spending and then set its revenues to meet it. This feature causes many analysts to claim that the federal government’s budget is fundamentally different from private sector businesses or individuals. Such claims are misleading.
The federal government faces budget constraints just like any other business, non-profit, or household. The difference is how the costs are manifested. Un-like households who bear the costs from their waste-ful ways, the federal government is able to spend an excessive amount of money and then force the costs onto the private sector. Whether by excessive bor-rowing or excessive taxation, when the expenditures of the federal government exceed the private sector’s ability to afford them, the vibrancy of the economy begins to diminish. People’s incomes grow slower, technological innovation stalls, and the improve-ment in people’s general welfare begins to stagnate. Ironically, the smaller economy that results from an unaffordable government diminishes its ability to provide public goods and services in the future. The result is a smaller and poorer private sector and less capable government sector. Given the stakes, rightsizing the government is imperative.
PRI’s publication, Beyond the New Normal: The 15 Percent Solution, defined affordability based on the impact from the government’s spending on the private economy.1 This analysis found that the growth in household income is the strongest when federal government expenditures are between 14 percent and 16 percent of national income – the 15 percent solution. Since federal expenditures are currently around 24 percent of national income, the current spending levels are clearly unaffordable.
Rightsizing the federal government requires widespread reforms that, due to their comprehen-siveness, requires time. Reforms should account for the significant transition costs as well. To account for these issues, The 15 Percent Solution suggested restricting the growth in total fed-
Despite politicians’ repeated promises to change their wasteful ways, the federal government continues to spend an unaffordable amount of money.
8 Beyond the New Normal: How Much Should We Spend?
eral expenditures to 2 percentage points below the average growth in national income (what is referred to as the affordable expenditure path). Based on the average growth in income, this plan would allow the total expenditures of the federal government to grow over time, even after accounting for inflation. But, this growth would be significantly below its current growth path.
Many obstacles block the creation of an affordable federal government. From a theoretical per-spective, two over-arching criticisms are typically levied against proposals such as the affordable growth path. First, critics will claim that the affordable growth path will balance the budget at the expense of the poor and middle class; and, second, they claim it will harm economic growth by constraining necessary public investments.
With respect to the first criticism, the below analysis demonstrates that, in reality, the best way to safeguard the social safety net (including Social Security and Medicare) is to restrict federal spending to the affordable growth path. As for the second criticism, PRI’s Beyond the New Nor-mal research program has demonstrated that the government’s current unaffordable expenditure
level has unconscionably imposed economic costs on all U.S. households. These costs manifest themselves as the problems of slower economic growth and the diminished innovation that has contributed to the problem of stagnating incomes for far too many middle- and lower-income fam-ilies. The U.S. economy has everything to gain from requiring the federal government to ensure that its expenditures are affordable.
There are also political obstacles to reform. Re-sistance to the affordable growth path emerges because such a policy requires budget discipline over time. Adhering to the affordable growth path requires political courage to implement spending reforms despite the array of special in-terests who will claim that economic Armaged-don will result.
Past budget decisions are also a problem – in many ways, the largest problem. The well docu-mented problems associated with Social Security and Medicare will significantly crowd out other government functions and raise the unafford-ability of government spending to unprecedented
levels in the not-too-distant future. Interest payments, or the future costs from past government spending, are also expected to dramatically increase as a share of the budget in the not-too-dis-tant future. Increases in these costs will further crowd out other government functions or will make future government expenditures even more unaffordable.
The well documented unfunded liabilities associated with Social Security and Medicare will significantly crowd-out other government functions and raise the unaffordability of government spending to unprecedented levels in the not-too-distant future.
9Realizing the 15 Percent Solution: Reforms to Establish a Pro-Growth Budget
The inability to right-size the federal government has not been due to a lack of ideas. Over the years there have been many studies that have evaluated federal programs and proposed reforms that would constrain the growth of expenditures while improving the efficiency of these pro-grams. These studies include reforms to the entitlement programs that will significantly worsen the unaffordability problem in the future (e.g. Social Security, Medicare, and Medicaid). Studies have also proposed innovative changes to our income support programs that could more ef-fectively empower lower-income families while reducing overall federal expenditures. Other studies have identified widespread discretion-ary savings opportunities since far too many government programs are either inefficient or serve special interests at the expense of the public interest (e.g. eliminating agricultural subsidies that primarily benefit rich farmers and corporations).
This paper, Part 6 of PRI’s Beyond the New Normal research program, demonstrates that comprehensive budget reform that leverages these ideas can transition the federal govern-ment to an affordable expenditure path. Im-portantly, this expenditure path would encour-age widespread prosperity while ensuring that vital programs (e.g. income support, Medicare, and Social Security) are funded, and vital pub-lic investments are made. The budget recommendations made here will not be a detailed line-by-line budget assessment – such calculations are the purview of Congress. Instead, the purpose of this paper is to bring together the fundamental expenditure reforms that already exist and demonstrate that imposing an affordable expenditure path on the federal government is a realis-tic goal – economically speaking.
Politically speaking, adhering to an affordable expenditure path is, at best, a difficult task. The affordability problem has developed over decades and across many expenditure areas. Conse-quently, transitioning the federal government to an affordable expenditure path requires funda-mental reforms across many different programs. There are many options regarding how these spending reforms can be implemented, but they will need to include reforms to Social Security, health care, and the inefficient social safety net programs. It will also require a hard cap on the remaining discretionary spending programs that include implementing identified defense sav-ings and base closures, and the elimination of all corporate welfare expenditures. Selling federal assets in order to reduce the government’s overall debt costs is an important feature as well.
One response to this overwhelming list of reforms is hopelessness. After all, it seems impossible that the political system that has led the country into such a precarious fiscal position could ever implement reforms like the ones suggested above. And, the pessimists have a point. There is also the Canadian case study that provides hope. As Edwards (2013) documented:
There are many options regarding how these spending reforms can be implemented, but they will need to include reforms to Social Security, health care, and the inefficient social safety net programs.

10 Beyond the New Normal: How Much Should We Spend?
Two decades ago Canada suffered a deep recession and teetered on the brink of a debt crisis caused by rising government spending. The Wall Street Journal said that growing debt was making Canada an “honorary member of the third world” with the “northern peso” as its currency. However, Canada reversed course and cut government spending, balanced its budget, and enacted pro-market reforms. It reduced trade barriers, privatized businesses, and slashed its corporate tax rate. The economy boomed, unemployment plunged, and the formerly weak Canadi-an dollar soared to reach parity with the U.S. dollar.2
Henderson (2011) also examined Canada’s spending restraint that began in the mid-1990s, where the government
began a decade‐long policy of cutting government spending. It also increased taxes, but by only one dollar for about every six dollars of spending cuts. The Canadian government cut subsidies to individuals, corporations, and provincial governments while tightening eligibility for unemployment insurance. The gov-ernment also sold off its holdings of various state‐owned enterprises. One major success was its shifting of air traffic control to NAV Canada, a private, non‐prof-it user cooperative. This step netted the government $1.4 billion at the outset, saved about $200 million a year in subsidies, and resulted in a technological rev-olution in air traffic control that has put Canada years ahead of the United States.From 1997 to 2008, Canada’s government had an unbroken string of annual budget surpluses; and by 2009, Canada’s debt‐to‐GDP ratio had fallen below 30%. Starting in 2000, the government used some of what otherwise would have been surplus to cut taxes on individuals and corporations. The corporate tax rate was cut in stages from 28% in 2000 to 21% by 2004.3
The Canadian example demonstrates that in the face of overwhelming fiscal calamity, pro-growth economic reforms that radically re-invent the federal government are possible. It also provides hope that, in spite of the tremendous obstacles, the federal government can implement the required fundamental reforms that will avert the coming fiscal calamity and, in its stead, promote widespread economic prosperity.
Why an Affordable Expenditure Path?A budget reveals our values. Judged against this criterion, the current federal budget does not reflect well on us; nor will future budgets. Instead of prioritizing our desires and taking respon-sibility for future generations, the current federal budget spends money irresponsibly, makes promises that will most likely be broken, and reduces the economy’s growth potential.
The purpose of adhering to the affordable expenditure path is to establish a more fiscally respon-sible and efficient federal government. Previous studies in the Beyond the New Normal research program have demonstrated that the benefits from implementing the affordable expenditure path will be a significant increase in the economy’s long-run average growth rate and an improvement

11Realizing the 15 Percent Solution: Reforms to Establish a Pro-Growth Budget
in the country’s economic vitality.4 Alternatively, failing to implement an affordable expenditure path will lead to dire fiscal and economic outcomes.
Adhering to a disciplined budget can be transformative in a relatively short timeframe. Consider what our current fiscal position would be had this plan been implemented back in 2000 when the federal government ran the largest surplus in recent memory (due to the combination of the booming dot.com economy and federal expenditure control).
Between 2000 and 2017, total federal expenditures grew, on average, 4.8 percent per year while national income grew 3.8 percent per year. Had an affordable expenditure path been implement-ed in 2000 that would have allowed for a slight growth in the real purchasing power of the feder-al government (2.3 percent annual growth), then, without accounting for the positive impact on economic growth, total federal government expenditures would have become affordable starting in 2015, and by 2017 federal expenditures could have been around 15 percent of national income (see the gray line in Figure 1). In other words, had the affordable expenditure path been followed starting in 2000, federal government expenditures could have become affordable within a decade and a half.5’
Figure 1 Federal Government Expenditures and Revenues as a Percentage of National Income | Actual versus Affordable Pathway - 2000–2017
10.0%
15.0%
20.0%
25.0%
30.0%
2000
2001
2002
2003
2004
2005
2006
2007
2008
2009
2010
2011
2012
2013
2014
2015
2016
2017
2018
e
Federal Revenues % National Income
Federal Expenditures % National Income
Affordable Expenditure Path % National Income
AFFORDABLE GOVERNMENT RANGE
Source: Author calculations based on OMB and BEA data.
Federal revenues (the black line in Figure 1) would have been more than sufficient to fund the affordable level of federal expenditures, in contrast to the actual level of federal expenditures (the red line in Figure 1). Perhaps most important, as the Beyond the New Normal analyses have illus-trated, a more affordable federal government that focused on providing high-valued public-goods would have helped alleviate the problem of stagnating family incomes, slower economic growth, and the budget surpluses would have created opportunities for fundamental pro-growth tax re-form and reductions in the amount of federal debt outstanding.6

12 Beyond the New Normal: How Much Should We Spend?
Table 1 provides a quick overview of the historical connection that links a growing government sector to a stagnating private sector.
Table 1 Federal Expenditures as a Percentage of National Income Compared to Growth in National Income - Various Periods
Federal Expenditures % National Income Average Growth Real National Income End of Period Change Over Period
1965 - 1983 26.5% 8.5% 2.7%
1983 - 2000 20.2% -6.3% 3.9%
2000 - 2017 23.8% 3.6% 1.9%
Source: Author calculations based on OMB and BEA data.
Table 1 categorizes the period from 1965 through 2017 based on the trends in the size of the federal government relative to the economy. These periods either start at the low-point of gov-ernment spending relative to national income (1965 and 2000) or the high-point (1983). The first column in Table 1 presents the total federal expenditures as a share of national income at the end of the relevant time period, the second column presents the change in federal expenditures as a share of national income during the relevant time period, and the last column presents the compound average annual growth in inflation-adjusted national income. The two periods of rising government expenditures are associated with slower economic growth, while the period of declining government expenditures is associated with stronger economic growth. The growth slowdown (as measured by the growth in inflation adjusted national income) is demonstrated in Figure 2. Economic growth averaged 2.8 percent between 1965 and 2017; however, Figure 2 il-lustrates that this average glosses over the significant break points demonstrated in Table 1 – the three dotted lines in Figure 2.
Figure 2 Annual Growth in Inflation-Adjusted National Income - 1965–2017
-4.0%
-2.0%
0.0%
2.0%
4.0%
6.0%
8.0%
1965
1967
1969
1971
1973
1975
1977
1979
1981
1983
1985
1987
1989
1991
1993
1995
1997
1999
2001
2003
2005
2007
2009
2011
2013
2015
2017
% CHG REAL NI
AVERAGE 1965 - 1983 AVERAGE 1983 - 2000 AVERAGE 2000 - 2017
Source: BEA data.

13Realizing the 15 Percent Solution: Reforms to Establish a Pro-Growth Budget
Beyond the New Normal Part IV: Policy Mix Theory and Historical Evidence summarized the evi-dence that links greater fiscal control to improved economic growth:
Mitchell (2005) provides a comprehensive review of studies that have exam-ined the impact from government spending on growth from a U.S. perspective, as well as an international perspective. Summarizing the findings from the aca-demic literature, Mitchell (2005) concludes that “regardless of the methodology or model, government spending appears to be associated with weaker economic performance.” In a 2009 review, Foster similarly finds that “empirical research rarely provides a simple, single answer to a policy question, and examinations of Keynesian stimulus are no exception. Yet the available results consistently indicate that, using a modern macroeconomic model and treating monetary policy care-fully, Keynesian stimulus’s short-term effects lie somewhere in the narrow range between slim and none. Keynesian stimulus produces debt, not jobs.”7
It follows that restraining federal spending to an affordable expenditure path is a necessary reform for restoring the U.S. long-term economic vibrancy that occurred between 1983 and 2000. A faster-growing economy would not only mean greater wealth for families, the federal, state, and local governments will benefit as well since a larger economy is better positioned to cover necessary public goods and services.
Comparing the Current Budget Path to the Affordable BudgetDue to the federal government’s future spending commitments, it is not sufficient to examine spending as it exists today. A spending plan that leads to an affordable federal government must account for the level and composition of spending that will arise, or what is referred to as a budget baseline.
By evaluating a budget baseline, the budget areas that require reforms and the extent that the growth in these programs must be con-strained in order to comply with the afford-able expenditure path can be identified. The budget baseline used in this analysis is based on the Congressional Budget Office’s 2018 long-term budget outlook, extended baseline through 2044.8 Based on the current trends and commitments, government expenditures will grow 4.9 percent annually between 2020 and 2044 causing total government spending to increase to $15.0 trillion, compared to the $4.2 trillion the government spent in 2018.
Based on the current trends and commitments, government expenditures will grow 4.9 percent annually between 2020 and 2044 causing total government spending to increase to $15.0 trillion.”
14 Beyond the New Normal: How Much Should We Spend?
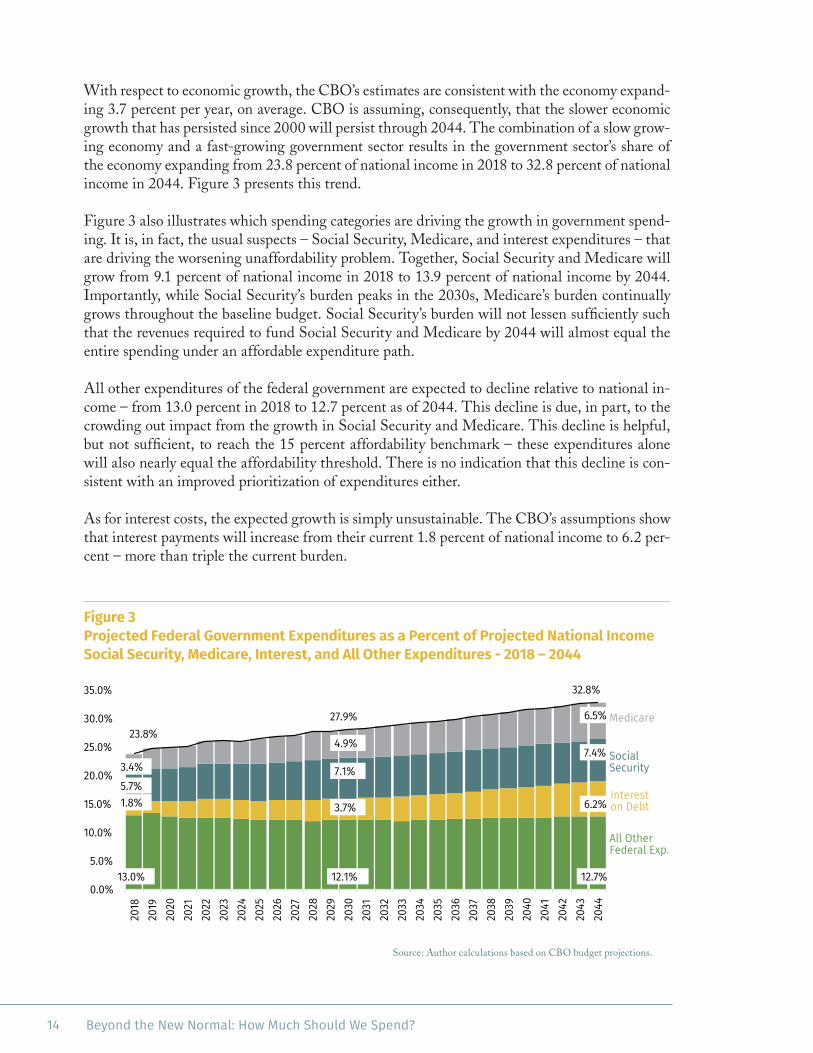
With respect to economic growth, the CBO’s estimates are consistent with the economy expand-ing 3.7 percent per year, on average. CBO is assuming, consequently, that the slower economic growth that has persisted since 2000 will persist through 2044. The combination of a slow grow-ing economy and a fast-growing government sector results in the government sector’s share of the economy expanding from 23.8 percent of national income in 2018 to 32.8 percent of national income in 2044. Figure 3 presents this trend.
Figure 3 also illustrates which spending categories are driving the growth in government spend-ing. It is, in fact, the usual suspects – Social Security, Medicare, and interest expenditures – that are driving the worsening unaffordability problem. Together, Social Security and Medicare will grow from 9.1 percent of national income in 2018 to 13.9 percent of national income by 2044. Importantly, while Social Security’s burden peaks in the 2030s, Medicare’s burden continually grows throughout the baseline budget. Social Security’s burden will not lessen sufficiently such that the revenues required to fund Social Security and Medicare by 2044 will almost equal the entire spending under an affordable expenditure path.
All other expenditures of the federal government are expected to decline relative to national in-come – from 13.0 percent in 2018 to 12.7 percent as of 2044. This decline is due, in part, to the crowding out impact from the growth in Social Security and Medicare. This decline is helpful, but not sufficient, to reach the 15 percent affordability benchmark – these expenditures alone will also nearly equal the affordability threshold. There is no indication that this decline is con-sistent with an improved prioritization of expenditures either.
As for interest costs, the expected growth is simply unsustainable. The CBO’s assumptions show that interest payments will increase from their current 1.8 percent of national income to 6.2 per-cent – more than triple the current burden.
Figure 3 Projected Federal Government Expenditures as a Percent of Projected National Income Social Security, Medicare, Interest, and All Other Expenditures - 2018 – 2044
13.0% 12.1% 12.7%
1.8% 3.7% 6.2% 5.7%
7.1% 7.4%
3.4%
4.9%
6.5% 23.8%
27.9%
32.8%
0.0%
5.0%
10.0%
15.0%
20.0%
25.0%
30.0%
35.0%
2018
20
19
2020
20
21
2022
20
23
2024
20
25
2026
20
27
2028
20
29
2030
20
31
2032
20
33
2034
20
35
2036
20
37
2038
20
39
2040
20
41
2042
20
43
2044
All Other Federal Exp.
Interest on Debt
Social Security
Medicare
Source: Author calculations based on CBO budget projections.

15Realizing the 15 Percent Solution: Reforms to Establish a Pro-Growth Budget
The future threat from growing interest expenditures under the current baseline is worth em-phasizing. If not altered, then interest expenditures will comprise nearly one-fifth of all govern-ment spending as of 2044, see Figure 4. Put differently, on the current trajectory, for every dollar that future generations will spend, nearly 20-cents will be devoted toward paying the costs of past government services that they did not receive. Figure 4 also shows that traditional govern-ment goods and services that comprise slightly more than one-half of government spending in 2018, will account for less than 39-cents of every dollar spent in 2044. The largest category of spending will be Social Security and Medicare comprising over 42-cents of every dollar spent.
Figure 4 Projected Federal Government Expenditures as a Percent of Budget Social Security, Medicare, Interest, and All Other Expenditures - 2018 – 2044
54.7% 43.5% 38.8%
7.4%
13.4% 18.9%
23.8% 25.5% 22.4%
14.1% 17.6% 19.9%
0.0%
10.0%
20.0%
30.0%
40.0%
50.0%
60.0%
70.0%
80.0%
90.0%
100.0%
2018
2019
2020
2021
2022
2023
2024
2025
2026
2027
2028
2029
2030
2031
2032
2033
2034
2035
2036
2037
2038
2039
2040
2041
2042
2043
2044
All Other Federal Exp.
Interest on Debt
Social Security
Medicare
Source: Author calculations based on CBO budget projections.
CBO’s baseline illustrates that the current expenditure trends, if left unaltered, will cause the federal government to become a tremendous burden on the economy. Given that the government will be spending an unprecedented amount of money under the baseline scenario, the CBO’s as-sumed growth assumption, which is already slow, might be too optimistic. Meeting this project-ed amount of spending will require significant increases in taxes or government debt. Either way, the excess spending will further erode the economy’s future growth potential. If the spending is funded through taxes, the incentives to work, save and invest will decline; if funded by borrow-ing, then there will be less capital available for the private sector, which will reduce the financial resources available for businesses and entrepreneurs. It is likely, consequently, that the current spending path would cause economic growth to be even slower than the post-2000 performance.
Instead of the current trends, the affordable growth path recommends that government spending be constrained to, at most, the assumed growth in national income minus two percentage points. If the economy expanded as per the CBO’s baseline growth rate – 1.7 percent average annual real growth plus 2.0 percent average annual inflation,9 or 3.7 percent average annual growth – then the affordable expenditure path as of 2044 would be $6.9 trillion. However, if the real growth in national income increases to the average rate between 1960 and 2017 – 3.0 percent average

16 Beyond the New Normal: How Much Should We Spend?
annual real growth, or 5.0 percent average annual growth including projected inflation – then the affordable expenditure path as of 2044 would be $9.5 trillion. At the real growth rate of 3.9 percent (5.9 percent including projected inflation), which was the real growth rate between 1983 and 2000, then the affordable expenditure path as of 2044 would be $11.7 trillion. These alter-native budgets are presented in Figure 5.
Figure 5 Projected Affordable Expenditure Path Assuming Different Growth Rates CBO Baseline, 5.0 Percent, and 5.9 Percent - 2018–2044
$11.7
$9.5
$6.9
$0.0
$2.0
$4.0
$6.0
$8.0
$10.0
$12.0
$14.0
2018
2019
2020
2021
2022
2023
2024
2025
2026
2027
2028
2029
2030
2031
2032
2033
2034
2035
2036
2037
2038
2039
2040
2041
2042
2043
2044
FEDE
RAL
REVE
NUES
(IN
TRIL
LIO
NS)
5.9% Growth
5.0% Growth
Baseline Growth Rate
Source: Author projections based on CBO data.
As established in the previous section, the purpose of the affordable expenditure path is to help reverse the growth slowdown and, in its stead, re-establish robust economic growth. Beyond the New Normal Part 4: Policy Mix Theory and Historical Evidence argued that the growth slowdown that has taken hold since 2000 has been caused, in large part, by the policy environment that in-cludes the unaffordability of the government’s budget.10 Further, this study showed that effective policy reforms will reinvigorate strong economic growth. While there is no reason to believe the accelerated economic growth rate between 1983 and 2000 could not be restored, for conservative purposes, the analysis examines two growth scenarios over the relevant budget period: (1) adher-ing to the affordable expenditure path lifts the growth in national income growth back up to the average pace between 1960 and 2017 (5.0 percent including the assumed 2.0 percent inflation, or the black line in Figure 5); and (2) adhering to the affordable expenditure path lifts the growth in national income growth back up to the average pace between 1983 and 2000 (5.9 percent in-cluding the assumed 2.0 percent inflation, or the blue dotted line in Figure 5).
Adhering to an affordable expenditure path requires a significant reduction in the growth of government, but it is important to emphasize that it does not require a reduction in the real pur-chasing power of the federal government. The expenditures of the federal government can grow every year, but at a subdued rate. Based on the budget discipline described below, and based on a real average growth rate that returns to 3.9 percent (nominal growth of 5.9 percent), federal

17Realizing the 15 Percent Solution: Reforms to Establish a Pro-Growth Budget
expenditures would become affordable by around 2041 and nearly reach the 15 percent target by 2044, see Figure 6.
Figure 6 Affordable Expenditure Path Total Federal Revenues as a Percentage of National Income - 2020–2044
5.0%
10.0%
15.0%
20.0%
25.0%
30.0% 20
20
2021
2022
2023
2024
2025
2026
2027
2028
2029
2030
2031
2032
2033
2034
2035
2036
2037
2038
2039
2040
2041
2042
2043
2044
FEDE
RAL
REVE
NUES
% N
ATIO
NAL
INCO
ME
5.9% Growth Scenario
5.0% Growth Scenario
AFFORDABILITY RANGE
Source: Author projections.
Establishing an Affordable BudgetCreating an affordable federal budget requires many difficult decisions. As the reforms outlined below illustrate, a budget strategy that achieves the goal of an affordable government while still meeting the government’s primary goals (including a secure government safety net) is econom-ically feasible. It requires better spending prioritization. The current, and growing, problem of an unaffordable government has arisen because politicians currently have the ability to match revenues to their desired expenditure level. So, the need to prioritize the potential benefits of alternative programs with one another is severely diminished. Nor do politicians bear the costs of government inefficiency.
Therefore, the first step toward following an affordable expenditure path is to replace politi-cians’ current soft budget constraint with a hard budget constraint that adheres to the affordable growth path. Hard budget constraints force politicians to make the necessary budget trade-offs by prioritizing the expenditures on one program (such as the export-import bank) against the expenditures on other programs (such as national defense or the need to adequately fund a secure safety net).

18 Beyond the New Normal: How Much Should We Spend?
The hard budget proposed here does not require any reductions in the government expenditures. Instead, the proposed budget caps the growth in expenditures to 2 percentage points below the target growth in national income, or 3.9 percent per year on average. Such a cap implies that ex-penditures on some programs will be reduced, or eliminated, in order to enable growth in other programs that are higher priorities. To the extent these trade-offs are made, this is precisely the point of establishing a hard budget constraint on the federal government.
Within the hard budget constraint, the specific approaches necessary to put the federal govern-ment on an affordable growth path must account for the actual distribution of expenditures. This distribution as of FY2018 is summarized in Figure 7.
Figure 7 Composition of Federal Government Expenditures, 2018 Total Expenditures: $4.2 trillion Social Security
23.8%
Medicare 14.1%
Health CareSvcs.
(e.g. Medicaid) 13.2%
IncomeSupport
Programs 8.5%
Defense 15.4%
Interest 7.4%
Everything else 17.6%
Source: OMB data.
Since the programs differ dramatically, how they should be reformed will vary. It should be noted upfront that the analysis, by definition, contains specific value judgements and should be viewed as illustrative of the types of spending reforms required. Alternative judgements could prioritize different budget items (e.g. emphasizing more generous welfare payments at the cost of fewer defense expenditures). The purpose of the hard budget constraint is to make these trade-offs explicit.
It is also important to distinguish between the federal government’s expenditures relative to na-tional income, and the real dollar value of the federal government’s expenditures. The proposed cap controls the growth in overall federal spending, but the amount of purchasing power that the federal government controls grows each year.
Finally, while the reforms are presented with the goal of reaching the growth-maximizing size of the government, there are still benefits from implementing only some of the reforms. For ex-
19Realizing the 15 Percent Solution: Reforms to Establish a Pro-Growth Budget
ample, implementing budget reforms that only reduce the federal government’s expenditures to 18 percent of national income would, based on the government’s long-run average revenues as a share of national income, still balance the budget and improve the underlying growth rate of the economy. Therefore, the perfect should not be made the enemy of the good.
Reforming Social Security An affordable federal government is impossible without reforms to Social Security and Medi-care. Starting with Social Security, as illustrated in Figure 7, Social Security already comprises 23.8 percent of the federal budget – nearly $1 out of every $4 spent by the federal government is devoted toward Social Security. And, as Figures 3 and 4 illustrated, the expected growth of Social Security threatens the financial viability of the federal government. Estimates of the cur-rent unfunded liabilities of Social Security vary, but, along with Medicare, equals as high as $80 trillion to $100 trillion.11 Consequently, the goal of an affordable federal government cannot be achieved without reforms to Social Security.
In theory, Social Security and Medicare benefits are earned by people over their careers. Howev-er, in practice, this is not how the federal government runs the programs. In reality, the federal government has already spent all of the revenues raised via the payroll taxes designed to fund Social Security and Medicare. It logically follows that all future benefits will have to be funded through future tax increases or future cuts in other spending priorities. Given these constraints, coupled with the large share of the budget that is devoted toward Social Security, creating an affordable federal government requires reforms to Social Security.
However, all reforms are not equal. Perhaps most important, several reform ideas have been proposed that update the program to reflect the realities of 21st Century America. These reforms do not jeop-ardize Social Security’s primary purpose – to ensure “adequate provision” for elderly persons.12 In fact, by eliminating policies that over-inflate benefits relative to the original intention of the program, these re-forms help safeguard the program’s financial viability while not over-burdening future generations. There are many reforms to Social Security that have already been proposed and that can generate significant budget savings while adhering to this criterion. An analysis by the Congressional Budget Office (CBO) documented three such reforms.13
The first savings opportunity arises due to the method Social Security uses to set retirees’ initial Social Security benefits. Social Security is designed to provide retirement benefits based on a retirees’ lifetime earnings.14 Since prices tend to rise over time, it is appropriate to adjust retirees’ nominal earnings for inflation in order to ensure that the purchasing power of their income is maintained. It is inappropriate, of course, to over-adjust their nominal earnings. But, the current formula over-adjusts for inflation when setting retirees initial benefit levels because past earnings
Perhaps most important, several reform ideas have been proposed that update the program to reflect the realities of 21st Century America.

20 Beyond the New Normal: How Much Should We Spend?
are adjusted to reflect the growth in wages, not the growth in prices. Adjusting past earnings by the growth in wages means that initial benefit levels reflect the increase in prices and the increase in productivity. Including the growth in productivity provides beneficiaries’ benefits that they did not earn. These excessive benefits are also costly.
The CBO has evaluated two reforms that would address this issue. One reform would adjust the initial benefit levels for all future retirees based on a price index rather than the current wage in-dex. The second reform (what the CBO calls progressive price indexing) would still allow wage indexing for lower-income workers, and would phase in the price indexing approach for progres-sively higher income workers. Effectively, the second reform creates a subsidy for lower-income retirees creating a higher retirement income floor. To account for these income distribution con-cerns, the estimates below are based on the savings from implementing CBO’s progressive price indexing reform.15
The second savings opportunity also arises due to inflation as well. Over time, inflation erodes the purchasing power for retirees who are living on a fixed income, and over a long-enough
period of time, inflation can make a once comfortable retirement income inadequate. It is, consequently, im-perative to ensure that people’s Social Security benefits contain adjustments for inflation, but once again, not over-adjust for inflation. Over-adjusting for inflation provides retirees with unwarranted increases in their purchasing power at the expense of future generations. It also makes the goal of an affordable government more difficult to reach. There is strong evidence that Social Security’s existing benefit structure over-adjusts for in-flation.
Currently, Social Security benefits are adjusted for infla-tion using the consumer price index (CPI), which does not account for changes in people’s spending patterns and suffers from several statistical biases. An alternative measure of inflation known as the chained CPI adjusts for many, but not all of these problems. Consequently, the chained CPI better reflects actual changes in peo-ple’s cost of living. The Chained CPI also grew, on av-
erage, 0.25 percent slower than the CPI. Correcting the cost of living adjustments can save tens of billions of dollars a year according to the CBO.16
The CBO report also evaluates the oft-proposed reform of raising the age when workers become eligible for full social security benefits. Specifically, this proposal would increase the retirement age from the current 67 years by two months per birth year until it reaches age 70.17 Given the large increase in people’s lifespan and health, such an increase in the full retirement age makes sense programmatically. It would also generate significant savings, according to the CBO that “by 2046, the option would reduce Social Security outlays from what would occur under current law by 7 percent.”18
Over-adjusting for inflation provides retirees with unwarranted increases in their purchasing power at the expense of future generations.
21Realizing the 15 Percent Solution: Reforms to Establish a Pro-Growth Budget
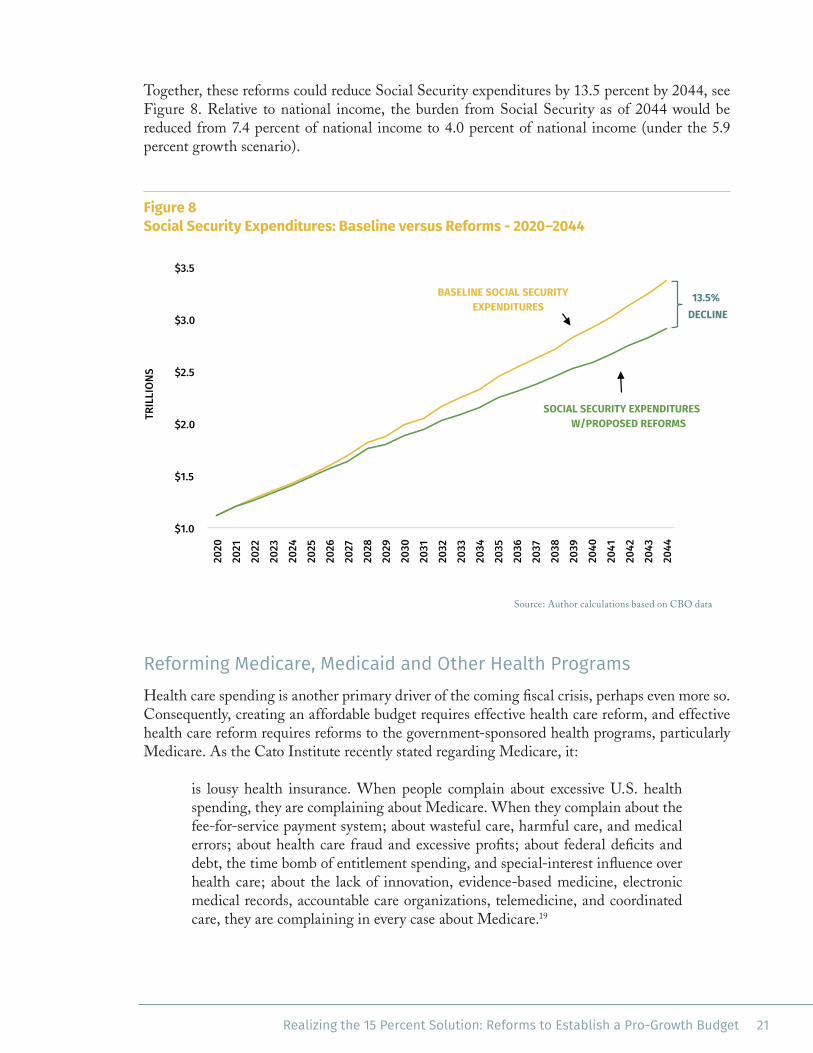
Together, these reforms could reduce Social Security expenditures by 13.5 percent by 2044, see Figure 8. Relative to national income, the burden from Social Security as of 2044 would be reduced from 7.4 percent of national income to 4.0 percent of national income (under the 5.9 percent growth scenario).
Figure 8 Social Security Expenditures: Baseline versus Reforms - 2020–2044
$1.0
$1.5
$2.0
$2.5
$3.0
$3.5
2020
20
21
2022
20
23
2024
20
25
2026
20
27
2028
20
29
2030
20
31
2032
20
33
2034
20
35
2036
20
37
2038
20
39
2040
20
41
2042
20
43
2044
TRIL
LION
S
BASELINE SOCIAL SECURITY EXPENDITURES
SOCIAL SECURITY EXPENDITURES W/PROPOSED REFORMS
13.5% DECLINE
Source: Author calculations based on CBO data
Reforming Medicare, Medicaid and Other Health ProgramsHealth care spending is another primary driver of the coming fiscal crisis, perhaps even more so. Consequently, creating an affordable budget requires effective health care reform, and effective health care reform requires reforms to the government-sponsored health programs, particularly Medicare. As the Cato Institute recently stated regarding Medicare, it:
is lousy health insurance. When people complain about excessive U.S. health spending, they are complaining about Medicare. When they complain about the fee-for-service payment system; about wasteful care, harmful care, and medical errors; about health care fraud and excessive profits; about federal deficits and debt, the time bomb of entitlement spending, and special-interest influence over health care; about the lack of innovation, evidence-based medicine, electronic medical records, accountable care organizations, telemedicine, and coordinated care, they are complaining in every case about Medicare.19
22 Beyond the New Normal: How Much Should We Spend?
Unlike Social Security, future Medicare expenditures are not expected to peak relative to nation-al income beginning in the 2030s. Instead Medicare will continue growing and will reach 6.5 percent of national income by 2044, see Figure 3. Similar to Social Security, how the govern-ment controls its health care expenditures matters. Reforms that impose price controls, expand the single payer system, or mandate other top-down restrictions will control costs at the expense of health care quality. With the right reforms, the federal government has the opportunity to control costs and improve the quality of health care patients receive. Leveraging this opportunity requires an understanding of the flaws that afflict the current health care system. These flaws exist on both how health care is delivered and how it is financed.
The flaws that pervade the delivery of health care, and reforms that would help overcome these issues, have been identified by Graboyes (2014):20
The debate over coverage (and over related issues concerning how health care providers are paid) has focused attention almost exclusively on the demand side of health care markets—who pays how much to whom for which currently of-fered services. The debate underplays questions of supply—how innovation can alter the very nature of the health care delivery system. This paper argues that the most important fact about American health care policy is that Left and Right actually share a detrimental worldview—an excessive aversion to risk and a defer-ence to medical insiders—and that this consensus slows the rate of technological progress in health care.21
Consequently, reforms to the system are required that empower the “disruptors”. Empowered disruptors (aka entrepreneurs), such as Southwest in the airline industry or Amazon in the retail industry, propel innovation typically leading to higher quality goods and services at lower prices.
Federal and state laws have become an important obstruc-tion that prohibit disruptors from creating many potential benefits in the health care industry, however.
At the federal level, commonly identified obstructions in-clude the slow FDA approval process, the ACA taxes on name-brand drugs and medical devices, and the medical liability system. At the state level, Graboyes (2014 & 2017) cites laws, which vary across states, that: impose certif-icate-of-need laws; bar telemedicine, online prescription websites, and independent practicing nurse practitioners; restrict the role of pharmacists; restrict the roles for the corporate practice of medicine; and restrict interstate li-censing reciprocity.22
These obstructions create two inter-related problems. First, they directly raise the costs of delivering health care. Second, they discourage creative ideas that could radically improve the way medical services are provided. Remov-
ing these obstructions have the potential to directly lower the costs of health care and empower greater medical entrepreneurship that lowers costs and improves overall health care quality.
Unlike Social Security, future Medicare expenditures are not expected to peak relative to national income beginning in the 2030s.
23Realizing the 15 Percent Solution: Reforms to Establish a Pro-Growth Budget
Reforms to the practice of medicine must also be combined with reforms to how we finance health care. The disincentives that pervade the current system, whose genesis is the tax-prefer-ences for employer sponsored health insurance, are well documented. Canon (2008) summarizes the adverse impacts:
First, the [tax] exclusion leaves workers with less control over their health insur-ance decisions and their compensation. Because most workers have their health insurance chosen for them by an employer, workers are less likely to obtain cov-erage that matches their preferences. Second, economists argue that the exclusion reduces efficiency by encouraging excess health insurance coverage, encouraging consumption of low-value medical care, and distorting the labor market. Third, economists and other commentators criticize the exclusion as inequitable, both in terms of horizontal and vertical equity.23
Haislmaier and Moffit (2017) explained that the distortions created by the employer-based cur-rent third-party payer system are an important driver of overall health care inflation as well:
Americans today can get an unlimited tax break for health insurance if, and only if, they get health insurance through the place of work. If they do not or cannot get health insurance through the place of work, they often must pay for their insurance coverage with after-tax dollars, which means that they could pay any-where from 20 percent to 50 percent more for health insurance. This is profoundly inequitable.
Not only does federal tax policy discriminate against Americans based on their job status, but it also distorts the normal functioning of the health care markets. The absence of limits on the amount of health benefits that may be excluded from taxable income creates incentives for over-insurance and over-consumption of health care and induces consumers to be indifferent with respect to the prices charged by competing medical providers. That, in turn, drives up the cost of health care across the board.
The current tax treatment also frustrates personal ownership and portability of health coverage, which means that when persons leave their jobs, they lose their coverage. Moreover, it is profoundly regressive because it offers more value to high-income employees enrolled in expensive health plans. There is an enormous intellectual consensus among prominent health care economists and policy ana-lysts regarding the distortionary effects of the current system.24
These distortions now pervade the current health insurance markets. Due to these distortions, health insurance often pays for common health care expenditures that are not actual health care risks, but fail to cover the costs for far too many patients when actual health risks are experienced. Consequently, health insurance often fails to fulfill the essential purpose of insurance – transfer-ing the financial risks associated with low-probability/high cost health problems from patients to insurers. Addressing these flaws through effective health care reform is necessary. Reforms that address the problems created by the inequitable tax treatment of health care expenditures, and a large expansion in health savings accounts, would go a long way toward improving the quality of health care in the country while also restraining the health care inflation problem.25

24 Beyond the New Normal: How Much Should We Spend?
Alleviating the broader health care inflation problem also requires reforms to the Medicare pro-gram due to its size (Medicare spent $588.4 billion in FY2018) and its scope (currently Medicare covers around 60 million elderly and disabled people). Finkelstein (2007) links Medicare to
higher overall health care expenditures, and during its first five years of existence (between 1965 and 1970) was “associated with a 37 percent increase in real hospital expenditures (for all ages)”.26 It stands to reason that addressing the flaws that pervade Medi-care will, consequently, help reduce the program’s broader impact on overall health care expenditures. For the purposes of this paper, effective Medicare re-form would meaningfully reduce the broader federal budget pressures. And, there are many beneficial re-forms that are necessary.
Typically, Medicare reimburses providers using the “fee-for-service” model, which is also the dominant model used by employer-sponsored health insurers. The fee-for-service model creates adverse incentives by encouraging excessive, and often wasteful, expen-ditures on high-cost medical devices and services. The fee-for-service model also creates misaligned incentives between providers. As a consequence,
Medicare’s fee-for-service model increases overall costs without any increase in health care qual-ity. There is growing evidence that other payment models, such as value-based health care or fixed “capitated” payments per patient, can meaningfully control costs while providing similar (or better) health care services.27
More broadly, as the success of Medicare Part D demonstrates, reforms should empower compe-tition. As Pipes (2015) explains
implemented in 2006, Part D gives seniors and the disabled access to prescrip-tion drugs, which Medicare previously didn’t cover. Today, 36 million Americans can afford essential medications thanks to this program.
Part D has cost less than expected year after year, making it nearly unique among government programs. From 2004 to 2013 Part D cost $349 billion — 45 per-cent less than originally predicted. In 2014, the Congressional Budget Office lowered its projection for total Part D spending by $56 billion.
The program’s innovative free-market structure enables it to keep costs low. Rather than relying on one-size-fits-all rules for coverage and pricing set by the federal government, Part D allows private-sector insurers to design plan coverage and set premium levels, then compete among themselves for seniors’ business.
This competition keeps costs down. This year, the average monthly Part D pre-mium is $32 — nearly 50 percent less than the initial 2004 projection of $60.28
It stands to reason that addressing the flaws that pervade Medicare will, consequently, help reduce the program’s broader impact on overall health care expenditures.
25Realizing the 15 Percent Solution: Reforms to Establish a Pro-Growth Budget
Medicare Part D provides a roadmap for the rest of Medicare. The best way to empower compe-tition, as the Cato Institutes puts it, is to “make Medicare like Social Security”.29 In other words, instead of Medicare paying billions of dollars to the health care industry, Medicare should di-rectly pay recipients, who would then use those funds to purchase private insurance. These pay-ments would empower seniors to choose the health coverage that best fits their individual needs, and would force insurers to compete against one another to earn their business. Experimenta-tions with different value-based health models in lieu of the currently inefficient fee-for-service model used by Medicare would likely proliferate, creating greater efficiencies and improved ser-vices. Such a transition by Medicare would encourage broader adoption of the payments as well, sparking broader market-based health care reforms.
Similarly, other federal expenditures on health care (particularly Medicaid, the federal/state jointly funded program for lower-income individuals and families) should follow the Medicare model and either directly empower recipients to purchase private insurance, or block grant the payments to the states (e.g. for Medicaid). Turning Medicaid into a block grant program would help inspire states to experiment with alternative ap-proaches to the program, which are currently afflicted with the same problems of high cost/low quality care as Medicare.
If coupled with reforms in the practice of medicine, then growth in the federal government’s expenditures on health care can be reduced without jeopardizing the quality of care – in fact, the quality of health care received would increase. Further, creating direct pay-ments to Medicare recipients and block grants to the states for Medicaid payments would enable the feder-al government to gain control over these expenditure programs.
In 2018, the federal government spent $588.4 bil-lion on Medicare and $551.7 billion on other federal health programs (primarily Medicaid). Compared to the average growth in national health care expendi-tures of 5.7 percent between 2000 and 2017,30 federal expenditures on Medicare and other health programs grew a faster 6.7 percent and 7.9 percent respective-ly.31 Looking forward, the accelerated growth in the federal health expenditures are expected to persist. For instance, the CBO projections anticipate a 6.3 percent average annual increase in Medicare spending between 2020 and 2044. The health care reforms outlined above can meaningfully reduce the anticipated rate of growth, and, based on the success of Medicare Part D, it is not unreasonable to assume that of growth of federal health care expenditures can be constrained to 4.0 percent per year (or below the expected economic growth rate incented by the affordable growth path). If capped at 4.0 percent per year, total Medicare expenditures would decline 43.8 percent as of 2044 relative to the baseline expenditures, and all other health expenditures would decline by 42.0 percent relative to the baseline, see Figure 9.
Experimentations with different value-based health models in lieu of the currently inefficient fee-for-service model used by Medicare would likely proliferate, creating greater efficiencies and improved services.

26 Beyond the New Normal: How Much Should We Spend?
Figure 9 Medicare and Other Federal Health Expenditures: Baseline versus Reforms 2020 - 2044
$0.0
$0.5
$1.0
$1.5
$2.0
$2.5
$3.0
$3.5
2020
2022
2024
2026
2028
2030
2032
2034
2036
2038
2040
2042
2044
TRIL
LION
S
43.8% decline
Baseline Medicare Expenditures
Medicare Expenditures w/proposed reforms
$0.0
$0.5
$1.0
$1.5
$2.0
$2.5
$3.0
$3.5
2020
2022
2024
2026
2028
2030
2032
2034
2036
2038
2040
2042
2044
TRIL
LION
S 42.0% decline
Baseline Other Health Expenditures
Other Health Expenditures w/proposed reforms
Source: Author calculations based on CBO data
The importance of effectively “bending the cost curve” for government health programs cannot be understated. Quite simply, without effective health care reform the goals of continued eco-nomic prosperity and affordable (high quality) health care will be incompatible. Alternatively, embracing the reforms discussed above that fundamentally change how we pay, and practice, medicine can enable both stronger prosperity and affordable, high quality, health care.
Making Transfer Payments AffordableThe primary function of the federal government as of 2018 is to take money from some people (either through the tax system or by borrowing money from investors in the capital markets) and transfer that money to other people. Including Social Security, Medicare, Medicaid and income support programs, nearly 60-cents out of every dollar taxed or borrowed is used in this manner. The previous sections focused on Social Security, Medicare, and Medicaid because these pro-grams are the largest drivers of the affordability problem.
Yet, addressing the inefficiencies that plague the other transfer payment programs is imperative as well. These transfer payments include the expenditures for income security programs (par-ticularly for children and families); but they also include payments to farmers and subsidies to businesses.
Reforming the transfer payments to farmers and businesses is straightforward – these unwar-ranted payments should be eliminated, and as quickly as possible. Starting with the farm subsi-dies, as Sumner explains in the Library of Economics and Liberty, “economists have criticized farm subsidies on several counts. First, farm subsidies typically transfer income from consumers and taxpayers to relatively wealthy farmland owners and farm operators. Second, they impose net losses on society, often called deadweight losses, and have no clear broad social benefit (Alston and James 2002). Third, they impede movements toward more open international trade in com-modities and thus impose net costs on the global economy (Johnson 1991; Sumner 2003).”32

27Realizing the 15 Percent Solution: Reforms to Establish a Pro-Growth Budget
Despite the clear economic harm caused by these policies, in 2018, the federal government spent $20.9 billion on these programs.33 And there are dozens of aid programs that farmers receive from the federal government that include subsidized insurance, price supports, revenue subsi-dies, and marketing and export promotion services.34 Despite this support, the average farm household income was well above the average household income in the U.S. (in 2017 the average farm household income was $113,495 according to the USDA); further, the payments tend to go to the largest and wealthiest farmers.35 Eliminating such wasteful expenditures is exactly what imposing a hard budget constraint on the federal government is supposed to create.
Unfortunately, farming is not the only business that has managed to amass unjustifiable subsi-dies. Other corporate welfare programs subsidize a wide range of activities. Some subsidies, such as the Export-Import bank and the Overseas Private Investment Corporation, provide below market financing for companies or force the taxpayers to cover the losses. Other subsidies, like the payments to Solyndra and Tesla underwrite companies investing in politically favored proj-ects. According to the Cato Institute, “a 2012 CATO report found that the federal government spends about $100 billion annually on corporate welfare.”36
Corporate welfare programs should be eliminated based on the merits – these programs harm the country’s economic vitality because they create economic distortions and support politically-fa-vored inefficient technologies often at the expense of more effective, but politically unconnected, alternatives. Eliminating these programs also exemplifies the necessary spending prioritization in order to make the federal government’s expenditures affordable. Spending billions of dollars to weaken the economy is clearly a less valuable use of the government’s scarce resources than funding Social Security, income support programs, or defense.
Income SecurityUnlike corporate welfare, the federal government’s income support programs serve an important eco-nomic function. However, it performs this function quite inefficiently. Table 2 details the 2018 expen-ditures for major federal income support program areas. Overall, the federal government spent $321.8 billion on these programs.
Table 2 Federal Expenditures on Income Support Programs (Housing Assistance, Food Assistance, and Other Income Security Expenditures) - FY2018
2018 EXPENDITURES (DOLLARS IN MILLIONS)
Housing assistance $49,325
Food and nutrition assistance $103,681
Other income security $168,758
Total Income Security Payments $321,764
Source: OMB
These expenditures do not include the approximately $407.6 billion the federal government spent on Medicaid,37 the $32.3 billion spent on Unemployment Compensation, which were gen-erally received by different households, nor the “25 million eligible workers and families” in 2018 who received about $63 billion from the Earned Income Tax Credit (EITC).38 Combined, the federal government is providing $824.6 billion in income support, see Table 3.

28 Beyond the New Normal: How Much Should We Spend?
Relative to the number of peo-ple who require assistance, these expenditures are gener-ous. The need for assistance varies, obviously, with the size of a household – there is a large difference between a household of 1-person earning $20,000 a year and a household of 5 peo-ple living on $20,000 a year. As a convenient benchmark, an in-come of approximately $30,000 annually is generally cited as the “living wage” threshold.39 According to the U.S. Census, there were 31.6 million house-holds earning less than the $30,000 living wage threshold. Using the $30,000 income lev-el as a benchmark, the federal
government spends $26,073 annually for every household whose earnings are less than the living wage threshold – and this does not include the state level expenditures. While it is inappropriate to provide each one of these households the same income support, this calculation illustrates that the current expenditure levels are sufficient to ensure an adequate safety net.
Due to the sufficiency of the current expenditure levels, from a funding level perspective, it is reasonable to limit the growth in all federal income support programs to the rate of inflation (excluding Medicaid, which will grow at the same rate as Medicare). Such a budget cap locks in the purchasing power of the current federal low-income support programs – guaranteeing no less, ensuring no more. Relative to national income, freezing the purchasing power of the current federal expenditures on income support programs can reduce the dollar value of expenditures relative to national income in half – falling from 1.8 percent estimated for 2020 to 0.7 percent in 2044 under the 3.9 percent real growth scenario; and to 0.9 percent in 2044 under the 3.0 percent real growth scenario. Figure 10 demonstrates that substantial budget savings are possible by capping the generosity of the income support programs at their current, arguably sufficient, levels.
Table 3 Federal Expenditures on Income Support Programs, Medicaid, EITC and Unemployment Compensation - FY2018
TOTAL INCOME
SUPPORT PROGRAMS (IN BILLIONS)
Income Support Programs $321.8
Federal Medicaid Expenditures $407.6
Earned Income Tax Credit (EITC) $63.0
Unemployment Compensation $32.3
TOTAL EXPENDITURES $824.6
Sources: Author calculations based on data from OMB, IRS, and HHS

29Realizing the 15 Percent Solution: Reforms to Establish a Pro-Growth Budget
Figure 10 Federal Expenditures on Income Support Programs Share of National Income - 2020–2044
0.7%
0.9%
0.0%
0.2%
0.4%
0.6%
0.8%
1.0%
1.2%
1.4%
1.6%
1.8%
2.0%
2020
20
21
2022
20
23
2024
20
25
2026
20
27
2028
20
29
2030
20
31
2032
20
33
2034
20
35
2036
20
37
2038
20
39
2040
20
41
2042
20
43
2044
3.0% Real Growth Scenario
3.9% Real Growth Scenario
Source: Author estimates
Simply because the federal government is spending a sufficient amount of money on the social safety net does not imply that this spending is being used efficiently. In fact, numerous studies have documented the inefficiencies that pervade the current system and have suggested reforms that can improve the effectiveness of the current income support programs. In this case, effec-tiveness is defined as ensuring a safety net exists that reduces the burden of poverty while also empowering more families and individuals to earn incomes that eliminate their need for such support.
In 2017, Michael Tanner noted that “few areas of government are as ripe for reform as our bloated, inefficient, and ineffective welfare system. The United States has spent more than $23 trillion fighting poverty, roughly $1 trillion last year alone. Yet all this spending has bought us surprisingly little. Although far from conclusive, the evidence suggests that our welfare system has marginally reduced the number of people living in poverty, while helping to reduce its depri-vations for millions of others.”40
These reforms should streamline the dozens of federal income support and anti-poverty pro-grams, many of which provide payments to landlords, doctors, and grocers not to the poor them-selves. The disincentives to work are also problematic. Due to the manner in which benefits are reduced as a person earns more income through work, the working poor can face some of the highest marginal tax rates in the U.S. For example, Tanner (2013) found that
The current welfare system provides such a high level of benefits that it acts as a disincentive for work. Welfare currently pays more than a minimum-wage job in 35 states, even after accounting for the Earned Income Tax Credit, and
30 Beyond the New Normal: How Much Should We Spend?
in 13 states it pays more than $15 per hour. If Congress and state legislatures are serious about reducing welfare dependence and rewarding work, they should consider strengthening welfare work requirements, removing exemptions, and narrowing the definition of work.41
Similarly, the Heritage Foundation notes that the “total federal, state, and local government spending on over 80 different means-tested welfare programs now reaches over $1 trillion annu-ally. The cost of welfare is unsustainable, and pouring dollars into an ever-increasing number of welfare programs has failed to improve rates of self-sufficiency.”42
As the old adage goes, the more you tax something, the less of that activity will be forthcom-ing. By excessively taxing work, the current income support programs are actively discouraging people from gaining the job skills and independence required to end poverty; or in the words of President Johnson, the aim of the War on Poverty was to not only “relieve the symptom of pov-
erty, but to cure it and, above all, to prevent it”.
Improving the incentives of the current income sup-port programs is a necessary reform for improving the economic outlook for those households who need sup-port while also ensuring that these payments can be-come affordable. There are several reforms that have been suggested, which typically include work require-ments, job-skills training, and reforms to lessen the effective marginal tax rates these groups face.
For example, transforming the current income sup-port programs into a simpler cash-basis system (such as Milton Friedman’s negative income tax) would help reduce inefficiencies that pervade the current system and could eliminate the high marginal tax rates that the current income support system imposes on these households. Perhaps most important, it would create a pro-work system that would help transition people into a sustainable career with the potential for ad-vancement and income growth.
Priotizing Defense Expenditures Outside of Social Security and Medicare, defense expenditures are the largest expenditure item of the federal budget; more than 15-cents out of every dollar taxed or borrowed during 2018 was spent on national defense. Over time, defense expenditures have been volatile, see Figure 11. Figure 11 presents the total national defense expenditures, and defense expenditures relative to national income. In part, the wide swings evident in Figure 11 correspond with the broader geo-political environment. During the Vietnam War era, defense expenditures peaked just be-low 10 percent of national income, expenditures then declined to 5.2 percent of national income in 1979, rose throughout the Cold War buildup during the 1980s, fell throughout the 1990s following the fall of the Berlin Wall, and then rose once again following 9-11. Expenditures
By excessively taxing work, the current income support programs are actively discouraging people from gaining the job skills and independence required to end poverty.

31Realizing the 15 Percent Solution: Reforms to Establish a Pro-Growth Budget
declined between 2009 and 2017 due, in large part, to the budget sequester – a non-geopolitical deemphasis on defense relative to other expenditure priorities.
Figure 11 Federal Defense Expenditures and Defense Expenditures as a Share of National Income 1962 - 2018
$0
$100,000
$200,000
$300,000
$400,000
$500,000
$600,000
$700,000
$800,000
0.0%
2.0%
4.0%
6.0%
8.0%
10.0%
12.0%
1962
19
64
1966
19
68
1970
19
72
1974
19
76
1978
19
80
1982
19
84
1986
19
88
1990
19
92
1994
19
96
1998
20
00
2002
20
04
2006
20
08
2010
20
12
2014
20
16
2018
Defense % NI
Defense Expenditures (millions $)
Source: Author calculations based on OMB and BEA data
Focusing on the recent trends, between 2001 and 2018, total defense expenditures grew 4.5 percent per year, on average. The average disguises two distinct trends, which are clearly visible in the red line in Figure 11. Between 2001 and 2010, defense expenditures grew 9.6 percent annually; but between 2010 and 2018, defense expenditures declined 0.9 percent annually (ex-penditures actually bottomed out in 2015).
Clearly, the total amount spent on defense matters. However, due to the recent budget volatility, establishing long-term budget stability creates a reform opportunity that would improve the effectiveness of the military without requiring an unaffordable growth in the military budget. In fact, when investing for the long-term, funding predictability is crucial. It is widely believed that the funding irregularities that have plagued the defense budget throughout the 2010s has harmed military preparedness. Speaking about the problems created by the recent budget uncer-tainty, a news article from the U.S. Department of Defense noted that the military
“must have predictable, adequate, sustained, and timely funding. Fiscal uncer-tainty has done a great deal to erode our readiness and hamper our ability to modernize, Army Secretary Mark T. Esper said.” Esper also pointed out the restrictions under the continuing resolution, which limits the services’ ability to initiate new projects and increase the quantities of munitions, directly impacting the training and readiness of the force.
Continuing resolutions and budget uncertainty have hurt military readiness and wasted tax dollars, the officials said.43

32 Beyond the New Normal: How Much Should We Spend?
Consequently, establishing a known budget level against which the military can reliably plan will, by itself, create important readiness benefits for the military.
Creating budget certainty is not enough. There is strong evidence that how these defense expen-ditures are spent matters too. Judged against this criterion current expenditure allocations have the potential for improvement. There are significant savings that have been identified by the De-partment of Defense (DOD) that would expand the readiness of the military while still adhering to the expenditure cap. For example, according to Miller and O’Hanlon (2019)
increased military spending largely serves three possible objectives: better mod-ernization for the future, upgraded unit-by-unit readiness for today, and in-creased force size and structure. Of these, the last is the least important to the U.S. military for the foreseeable future, and by draining away resources needed elsewhere, increasing force size is actually counter-productive. The focus should be on quality over quantity.
The U.S. armed forces need to innovate and invest in breakthrough capabilities, and to improve immediate readiness, but they can do so at their current overall size. Investing in modernization and readiness rather than growth, paired with more clever and efficient management of the military, can allow today’s U.S. military of roughly 1.3 million active-duty troops, just over 900,000 reservists, and almost 750,000 full-time civilians to do the job. By giving up most plans for expansion, the military services can ensure that modernization and readiness get the resources they crucially require.44
Eliminating unnecessary infrastructure, particularly unneeded military bases, offers another savings opportunity. According to Bartels (2017), while an imperfect instrument,
previous rounds of BRAC have resulted in close to $12 billion in annual recur-ring savings, proving to be a powerful instrument in rationalizing the DOD’s infrastructure footprint. …
According to a March 2016 DOD report requested by Congress, the department carries at least 22 percent of excess basing. The report further shows that every armed service carries excess infrastructure: the Army has 33 percent, the Air Force has 32 percent, the Navy has 7 percent, and the DOD-wide Defense Lo-gistics Agency has 12 percent. Even this assessment underestimates excess basing capacity, since the report was based on projection of space required, not actual facilities. A more accurate assessment cannot be accomplished until Congress allows the DOD to spend funds to perform this analysis.
Supporting excess infrastructure means that DOD is currently forced to pay to maintain installations that are either extremely underutilized or completely unnecessary. The financial resources dedicated to such maintenance could have been directed to legitimate military priorities. A new round is estimated to gen-erate $2 billion annually in savings.45

33Realizing the 15 Percent Solution: Reforms to Establish a Pro-Growth Budget
These potential savings illustrate that there are opportunities for controlling the Defense De-partment’s expenditures without reducing overall military effectiveness. Taking advantage of these opportunities will improve overall military efficiency while also complying with a strict budget cap that can meaningfully improve the federal government’s overall affordability.
In light of these opportunities, there are two ways that military effectiveness can be improved while adhering to the budget cap. The first is to commit to a set annual increase in overall de-fense expenditures. Such a commitment would enhance the military’s ability to plan for the future, and would reduce the waste that inevitably results from erratic funding growth. Second, empowering the military to fund programs based on defense needs, not political desires, would improve overall effectiveness without requiring any additional funding.
Based on the restrictions created by the overall budget cap, defense expenditures would be affordable if their growth (both Defense and Veterans Affairs) were limited to 5.0 percent per year, or slightly higher than the average expenditures between 2001 and 2018. However, if the cap is combined with greater stabili-ty and improved allocation, military effectiveness can be maintained (even improved) while still adhering to the budget cap. Should the economy only reach the 5.0 percent growth scenario, defense expenditures will maintain their current share of national income (3.7 percent). Under the 5.9 percent growth scenario, even though the dollar level of defense expenditures would be the same, these expenditures would decline over time to 3.0 percent of national income as of 2044 (including both Defense and Veterans Affairs, expen-ditures would equal 3.9 percent of national income).
Addressing the Threat from Interest Costs The federal government’s spending problem over the past half century has resulted in the esti-mated $15.8 trillion federal debt held by the public as of 2018.46 Consequently, future genera-tions are now on the hook for these costs. As we argued in the Beyond the New Normal: Account-ing for Government,47 such an inter-generational transfer could be justified if these expenditures supported public goods and services that benefited future generations. However, this has not been the case. Making matters worse, the costs from the large and growing debt will increase over time.
Despite the low-interest rate environment, more than 7-cents out of every dollar taxed or bor-rowed during 2018 was spent on interest payments. Worse, as discussed earlier, this burden is projected to grow over time. Figure 12 illustrates the consequences from this growing burden. Figure 12 presents the burden that interest payments will impose on future generations under the baseline scenario by comparing the baseline interest payments relative to the baseline growth in national income. As Figure 12 illustrates, this burden will more than double between 2020
Despite the low-interest rate environment, more than 7-cents out of every dollar taxed or borrowed during 2018 was spent on interest payments.

34 Beyond the New Normal: How Much Should We Spend?
and 2044. If the baseline scenario were allowed to come to fruition, then paying the costs for past government programs would require over 41 percent of an affordable budget (the 15 percent solution). Clearly, the current trends are unsustainable.
Figure 12 Baseline Interest Costs Relative to National Income - 2020–2044
2.6%
3.2% 3.4% 3.5% 3.6% 3.7%
4.0% 4.3%
4.6% 4.9%
5.4% 5.7%
6.2%
2020
2021
2022
2023
2024
2025
2026
2027
2028
2029
2030
2031
2032
2033
2034
2035
2036
2037
2038
2039
2040
2041
2042
2043
2044
Source: Author calculations based on CBO data
Adhering to the affordable expenditure path will alleviate some of these future costs by reducing, and ultimately eliminating, future budget deficits. The burden from managing the past deficits remain. And, as the baseline projections illustrate, these costs make it difficult (if not impossi-ble) to reach an affordable federal government, provide core value-added public goods to future generations, and cover the future interest costs.
One pathway for resolving this conflict would leverage the assets of the federal government to paydown its liabilities. This approach would shrink the balance sheet of the federal government by selling off (in an orderly fashion) some assets of the federal government in order to reduce the size of the government’s liabilities. As Shughart and Close (2017) argue:
The sale of federal assets for the purpose of debt-reduction warrants serious consideration mostly because of one fundamental issue: America’s debt obliga-tions are so huge that traditional methods for improving the government’s fiscal stance—namely, by raising more tax revenue, printing more money, or refinanc-ing/reissuing government debt—are inadequate to the task and would create a host of major problems.48
From an affordable government perspective, using the government’s assets to pay-off its debts would enable the government to reduce its annual interest costs to an affordable level. Conse-quently, it would be possible to create an affordable federal government while both paying off the

35Realizing the 15 Percent Solution: Reforms to Establish a Pro-Growth Budget
costs from past debts and ensuring that the federal government can provide future generations with core, value-added, public goods and services. An additional economic benefit from asset sales also arises because the “ownership and control of the formerly government-owned assets move to the private sector [where] profit-motivated business owners and entrepreneurs gain in-centives to employ those assets in ways that maximize their economic value.”49
There are many assets of the federal government that could be privatized in order to pay off the federal debt. The assets of the federal government include its gold holdings; land holdings; the buildings the federal gov-ernment owns, many of which are under-utilized and un-needed; oil held in the strategic petroleum reserve; and, deposits of oil, natural gas, and coal. While the precise value of these assets is difficult to quantify, estimates are in the tens of trillions of dollars – with some estimates even higher.
For example, Murphy 2011 notes that at the price of gold at the time of writing ($1,500 an ounce, compared to $1,283 as of January 21, 2019), the federal government’s gold holdings were worth $525 billion (about $449 bil-lion at the January 21st value).50 Then there is $52 billion in oil held in the Strategic Petroleum Reserve, offshore oil deposits valued at $164 billion (present discounted value), $786 billion in “credit market instruments”, and $55 billion in corporate equities acquired under the TARP. Murphy further notes that the federal government further owns large amounts of underutilized commercial land and buildings, power generation facilities, and valuable portions of the electromagnetic spec-trum. Shughart and Close (2017) attempt to put a total value on these assets. They claim that
The Federal Real Property Council in 2006 appraised the value of federal land, buildings, and infrastructure at $1.3 trillion. As large as this estimate is, one class of assets not included in that inventory would likely bring in far more revenue: deposits of oil, natural gas, and coal on federal property, onshore and offshore. This includes technically recoverable resources totaling 1,194 billion barrels of oil and 2,150 trillion cubic feet of natural gas. Estimated recoverable coal re-serves on federal lands total 7.4 billion tons. The considerable cost of developing these reserves must also be factored in. Assuming that energy developers bid one-third to one-half the current market prices of these commodities, total rev-enues would amount to $23.3 trillion to $35 trillion, compared to today’s U.S. debt of $20 trillion.51
How the assets are liquidated is important. An effective liquidation requires careful planning and adequate time in order to ensure that the assets are sold off in an orderly fashion that does not adversely impact their value. Further, the amount of asset privatization required depends upon the ultimate goal, and even though the value of the federal government’s assets exceeds its total debt outstanding, there is no reason to completely pay down the federal government’s debt.
One pathway for resolving this conflict would leverage the assets of the federal government to paydown its liabilities.
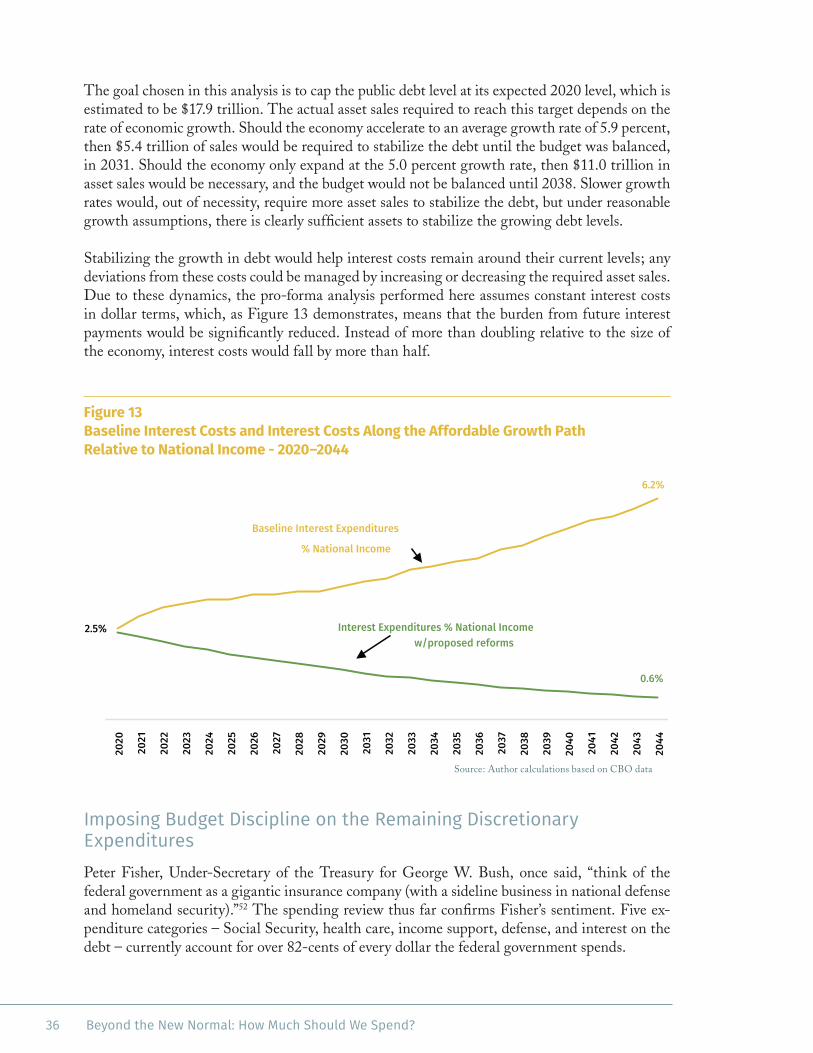
36 Beyond the New Normal: How Much Should We Spend?
The goal chosen in this analysis is to cap the public debt level at its expected 2020 level, which is estimated to be $17.9 trillion. The actual asset sales required to reach this target depends on the rate of economic growth. Should the economy accelerate to an average growth rate of 5.9 percent, then $5.4 trillion of sales would be required to stabilize the debt until the budget was balanced, in 2031. Should the economy only expand at the 5.0 percent growth rate, then $11.0 trillion in asset sales would be necessary, and the budget would not be balanced until 2038. Slower growth rates would, out of necessity, require more asset sales to stabilize the debt, but under reasonable growth assumptions, there is clearly sufficient assets to stabilize the growing debt levels.
Stabilizing the growth in debt would help interest costs remain around their current levels; any deviations from these costs could be managed by increasing or decreasing the required asset sales. Due to these dynamics, the pro-forma analysis performed here assumes constant interest costs in dollar terms, which, as Figure 13 demonstrates, means that the burden from future interest payments would be significantly reduced. Instead of more than doubling relative to the size of the economy, interest costs would fall by more than half.
Figure 13 Baseline Interest Costs and Interest Costs Along the Affordable Growth Path Relative to National Income - 2020–2044
6.2%
2.5%
0.6%
2020
2021
2022
2023
2024
2025
2026
2027
2028
2029
2030
2031
2032
2033
2034
2035
2036
2037
2038
2039
2040
2041
2042
2043
2044
Baseline Interest Expenditures
% National Income
Interest Expenditures % National Income w/proposed reforms
Source: Author calculations based on CBO data
Imposing Budget Discipline on the Remaining Discretionary ExpendituresPeter Fisher, Under-Secretary of the Treasury for George W. Bush, once said, “think of the federal government as a gigantic insurance company (with a sideline business in national defense and homeland security).”52 The spending review thus far confirms Fisher’s sentiment. Five ex-penditure categories – Social Security, health care, income support, defense, and interest on the debt – currently account for over 82-cents of every dollar the federal government spends.

37Realizing the 15 Percent Solution: Reforms to Establish a Pro-Growth Budget
The remaining 18-cents of every dollar taxed or borrowed during 2018 was spent on every other function of the government including international affairs, criminal justice, regulations, infra-structure, commerce programs, transportation programs, education programs, the U.S. postal service, business subsidies, science and technology, and general government expenditures (e.g. the costs to maintain Congress). These are the discretionary expenditures (minus defense and veterans) of the federal government.
While as a share of the budget these expenditures are around all-time lows, they are large in absolute terms – there were nearly $733 billion in FY2018. Consequently, capping the growth in these expenditures can meaningfully improve the federal government’s overall affordability. Overall, given the spending paths for the previous five areas, reaching an affordable budget by 2044 would require that these expenditures be capped, in aggregate, to a 3.7 percent annual growth rate, which is 1.7 percentage points above the assumed rate of inflation of 2.0 percent, but below the assumed growth in national income of 5.9 percent or 5.0 percent. As a result, all other discretionary spending would decline from 4.1 percent of national income to 2.3 percent of national income (under the 5.9 percent growth scenario), see Figure 14.
Figure 14 All Other Discretionary Spending Relative to National Income - 2020–2044
4.1% 3.8%
3.5% 3.4%
3.2% 3.1% 2.9% 2.8% 2.7% 2.6% 2.5% 2.3% 2.3%
2020
2021
2022
2023
2024
2025
2026
2027
2028
2029
2030
2031
2032
2033
2034
2035
2036
2037
2038
2039
2040
2041
2042
2043
2044
Source: Author calculations
This cap should not be applied equally, however. Some programs should be completely eliminat-ed. For example, just as the expenditures on corporate cronyism (e.g. agriculture subsidies) are unjustifiable, so are the expenditures on the U.S. postal service or Amtrak. Whatever past merits these programs may have created, the proliferation of private companies competing against these government subsidized industries demonstrates that these functions can be clearly privatized.

38 Beyond the New Normal: How Much Should We Spend?
For the programs that have merit, these expenditures need to be prioritized against one another. Greater infrastructure expenditures, and there is strong evidence that more infrastructure invest-ments are needed, would need to be judged against increased funding for the National Technical Information Service, a Bureau of the Department of Commerce. The purpose, and benefits, from a hard budget constraint is to require that the merits of each program be judged against all other programs. And, just like with defense expenditures, reprioritizing the other discretionary programs can improve the services provided by the government while better controlling cost growth.
ConclusionEstablishing a pro-growth budget is feasible over time. It requires many tough choices including:
• Social Security reform
• Health care reform
• Reforms to social safety net programs
• Implementing identified defense savings coupled with a growth cap
• Selling federal assets to reduce the government’s debt costs, and
• A hard cap on the remaining discretionary spending programs that in-cludes the elimination of all corporate welfare expenditures.
If all of these reforms are implemented, then the current trajectory of the federal government would be radically transformed. Figure 15 illustrates this impact.

39Realizing the 15 Percent Solution: Reforms to Establish a Pro-Growth Budget
Figure 15 Affordable Expenditure Path Based on High-income Growth Scenario Social Security, Medicare, Interest, and All Other Expenditures as a Percent of National Income - 2020–2044
0.0%
15.0%
30.0%
2020
2021
2022
2023
2024
2025
2026
2027
2028
2029
2030
2031
2032
2033
2034
2035
2036
2037
2038
2039
2040
2041
2042
2043
2044
Baseline expenditures
Affordable expenditures with 5.0% Growth
Affordable expenditures with 5.9% Growth
Affordability Range
Source: Author calculations based on CBO projections
On the current expenditure path, federal expenditures will rise from 24.9 percent of national income currently to 32.8 percent by 2044. In contrast, if the above reforms are implemented, then federal expenditures will decline relative to national income by 2044. The extent of the decline depends on the increased economic growth rate that results. Should economic growth return to the 1960 – 2017 average of 3.0 percent inflation adjusted growth (5.0 percent including the assumed 2.0 percent growth in inflation), then total government expenditures would fall to 18.3 percent of national income. While not yet in the affordability range, such an expenditure level is below the long run average for revenues relative to national income. Put differently, the budget would be structurally balanced, and the government would not be incurring more debt.If growth could return to the average growth rate between 1983 and 2000 (3.9 percent real growth plus the assumed 2.0 percent growth in inflation), federal expenditures could reach the goal of 15.0 percent of national income. The federal budget would not only be balanced, it would be affordable to the private sector as well.
The previous research in the Beyond the New Normal program has indicated that excessive gov-ernment expenditures are a significant obstacle to economic growth. Based on these results, a return to the strong growth of the 1980s and 1990s is not unreasonable. Consequently, the U.S. economy will reap large economic benefits from transitioning to a pro-growth affordable budget. Importantly, these growth benefits will reduce the need for higher income-support expenditures, further easing the difficulty of maintaining the affordable budget path over time. For conserva-tive purposes, these dynamic impacts were not included in the analysis.

40 Beyond the New Normal: How Much Should We Spend?
These growth benefits are the ultimate justification for undertaking the reforms. Poor fiscal pol-icies have been impeding the U.S. economy’s growth potential for most of the 21st century. If left unaddressed, these impediments will continue to grow over time reducing the general welfare of Americans. On the other hand, undertaking the difficult process of creating an affordable government will create significant benefits in terms of higher incomes, greater prosperity, and a more effective public sector. These benefits more than justify the effort required.

41Realizing the 15 Percent Solution: Reforms to Establish a Pro-Growth Budget
Endnotes
1 Winegarden, W. (2018) “Beyond the New Normal: The 15 Percent Solution, Defining the Affordable Level of Government” Pacific Research Institute, May; https://www.pacificre-search.org/wp-content/uploads/2018/05/NewNormal2018-1_The15PercentSolution_Web.pdf.
2 Edwards C (2013) “Canada’s Fiscal Reforms” Cato Journal, Vol. 33, No. 2 (Spring/Sum-mer); https://object.cato.org/sites/cato.org/files/serials/files/cato-journal/2013/5/cj33n2-11.pdf.
3 Henderson DH (2011) “Canada’ Budget Triumph” Journal of Applied Corporate Finance, September 28.
4 The Pacific Research Institute’s series of papers in the Beyond the New Normal series can be found at: https://www.pacificresearch.org/beyond-the-new-normal-new-study-slow-eco-nomic-growth-is-not-the-new-normal-for-us-economy/.
5 It is important to note that the surge in federal government expenditures following the Great Recession was not stimulative, and did not help alleviate the costs associated with the economic downturn (See: the Beyond the New Normal series at: https://www.pacificresearch.org/beyond-the-new-normal-new-study-slow-economic-growth-is-not-the-new-normal-for-us-economy/). Therefore, the actual surge in expenditures that occurred in 2009 is not a justification for violating the affordable expenditure path.
6 The Pacific Research Institute’s series of papers in the Beyond the New Normal series can be found at: https://www.pacificresearch.org/beyond-the-new-normal-new-study-slow-eco-nomic-growth-is-not-the-new-normal-for-us-economy/.
7 Winegarden, W. and Chura, N. (2017) “Beyond the New Normal Part IV: Policy Mix The-ory and Historical Evidence” Pacific Research Institute, April; https://www.pacificresearch.org/wp-content/uploads/2017/06/Beyond__4Historical_web.pdf. Studies cited include: Mitchell, D.J. (2005) “The Impact of Government Spending on Economic Growth” Her-itage Foundation Backgrounder, No. 1831, March 31; and Foster, J.D. (2009) “Keynesian Fiscal Stimulus Policies Stimulate Debt -- Not the Economy” Heritage Foundation Back-grounder, No. 2302, July 27.
8 (2018) “The Budget and Economic Outlook: 2018 to 2028” Congressional Budget Office, April; https://www.cbo.gov/system/files/115th-congress-2017-2018/reports/53651-out-look.pdf. The CBO projects government expenditures as a share of GDP. This percentage was converted to a percentage of national income based on the average relationship between national income and GDP, which vacillated around 85.7 percent between 1994 and 2017.
9 Inflation is measured based on CBO’s projected growth rate in the GDP price index.

42 Beyond the New Normal: How Much Should We Spend?
10 The Pacific Research Institute’s series of papers in the Beyond the New Normal series can be found at: https://www.pacificresearch.org/beyond-the-new-normal-new-study-slow-eco-nomic-growth-is-not-the-new-normal-for-us-economy/.
11 Tanner MD (2015) “Medicare and Social Security Tabs Coming Due” Cato Institute, March; https://www.cato.org/publications/commentary/medicare-social-security-tabs-com-ing-due.
12 For the provisions of the Social Security Act of 1935 see: https://www.ssa.gov/histo-ry/35act.html#PREAMBLE.
13 (2016) “Options for Reducing the Deficit: 2017 to 2026” Congressional Budget Office, December.
14 Martin PP and Weaver DA (2005) “Social Security: A Program and Policy History” So-cial Security Office of Policy, Vol. 66, No. 1; https://www.ssa.gov/policy/docs/ssb/v66n1/v66n1p1.html.
15 (2016) “Options for Reducing the Deficit: 2017 to 2026” Congressional Budget Office, December.
16 (2016) “Options for Reducing the Deficit: 2017 to 2026” Congressional Budget Office, December.
17 (2016) “Options for Reducing the Deficit: 2017 to 2026” Congressional Budget Office, December.
18 (2016) “Options for Reducing the Deficit: 2017 to 2026” Congressional Budget Office, December.
19 (2017) “CATO Handbook for Policymakers: 38. Medicare” Cato Institute, 8th edition; https://www.cato.org/cato-handbook-policymakers/cato-handbook-policy-makers-8th-edi-tion-2017/medicare.
20 Graboyes RF (2014) “Fortress and Frontier in American Health Care” Mercatus Research, October; https://www.mercatus.org/system/files/Graboyes-Fortress-Frontier_3.pdf.
21 Graboyes RF (2014) “Fortress and Frontier in American Health Care” Mercatus Research, October; https://www.mercatus.org/system/files/Graboyes-Fortress-Frontier_3.pdf.
22 Graboyes R (2017) “Missing Elements of Health Care Reform” Real Clear Health, March 10; https://www.realclearhealth.com/articles/2017/03/10/missing_elements_of_health_care_reform_110490.html.
23 Cannon MF (2008) “Large Health Savings Accounts: A Step toward Tax Neutrality for Health Care” Forum for Health Economics & Policy, Volume 11 Issue 2.
24 Haislmaier E and Moffit R (2017) “Fairness in the Federal Tax Treatment of Health Insur-ance: The Linchpin of Real Reform” the Heritage Foundation, February 24; https://www.heritage.org/health-care-reform/report/fairness-the-federal-tax-treatment-health-insur-ance-the-linchpin-real.
43Realizing the 15 Percent Solution: Reforms to Establish a Pro-Growth Budget
25 Cannon MF (2008) “Large Health Savings Accounts: A Step toward Tax Neutrality for Health Care” Forum for Health Economics & Policy Volume 11, Issue 2.
26 Finkelstein A (2007) “The Aggregate Effects of Health Insurance: Evidence from the In-troduction of Medicare” the Quarterly Journal of Economics Vol. CXXII, Issue 1, September.
27 Araujo M (2018) “Can Value-Based Care Bring Down the Cost of Healthcare?” the bal-ance, July 23; https://www.thebalance.com/can-value-based-care-bring-down-the-cost-of-healthcare-4172231.
28 Pipes S (2015) “Medicare Part D saves money and lives” Washington Examiner, May 26; https://www.washingtonexaminer.com/medicare-part-d-saves-money-and-lives.
29 (2017) “CATO Handbook for Policymakers: 38. Medicare” Cato Institute, 8th edition; https://www.cato.org/cato-handbook-policymakers/cato-handbook-policy-makers-8th-edi-tion-2017/medicare.
30 Centers for Medicare & Medicaid Services, Office of the Actuary, National Health Statis-tics Group.
31 Office of Management and Budget, Table 3.2 — Outlays by Function and Subfunction: 1962–2022.
32 Sumner DA “Agricultural Subsidy Programs” The Library of Economics and Liberty; https://www.econlib.org/library/Enc/AgriculturalSubsidyPrograms.html.
33 See: OMB “Historical Tables”; https://www.whitehouse.gov/omb/historical-tables/.
34 http://sustainableagriculture.net/publications/grassrootsguide/farm-bill-programs-and-grants/.
35 https://www.ers.usda.gov/data-products/farm-household-income-and-characteristics.aspx.
36 (2017) “CATO Handbook for Policymakers: 54. Special-Interest Spending and Corporate Welfare” Cato Institute, 8th edition; https://www.cato.org/cato-handbook-policymakers/cato-handbook-policy-makers-8th-edition-2017/special-interest-spending.
37 “HHS FY 2018 Budget in Brief - CMS - Medicaid” Department of Health and Human Ser-vices; https://www.hhs.gov/about/budget/fy2018/budget-in-brief/cms/medicaid/index.html.
38 “About EITC” Internal Revenue Service; https://www.eitc.irs.gov/eitc-central/about-eitc/about-eitc.
39 For an estimation of the living wage ($15.12/hour or approximately $30,000 a year) see: Nadeau C (2016) “ew Data: Calculating the Living Wage for U.S. States, Counties and Metro Areas August 19; http://livingwage.mit.edu/articles/19-new-data-calculating-the-living-wage-for-u-s-states-counties-and-metro-areas.
40 Tanner MD (2017) “The Risks and Rewards of Welfare Reform” National Review Decem-ber 20.

44 Beyond the New Normal: How Much Should We Spend?
41 Tanner MD (2013) “The Work Versus Welfare Trade-off: 2013” the Cato Institute; https://object.cato.org/sites/cato.org/files/pubs/pdf/the_work_versus_welfare_trade-off_2013_wp.pdf
42 “Solutions 2018: The Policy Briefing Book – Welfare” The Heritage Foundation; https://solutions.heritage.org/ensuring-opportunity-for-all/welfare/.
43 Ibarra J (2018) “Continuing Resolutions, Budget Uncertainty Harm Readiness, Service Secretaries Say” U.S. Department of Defense March 21; https://dod.defense.gov/News/Article/Article/1471649/continuing-resolutions-budget-uncertainty-harm-readiness-ser-vice-secretaries-say/.
44 Miller JN and O’Hanlon M (2019) “Quality Over Quantity: U.S. Military Strategy and Spending in the Trump Years” Brookings Foreign Policy Brief January; https://www.brook-ings.edu/wp-content/uploads/2019/01/FP_20190102_military_strategy_spending.pdf.
45 Bartels F (2017) “Four Priorities for the New Round of Base Realignment and Closure (BRAC)” the Heritage Foundation June 26; https://www.heritage.org/defense/report/four-priorities-the-new-round-base-realignment-and-closure-brac. The quote cited the following reports: U.S. Government Accountability Office, “Military Bases: Opportunities Exist to Improve Future Base Realignment and Closure Rounds,” Report to Congressional Committees, March 2013, https://www.gao.gov/assets/660/652805.pdf; U.S. Department of Defense, Infrastructure Capacity, March 2016, http://defensecommunities.org/wp-con-tent/uploads/2015/01/2016-4-Interim-Capacity-Report-for-Printing.pdf.
46 “Historical Tables” Office of Management and Budget; https://www.whitehouse.gov/omb/historical%20tables/.
47 Winegarden, W. and Chura, N. (2017) “Beyond the New Normal: Accounting for Govern-ment” Pacific Research Institute, February 3; https://www.pacificresearch.org/beyond-the-new-normal-part-2-accounting-for-government/.
48 Shughart WF and Close CP (2017) “Liquidating Federal Assets: A promising tool for end-ing the U.S. debt crisis” the Independent Institute, April 12.
49 Shughart WF and Close CP (2017) “Liquidating Federal Assets: A promising tool for end-ing the U.S. debt crisis” the Independent Institute, April 12.
50 Murphy RP (2011) “Privatizing Federal Government Assets” Econlib, July 4.
51 Shughart WF and Close CP (2017) “Liquidating Federal Assets: A promising tool for end-ing the U.S. debt crisis” the Independent Institute, April 12.
52 https://www.treasury.gov/press-center/press-releases/Pages/po3622.aspx.
45Realizing the 15 Percent Solution: Reforms to Establish a Pro-Growth Budget
About the Author
Wayne H. Winegarden, Ph.D. is a Senior Fellow in Business and Economics, Pacific Research Institute, as well as the Principal of Capitol Economic Advisors.
Dr. Winegarden has 20 years of business, economic, and policy experience with an expertise in applying quantitative and macroeconomic analyses to create greater insights on corporate strat-egy, public policy, and strategic planning. He advises clients on the economic, business, and in-vestment implications from changes in broader macroeconomic trends and government policies. Clients have included Fortune 500 companies, financial organizations, small businesses, state legislative leaders, political candidates and trade associations.
Dr. Winegarden’s columns have been published in the Wall Street Journal, Chicago Tribune, Inves-tor’s Business Daily, Forbes.com, and Townhall.com. He was previously economics faculty at Ma-rymount University, has testified before the U.S. Congress, has been interviewed and quoted in such media as CNN and Bloomberg Radio, and is asked to present his research findings at policy conferences and meetings. Previously, Dr. Winegarden worked as a business economist in Hong Kong and New York City; and a policy economist for policy and trade associations in Washington D.C. Dr. Winegarden received his Ph.D. in Economics from George Mason University.

46 Beyond the New Normal: How Much Should We Spend?
About PRIThe Pacific Research Institute (PRI) champions freedom, opportunity, and personal responsibil-ity by advancing free-market policy solutions. It provides practical solutions for the policy issues that impact the daily lives of all Americans, and demonstrates why the free market is more effec-tive than the government at providing the important results we all seek: good schools, quality health care, a clean environment, and a robust economy.
Founded in 1979 and based in San Francisco, PRI is a non-profit, non-partisan organization supported by private contributions. Its activities include publications, public events, media com-mentary, community leadership, legislative testimony, and academic outreach.
Center for Business and EconomicsPRI shows how the entrepreneurial spirit—the engine of economic growth and opportunity—is stifled by onerous taxes, regulations, and lawsuits. It advances policy reforms that promote a ro-bust economy, consumer choice, and innovation.
Center for Education PRI works to restore to all parents the basic right to choose the best educational opportunities for their children. Through research and grassroots outreach, PRI promotes parental choice in education, high academic standards, teacher quality, charter schools, and school-finance reform.
Center for the EnvironmentPRI reveals the dramatic and long-term trend toward a cleaner, healthier environment. It also examines and promotes the essential ingredients for abundant resources and environmental qual-ity: property rights, markets, local action, and private initiative.
Center for Health CarePRI demonstrates why a single-payer Canadian model would be detrimental to the health care of all Americans. It proposes market-based reforms that would improve affordability, access, quality, and consumer choice.
Center for California ReformThe Center for California Reform seeks to reinvigorate California’s entrepreneurial self-reliant traditions. It champions solutions in education, business, and the environment that work to ad-vance prosperity and opportunity for all the state’s residents.

47Realizing the 15 Percent Solution: Reforms to Establish a Pro-Growth Budget

48 Beyond the New Normal: How Much Should We Spend?

49Realizing the 15 Percent Solution: Reforms to Establish a Pro-Growth Budget

50 Beyond the New Normal: How Much Should We Spend?
www.pacificresearch.org
SAN FRANCISCO HEADQUARTERS101 Montgomery Street, Suite 1300San Francisco, CA 94104Tel 415-989-0833Fax 415-989-2411
SACRAMENTO OFFICE2110 K Street, Suite 28Sacramento, CA 95816Tel 916-389-9774
PASADENA OFFICE680 E. Colorado Blvd.Pasadena, CA 91107Tel 626-714-7572
Connect with Us
facebook.com/pacificresearchinstitute
@pacificresearch
youtube.com/pacificresearch1
www.linkedin.com/company/ pacific-research-institute