realizing rosslyn - amazon web services€¢ model 3 scenarios • review and discuss 3 scenarios...
TRANSCRIPT
GOODY CLANCY WITHKITTELSON & ASSOCIATES | RHODESIDE & HARWELLFARR ASSOCIATES | W-ZHA
Realizing Rosslyn: a new era of opportunity
1

GOODY CLANCY WITHKITTELSON & ASSOCIATES | RHODESIDE & HARWELLFARR ASSOCIATES | W-ZHA
AGENDA
••••
••••
••
•
2

GOODY CLANCY WITHKITTELSON & ASSOCIATES | RHODESIDE & HARWELLFARR ASSOCIATES | W-ZHA
1. Recap of July 29
3
••
•
•
•
••

GOODY CLANCY WITHKITTELSON & ASSOCIATES | RHODESIDE & HARWELLFARR ASSOCIATES | W-ZHA 4
• Confirm assumptions, goals, and performance criteria
• Determine 3 alternative scenarios to explore for analysis
• Model 3 scenarios
• Review and discuss 3 scenarios
• Narrow 3 scenarios down to 1 based on input
• Review, discuss 1 scenario
• Draft design guidelines, regulatory strategies
• Finalize preferred scenario
Mee
ting
1
Mee
ting
2
Mee
ting
3
Mee
ting
4
Building Heights and Massing Subcommittee Approach and General Work Plan
GOODY CLANCY WITHKITTELSON & ASSOCIATES | RHODESIDE & HARWELLFARR ASSOCIATES | W-ZHA
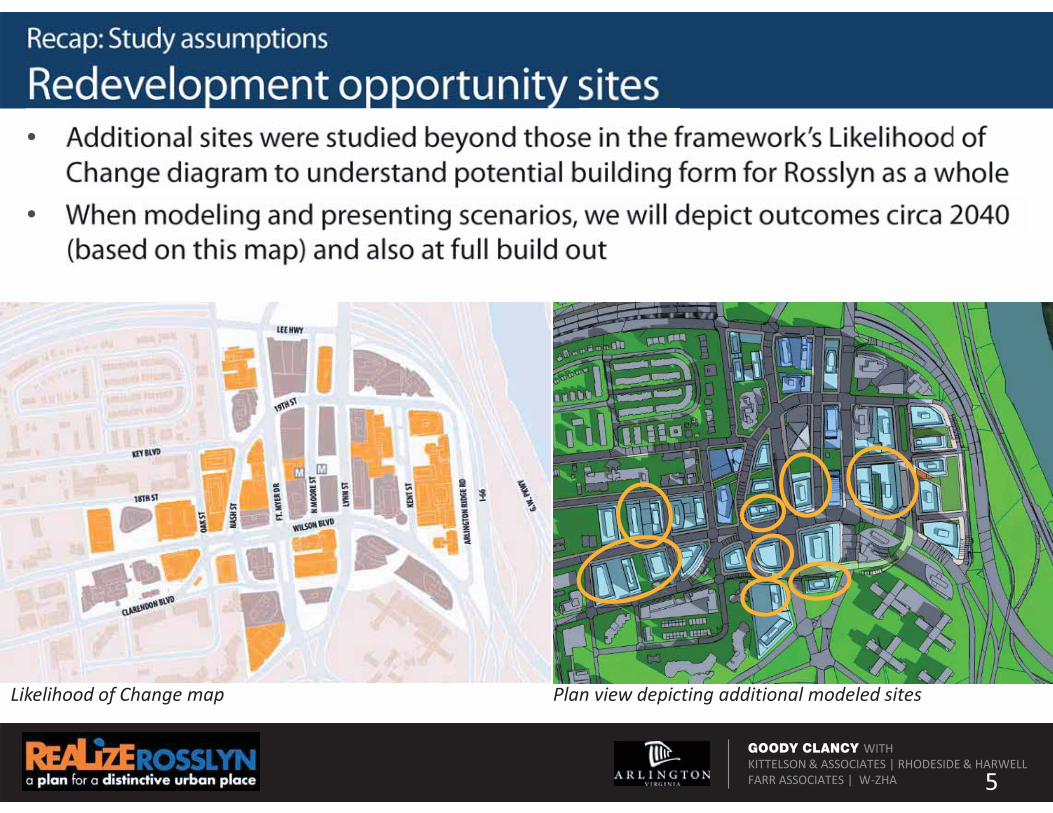
•
•
5
Likelihood of Change map Plan view depicting additional modeled sites
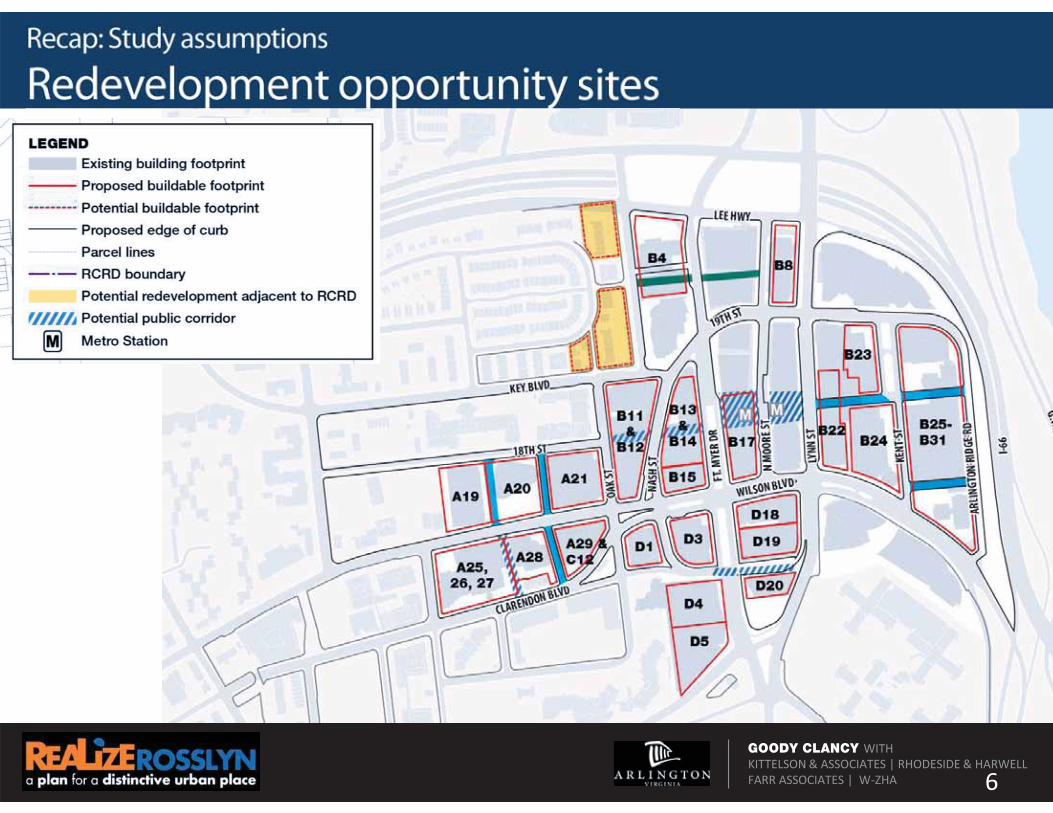
GOODY CLANCY WITHKITTELSON & ASSOCIATES | RHODESIDE & HARWELLFARR ASSOCIATES | W-ZHA 6

GOODY CLANCY WITHKITTELSON & ASSOCIATES | RHODESIDE & HARWELLFARR ASSOCIATES | W-ZHA 7
•
•
•

GOODY CLANCY WITHKITTELSON & ASSOCIATES | RHODESIDE & HARWELLFARR ASSOCIATES | W-ZHA 8
DRAFTBlock Map with Recommended Build to Lines Under development

GOODY CLANCY WITHKITTELSON & ASSOCIATES | RHODESIDE & HARWELLFARR ASSOCIATES | W-ZHA
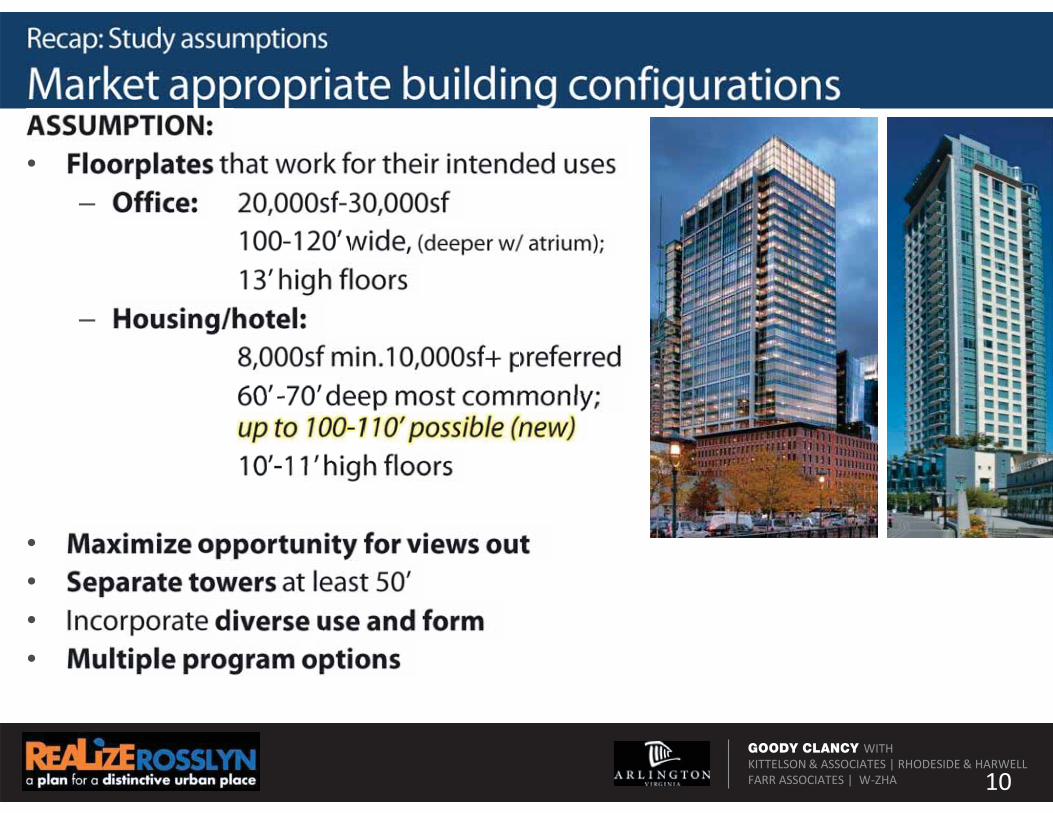
•
–
–
•
9
GOODY CLANCY WITHKITTELSON & ASSOCIATES | RHODESIDE & HARWELLFARR ASSOCIATES | W-ZHA 10
•–
–
••••
GOODY CLANCY WITHKITTELSON & ASSOCIATES | RHODESIDE & HARWELLFARR ASSOCIATES | W-ZHA
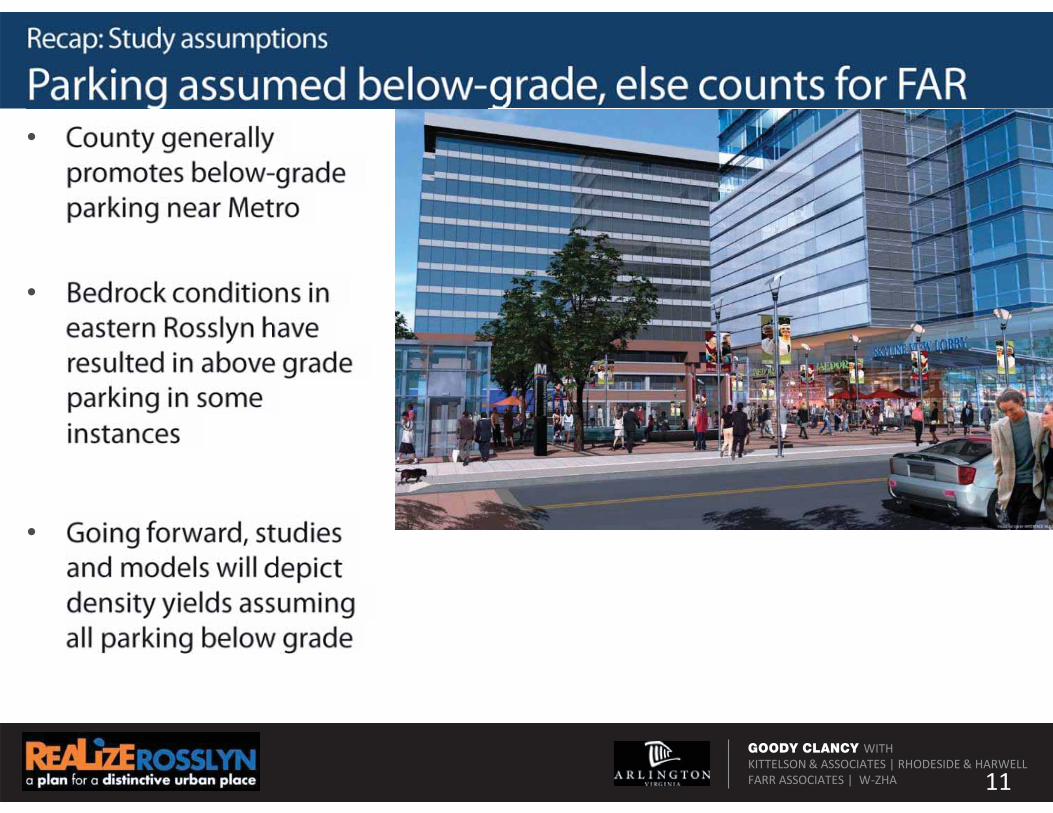
•
•
•
11
GOODY CLANCY WITHKITTELSON & ASSOCIATES | RHODESIDE & HARWELLFARR ASSOCIATES | W-ZHA 12
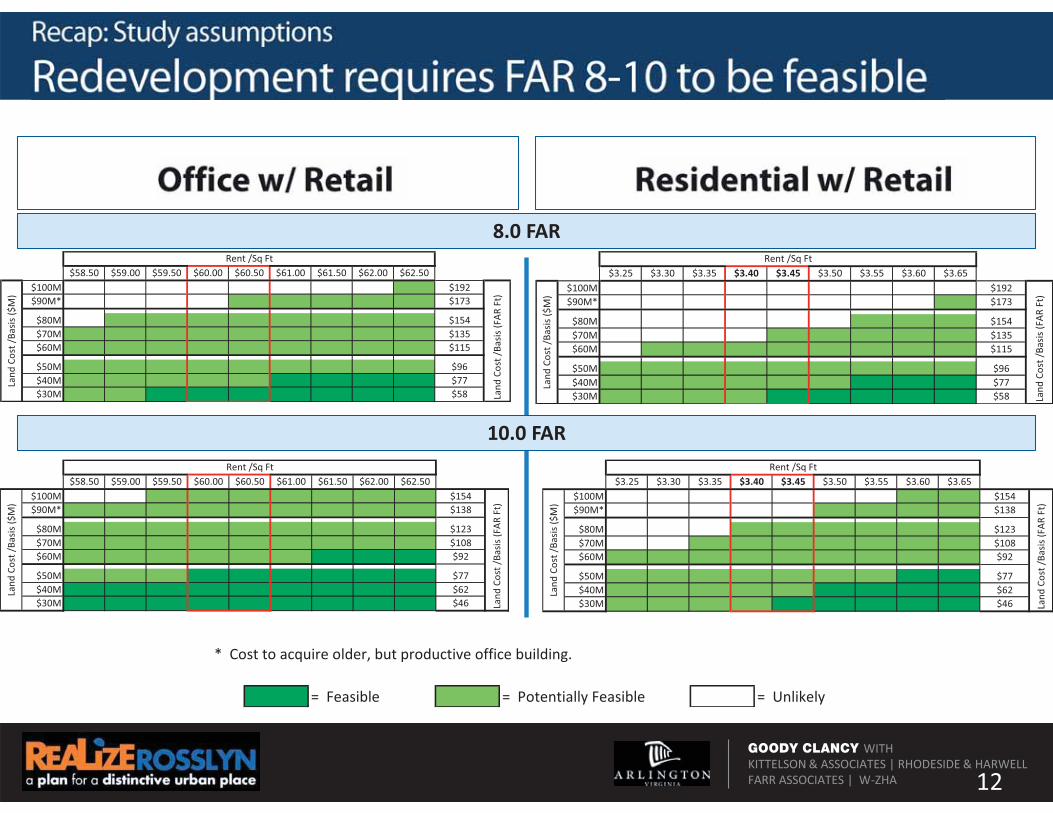
$3.25 $3.30 $3.35 $3.40 $3.45 $3.50 $3.55 $3.60 $3.65$100M $192$90M* $173
$80M $154$70M $135$60M $115
$50M $96$40M $77$30M $58
Rent /Sq Ft
Land
Cos
t /Ba
sis ($
M)
Land
Cos
t /Ba
sis (F
AR F
t)
$3.25 $3.30 $3.35 $3.40 $3.45 $3.50 $3.55 $3.60 $3.65$100M $154$90M* $138
$80M $123$70M $108$60M $92
$50M $77$40M $62$30M $46
Rent /Sq Ft
Land
Cos
t /Ba
sis ($
M)
Land
Cos
t /Ba
sis (F
AR F
t)
$58.50 $59.00 $59.50 $60.00 $60.50 $61.00 $61.50 $62.00 $62.50$100M $154$90M* $138
$80M $123$70M $108$60M $92
$50M $77$40M $62$30M $46
Rent /Sq Ft
Land
Cos
t /Ba
sis ($
M)
Land
Cos
t /Ba
sis (F
AR F
t)
8.0 FAR
10.0 FAR
$58.50 $59.00 $59.50 $60.00 $60.50 $61.00 $61.50 $62.00 $62.50$100M $192$90M* $173
$80M $154$70M $135$60M $115
$50M $96$40M $77$30M $58
Rent /Sq Ft
Land
Cos
t /Ba
sis ($
M)
Land
Cos
t /Ba
sis (F
AR F
t)
* Cost to acquire older, but productive office building.
= Feasible = Potentially Feasible = Unlikely

GOODY CLANCY WITHKITTELSON & ASSOCIATES | RHODESIDE & HARWELLFARR ASSOCIATES | W-ZHA 13
•
•
•
•
•
•
•
How should we manage and design future
building forms to create the best
possible Rosslyn (maximizing
framework goals)
GOODY CLANCY WITHKITTELSON & ASSOCIATES | RHODESIDE & HARWFARR ASSOCIATES | W-ZHA 13
?
GOODY CLANCY WITHKITTELSON & ASSOCIATES | RHODESIDE & HARWELLFARR ASSOCIATES | W-ZHA
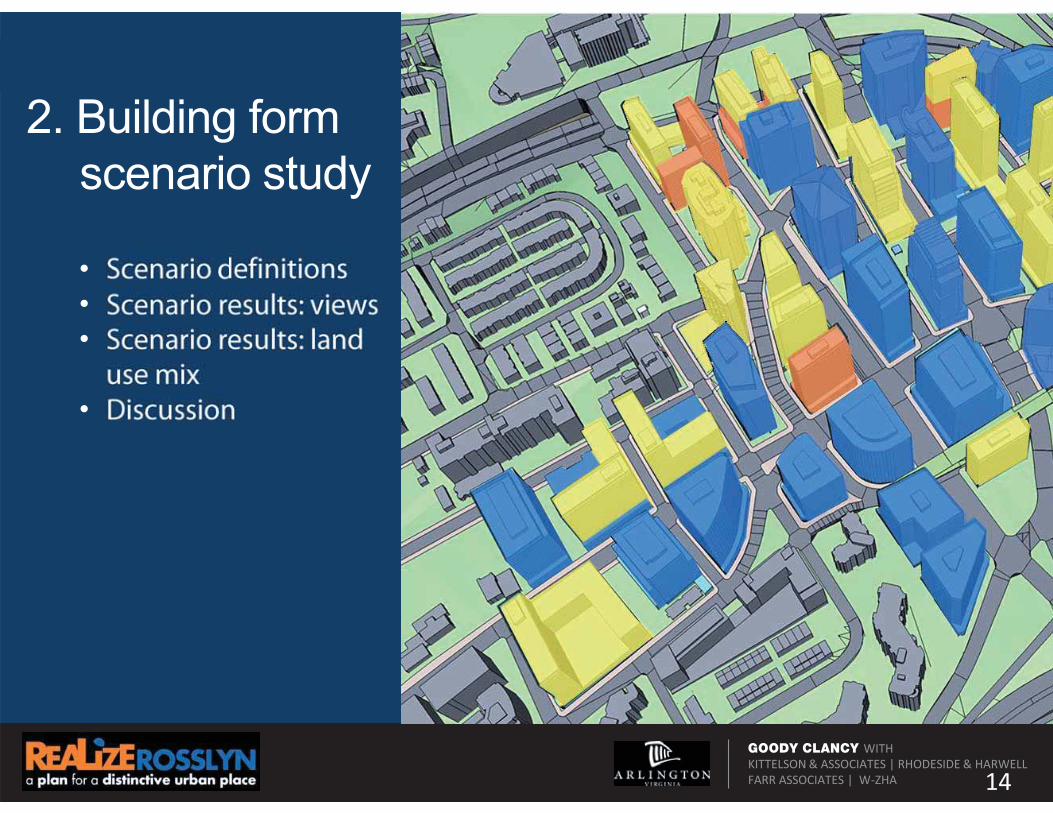
2. Building form scenario study
14
•••
•
GOODY CLANCY WITHKITTELSON & ASSOCIATES | RHODESIDE & HARWELLFARR ASSOCIATES | W-ZHA
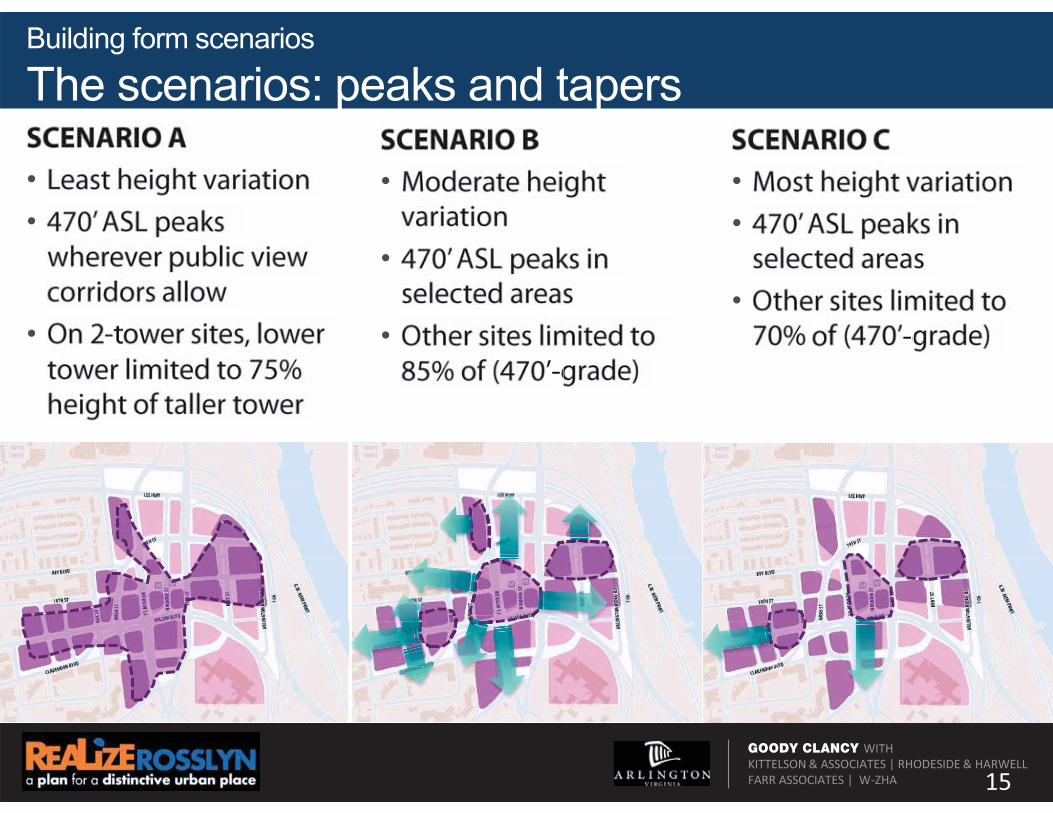
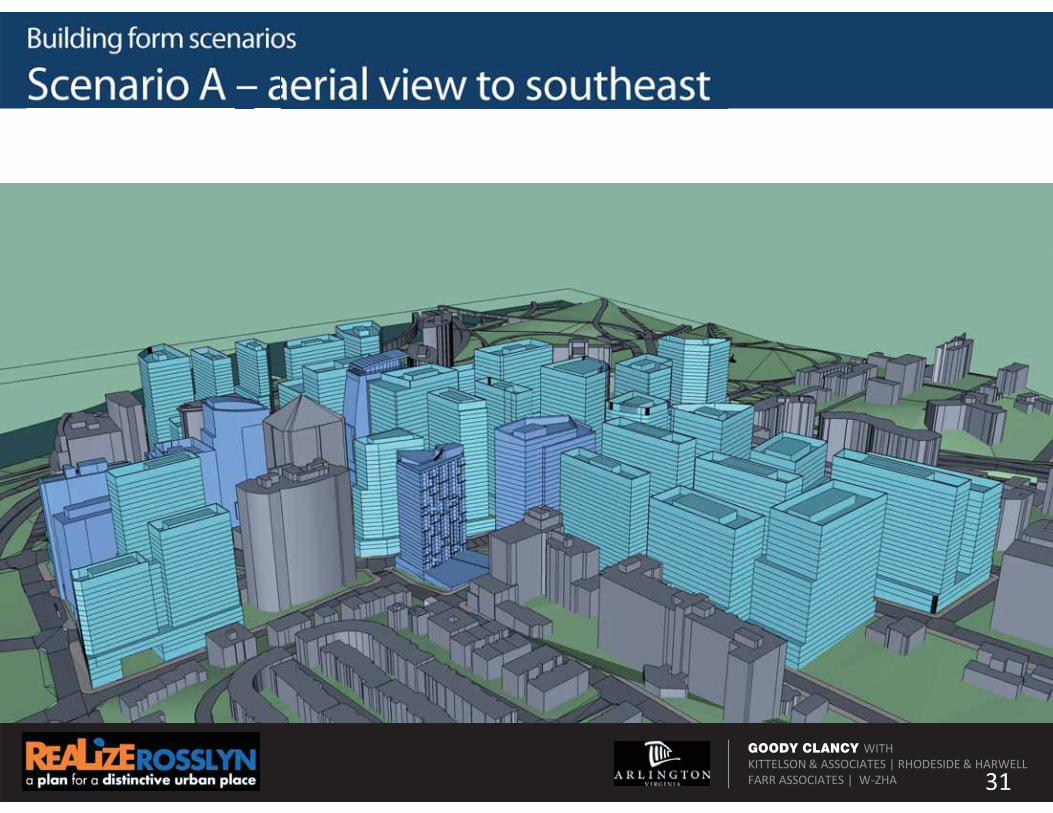
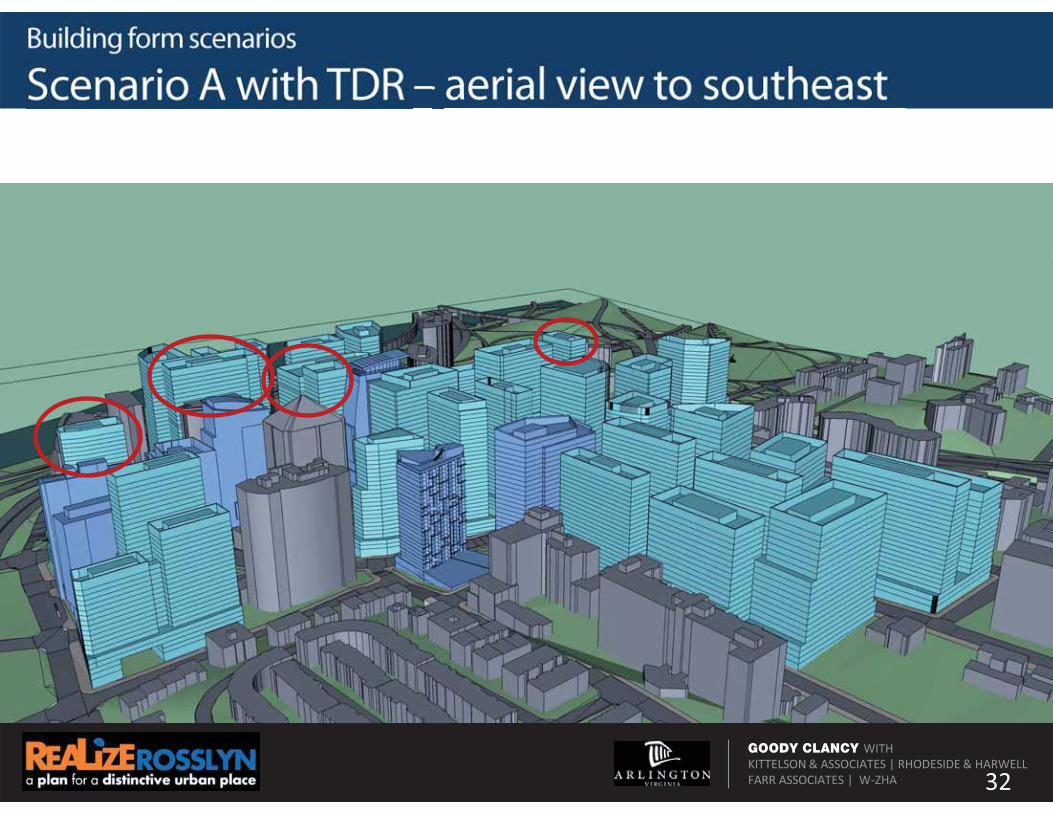
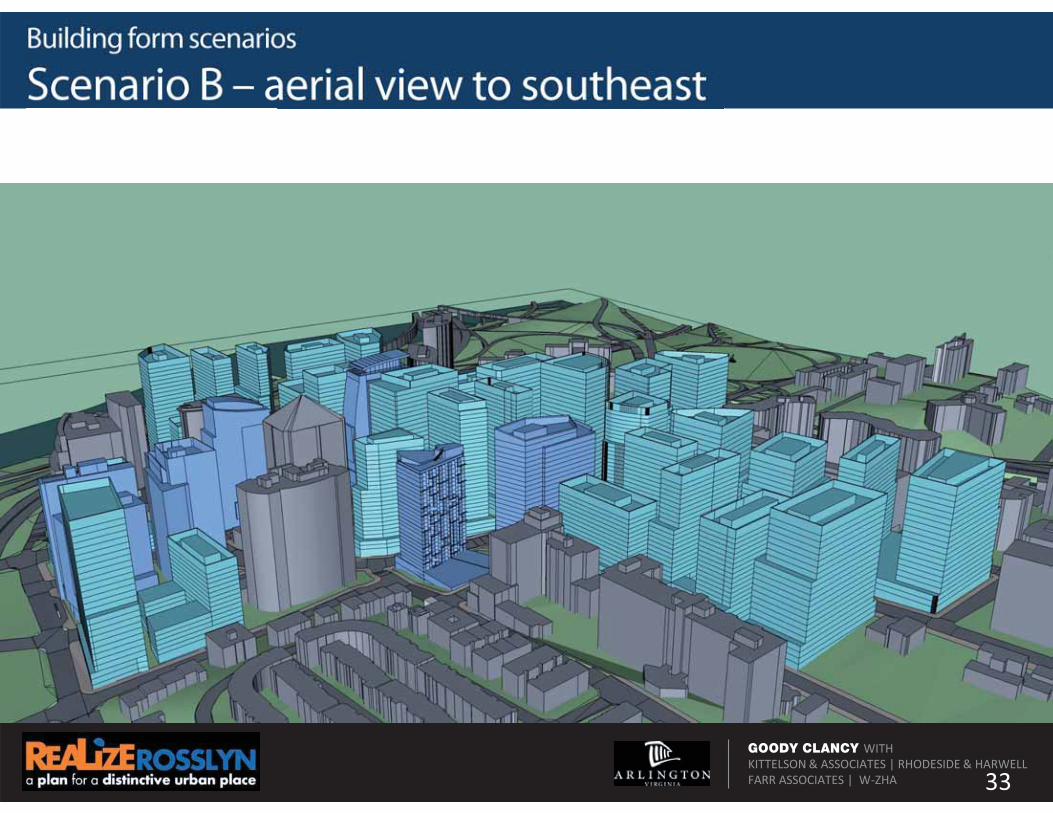
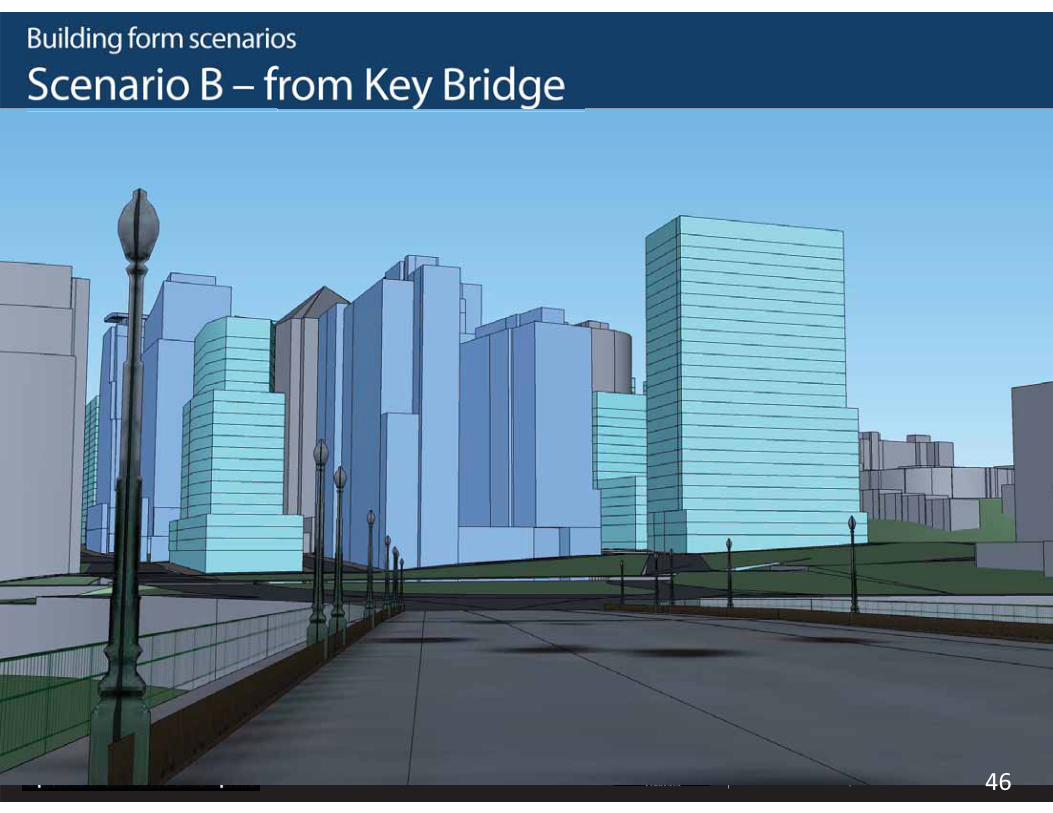
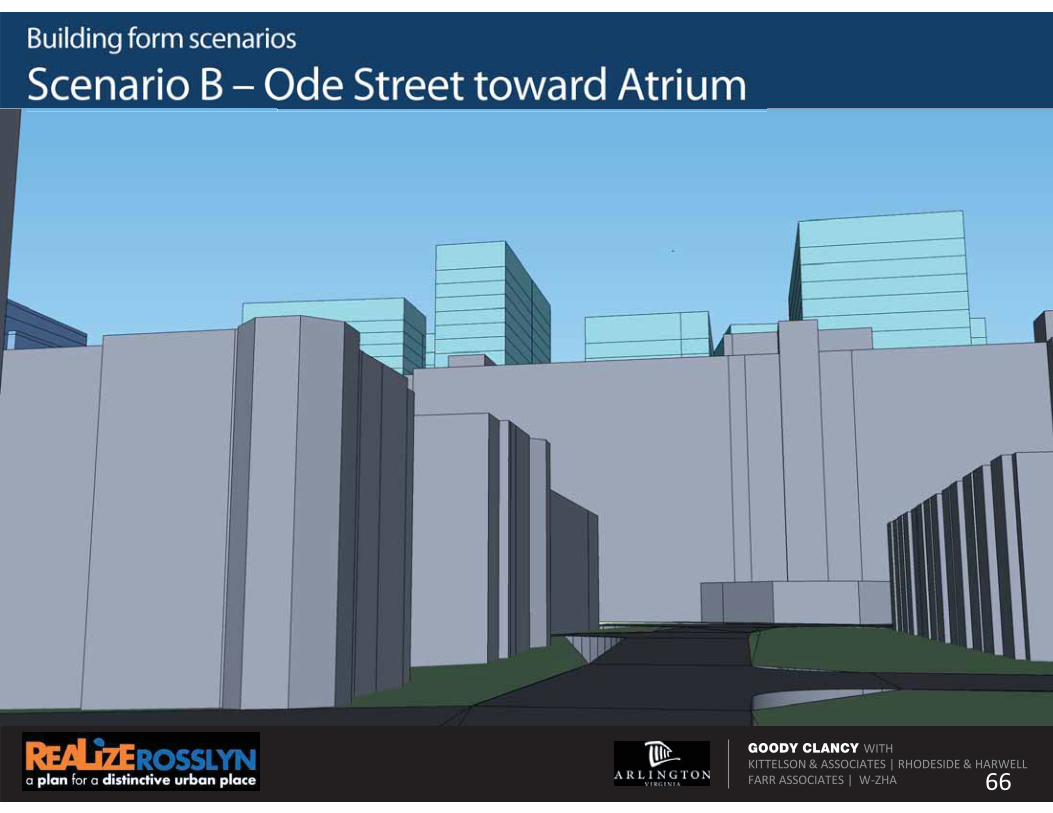
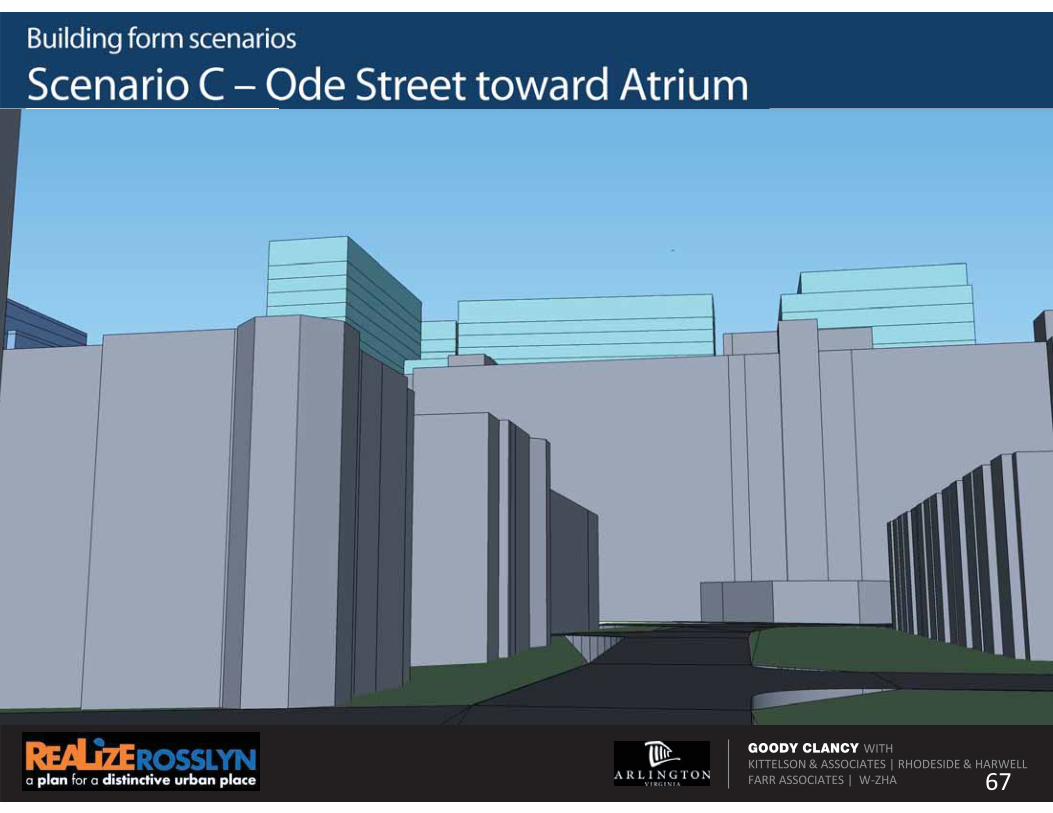
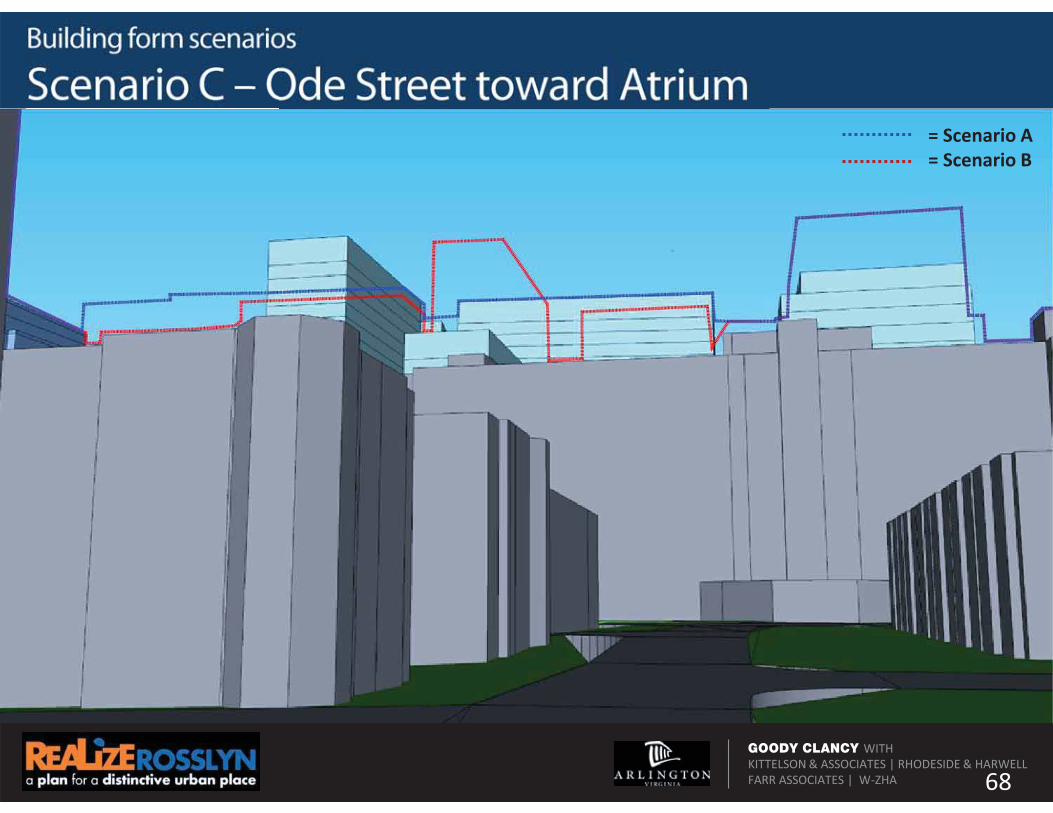
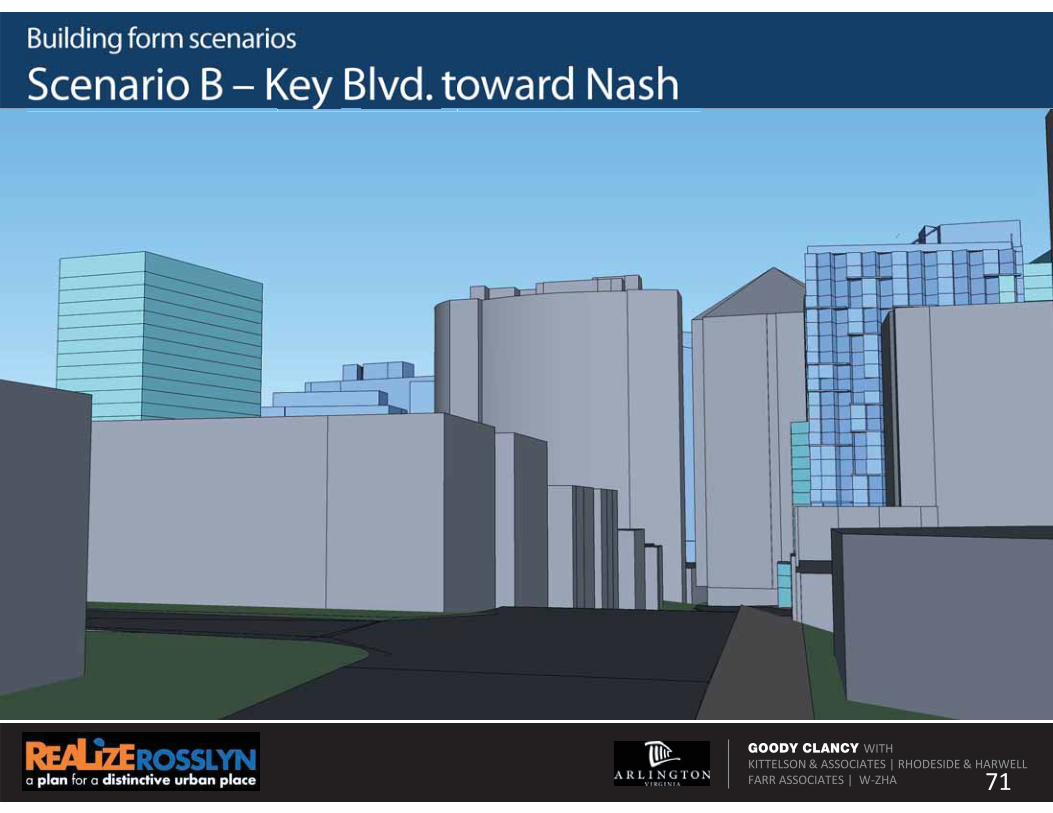
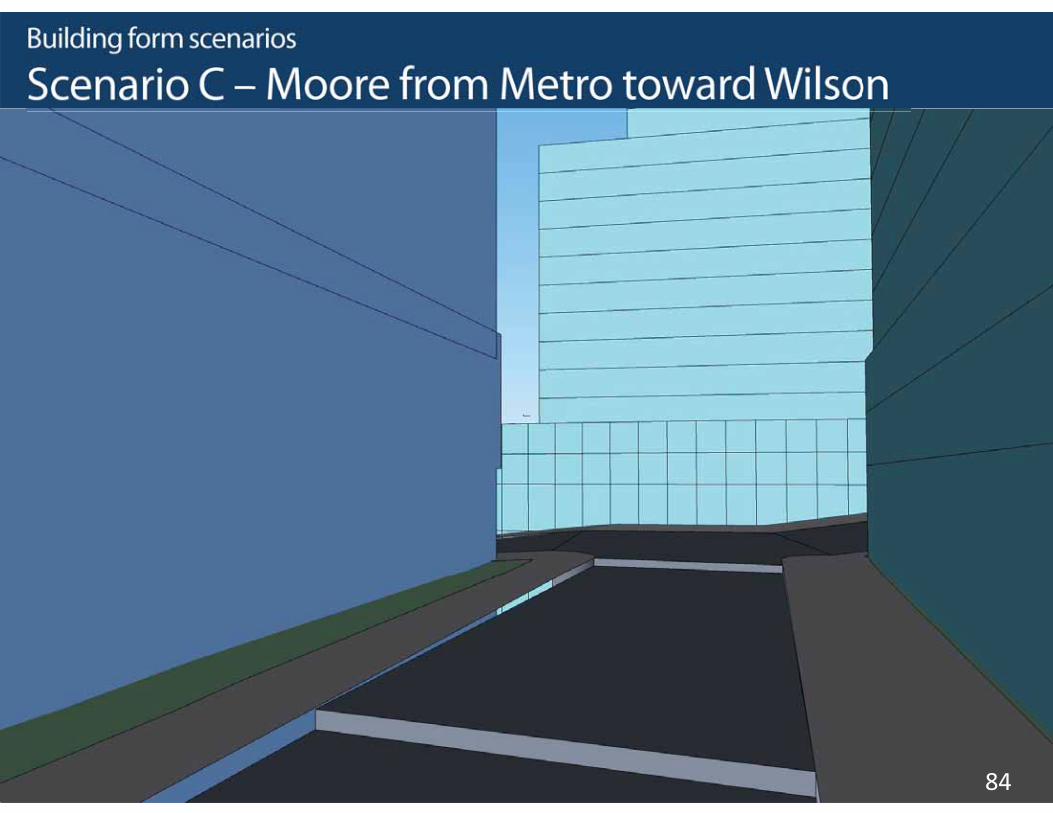
Building form scenarios
The scenarios: peaks and tapers
••
•
15
•
•
•
••
•

GOODY CLANCY WITHKITTELSON & ASSOCIATES | RHODESIDE & HARWELLFARR ASSOCIATES | W-ZHA
Building form scenarios
The scenarios: building layout
•
•
•
•
16
•
••
•
•
•
•
•
*Note: Scenario parameters for modeling apply broadly across the study area, yet in select instances sites may depart slightly to reach at least 8 FAR

GOODY CLANCY WITHKITTELSON & ASSOCIATES | RHODESIDE & HARWELLFARR ASSOCIATES | W-ZHA
Building form scenarios
Modeling and analysis methodology•
•
•
––
––
17
gygy
Scenario A Scenario B Scenario C
GOODY CLANCY WITHKITTELSON & ASSOCIATES | RHODESIDE & HARWELLFARR ASSOCIATES | W-ZHA
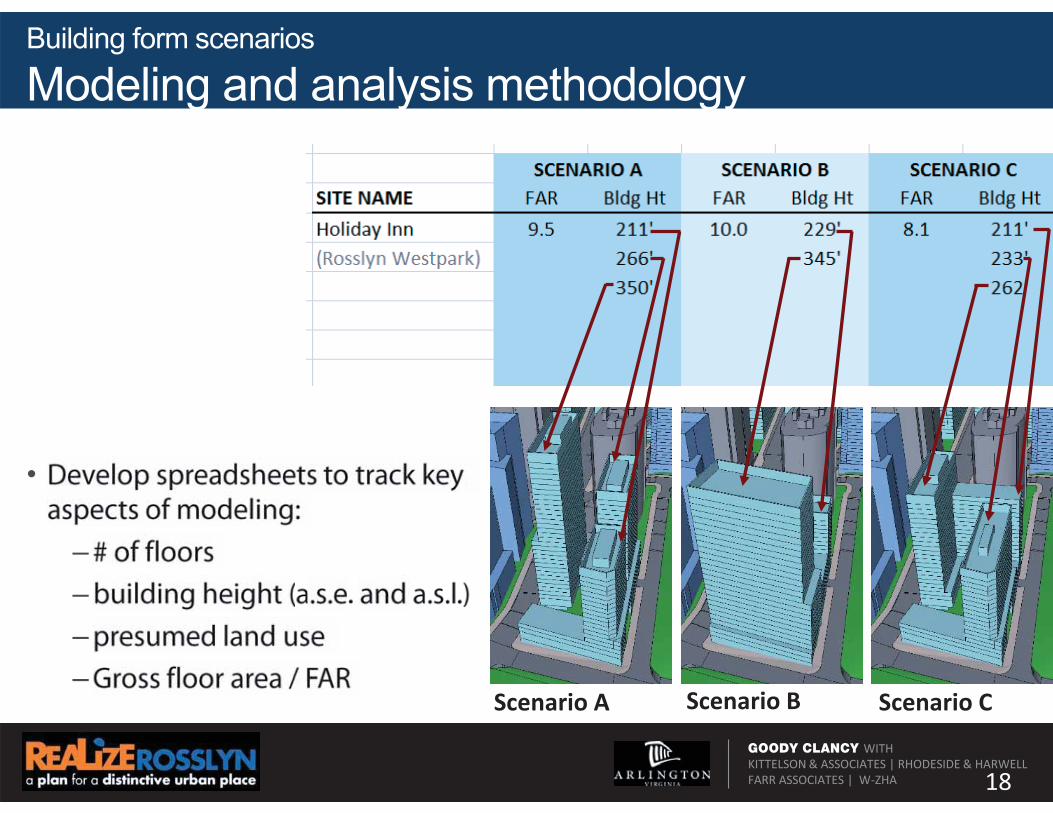
Building form scenarios
Modeling and analysis methodology
•
––––
18
Scenario A Scenario B Scenario C
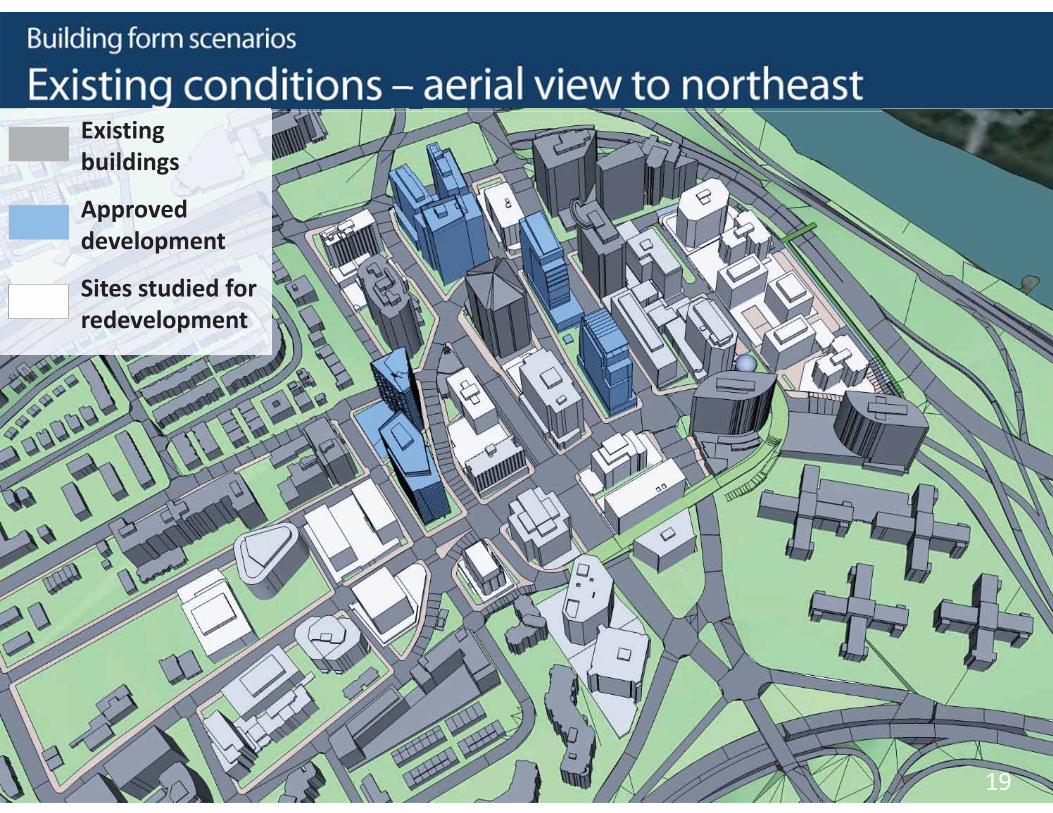
GOODY CLANCY WITHKITTELSON & ASSOCIATES | RHODESIDE & HARWELLFARR ASSOCIATES | W-ZHA 19
Existing buildings
Approved development
Sites studied for redevelopment
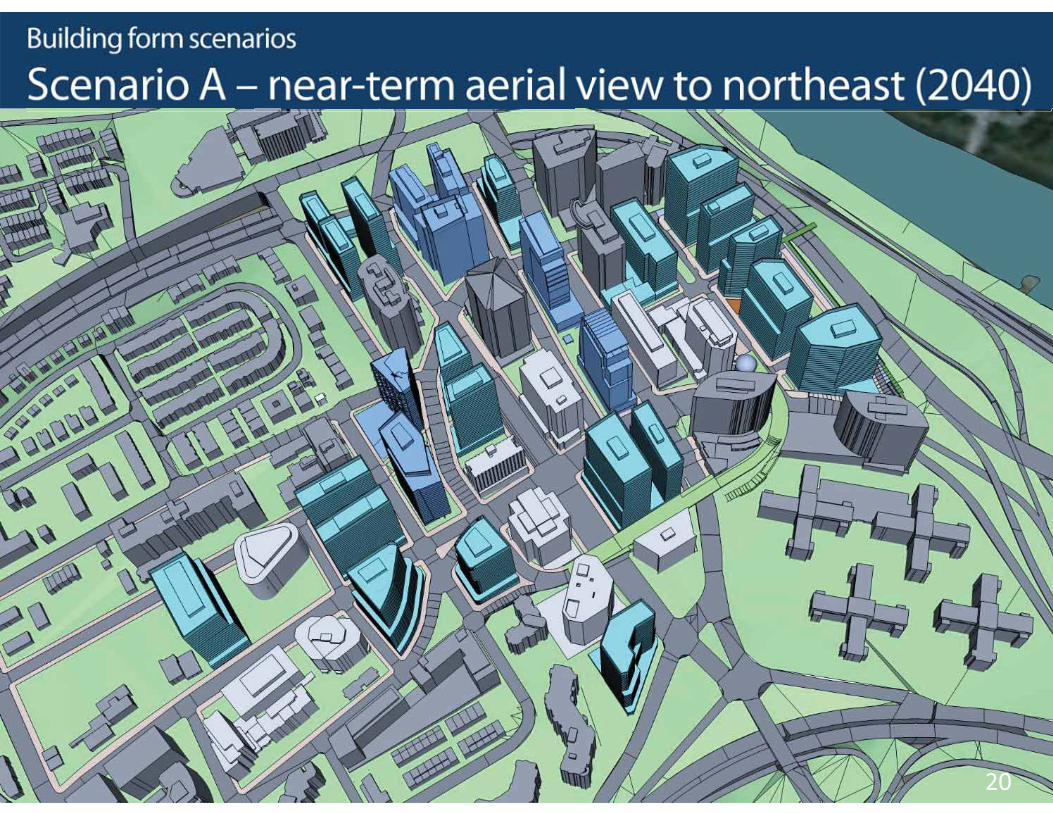
GOODY CLANCY WITHKITTELSON & ASSOCIATES | RHODESIDE & HARWELLFARR ASSOCIATES | W-ZHA 20
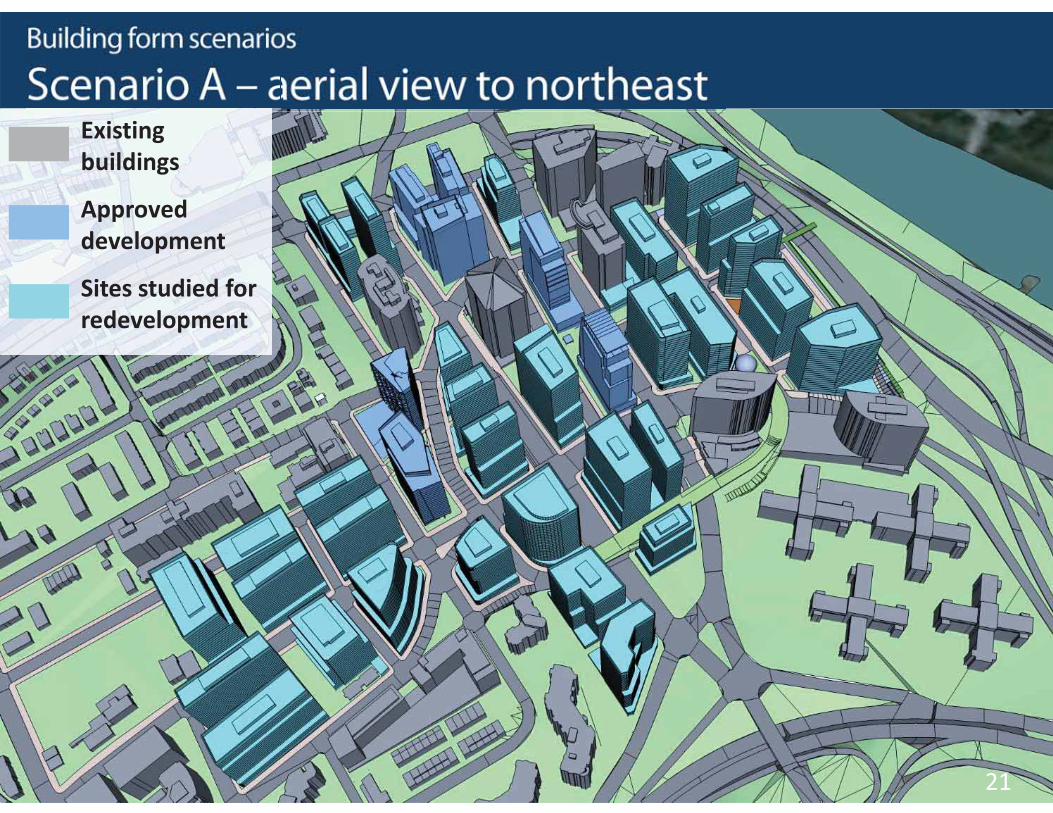
GOODY CLANCY WITHKITTELSON & ASSOCIATES | RHODESIDE & HARWELLFARR ASSOCIATES | W-ZHA 21
Existing buildings
Approved development
Sites studied for redevelopment
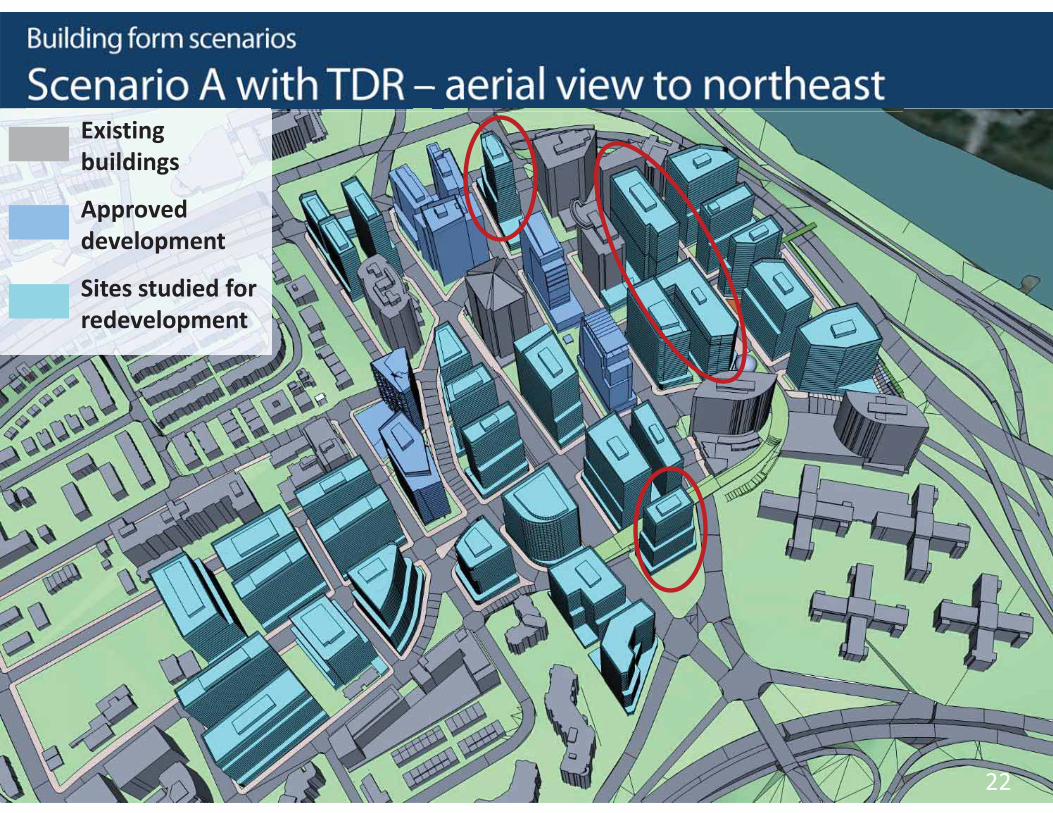
GOODY CLANCY WITHKITTELSON & ASSOCIATES | RHODESIDE & HARWELLFARR ASSOCIATES | W-ZHA 22
Existing buildings
Approved development
Sites studied for redevelopment
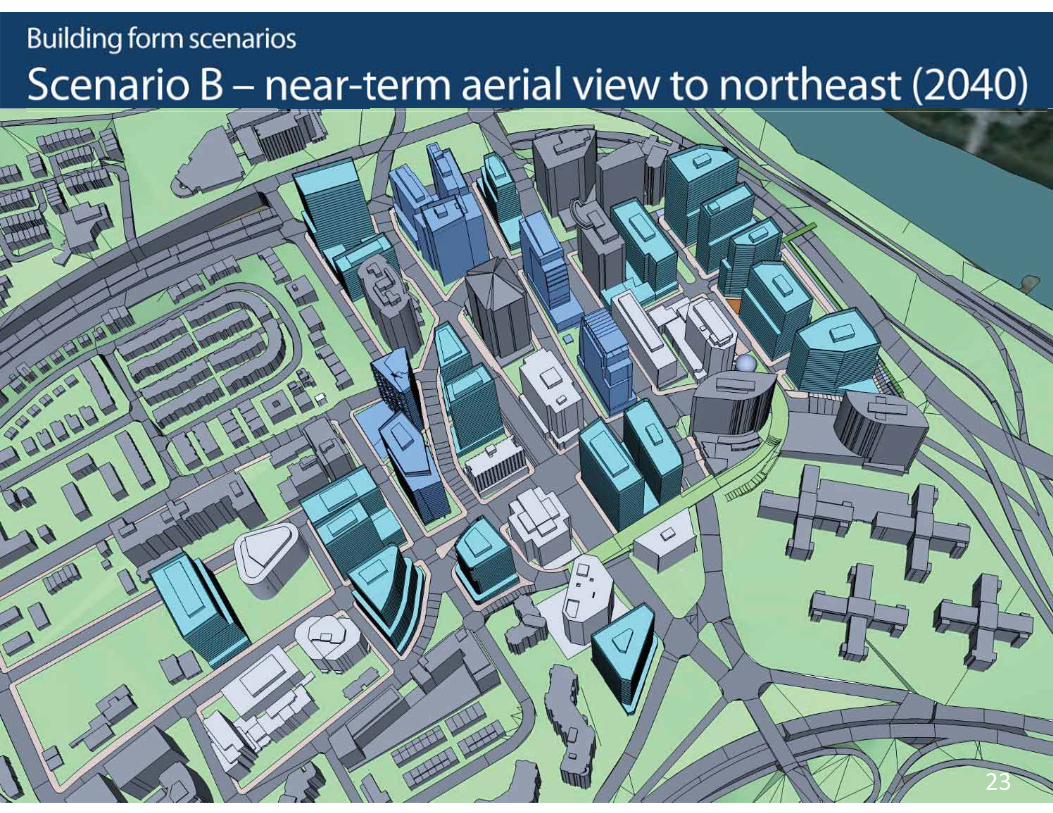
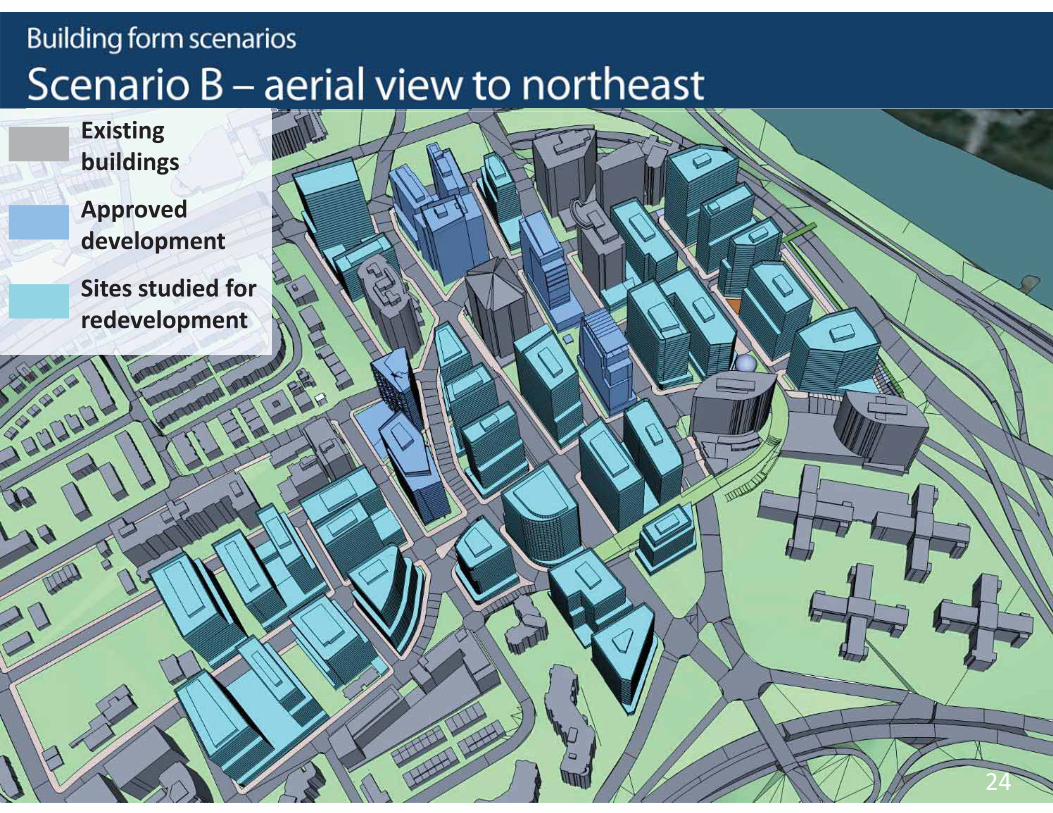
GOODY CLANCY WITHKITTELSON & ASSOCIATES | RHODESIDE & HARWELLFARR ASSOCIATES | W-ZHA 23
GOODY CLANCY WITHKITTELSON & ASSOCIATES | RHODESIDE & HARWELLFARR ASSOCIATES | W-ZHA 24
Existing buildings
Approved development
Sites studied for redevelopment
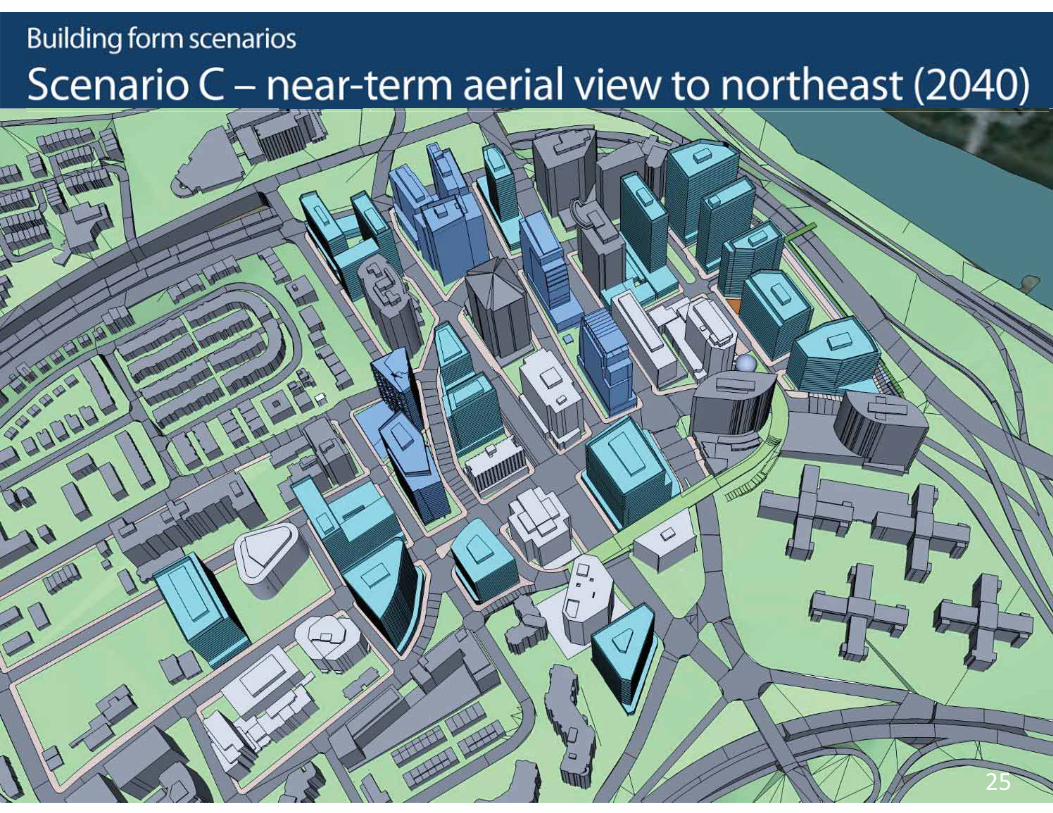
GOODY CLANCY WITHKITTELSON & ASSOCIATES | RHODESIDE & HARWELLFARR ASSOCIATES | W-ZHA 25
GOODY CLANCY WITHKITTELSON & ASSOCIATES | RHODESIDE & HARWELLFARR ASSOCIATES | W-ZHA 26
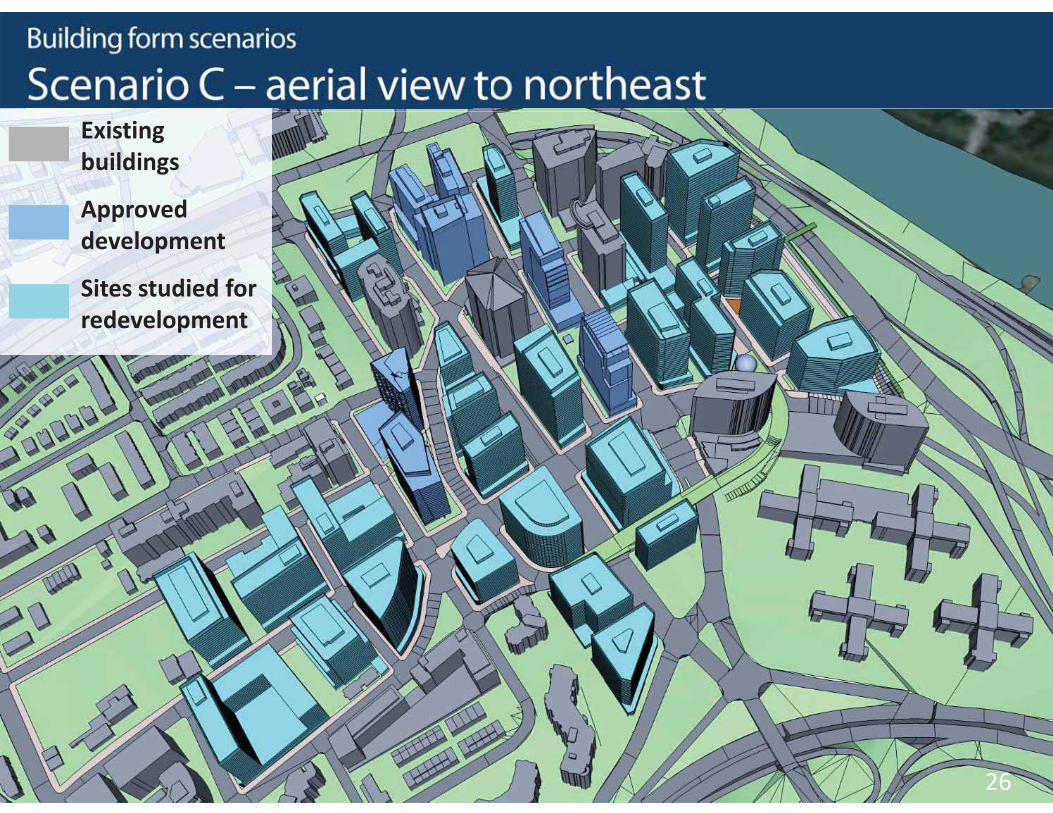
Existing buildings
Approved development
Sites studied for redevelopment
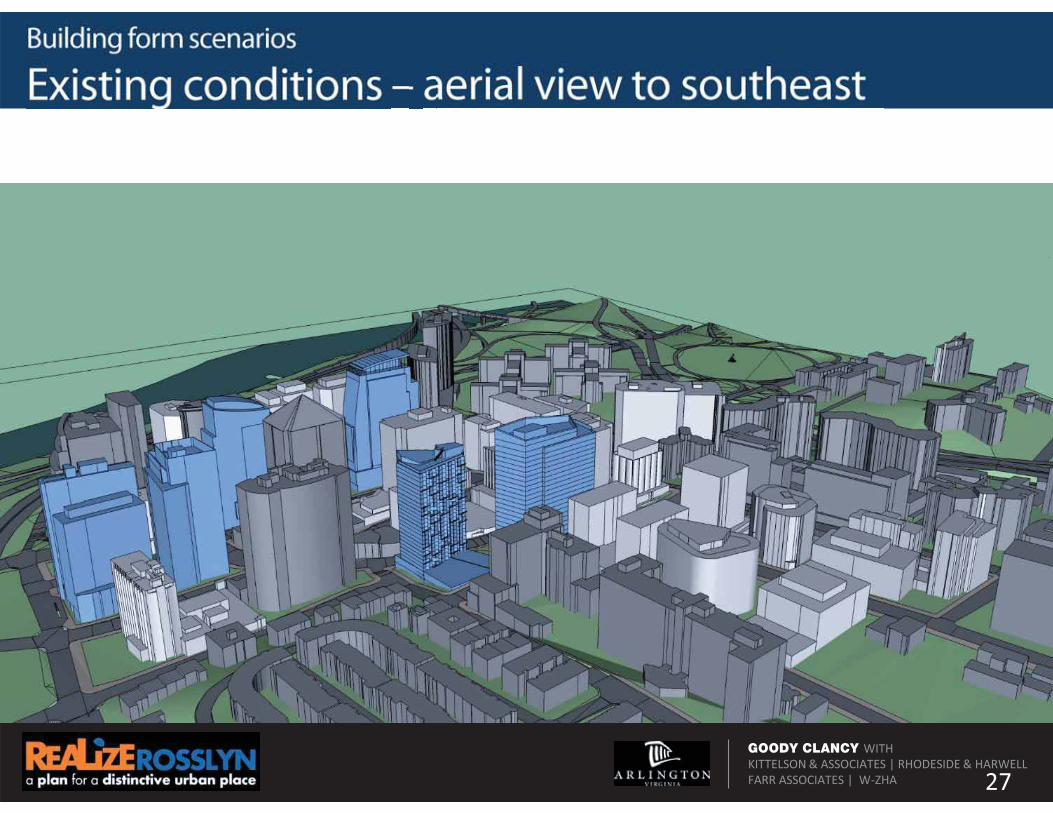
GOODY CLANCY WITHKITTELSON & ASSOCIATES | RHODESIDE & HARWELLFARR ASSOCIATES | W-ZHA 27

GOODY CLANCY WITHKITTELSON & ASSOCIATES | RHODESIDE & HARWELLFARR ASSOCIATES | W-ZHA 28
GOODY CLANCY WITHKITTELSON & ASSOCIATES | RHODESIDE & HARWELLFARR ASSOCIATES | W-ZHA 29
GOODY CLANCY WITHKITTELSON & ASSOCIATES | RHODESIDE & HARWELLFARR ASSOCIATES | W-ZHA 30
GOODY CLANCY WITHKITTELSON & ASSOCIATES | RHODESIDE & HARWELLFARR ASSOCIATES | W-ZHA 31
GOODY CLANCY WITHKITTELSON & ASSOCIATES | RHODESIDE & HARWELLFARR ASSOCIATES | W-ZHA 32
GOODY CLANCY WITHKITTELSON & ASSOCIATES | RHODESIDE & HARWELLFARR ASSOCIATES | W-ZHA 33

GOODY CLANCY WITHKITTELSON & ASSOCIATES | RHODESIDE & HARWELLFARR ASSOCIATES | W-ZHA 34
GOODY CLANCY WITHKITTELSON & ASSOCIATES | RHODESIDE & HARWELLFARR ASSOCIATES | W-ZHA 35

GOODY CLANCY WITHKITTELSON & ASSOCIATES | RHODESIDE & HARWELLFARR ASSOCIATES | W-ZHA 36

GOODY CLANCY WITHKITTELSON & ASSOCIATES | RHODESIDE & HARWELLFARR ASSOCIATES | W-ZHA 37
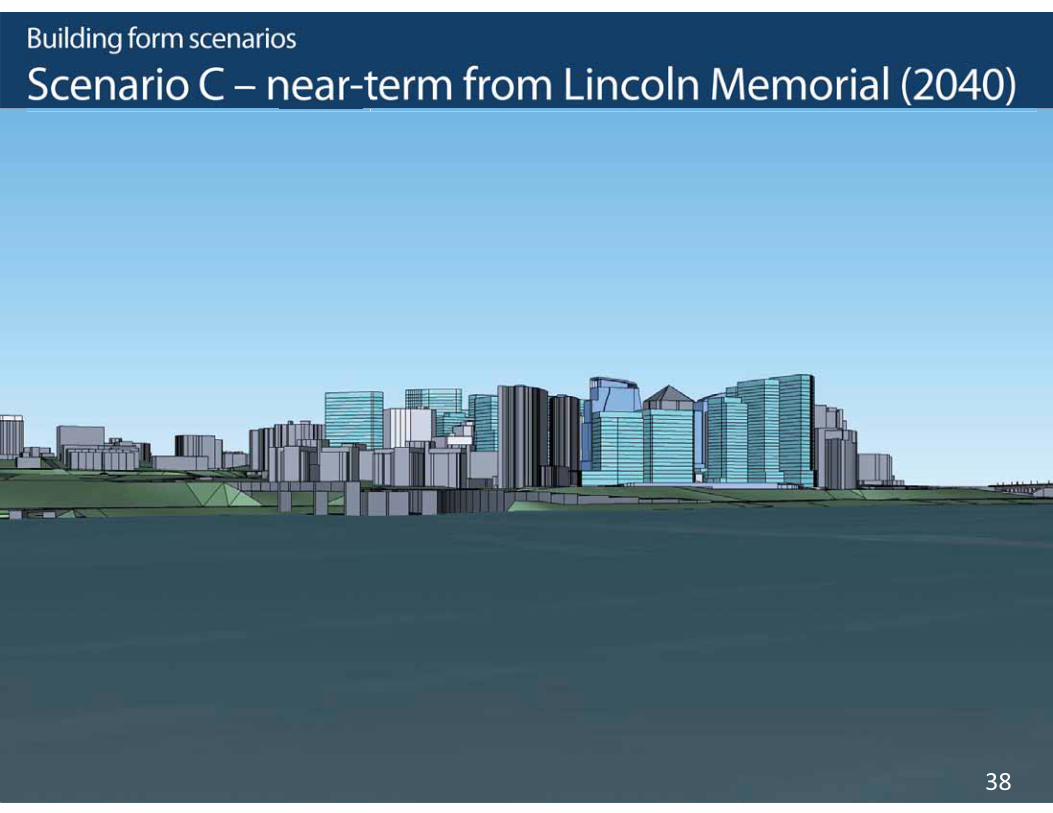
GOODY CLANCY WITHKITTELSON & ASSOCIATES | RHODESIDE & HARWELLFARR ASSOCIATES | W-ZHA 38

GOODY CLANCY WITHKITTELSON & ASSOCIATES | RHODESIDE & HARWELLFARR ASSOCIATES | W-ZHA 39
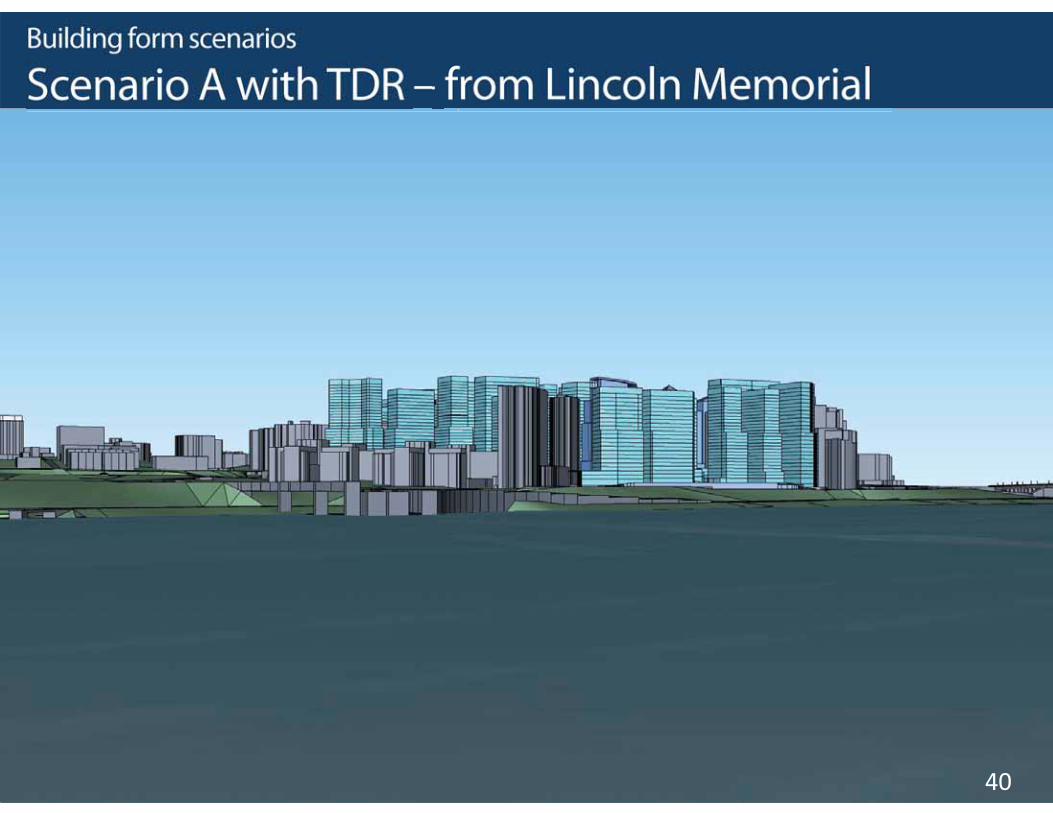
GOODY CLANCY WITHKITTELSON & ASSOCIATES | RHODESIDE & HARWELLFARR ASSOCIATES | W-ZHA 40
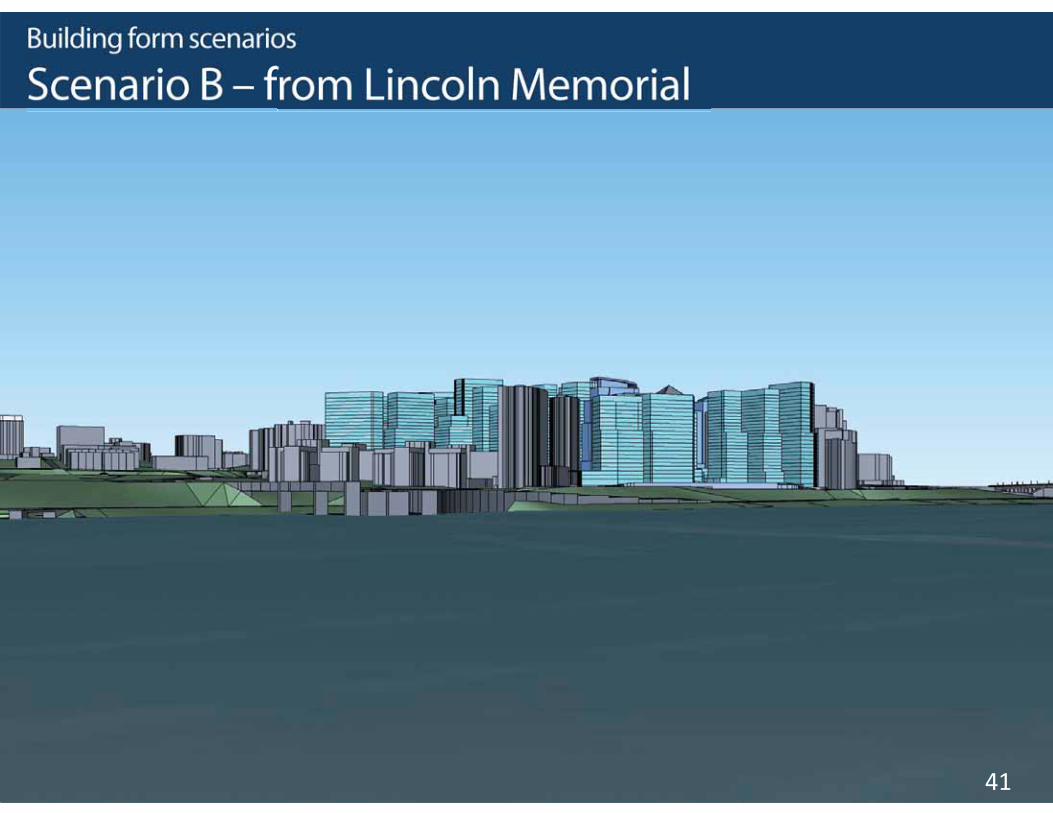
GOODY CLANCY WITHKITTELSON & ASSOCIATES | RHODESIDE & HARWELLFARR ASSOCIATES | W-ZHA 41

GOODY CLANCY WITHKITTELSON & ASSOCIATES | RHODESIDE & HARWELLFARR ASSOCIATES | W-ZHA 42

GOODY CLANCY WITHKITTELSON & ASSOCIATES | RHODESIDE & HARWELLFARR ASSOCIATES | W-ZHA 43
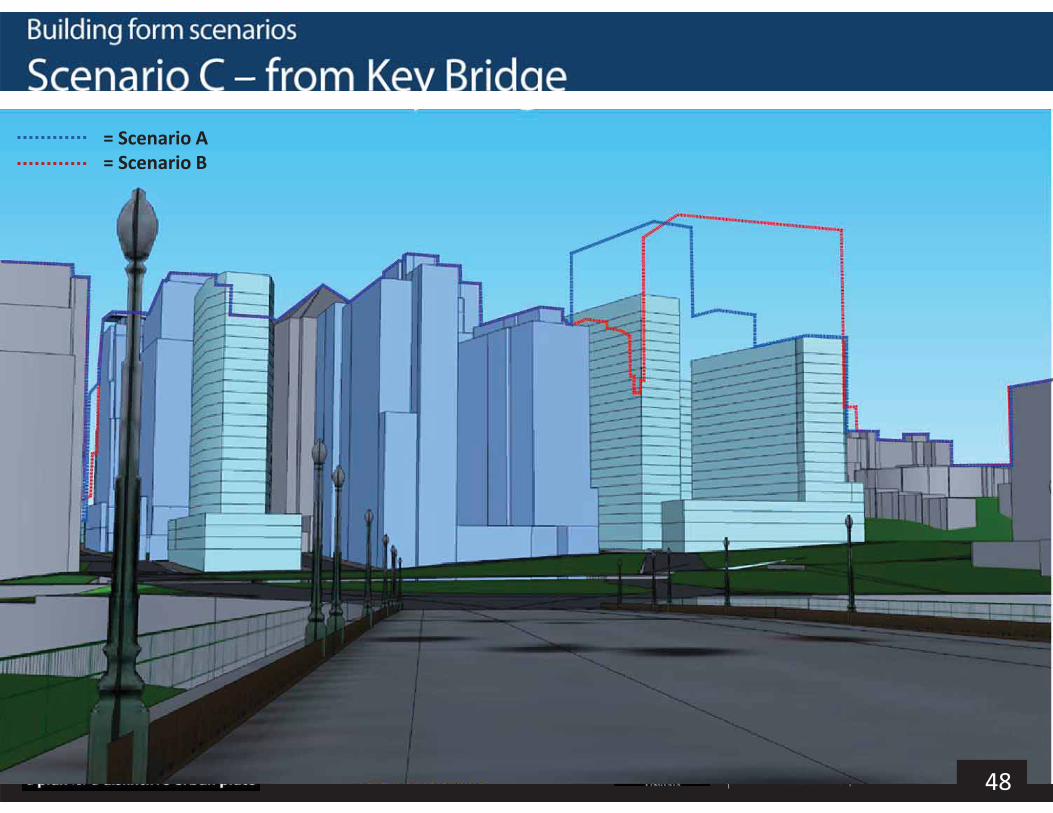
= Scenario A= Scenario B
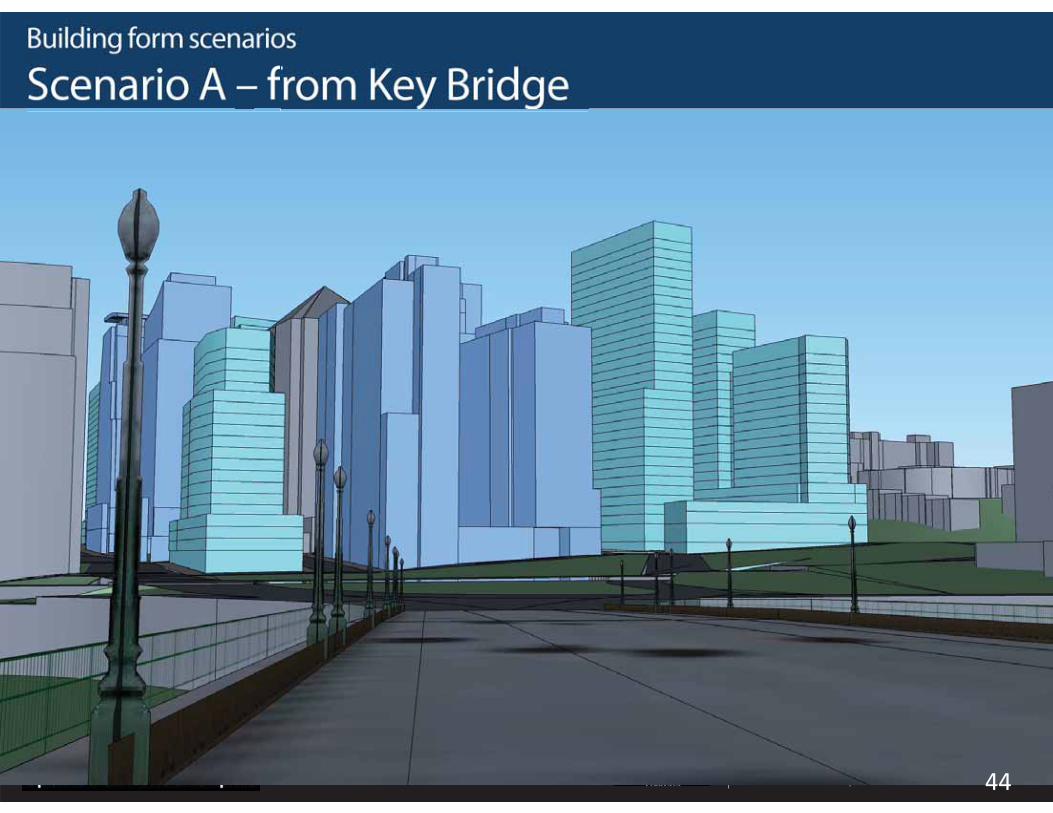
GOODY CLANCY WITHKITTELSON & ASSOCIATES | RHODESIDE & HARWELLFARR ASSOCIATES | W-ZHA 44

GOODY CLANCY WITHKITTELSON & ASSOCIATES | RHODESIDE & HARWELLFARR ASSOCIATES | W-ZHA 45
GOODY CLANCY WITHKITTELSON & ASSOCIATES | RHODESIDE & HARWELLFARR ASSOCIATES | W-ZHA 46

GOODY CLANCY WITHKITTELSON & ASSOCIATES | RHODESIDE & HARWELLFARR ASSOCIATES | W-ZHA 47
GOODY CLANCY WITHKITTELSON & ASSOCIATES | RHODESIDE & HARWELLFARR ASSOCIATES | W-ZHA 48
= Scenario A= Scenario B
GOODY CLANCY WITHKITTELSON & ASSOCIATES | RHODESIDE & HARWELLFARR ASSOCIATES | W-ZHA 49
GOODY CLANCY WITHKITTELSON & ASSOCIATES | RHODESIDE & HARWELLFARR ASSOCIATES | W-ZHA 50

GOODY CLANCY WITHKITTELSON & ASSOCIATES | RHODESIDE & HARWELLFARR ASSOCIATES | W-ZHA 51
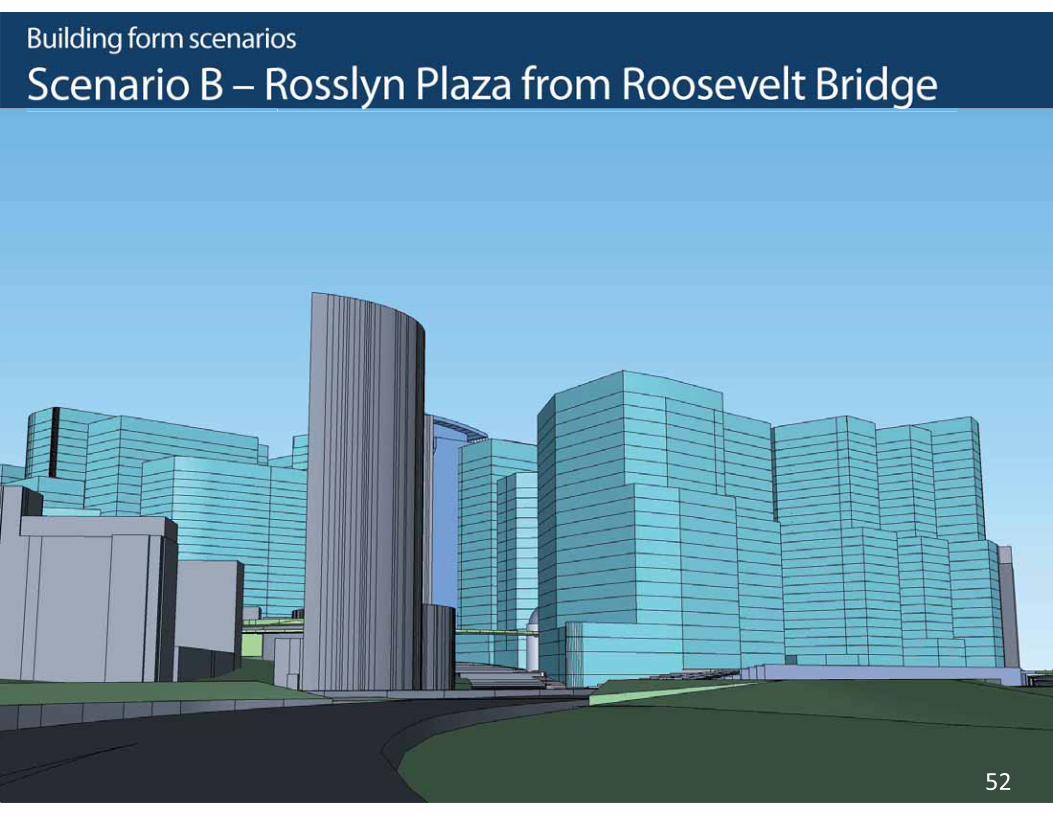
GOODY CLANCY WITHKITTELSON & ASSOCIATES | RHODESIDE & HARWELLFARR ASSOCIATES | W-ZHA 52
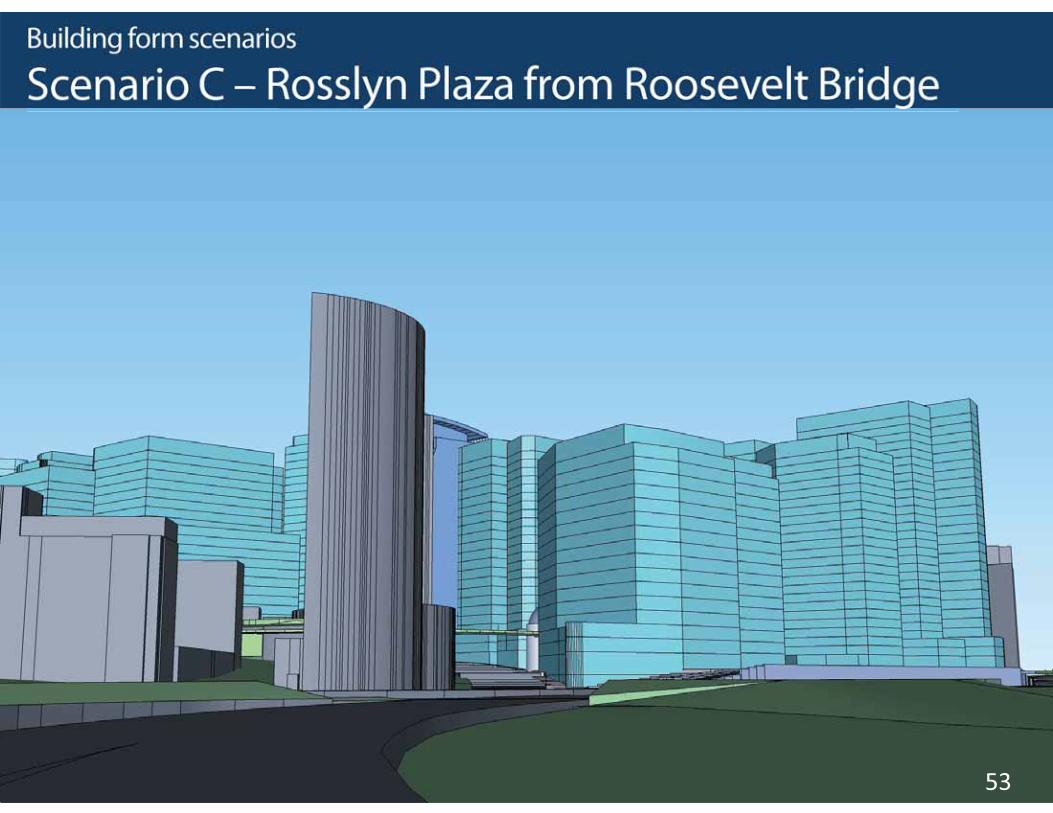
GOODY CLANCY WITHKITTELSON & ASSOCIATES | RHODESIDE & HARWELLFARR ASSOCIATES | W-ZHA 53
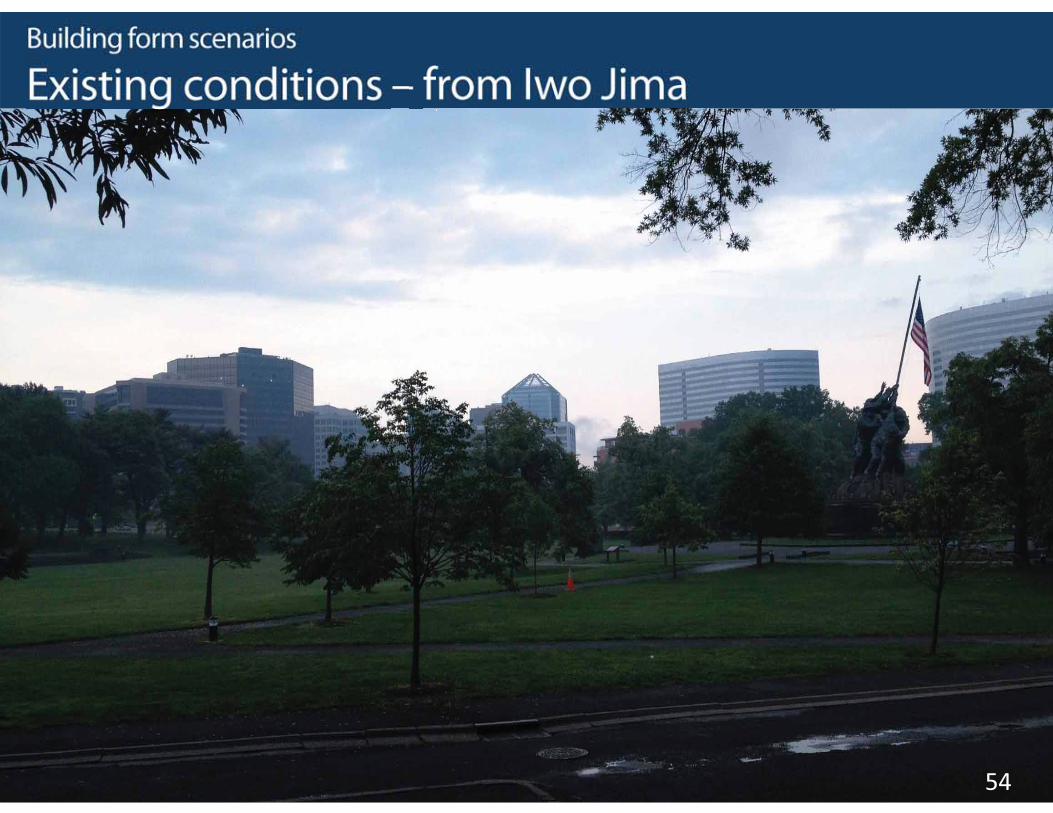
GOODY CLANCY WITHKITTELSON & ASSOCIATES | RHODESIDE & HARWELLFARR ASSOCIATES | W-ZHA 54

GOODY CLANCY WITHKITTELSON & ASSOCIATES | RHODESIDE & HARWELLFARR ASSOCIATES | W-ZHA 55

GOODY CLANCY WITHKITTELSON & ASSOCIATES | RHODESIDE & HARWELLFARR ASSOCIATES | W-ZHA 56
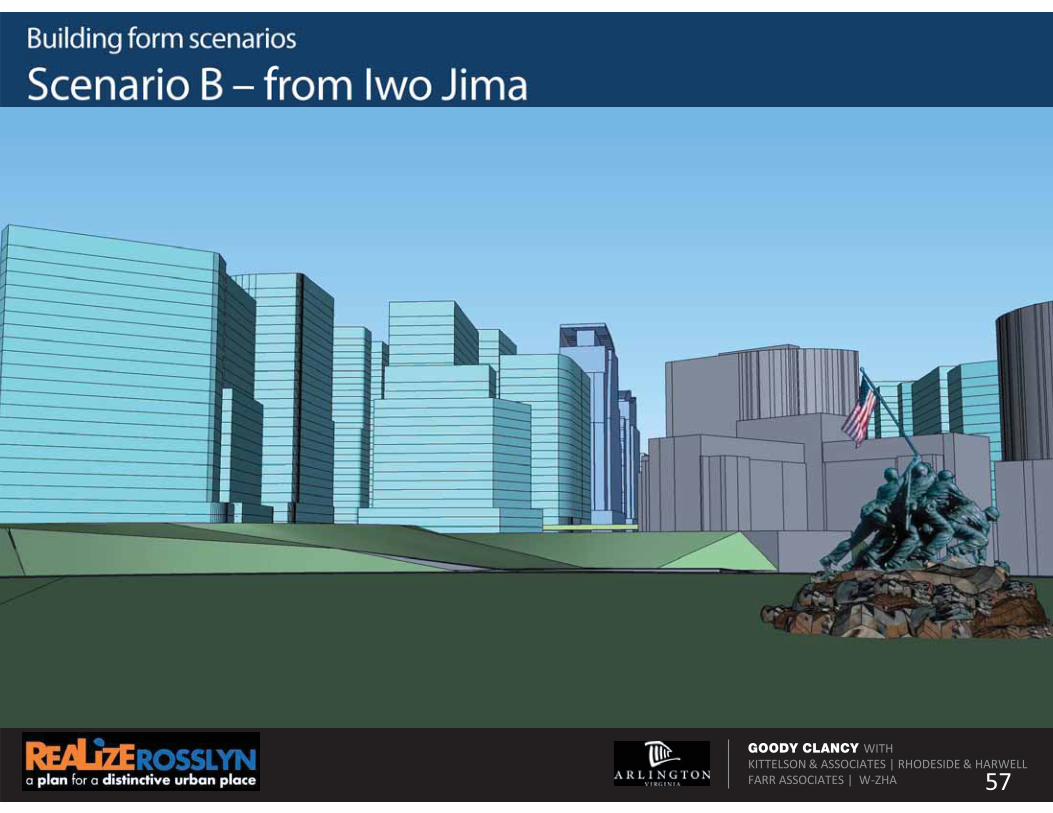
GOODY CLANCY WITHKITTELSON & ASSOCIATES | RHODESIDE & HARWELLFARR ASSOCIATES | W-ZHA 57

GOODY CLANCY WITHKITTELSON & ASSOCIATES | RHODESIDE & HARWELLFARR ASSOCIATES | W-ZHA 58
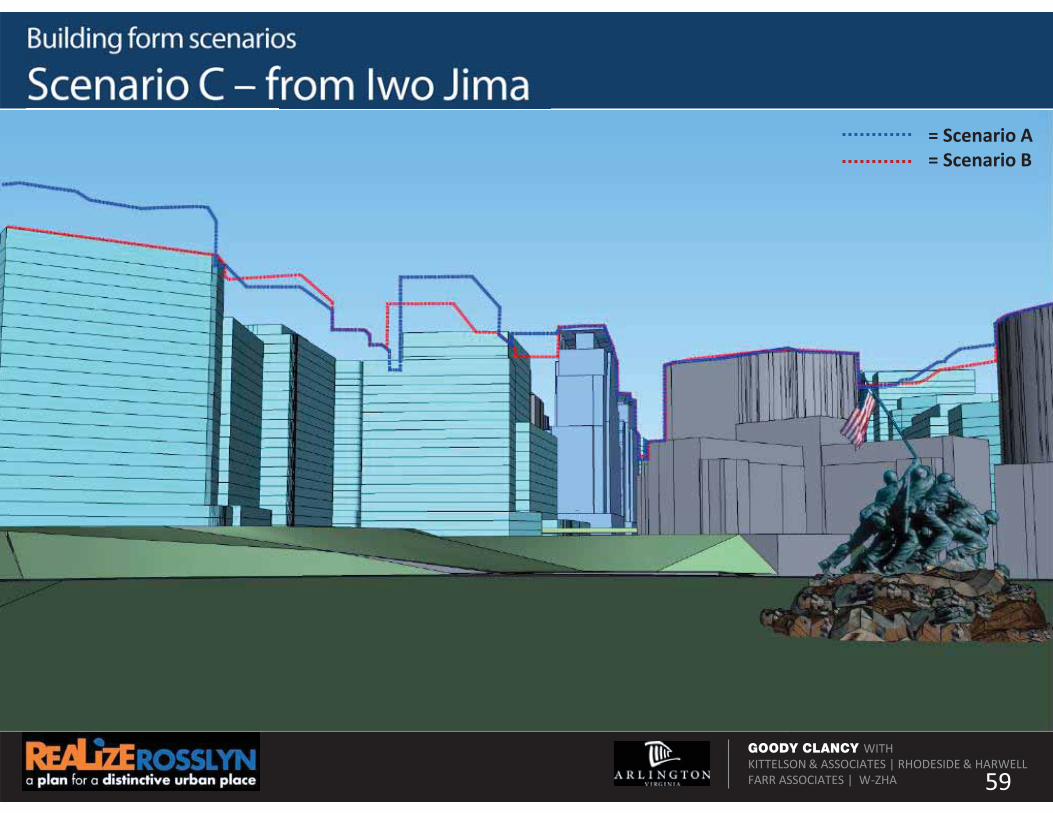
GOODY CLANCY WITHKITTELSON & ASSOCIATES | RHODESIDE & HARWELLFARR ASSOCIATES | W-ZHA 59
= Scenario A= Scenario B
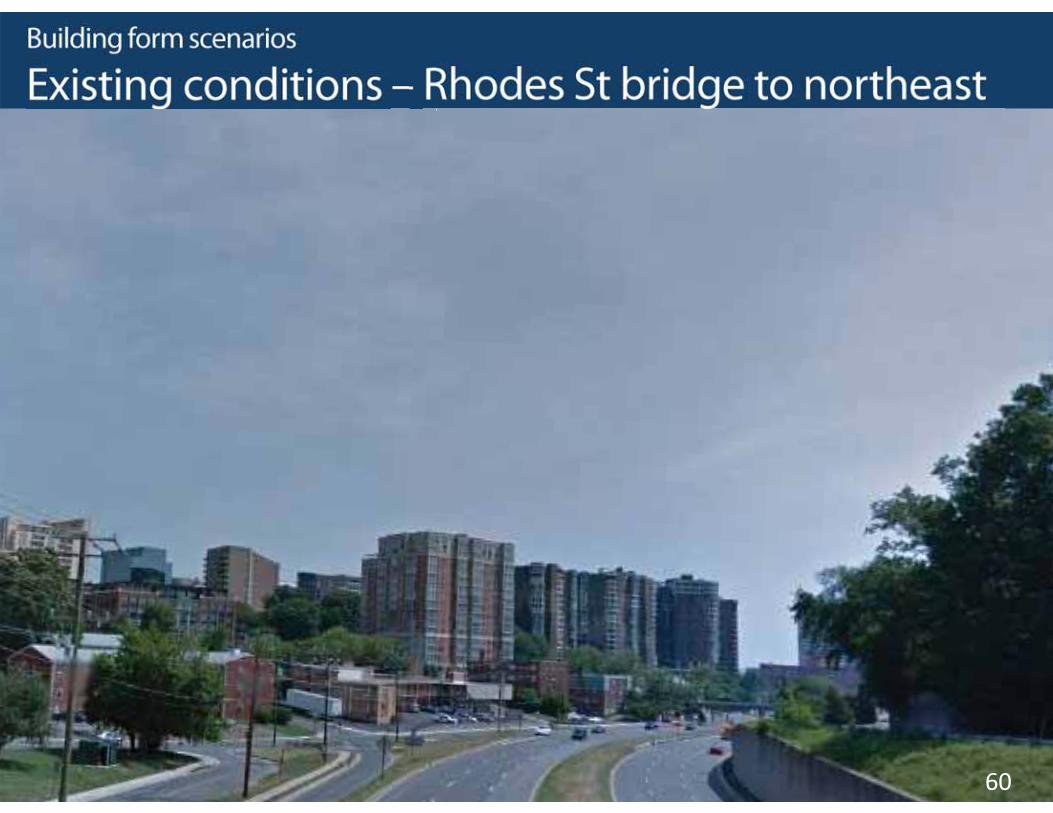
GOODY CLANCY WITHKITTELSON & ASSOCIATES | RHODESIDE & HARWELLFARR ASSOCIATES | W-ZHA 60

GOODY CLANCY WITHKITTELSON & ASSOCIATES | RHODESIDE & HARWELLFARR ASSOCIATES | W-ZHA 61

GOODY CLANCY WITHKITTELSON & ASSOCIATES | RHODESIDE & HARWELLFARR ASSOCIATES | W-ZHA 62

GOODY CLANCY WITHKITTELSON & ASSOCIATES | RHODESIDE & HARWELLFARR ASSOCIATES | W-ZHA 63
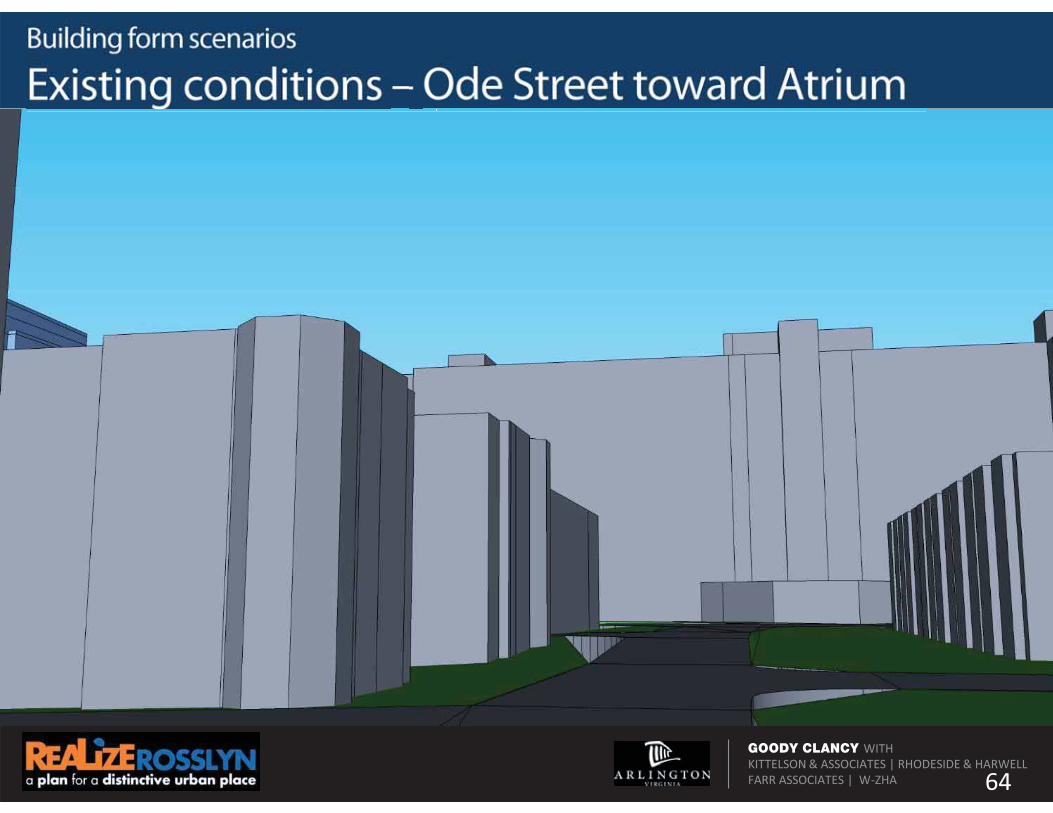
GOODY CLANCY WITHKITTELSON & ASSOCIATES | RHODESIDE & HARWELLFARR ASSOCIATES | W-ZHA 64
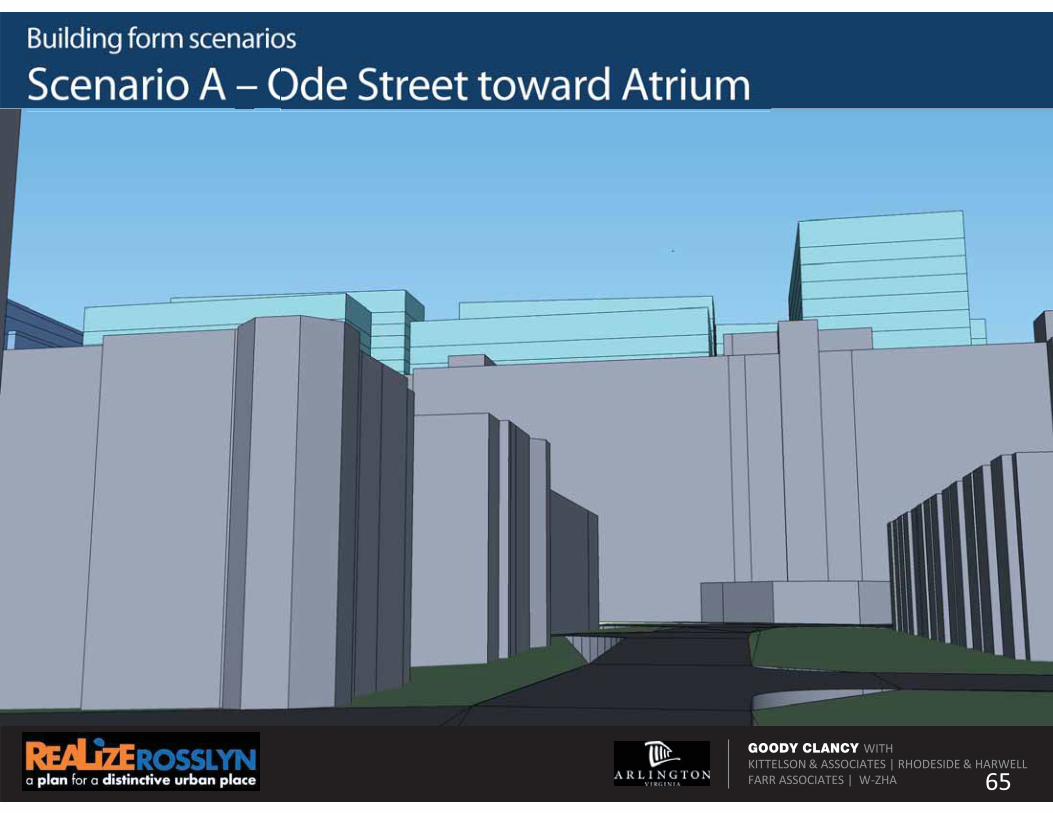
GOODY CLANCY WITHKITTELSON & ASSOCIATES | RHODESIDE & HARWELLFARR ASSOCIATES | W-ZHA 65
GOODY CLANCY WITHKITTELSON & ASSOCIATES | RHODESIDE & HARWELLFARR ASSOCIATES | W-ZHA 66
GOODY CLANCY WITHKITTELSON & ASSOCIATES | RHODESIDE & HARWELLFARR ASSOCIATES | W-ZHA 67
GOODY CLANCY WITHKITTELSON & ASSOCIATES | RHODESIDE & HARWELLFARR ASSOCIATES | W-ZHA 68
= Scenario A= Scenario B

GOODY CLANCY WITHKITTELSON & ASSOCIATES | RHODESIDE & HARWELLFARR ASSOCIATES | W-ZHA 69

GOODY CLANCY WITHKITTELSON & ASSOCIATES | RHODESIDE & HARWELLFARR ASSOCIATES | W-ZHA 70
GOODY CLANCY WITHKITTELSON & ASSOCIATES | RHODESIDE & HARWELLFARR ASSOCIATES | W-ZHA 71

GOODY CLANCY WITHKITTELSON & ASSOCIATES | RHODESIDE & HARWELLFARR ASSOCIATES | W-ZHA 72
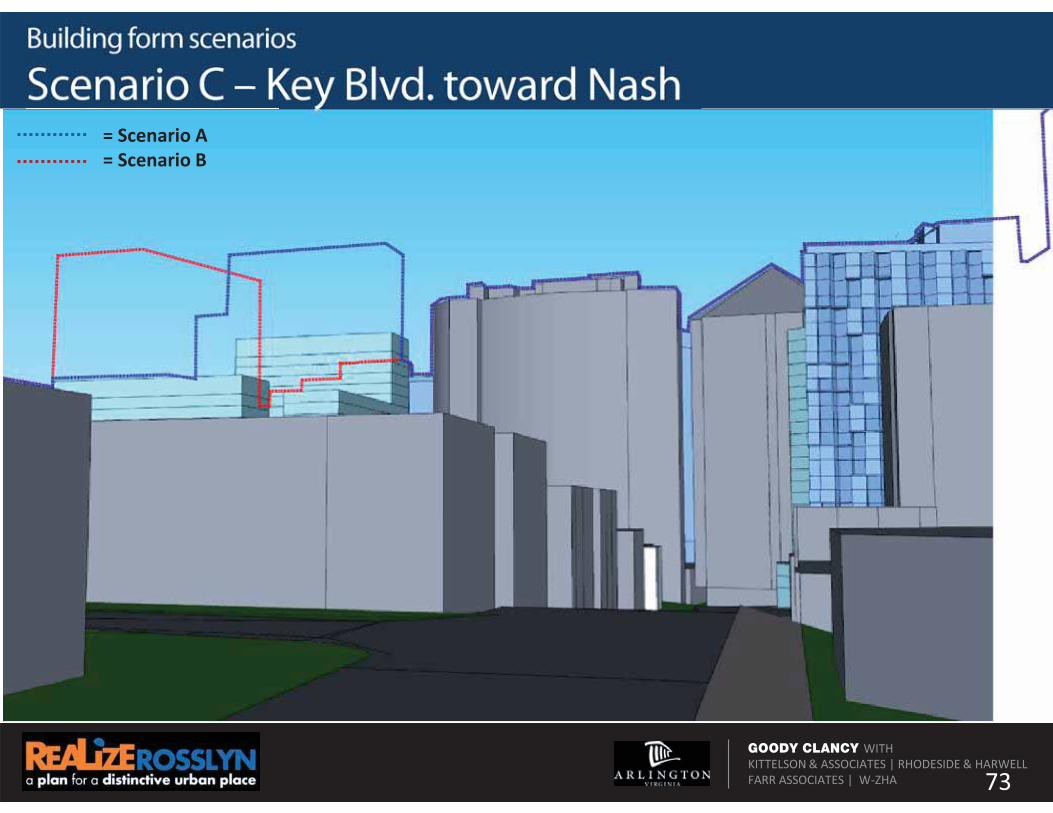
GOODY CLANCY WITHKITTELSON & ASSOCIATES | RHODESIDE & HARWELLFARR ASSOCIATES | W-ZHA 73
= Scenario A= Scenario B
GOODY CLANCY WITHKITTELSON & ASSOCIATES | RHODESIDE & HARWELLFARR ASSOCIATES | W-ZHA 74
GOODY CLANCY WITHKITTELSON & ASSOCIATES | RHODESIDE & HARWELLFARR ASSOCIATES | W-ZHA 75

GOODY CLANCY WITHKITTELSON & ASSOCIATES | RHODESIDE & HARWELLFARR ASSOCIATES | W-ZHA 76
GOODY CLANCY WITHKITTELSON & ASSOCIATES | RHODESIDE & HARWELLFARR ASSOCIATES | W-ZHA 77

GOODY CLANCY WITHKITTELSON & ASSOCIATES | RHODESIDE & HARWELLFARR ASSOCIATES | W-ZHA 78

GOODY CLANCY WITHKITTELSON & ASSOCIATES | RHODESIDE & HARWELLFARR ASSOCIATES | W-ZHA 79

GOODY CLANCY WITHKITTELSON & ASSOCIATES | RHODESIDE & HARWELLFARR ASSOCIATES | W-ZHA 80

GOODY CLANCY WITHKITTELSON & ASSOCIATES | RHODESIDE & HARWELLFARR ASSOCIATES | W-ZHA 81
= Scenario A= Scenario B

GOODY CLANCY WITHKITTELSON & ASSOCIATES | RHODESIDE & HARWELLFARR ASSOCIATES | W-ZHA 82

GOODY CLANCY WITHKITTELSON & ASSOCIATES | RHODESIDE & HARWELLFARR ASSOCIATES | W-ZHA 83
GOODY CLANCY WITHKITTELSON & ASSOCIATES | RHODESIDE & HARWELLFARR ASSOCIATES | W-ZHA 84
GOODY CLANCY WITHKITTELSON & ASSOCIATES | RHODESIDE & HARWELLFARR ASSOCIATES | W-ZHA 85
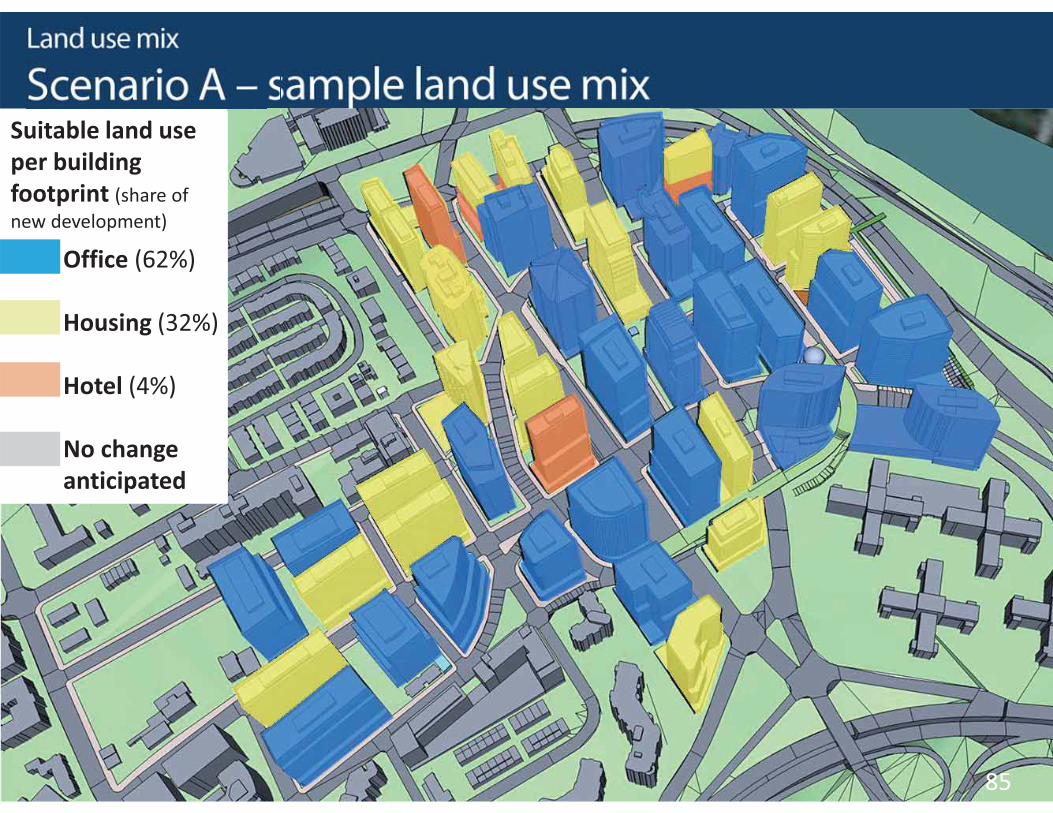
Suitable land use per building footprint (share of new development)
Office (62%)
Housing (32%)
Hotel (4%)
No change anticipated

GOODY CLANCY WITHKITTELSON & ASSOCIATES | RHODESIDE & HARWELLFARR ASSOCIATES | W-ZHA 86
Average FAR 9.5
Office (64%)
Housing (32%)
Hotel (4%)
No change anticipated
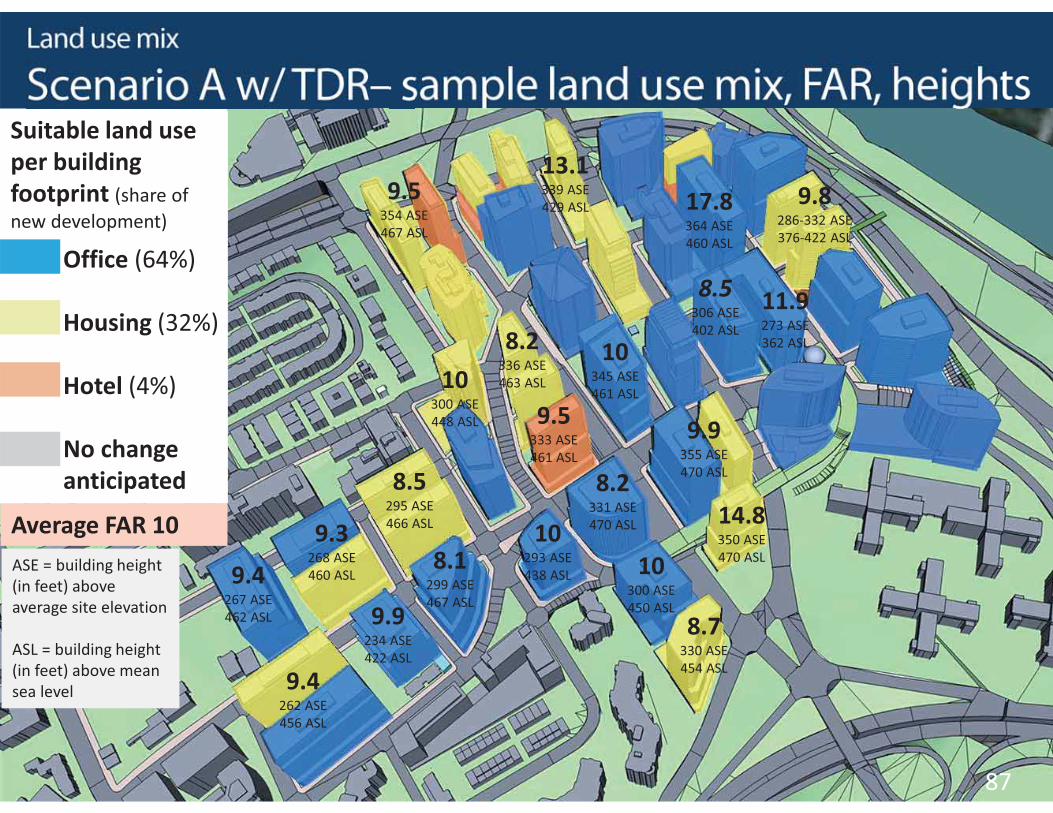
Suitable land use per building footprint (share of new development)
10229 ASE 319 ASL
10207 ASE 326 ASL
8.7330 ASE 454 ASL
10300 ASE 450 ASL
8.5306 ASE 402 ASL
10345 ASE461 ASL
9.9355 ASE470 ASL
8.2336 ASE 463 ASL
9.5333 ASE 461 ASL
10195 ASE 291 ASL
9.7221 ASE 310 ASL
10293 ASE 438 ASL
8.1299 ASE 467 ASL
9.9234 ASE 422 ASL
9.4262 ASE 456 ASL
8.5295 ASE 466 ASL9.3
268 ASE 460 ASL9.4
267 ASE 462 ASL
10300 ASE 448 ASL
9.5354 ASE 467 ASL
8.2331 ASE 470 ASL
9.8286-332 ASE 376-422 ASL
ASE = building height (in feet) above average site elevation
ASL = building height (in feet) above mean sea level
GOODY CLANCY WITHKITTELSON & ASSOCIATES | RHODESIDE & HARWELLFARR ASSOCIATES | W-ZHA 87
Average FAR 10
Office (64%)
Housing (32%)
Hotel (4%)
No change anticipated
Suitable land use per building footprint (share of new development)
ASE = building height (in feet) above average site elevation
ASL = building height (in feet) above mean sea level
13.1339 ASE 429 ASL
14.8350 ASE 470 ASL
8.7330 ASE 454 ASL
10300 ASE 450 ASL
8.5306 ASE 402 ASL
10345 ASE461 ASL
9.9355 ASE470 ASL
8.2336 ASE 463 ASL
9.5333 ASE 461 ASL
17.8364 ASE 460 ASL
11.9273 ASE 362 ASL
10293 ASE 438 ASL
8.1299 ASE 467 ASL
9.9234 ASE 422 ASL
9.4262 ASE 456 ASL
8.5295 ASE 466 ASL9.3
268 ASE 460 ASL9.4
267 ASE 462 ASL
10300 ASE 448 ASL
9.5354 ASE 467 ASL
8.2331 ASE 470 ASL
9.8286-332 ASE 376-422 ASL
GOODY CLANCY WITHKITTELSON & ASSOCIATES | RHODESIDE & HARWELLFARR ASSOCIATES | W-ZHA 88
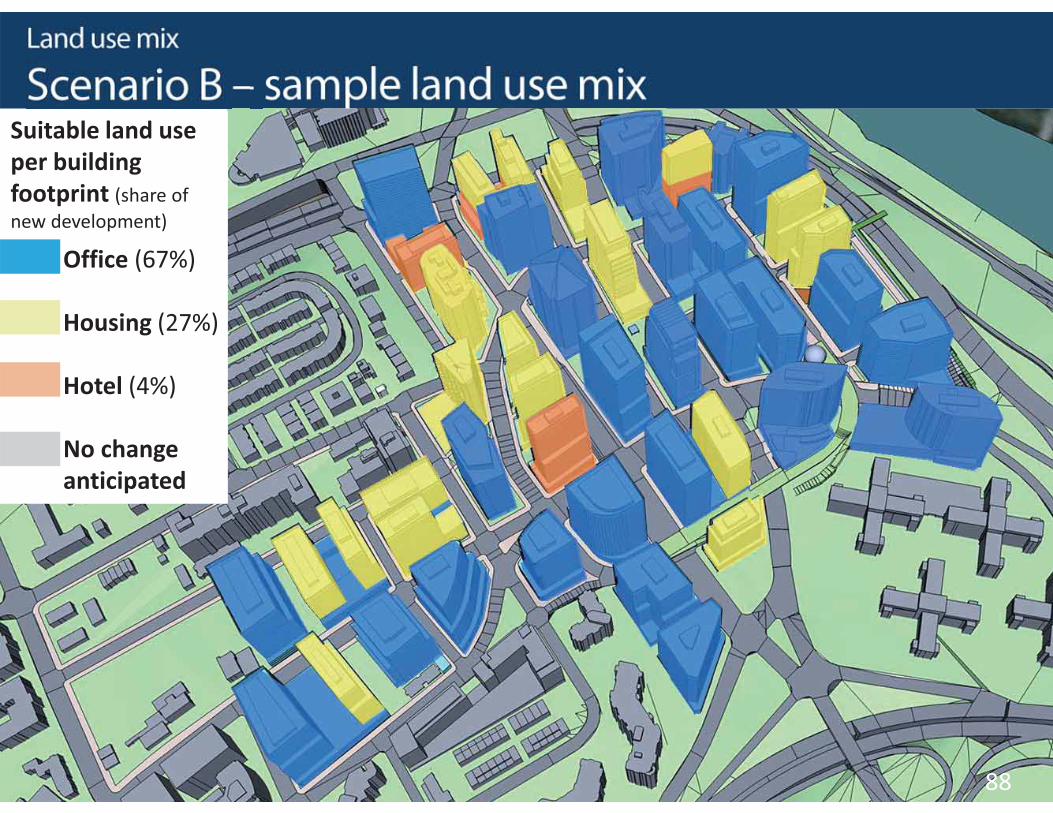
Office (67%)
Housing (27%)
Hotel (4%)
No change anticipated
Suitable land use per building footprint (share of new development)
GOODY CLANCY WITHKITTELSON & ASSOCIATES | RHODESIDE & HARWELLFARR ASSOCIATES | W-ZHA 89
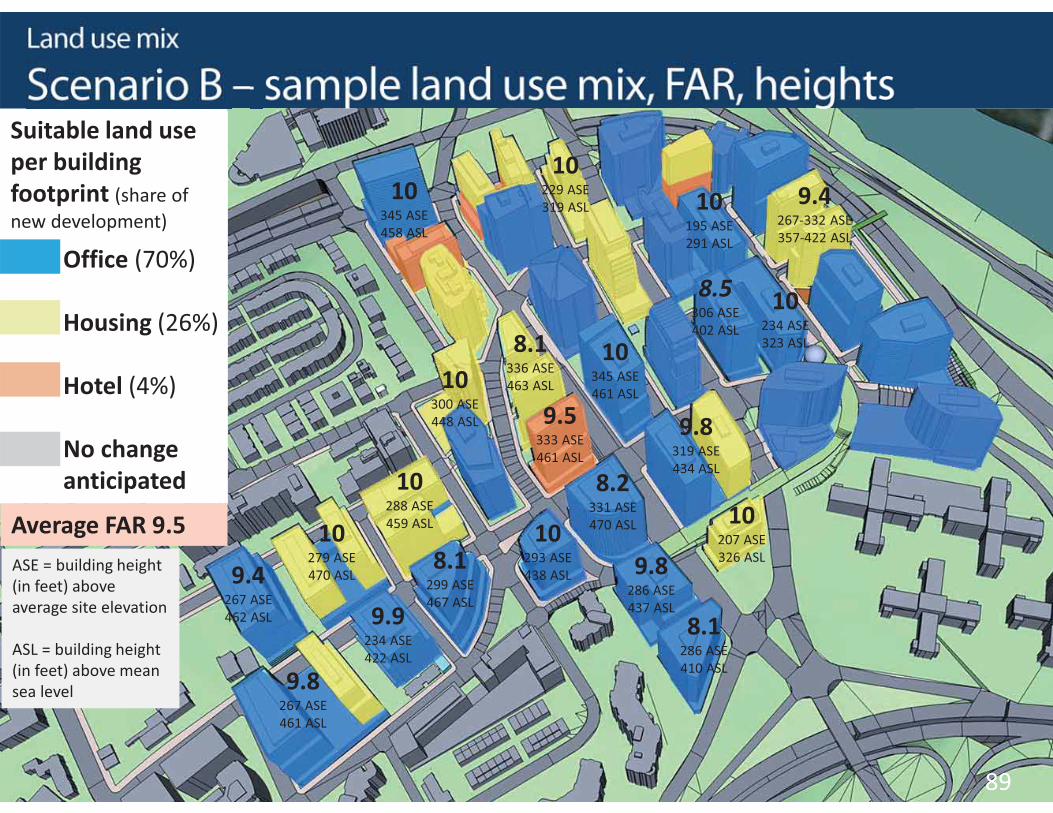
Average FAR 9.5
Office (70%)
Housing (26%)
Hotel (4%)
No change anticipated
Suitable land use per building footprint (share of new development)
10229 ASE 319 ASL
10207 ASE 326 ASL
8.1286 ASE 410 ASL
9.8286 ASE 437 ASL
8.5306 ASE 402 ASL
10345 ASE 461 ASL
9.8319 ASE 434 ASL
8.1336 ASE 463 ASL
9.5333 ASE 461 ASL
10195 ASE291 ASL
10234 ASE 323 ASL
10293 ASE 438 ASL
8.1299 ASE 467 ASL
9.9234 ASE 422 ASL
9.8267 ASE 461 ASL
10288 ASE 459 ASL10
279 ASE 470 ASL9.4
267 ASE 462 ASL
10300 ASE448 ASL
10345 ASE 458 ASL
8.2331 ASE 470 ASL
9.4267-332 ASE 357-422 ASL
ASE = building height (in feet) above average site elevation
ASL = building height (in feet) above mean sea level

GOODY CLANCY WITHKITTELSON & ASSOCIATES | RHODESIDE & HARWELLFARR ASSOCIATES | W-ZHA 90
Office (63%)
Housing (31%)
Hotel (4%)
No change anticipated
Suitable land use per building footprint (share of new development)
GOODY CLANCY WITHKITTELSON & ASSOCIATES | RHODESIDE & HARWELLFARR ASSOCIATES | W-ZHA 91
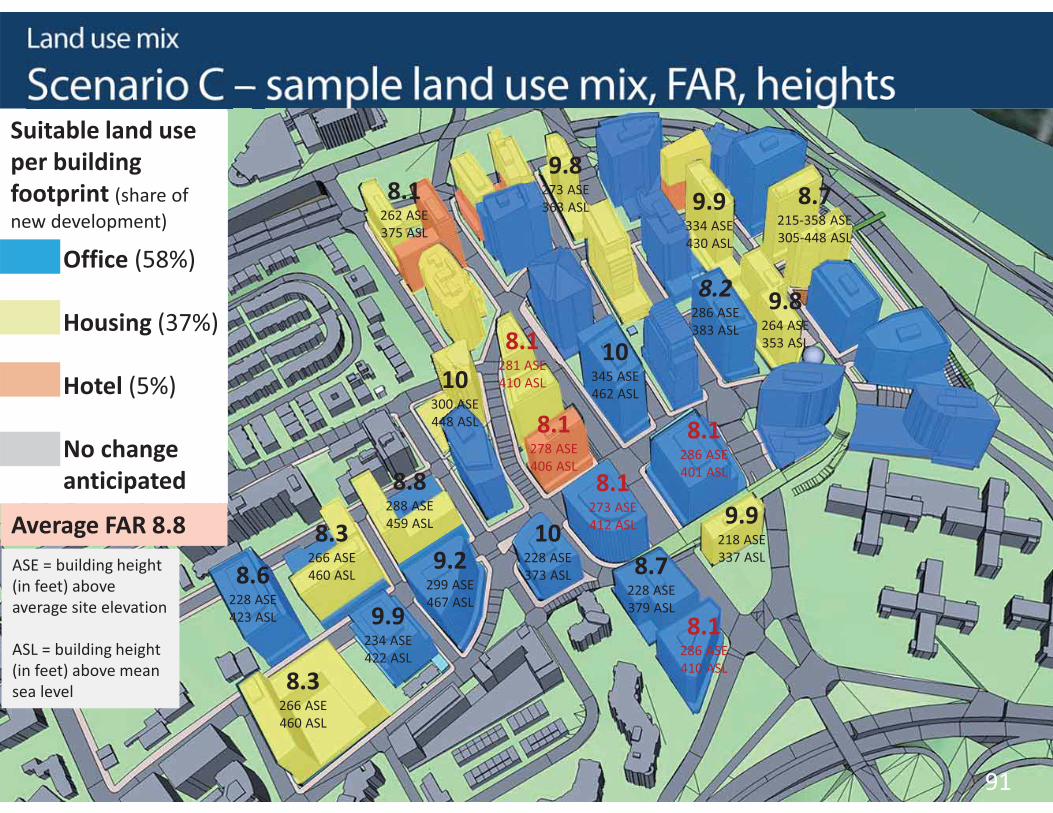
Average FAR 8.8
Office (58%)
Housing (37%)
Hotel (5%)
No change anticipated
Suitable land use per building footprint (share of new development)
9.8273 ASE 363 ASL
9.9218 ASE 337 ASL
8.1286 ASE 410 ASL
8.7228 ASE 379 ASL
8.2286 ASE 383 ASL
10345 ASE462 ASL
8.1286 ASE 401 ASL
8.1281 ASE 410 ASL
8.1278 ASE 406 ASL
9.9334 ASE 430 ASL
9.8264 ASE353 ASL
10228 ASE373 ASL
9.2299 ASE 467 ASL
9.9234 ASE 422 ASL
8.3266 ASE 460 ASL
8.8288 ASE 459 ASL8.3
266 ASE 460 ASL8.6
228 ASE 423 ASL
10300 ASE 448 ASL
8.1262 ASE 375 ASL
8.1273 ASE 412 ASL
8.7215-358 ASE 305-448 ASL
ASE = building height (in feet) above average site elevation
ASL = building height (in feet) above mean sea level
GOODY CLANCY WITHKITTELSON & ASSOCIATES | RHODESIDE & HARWELLFARR ASSOCIATES | W-ZHA
300
221
266
195
299
297
215
292
234
331
330
352
306
299
300
345
218
286
385
355
331282
388
300
292262
215
300
300
216
297
297
207
264
333
335
295
268268
274
285247
354
251
266
211
300
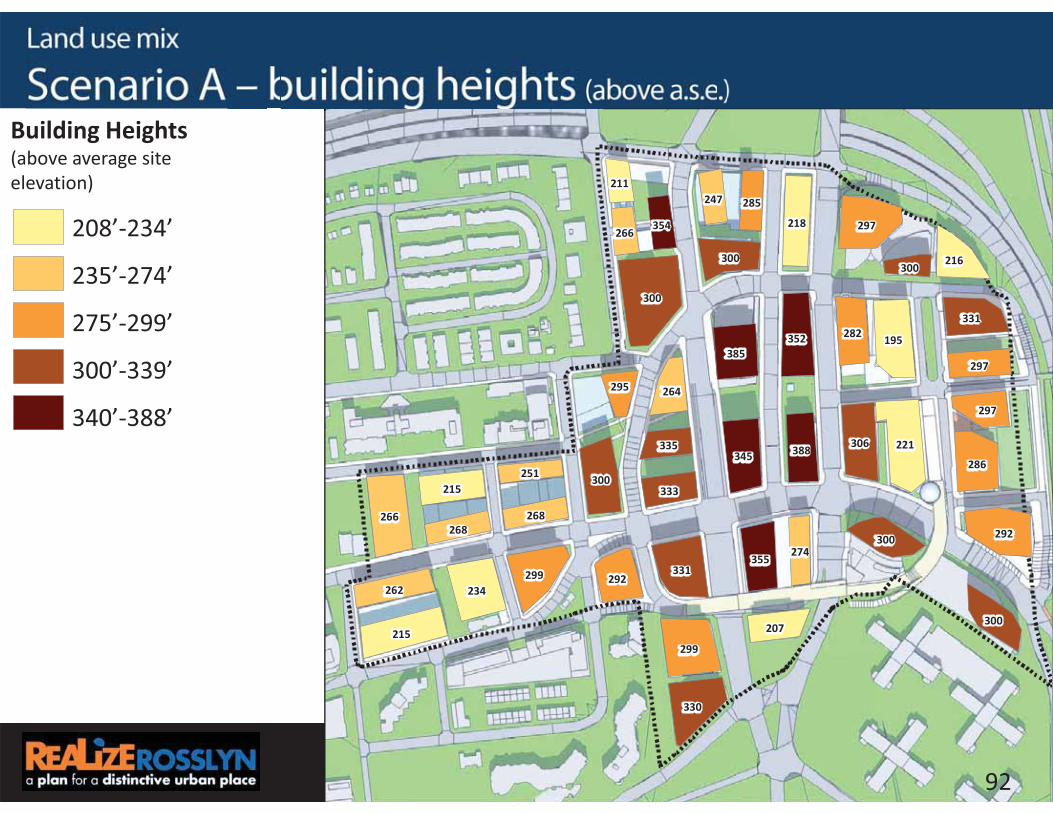
92
Building Heights(above average site elevation)
208’-234’
235’-274’
275’-299’
300’-339’
340’-388’

GOODY CLANCY WITHKITTELSON & ASSOCIATES | RHODESIDE & HARWELLFARR ASSOCIATES | W-ZHA
398
310
461
291
450
357
409
382
422
470
454
434
402
467
447
461
307
376
470
469
421360
470
405
437456
406
376
376
270
387
387
326
392
461
463
438
459459
388
385348
466
422
379
324
360
93
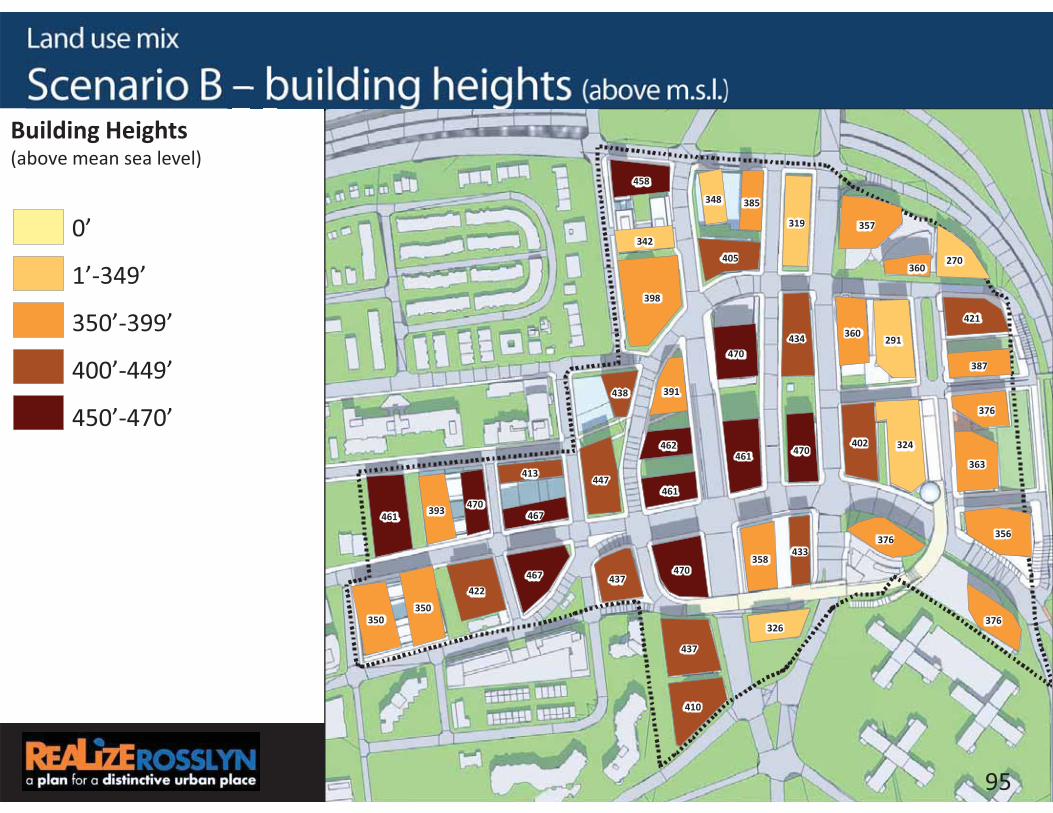
Building Heights(above mean sea level)
0’
1’-349’
350’-399’
400’-449’
450’-470’
GOODY CLANCY WITHKITTELSON & ASSOCIATES | RHODESIDE & HARWELLFARR ASSOCIATES | W-ZHA
300
234
266
195
286
297
266
234
331
267
286
352
267
306
299
300
345
229
273
385
244
331282
388
300
202
292
345
300
300
216
297
286
207
264
333279
285
335
229
247
295
300
286
319
242
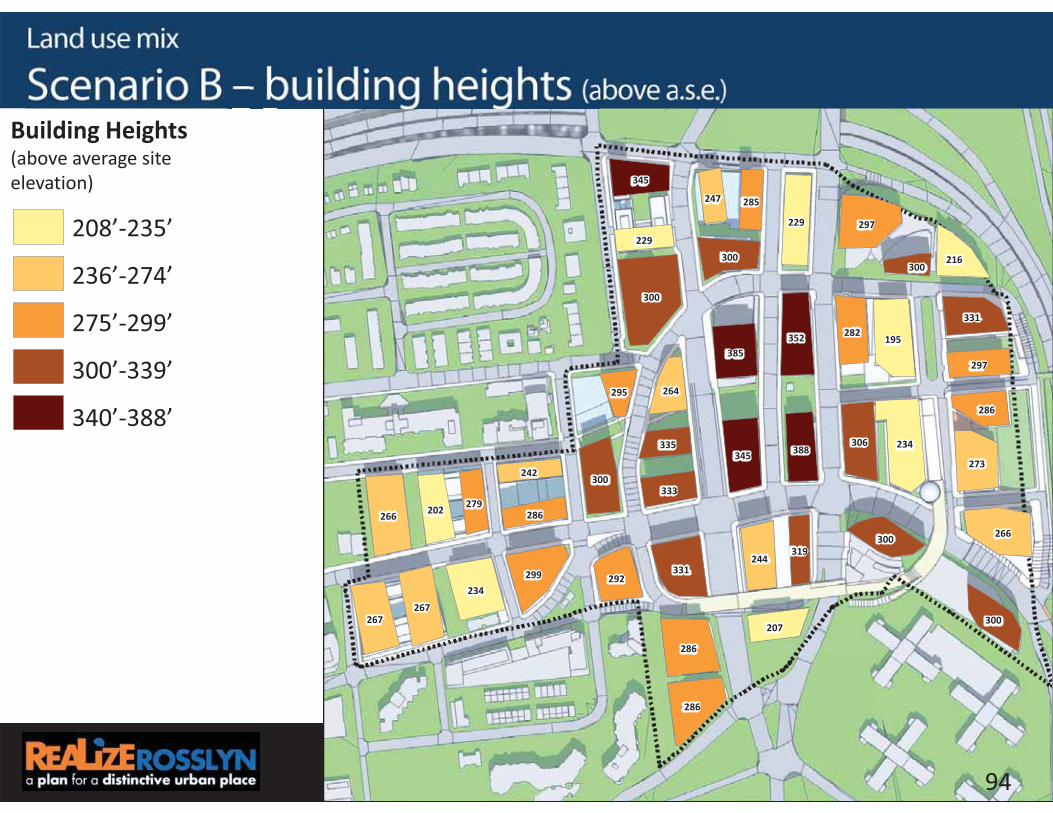
94
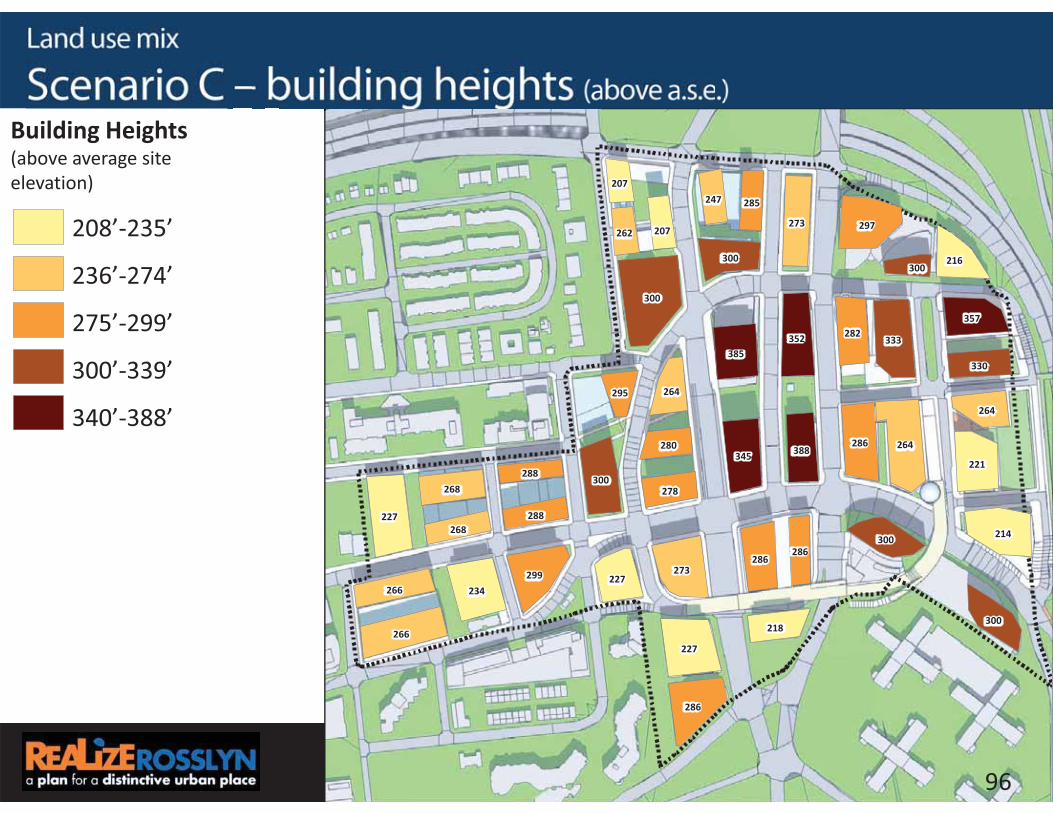
Building Heights(above average site elevation)
208’-235’
236’-274’
275’-299’
300’-339’
340’-388’
GOODY CLANCY WITHKITTELSON & ASSOCIATES | RHODESIDE & HARWELLFARR ASSOCIATES | W-ZHA
398
324
461
291
437
357
356
422
470
350
410
434
350
402
467
447
461
319
363
470
358
421360
470
405
393
437
458
376
376
270
387
376
326
391
461470
385
462
342
348
438
360
467
433
413
95
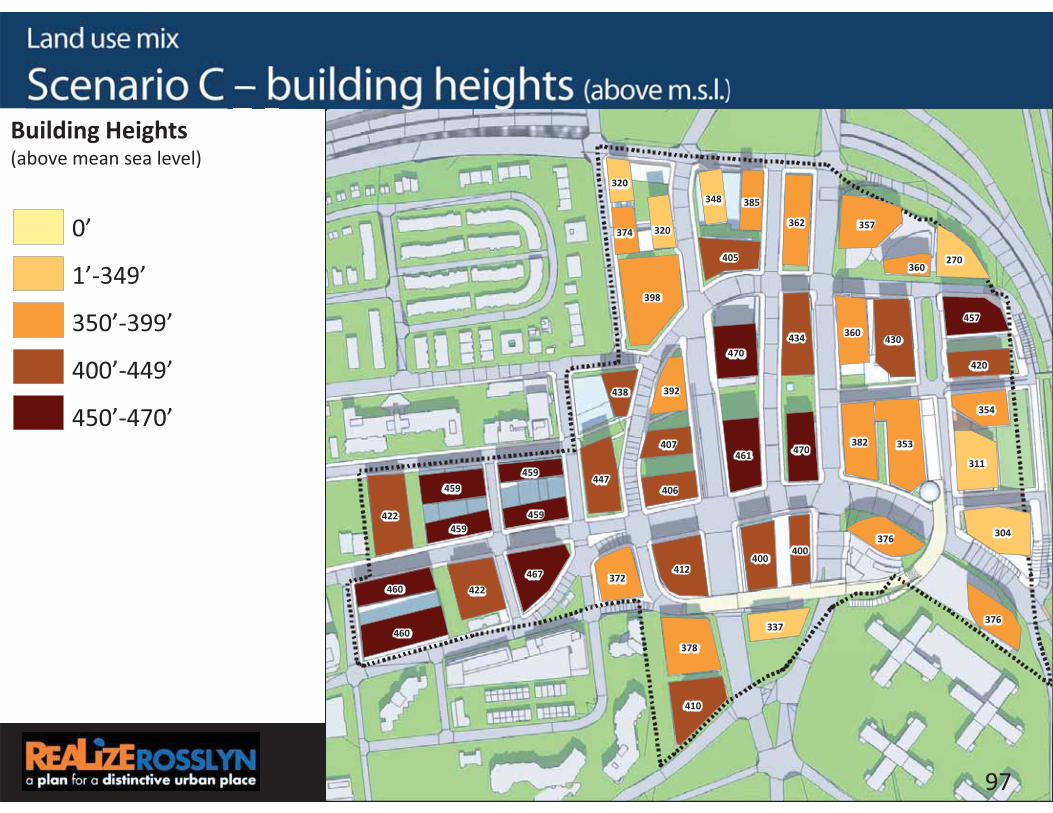
Building Heights(above mean sea level)
0’
1’-349’
350’-399’
400’-449’
450’-470’
GOODY CLANCY WITHKITTELSON & ASSOCIATES | RHODESIDE & HARWELLFARR ASSOCIATES | W-ZHA
300
264
227
333
227
297
266
214
234
273
286
352
286
299
300
345
273
221
385
286
357282
388
300
227266
268
300
300
216
330
264
218
264
278
285
280
247
207262
295
207
300
268288
286
288
96
Building Heights(above average site elevation)
208’-235’
236’-274’
275’-299’
300’-339’
340’-388’
GOODY CLANCY WITHKITTELSON & ASSOCIATES | RHODESIDE & HARWELLFARR ASSOCIATES | W-ZHA
398
353
422
430
378
357
460
304
422
412
410
434
382
467
447
461
362
311
470
400
457360
470
405
372460
459
376
376
270
420
354
337
392
406
385
407
348
320374
438
320
360
459459
400
459
97
Building Heights(above mean sea level)
0’
1’-349’
350’-399’
400’-449’
450’-470’
GOODY CLANCY WITHKITTELSON & ASSOCIATES | RHODESIDE & HARWELLFARR ASSOCIATES | W-ZHA 98
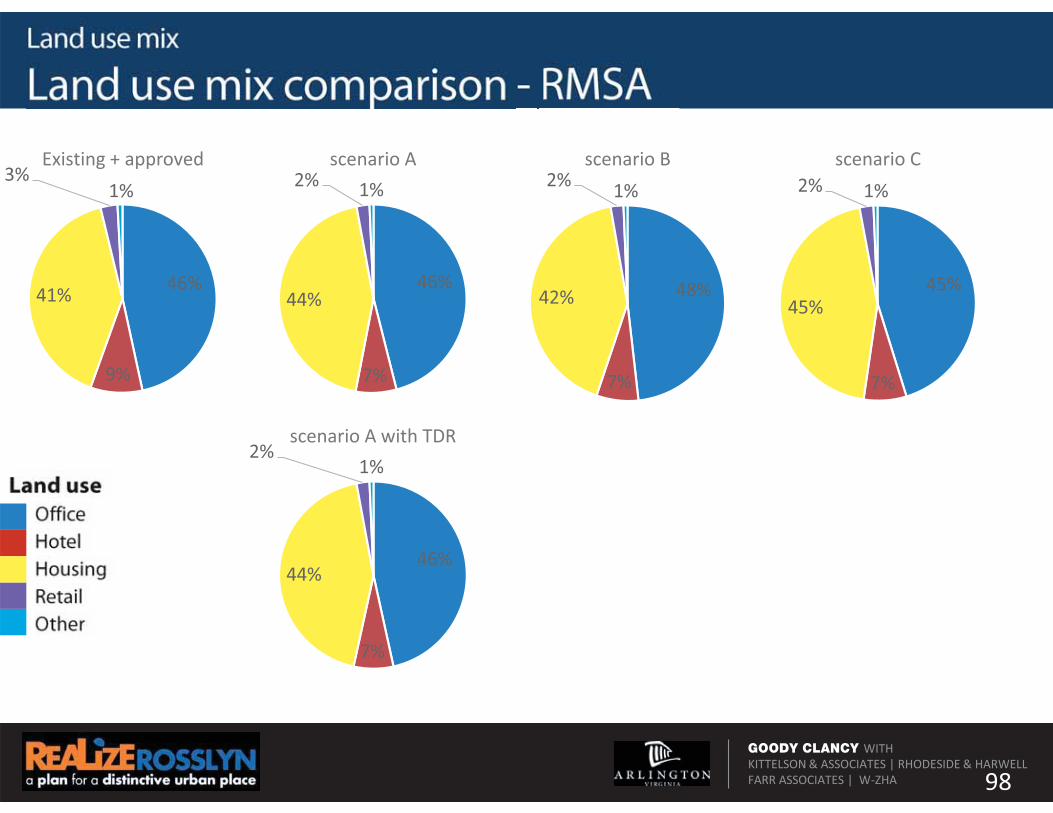
46%
9%
41%
3%1%
Existing + approved
46%
7%
44%
2% 1%scenario A
48%
7%
42%
2% 1%scenario B
45%
7%
45%
2% 1%scenario C
46%
7%
44%
2%1%
scenario A with TDR
GOODY CLANCY WITHKITTELSON & ASSOCIATES | RHODESIDE & HARWELLFARR ASSOCIATES | W-ZHA 99
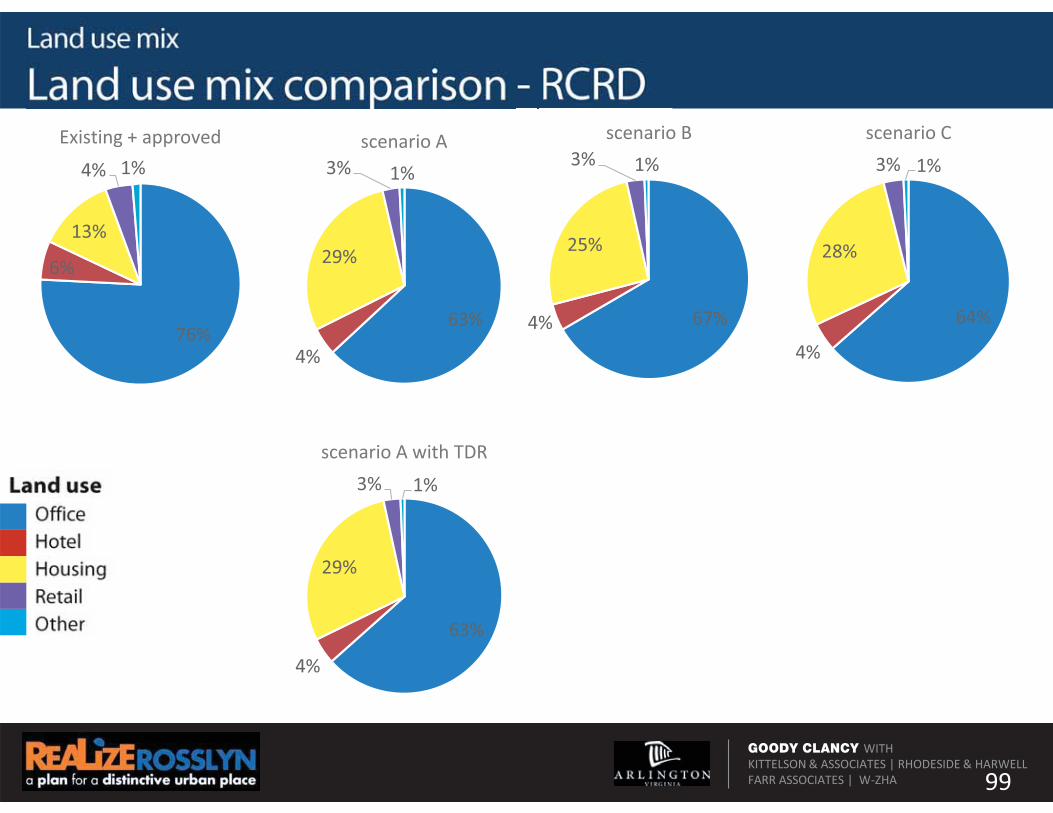
76%
6%
13%
4% 1%Existing + approved
63%
4%
29%
3% 1%scenario A
67%4%
25%
3% 1%scenario B
64%
4%
28%
3% 1%
scenario C
63%
4%
29%
3% 1%
scenario A with TDR

GOODY CLANCY WITHKITTELSON & ASSOCIATES | RHODESIDE & HARWELLFARR ASSOCIATES | W-ZHA 100
0
2,000,000
4,000,000
6,000,000
8,000,000
10,000,000
12,000,000
14,000,000
16,000,000
18,000,000
A A with TDR B C

GOODY CLANCY WITHKITTELSON & ASSOCIATES | RHODESIDE & HARWELLFARR ASSOCIATES | W-ZHA 101

GOODY CLANCY WITHKITTELSON & ASSOCIATES | RHODESIDE & HARWELLFARR ASSOCIATES | W-ZHA 102
GOODY CLANCY WITHKITTELSON & ASSOCIATES | RHODESIDE & HARWELLFARR ASSOCIATES | W-ZHA
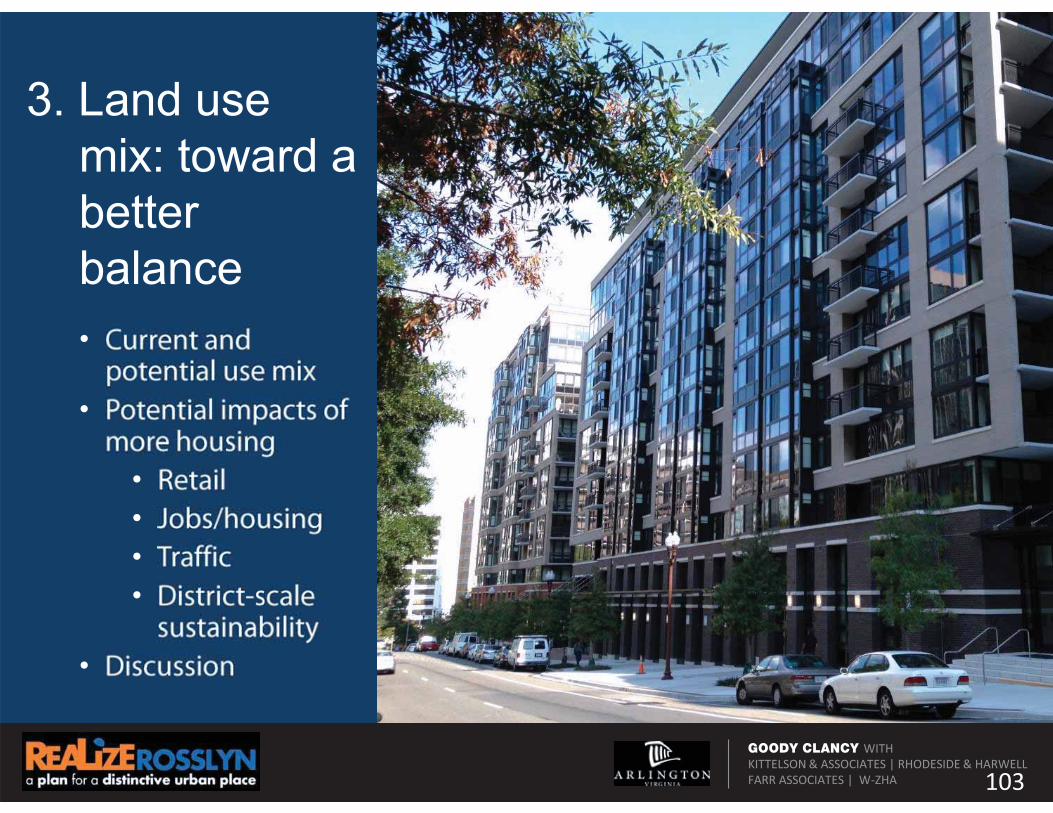
3. Land use mix: toward a better balance
103
•
•
••••
•

GOODY CLANCY WITHKITTELSON & ASSOCIATES | RHODESIDE & HARWELLFARR ASSOCIATES | W-ZHA
••
•
•
••
••••
104

GOODY CLANCY WITHKITTELSON & ASSOCIATES | RHODESIDE & HARWELLFARR ASSOCIATES | W-ZHA 105
81%
5%1% 7%
6%
76%
6%
13%
4% 1%
64%
4%
28%
3% 1%

GOODY CLANCY WITHKITTELSON & ASSOCIATES | RHODESIDE & HARWELLFARR ASSOCIATES | W-ZHA 106
81%
5%1% 7%
6%
76%
6%
13%
4% 1%
••
64%
4%
28%
3% 1%
GOODY CLANCY WITHKITTELSON & ASSOCIATES | RHODESIDE & HARWELLFARR ASSOCIATES | W-ZHA 107
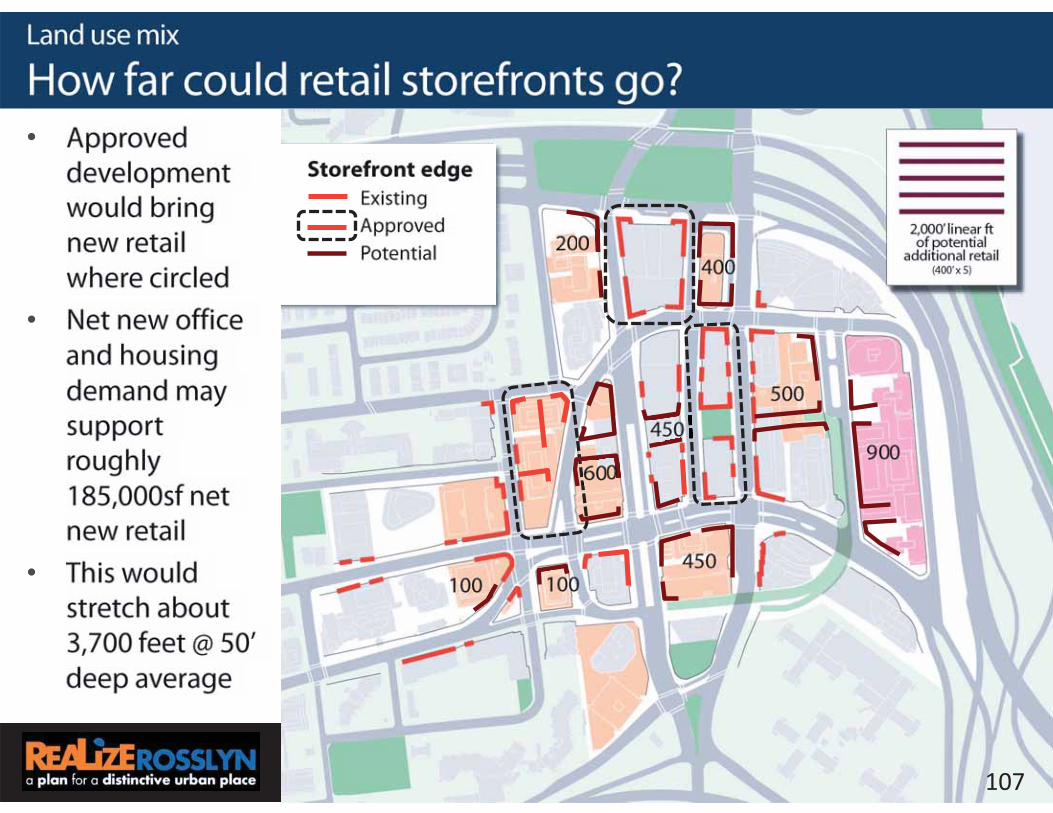
•
•
•

GOODY CLANCY WITHKITTELSON & ASSOCIATES | RHODESIDE & HARWELLFARR ASSOCIATES | W-ZHA
•
•
108
0
2,000
4,000
6,000
8,000
10,000
12,000
14,000
2010 base 22% housing,current mode
share
22% housing,target mode
share
30% housing 36% housing 45% housing
Non-motorized trips
Transit trips
Vehicle trips
GOODY CLANCY WITHKITTELSON & ASSOCIATES | RHODESIDE & HARWELLFARR ASSOCIATES | W-ZHA 109
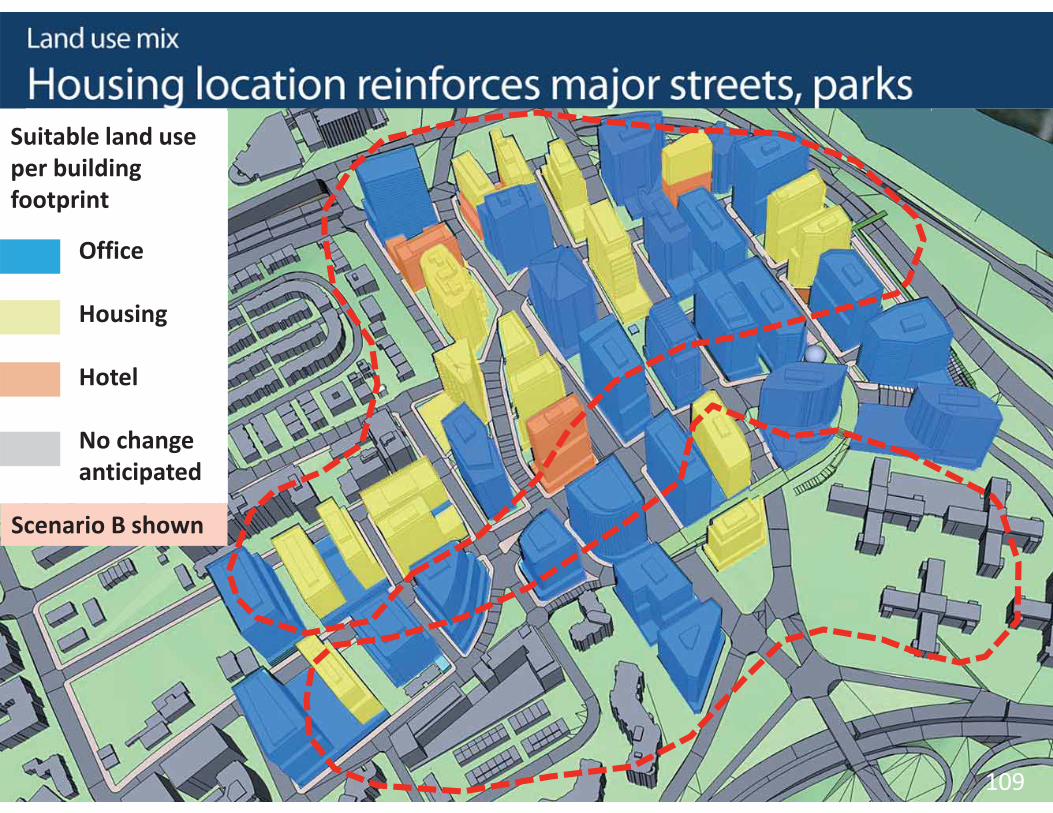
Suitable land use per building footprint
Office
Housing
Hotel
No change anticipated
Scenario B shown
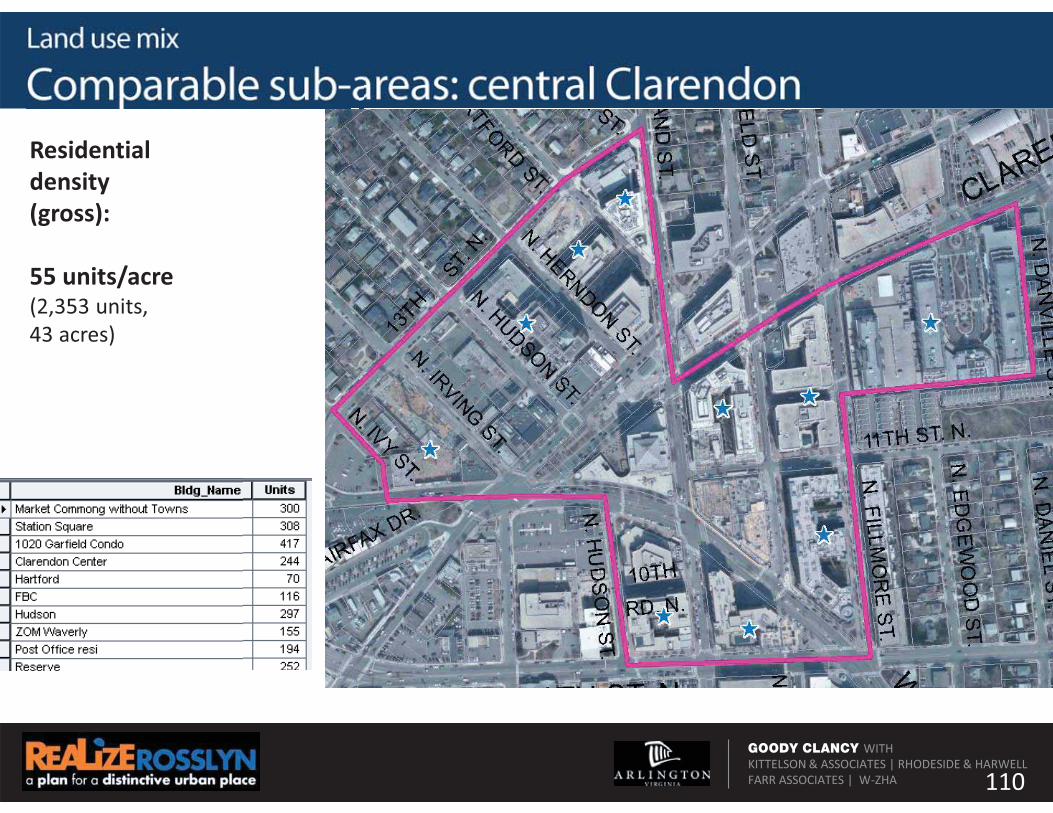
GOODY CLANCY WITHKITTELSON & ASSOCIATES | RHODESIDE & HARWELLFARR ASSOCIATES | W-ZHA 110
Residential density (gross):
55 units/acre(2,353 units,43 acres)
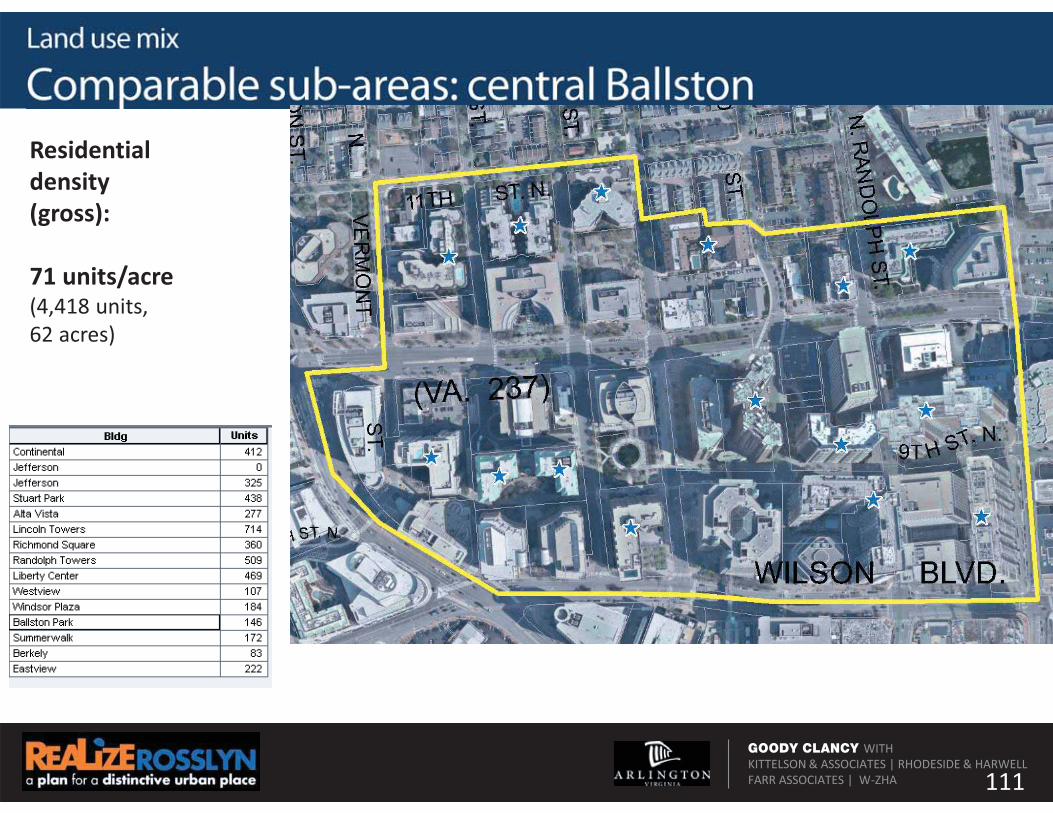
GOODY CLANCY WITHKITTELSON & ASSOCIATES | RHODESIDE & HARWELLFARR ASSOCIATES | W-ZHA 111
Residential density (gross):
71 units/acre(4,418 units,62 acres)

GOODY CLANCY WITHKITTELSON & ASSOCIATES | RHODESIDE & HARWELLFARR ASSOCIATES | W-ZHA 112
Residential density (gross):
62 units/acre(4,311 units,69 acres)
GOODY CLANCY WITHKITTELSON & ASSOCIATES | RHODESIDE & HARWELLFARR ASSOCIATES | W-ZHA
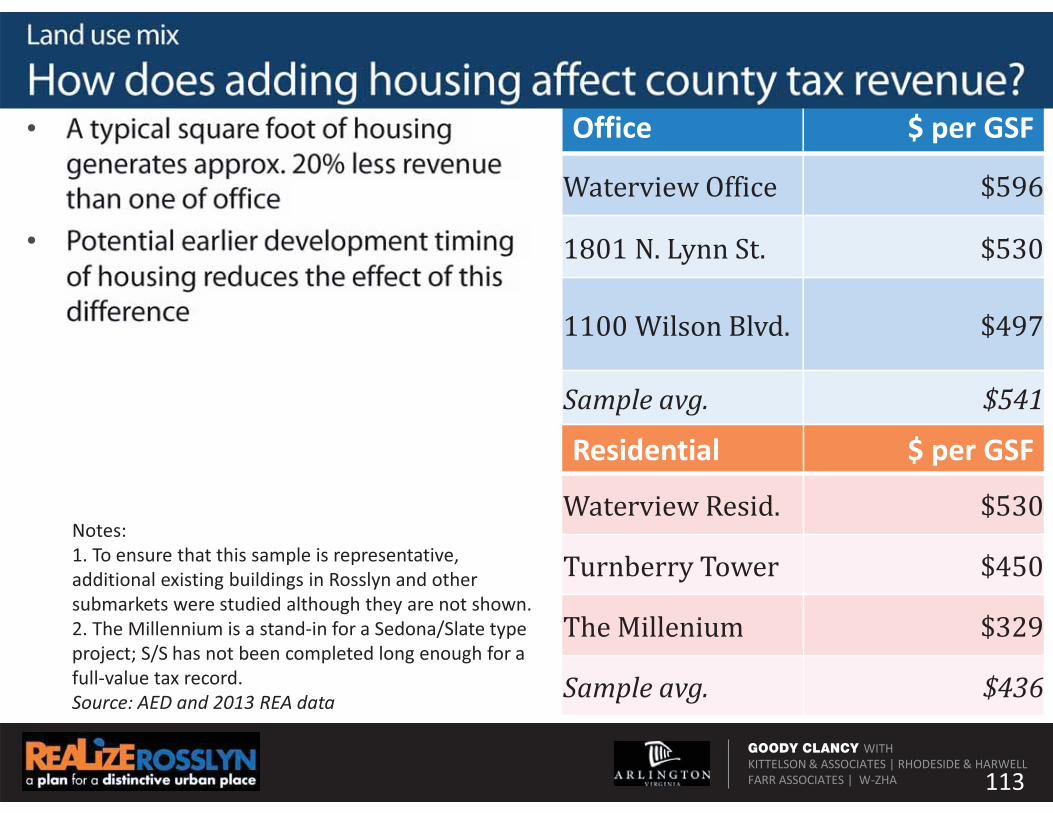
•
•
113
Office $ per GSF
Waterview Office $596
1801 N. Lynn St. $530
1100 Wilson Blvd. $497
Sample avg. $541
Residential $ per GSF
Waterview Resid. $530
Turnberry Tower $450
The Millenium $329
Sample avg. $436
Notes:1. To ensure that this sample is representative, additional existing buildings in Rosslyn and other submarkets were studied although they are not shown.2. The Millennium is a stand-in for a Sedona/Slate type project; S/S has not been completed long enough for a full-value tax record.Source: AED and 2013 REA data

GOODY CLANCY WITHKITTELSON & ASSOCIATES | RHODESIDE & HARWELLFARR ASSOCIATES | W-ZHA
Housing unlocks energy & water efficiencies
114
•–
•–
–––
–
•–
GOODY CLANCY WITHKITTELSON & ASSOCIATES | RHODESIDE & HARWELLFARR ASSOCIATES | W-ZHA
4. Next steps
115
•
•
•
••