realistic propagation of uncertainties in geologic ... · american mineralogist, volume 7 2, pages...
TRANSCRIPT

American Mineralogist, Volume 7 2, pages 67 1480, 1987
Realistic propagation of uncertainties ingeologic thermobarometry
K. V. HorcES, L. W. McKrNN.c,Department of Earth, Atmospheric, and Planetary Sciences, Massachusetts Institute of Technology,
Cambridge, Massachusetts 02 I 39, U.S.A.
AssrRAcr
Two of the most significant sources of uncertainty in geologic thermobarometry areanalytical imprecision and the systematic error associated with experimental calibrationtechniques. Analytical uncertainties are sample-specific and dictate the precision of a P-Testimate. Calibration uncertainties are reaction-specific and effectively limit the accuracyof an estimate. We describe a systematic method of propagating both types of uncertaintythrough thermobarometric calculations in order to place realistic confidence limits on P-Zestimates. As an example, we evaluate the accuracy and precision of garnet-biotite, garnet-plagioclase-kyanite-quartz, and garnet-rutile-kyanite-ilmenite-quartz thermobarometry fora pelitic sample from the Funeral Mountains of southeastern California. Calibration andanalytical uncertainties together propagate into absolute pressure and temperature un@r-tainties (950/o confidence level) of several hundred megapascals and more than 100 K.Analytical imprecision accounts for only l0-20o/o of the pressure uncertainty and less than300/o of the temperature uncertainty. Our capacity to confidently calculate equilibrationpressures and temperatures for geologic samples seems rather limited, but it can be im-proved significantly through additional careful experimental work. Comparative thermo-barometry, which involves applying a single set of thermobarometers to different samplesin order to calculate dffirences in P-T conditions, eliminates the systematic error asso-ciated with experimental calibrations. Through careful analytical work, it is possible toconfidently resolve P-7 differences ofas little as a few tens ofdegrees and a few tens ofmegapascals.
INrnonuc:rIoN
In recent years, quantitative thermobarometry andthermodynamic modeling of mineral zoning have led toa dramatic increase in the contributions made by meta-morphic petrology to a better understanding of tectonicprocesses (e.g., Hollister,1979; Tracy and Robinson, 1980;Hodges and Royden, 1984; Selverstone, 1985). Unfor-tunately, many of us are negligent (or at least optimistic)about the assigrrment of uncertainties to P-Z estimales,despite the significant effect these uncertainties may haveon the believability of a tectonic interpretation. Thesources of uncertainty in thermobarometry have been re-viewed by Essene (1982) and Powell (1985), but few at-tempts have been made to propagate these uncertaintiesinto realistic confidence limits for actual P-T estimates.In this paper, we describe a systematic approach to ex-pressing uncertainties in P-T estimates derived throughthe simultaneous solution of two experimentally cali-brated thermobarometers.
Souncrs oF uNCERTAINTy
There are four basic sources of uncertainty in ther-mobarometry.
1. Disequilibrium effects. It is impossible to "prove"
that a given metamorphic assemblage ever achievedequilibrium, although textural and chemical evidence maybe cited to support the assumption. In most applicationsof thermobarometry, only the outermost rims of adjacentphases are assumed to reflect equilibrium conditions. Thisassumption reduces some of the uncertainty involved,but an increasing body of kinetic data for metamorphicphases argues that disequilibrium is a problem to be reck-oned with (e.g., Loomis, 1983; Carpenter and Putnis,1986). Many thermobarometric assemblages from re-gionally metamorphosed terranes "re-equilibrate" duringuplift and slow cooling such that the calculated pressuresand temperatures underestimate "peak" metamorphicconditions (e.g., Tracy et al., 1976 Hodges and Spear,198 1). In these instances, the thermobarometric resultsmay help define the P-T trajectory of a terrane duringuplift and cooling (e.g., Hodges and Royden, 1984), butoften differences between the kinetics of retrograde ex-change and net-transfer reactions result in partial equilib-rium (e.g., Loomis, 1976) or outright disequilibrium. P-Iuncertainties associated with deviations from equilibri-um may be extremely significant, but they are impossibleto quantify at present.
2. Calibration uncertainties. All of the commonly usedmethods of calibration introduce significant uncertainties
0003404x/8 7/0708-o67 l s02.00 671

HODGES AND MCKENNA: UNCERTAINTIES IN THERMOBAROMETRY
lllullloun"tt E ",ot't. f--l ernr'rer
ll ur""ou't. V-r'^no"t^". [lIJ]*r^",r,
Fig. 1. Line drawing of a hypothetical domain within a pelit-ic schist. Numbered points indicate spot analyses referred to intext.
that propagate as systematic errors in P-Z estimates. For-tunately, these uncertainties can be quantified: Anderson(197 7 a, 197 7b) has discussed the uncertainties associatedwith calculating the position of an equilibrium curve inP-I space using thermochemical data, and Hodges andCrowley (1985) have examined the uncertainties inherentin empirical calibration. Relatively little attention has beenpaid to the uncertainties associated with direct experi-mental calibration, even though experimentally calibrat-ed equilibria are inherently the most reliable thermoba-rometers.
3. Analytical uncertainties. Analytical uncertainties as-sociated with electron-microprobe analysis fall into twocategories: (a) standardizatio\, X-ray counting, and cor-rection uncertainties inherent to the technique and (b)variations in composition associated with variable scalesof equilibrium. Uncertainties of the first kind have beentreated routinely for some time (e.g., Smith, 1976), butactual compositional variability within samples is seldomdealt with in systematic fashion.
4. Solution modeling. Many of the phases commonlyused for thermobarometric calculations exhibit nonidealsolution behavior, in some cases necessitating major cor-rections of measured compositions to arrive at reasonableactivities. Phase-equilibrium experiments (e.g., Eugster etal.,1972), calorimetric measurements (e.g., Newton et al.,1977), and empirical observations (e.g., Ganguly andKennedy, 1974; Ghent et al., 1979; Hodges and Spear,1982) have been used to formulate activity coefrcients.
Unfortunately, there is often disagreement amongworkers about the magnitude of various AG"*""., termsand even the mathematical form of solution models. Thishas led to the widespread practice of reporting multipleP-7 estimates reflecting the effects of different solution
models. For example, garnet-biotite temperatures havebeen calculated using an ideal solution model for garnet(Ferry and Spear, 1978) and nonideal models proposedby Newton and Haselton (1981), Hodges and Spear (1982),and Ganguly and Saxena (1984). In some cases, P-Z es-timates calculated using different solution models can varywidely, implying that uncertainties in solution behaviorconstitute a major source of error in thermobarometry.In general, this error cannot be quantified because theassumptions inherent in different models are often mu-tually exclusive.
For the remainder of this paper, we will treat only theeffects of analytical and calibration uncertainties on ourconfidence in P-T estimates, because these are the onlyuncertainties that, aI present, lend themselves to rigorouserror-propagation techniques. Because analytical uncer-tainties pertain to individual samples, they propagate intominimum estimates of the precision of a P- 7 calculation.Calibration uncertainties reflect our confidence in the po-sitions of end-member reactions in P-T space and thuspropagate into minimum estimates of the systematic errorassociated with the use of specific thermobarometers. To-gether, the two types of uncertainty provide a sense ofthe accuracy of a P-T estimate.
PnoplclrroN oF ANALYTTcAL UNCERTAINTTES
Because it is impractical to analyze every segment ofevery rim of every pertinent grain in a sample, we mustuse some systematic (yet cost-efficient!) technique to es-timate compositional variability. First, we select two tothree domains in each probe mount. A hypothetical "do-main" in a quartz-muscovite-biotite-garnet-plagioclase-kyanite schist is illustrated in Figure 1. Knowing a priorithat we want to simultaneously solve the equilibria
MgrAlrSirO,, + KFe.AlSirO,o(OH),garnet biotite
: FerAlrSi:O,, + KMgrAlSi3O'o(OH), (Rl)garnet biotite
and
CarAIrSirO,, + 2AlrSiO5 + SiO, : 3CaAlSiO' (R2)garnet kyanite quartz plagioclase
for rim temperature and pressure, we have chosen thisdomain such that the non-end-member phases partici-pating in the equilibria (garnet, biotite, and plagioclase)share sharp mutual boundaries. We would analyze min-erals along each ofthe critical boundaries twice, as nearas possible to the "rim" (points l-6 for garnet, points 7-l0 for biotite, and points I I and 12 for plagioclase). Inorder to account for narrow concentration gradients inthese phases, we might define the "rim" by analyzingpoints along short traverses across each boundary.
The same procedure is repeated for each domain, re-sulting in a suite of rim analyses for each non-end-mem-ber phase. Using the formula basis for each analysis, we

var.: (H)'u",,, * (f'r^,,,
where variables zr, zr, . . . zn have normally distributedrandom uncertainties, and p,,", are covariance coefrcientsdescribing the interdependenie between the variances ofany two compositional variables.
At this point, we wish to calculate a pressure and atemperature by simultaneously solving two equilibrium-condition equations ofthe form
0 - AH - 7rA,S + (P - l}s)LV + R?" In K (5)
where R is the gas constant, P is pressure, Z is temper-ature, and AH, AS, and AV are the enthalpy, entropy,and volume change for the reaction. The equilibriumconstant (K) is a function of various mole fractions and(if nonideal solutions are involved) T and P.If we assumethat all of the uncertainty in T and P is a consequence ofanalytical uncertainty, then we could use equations suchas 4 to propagate uncertainties in mole fractions into s1and s.. Although rigorous, this approach can be cumber-some if complex solution models are involved.
A computationally simpler approach was suggested bySteltenpohl and Banley (1984) and involves Monte Carlopropagation of the compositional uncertainties (Ander-son, 1976, 1977b; Hodges and Crowley, 1985). The pro-cedure is (l) create a 200-element array for each molefraction, consisting of a population of values normallydistributed about the accepted value; (2) choose a "seed"pressure and temperature (e.9., 500 MPa and 500 K) forthe calculation; (3) calculate both equilibrium constantsusing a randomly chosen element from each mole-frac-
TaeLe 1. Statistical and thermodynamic variables
Xi: the lth datum in a set X, X", . . . , X.X: samole mean of X
Varr: sample variance of Xn: the number of data in a sample
sx: sample esd of XF: any function of variables Zt, Zz,. . . , zn
px, = covariance coefficient of x' and Xt@r, @p : uncertainty in calculated f and P
E: ellipticity of an uncertainty ellipseM: slope of a line in two-dimensional spaceB: ordinate intercept of a line in two-dimensional space
&: a Particular value of XY* = expected value of yfrom a regression at XrlV: confidence interval of a regression
t : Student's distribution coefficienta : confidence interval for the Student's t distribution
S : entropy [J(mol. K)]P: pressure (Pa)K: eouilibrium constant
673HODGES AND MCKENNA: UNCERTAINTIES IN THERMOBAROMETRY
calculate the mean (X) and sample variance (Var") foreach element (see Table I for notation of variables),
x:!f, ", (r)n ._,
, / , \ 2
Yar* : "2X - (>x) , e)r : I \ i : l /
where .{ is the composition measure d at i : I to n points.Note that Var" is related to the commonly used estimatedstandard deviation (esd) of X, s" by
Yar* : s2r.
Mole fractions of various components (e.g., almandinein the garnet solution) are calculated using measured com-positional data, and their uncertainties are obtained byapplying the basic error-propagation equation (Larsen andMarx, l98l). For a function ,F of variables zr, zr, . . . , Zn,
R: gas constant [8.314 J/(mol K)]
tion array, as well as the "seed" P and I if necessary;(4) calculate P and T as a function of the various ther-modynamic variables and the equilibrium constants; (5)iterate step 4 until P and 7 converge; and (6) iterate steps2 through 5 100 times in order to produce a total of 100P-?" pairs for the sample. The Monte Carlo method oferror propagation is strictly valid only when the variablessubject to uncertainty are independent. Because molefractions are constrained to sum to unity for a single phase,this condition is not completely satisfied in our applica-tion. Covariances between mole fraction variables will bedominantly negative; consequently, Equation 4 indicatesthat the Monte Carlo method will slightly overestimatethe P-T uncertainty.
In P-T space, the Monte Carlo array defines an ellip-tical cloud that reflects the estimated uncertainty in P and7 as well as the correlation between these uncertainties.We extend the approach of Steltenpohl and Bartley (1984)by calculating a best-fit, 2s (95o/o confidence) ellipse forthe data. We begin by defining the long axis of the ellipseas parallel to a best-fit line passing through the P-T anay.In practice, we use the mean of least-squares linearregressions of P on T and T on P. The slope of this lineis used to define a rotation matrix that permits reorien-tation ofthe elliptical cloud with principal axes parallelto P and Z axes. The resultant cloud is translated to theorigin in P-7"space, and an ellipse is deflned such that itsradii span +2s variations in P and T from the origin.This ellipse is then translated and rotated back to itsproper position in P-I space.
Figure 2 illustrates the results of this sort of analysisfor a pelitic schist sample from the Monarch Canyon areaof the Funeral Mountains, southeastern California (La-botka, 1980; Hodges and Walker, in prep.). The samplecontains the subassemblage ilmenite-rutile-garnet-kya-nite-plagioclase-muscovite-biotite-quartz, permitting theapplication of thermobarometers Rl and R2, as well asGRAIL,
(3)H: enthalpy (J/mol)f : temperature (K)V: volume (m3/mol)
+...+(#) '"- , (4)
*' 2 2 o"''Y,Y,Yar'/"'Yag'

674 HODGES AND McKENNA: UNCERTAINTIES IN THERMOBAROMETRY
Tnele 2. Compositional data for FM-12
Garnet
Biotite
Muscovite
Plagioclase
llmenite
3FeTiO, + AlrSiOs + 2SiO,ilm kyanite quaftz
: Fe.AlrSirOr, + 3TiOr, (R3)garnet rutile
which was experimentally calibrated by Bohlen et al.(1983). Rim compositions for non-end-member phaseswere obtained using the rcor Superprobe at MIT (Table2) and manipulated using the techniques outlined aboveto obtain precisions for mole fractions. The dashed ellipsein Figure 2 corresponds to the precision of a P- I estimatemade by using the Ferry and Spear (1978) and Goldsmith(1980) calibrations of Rl and R2, respectively, with so-Iution models as described by Hodges and Spear (1982)and modified by Hodges and Royden (1984). We cancalculate the approximate precisions associated with thegeothermometer (c,r.) and geobarometer (<.r") using half ofthe spread in Z and P (respectively) enclosed by the el-lipse. These uncertainties are +45 K for Rl and +105MPa for R2 and are in good agreement with commonlyaccepted uncertainties for the equilibria (e.g., Ferry, 1980;Ghent et al.,1982). The ellipticity (E) of the uncerrainryfield (defined as the major radius divided by the minorradius) provides a measure ofthe dependence ofthe over-all precision on the individual precisions of the thermo-barometers; ellipticities greater than l0 indicate that theprecision of one of the equilibria dominates the precisionof the P-I estimate. In this case, E : 12.8, implying thatmost of the uncertainty represented by the ellipse is afunction of the uncertainty in the composition of phasesinvolved in equilibrium Rl.
We can explore the sensitivity of the P-Z estimate tothe uncertainties associated with individual phases bysetting selected mole-fraction uncertainties to zero andderiving new ellipses (Fig. 3a). For this sample, most ofthe uncertainty in Rl stems from uncertainties in thegarnet composition, whereas most of the uncertainty inR2 depends on the precision ofthe plagioclase analyses.
The dotted ellipse in Figure 2 represents the precisionof a P-T estimate calculated by using Rl and R2 andalternative garnet (Ganguly and Saxena, 1984) and pla-
1 300
- - - - ( R l ) , ( R 2 ) - H S
. . . (R l ) , (R2) -NHGS
- (R1) . (R3)
bl'iy'
500 700 900TEMPERATURE (K)
1 100
Fig. 2. Analytical uncertainty ellipses (2s) for the FuneralMountains sample. Rl, R2, and R3 refer to equilibria used. HSand NHGS indicate solution models of Hodges and Spear (1982)or Newton and Haselton (l 98 1) and Ganguly and Saxena (l 984).Aluminosilicate stability fields after Holdaway (1971).
gioclase (Newton and Haselton, 198 l) solution models.The resultant shift in the absolute position of the ellipseis relatively minor, but the size of the ellipse increasesmarkedly (orr: 53 K, r" : 135 MPa, E : l l .0). This isa consequence of the increased mathematical complexityand greater dependence on compositional terms associ-ated wrth the alternative solution models, and it empha-sizes the point that more complex solution models leadto less precise (albeit possibly more accurate) P-T esti-mates.
The solid-line ellipse in Figure 2 shows the results forsimultaneous solution of thermobarometers Rl and R3.using the Bohlen et al. (1983) calibration of R3 and as-suming the Hodges and Spear (1982) solution model forgarnet. For the ellipse, or: 35 K, @p : 37 MPa, and E :
3.6. The precision of the Rl-R3 estimate is not stronglydependent on the precision of one thermobarometer orthe other, and the precision of the GRAIL geobarometeris inherently greater than that of the garnet-plagioclase-aluminosilicate-quartz geobarometer. Sensitivity analysis(Fig. 3b) reveals that almost all of the uncertainty in theRl-R3 estimate is due to uncertainty in garnet compo-sition. Our ultimate conclusion for the Funeral Moun-tains sample is that the Rl-R2 and Rl-R3 P-Z estimates(solid and dashed ellipses) are internally consistent within2s analytical uncertainty.
PnoplclrroN oF cALIBRATIoN UNCERTAINTIES
Equation 5 can be rewritten as
P :Z ( A ^ S - R l n K ) (6a)
A V
L H + ( P - l 0 ) A Z
Commonly a net-transfer reaction (e.g., R2) is experi-mentally calibrated as a thermobarometer by bracketing
MineralMole
Component fractionUncertainty
(1 s)
AlmandinePyropeGrossularSpessartine
AnnitePhlogopite
KzalkalisNaDalkalisvrAl
AlbiteAnorthite
Fe2*
0.7980 1 1 90 04640.0371
0.427n qoq
0.8420.1 570 .911
0.8860 . 1 1 0
0.958
7.2 x7 7 x8 5 x1 . 7 x
4.8 x4.3 x
3.8 x3.8 xo,o x
8.4 x8.2 x
3.0 x
1 0-31 0 3
1 0 o
1 0-4
1 0-31 0-3
1 0 ,1 0 21 0-3
10-31 0-3
1 0-3
Gc:U
U'ahU
d
'ro00
+-ff+ rc'
'"K: -+R
. f; (6b)

the position of the end-member reaction in P-7 space,performing a linear regression on the bracketing data, andderiving values for reaction entropy and enthalpy fromthe slope and P intercept ofthe regression line by usingEquation 6a. For an exchange reaction (e.g., Rl), mineralpairs are allowed to equilibrate at a variety of tempera-tures, their compositions are measured and used to cal-culate equilibrium constants, and A11 and AS are calcu-lated from l/T vs. ln K regression parameters by usingEquation 6b. Solving Equations 6a and 6b for AS andAfl yields
AS : M"AV AH : -(8" - 1gs1AV (7a)As: RBo LH: -M8 - e - I} ')AV, (7b)
where M and B are the slope and I intercept of theregression lines, respectively, and the a and b subscriptsrefer to the (?", P) and (l/7, ln K; forms of Equations 6aand 6b, respectively. Applying Equations 3 and 4 toEquations 7a and 7b produces the formulae for the un-certainties in AIl and AS. For (2, P) space
s2o, : Llz s2u^ + (8. - 105)'?sln s'z*: AQs')r", (8a)
and for (l/7,ln K) space
sio: R'?siro * a,I/2s2, + (P - 105)'sl, sl": R,slo, (8b)
where s, and s. are the uncertainties in the Y interceptand slope of the regression line, so, is the uncertainty inthe volume change for the reaction, and s" is the uncer-tainty of the pressure at which l/T vs. ln K experimentswere conducted. Because AZis generally well known (Ro-bie et al., 1978), slnis rather small and can be droppedfrom Equations 8a and 8b without introducing significanterror. The experimental uncertainties that contribute tos"o and so" include (l) the temperature uncertainty in eachrun; (2) the pressure uncertainty in each run; and (3) inthe case ofnet-transfer reactions, the pressure and tem-perature differences between pairs of experiments thatbracket the position of a reaction over a range of condi-trons.
Temperature uncertainties for calibration experimentsgenerally range from 5 to 15 K (Schmid et al., 1978; Boh-len et a1., 1983), depending on the apparatus used. Thepressure uncertainties in calibration experiments varywidely (Hays, 1966; Bohlen et a1., 1983). Johannes (1978)and Johannes et al. (1971) have discussed accuracies ofpiston presses over a range of run parameters. In general,they have concluded that experimental runs in piston-cylinder apparatus with alkali halide pressure media areaccurate to +0.5 x 10⁸ Pa, whereas the same presses runwith talc or pyrophyllite cells may have inaccuracies asgreat as 1.5 x lOs Pa. The experimental reproducibility(i.e., the precision) oftalc cells is better, and the inaccu-taay can be improved to near 10.5 x 10⁸ Pa by cali-brating the cell against alkali halide cells. If experimentaldata are collected on the same press, the inaccuracy ofthe press affects only the regression line's intercept un-certainty. Because the slope ofthe regression line depends
675
1 300
1 000
700
400
1 0 0
500 700 900 1 100TEMPERATURE (K)
1300
? roooo-=lrJtrf 700oaluTEIL
400
100
SENSITIVITY (R1), (R3) b
500 _
700 900 1 100TEMPERATURE (K)
Fig. 3. (a) Sensitivity analysis for Rl-R2 uncertainties. Solidellipse assumes no uncertainty in garnet analysis. Dashed ellipseassumes no uncertainty in biotite analysis. Dotted ellipse as-sumes no uncertainty in plagioclase analysis. (b) Sensitivity anal-ysis for R1-R3 uncertainties. Solid ellipse assumes no garnetuncertainty, dashed ellipse assumes no biotite uncertainty, anddotted ellipse assumes no ilmenite uncerlainty.
only on the relative position of the data in(7, P) or (l/T, ln IQ space, a constant bias in the press cancels out ofthe slope calculation, making the uncertainty in the slopea function only of the imprecision of the press. Thus,diferent calibrations of the same reaction often have bet-ter slope agreement than intercept agreement. Unfortu-nately, press inaccuracy becomes important when datafrom different laboratories are regressed together, and thenthe full inaccuracy must be considered.
Bracketing uncertainties for net-transfer reactions arecalculated from the differences in run conditions (2"^,
HODGES AND MCKENNA: UNCERTAINTIES IN THERMOBAROMETRY
o(L
uJtrfoolrJCL(L
SENSITIVITY (R1), (R2)

676
P"*) between a pair of runs. For two runs at (i",, P,) and(Tr, Pr),
T'*: (7, - T')Pu": (P, - Pr).
(9)
Using Equation 4, the bracketing variances are
Varrn" :Yarr , 1 Yarr , (10)Var^ * :Va r " , *Va r " ,
Assuming that the variances are equal at the two (2, P)conditions, then
s."" : 1.4,,.i"uo : I .4,"
( l l )
where s, and .rp are the experimental uncertainties fortemperature and pressure, respectively. Thus, even when
HODGES AND MCKENNA: UNCERTAINTIES IN THERMOBAROMETRY
two runs nominally bracket an equilibrium perfectly (thatis 7, : Tr, P, : Pr), the bracket still has a 2s uncertaintyof 2.8s. and 2.8so due simply to the inaccuracy of theapparatus.
Given a variety of experimental uncertainties, we re-quire a linear regression routine that will permit us topropagate these uncertainties into entropy and enthalpyuncertainties. For a similar problem involving empiricalthermobarometric calibrations, Hodges and Crowley(1985) used the York (1969) treatment, which yields sim-ple uncertainties in the calculated slope and Y intercept.The problem of experimental calibration involves an ad-ditional factor: many experiments are conducted at P-Tconditions that greatly exceed the natural conditions per-tinent to crustal thermobarometry. Intuitively, thermo-barometers calibrated at more realistic P-I should bebetter than those calibrated at less realistic P-2, and thisshould be reflected in uncertainty calculations. Because
(7)
Y
T
1 0 1 2 1 41 / T E M P E R A T U R E X 1 O - 4 ( 1 / K )
Fig. 4. Experimental calibration of Rl, R2, andR3 showing 2s uncertainty limits from the Yorkregression routine (dashed envelopes) and our treat-ment (solid envelopes). Experimental data are shownwith appropriate errors which, in the case of R2and R3, include bracketing uncertainties. For R2,the solid boxes represent data of Goldsmith (1980),the negative-slope ruled boxes represent data ofHays( I 966), and the positive-slope ruled boxes representdata of Hariya and Kennedy (1968). The unpat-terned boxes in Figures 4b and 4c represent the P-7space shown in Figure 2. Figure 4a lies entirelywithin the temperature range of Figure 2.
4 0 0 8 0 0 1 2 0 0 1 6 0 0T E M P E R A T U R E ( K )
(u(L
IIJEl(t)ouJ(r(L
(!n
uJElaouJE,(L
3 0 0 0
2 0 0 0
3 0 0 0
2 0 0 0
4 0 0 8 0 0 1 2 0 0T E M P E R A T U R E ( K )
R 1 CALIBRATION
R 2 C A L I B R A T I O N R 3 C A L I B R A T I O N
1 0 0 0
1 6 0 0
1 0 0 0

HODGES AND McKENNA: UNCERTAINTIES IN THERMOBAROMETRY 677
the York (1969) treatment does not account for this ef-fect, we derive an explicit formula for the full uncertaintyfield defined by the experimental data. The regression lineis defined by
Y r - - Y + M ( X k - n , (r2)where X^ is any X value, I^ is the expected value of theregression at Xk, M is the slope, and X and 7 are theaverage X and Z (Draper and Smith, 1966). ApplyingEquation 4 to 12 and noting that the variance of X, iszero because X^ is an arbitrarily chosen variable, we findthat
Var.k: Vary * (Xo - X)2Yar, + M2Yary
1- 2per(Xr - X)YarogsYaror|+ 2pyy(-tr4)Yar$5Var$5+ 2px,GM)(Xr - X)Yarf;;sYarof , (13)
where Vari, is the variance ofthe expected Yo value fromthe regression line, Var., is the variance of the slope, andVar.1 and Var" are the variances of the mean X and Y.Varl and Varr may be found by applying Equation 4 toEquation 1. The variance of the slope may be taken fromthe results of a standard York regression of an experi-mental data set. In effect, the first and third terms inEquation 13 account for the uncertainties in individualexperimental runs. The second term accounts for the ef-fect of the slope uncertainty on a Y* estimate. It has aminimum of zero at Xk:.Y and increases symmetricallyabout X as a hyperbola in (X, Y) space. The next threeterms in the equation account for covariances between I,X, and M.
Once the variance of a calibration has been deter-mined, it must be converted into a confidence interval.Through standard practice, the confidence interval is giv-en at the 95o/o ("2s") level. The confidence interval has afull width of 2W; lZ is given by the relation (after Larsenand Marx. l98l)
W : Yafp5otr.,r,,_r.,, (r4)where t,.,r.,-r, is the Student's / distribution with (n - 2)degrees offreedom at the 100(l - a) percent confidencelevel. For 950/o uncertainties, a : 0.05 ?td t612.,-21tdrrgasfrom - 13 (n : 3) to 1.96 (n : <n\.
The morphology of the confidence curves is dominatedby the VarT and Var, terms in the neighborhood of (X,Y), and the Var, and covariance terms dominate wherelXr - Nl is large. Because two of the covariance terms inEquation 13 are odd functions of (Xr - X), they changesigns at Xx: X. This behavior leads to confidence curvesthat are asymmetric with respect to X. The confidenceinterval for Yo at Xr : 0 gives the l-intercept uncertaintyfor the data array, or, in terms of Equations 8a and 8b,the value of su. As Var,', is a function of X., so too is su;the "resolved" uncertainty in Atl (in 8a) and AS (in 8b)will vary as a function of Z and l/2, respectively. Theuncertainty is least at Tk : T or (l/7)r : Q/T) and in-creases away from these values. As the thermodynamicuncertainties derived in this fashion are propagated into
Ferry andSpear(1 978)(ln K)/3
1673 3.1s(08)1623 3.03(08)1573 2.88(03)1523 2.88(08)1473 2.53(18)1423 2.58(08)1 373132312731223 2.10(10)117311231 0731 0231 0 1 1971924871823
Nominal bracketing uncertainties2.8s7 172 gsp 0 .142st,,2s"" *
7 70.07
5 x 1 0 6
0.01
uncertainties in thermobarometric estimates of P-7, theeffects are minimized when the calculated temperature ofthe sample coincides with the mean ?"of the experimentaldata, and the efects increase geometrically with increas-ing difference between the sample temperature and theexperimental mean temperature.
Figure 4 illustrates the confidence limits for experi-mental calibrations of Rl through R3 using the data of(1) Ferry and Spear (1978) for Rl; (2) Hays (1966), Ha-riya and Kennedy (1968), and Goldsmith (1980) for R2;and (3) Bohlen et al. (1983) for R3. The pertinent datafrom these papers are summarized in Table 3. To thesedata, we assigned nominal 2J temperature and pressureuncertainties of 5 K and 6.5 x I 08 Pa or the uncertaintiesgiven in the source if they were larger. The computedvalues for the input parameters of Equations 12 through14 are given in Table 4. We derived covariance coeffi-cients for Rl through R3 using a Monte Carlo approach.In this technique, we use each datum in the experimentalcalibration set and its corresponding uncertainty to de-rive a 20O-element, normally distributed array. One val-ue is chosen arbitrarily from each array, and a simplelinear-regression analysis is performed on the resultingset of points. This procedure is repeated 1000 times inorder to produce a suite of values for I, X, and M. Theseare then regressed against each other, and the resultingcorrelation coemcients are used as the covariance coefr-cients in Equation 13. The values for these coefficientsare listed in Table 4. For the three calibrations that weconsidered, only one covariance terrn (pr, in R3) is largeenough to have a significant effect on Vario.
The most noticeable feature of Figure 4 is the (rather
TeeLe 3. Bracketing data
Hays(1 966)
P(GPa)
Hariya and BohlenKennedy Goldsmith et al.(1968) (1e80) (1e83)
P P P(GPa) (GPa) (GPa)
T(K)
3.05(05)2 85(05)2.80(1 0)2.70(1 0)2.60(1 0)2.50(1 0)2.30(10) 1.59(02)
1 .53(01)1 .46(01)
1.32(02)1 .2s(01)1 20(01) -1.2' l116(03) -1 .33
-1 .35_1.48_1.68_ 1 . 7 8
t ' l0.07
678 HODGES AND McKENNA: UNCERTAINTIES IN THERMOBAROMETRY
TABLE 4. Regression results
Term R1
nlgs
MBVarts?
Vat M
s?X
PxM
Px?
72.57
-2 .08 x 10gK t0.7536.62 x 10 34.61 x 10- '?
-1 447 .1 t x 16s 11 z1 .50 x 10 "K - '1 .05 x 10-8 K-,1 05 x 10 a K I0 1 60 . 1 10 .011
1 42.'t82.29 x 106 PalK
-7.47 x 10⁸ Pa1 . 12 x 1016 Paz8.79 x 1016Pa2271 x 10e Pa252 x 1010 (PalKl21 1 7 x 1 0 3 K ,1.58 x 100 K'z'1.51 x 10³ K0.050 . 1 2
-0.004
72.571 .28 x 106Pa /K
- 1 . 6 7 x 1 0 8 P a5.30 x 1015Paz2.85 x 10'6Pa21.36 x 10s Pa1 .19 x . l e i o (pa lK ) ,2.48 x 103 K21.74 x 100 K21 . 1 9 x 1 0 3 K
-0.610.02
-0.006
disappointing) size of the uncertainty fields. The dashedlines indicate the much smaller uncertainty limits pre-dicted by the standard York regression routine. The Var.term in Equation 14 is within 50/o of the York limits forall Z, for all three equilibria. At temperatures far re-moved from the mean temperatures of the data, this termaccounts for between 300/o (R2) and l2o/o (Rl) of the un-certainty field. Near the mean temperatures, the effect ofthis term becomes negligible, and the other terms inEquation 14 combine to produce uncertainty limits thatare somewhat greater than the 950/o confidence limits ofthe data points themselves. The magnitude of the 2s un-certainty fields for these equilibria is striking when com-pared to the realm ofcrustal P-Z space. The unfilled box-es in Figure 4 correspond to the P-T conditionsrepresented in Figure 2. Table 5 gives the derived ther-modynamic values, and their associated uncertainties, forRl, R2, and R3.
Accun.l,cy oF THE FuNnn-q.r, MouNr.llNsP-T Bsrriulrns
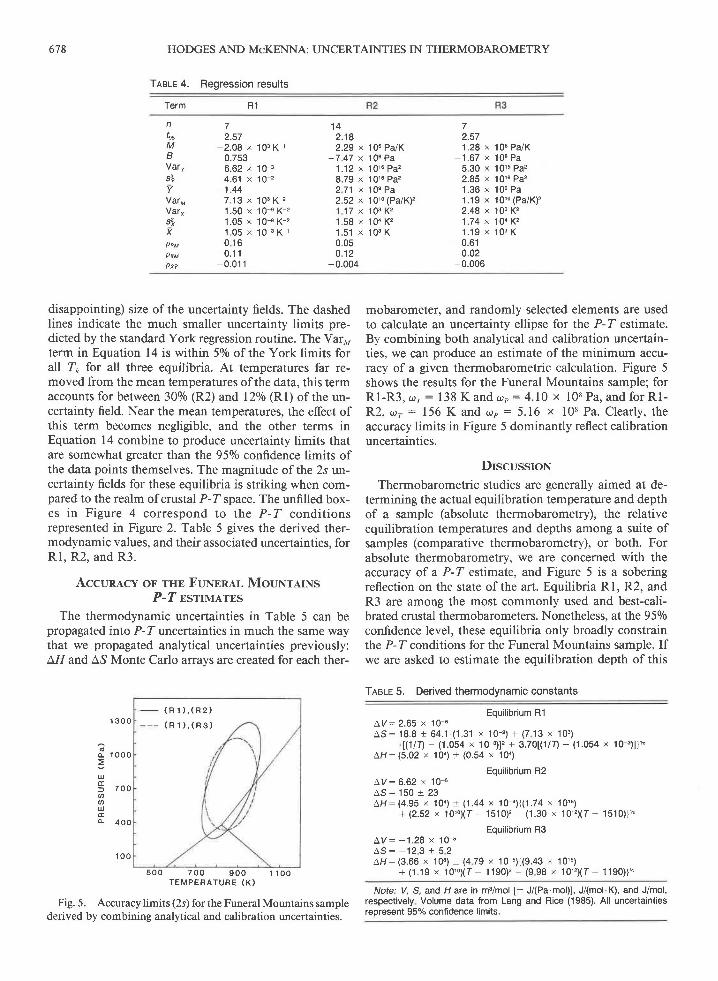
The thermodynamic uncertainties in Table 5 can bepropagated into P-Z uncertainties in much the same waythat we propagated analytical uncertainties previously:AfI and AS Monte Carlo arrays are created for each ther-
1 3 0 0
1 0 0 0
7 0 0
400
1 0 0
mobarometer, and randomly selected elements are usedto calculate an uncertainty ellipse for the P-Z estimate.By combining both analytical and calibration uncertain-ties, we can produce an estimate of the minimum accu-racy of a given thermobarometric calculation. Figure 5shows the results for the Funeral Mountains sample; forR1-R3, c.r. : 138 K and <,r" : 4.10 x 10⁸ Pa, and for Rl-R2, or . : 156 K ?nd <or : 5.16 x 10⁸ Pa. Clear ly , theaccuracy limits in Figure 5 dominantly reflect calibrationuncertainties.
DrscussroN
Thermobarometric studies are generally aimed at de-termining the actual equilibration temperature and depthof a sample (absolute thermobarometry), the relativeequilibration temperatures and depths among a suite ofsamples (comparative thermobarometry), or both. Forabsolute thermobarometry, we are concerned with theaccuracy of a P-T estimate, and Figure 5 is a soberingreflection on the state of the art. Equilibria Rl, R2, andR3 are among the most commonly used and best-cali-brated crustal thermobarometers. Nonetheless, at the 950/oconfidence level, these equilibria only broadly constrainthe P-T conditions for the Funeral Mountains sample. Ifwe are asked to estimate the equilibration depth of this
Tnele 5. Derived thermodynamic constants
Eouilibrium R14y : ! . gg x 10 -6AS :18 .8 + 64 .1 { (1 .31 x 10+ ) + ( 7 13 x 103 )
[(1/7) - (1.054 x 10 3) ] '+ 3.70[(1/D - (1.054 x 10-") ] ] "AH:(5.02 x 10⁴) + (0.54 x 10a)
Eouilibrium R26 Y : 6 . 6 2 x 1 0 5
as : 150 + 23AH:(4.95 x 10⁴) + (1.44 x 10 a){(1.74 x 10¹⁶)
+ (2 .52 x 1019 ( r - 1510F (1 .30 x 1o1 '?X r - 1510 )1 r
Equilibrium R3A y : _ 1 . 2 9 x 1 0 s
a s : - 1 2 3 + 5 2AH: (3.66 x 10³) + (4 79 x 10 5){(9.43 x 10¹⁵)
+ (1 .19 x 1019 (T - 1190F - ( 9 98 x 101 '?X r - 1 190 ) )h
Note: V, S, and Hare in m3/mol [: J/(Pa.mol)], J/(mol K), and J/mol,respectively Volume data from Lang and Rice (1985). All uncertaintiesreoresent 95% confidence limits.
oc
Ut
ooUE
( R 1 ) , ( R 2 )
( R 1 ) , ( R 3 )
5 0 0 7 0 0 9 0 0 1 1 0 0T E M P E R A T U R E ( K )
Fig. 5. Accuracy limits (2s) for the Funeral Mountains samplederived by combining analytical and calibration uncertainties.

HODGES AND McKENNA: UNCERTAINTIES IN THERMOBAROMETRY 679
sample, we are forced to report the estimate with a min-imum 2s uncertainty of l0 to 20 km. Despite this unfor-tunate truth, it is noteworthy that these equilibria usuallyyield P-Z estimates that are consistent with independentindicators of metamorphic conditions (e.9., the alumi-nosilicate stability fields), and it seems likely that thesethermobarometers are better than statistical rigor leadsus to believe.
In a sense, the uncertainty limits in Figure 4 make astronger statement about calibration techniques than aboutthe inherent quality of specific thermobarometers. Statis-tically meaningful absolute thermobarometry requiressome modification of commonly accepted calibrationprocedures. The form of Equation l{ srrggests threechanges that could significantly improve thermobaro-metric accuracy: (l) increasing the number of runs in thecalibration data set; (2) increasing the P-T range of thecalibration data set, and (3) increasing the P and Z pre-cision of the experimental presses.
Because the Var" and Vary terms in Equation 14 scaleas n t, the magnitude of these terms is reduced by in-creasing the number of statistically independent brack-eting experiments in the calibration data set. By "statis-tically independent," we mean experiments run at separatetimes or in separate presses, even if the experiments du-plicate P-Z conditions of other experiments. Althoughduplicating the P-T conditions of runs will not improvethe York regression statistics, increasing the number ofbracketing runs at a given temperature increases the like-lihood that the pressure bracket lies on the modeledregression line.
Extensions of the P- 7 range of calibration experimentsaffects uncertainties in two ways. First, the Var- term inEquation 14 changes in direct proportion to the ratio be-tween the data uncertainty and the temperature range ofthe experiments. Second, extending the calibration to in-clude crustally accessible P-7 space ensures that the uni-variant reaction has been fitted near the conditions atwhich it will be used, reducing extrapolation errors. Al-though low-temperature experiments can be extremelytime-consuming, their practical value is significant.
It is also apparent from Figure 4 that no P determi-nation can be better than the bracketing uncertainty ofthe calibration data. In the limit where both the numberand P-T range of the calibration experiments becomelarge, Equation 13 shows that
lim(Vareo) : (1.4s"), * M2(1.4s,\2
- 2pyyM(|.4s,)(1.4s,). (15)
For many experimental calibrations, bracketing uncer-tainies are - 100 MPa and make a major contribution tothe overall uncertainty of the thermobarometer. Clearly,a conscientious effort to reduce these uncertainties is oneof the surest and most cost-effective ways to improve theaccuracy of thermobarometry.
For comparative thermobarometry involving a single
pair of equilibria, the systematic errors associated withthe calibrations cancel, leaving only the effects ofanalyt-ical uncertainties (Fig. 2). Carefully analyzed samples yield2s precision limits for Rl-R3 equilibria sufficient to dis-tinguish between equilibration conditions differing by aslittle as 70 K or 70 MPa. Thus, comparative thermoba-rometry is a statistically valid means of studying tectonicprocesses on length scales exceeding 3 to 5 km.
AcrNowr,rlcMENTS
We would like to thank Steve Bohlen for useful discussions concemingthe precision ofexperimental apparatus, Dave Gutzler for an invaluablereview of the statistics, Peter Tilke for providing computational insights,and Jane Selverstone and Jim Munoz for reviews ofthe entire text. Thiswork was supported by National Science Foundation Grants EAR 83 19768and EAR 8407730.
RnrrnnNcnsAnderson, G.M. (1976) Error propagation by the Monte Carlo method in
geochemical calculations Geochimica et Cosmochimica Acta, 40, 1533-I 538 .
- (1977 a) Uncertainties in calculations involving thermodynamicdata. In H.J. Greenwood, Ed, Short course in application ofthermo-dynamics to petrology and ore deposits, p. 199-215 Mineralogical As-sociation of Canada.
-(1977b) The accuracy and precision of calculated mineral dehy-dration equilibria. In D.G. Fraser, Ed., Thermodynamics in geology,p 135-136 NATO Advanced Studies Institute, Series C, Reidel, Bos-ton
Bohlen, S.R., Wall, V.J , and Boettcher, A L. (1983) Experimental inves-tigations and geological applications of equilibria in the system FeO-TiOr-AlrO3-SiOr-HrO American Mineralogist, 68, 1049-l 058.
Carpenter, M.A., and Putnis, A. (1986) Cation order and disorder duringcrystal growth: Some implications for natural mineral assemblages. InA B Thompson and D.C. Rubie, Eds , Metamorphic reactions, kinet-ics, textures and deformation, p. l-26. Spnnger-Verlag, New York.
Draper, N.R., and Smith, H. (1966) Applied regression analysis. Wiley,New York.
Essene, E J. (1982) Geologic thermometry and barometry. MineralogicalSociety of America Reviews in Mineralogy, 10, 153-206
Eugster, H.P., Albee, A.L., Bence, A.E., Thompson, J B , and Waldbaum,DR (1972) The two phase region and excess mixing properties ofparagonite-muscovite crystalline solutions. Journal of Petrology, 13,t47 - t79.
Ferry, J M (1980) A comparative study ofgeothermometers and geoba-rometers in pelitic schists from southem-central Maine. AmericanMineralogist, 65, 7 20-7 32
Ferry, J.M., and Spear, F.S. (1978) Experimental calibration ofthe par-titioning of Fe and Mg between biotite and garnet. Contributions toMineralogy and Petrology, 66, ll3-l l '7.
Ganguly, J., and Kennedy, G.C. (1974) The energetics ofnatural gametsolid solution L Mixing of the aluminosilicate end-members. Contri-butions to Mineralogy and Petrology, 48,137-148.
Ganguly, J , and Saxena, S K (1984) Mixing properties ofaluminosilicategarnets: Constraints from nalural and experimental data, and applica-tions to geothermo-barometry. American Mineralogist, 69, 88-97 .
Ghent, E.D., Robbins, D B, and Stout, M.Z. (1979) Geothermometry,geobarometry, and fluid compositions of metamorphosed calc-silicatesand pelites, Mica Creek, British Columbia American Mineralogist, 64,874-885.
Ghent, E.D., Knitter, C.C, Raeside, R.P., and Stout, M.Z. (1982) Geo-thermometry and geobarometry of pelitic rocks, upper kyanite and sil-limanite zones, Mica Creek area, British Columbia. Canadian Miner-alogist, 20, 295-305
Goldsmith, J.R. (1980) Melting and breakdown reactions of anorthite athigh pressure and temperatures. American Mineralogrst, 65,272-284.
Hariya, Y., and Kennedy, G C. (1968) Equilibrium study of anorthite

680 HODGES AND MCKENNA: UNCERTAINTIES IN THERMOBAROMETRY
under high temperature and high pressure American Journal of Sci-ence, 266, 193-203
Hays, J F. (1966) Lime-alumina-silica. Carnegie Institution of Washing-ton Year Book 65, 234-239
Hodges, K.V, and Crowley, P. (1985) Error estimation and empiricalgeothermobarometry for pelitic systems American Mineralogist, 70,702-709.
Hodges, K.V., and Royden, L. ( 1984) Geologic thermobarometry of retro-graded metamorphic rocks: An indication of the uplift trajectory of aportion of the northem Scandinavian Caledonides. Journal of Geo-physical Research, 89, 7 07 7 -7 090
Hodges, KV., and Spear, F.S. (1981) Geothermometry, geobarometry,garnet closure temperatures and the AlrSiO, triple point, Mt. Moosi-lauke, New Hampshire (abs.). EOS, 62, 1060.
-(1982) Geothermometry, geobarometry and the AlrSiOs triple pointat Mt Moosilauke, New Hampshire. American Mineralogist, 67, I I 18-I 134 .
Holdaway, MJ (1971) Stability ofandalusite and the aluminosilicatephase diagram. American Journal of Science, 27 l, 97 -l 3 l.
Hollister, L.S. ( I 979) Metamorphism and crustal displacements: New in-sights. Episodes, 3, 3-8
Johannes, W. (1978) Pressure comparing experiments with NaCl, AgCl,talc and pyrophyllite assemblies in a piston cylinder apparatus. NeuesJahrbuch fiir Mineralogie Monatshefte, 2, 8+92.
Johannes, W , Bell, P.M., Mao, H.K., Boettcher, A.L, Chipman, D.W.,Hays, J.F, Newton, R.C., and Seifen, F (1971) An interlaboratorycomparison of piston-cylinder pressure calibration using the albitebreakdown reaction. Contributions to Mineralogy and Petrology, 32,24-38.
Labotka, T.C. (1980) Petrology of a medium-pressure regional metamor-phic terrane, Funeral Mountains, Califomia. American Mineralogist,65. 670-689.
Lang, H M., and Rice, J M (1985) Geothermometry, geobarometry and7-X (Mg-Fe) relations in metapelites, Snow Peak, Northern Idaho.Journal of Petrology, 26, 889-924
Larsen, RJ., and Marx, M.L. (1981) An introduction to mathematicalstatistics and its applications Prentice-Hall, Englewood Cliffs, NewJersey.
Loomis, T.P. (1976) Irreversible reactions in high-grade metamorphicrocks. Journal ofPetrology, 17, 559-588.
-(1983) Compositional zoning of crystals: A record of growth and
reaction history In S K Saxena, Ed, Kinetics and equilibrium in min-
eral reactions, p l-60 Springer-Verlag, New YorkNewton, R.C, and Haselton, H T (l 98 l) Thermodynamics of the garnet-
plagioclase-AlSiorquartz geobarometer In R.C. Newton et al , Eds.,
Thermodynamics of minerals and melts, p 13l-147. Springer-Verlag,New York.
Newton, R C., Charlu, T.V., and Kleppa, O.J (1977) Thermochemistryof high pressure gamets and clinopyroxenes in the system CaO-MgO-Al,O3-Sior. Geochimica et Cosmochimica Acta, 41, 369-37 7.
Powell, R. (1985) Geothermometry and geobarometry: A discussionGeological Society of London Journal 142, 29-38
Robie, R.A., Hemingway, B.S, and Fisher, J.R. (1978) Thermodynamicpropenies of minerals and related substances at 298.13 K and I bar(105 pascals) pressure and at higher temperatures. U.S. Geological Sur-vey Bulletin 1452.
Schmid, R., Cressey, G, and Wood, B.J. (1978) Experimental determi-nation of univariant equilibria using divariant solid solution and as-
semblages American Mineralogist, 63, 5l l-515.Selverstone, J. (1985) Petrologic constraints on imbrication, metamor-
phism, and uplift in the SW Alps, Tauern Window, eastem Alps Tec-
tonics,4, 686-704.Smith, D.G W , Ed. (1976) Short course in microbeam techniques Min-
eralogical Association ofCanada, 186 p-
Steltenpohl, M , and Bartley, J.M. (1984) Statistical evaluation of P-7
trajectories based on elemental partitioning geothermometers and geo-
barometers Geologic Society of America Abstracts with Programs, 16,667.
Tracy, RJ., and Robinson, P. (1980) Evolution of meumorphic belts:Information from detailed petrologic studies. In D.J. Wones, Ed., The
Caledonides in the USA, 189-195. Virginia Polytechnic Institute andState University, Memoir 2.
Tracy, R J., Robinson, P, and Thompson, A.B. (1976) Garnet compo-sition and zoning in the determination oftemperature and pressure ofmetamorphism, central Massachusetts American Mineralogist, 61, 7 62-775
York, D. (1969) Least-squares fitting of a straight line with correlatederrors Earth and Planetary Science Letters, 5,320-324.
M.Lruscnrpr RECEIvED SerrsMspR 29, 1986Mexuscnrpr ACcEPTED APnlr- 3, 1987