real-time underwater 3d scene reconstruction … anwer-msc_thesis.pdf · real-time underwater 3d...
TRANSCRIPT


REAL-TIME UNDERWATER 3D SCENE RECONSTRUCTION USING
KINECT V2 TIME OF FLIGHT CAMERA
by
ATIF ANWER
A Thesis
Submitted to the Postgraduate Studies Program
as a Requirement for the Degree of
MASTER OF SCIENCE
ELECTRICAL AND ELECTRONIC ENGINEERING
UNIVERSITI TEKNOLOGI PETRONAS
BANDAR SERI ISKANDAR
PERAK
NOVEMBER 2017

v
DEDICATION
To my (late) mother and father, who’s love, prayers, efforts, wishes, wisdom and
support has made me into what and where I am today
To my brother, who’s words of motivation have encouraged me to pursue my
dreams
To my wife, who has supported me through times thick and thin

vi
ACKNOWLEDGEMENTS
In the name of Allah, the Most Beneficent and the Most Merciful. I would like to
thank Almighty Allah for giving me strength and resolve to accomplish this work with
due diligence and determination.
I would like to express my utmost gratitude to my supervisor, Dr Syed Saad Azhar
Ali, for his guidance, support and encouragement during my research. I am also
grateful for his never-ending dedication, motivation and cooperation throughout this
period.
I wish to express my sincere appreciation to my co-supervisor Prof. Fabrice
Mériaudeau, for all the invaluable suggestions, encouragement and enlightening
discussions throughout this time. I am grateful to him for enhancing my analytical
and research skills through his valuable advice and wisdom.
I am also thankful to all faculty members, colleagues and friends at Centre for
Intelligent Signal and Imaging Research (CISIR) for their support. Special mention
and thanks are due towards Dr Khurram Altaf, Amjad Khan, Abul Hassan, and
Sadam Shareen Abbasi for their help and support throughout this period.
Last, but certainly not the least, I would like to thank my parents, brother, wife,
friends and colleagues for their patience, never ending moral support and
encouragement during my study at UTP.

vii
ABSTRACT
Underwater 3D scene reconstruction is used to generate topographic maps and 3D
visualizations of sub-sea geological features and man-made structures. 3D
visualization provides the ability to easily envisage the environment beneath the water
line. However, underwater environment offers challenging conditions for 3D scene
reconstruction. Most of the existing solutions in use, such as LIDAR’s and sonars, are
specialized marine hardened equipment that are costly, bulky and are unable to
provide real time data processing.
This work presents the use of Microsoft Kinect, a commercial RGB-D camera,
for a small scale, economical and real-time underwater 3D scene reconstruction.
Kinect is operated while operating fully submerged underwater in a customized 3D
printed waterproof housing, and able to successfully acquire data at distances between
350 mm to 650 mm. RGB and Infrared cameras are calibrated, and the acquired time
of flight data is processed to cater for the errors in depth calculation due to the change
of imaging medium. A noise filter is applied to remove the noise in the point cloud
data, without significant loss of features. To accommodate the effects of refraction
due to the sensor housing and water, a fast, accurate and intuitive ray-casting based
refraction correction method has been developed that is applied to point clouds during
3D mesh generation. A software implementation including the noise filter, camera
calibration, time of flight and refraction correction algorithms has been developed
adapting Kinect Fusion SDK for underwater data processing. Data acquisition
experiments were done in controlled environments with both clear and turbid water
and a mean error of ±6 mm with an average stand deviation of 3 mm is achieved. A
complete dataset consisting of underwater 3D scans of objects has been developed
and released publicly. Areas such as coral reef mapping and underwater localization
and mapping for a robotic solution in shallow waters can benefit from the results
achieved by this research.

viii
ABSTRAK
Pembinaan semula pemandangan 3 dimensi (3D) bawah air digunakan untuk
menjana peta topografi dan visualisasi 3D ciri-ciri geologi dan struktur buatan
manusia bawah laut. Visualisasi 3D memberikan keupayaan untuk mudah
membayangkan persekitaran di bawah garisan air. Walaubagaimanapun, persekitaran
bawah air merupakan persekitaran yang mencabar bagi imbasan dan pembinaan
semula pemandangan 3D.
Kajian ini membentangkan penggunaan Microsoft Kinect, kamera komersial
RGB-D, untuk masa sebenar berskala kecil pemandangan 3D objek bawah air dan
imbasan 3D. Kinect beroperasi dengan cara merendamkannya di dalam air secara
penuh. Ia dilengkapi dengan perumah kalis air yang direka dan dihasilkan dengan
cetakan 3D dan mampu untuk memperolehi data pada jarak antara 350mm hingga
650mm dengan jayanya. Kamera RGB dan infra merah dikalibrasi, dan masa
pergerakan isyarat data diproses untuk menangani ralat dalam pengiraan kedalaman
yang disebabkan oleh perubahan medium pengimejan. Penapis hingar diaplikasikan
bagi menyingkirkan hingar data awan titik tanpa kehilangan banyak ciri penting.
Untuk menampung kesan pembiasan disebabkan oleh perumah penderia dan air,
kaedah pembetulan pembiasan berasaskan ray-casting yang cepat, tepat dan intuitif
telah dibangunkan yang digunakan untuk menunjuk awan semasa penjanaan mesh
3D. Pelaksanaan perisian termasuk penyaring hingar, penentukuran kamera, masa
pergerakan isyarat dan algoritma pembetulan pembiasan telah dikembangkan
menyesuaikan Kinect Fusion SDK untuk pemprosesan data bawah air. Eksperimen
pemerolehan data dilakukan dalam persekitaran terkawal dengan air yang jelas dan
keruh dan min ralat ± 6 mm dengan sisihan standard purata 3mm dicapai. Satu dataset
lengkap yang terdiri daripada imbasan 3D bawah air objek telah dibangunkan dan
dikeluarkan secara terbuka. Kawasan pemetaan terumbu karang dan pemetaan bawah
air dan pemetaan untuk penyelesaian robotik di perairan cetek boleh mendapat
manfaat daripada hasil yang dicapai oleh penyelidikan ini.

ix
In compliance with the terms of the Copyright Act 1987 and the IP Policy of the university, the copyright of this thesis has been reassigned by the author to the legal entity of the university,
Institute of Technology PETRONAS Sdn Bhd.
Due acknowledgement shall always be made of the use of any material contained in, or derived from, this thesis.
© Atif Anwer, 2017
Institute of Technology PETRONAS Sdn Bhd
All rights reserved.

x
TABLE OF CONTENT
ABSTRACT ........................................................................................................... vii
ABSTRAK ............................................................................................................ viii
TABLE OF CONTENT ............................................................................................. x
LIST OF FIGURES ............................................................................................... xiii
LIST OF TABLES ............................................................................................... xvii
LIST OF ABBREVIATIONS .............................................................................. xviii
LIST OF SYMBOLS .............................................................................................. xix
INTRODUCTION .......................................................................... 1
1.1 Background .................................................................................................. 1
1.2 3D Scanning and Scene Reconstruction for Underwater Applications ......... 4
1.3 Problem Statement ........................................................................................ 6
1.4 Hypothesis .................................................................................................... 7
1.5 Motivation .................................................................................................... 8
1.6 Research Objectives, Impact and Contributions ........................................... 8
1.7 Scope of work ............................................................................................... 9
1.8 Thesis Organization ...................................................................................... 9
DEPTH SENSING AND 3D SCENE RECONSTRUCTION IN
UNDERWATER ENVIRONMENT ........................................................................ 11
2.1 Overview .................................................................................................... 11
2.2 Overview of Depth Sensing Techniques ..................................................... 11
2.3 Light in Underwater Environment .............................................................. 14
2.3.1 Attenuation, Absorption and Scattering of Light in Water ................ 15
2.3.2 Refractive Index and Its Adverse Effects on Underwater Imaging ... 18
2.3.3 Effect of Water Salinity and Temperature on Light Transmission .... 21
2.4 Optical Depth Imaging and 3D Reconstruction in Underwater ................... 21
2.4.1 Structured Light Cameras ................................................................. 24
2.4.2 Time of Flight Depth Sensors ........................................................... 25
2.4.3 RGB-D Cameras ............................................................................... 26
2.4.3.1 RGB-D Cameras in Underwater Environment ...................... 29
2.5 Detailed Overview of Kinect RGB-D Sensors ............................................ 30
2.5.1 Kinect for Xbox 360 (KinectSL) ........................................................ 31

xi
2.5.2 Kinect for Xbox One (KinectToF) ...................................................... 32
2.5.3 Comparison of Kinect Devices ......................................................... 34
2.5.4 3D Scene Reconstruction Using Kinect Fusion ................................ 39
2.5.4.1 Brief Working of Kinect Fusion ........................................... 39
2.5.4.2 Tracking Performance and Reconstruction Volume ............. 41
2.5.5 3D Reconstruction Algorithms for RGB-D sensors .......................... 43
2.6 Proposed Methodology .............................................................................. 46
2.7 Summary .................................................................................................... 48
WATERPROOF CASING DESIGN AND DATA PROCESSING
PIPELINE FOR UNDERWATER 3D DATA ......................................................... 49
3.1 Overview .................................................................................................... 49
3.2 Design and Prototyping of Waterproof Housing ........................................ 49
3.2.1 Transparent Material Selection ......................................................... 50
3.2.2 Casing Structural and Sealing Design .............................................. 53
3.2.3 3D Printing Considerations .............................................................. 56
3.2.4 Structural Analysis of Designed Housing ......................................... 57
3.3 Refraction Correction and distortion removal in Underwater 3D Data ....... 60
3.3.1 Kinect RGB and Depth Camera Underwater Calibration ................. 60
3.3.1.1 Camera Calibration Concepts ............................................... 60
3.3.1.2 Underwater Calibration of Kinect Cameras.......................... 65
3.3.2 Time of Flight Correction in Underwater Environment .................... 66
3.3.3 Distortion Removal for ToF Camera in Underwater Medium .......... 69
3.3.3.1 Refraction Correction of Depth Data in Underwater ............ 69
3.3.3.2 Pincushion Distortion Removal in Depth Images ................. 76
3.3.4 3D Point Cloud Noise Filtering in Turbid Medium .......................... 77
3.3.5 Customized Kinect Fusion Implementation ...................................... 79
3.3.6 Qualitative & Quantitative Performance Criteria for 3D Meshes ..... 83
3.4 Experimental Setup .................................................................................... 85
3.4.1 KinectToF Underwater Dataset and Selection of Test Objects ........... 86
3.4.2 Uncorrected RGB, IR and Depth Images from Submerged Kinect ... 90
3.4.3 KinectToF RGB and IR Camera Calibration ...................................... 91
3.4.4 Real-Time Data Collection, Scanning Rate and Parameters ............. 93
3.5 Summary .................................................................................................... 94

xii
RESULTS AND DISCUSSION ................................................... 95
4.1 Overview .................................................................................................... 95
4.2 Performance of KinectToF Sensor in Underwater Environment ................... 95
4.2.1 Kinect Depth Camera Performance in Underwater Environment ...... 96
4.2.2 Camera Calibration and Distortion Correction Results ..................... 98
4.2.3 Effect of Colour and Material of Scanned Objects ............................ 99
4.3 Qualitative and Quantative Performance Evaluation ................................ 101
4.3.1 3D Reconstruction in Water by Unfiltered Kinect Fusion ............... 103
4.3.2 3D Reconstruction Results after Camera Calibration ...................... 104
4.3.3 3D Reconstruction Results after Median Filtering .......................... 105
4.3.4 3D Reconstruction Results after ToF and Refraction Corrections ... 106
4.4 Comparison with Existing Methods .......................................................... 113
4.5 Summary .................................................................................................. 114
CONCLUSION AND FUTURE WORK .................................... 116
5.1 Contributions ............................................................................................ 117
5.2 Limitations and Future Work .................................................................... 117
5.3 List of Publications ................................................................................... 119
BIBLIOGRAPHY ................................................................................................. 128
APPENDICES
A. Housing Design Drawings
B. Brief Description and Working of Kinect Fusion Interface

xiii
LIST OF FIGURES
Figure 1.1: Areas in which underwater 3D imaging is being used extensively such
as sub-sea surveys [3], coral reef preservation [4] and maintenance
[5], underwater robotics [6] etc. ............................................................ 2
Figure 1.2: Autonomous [6] and semi-autonomous [9] robotic exploration .............. 3
Figure 2.1: Taxonomy of depth measurement methods (expanded version of the
one proposed by Lachat et al. [15]) ..................................................... 13
Figure 2.2: Spectral distribution of the electromagnetic spectrum .......................... 14
Figure 2.3: Absorption coefficient for light wavelengths in water at 20° C [17] ..... 16
Figure 2.4: Image taken of spectral (right) and fluorescent (left) colour paint
samples taken (a) outside water (b) underwater at a depth of 60 m ..... 18
Figure 2.5: Refractive index of water variation with temperature [16] ................... 20
Figure 2.6: Popular techniques of active optical 3D imaging .................................. 22
Figure 2.7: 3D scene reconstruction process overview ........................................... 23
Figure 2.8: KinectSL and its internal structure [52] .................................................. 32
Figure 2.9: KinectToF and its internal structure [54] ................................................ 33
Figure 2.10: The 3D image sensor system of KinectToF [55] ................................... 33
Figure 2.11: Kinect measured depth vs actual distance ........................................... 35
Figure 2.12: Kinect Fusion overall workflow as given by Newcombe et al [65] ..... 40
Figure 2.13: ICP for aligning point clouds acquired by Kinect ............................... 40
Figure 2.14: A cubic volume is subdivided into a set of voxels which are equal in
size and defined per axis. [66]. ............................................................ 43
Figure 2.15: Workflow for generating real-time 3D meshes from Kinect sensor,
in under water environment. Coloured blocks are the contributions
of this research. ................................................................................... 47
Figure 3.1: Transmission percentage of different wavelengths of light through
3mm Acrylic [74]. The red band is NIR wavelength used by
KinectToF ............................................................................................. 51
Figure 3.2: 3D mesh reconstruction results in open air through various
thicknesses of Perspex (a) Original scene (b) No Perspex (c) 2mm
(d) 3mm (e) 5mm (f) 8mm .................................................................. 53

xiv
Figure 3.3: Cable gland design (a) Exploded view (b) Cross-section view .............. 54
Figure 3.4: Designed housing assembly (a) housing only (b) housing with
KinectToF (c) exploded view of the assembly ....................................... 55
Figure 3.5: Zoomed in view of the porosity between fused 3D printed layers due
to FDM process .................................................................................... 56
Figure 3.6: (a) Increasing pressure exerted on a submerged object in water (b)
simulated linear relationship of pressure in water and depth ................ 57
Figure 3.7: Structural strength analysis of the designed KinectToF housing (a) Von
Mises stress distribution (b) displacement due to pressure (c) 1st
principle stress (d) 3rd principle stress (e) Safety factor results ............ 58
Figure 3.8: Structural strength analysis of the designed cable gland (a) Inside
edge Von Mises Stress distribution (b) Outside surface Von Mises
Stress distribution (c) Inside edge displacement due to pressure (d)
Outside surface Displacement due to pressure ..................................... 59
Figure 3.9: Camera calibration process.................................................................... 61
Figure 3.10: Types of distortion in an image [76] .................................................... 64
Figure 3.11: Pictures of (a) black and white calibration checkerboard and (b)
colour checkerboard taken underwater from the Kinect RGB camera.
............................................................................................................. 66
Figure 3.12: Calculating the corrected time of flight values .................................... 68
Figure 3.13: Simulated depth distance (mm): measured (red) vs actual (blue) ........ 68
Figure 3.14: Formation of virtual image at due to refraction ................................... 70
Figure 3.15: Calculating refraction of a ray of light for two materials resulting in
a shift in perceived depth ..................................................................... 71
Figure 3.16: Spherical to image coordinate conversion ........................................... 73
Figure 3.17: Projections of a depth point on the Kinect sensor image plane ............ 74
Figure 3.18: Methodology to trace the light ray path for each depth pixel .............. 74
Figure 3.19: (a) Bottom plane (blue) is the simulated curved point cloud whereas
the top (yellow) is the refraction corrected point cloud (b) A plot of
the calculated error distance that grows larger error as the distance
from central axis increases. .................................................................. 75
Figure 3.20: Front and left views of acquired noisy point cloud .............................. 78

xv
Figure 3.21: The main user interface and sub-windows .......................................... 80
Figure 3.22: Kinect Fusion implementation flowchart (Kinect Fusion SDK
function names are written in red) (Page 1) ......................................... 81
Figure 3.23: Kinect Fusion implementation flowchart (Kinect Fusion SDK
function names are written in red) (Page 2) ......................................... 82
Figure 3.24: Qualitative analysis comparison process ............................................. 83
Figure 3.25: (a) Target point cloud (green) and reference point cloud (yellow)
(b) finding the distances of the point clouds (c) error heat map ........... 85
Figure 3.26: Experimental setup for data acquisition at swimming pool and
offshore experiment facility at UTP .................................................... 86
Figure 3.27: Raw images captured from KinectToF cameras under water (a) RGB
(b) depth (c) infrared ........................................................................... 91
Figure 3.28: Infrared camera calibration underwater (a) original images (b)
enhanced IR images (c) calibration images used to calculate the
parameters ........................................................................................... 92
Figure 4.1: Reported vs actual depth of KinectToF in underwater environment ....... 96
Figure 4.2: Original depth data reported by KinectToF ............................................. 97
Figure 4.3: RGB camera calibration results in air and under water (a) focal length
and principal axis values (b) distortion coefficients ............................ 98
Figure 4.4: IR camera calibration results in air and under water (a) focal length
and principal axis values (b) distortion coefficients ............................ 99
Figure 4.5: IR image (a) original (b) undistorted using calibration parameter ...... 100
Figure 4.6: Dense vs sparse point cloud under water ............................................ 101
Figure 4.7: Steps for 3D mesh generation in underwater environment .................. 102
Figure 4.8: (a) RGB image of scene (b) 3D reconstruction by Kinect Fusion only
.......................................................................................................... 103
Figure 4.9: (a) 3D reconstruction by Kinect Fusion only (b) Mesh after applying
camera calibration ............................................................................. 104
Figure 4.10: Noise filtering results (a) results after camera calibration (b) mesh
after noise filtering ............................................................................ 105
Figure 4.11: ToF and refraction correction results (a) mesh with median filter (b)
mesh after applying ToF and refraction correction ............................ 106

xvi
Figure 4.12: Alignment error maps of 3D reconstructed mesh of a submerged
swimming pool wall compared with an ideal plane, showing the
refraction correction results. green represents 0 mm error, red
represents ≥ +20 mm error, blue represents ≥ -20mm error. (From
Left to right: Ideal reference plane, original Kinect Fusion mesh,
after camera calibration, after median filtering, ToF and refraction
corrected mesh) .................................................................................. 108
Figure 4.13: Results of RGB mapping on the generated 3D mesh (a) RGB image
acquired (b) 3D reconstructed scene (c) colour mapped mesh ........... 109

xvii
LIST OF TABLES
Table 1.1: Comparison of popular underwater 3D depth sensing techniques ............ 5
Table 2.1: Comparison of popular RGB-D sensors ................................................. 28
Table 2.2: Summary of previous work on RGB-D sensors under water .................. 30
Table 2.3: Specification comparison of KinectSL and KinectToF .............................. 36
Table 2.4: Previous work done on characterizing KinectToF properties ................... 37
Table 2.5: Summary of related work done on scene reconstruction and mapping ... 44
Table 3.1: Stress analysis simulation results summary ............................................ 60
Table 3.2: Measured vs actual distance measured by Kinect under water ............... 69
Table 3.3: Visual parameters for qualitative analysis .............................................. 83
Table 3.4: Objects selected for scanning and their characteristics ........................... 89
Table 4.1: RGB camera calibration results in air and underwater ........................... 98
Table 4.2: IR camera calibration results in air and underwater ............................... 99
Table 4.3: Effect of colour and material of objects on underwater NIR scanning . 100
Table 4.4: Front/side view of 3D reconstructed submerged swimming pool wall . 107
Table 4.5: Additional object scan results in different conditions........................... 110
Table 4.6: Error heat maps and gaussian distribution of error histogram of various
objects scanned underwater. Objects scanned are compared to original
3D CAD model as well as with the 3D printed model scanned with
KinectToF in the air ............................................................................... 111
Table 4.7: Summary of comparison with similar work ......................................... 113

xviii
LIST OF ABBREVIATIONS
AUV Autonomous Underwater Vehicle
ROV Remotely Operated Vehicles
LIDARs Light Detection and Ranging sensors
SL Structured Light
ToF Time of Flight
KinectSL Kinect v1 (Kinect for Xbox 360)
KinectToF Kinect v2 (Kinect for Xbox One)
IR Infrared
NIR Near InfraRed
VPM Voxels Per Meter
IP Ingress Protection
FOV Field of view
ABS Acrylonitrile Butadiene Styrene
PLA Poly Lactic Acid
FDM Fused Deposition Modelling
ICP Iterative Closes Point
COTS Commercial off-the-shelf
FPS Frames per second

xix
LIST OF SYMBOLS
I Irradiance
k Attenuation coefficient
a(λ) Absorption coefficient
b(λ) Scattering coefficient
λ Wavelength
f Focal length
c Speed of light
ν Velocity
η Index of refraction
θ, ϕ Angles
t Time
r Radial distance
d Depth distance
fmod Frequency of modulation
px Pixel
vpm Voxel per meter
Γ Transmittance
P Pressure
atm Atmospheric pressure
K Intrinsic matrix
R Rotation matrix
T Translation matrix
x Uncorrected coordinates on projection plane in x-axis
y Uncorrected coordinates on projection plane in y-axis
z Scale factor
X Coordinates in real world along x-axis
Y Coordinates in real world along y-axis
Z Coordinates in real world along z-axis
q Principal point
γ Skew coefficient

xx
m Pixel coordinates in x-axis
n Pixel coordinates in y-axis
x’ Undistorted coordinates on projection plane in x-axis
y’ Undistorted coordinates on projection plane in y-axis
p Tangential distortion coefficients
α, β, χ Radial distortion coefficients of lens
ζ Linear scaling of image
shiftd Shift in depth
σ Standard deviation

1
INTRODUCTION
1.1 Background
Approximately 70% of the earth surface is submerged under water and hence is of
immense interest to researchers, scientists and engineers for identifying, exploring
and understanding the planet earth and its diverse ecosystems. Unfortunately, being
submerged in immense depths most of which are yet to be fully explored, access to
these rich ecosystems poses an enormous challenge, inhibiting detailed exploration
and understanding. Efforts have been done since time immemorial to map the
uncharted seas and explore the treasures hidden beneath the vast ocean surface. With
the advent of revolutionary maritime technologies such as diving gear and
submarines, particularly in the 14th and 15th century by Leonardo Da-Vinci, access to
sub-sea environment was pioneered, stirring a renewed interest in understanding
surfaces beneath lakes and oceans and its wonders. Cartographers developed sub-sea
topographic mapping techniques known as bathymetry, to map the geological and
geographical features. Maritime maps of busy harbours and sea shores were
imperative for the development and extension of widespread maritime navigation and
trade activities between nations around the world.
As naval technologies for navigation and mapping improved, it resulted in
vastness and accuracy of these bathymetric maps. Discovery of vibrant ecosystems of
sub-sea life such as coral reefs, particularly in the late 17th century, led to detailed
mapping to study these wonders of nature. Coral reefs are fragile ecosystems, partly
because they are susceptible to water temperature and are under threat from climate
change, oceanic acidification, blast fishing, overuse of reef resources and harmful
land-use practices, including urban and agricultural runoff and water pollution, which

2
can harm reefs by encouraging excess algal growth. Preservation of these wonders of
nature requires the creation of accurate maps of reefs and surrounding areas [1], so
the lost or damaged reefs can be re-grown in their original grandeur and beauty.
With the growth of human civilization, maritime activities in deep seas required
greater understanding of the sub-sea bed rock for safe and efficient sea travel, mostly
to promote trade between nations. As these activities continued to increase, the
discovery of submerged ancient archaeological sites of civilizations of past, as well
as discovery of previously undocumented shipwrecks took the scientific and historian
community by storm. Understanding and recording these discoveries gave precious
insight of past civilizations and the evolution of human civilization itself. With the
advent of electronics devices and sensors, a significant rise has been seen in the speed
and accuracy of underwater maps. As summarized in figure 1.1, discovery and
exploration of geological structures such as hydrothermal vents, coral reefs, along
with study of oil pipeline inspections [2], offshore structure maintenance, shipwrecks
and a relatively newer phenomenon of aircraft crash exploration has benefited
extensively with modern imaging and mapping technologies.
Figure 1.1: Areas in which underwater 3D imaging is being used extensively such as
sub-sea surveys [3], coral reef preservation [4] and maintenance [5], underwater
robotics [6] etc.

3
Standard bathymetric maps are also being augmented into 3D visualizations as
the technology for 3D imaging started to rise to a commonplace level. Since the late
20th century, Remotely Operated Vehicles (ROV’s) as well as Autonomous
Underwater Vehicles (AUV’s) are being used extensively used in underwater
exploration missions, like the ones shown in figure 1.2. These vehicles carry a host
of sensors as well as multiple imaging devices to provide real-time as well as recorded
visual feedback to the operators. This data is often of critical importance for various
applications such as health monitoring and inspection of underwater man-made
structures such as oil-rigs, as well as for maintaining an updated record of
archaeological sites and health monitoring of coral reefs. Enabling data acquisition
especially for visual servoing [7] in real time is extremely important for agile and
autonomous navigation of robots as discussed by [2] and [8] for unknown and
unstructured environments. 3D mapping data in real time provides active perception
that is required for path-planning, localisation as well as control purposes, especially
in the absence of or for augmenting inertial navigation.
Figure 1.2: Autonomous [6] and semi-autonomous [9] robotic exploration
3D scanning and reconstruction is also being used extensively for ship hull
inspection, mapping the coral reefs, archiving archaeological sites [10], preserving
and analysing sunken ships [11] and war-planes, etc. Historical preservation is one of
the key attributes of mankind that enables a permanent record for the generations to
come so that they can learn from their past. Preservation or history and ecosystems

4
like the coral reefs is a big responsibility for each generation of scientists and
engineers. 3D data also provides useful insight on various factors of the unobservable
environment, aiding in sometimes critical decisions as well as aiding in preventive
maintenance before any critical failure occurs.
1.2 3D Scanning and Scene Reconstruction for Underwater Applications
3D scanning and scene reconstruction is a technique to digitize real world objects and
surfaces into 3-dimensional graphical models or meshes. These 3D models can then
be used for various applications, ranging from generating prototyping, record
preservation, maintenance and inspection or for the use in modern entertainment
applications such as Augmented Reality (AR) or Virtual Reality (VR). For
engineering and industrial applications, it enables qualitative and quantitative analysis
of the objects by comparison to the original design intent and verify the product; post-
production or after passage of certain time of usage in its real environment. The latter
is especially true in harsher environments such as underwater, where changes such as
erosion, rusting, and other deteriorating effects due to weather and surrounding
conditions are common. The acquisition of the geometric description of a dynamic
scene has always not only been a very challenging task but it is a compulsory
requirement for robotics, where the robot must know the description of the
environment in order to actively and safely perform its duties, especially in tandem
to human operators and co-workers.
3D scanning or scene reconstruction can be done by either contact or non-contact
data collection techniques. Contact based techniques such as a Coordinate Measuring
Machine (CMM) use physical contact with the object for precise measurement,
whereas non-contact scanning techniques use some form of active scanning with
sonars, ultrasound, x-ray or optical imaging in different wavelengths of light. As
contact sensing requires the object to be approachable and preferably isolated, it
cannot be used as a flexible solution for in-place measurement of objects. Non-contact
methods provide the benefit of scanning the objects in-place; in their original

5
environment. This is much more beneficial for inspection, maintenance and
preservation activities where moving the object is not a feasible solution.
Nowadays, 3D scanning is being utilized much more regularly due to significant
advancement of 3D depth sensing techniques such as stereo imaging, depth sensors
such as sonar’s, Light Detection and Ranging sensors (LIDARs) and commercial
depth cameras. For underwater applications, 3D scanning and volumetric
reconstructions from non-contact sensors are being used extensively for ship hull
inspection [12], mapping the coral reefs, scanning underwater terrain, sunken ships
and war-planes just to name a few. Except for camera based stereo imaging, the
specialized more expensive marine hardened solutions provide long range 3D scene
reconstruction using offline processing of prior collected data. RGB cameras (in
monocular or stereo or multiple configurations) offer methods for real time 3D
reconstruction in underwater environment, but are heavily dependent on presence of
ambient or artificial lighting and have limited range due to the properties of light
propagation in water. To acquire detailed underwater maps of areas of interest, a
detailed 3D scene is reconstructed generally using stationary equipment, divers and
autonomous or semi-autonomous robotic vehicles (AUV’s). However, underwater
environment itself offers a unique challenge for mapping and 3D scene construction
of both geological or man-made underwater structures. A brief comparison of the
various types of depth sensors used for underwater 3D scanning is given in table 1.1.
Table 1.1: Comparison of popular underwater 3D depth sensing techniques
Property LIDAR Sonar RGB Imaging Range >40m >30m Typically, a few meters
(depends on turbidity of water) Spatial resolution High Medium Medium
Effect of temperature
Not affected
Greatly affected
Nil
Ambient light Not affected
Not affected Highly dependent

6
3D scanning requires state-of-the-art sensing and instrumentation technologies
that were only available to research labs or major conglomerates until recently. With
the release of commercial Depth sensors in the mid-late 2000’s changed this
drastically. Low-cost depth sensors based on Structured Light (SL) and Time of Flight
(ToF) technologies emerged in the hobbyist and commercial market. These sensors
were much cheaper than the traditional specialized and accurate industrial sensors
which allowed them to be used by hobbyists and roboticist for 3D mapping and depth
sensing. Companies such as Microsoft, Asus and Intel released depth sensors such as
the Kinect™ 360 (2010), Xtion™ (2011), Kinect™ v2 (2014) and RealSense™
(2014), primarily as motion capture solutions. The lower cost of sub 200 US$ and off
the shelf availability of these sensors led to a sweeping increase in the robotics
community. Together with the high scanning resolution and open source software
libraries, these sensors provide real-time, small scale and efficient 3D scanning
sensors that can be used for all sorts of research and commercial purposes alike.
However very little research has been done in utilization of these sensors for
underwater applications, as discussed in the following sections.
1.3 Problem Statement
Over the last three to four decades, terrestrial applications such as robotics and
autonomous vehicles have seen extensive research and growth in 3D mapping and
scene reconstruction techniques. Issues such as noise reduction, 3D camera
calibration and environmental effects for outdoor environments are being researched
extensively. 3D reconstruction in underwater environment however; is a much more
challenging task due to the requirement of expensive, specialized equipment and
services as well as the challenges faced due to the harsh environment and properties
of water as an imaging medium. The prohibitive cost of acquiring up-to-date data
through traditional methods, such as airborne LiDARS, advanced ship-based Sonars
or static 3D scanning sensors and services such as 2G Robotics [5] and 3D at Depth™
[13] limit the work of many researchers and organizations with limited budgets. The
development of an economical sensor that can give the same or better level of
performance for small scale researchers is still an area open for research.

7
According to the literature reviewed, there is a significant gap in the availability
of a cost-effective, real time, underwater 3D scene reconstruction sensors and
techniques. Moreover, the exiting methods are not ideally suited for finely detailed
reconstructions of underwater scenes. By using a commercial RGB-D sensor, small
scale research activities on real-time scene reconstruction in underwater environments
can benefit greatly with the reduced cost. Up till now, very limited research has been
done in testing RGB-D sensors in real underwater environment. Also, the work done
by Digumarti et al [14] is the only available refraction correction technique for
adapting a RGB-D (structured light) sensors in underwater environment. But the
proposed refraction model is processor intensive and limits the real-time generation
of 3D scenes.
1.4 Hypothesis
As detailed in section 1.3, there is a gap in the availability of economical and small-
scale sensors for underwater applications. Nowadays with the advent of commercial
RGB-D sensors, the possibility of fast, accurate and low-cost 3D sensing has become
available. However, even after almost a decade after the launch of these sensors, very
little work has been done for using them in underwater 3D scanning application.
Sensors like Kinect v1 (denoted as KinectSL from here onwards) and Kinect v2
(denoted as KinectToF from here onwards) provide the ability for real-time 3D scene
reconstruction, which can then be used for a multitude of purposes ranging from
robotic navigation to simple scene reconstruction for visualizing and understanding
the condition of the surrounding environment. It is theorized that the development
and testing of low-cost and real-time techniques using low-cost commercial depth
sensor can be done using the Microsoft® KinectToF. It is a time of flight depth sensor
costing approximately 120US$; primarily designed to be a used as a Natural User
Interface (NUI) device for the gaming console Xbox™ One. It is expected to provide
a small scale, low cost and low range 3D scene reconstructing solution with high
spatial resolution for detailed scene visualization. These sensors can easily be
mounted on ROV’s offering a great opportunity for 3D navigation and scanning at
deeper depths of water. As this is still an emerging field, with a significant potential

8
for further research and the work done on this is very limited thereby providing
additional motivation to explore this area for underwater applications.
1.5 Motivation
The core motivation behind any engineering problem is the development of better and
cost effective technology and techniques, that can add to the previous technological
advancement and have a positive influence and forward progression towards the
overall state of the art. Keeping in view this primary cause; the motivation behind this
research work is exploring and improving the current state of underwater 3D sensing
technology and processes for environmental and robotics applications; while having
a constructive impact on underwater monitoring and preservation of natural and man-
made structures. To achieve this, this research work is based on the use of low-cost,
commercial off-the-shelf (COTS) sensors such as the Microsoft Kinect v2 (KinectToF)
that could bring cost effective, robust and real-time 3D underwater sensing and
mapping to the access of budget limited research activities.
1.6 Research Objectives, Impact and Contributions
The objectives of this research work are enumerated as follows:
To investigate the performance of near infrared, time of flight, KinectToF
sensor in underwater environment.
To develop, implement and characterize a real-time solution for 3D
reconstruction of underwater scene.
Since insufficient work has been done in the area of commercial depth sensors in
underwater environment, as discussed in detail in section 0, there remains a significant
technology gap and margin for research and exploration. The major contribution of
this thesis is the adaptation of an economical depth sensor for underwater
environment, without any hardware modifications. The methodology proposed in this
thesis enables real-time 3D scene reconstruction using an un-modified KinectToF. The

9
undesirable and adverse effects of using an imaging device in underwater such as
distortion, refraction, effects due to the housing and noise are catered for. An intuitive
and computationally efficient methodology of refraction correction inspired from the
standard ray-tracing techniques used in computer graphics is proposed, keeping in
mind the high-performance requirements of real time reconstruction.
1.7 Scope of work
The scope of this work, as defined by the research objectives, is limited to
investigation of performance of KinectToF camera in underwater environment and
develop methods and algorithms to cater for the negative effects encountered while
data acquisition. The scope of this research does not include 3D object and plane
segmentation from the reconstructed mesh or any object recognition approach to
identify the object being reconstructed from the surroundings. These additional
objectives have been identified to be part of the future work that can be done to extend
the research for real world application scenarios.
1.8 Thesis Organization
This thesis is organized into 6 Chapters. In this chapter, we have established that
underwater 3D imaging is significant for various commercial and scientific purposes.
This thesis attempts to add to the current state of the art of 3D imaging in underwater
environment by adapting a well know commercial depth sensor and real-time 3D
scanning algorithms that are widely used in normal open-air environments, to work
with nearly same accuracy in the underwater environments. The remainder of the
thesis covers various aspects of this research and is arranged as follows.
Chapter 2 covers the current state of the art in 3D underwater imaging as part of
the literature review. The chapter covers an introduction on the properties of different
wavelengths of light in water and various effects such as refraction, absorption and
scattering of light etcetera. Since this work is focused on the Microsoft Kinect, which
is a Near Infrared (NIR) device, the effects of water on infrared wavelength is covered

10
in detail. Traditional underwater 3D imaging and scene reconstruction techniques and
sensors are sparsely covered to establish the research gap and the contribution of this
thesis. The KinectToF sensor specifications and its properties are also explained in
detail.
The methodology employed for carrying out this research is defined in chapter 3,
which comprises of two main parts. The first part deals with the development of a
special housing that has been designed for water proofing without diminishing the
performance of the sensor. The complete hardware design intent and simulation
results are covered. The second part covers of chapter 3 covers the experiment design,
data acquisition setup and main contribution of this thesis including algorithms and
techniques developed for real time 3D scene reconstruction in underwater
environment. Issues faced such as noise and refraction correction and their counters
have been discussed at length.
The results including qualitative and quantitative analysis have been discussed in
chapter 4. Comparison of the results achieved with relevant techniques and
comparison of aerial reconstruction versus underwater reconstruction are deliberated
in detail. Chapter 5 covers the conclusions and future work proposed based on the
results achieved. Materials such as a tutorial on the software developed for the
research work and the housing design details and specifications are given as
appendices at the end of this thesis.

11
DEPTH SENSING AND 3D SCENE RECONSTRUCTION IN UNDERWATER
ENVIRONMENT
2.1 Overview
This literature review section begins by introducing various depth sensing techniques
that are commonly used with emphasis on optical depth sensing in the underwater
environment. This is followed by details about characteristics of light and the effect
of water on the propagation of light in water and issues affecting light such as
attenuation, absorption, scattering, refraction, the effect of salinity and temperature
etcetera are then discussed. Details on the working principals of active and passive
sensors like RGB Cameras and active optical sensors such as structured light and time
of flight sensors are discussed. This is followed by technical and working details of
both Kinect sensors with focus on KinectToF which has been utilized in this research.
Descriptions on how Kinect acquires and generates the depth image and its various
benefits and issues are deliberated in detail.
2.2 Overview of Depth Sensing Techniques
Depth sensing techniques can be classified in two distinct methods, contact and non-
contact. Non-contact methods have the advantage of acquiring depth data for 3D
scanning of the objects in its original environment, without the need for interfering
with the working conditions. Especially for underwater, since the access to objects
and surfaces deep in water is constrained, non-contact methods are the preferred
methods. Non-contact sensing methods are mostly based on reflective and
transmissive techniques. Reflective methods provide much more ease of use and have

12
been the centre of research for several decades. The reflective methods can either be
optical or non-optical. Non-optical methods cover methods and specialized sensors
such as radars, sonars etcetera. Most of the non-optical methods are inspired by the
natural echolocation techniques used by mammals such as bats and dolphins. Optical
methods comprise of one or more imaging sensors that work by capturing light in the
scene. These methods generally work on the visible spectrum of light. However
several techniques work in the infrared or ultraviolet domain as well. The source of
light divides the optical sensing methods into either active or passive nature. For
passive optical sensing, the light source is the ambient light that comes from the scene.
Light can be generated from any source, natural or artificial. For active optical
sensing, the light source is controlled as part of the sensing system, which can be
either comprise of the visible spectrum of light, or can be in the infrared or ultraviolet
wavelengths. The light can also be modulated, follow a specific pattern that is
detected by the sensors or be omnidirectional (uniform spatial distribution).
Optical sensing methods and depth imaging have several strengths alongside some
limitations. On one hand, the main strengths are that the method is non-contact, and
can be used for objects and surfaces from a distance. On the other hand, the same
strength becomes its limiting factor. Only visible portions of the surface or object can
be measured and occlusion is a limiting factor in depth measurement. Also, optical
methods are sensitive to the properties of interaction of light with the surface of the
target object as well as the intermediate medium between the sensing device to the
inspected object; therefore, common features such as transparency, reflectance or
absorbance of light (single or multiple wavelengths) are a major concern when doing
distance measurements. A taxonomy of depth measurement is given in figure 2.1,
which is an expanded version of the one provided by Lachat et al. [15]. The coloured
boxes leading to the KinectToF are the focus of this work.

13
Figure 2.1: Taxonomy of depth measurement methods (expanded version of the one
proposed by Lachat et al. [15])
For underwater environment, optical sensing methods face additional issues due
to the properties of light in water as a transmission medium. Light properties vary
according to the properties of the transmission medium. Water, being a denser
medium than air, has a distinct effect on the transmission of light. Accordingly, optical
sensors under water behave differently than in open air. Therefore, the imaging sensor
itself or the acquired image have to be modified to accommodate these effects. The
behaviour of light in water is discussed in detail in the following sections. As the
focus of this thesis is on active optical depth sensing methods, details of the working
Non-Contact
Reflective Transmissive
Optical Non-Optical
Radars, Sonars ...ActivePassive
Monocular / Stereo Imaging
Structure from Motion (SFM)
Shape from Silhouette
...
Structured LightTime Of Flight
KinectToF
KinectSL
Intel RealSense
LIDAR’s
Depth / Distance Measurement
Contact
...

14
principle of active optical sensors is discussed in detail with emphasis on ToF as it is
the working method used by KinectToF.
2.3 Light in Underwater Environment
Light has a dual nature of an electromagnetic wave and particle (photons). Therefore,
the effect on light in a medium are the resultant of both electromagnetic and
particulate nature. The electromagnetic spectrum of light spans an extensive range of
wavelengths comprising of both visible and invisible parts. Visible light falls between
the wavelength of 400nm to 700nm, with colours starting from violet at 400nm and
going towards red at 700nm, with each intermediate colour having its specific band
of wavelength in the spectrum, as shown in figure 2.2. The wavelengths before 450nm
are ultraviolet radiations whereas the wavelengths of light larger than 750nm up to
1000μm line in the Infrared (IR) region. The infrared region is broadly subdivided
into Near Infrared Region (NIR) spanning from 750nm to 1400nm and Far Infrared
(FIR) from 1500 to 1000μm. This exact subdivision varies with standards and uses;
however, the above-defined division is the most commonly used one.
Figure 2.2: Spectral distribution of the electromagnetic spectrum
Underwater environment affects light in multiple ways, with the most prominent
being the absorption of light as we go deeper in water. The rate of absorption of each

15
colour however is different. The result of this different rate of absorption is the visible
change of colours of objects submerged in water. Colours such as red, orange and
yellow appear to be overcome by a strong hue of green and blue. Other colours also
show the same effect, with the effect getting more pronounced as we go deeper in the
water. This ultimately leads to the loss of visibility to the human eye as the entire
visible light wavelength is absorbed in water. This absorption also has an impact on
underwater imaging sensors, which are discussed in detail in the ensuing sections.
2.3.1 Attenuation, Absorption and Scattering of Light in Water
The way human vision perceives colour is detecting the wavelength of light bouncing
off an object or through a medium. An object appears to be of a particular colour
whose wavelength is reflected off the objects’ surface. Object absorbs the remainder
of the wavelengths of the visible spectrum of light. Water has the inherent property
of attenuating the entire visible and invisible electromagnetic spectrum, with a
different rate of absorption for various wavelengths of light. The wavelengths of light
that have less attenuation can penetrate deeper in water. Attenuation is defined as the
reduction in intensity of the light beam with respect to distance travelled through a
medium. Mathematically, attenuation of a wavelength of light of strength Io at a
particular depth is given by [16] as given in eqn. (1.1):
kzz oI I e (1.1)
where:
1
Depth
Irradiance at depth z
Irradiance at surface (depth = 0)
Attenuation coefficient ( )
z
o
z
I
I
k m
The attenuation of light is therefore exponentially increased with depth of water,
thus leading to complete absorption at a very short depth of water. The attenuation
coefficient is further comprised of two coefficients as given in eqn. (1.2):

16
( ) ( )k a b (1.2)
where:
a(λ) = absorption coefficient
b(λ) = scattering coefficient
Figure 2.3: Absorption coefficient for light wavelengths in water at 20° C [17]
So, the attenuation or loss of light in water is governed by the combined effects
of scattering and absorption and increases exponentially over the length of travel in a
medium. The absorption and scattering effects of light in water can be broadly
assumed to be due to the energy absorbing molecular structure of water and effect of
non-visible particles in water respectively. The absorption coefficient a(λ), is a
measure of the conversion of radiant energy to heat and chemical energy. It is
numerically equal to the fraction of energy absorbed from a light beam per unit of
distance travelled in an absorbing medium [18]. The absorption coefficient of light in
the visible and infrared spectrum is given in figure 2.3. The scattering coefficient b(λ),
is equal to the fraction of energy dispersed from a light beam per unit of distance
0.0001
0.001
0.01
0.1
1
10
100
1000
10000
100000
100 300 500 700 900 1100
AbsorptionCoefficient(cm
¯¹)
Wavelengthλ(nm)
NearInfrared700‐ 1400nm
VisibleSpectrum400‐ 700nm
17
travelled in a scattering medium. Light scattering changes the direction of photon
transport, “dispersing” them as they penetrate a sample, without altering their
wavelength. For example, water with b(λ) of 1 cm-1 will scatter 63% of the energy
out of a light beam over a distance of 1cm, whereas another sample with b(λ) of
0.1 cm-1 will scatter the same proportion of energy in 10 cm. Both absorption and
scattering reduce the light energy in a beam as it travels through a sample. The
scattering coefficient of pure water is less than 0.003 cm-1 [18] so light scattering has
a smaller influence as compared to absorption.
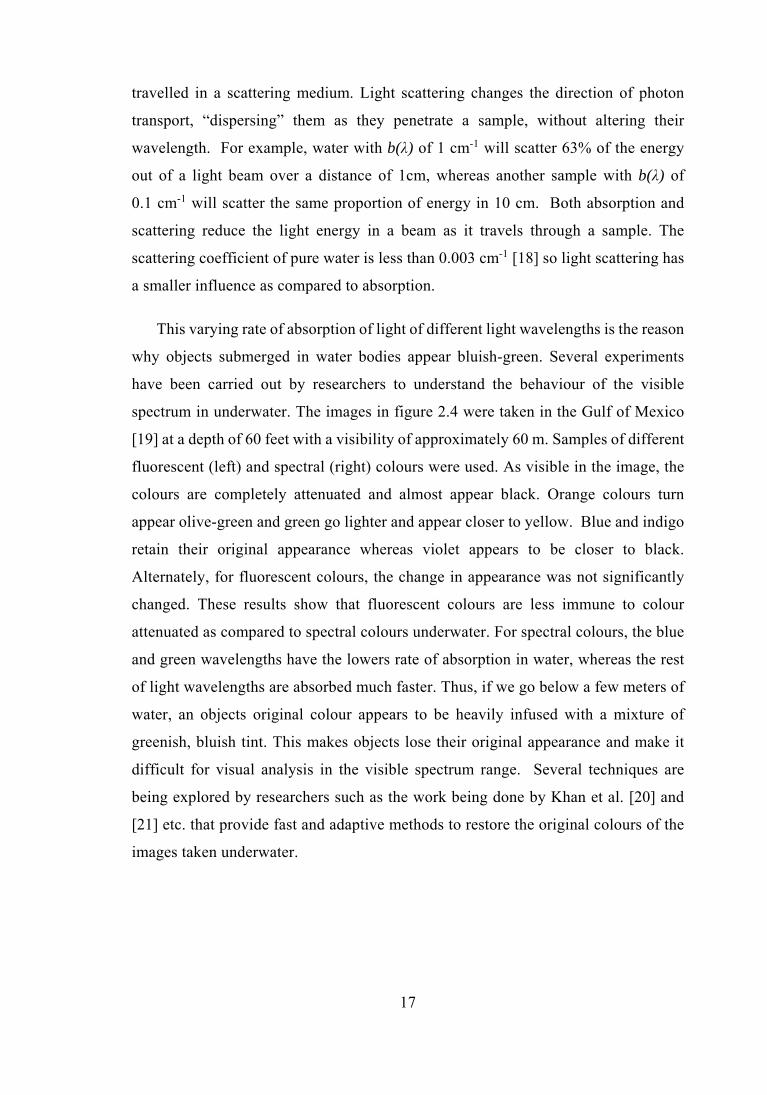
This varying rate of absorption of light of different light wavelengths is the reason
why objects submerged in water bodies appear bluish-green. Several experiments
have been carried out by researchers to understand the behaviour of the visible
spectrum in underwater. The images in figure 2.4 were taken in the Gulf of Mexico
[19] at a depth of 60 feet with a visibility of approximately 60 m. Samples of different
fluorescent (left) and spectral (right) colours were used. As visible in the image, the
colours are completely attenuated and almost appear black. Orange colours turn
appear olive-green and green go lighter and appear closer to yellow. Blue and indigo
retain their original appearance whereas violet appears to be closer to black.
Alternately, for fluorescent colours, the change in appearance was not significantly
changed. These results show that fluorescent colours are less immune to colour
attenuated as compared to spectral colours underwater. For spectral colours, the blue
and green wavelengths have the lowers rate of absorption in water, whereas the rest
of light wavelengths are absorbed much faster. Thus, if we go below a few meters of
water, an objects original colour appears to be heavily infused with a mixture of
greenish, bluish tint. This makes objects lose their original appearance and make it
difficult for visual analysis in the visible spectrum range. Several techniques are
being explored by researchers such as the work being done by Khan et al. [20] and
[21] etc. that provide fast and adaptive methods to restore the original colours of the
images taken underwater.

18
Figure 2.4: Image taken of spectral (right) and fluorescent (left) colour paint
samples taken (a) outside water (b) underwater at a depth of 60 m
Just as in the visible wavelengths of the electromagnetic spectrum, water also
absorbs the Infrared (both near and far) and Ultraviolet (UV) wavelengths, shown in
figure 2.3 . The rate of absorption for NIR and UV wavelengths is quite higher than
the visible spectrum. Due to this high rate, maximum amount of infrared and
ultraviolet radiation is absorbed within the first few meters of water. Alternately, if
the IR or UV source is submerged, the distance that these light wavelengths can travel
is severely attenuated. Even if the source is sufficiently high powered, the distance
will still be much shorter than the distance of normal light generated by a submerged
light source. For these wavelengths to work underwater, selected wavelengths such
as 532 nm (green) and 440nm (blue) wavelength lasers are developed that can
penetrate much further in water. Lasers, being high powered as well as being coherent
beams of light have much-reduced attenuation than non-focused light.
2.3.2 Refractive Index and Its Adverse Effects on Underwater Imaging
The refractive index n of a material is a dimensionless number that describes how
much light is bent when entering or exiting a medium. Refraction is the bending of a
light ray when it enters a medium where its speed is different from the incident
medium. The light ray is bent or refracted toward the normal when it passes from a
less dense medium to a denser medium, at the boundary between the two media. The

19
amount of bending depends on the indices of refraction of the two media and is
described quantitatively by Snell's Law, as given in equation (1.3):
1 1 1 1
2 2 2 2
sin
sin
v
v
(1.3)
Snell's Law states that the ratio of the sines of the angles of incidence and
refraction is equivalent to the ratio of phase velocities in the two media, or equivalent
to the ratio of wavelengths of light in the two mediums, or is equal to the reciprocal
of ratio of the indices of refraction. So, a medium with refractive of index higher than
air (η=1), bends the light towards the normal and vice versa. The refractive index of
a medium like water is dependent on the temperature and wavelength of light. The
refractive index of water is dependent on temperature and wavelength is shown as in
figure 2.5. As is visible in the graph, there is very slight variation of refractive index
with respect to temperature. The change of refractive index becomes more noticeable
if the temperature varies approximately 25° to 30° from the source ambient
temperature. Therefore, for most cases, the refraction index of water can be
considered constant.
Refractive index has a very prominent impact on all imaging sensors used in
underwater environment. For standard pinhole cameras, light from the scene is
focused on a point using lens which works on the principle of refraction between the
surrounding medium and lens. When a camera is immersed in water, the difference
of speed of light and optical density between the surrounding medium and the lens is
different than it is working in open air. Due to this difference, the focal length of the
lens increases than its actual focal length and the scene seems to be farther than it is,
and the scene shows an apparent shift away from the camera.

20
Figure 2.5: Refractive index of water variation with temperature [16]
As light is comprised of multiple colour components, each with their specific
wavelengths and slight variation in speed. Then passing from water into camera lens,
each component of light is refracted at a different rate which results into splitting of
white light in various components. These different colours overlap at the focal point
causing a loss of sharpness and colour saturation. This is called Chromatic Aberration
[22].
One design consideration for underwater cameras is the selection of the shape of
the transparent housing in front of the camera lens and aperture. If the transparent
housing in front of the camera is a flat surface, the light rays are distorted unequally
as the light rays hitting perpendicularly are not refracted as opposed to the rays hitting
at increasing angles from the normal, which face increasing refraction. This results in
a progressive radial distortion that becomes more evident as wider lenses are used.
These distortions radially symmetric, and can be classified as either barrel distortions,
pincushion distortions or a complex combination of both. These distortions in the
acquired image also generate a progressive blur that increases with large apertures on
1.3
1.31
1.32
1.33
1.34
1.35
1.36
1.37
1.38
1.39
1.4
0 20 40 60 80 100
RefractiveIndexofWater
WaterTemperature(°C)
226.5nm 361.05nm 404.41nm
589nm 632.8nm 1.01389µm

21
wide lenses. For dome-shaped spherical housing that is symmetrical about the
principal axis of the camera, the light rays strike the housing perpendicularly from all
directions, significantly reducing the problems of refraction, radial distortion and
axial and chromatic aberrations. This is especially true if the spherical radius has its
centre at the focal length of the lens. However, the design of a customized spherical
housing is quite difficult.
2.3.3 Effect of Water Salinity and Temperature on Light Transmission
Temperature and salinity of water also affect light transmission. Light absorption
coefficient of water is dependent on temperature and concentration of ions. Correction
coefficients can be used to calculate differences in the water absorption coefficient
for a known difference in temperature and salinity. Light scattering by pure water,
seawater, and some salt solutions have been modelled for nearly all wavelengths of
the electromagnetic spectrum. However, as compared to absorption, scattering by
saline water is negligible for general use, especially in the infrared spectral region as
noted by Rottgers et. al. [23]. The effect of salinity and temperature for calculating
temperature and salinity correction coefficients are ±0.5% C-1 and ≤ -0.05 % gL-1
respectively. Therefore, these effects can be taken as negligible if the depth being
measured is small.
2.4 Optical Depth Imaging and 3D Reconstruction in Underwater
Traditionally, depth imaging in underwater is done using non-optical techniques such
as acoustic sonars that are mounted on ships, submarine or remotely operated
vehicles. For bathymetry and underwater surveys, popular imaging sonars are Side-
Scan Sonars or the newer Synthetic Aperture Sonars (SAS). Substantial work has
been done on 3D target reconstruction from side-scan sonars [24], however, because
of the particular properties of light in water and the presence of suspended particles,
sonar images are very noisy, the object boundaries are not uniform, and the contrast
is low [25]. Sonars can work at much larger distances than optical cameras. However,
for 3D imaging, the resolution is somewhat compromised with the distance also and

22
even the high-resolution sonar scans cannot capture the finer details in underwater
objects and surfaces. Significant research is being done to develop various augmented
sonar technologies such as Multi-beam sonars and Acoustic cameras (vision and sonar
in tandem) [26], to cater for these issues.
Figure 2.6: Popular techniques of active optical 3D imaging
In recent years, however, depth imaging for bathymetry as well as for underwater
3D reconstruction using optical sensors is being vastly adopted for various
applications[27]. Popular optical sensing methods that are being used in underwater
environment are stereo vision (passive optical imaging), time of flight imaging and
structured light imaging (active optical imaging) as given in figure 2.6, which are
discussed in detail in the following sections.
The depth data acquired after scanning from a passive or active optical sensors is
spatial and is represented by a point cloud. A point cloud is a set of data points in a
3D coordinate system with each point representing the distance to a point on the
external surface of an object that reflects a light ray; captured by the imaging sensor.
The data in point clouds are generated in very large numbers and the density of the
point cloud defines the resolution of the 3D image. Sparse point clouds have lesser
Object
Camera 2 Camera 1
Object
CameraLaser Source
Object
CameraProjector
Stereo Vision Structured Light Time of Flight

23
number of data points captured per unit area than dense point clouds. Density of the
point cloud is defined by the depth sensor resolution. The raw point cloud data itself
is not used directly and is converted in to a polygonal or triangle mesh model or Non-
Uniform Rational Basis Spline (NURBS) surface etc. through a process commonly
referred to as sparse or dense surface reconstruction. These surfaces or meshes can be
used for visualizing 3D models on the screen or CAD models that can be analysed,
printed using additive manufacturing or developed using any number of
manufacturing processes. The generated mesh is a single object, with no distinction
between objects and surfaces in the scene. The entire process can be summarized by
figure 2.7.
Figure 2.7: 3D scene reconstruction process overview
3D object detection and segmentation algorithms are then applied on the mesh to
distinguish between individual objects and items. For robotic motion and path
planning, plane detection algorithms are used to segment out floor and walls to
evaluate the safest and efficient routes to follow to the required destination.
The following sections will discuss the most relevant 3D optical depth sensing
methods within the scope of this research work. Each sensing method has its benefits
and pitfalls when being used underwater, which are discussed in detail.
Object ona surface
3D Scanning Point Cloud 3D Mesh ObjectSegmentation

24
2.4.1 Structured Light Cameras
The structured light approach is an active optical depth sensing technique. It is a
variation of stereo-vision, where instead of using two imaging devices together, a
single imaging camera and a projector are paired together. Sequence of known
patterns is sequentially projected onto an object, which gets deformed by geometric
shape of the object. A typical system uses an LCD projector or other stable light
source to illuminate the scene with a changing pattern of stripes or fixed-point pattern
across an object. A camera in an offset position from the projecting source captures
the frames and calculates the distortions in the light patterns. The resulting distortions
can be processed and used to form a point cloud and therefore into a dense point cloud
representation of the object surface. The patterns can be in visible light wavelengths
or in invisible wavelengths. White light or infrared light are the preferred light types
used in structured light sensors.
The advantage of a structured-light scanning system is that it is a speedy process
and the output point cloud is precise. Since the entire scene is illuminated and
captured in an image, the method allows for scanning the entire field of view at once,
and a point cloud is captured in a single snapshot. However, it is generally suited for
static scenes and objects. Furthermore, any ambient light that interferes with the
projected light causes the sensors to acquire false or no data at all. Any background
light can lead to over-saturation for long exposure times causing problems to the
systems in detecting the light pattern Reflective, specular, transparent or light
absorbing surfaces also pose difficulty if the wavelength of light being used passes
through or bounces off the scene’s surface in indeterminate directions. Several
researchers have explored structured light for underwater 3D imaging. Bruno et al.
[28] proposed a method of using structured light with stereo photogrammetry for 3D
reconstruction in underwater environment and showed promising results even in high
turbidity levels, using 25 distinct fringe patterns scanned form stereo cameras.
Sarafraz et al. [29] have recently proposed a new method to estimate the shape of
underwater objects along with the shape of the water surface when the projecting
source is outside of water but the imaging sensor is submerged in water.

25
2.4.2 Time of Flight Depth Sensors
Time of flight (ToF) depth sensors calculate the depth from the sensor to a point on
the surface by calculating the time it takes for a signal generated from a known source,
to return after bouncing off a subject. Since the light travels in the air at a constant
speed ( 82.99x10c ms-2), the distance d covered at time t is given by
d = ct. Therefore, a ray of light emitted at time t0 by the transmitter is then reflected
from a point on the scene surface, travelling back again for the distance d and at time
t it reaches the ToF sensor receiver. The receiver is ideally coincident with the
transmitter. Since at time t the path length covered by the ray of light is 2d, it is simply
divided by 2 to get the depth of the reflecting surface. Another method of
implementing a ToF sensor is transmitting a modulated signal and then calculating
the phase difference between the transmitted and received signals. The phase shift in
the signals is a function of the time difference between the time of the transmitted and
received signal. A detailed working of the phase difference methodology of ToF
sensors has been covered by Jaremo et al. [30].
Despite the conceptual simplicity of a ToF sensor, its implementation is a big
technological challenge. Multiple issues must be catered in a ToF sensor. Firstly,
since the calculation depends on reading a reflected signal from the scene, isolating
the exact signal that was sent from multiple reflections and ambient noise is a big
challenge. Secondly, since the signal is electromagnetic in nature, the precise sensing
mechanism and clock speeds have to be extremely fast, accurate and free of any
accumulated errors over time. Lastly, any over exposure of light from any external
source or due to reflection must be cancelled for detecting the original signal. A
popular way to cater for these issues is to use a continuous, modulated IR signal and
then measure the phase difference and amplitude of the reflected signal to measure
the time difference. Using modulated signals specifically helps in isolating the source
signal from ambient IR signals.
Light (or Laser) Detection and Ranging (LIDAR) are the most popular
implementation of time of flight sensors that have seen significant adoption for
bathymetry and underwater mapping purposes. Since light is significantly attenuated

26
in water, as previously explained in section 2.3, a monochromatic and spatially
coherent laser beam of blue or green wavelength (popularly 532nm green laser [31])
are used. Green wavelength has the lowest absorption coefficient, as detailed in figure
2.3. Therefore, green laser LIDARs have much better depth penetration in water than
lasers of other wavelengths. For underwater topography development, LIDARs
mounted on small aircrafts are used. Air borne LiDAR’s also offer a much wider
scanning area than ship borne acoustic sonars, and are commonly being used to
generate 3D maps of coral reefs and other sub-sea geological features. 3D scanning
using LiDARs is gaining popularity and several successful projects are being done,
with LiDARs mounted on AUV’s for autonomous inspection [32]–[37] and 3D scene
construction.
Lidars provide the means for reliable 3D point cloud generation aiding in a much
better underwater 3D scene reconstruction, in comparison to techniques like Structure
from Motion (SFM) from monocular or stereo cameras. Even though LiDARs
provide a much better method for sub-marine object and surface 3D reconstruction,
the equipment cost of commercial LiDARs is staggering and therefore out of reach
for small projects that do not have extensive funding’s or can afford investment into
the marine environment hardened hardware.
2.4.3 RGB-D Cameras
RGB-D (acronym for Red Green Blue and Depth) sensors combine RGB colour
information with depth information. RGB-D sensors are a multi camera system, with
RGB camera and a depth camera combined in one package. The depth camera can use
any of the previously explained techniques for depth sensing like structured light or
time of flight. An RGB-D sensor provides multiple time stamped outputs
simultaneously, including a standard RGB image and an intensity image, where the
value of each pixel represents the depth of the corresponding point in the scene. This
depth image can be used to generate a point cloud, for 3D scene reconstruction
processes. Originally designed as a gaming accessory, the RGB-D cameras have
found popular applications in various field, particularly in robotics. The Kinect sensor

27
by Microsoft was introduced to the market in November 2010 as an input device for
the Xbox 360 gaming console and was a very successful product with more than 10
million devices sold by March 2011. Kinect 360 had a 640x480 RGB camera and a
320x240 depth image camera. The depth sensing is using the structured light method.
The per-pixel depth sensing technology that is used in consumer RGB-D cameras was
developed and patented by PrimeSense® [38]–[40]. ASUS also developed RGB-D
sensors called the ASUS Xtion and ASUS Xtion Live, using the same technology
licenced from PrimeSense. In June 2011, Microsoft released a software development
kit (SDK) for the Kinect, allowing it to be used as a tool for non-commercial products
and spurring further interest in the product.
In September 2014, Microsoft released a new version named Kinect for Xbox One
(also Known as Kinect v2). The sensor employed ToF technology instead of the
structured light sensor and updated the camera to a full 1920x1080 px RGB, while
increasing the depth image resolution to 512×424 px. Technical details of the
KinectToF were released in an article [41], describing the working procedure and
features incorporated in the sensor. Google also announced the Google Tango, a
structured light depth camera in 2014. Following the popularity of these devices, in
2015, Intel released the first RGB-D camera under the Realsense brand. At the time
of writing of this work, Intel has released four versions, available as developer’s kits,
the F200 (2015), R200 (2015), SR300 (2016) and ZR300 (2016). These are also
structured light cameras, working in the infrared wavelength. A comparison of the
popular RGB-D sensors is given in table 87.1.
After the release of the first Kinect, the robotics and computer vision communities
quickly realized that the depth sensing technology in these sensors could be used for
other purposes than gaming. Specifically, since the sensor provided 3D scene
information at a much lower cost than traditionally used 3D depth cameras. But
because most RGB-D sensors are a commercial product, detailed technical
specification and data from the OEMs is often not provided and much information
has to be interpreted after extensive testing. For KinectToF, even though most technical
details have become known through extensive testing, officially there have not been
many publicly released information regarding technical specifications of the internals

28
and working of the sensor. Also, since the Kinect uses a proprietary SoC, detailed
working and algorithms of the firmware are not available, and have to be interpreted
by researchers. Hertzberg et al. [42] provide calibration of the sensor along with issues
about multiple sensors with overlapping field-of-views. Careful error analysis of the
depth measurements from the Kinect sensor has been made by Khoshelham [43].
Table 2.1: Comparison of popular RGB-D sensors
RealSense SR300
RealSense R200
RealSense F200
KinectSL KinectToF
Released Mar 2016 Sep 2015 Jan 2015 Jun 2011 Jul 2014 Price $150 $99 $99 ~$100 ~$120
Tracking Method
Structured Light
Structured Light
Structured Light
Structured Light
Time of Flight
Range (m) 0.2 – 1.2 0.5 – 3.5 0.2 – 1.2 0.4 – 8 0.5 – 8 RGB Image
1920×1080 30 FPS
1920×1080 30 FPS
1920×1080 30 FPS
640×480 30 FPS
1920×1080 30 FPS
Depth Image
640×480 60 FPS
640×480 60 FPS
640×480 60 FPS
320×240 30 FPS
512×424 30 FPS
Connection USB 3.0 USB 3.0 USB 3.0 USB 2.0 USB 3.0
Works outdoors
(Limited) Skeleton tracking
(2) (6)
Facial tracking
3D scanning
Gesture Detection
Toolkits
Java, JavaScript, Processing, Unity3D,
Cinder
Java, JavaScript, Processing, Unity3D,
Cinder
Java, JavaScript, Processing, Unity3D,
Cinder
WPF, Open-Frameworks, JavaScript, Processing, Unity3D,
Cinder
WPF, Open-Frameworks, JavaScript, Processing, Unity3D,
Cinder

29
2.4.3.1 RGB-D Cameras in Underwater Environment
It is interesting to note that even though, release of the first Kinect was in 2011,
insufficient work has been done in using the Kinect sensor, or any other commercial
RGB-D sensor, in underwater environment. It should be noted that generally, these
RGB-D sensors work in the NIR region which has a very high absorption rate in water,
as shown in The absorption and attenuation coefficients on NIR in water have been
calculated by [44], [45] and found to be as follows:
NIR Absorption coefficient in water [a(λ)] = 2.02 m-1
NIR Scattering coefficient in water [b(λ)] = 0.00029 m-1
NIR Attenuation coefficient (k) in water = 2.02 m-1
Tsui et el. [46] showed experimental results for depth image acquisition and point
cloud generation using the KinectSL and Softkinect DS311 time of flight camera. Both
cameras operate between the 800-830nm NIR region and they successfully generate
depth images underwater with significant noise; up to ranges of ~0.9m. NIR around
the ~850 nm wavelength has a very high absorption rate in water explaining the severe
loss of working depth. Dancu et el. [47] demonstrated depth images acquired from
KinectSL for surface below the water level. However the sensor was kept
approximately 0.5m above the surface of water, as the Kinect has a minimum depth
sensing limit of ~50cm. They were able to generate 3D mesh from depth images up
to a distance of 30 cm below water. Butkiewicz [48] has discussed KinectToF infrared
camera distortion model and its issues as well as initial results for 3D scanning in an
outdoor environment and from above the water surface, showing that the KinectToF
can acquire data up to a distance of 1 m.
Digumati et al. [14] are the first ones to successfully demonstrate 3D
reconstruction from low-cost depth sensors in controlled and real underwater
environment. Using the Intel Realsense structured light depth camera, the authors
demonstrated a system capable of capturing depth data of underwater surfaces up to
20cm. They also present a method to calibrate depth cameras for underwater depth
imaging based on the refraction of light and different medium between the image
plane and the object of interest. They presented two models for calibration of both

30
structured light and time of flight cameras. However results for only the structured
light model are discussed, which is processed at a speed of 1 frame per second.
Recently, Huimin et al. [49] proposed an improvement in depth map accuracy and
effects due to occlusion using underwater channels prior de-hazing model and
inpainting. A summary of the research done on RGB-D cameras underwater is given
in table 2.2.
Table 2.2: Summary of previous work on RGB-D sensors under water
Author Year RGB-D Sensor
Testing method
Camera motion
Results
Tsui et al. [46]
2014 KinectSL Container in
water Stationary
Data captured to rang of ~0.9m
Dancu et al. [47]
2014 KinectSL Above water
surface Stationary
Depth image at 30 cm below water
Butkiewicz [48]
2014 KinectToF Above water
surface Stationary Data up to a depth of 1m
Digumati et al. [14]
2016 Intel
Realsense Fully
submerged
6-DOF (Hand held scanning)
3D data of underwater surfaces up to 20cm
distance and 1hz
Huimin et al. [49]
2017 KinectToF Above water
surface Stationary
Solution of occlusion for underwater depth images
caused by relative displacement
of the projector and camera
2.5 Detailed Overview of Kinect RGB-D Sensors
Since there are several commercially available RGB-D sensors available as shown in
table 87.1, selection of sensor for this research was made keeping in view several
factors, such as depth sensing technique, depth resolution, ease of availability,
toolchain supported and ease of use. The most user-friendly and the widely accepted
of the RGB-D sensors is the Kinect. Not only is it supported with compatible drivers
with multiple frameworks and operating systems and is easily available, but it also
has the maximum adoption rate among roboticists. Consequently, much detailed

31
information and help is available for the Kinect, as compared to the other sensors. A
detailed breakdown of Kinect sensor working, comparison between KinectSL and
KinectToF and a brief explanation of the real-time 3D mesh generation algorithm
developed by Microsoft is given in the following sections.
2.5.1 Kinect for Xbox 360 (KinectSL)
The first version of Kinect is a structured light RGB-D camera. It works in the near
infrared domain, however the exact wavelength that the Kinect sensor works on is not
available from Microsoft, however it is at approx. 850 nm range [50]. The sensor
works by projecting a 3x3 times repeated pattern of IR dots. The projected pattern of
dots is then captured in an image with a traditional CMOS camera that is fitted with
an IR-band pass filter. The IR speckle pattern superimposed on the scene is compared
to a reference pattern stored within the Kinect. A view of the internal structure of the
KinectSL is given in figure 2.8.
Objects and various surfaces in the scene that are farther or closer than the
reference plane make the speckles shift and by using a correlation procedure, the
Kinect sensor can detect the disparities between the emitted pattern and observed
positions [51] and thereby the depth displacement at each pixel position in the image.
Each depth pixel is represented by one 16-bit unsigned integer value in which the 13
high-order bits contain the depth value (in millimeters). Any depth value outside the
reliable range or at places where the depth was unable to be calculated (mostly sharp
edges, IR absorbing and reflective surfaces) is replaced with a zero.
As KinectSL is based on the structured light technology in the NIR region, several
issues are inherent to the sensor. Issues such as dependence of ambient lighting, NIR
reflectivity on glossy surfaces, NIR absorption on certain surfaces, etc. result in holes,
rough edges and other irregularities in the output depth images.

32
Figure 2.8: KinectSL and its internal structure [52]
Furthermore, the RGB camera is only 320x240 pixels and the USB 2.0 standard
thereby has a low data bandwidth, which causes throughput issues for real-time
processing.
2.5.2 Kinect for Xbox One (KinectToF)
The second version of Kinect released in 2014, is a time of flight depth sensor and
calculates time of flight by finding the phase difference of a transmitted signal. Some
official technical details about the working and internals of the sensor were published
in [41], such as the phase difference calculation, audio and 3D processing capabilities,
face recognition and other details of the device. A view of the internal structure of
the KinectToF is given in figure 2.9.
For KinectToF, each pixel in the infrared image sensor has two photo diodes, which
are turned on and off alternately. The IR light source is pulsed in phase with the first
photo diode of the pixel and the reflected NIR signal is detected by the second photo
diode of the pixel that is turned on [53]. The light that is reflected returns with a delay
and phase shift in the signal. The signal intensity measured in each frame is the
difference between the output voltages of the two diodes [41], as shown in figure 2.10.

33
Figure 2.9: KinectToF and its internal structure [54]
This is used to detect the phase difference of the amplitude modulated light signal,
generated by the NIR laser emitters in the sensor, as briefly mentioned in section 2.4.2
and [55]. The raw depth data returned by the device is in millimeters and ranges
between 0 and 8000 (16-bit unsigned short). The minimum distance KinectToF can
measure is 500mm and the maximum reliable depth distance returned is 4500 mm,
however it can be disabled to get the full 8000mm depth data. Depth data is 0 for the
pixels where no depth can be calculated.
Figure 2.10: The 3D image sensor system of KinectToF [55]

34
Furthermore, KinectToF has a high dynamic range, to cater for different reflecting
sufraces and properties, and uses multiple transmitted frequencies of approximately
120MHz, 80MHz and 16Mhz to eliminate any depth sensing error and aliasing of
different modulated frequencies. Kinect specifications cite a maximum exposure time
of 14ms, and a maximum latency of 20ms to transfer each exposure data over USB
3.0 to the host system. The depth measured and the phase shift in the signal are related
by equation (1.4) by [55], relating depth (d), speed of light (c) and frequency of
modulation (fmod):
mod
2 .2
phase cd
f (1.4)
2.5.3 Comparison of Kinect Devices
Microsoft as an OEM has not explicitly released detailed technical specifications of
the internal hardware components and structure [50], and most of the information,
particularly for KinectSL, has been inferred by teardowns and manual inspection by
enthusiasts. Significant research has been done to evaluate the technical, metrological
difference of the two sensors, as well as a comparison of both versions of Kinect and
has been summarized in table 2.3.
Effect of different variables, such as effects of varying illumination, the effect of
the sensor and ambient temperature, various calibration parameters, including IR
sensor and RGB camera calibration, etc. have been discussed in detail by the authors
in [50], [53], [55]–[60]. Both versions of Microsoft Kinect utilize infrared emitters in
the Near Infrared (NIR) region with a wavelength of 850nm [50]. It is also interesting
to note that the KinectToF is also capable of working in outdoor condition [56], unlike
the first version.

35
Figure 2.11: Kinect measured depth vs actual distance
It should be noted that the depth calculated in both versions of Kinect is the
perpendicular distance from the object to the camera-laser plane rather than the actual
distance from the object to the sensor [61] as shown in figure 2.11. A detailed
comparison table of the two Kinect sensors is given in table 2.3.
KinectToF improves several things over the first version, technically and
otherwise. Firstly, the sensing method has been enhanced to be much more reliable
and accurate than the structured light method in KinectSL. Even though the depth
sensor has slightly smaller resolution than the first version, a much wider field of view
of the depth sensor doubles the average pixel per degree resolution, thereby giving an
improved scanning resolution. A wider field of view also eliminates the need of an
actuated base. Secondly, the upgrade to USB 3.0 standard means a much higher data
throughput, enabling real-time higher resolution scanning of the scene. The details of
internal hardware and System on Chip (SOC) used on board the device have generally
been speculated in numerous teardowns by hobbyists and researchers alike.
Researchers have identified detailed hardware specifications such as intrinsic camera
parameters, calibration methods, metrological characteristics and performance
parameters of the depth sensor. A quick summary of these works is given in table 2.4.

36
Table 2.3: Specification comparison of KinectSL and KinectToF
KinectSL KinectToF
IR / Depth Camera
Imaging Sensor Aptina MT9M001
CMOS -
Pixel Size 5.2 μm 10 μm
Resolution (px) 640 x 480 512 x 424
Field of View 57.5 ˚ x 45 ˚ 70˚ x 60˚
Average px/degree 10 x 10 5 x 5
Angular Distortion - 0.14 / px
Maximum reliable depth (Maximum depth)
4.5 m (8 m) 4.5 m (8 m)
Minimum depth 0.4 m 0.1 m
RGB Camera
Imaging Senor Aptina MT9M112
CMOS -
Pixel Size 2.8 μm 3.1 μm
Resolution (px) 320 x 240 1920 x 1080
Field of View 62 x 48.6 84.1˚ × 53.8˚
Average px/degree 22 x 20 7 x 7
Frame Rate 30 fps 30 fps
Sensor Type SL ToF
IR Spectrum (nm) ~ 850 ~ 850
USB Standard 2 3
Tilt degree ± 27˚
Number of person tracking 2 6
Kinect SDK version v1.8 v2.0
Can work in Outdoor environments

37
Tab
le 2
.4: P
revi
ous
wor
k do
ne o
n ch
arac
teri
zing
Kin
ectT
oF p
rope
rtie
s
Ref
eren
ce
Yea
r
Sen
sors
Use
d A
ccom
plis
hmen
ts
Rem
arks
[42]
20
14
PM
D C
ambo
ard
Nan
o T
oF
Cam
era
Mod
elli
ng o
f a
Tim
e of
Fli
ght c
amer
a an
d m
etho
ds to
cal
ibra
te a
nd c
ompe
nsat
e m
odel
led
effe
cts
incl
udin
g op
tica
l eff
ects
, sc
atte
ring
etc
.
Pro
pose
a s
enso
r m
odel
of
Tim
e-of
-Fli
ght
cam
eras
as
wel
l as
met
hods
to c
alib
rate
and
co
mpe
nsat
e al
l mod
eled
eff
ects
.
[15]
20
15
Kin
ectT
oF
Det
aile
d su
rvey
of
Kin
ectT
oF c
hara
cter
isti
cs
and
cali
brat
ion
appr
oach
es.
Hig
hlig
ht e
rror
s ar
isin
g fr
om th
e en
viro
nmen
t and
th
e pr
oper
ties
of
the
capt
ured
sce
ne a
nd p
re-
heat
ing
tim
e. P
erfo
rm g
eom
etri
c an
d de
pth
cali
brat
ion.
[60]
20
15
Kin
ectS
L (
mod
el
1414
and
147
3)
Exp
erim
enta
l stu
dy to
inve
stig
ate
perf
orm
ance
and
cha
ract
eris
tics
of
thre
e di
ffer
ent m
odel
s of
Kin
ect s
uch
as a
ccur
acy,
ef
fect
of
tem
pera
ture
on
3D m
odel
s.
Dev
iati
on o
f de
pth
on o
pera
ting
tem
pera
ture
is
high
ligh
ted.
[56]
20
15
Kin
ectT
oF
Asu
s X
tion
Pro
Com
pari
son
of a
ccur
acy,
det
ecti
on r
ate
and
pose
est
imat
ion
betw
een
firs
t gen
erat
ion
(Str
uctu
red
Lig
ht)
and
seco
nd g
ener
atio
n (T
ime
of F
ligh
t) d
epth
sen
sors
.
Dem
onst
rate
that
Kin
ectT
oF h
as h
ighe
r pr
ecis
ion
and
less
noi
se u
nder
con
trol
led
cond
itio
ns a
nd
can
wor
k ou
tdoo
rs.
[62]
20
16
Kin
ectT
oF
Inve
stig
atio
ns o
n pi
xel e
rror
s in
dep
th
imag
e, e
rror
bet
wee
n re
al &
mea
sure
d di
stan
ces,
err
ors
due
to in
cide
nt a
ngle
, ta
rget
type
, col
our
& m
ater
ials
. R
econ
stru
ctio
n of
gen
eric
sha
pes
& e
rror
s
Infl
uenc
e of
the
Kin
ectT
oF s
enso
r te
mpe
ratu
re o
n th
e re
turn
ed d
epth
val
ues
are
valu
able
res
ults
.

38
Ref
eren
ce
Yea
r
Sen
sors
Use
d A
ccom
plis
hmen
ts
Rem
arks
[63]
20
15
Kin
ectT
oF
Infl
uenc
e of
fra
me
aver
agin
g, p
re-h
eati
ng
tim
e, m
ater
ials
and
col
ours
, out
door
ef
fici
ency
. Wor
k on
geo
met
ric
and
dept
h ca
libr
atio
n.
Sho
w th
at d
epth
mea
sure
men
ts a
chie
ved
are
mor
e ac
cura
te c
ompa
red
to th
e fi
rst K
inec
t dev
ice.
[53]
20
15
Kin
ectS
L
Kin
ectT
oF
Met
eoro
logi
cal c
ompa
riso
n be
twee
n K
inec
tSL a
nd K
inec
tToF
and
thei
r ac
cura
cy
and
prec
isio
n.
Sho
w a
dec
reas
e of
pre
cisi
on w
ith
rang
e ac
cord
ing
to a
sec
ond
orde
r po
lyno
mia
l equ
atio
n fo
r K
inec
t I, w
hile
Kin
ect I
I sh
ows
a m
uch
mor
e st
able
dat
a.
[64]
20
15
Kin
ectS
L
Kin
ectT
oF
SR
4000
S
truc
ture
Sen
sor
Com
pari
son
of a
vera
ge e
rror
s be
twee
n th
e se
nsor
s, e
ffec
t of
colo
ur o
n de
pth
sens
ing.
Ave
rage
Euc
lide
an e
rror
is s
mal
ler
for
the
ToF
se
nsor
s is
alm
ost c
onst
ant a
long
dif
fere
nt
dist
ance
s to
the
targ
et.

39
2.5.4 3D Scene Reconstruction Using Kinect Fusion
Kinect Fusion, developed by Newcomb et al [65], is a real-time complex and
unstructured scene mapping system using low-cost depth sensors and graphics
hardware. It was released with the Kinect SDK, as a real-time 3D scanning tool for
developers. At its core, Kinect Fusion is a Simultaneous Localization and Mapping
(SLAM) system, that can do two things in parallel; localization (to estimate the
current and up to date pose of the sensor with respect to the current scene) and
mapping (expand and improve the current map of the scene using global optimization
techniques), in real time. Using the depth data from the RGB-D sensor, Kinect Fusion
fuses each depth map into one single 3D volume or mesh, to form a dense global
surface, when the scene is scanned from the Kinect sensor from multiple viewpoints.
Therefore, it provides 3D object scanning and model creation using a Kinect sensor.
This 3D surface is nonparametric and provides surface and sensor orientation
representation in the field of view which can be useful for physical interaction,
especially in the field of robotics.
2.5.4.1 Brief Working of Kinect Fusion
As the Kinect is moved around in the scene, the pose of the sensor is tracked as it is
moved. Since each frame's pose and its relation to the previous scene is known,
multiple viewpoints of the environment can be integrated together. The overall
working of the algorithm is given as shown in figure 2.12 and described in the
following paragraphs.
The input and first step for the algorithm is the 3D depth data from the Kinect
sensor. This data is in the form of a point cloud and consists of 3D points/vertices (in
camera coordinate system) and the orientation of the surface (surface normals) at
these points. The raw depth information is stored in a voxel, a data point on an evenly
spaced 3D grid. Note that it only represents a single point and not volume information.

40
Figure 2.12: Kinect Fusion overall workflow as given by Newcombe et al [65]
The spacing of the voxels (voxels per meter) is defined by the depth resolution of
the scene being scanned. Next, the location of the sensor in global coordinates is
tracked as the sensor is moved across the view, so the current position of the sensor
with respect to the initial point is known. This is done by iteratively aligning the
acquired and the last measured surface using the Iterative Closes Point (ICP)
algorithm. ICP minimizes the difference between two clouds of points and each frame
is transformed to best match the reference [65]. The algorithm iteratively revises the
transformation matrices (translation and rotation) needed to minimize the distance
from the source to the reference point cloud. An illustration of this concept is givn in
figure 2.13.
Figure 2.13: ICP for aligning point clouds acquired by Kinect
Initial point cloud Aligned point cloud
Kinect scanning path

41
The third stage is fusing of the depth data from the known sensor pose into a single
volumetric representation of the space around the camera. This integration of the
depth data is looped and performed on every nth frame acquired (frames can be
dropped to increase performance in static or slow translating environments). A
bilateral filtering process is applied to the acquired data to smoothen out the point
cloud before integration and remove erroneous data points. As the sensor moves
across the scene from slightly different viewpoints, any gaps or holes where depth
data was not present in the previously acquired frames or generated mesh is also filled
in. Previously created surfaces are increased in resolution and refined as more data
comes in and is repeated over frames.
In the last stage, the fused frames in a mesh need to be rendered on screen. The
rendering technique used is called Volumetric ray casting. It is an image-based
volume rendering technique that computes 2D images from 3D volumetric data for
display on the screen. It must not be confused with ray tracing, which renders surface
data only. For volumetric rendering, the tracing ray passes through the object,
sampling the material along the ray path. There are no ray reflections or secondary
rays sprouting from the main rays. The resultant mesh can be shaded according to the
variation of depths along the surface or direction of the surface normals. Typical
volume sizes that can be scanned are up to around 8m3 while typical real-world voxel
resolutions can be up to around 1-2mm per voxel. However, it is not possible to have
both simultaneously, because the algorithm is memory dependent. Kinect Fusion
stores the data in GPU memory in a voxel grid. Therefore, the limiting factory
becomes the available memory.
2.5.4.2 Tracking Performance and Reconstruction Volume
The most important point for Kinect fusion is that for tracking purposes, it only
uses the depth data which is captured using the Kinect's infrared sensor. Since RGB
is not used, therefore there is no effect of lighting conditions on the scene. This also
enables Kinect fusion to work in pitch dark conditions. However, for the tracking to
work, the scene must have enough texture or variations that are visible in infrared. If

42
there is a lack of texture, like a plane wall or surface, the tracking fails to extract any
features to align the frames to and therefore loses the track. For best results, a cluttered
unstructured scene gives the best results. In addition to the requirement of a textured
scene, the scanning rate also plays a part in maintaining a stable tracking output.
Movement in small and slow increments help the acquisition of closely aligned point
clouds and help in lower alignment cost per frame. If tracking is lost, the camera can
be repositioned to a previously aligned frame to recover any lost tracking in real time.
Optionally, the option to align the RGB image to the captured depth image and
generated 3D mesh. After alignment, the RGB colours of each pixel can be overlaid
on the mesh, to generate a coloured 3D mesh. This may be processed to create a
coloured rendering or for application in additional vision algorithms such as 3D object
segmentation.
To store the depth information, the number of voxels that can be generated
depends on the amount of memory available on the host computer. The resolution in
the three axes can be different and can be set to encompass the area required to scan.
The size in real world units that one voxel represents is defined by ‘voxel per meter’
(vpm). So, a (512)3 voxel volume can represent a 4m3 volume of the real world if the
vpm is set to 128 (512/128=4). In this case, a single voxel will cover a volume of
4m/512=7.8mm3. The same (512)3 can be set to represent a 2m3 volume of real world,
at a much higher resolution of 256vpm (512/256=2m3). Then each voxel would cover
a volume of 2m/512 = 3.9mm3). The voxel per meter can be set independently for the
three axes. However, to scan an extensive area with a very high resolution is no
possible, since the number of voxels required to scan a large area would increase
beyond control. There methods to use multiple devices and multiple GPU’s each with
their own contiguous memory space, however that is beyond the scope of this research
work. A visual representation of a cubic voxel volume is given in figure 2.14.

43
Figure 2.14: A cubic volume is subdivided into a set of voxels which are equal in
size and defined per axis. [66].
2.5.5 3D Reconstruction Algorithms for RGB-D sensors
After the release of Kinect Fusion, several researchers have developed similar and
improved open and closed source implementations. Several other techniques are also
being developed by researchers for SLAM and 3D scene reconstruction. A summary
of some popular alternatives is given in table 2.5.

44
Tab
le 2
.5: S
umm
ary
of r
elat
ed w
ork
done
on
scen
e re
cons
truc
tion
and
map
ping
Ref
eren
ce Y
ear
Tec
hniq
ue(s
) A
ccom
plis
hmen
ts
Lim
itat
ions
[65]
20
11
Pho
ng-s
hade
d B
ilat
eral
fil
teri
ng
ren
deri
ngs
GP
GP
U
TS
DF
(Kin
ect F
usio
n le
adin
g pa
per)
. Usi
ng d
epth
onl
y, it
is c
ompl
etel
y ro
bust
to in
door
ligh
ting
sce
nari
os. U
ses
all f
ram
es o
f K
inec
t dat
a.
Usi
ng e
very
6'h
fra
me,
and
64
tim
es le
ss G
PU
mem
ory
is u
sed
by
redu
cing
the
reco
nstr
ucti
on r
esol
utio
n to
643
.
Vol
ume
gene
rate
d is
lim
ited
to
mem
ory
avai
labl
e fo
r nu
mbe
r of
vo
xels
[67]
20
12
TS
DF
C
SP
O
dom
etry
(Kin
tinu
ous)
Im
prov
es o
n K
inec
t Fus
ion’
s vo
xel l
imit
atio
n. N
ot
rest
rict
ed to
a s
mal
l vol
ume
by th
e av
aila
ble
mem
ory
on th
e G
PU
. In
stea
d, v
olum
e m
oves
thro
ugh
spac
e al
ong
wit
h th
e ob
serv
er a
nd
tria
ngul
ar m
esh
is c
reat
ed f
or s
lice
s th
at le
ave
the
volu
me.
Com
bine
s IC
P-b
ased
trac
king
wit
h de
nse
colo
ur in
form
atio
n to
ach
ieve
rob
ust
trac
king
in a
larg
e va
riet
y of
env
iron
men
ts.
Loo
p cl
osur
e de
tect
ion
and
mes
h re
-in
tegr
atio
n
[68]
20
11
Poi
nt C
loud
M
anua
l cal
cula
tion
of
poin
t clo
ud b
ut tr
ansf
orm
ing
curr
ent p
osit
ion
in r
eal w
orld
usi
ng tr
ansf
orm
atio
n m
atri
x ca
lcul
ated
fro
m S
UR
F o
n ca
mer
a po
se
Slo
w, p
oint
clo
ud u
pdat
es o
nly
afte
r se
vera
l fra
mes
. Cre
ates
a p
oint
cl
oud
but n
ot a
mes
h
[69]
20
13
Bil
ater
al f
ilte
ring
K
inec
t Fus
ion
TS
DF
B
ilat
eral
fil
teri
ng o
n no
isy
Kin
ect d
ata
to r
educ
e an
d fi
ll s
mal
l hol
es.
[70]
20
12 V
olum
etri
c V
oxel
R
epre
sent
atio
n (U
sing
Kin
ectS
L)
Use
s O
ctom
ap li
brar
y to
gen
erat
e a
volu
met
ric
repr
esen
tati
on o
f th
e en
viro
nmen
t.
Ope
n-S
ourc
e
Doe
s no
t ass
ume
odom
etry
dat
a av
aila
bili
ty.

45
Ref
eren
ce Y
ear
Tec
hniq
ue(s
) A
ccom
plis
hmen
ts
Lim
itat
ions
[71]
20
14
PO
VR
ay r
ende
rer
Kin
tinu
ous
Use
s D
epth
and
RG
B n
oise
mod
elli
ng.
Ope
n-S
ourc
e
[72]
20
13
Occ
upan
cy G
rid
Map
s pr
opos
es u
nifi
ed f
ram
ewor
k of
bui
ldin
g oc
cupa
ncy
map
s an
d re
cons
truc
ting
sur
face
s hi
gh-s
tora
ge c
ompl
exit
y of
oc
cupa
ncy
map
s in
mem
ory
[73]
20
13
Vox
el H
ashi
ng
Alg
orit
hm
The
fus
ion
of s
pati
al a
nd v
isua
l dat
a us
ing
a fr
amew
ork.
bui
ldin
g el
emen
ts a
re r
ecog
nize
d ba
sed
on th
eir
visu
al p
atte
rns.
The
re
cogn
itio
n re
sult
s ca
n be
use
d to
labe
l the
3D
poi
nts,
whi
ch c
ould
fa
cili
tate
the
mod
elli
ng o
f bu
ildi
ng e
lem
ents
.
Illu
min
atio
n ef
fect
s on
the
segm
enta
tion
and
clu
ster
ing
resu
lts
coul
d no
t be
com
plet
ely
rem
oved
.

46
2.6 Proposed Methodology
As it has been discussed in the sections above, the objectives of this proposed research
are to investigate the performance of KinectToF sensor in underwater environment.
Once the working of the sensor has been found to be satisfactory, a solution for real-
time 3D scene reconstruction in underwater environment will be developed. The
algorithm is proposed to be based on the popular Kinect Fusion algorithm, but as it is
not designed to work in a medium other than air, it must be adapted to cater for the
new working medium. Furthermore, all the unwanted effects that adversely affect the
performance of sensors underwater must be catered for. This includes noise removal
on the acquired point cloud, a correction for the refraction effect of water and the
housing material itself etcetera. To execute this research work, the methodology will
therefore have two distinct parts, as shown in figure 2.15.
The first part will be the design of a custom-built casing so that operation of the
device isn’t hampered in any way in underwater environment. The casing material in
the field of view of the Kinect must be selected so that it has minimum effect and
absorption on near infrared wavelength. Secondly, since the pressure sustained by
submerged objects increases linearly with depth, the casing has to be able to sustain
such pressures for at least 3-4m depth so the data acquisition process can be done
without any issue. The design of this tailored casing has been deliberated at length in
chapter 3, as part of the research methodology.
Secondly, since insufficient research has been done in the area of working of
commercial depth sensors under water, there remains a large research gap and a
significant lack of data on the effective performance and issues faced in such devices.
Taking inspiration from working of RGB cameras in water, it is speculated that issues
like refraction, noise due to turbidity, absorption and scattering of NIR wavelength,
etc. will be faced with varying effect and therefore corrections for these problems will
have to be devised as part of the research work.

47
Figure 2.15: Workflow for generating real-time 3D meshes from Kinect sensor, in
under water environment. Coloured blocks are the contributions of this research.
To utilize Kinect Fusion for 3D scene reconstruction in underwater environment,
additional filters need to be appended to the framework to cater for the effect of
multiple refraction due to the three mediums. Results of the data acquired and
corrected will be analysed qualitatively and quantitively by comparison to meshes
created by Kinect fusion and KinectToF in different environments and conditions, such
as clear and turbid waters etc. The results, discussed in detail in chapter 5, show the
effectiveness of the proposed methodology and creates further avenues of research
that can be explored in future work.

48
2.7 Summary
Depth sensing is a necessary task not only for just understanding the sub-sea surfaces
and features but also for developing autonomous robotic solutions and improve state
of the art in robotics. A brief overview of the depth sensing techniques has been
covered in this chapter, with emphasis on non-contact optical depth sensing. Effect of
water on the propagation of light in water, effects of temperature and salinity, etc. and
the resulting effects on underwater imaging have been discussed in detail. Different
imaging techniques of optical imaging and optical sensors have been discussed
including structured light and time of flight cameras and commercial RGB-D
cameras. Focusing on the RGB-D sensors, the Microsoft Kinect sensors (both
KinectSL and KinectToF have been compared in detail. Lastly, working of Kinect fusion
has been explained and other inspired algorithms are compared to understand their
pros and cons. Lastly, the proposed methodology of this research has been outlined
as it will be explained in the following chapters.

49
WATERPROOF CASING DESIGN AND DATA PROCESSING PIPELINE FOR
UNDERWATER 3D DATA
3.1 Overview
The methodology can be divided in two distinct parts. Firstly, a custom waterproof
housing for Kinect had to be designed and prototyped for data acquisition underwater,
with minimum effect on the imaging data. Second, the RGB and Depth cameras must
be calibrated, since the working of optical cameras changes when used in denser
medium than air. In addition to the calibration issues, the change in working medium
adds several unwanted issues such as enhanced distortion, change in time of flight
calculations and refraction of the rays of light. These hardware and software issues
and their developed solutions are discussed in detail in the following sections.
3.2 Design and Prototyping of Waterproof Housing
The KinectToF does not have any visible or commonly known Ingress Protection (IP)
rating information available. From several teardowns that are available online, it can
be assumed that the device is rated at IP5x or IP6x, with much more emphasis on dust
protection and none to limited splash protection. Since significant processing is done
onboard the Kinect’s specialized DSP processor, it also requires some heat dissipation
via air circulation, which is achieved by a 5V 40mm DC Fan. As the electronic device
is clearly not meant to handle water ingress of any sort, a specialized waterproof
casing has been designed to take the sensor underwater, as proposed in section 2.6.
The waterproof and transparent housing has been designed so that not only can it
protect the electronic hardware, but also enable clear and obstruction free field of

50
view to the on-board IR and RGB sensors. Specific details of the design decisions,
material selection, water ingress protection for the casing as well as the measured
effects of the casing on the Kinect's field of view (FOV) are discussed in the following
sections. The design of the casing has been done keeping in view the operational
requirements of Kinect in water, namely:
Kinect is easy to handle around the scene or objects of interest to fully capture
the depth data.
There is an obstruction free and clear view in front of the IR and RGB cameras.
Maintaining air-flow for cooling the onboard electronics should be ensured in
a sealed environment, while the device is being operated underwater for a
longer operational time.
Since the Kinect needs external power and USB connection to the host
computer for real-time processing, the point where the cable comes out of the
housing must be properly sealed against increasing water pressure with depth
of 3D scanning.
Lastly, the casing should allow easy access to the device along with easy
removal and reset to the desired place again, if required.
3.2.1 Transparent Material Selection
The most important part of this casing is the front face, which must offer obstruction
free, clear and distortion free view to the NIR and RGB cameras. Also, since Kinect
is an NIR device, the transparent material should have a high NIR transmission
percentage. It was therefore essential for the proper material to be selected. Other than
the transmission, the following factors were considered in selecting the housing
material, in order of importance:
NIR Transmission percentage
Refraction Index
Density
Thickness available
Malleability and machinability

51
Adhesion to other materials
Availability
The first clear choice is glass, however there are several issues in selecting it as a
housing material. Firstly, the brittleness for normal thin light glass casing would be
impractical for a robust casing design. To increase the strength, the thickness of the
glass would have to be increased, or specialized glass casings of hardened glass such
as Pyrex would be required, which in turn would increase weight. Also, glass would
make it difficult to get a custom shaped and custom designed piece manufactured.
The second most relevant material option is Perspex or Acrylic, a thermoplastic
material that is easily available and is malleable. Perspex (also known as Acrylic)
provides obstruction free view to the cameras. It has a refraction index of 1.49 and is
light weight, with a density of 1.18 g/cm3. A 2mm thick Perspex sheet would also
provide a strong and robust material for trouble-free use underwater.
Figure 3.1: Transmission percentage of different wavelengths of light through 3mm
Acrylic [74]. The red band is NIR wavelength used by KinectToF
100
80
60
40
20
0
300 500 700 900 1100 1300 1500 1700 1900 2100
Wavelength (nm)
Tra
nsm
issi
on (
%)
Acrylic NIR Transmission (3mm sample)

52
According to data available from manufacturers, the transmittance (Γ) of NIR
wavelength is approximately ~95% for the entire NIR range [74], and the decrease
starts to occur in the infrared region, as shown in figure 3.1. Transmittance is the ratio
of intensities of incoming light in air to that of light passing through a medium and is
given by equation (3.1) [75].
acrylic
air
I
I (3.1)
The absorption coefficient is related to the transmittance according to the
relationship given in equation (3.2):
kze (3.2)
Therefore, a Perspex housing will not absorb the light emitted by the Kinect’s
NIR source. This was also experimentally verified by testing different thicknesses of
Perspex sheets (2mm, 3mm, 5mm and 8mm) as compared in figure 3.2 and using out-
of-the-box Kinect Fusion sample application provided by Microsoft in the SDK.
Comparing the accuracy of the reconstructed mesh, it is noted that there is nearly
negligible distortion in the depth map reconstructed for all thickness of Perspex.
However, the Perspex sheet must be preferably touching the Kinect's’ face or be very
close to its face. If there is a gap of more than 4-5mm between Kinect and Perspex,
there is a noticeable loss of depth data from the edges of the image. Furthermore, if
the sheets are further from the front face, internal reflection of the IR rays occurs
directly in the area in front of the source. This leads to loss of depth data in the centre
of the image and the reconstructed mesh also.

53
Figure 3.2: 3D mesh reconstruction results in open air through various thicknesses
of Perspex (a) Original scene (b) No Perspex (c) 2mm (d) 3mm (e) 5mm (f) 8mm
3.2.2 Casing Structural and Sealing Design
The casing for Kinect has been designed in a modular fashion, as shown in figure 3.4.
It consists of two side housing holders that hold the Perspex face in place and double
as the main structural part of the casing. A slot is designed in the housing holder and
the arms to ensure that the Perspex sheet remains fixed. The slots are also filled with
clear automotive silicone paste, acting as a seal of the casing to prevent water entering
the case. The device itself is held firmly in place with 2 exact sized Kinect holders,
designed to fit inside the Perspex housing which limit any vertical and lateral
movement of Kinect while scanning objects under water.
KinectToF has air intakes on the sides of the device and a 40mm fan in the rear for
hot air exhaust, to maintain air flow for cooling the on-board processor and other
electronics. The designed Kinect holders allow almost unrestricted airflow intake
from the sides of the Kinect for cooling purposes. The back plate is also cut out from
8mm Perspex sheet and is held together firmly with 16 × M5 bolts distributed around
the back side, with a layer of clear automotive silicone paste. There is approximately
50mm gap between the back plate and Kinect's rear mounted exhaust fan, to allow for

54
air circulation inside the casing during operation. Due to unavailability of the required
size of cable glands, a custom cable seal was designed as a 4-part snap-fit assembly
and has 5x rubber washers installed to ensure water proofing of the cable entering the
casing. Designing a function waterproofing seal was the most difficult part of this
entire assembly, and required several design revisions after initial testing. Section and
exploded views of the cable seal is given in figure 3.3 while the complete assembly
and exploded view are given in figure 3.4. Detailed drawings of the casing sub
assembly are given in Appendix A.
Kinect is powered with a proprietary power adapter from Microsoft, that is
bundled with the Kinect for Windows Adapter, required to access the data streams of
the KinectToF sensor. To cater for the power requirements, the adapter was replaced
with a standard 12V 7Ah sealed lead-acid battery.
Figure 3.3: Cable gland design (a) Exploded view (b) Cross-section view

55
Figure 3.4: Designed housing assembly (a) housing only (b) housing with KinectToF
(c) exploded view of the assembly

56
3.2.3 3D Printing Considerations
The structural protective housing has been designed and prototyped for Kinect using
Fused Deposition Modelling (FDM) 3D printing technique. The material selected was
ABS (Acrylonitrile Butadiene Styrene), as opposed to Poly Lactic Acid (PLA)
material, as the latter can absorb water and humidity in due time. The printing was
done using a 3DSystems® CubePro Duo which is a Fused Deposition Modelling
(FDM) additive manufacturing technique based 3D printer. The 3D print was done
with a layer resolution of 0.7μm and 80% solid infill, 5 top and 6 bottom layers to
reduce the chance of porosity and a diamond hatched support print pattern to increase
overall structural strength. Because of the way FDM 3D printed objects are
manufactured (layer by layer stacking of linear fused plastic extrusions), there is a
high chance of porosity between the printed layers even after fusion of the material
layers, as shown in figure 3.5 below. To cater for any such non-visible inaccuracies,
the printed parts were coated with multiple layers of aerosol solvent based paint and
covered with a coat of clear lacquer. These methods helped fill in any invisible
porosity between the printed layers and add a protective layer against water intrusion.
Figure 3.5: Zoomed in view of the porosity between fused 3D printed layers due to
FDM process

57
3.2.4 Structural Analysis of Designed Housing
As static pressure exerted on the walls of a submerged object is dependent on the
density ρ, acceleration due to gravity and depth of the object. As the depth d increases,
the pressure distribution P on the surface of the object becomes asymmetric along the
height of the object and is more at the lower half as compared to the top half, as shown
in figure 3.6(a). As this is a linear trend, therefore the pressure that will be exerted on
the Kinect housing can be shown from the figure 3.6(b).
Figure 3.6: (a) Increasing pressure exerted on a submerged object in water (b)
simulated linear relationship of pressure in water and depth
To assess the pressure that the housing can sustain, 3D structural strength
simulations using Finite Element Analysis (FEA) were carried out. The respective
materials for the objects such as Perspex and silicon nitride for washer were selected
according to the exact specification of the materials available. As the prototype was
meant for data collection at relatively shallow depths of 3 to 5 meters, the same
pressure of 3 to 5 meters was simulated, which translates to a pressure of 0.3 atm. The
stress analysis and simulation results show that a thickness of 4 mm for the shell for
the casing holders, as well as the cable glands would suffice to sustain the pressures
exerted at the casing. As it can be seen by the results in figure 3.7, more prominent
deflections occur especially at the centre of the holder. It must be noted that the Von
(a) (b)
dept
h (
)d P=f(d)
Pressure distribution on an immersed cube
dept
h (
)d

58
Mises stress, as well as the deflection results shown here, have been simulated by
analysing a hollow casing design with a wall thickness varying from 1mm to 4mm.
Figure 3.7: Structural strength analysis of the designed KinectToF housing (a) Von
Mises stress distribution (b) displacement due to pressure (c) 1st principle stress (d)
3rd principle stress (e) Safety factor results
Von Mises stress is a theoretical measure of stress, used to predict yielding of
materials under given load condition from results of simple axial tensile tests. This is
done as the support structure in 3D printing are generated at the time of generating
the g-codes from the model files. Also, there is no direct method to duplicate the exact
diamond support structure inside a hollow structure, unless it is designed to be a part
of the model. Furthermore, if the simulations of hollowed out parts can sustain the
pressures designed, the support structures inside the hollow print will further
strengthen the part, adding a much larger safety factor than the ones simulated,
allowing to sustain the stresses at depths of 10 to 15ft below water. While it is

59
understood that these simulations do not consider the manufacturing properties of a
layer based 3D printed model, however, the simulations enhanced our confidence in
the stability and strength of the housing design.
Figure 3.8: Structural strength analysis of the designed cable gland (a) Inside edge
Von Mises Stress distribution (b) Outside surface Von Mises Stress distribution (c)
Inside edge displacement due to pressure (d) Outside surface Displacement due to
pressure
A similar stress analysis was also carried out on the cable gland as shown in figure
3.8 and washer assembly to see if the glands can sustain the pressures. As seen from
the results in table 3.1, the cable glands sustain the pressure easily without any
buckling of the casing and all the stress is transferred to the rubber washers, further
strengthening the seal. Details of the simulation results obtained are given in table
3.1.

60
Table 3.1: Stress analysis simulation results summary
Name Kinect Holders Cable Gland
Minimum Maximum Minimum Maximum Volume (mm3) 1091530 - 327952 -
Mass (kg) 1.233 - 0.388629 - Von Mises Stress (MPa) 2.77E-08 3.51E+00 1.98E-20 9.22E+00 1st Principal Stress (MPa) -1.97E+00 2.68E+00 -4.46E+00 6.55E+00 3rd Principal Stress (MPa) -4.70E+00 8.36E-01 -8.95E+00 7.23E-01
Displacement (mm) 0.00E+00 1.16E-01 0.00E+00 6.00E-03 Safety Factor 5.69727 15 4.62473 15
3.3 Refraction Correction and distortion removal in Underwater 3D Data
The following sections address camera calibration and filters developed for removal
of noise and accommodating the various effects of water as an imaging medium such
as distortion removal and refraction correction.
3.3.1 Kinect RGB and Depth Camera Underwater Calibration
Before the camera calibration can be explained, some basic concepts that will be used
for calculating the final results have to be explained. Then the methodology for
calibrating the Kinect’s RGB and depth cameras will be discussed in detail. Note that
since the depth detected by Kinect is calculated from images taken from the infrared
camera, the calibration of the IR camera will automatically mean that the depth
images incorporate the calibration corrections.
3.3.1.1 Camera Calibration Concepts
Imaging cameras are ideally modelled after a pin-hole camera model, where the light
from the scene passes through a virtual pinhole and forms an inverted image on a
plane behind the pinhole. In real world cameras, however, to capture maximum light
from the scene required to form a clear image, the light is passed through the camera
aperture and focused on a virtual pin-hole by a lens. The image is formed on a plane,

61
that lies on an imaging sensor as shown in figure 3.9. Since the model deviates from
an ideal camera model, the lenses and imaging sensors have inherent properties, that
effect the image captured. To cater for the unwanted effects of these inherent
properties, the cameras need to be calibrated before utilization. By calibration, we can
estimate the internal parameter of the lens installed and the imaging sensor properties
that are required to form an image. The complete camera parameters can be described
by intrinsic parameters (covering the lens position and orientation, imaging sensor
orientation and image capturing properties, distortion coefficients of the lens) and
extrinsic parameters (3D coordinates of the camera relative to the scene). These
intrinsic parameters and distortion coefficients of the camera are unique to each
device. The intrinsic parameters are used to calculate and add a correction to the image
acquired. This is a necessity for detecting and calculating real world sizes of objects
in the scene. Camera calibration is also essential for robotics, navigation systems and
3-D scene reconstruction as well.
Figure 3.9: Camera calibration process
To project a point in 3D space on to a 2D image plane, perspective projection and
the pinhole camera model are used, which can be defined by equation (3.3):
Connect to Kinect DeviceWorld Coordinates( )X, Y, Z
Camera Coordinates( )x, y, z
Connect to Kinect DevicePixel Coordinates( )m, n
Extrinsic Parameters Intrinsic Parameters
Object Camera Image Sensor
y
x z
y
x z
v
u

62
|
1
Xx
Yy K R T
Zz
(3.3)
where:
, Coordinates of the projection plane in pixels
= scale factor (ideally 1)
Intrinsic matrix
Rotation matrix
Translation matrix
, , = Coordinates of object in real world
x y
z
K
R
T
X Y Z
z is the scale factor and is used if the lens scales the image. K is the camera’s
intrinsic parameters and R and T form a transformation matrix that relates the 3D
point’s transformation projection onto a 2D plane. The intrinsic matrix of the camera
is defined by eqn. (3.4):
K= 0
0 0 1
x x
y y
f q
f q
(3.4)
where:
, Focal length in pixels
, Principal point
Skew coefficient between x and y axis
x y
x y
f f
q q
The focal lengths (fx, fy) are focal lengths distances between the pinhole and the
image plane (on the image sensor) in pixels. They can be converted to distances in
millimetres using a scale factor inherent to the lens. The skew (γ) is non-zero only
when the image sensor axes are not perpendicular.

63
The camera extrinsic parameters are defined as the 3-dimensional location of the
camera in the world coordinate system (or conversely, the transformation coordinates
of a point to a coordinate system that is fixed with respect to the camera). The
augmented transformation matrix (3×4) is given by eqn. (3.5):
11 12 13 1
21 22 23 2
31 32 33 3
Transformation matrix = |
r r r t
R T r r r t
r r r t
(3.5)
where:
Rotation matrix (3x3)
Translation matrix (3x1)
R
T
The pixel coordinates (m, n) of a point on the 2D image plane can then be
calculated by eqn. (3.6):
*
*x x
y y
m f x q
n f y q
(3.6)
The camera’s intrinsic matrix given in equation (3.4) does not incorporate the
radial distortion effects due to the lens and therefore these have to be dealt separately.
The distortions can be categorized into two types, radial distortion and tangential
distortion, as shown in figure 3.1. Radial distortions are due to the imperfections in
the manufacturing of lenses. It also occurs in special lenses like wide angle, fish-eye
and telephoto lenses.
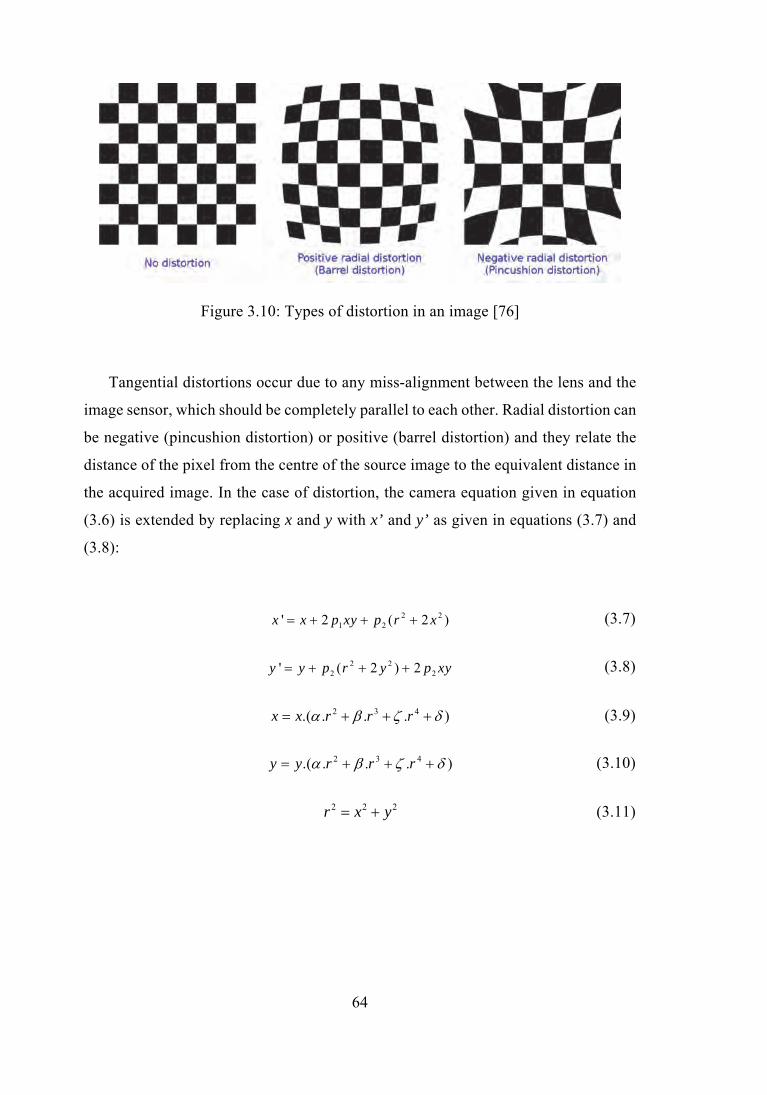
64
Figure 3.10: Types of distortion in an image [76]
Tangential distortions occur due to any miss-alignment between the lens and the
image sensor, which should be completely parallel to each other. Radial distortion can
be negative (pincushion distortion) or positive (barrel distortion) and they relate the
distance of the pixel from the centre of the source image to the equivalent distance in
the acquired image. In the case of distortion, the camera equation given in equation
(3.6) is extended by replacing x and y with x’ and y’ as given in equations (3.7) and
(3.8):
2 21 2' 2 ( 2 )x x p xy p r x (3.7)
2 22 2' ( 2 ) 2y y p r y p xy (3.8)
2 3 4.( . . . )x x r r r (3.9)
2 3 4.( . . . )y y r r r (3.10)
2 2 2r x y (3.11)

65
where
2 2
Linear scaling of the image
, , Radial distortion coefficients of the lens
, Tangential distortion coefficients
', ' Undistorted(corrected) pixel locations
p p
x y
The distortion coefficients x’ and y’ are represented by a higher order polynomial
equation in equations (3.9) and (3.10). Ideally, the scaling value δ is 1. An undistorted
image has δ =1 and α=β=ζ=0. Positive values of these parameters shift the distance
towards the centre, counteracting pincushion distortion while negative values of the
parameters shift the points away from the centre, counteracting barrel distortion.
Changes in ‘α’ affect only the outermost pixels of the image. Changing ‘β’ has a more
uniform effect on the image distortion [77]. To avoid any scaling while removing
distortion, the parameters should be chosen so that α+β+ζ+δ=1. Furthermore, the x
and y are normalized values, between 0 and 1.
3.3.1.2 Underwater Calibration of Kinect Cameras
For most professional cameras, the distortion coefficients are provided with the
camera. However, normally, these parameters have to be calculated for the particular
camera in use. This is easily accomplished by acquiring images of a checkerboard,
with a known size of the checkbox pattern. Multiple images of a checkerboard can
then be used to calculate the intrinsic and extrinsic parameters. Since Kinect cameras
were designed to be used in open air, the Kinect drivers come with pre-defined camera
calibration parameters that closely approximate any KinectToF device manufactured.
However, for use under water, the camera intrinsic parameters and distortion
coefficients will have to re-calculated. The calculated parameters can then be used for
undistorting the images before using them for scene reconstruction.
In order to calculate the intrinsic parameters and distortion coefficients, several
ready-to-use methods are available, including a dedicated toolbox function for camera
calibration in MATLAB. For calibrating Kinect however, an open source tool called

66
GML C++ Camera Calibration Toolbox [78] was utilized. Reference checkerboard
5×6 matrix, with each square size of 30×30mm, was developed and coated to be taken
underwater. In addition to the black and white checkerboard, a coloured checkerboard
was also printed, to test some colour restoration algorithms on images acquired by the
RGB camera. This colour corrected images can then be used for generating coloured
3D meshes if the images acquired are taken under sufficient light. Results of the
camera calibration procedure, along with the coefficients calculated are discussed in
detail in section 4.2.2.
Figure 3.11: Pictures of (a) black and white calibration checkerboard and (b) colour
checkerboard taken underwater from the Kinect RGB camera.
3.3.2 Time of Flight Correction in Underwater Environment
KinectToF calculates depth by emitting a continuous wave of IR from the embedded
NIR source and measuring the phase difference between transmitted and received
signals. The hardware calculates the time it takes for the returning beam to calculate
the distance. However; KinectToF does not consider the difference of speed of light in
different mediums. Although trivial in nature, this results in the creation of 3D meshes
at an incorrect distance from the camera position. Since KinectToF measures the time
for the return of the NIR rays, the measured depth by KinectToF is reported to be farther
than the actual distance to the object, as it takes longer for the signal to return due to
light propagating at a slower speed.

67
Additionally, since KinectToF is encased in a housing, the infrared light must pass
three different mediums, as shown in Figure 3.12, First is air between the housing
inner face and the imaging sensor, second is the housing material and last is water.
Originating from KinectToF, the NIR beam will therefore face two media transitions.
The actual distance measured by KinectToF at each pixel (dpixel) will be a sum of the
three different distances, namely: the distance between the image sensor and the
housing’s inner face (dair), the thickness of the housing material (dperspex) and the
distance in water to the actual object or surface (dwater). Similarly, the time taken by
the NIR beam by KinectToF is also split into three different parts, as given in Eqn.
(3.12) and (3.13) respectively:
= ( )water pixel air perspexd d d d (3.12)
( )water pixel air perspext t t t (3.13)
The original time used by KinectToF for calculating the depth (twater) can be found
and updated using Eqn. (3.14) and (3.15):
pixel perspexairpixel air perspex
air air perspex
d ddt t t
c c c (3.14)
( )water pixel air perspext t t t (3.15)
The new time in water can then be used to calculate the new distance (dcorrected)
using the speed of light in water as given in Eqn. (3.16). This corrected distance can
then be used to update the new depth at each pixel in water by Eqn. (3.17).
corrected water waterd t c (3.16)

68
Figure 3.12: Calculating the corrected time of flight values
pixel corrected air perspexd d d d (3.17)
As a result, the updated depth value calculated is closer than the one calculated
by KinectToF. The same calculation is performed for each 512×424 depth image, to
get the actual depth at each pixel. This results in a depth value that is closer than the
one calculated by Kinect as shown in Table 3.2
Figure 3.13: Simulated depth distance (mm): measured (red) vs actual (blue)
Water
Perspex
Air( = 1.00)η
( = 1.49)η
( = 1.33)η
Kinect Plane
Incident NIRray
(not to scale)
dshift
dair
dcorrected
tperspex
tair
θ
θperspex
θwater
twater
dperspex
dwater
Act
ua
l dis
tan
ce

69
Table 3.2: Measured vs actual distance measured by Kinect under water
Measured Distance (mm)
500 550 600 650 700 750 800 850 900
Actual Distance (mm)
375 412.5 450 487.5 525 562.5 600 637.5 675
3.3.3 Distortion Removal for ToF Camera in Underwater Medium
Images acquired by cameras used underwater show a distinct distortion. This
distortion is much more evident for depth images and the resulting point clouds of a
flat wall or surface. The visible effect of this is an alteration in the reconstructed mesh
of a flat surface into a peculiar concave shape that is bulging towards the camera along
the corners and pinched backwards from the centre. The effect is significantly
enhanced when the depth data is acquired in underwater environment. This
amplification in distortion is due to the refraction of light in water and the effect of
the transparent housing, both of which will have to be incorporated in the mesh
generation code. The correction developed for removing this unwanted distortion can
be defined as being a two-stage process. The first being the distortion in the point
cloud due to the refraction of infrared light in water, whereas the second stage is the
removal of pin-cushion optical distortion, which is also visible in the RGB images.
Both stages are discussed in detail below.
3.3.3.1 Refraction Correction of Depth Data in Underwater
Point clouds acquired by KinectToF underwater show significantly amplified
pincushion radial distortion that is significantly amplified than the distortion
measured in air by Butkiewicz [48]. This distortion is much more visible for depth
images of a flat surface where the reconstructed mesh shows a concave shape, bulging
towards the camera along the corners and pinched backward from the center. The
concave nature of the acquired point cloud can be visualized as shown in Figure 3.14,
which illustrates the detection of a depth point in water. The cause of this unwanted
amplified distortion is due to the fact that the pinhole camera model has been

70
developed for taking images in air, where the incident light does not have to interact
with different mediums (other than the lens of the camera) for image formation
process. But in underwater environment, where the camera is enclosed in a casing,
the speed of light is different in different medium. This interaction first must be
modelled and the resulting effect to be incorporated in underwater 3D mesh creation.
Figure 3.14: Formation of virtual image at due to refraction
As illustrated in Figure 3.14, the point detected is in-line with the incident NIR
ray along the normal to the actual point. As we move away from the center, the error
increases with the increase in the angle of incidence of the NIR ray. The rays of light
along the centre of the camera face nearly zero refraction as compared to the rays in
the outer layers and edges. Note that it is assumed that NIR emitters and the depth
camera sensor have no horizontal offset between them and the principal axis of the
depth camera is aligned with the optical axis of the image sensor, for the sake of
simplification of the problem.
Kinect Plane
Actual depth
Water
Perspex
Air( = 1.00)η
( = 1.49)η
( = 1.33)η
(not to scale)
dshift
Measured depth

71
Using Snell’s law, it can be shown that the shift in the depth (dshift) is dependent
on incident and refraction angles and the actual depth measured. Using the
nomenclature defined in Figure 3.12, we define the incident angle as air and
refracted angle in Perspex as perspex for a single ray originating from KinectToF and
passing through the space of air between the sensor surface and the Perspex housing.
The refracted angle from Perspex to water is given by water . Note that the only
numerical measures available are the uncorrected depth value and the thickness of
Perspex. Using the Law of Sines the shift in the depth shiftd can be derived as given
by equations (3.18), (3.19) and (3.20).
Figure 3.15: Calculating refraction of a ray of light for two materials resulting in a
shift in perceived depth
1sin(90 )
mdb
(3.18)
1 22
.sin( )sinshift
bd
(3.19)
1
2
Incident IR ray
RefractedIR ray
dshift
b
θ
θ
2θ
dair tair
dcorrectedduncorrected

72
1 2
1 2
sin( )
sin(90 ) sinmeasured
shift
dd
(3.20)
1
2
where:
shift in distance measured
Incident angle
Refracted angle
shiftd
This shift must be incorporated for every pixel in the (512×424) depth image by
calculating the incident angles, refraction angles and radial depths of each pixel with
respect to the principal axis of the depth camera. The incident and refracted angles
are first calculated for the transition from air to Perspex. The refracted ray then
becomes the incident ray and the angles are recalculated for Perspex to water. To
calculate the incident and refracted angles, we assume that a single ray of light is
generated for every pixel of the image sensor and returns to the same sensor pixel
after being reflected by the scene in the FoV. This method is analogous to the ray-
casting technique used in the field of computer graphics. We first translate all the
pixel locations from the 2-dimensional Cartesian coordinate system (x, y) to a 3-
dimensional spherical coordinate system (r, θ, φ). This is done by two simple
rectangular to polar trigonometric transformation, and can be defined by the following
core set of spherical trigonometric equations:
2 2 2x y zr r r r (3.21)
1 1
2 2 2cos cos
z z
x y z
r r
rr r r
(3.22)
1tany
x
r
r (3.23)

73
Figure 3.16: Spherical to image coordinate conversion
The result is three 512×424 matrices, one for the radial distance r, one for the
inclination angle (in radians) and one for the azimuth angle φ (also in radians). Using
the θ and angles, we can calculate orthogonal projections of the radial distance r
along the z-axis.
Mathematically, let the spherical coordinates of the ray segment inside the
housing be denoted by z airr , its projections by ,zx air zy airr r and angles by ,air air ,
respectively. After striking Perspex, the NIR ray changes path after refraction and
,air air become the incident angles. This new path is denoted by
, ,z perspex zx perspex zy perspexr r r and ,perspex perspex for magnitude, projections, and angles
inside Perspex, respectively. Lastly, the NIR ray is refracted again as it moves from
Perspex to water and the path is traced to depth values in the water. The spherical
coordinates are denoted by , ,z water zx water zy waterr r r and ,water water for magnitude,
projections, and angles in water, respectively. The magnitude zy waterr will be the new
depth value in water along the z-axis, incorporating the effect of refraction of all the
mediums as it has been traced along the entire path. The error in distances for each
pixel can be calculated by subtracting the original depth value dpixel from zy waterr . The
entire process can be visualized in figure 3.18.
m
n
2D Image
y
zxθ
φ
Spherical coordinates
(r ), , θ φ
ryrx
rz

74
Figure 3.17: Projections of a depth point on the Kinect sensor image plane
Figure 3.18: Methodology to trace the light ray path for each depth pixel
In the above figure, the yellow plane is the x-axis projection of the light ray; the
blue plane is the y-axis projection plane of the light ray. The result of this ray tracing
method is visible in the point clouds and the 3D mesh created, where the concave
nature of the plane is significantly fixed and a concave plane is adjusted to form a
corrected, flatter plane, before getting to the actual 3D mesh results. Incorporating
(0,0)
(212,-256) (212,256)
(-212,-256) (-212,256)
θ
φ
xaxis
z daxis ( epth)
rz
rzx
rzy
yaxis

75
refraction angles and calculating X and Y projections for all the pixels in the 512x424
depth image, we can find the actual position of the point. Results have been simulated
on depth plane that is curved around a centre axis, simulating a type of pincushion
distortion, as given in figure 3.19.
It can be seen that by tracing the ray paths originating from a NIR sensor and
captured by the IR imaging camera, both of which are assumed to be concentric, a
correction can be calculated incorporating the effect of different refraction angles for
different medium. A pseudo code of the above-devised method is given as algorithm
1 to explain the process further.
(a) (b)
Figure 3.19: (a) Bottom plane (blue) is the simulated curved point cloud whereas the
top (yellow) is the refraction corrected point cloud (b) A plot of the calculated error
distance that grows larger error as the distance from central axis increases.

76
Algorithm 1: Refraction correction 1: // get incident ray matrix (θand φ) 2: for i= +Vertical FOV to -Vertical FOV in 424 steps 3: for j= +Horizontal FOV to -Horizontal FOV in 512 steps 4: φair = i, θair = j; 5: end 6: end 7: for each image pixel u ∈ depth image Di 8: // calculate new refracted angles for air → Perspex ray 9: [θperspex, φperspex] = calculateRefractedAngles(θAir, φAir, ηair, ηperspex); 10: // calculate ray projection magnitudes for Perspex 11: [rzx_perspex, rzy_perspex] = calculateRayLengths(θperspex, φperspex); 12: // calculate new refracted angles for Perspex → water ray 13: [θwater, φwater]=calculateRefractedAngles(θperspex,φperspex,ηperspex,ηair); 14: // calculate ray projection magnitudes for water 15: [rzx_water, rzy_water] = calculateRayLengths(θwater, φwater); 16: end 17: corrected_depth_value = rzy_water; 18: dShift = rzy_water - depth_img;
3.3.3.2 Pincushion Distortion Removal in Depth Images
In addition to the refraction correction devised in above section, the concave nature
of the generated mesh was not fully reduced. This was deduced to be because of the
camera calibration issues of KinectToF. Due to unavailability of the camera
specifications and technical details from Microsoft (being their proprietary product),
significant research has been done by researchers in not only calculating the working
principles of the device but also properly calibrating the RGB, depth and IR cameras
of both versions of Kinect. The Kinect SDK v2.0.x provides some hard-coded
calibration values, but camera calibration varies from device to device, it must be re-
done for a more accurate alignment. Since the Kinect camera has been calibrated for
use in open air, the camera calibration values must be recalculated to cater for the
distortion produced by the housing and refraction in water. By recalibrating the
camera and implementing the calibration model in removing the pin-cushion
distortion, it was estimated that the last of the remaining radial distortion effects

77
would be significantly reduced, thereby generating a much flatter 3D mesh in addition
to using the above designed ray-tracing methodology.
3.3.4 3D Point Cloud Noise Filtering in Turbid Medium
All types of data acquisition in underwater faces noise in the medium. As water is
rich environment for suspended microbial, invisible and semi invisible life forms, any
sensor, whether acoustic (sonars) or optical (RGB or depth cameras) working in water
has to cater for unwanted reflections of the sensor rays from these suspended bodies.
Furthermore, just as air has a significant amount of dust and smog particles, water
also has a lot of suspended particles alongside living organisms. Both these are the
cause of significant in all sorts of data and thus must be actively cancelled out before
the data can be used further. This noise is in addition to any noise generated inherently
by the sensor itself and therefore mandates the addition of a layer of complex and
often computationally expensive noise removal algorithms and techniques as part of
the pre-processing stage.
The depth data from Kinect has a significant amount of random noise. This noisy
depth data is due to the way Kinect works. To capture the depth of a scene and its
contents, the scene is illuminated with infrared light, and the reflected rays are
captured by the imaging sensor. These reflections for a single pixel are often from
multiple objects of the same IR ray. The noisy data and multiple reflections are
cleaned out the onboard embedded processors before being forwarded to the image
acquisition drivers on the PC side. Nevertheless, there is no fixed depth data of a
single point over multiple frames. This results in noisy depth values being reported
over several frames of a single pixel. This in turn leads to noisy depth data of an
entirely flat surface, on each frame. A sample point cloud view is given in figure 3.20.
As can be seen, the point cloud acquired which looks quite clean and clear to the
Kinect (figure 3.20 (d)) is quite noisy when seen from the left view
(figure 3.20 (c)). The point cloud is acquired with a large amount of random points
that are detected by suspended particles and other microbial life that reflects the

78
infrared rays in water. The red line in the left view is the minimum limit the Kinect
can measure depth data, limited by design at 500mm.
Figure 3.20: Front and left views of acquired noisy point cloud
As briefly explained in section 2.5.4, Kinect fusion includes a bilinear filter for
cleaning the depth data before fusing it in a mesh. However, since in general, air in a
normal environment does not have any significant number of suspended particles that
reflect infrared rays, therefore a simple bilinear filter is sufficient for normal use.
However underwater environment poses a significantly more challenging
environment for underwater imaging in any wavelength. The number of suspended
particles in the natural underwater environment increases exponentially in
comparison to open air. Furthermore, due to refraction, the amount of reflection from
rays particularly at outer periphery of the sensor increases quite a lot.
To cater for this additional noise in under water medium, additional filtering has
to be done in the pre-processing stage. However, in order to achieve real-time

79
processing, the filtering has to be fast enough so that the performance is not slowed
down too much. Several popular filters exist for filtering noisy image data in 2-D
images. Since the noise can be categorized as of salt and pepper type, therefore a
median filter was the best suited for the particular case. A median filter works by
arranging the depth values in a fixed window in ascending order and replaces the
centre of the kernel with the median of the values which is the centre of the sorted
range. The index of the median value is given by ( 1 2)C N where C is the centre
pixel of N number of pixels in a window. This is better than a simple averaging kernel
as using a median avoids any bias in the depth values, and helps remove any abnormal
depth values in the field of view. A caveat is that since the filter is based on sorting
the values, which is a computationally expensive process, an implementation of the
filter has to be selected so that if that offers the fastest sorting. Similarly, the size of
the window controls the speed of the filter, with a bigger window leading to a much
slower filtering. Several implementations of median filters have been devised keeping
the performance in view, such as Zhang et al. [79] and Huang et al. [80]. A good
comparison of various median filter implementation has been discussed by Perreault
et al. [81]. Keeping in view the ease of implementation and performance speed, the
Fast Histogram based median filter was implemented, along with the normal sorting
based median filter for purely comparison purposes. The filter can be enabled or
disabled during the implementation, however the mesh is regenerated once the state
is toggled.
3.3.5 Customized Kinect Fusion Implementation
A software implementation of Kinect fusion, additional noise filterers, time of flight
and refraction correction algorithms implementation were an integral part of this
research work. The implementation of Kinect Fusion algorithm was adapted from the
original algorithm provided by Microsoft along with the SDK 2.0. Several tweaks and
alterations have been implemented to develop a customized software, with a
customized front end Graphical User Interface (GUI) developed in XAML, while the
backend was coded in C# language, using the Windows Presentation Foundation

80
(WPF) render for visualizing the 3D mesh. A brief explanation of the various
functions of the GUI is given in the figure 3.21.
Figure 3.21: The main user interface and sub-windows
A detailed explanation of the working of the software and its additional windows,
along with short user tutorial is explained in Appendix B. The software developed for
this research work using Kinect SDK 2.0 captures data from Kinect attached to the
USB port, or from the data being played back from Kinect Studio for processing in
real time. Data captured from the RGB and IR cameras is visible in real time, along
with the depth image generated. Additionally, a coloured image of the camera
tracking algorithm alignment results, color-coded by per-pixel algorithm output is
also visible, to analyse the tracking and alignment results. This may be used as input
to additional vision algorithms such as object segmentation. Values of the colour
image vary depending on whether the pixel was a valid pixel used in tracking (inlier)
or failed in different tests (outlier). A detailed flowchart of the Kinect fusion
implementation, along with the main function names is given in figures 3.22 and 3.23.
A detailed explanation of the user interface, its sub-windows and its usage
methodology has been provided in the appendix.

81
Figure 3.22: Kinect Fusion implementation flowchart (Kinect Fusion SDK function
names are written in red) (Page 1)

82
Figure 3.23: Kinect Fusion implementation flowchart (Kinect Fusion SDK function
names are written in red) (Page 2)

83
3.3.6 Qualitative & Quantitative Performance Criteria for 3D Meshes
The 3D reconstructed meshes need to be compared qualitatively and quantitatively.
Various researchers have defined several qualitative parameters for analysis of 3D
meshes such as [82], however no direct evaluation method is available for use with
3D reconstructed mesh. The parameters to evaluate the qualitative output of the
reconstruction results are subjective based on the user, and had to be selected
intuitively, based on the perceived visual appearance and quality of the output meshes.
The devised parameters for qualitative evaluations are given in table 3.3:
Table 3.3: Visual parameters for qualitative analysis
Parameter Description
Smoothness The mesh should form a discontinuous and smooth
surface, representing the original object being scanned
Feature preservation Major features of the original object must be retained and
make it easily distinguishable from the background
Keeping in view the methodology defined in section 2.6, the qualitative analysis
can be devised as a four-stage process. The first stage is the visual comparison
between meshes generated with the original Kinect Fusion code working in open air
for scanning the selected objects. These original scanned meshes form the ground
truth of the objects and can then be compared to the meshes generated by scanning
them underwater without any application of noise filtering. In the third stage, the same
meshes are reconstructed using the devised noise filtering. Lastly, the mesh is
regenerated using the noise filtering and time of flight correction incorporated. The
following flow chart can show the qualitative analysis workflow in figure 3.24.
Figure 3.24: Qualitative analysis comparison process

84
In order to quantitatively analyse the results, we need to do a mesh to mesh
comparison and calculate the sizes of the reconstructed objects. This is very easy for
the 3D printed objects selected for scanning, as the 3D models and meshes are
available which can be compared easily with the reconstructed meshes. For the
objects, whose 3D models are not available, the scanned mesh created by the original
Kinect Fusion application can be taken as ground truth data, as the scanning quality
of Kinect in air has already been proven to be quite accurate to the original object
being scanned. Once the object has been scanned in air, it can be cropped out of the
3D mesh scene while retaining its original dimension data for further use.
Several techniques have been previously developed for comparison of two 3D
meshes or two point clouds, or a combination of a mesh and point cloud. Several
popular programs are freely available for use such as MeshLab [83], CloudCompare
[84], etc. which provide the facility to compare two different meshes or point clouds
and give a numeric comparison based on one of the standard algorithms. Typically, a
triangular mesh is only a point cloud (the mesh vertices) with an associated topology
(triplets of 'connected' points corresponding to each triangle). So, a mesh can be
treated as a set of points in a 3D space. One of the most common methods of
measuring the distance between two sets of space is Hausdorff Distance. The
Hausdorff distance is a metric between two-point sets which measure the distances
that can relate the proximity of one set of points to another set of points. Therefore, it
can be used to determine the degree of resemblance of two sets of point clouds.
Mathematically it is described as the maximum distance of a set to the nearest point
in the other set, and is given by the following equation:
( , ) max{min{ ( , )}}BA
h A B
(3.24)
Where ψ and ω are points in sets A and B respectively. The metric σ(ψ,ω) can be
any distance metric like the Euclidean distance between two points. The distances can
then be represented as a colour heat map, indicating the deviation of each point from

85
the plane on a colour scale. An example plane and its heat map, when compared to an
ideal flat plane, is given in figure 3.3.
Figure 3.25: (a) Target point cloud (green) and reference point cloud (yellow)
(b) finding the distances of the point clouds (c) error heat map
In the simulated figure 3.3, the blue colour represents the closest distances (+ive
and -ive from the reference plane), green represents the medium (+ive and -ive from
the reference plane) and red represent the farthest distances (+ive and -ive from the
reference plane) values. An ideal plane that is completely aligned will have a single
colour heat-map. The colour scales can be represented differently as well, but the
overall concept remains the same.
3.4 Experimental Setup
To acquire 3D Kinect data in underwater environment, multiple data acquisition
experiments were done. These experiments were done in controlled environments and
the results are assumed to be similar in deeper natural environments. Two locations
were selected for data collection, based on the type of conditions they offered. The
locations used were the Offshore Experiment Lab and the swimming pool available
within UTP premises. The offshore lab houses a Wave Flume (Edinburgh) and a Wave
Tank (HR Wallingford) that is 10×20×1.5 (W×L×H) meters and has a variable depth

86
of up to 1.5 m. The stagnant water contained in the tank has turbidity, with suspended
particles and small amounts of algae in the water. The swimming pool provides clear
water with no visibility issues in the RGB domain. The depth of the pool available is
1.5 m on the shallow side, which increases to 3 m on the deeper end of the pool. The
pool provides an ideal controlled environment that has clear water free from any
visible suspended particles.
Figure 3.26: Experimental setup for data acquisition at swimming pool and offshore
experiment facility at UTP
3.4.1 KinectToF Underwater Dataset and Selection of Test Objects
Although significant research has been done in underwater environment, with data
acquired from various sensors and methods, however, there is a significant lack of
publicly available datasets of underwater 3D imaging. This is partly due to the
challenges in the acquisition of data in underwater environment, as not only the
equipment required is costly and specialized, but there is significant effort required

87
for the design of data acquisition of experiments in underwater as special care must
be taken for usable data acquisition. Since no one has used the KinectToF for acquiring
underwater images, this research required the acquisition of data underwater to test
the hypothesis. The data acquired by Kinect have been saved for offline simulation
and testing as well. Microsoft provides several tools bundled with the Kinect SDK,
one of them being the Kinect Studio. This is a closed source tool developed by
Microsoft, that allows capturing complete Kinect data from all its cameras and
provides RGB, IR and depth data along with the audio input from the array of
microphones in Kinect. Furthermore, the Kinect Studio also captures and displays 3D
point clouds and body tracking data in real time. These data streams can also be saved
for further analysis and processing in a closed proprietary file format (*.xef). These
files can later be loaded in the Kinect studio and seamlessly connected to the Kinect
drivers, simulating the sensor for use with any custom application using the Kinect
drivers and SDK. For this research, the data acquired in underwater were captured
using Kinect Studio so the data can be processed post collection. The objects were
first scanned outside of water to acquire a ground truth mesh. The same objects were
scanned again under water. The raw data of both these phases are available at the
above-referred link. Details of the Kinect Studio version used, and other
miscellaneous details are as follows:
Kinect Studio Version: 2.0.1410.19000
Kinect Sensor Version: 4.0.3916.0
Windows Environment: Windows 10 (Version 1607, Build 14393)
One of the major inherent requirements of Kinect fusion, like any image
reconstruction algorithm, is that the objects or view of interest must have distinct
features that can be processed. As Kinect works in the NIR spectrum, it is imperative
that the features of interest must be visible in the infrared spectrum. This requirement
dictates the selection of objects for scanning, as distinct features that are visible in
RGB domain such as textures or patterns are not necessarily also visible in infrared.
Also since there is absorption of the light spectrum wavelengths in water, the
textures on any object surface are less distinguishable than in open air. For scanning

88
under water, it is preferable that the objects and should have easily distinguishable
and angular edges and faces, so the difference in depth is noticeable. Objects that have
a surface normal that can be easily calculated will result in a better and smoother
mesh, whether captured in open air or underwater. Very fine textures or intricate
surface designs are not easily distinguishable under water and do not make a good
reconstruction test target. Therefore, based on these requirements, the following
objects listed in table 3.4 were selected for scanning, and have been used throughout
the results section.
For qualitative and quantitative analysis, the objects detailed in table 3.4 were
selected as they provided a diverse variety of characteristics such as material, shape,
features for comparison. Several objects that were scanned proved to be helpful in
testing the limitations of the proposed system and algorithms which have been
discussed in detail in section 4.2.3.
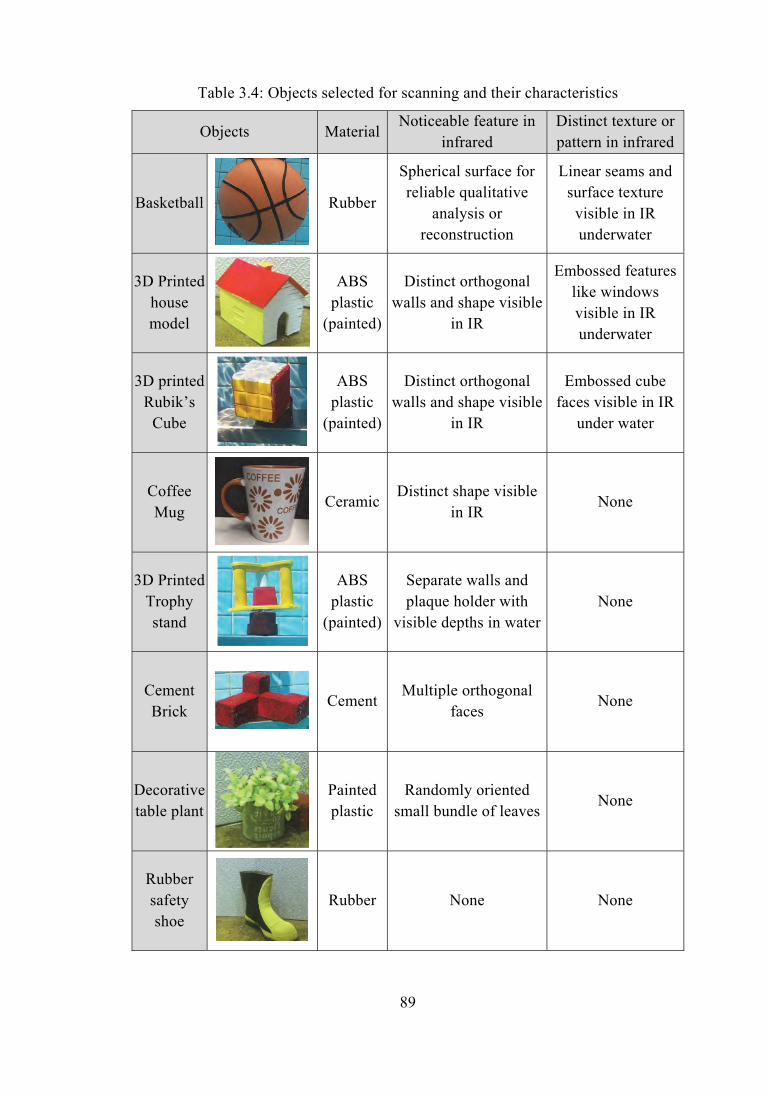
89
Table 3.4: Objects selected for scanning and their characteristics
Objects Material Noticeable feature in
infrared Distinct texture or pattern in infrared
Basketball
Rubber
Spherical surface for reliable qualitative
analysis or reconstruction
Linear seams and surface texture visible in IR underwater
3D Printed house model
ABS plastic
(painted)
Distinct orthogonal walls and shape visible
in IR
Embossed features like windows visible in IR underwater
3D printed Rubik’s
Cube
ABS plastic
(painted)
Distinct orthogonal walls and shape visible
in IR
Embossed cube faces visible in IR
under water
Coffee Mug
Ceramic Distinct shape visible
in IR None
3D Printed Trophy stand
ABS plastic
(painted)
Separate walls and plaque holder with
visible depths in water None
Cement Brick
Cement Multiple orthogonal
faces None
Decorative table plant
Painted plastic
Randomly oriented small bundle of leaves
None
Rubber safety shoe
Rubber None None

90
3.4.2 Uncorrected RGB, IR and Depth Images from Submerged Kinect
Several experiments were done under water to collect data for further analysis. The
objects mentioned in section 3.4.1 were scanned from several perspective points and
styles, and data was extracted from the *.xef files in image form. Some sample RGB,
IR and depth images are given in figure 3.27. Analysis of the raw images collected
shows a significant amount of pincushion distortion in the RGB and IR cameras. The
distortion in the IR camera is transmitted to the depth image, and thus the generated
point cloud. The effect of turbid water in the RGB and IR images can be seen easily,
as well as the performance of the RGB camera in the absence of any external light
source.
As is clear from the above raw RGB images taken underwater from inside a
protective casing, there is a clear distortion in the RGB images that can be defined as
a type of pincushion distortion. As Kinect has been pre-calibrated only for use in air,
the cameras are necessary to be recalibrated, using the procedure defined in section
3.3.1. In addition to the distortion, since Kinect is a ToF sensor and calculates depth
by measuring time for the light to return, the actual depth calculated in underwater
environment is different than the ones originally reported by Kinect. The results of
these corrections are discussed in detail in the following sections. These additions
also become the major contributions of this thesis, wherein the standard Kinect Fusion
algorithm is adapted to work for Kinect working in a sealed enclosure under water.
Detailed discussion on the effects observed and the corrections devised are discussed
in subsequent paragraphs.

91
Figure 3.27: Raw images captured from KinectToF cameras under water (a) RGB (b)
depth (c) infrared
3.4.3 KinectToF RGB and IR Camera Calibration
The Kinect’s IR and RGB cameras were calibrated using a 7×8 (square size of 30
mm) checkerboard and the free calibration toolbox provided by the GML Camera
Calibration Toolbox [78]. While the RGB camera calibration was not that problematic
especially when done in clear water, the calibration of the IR camera under water was
not straight forward. The infrared images acquired were of very low intensity due to

92
the absorption of light. Therefore, the images had to be enhanced using simple
contrast adjustment techniques available in any decent image viewing software and
editor. Some calibration images used and their detected output, along with the
calibration values are given in figure 3.28. Adobe Photoshop® CC 2014 was used to
enhance the IR images using curve intensity adjustments of the histogram. Even after
enhancement, most of the images of the checkerboard were not usable due to the
additional noise enhanced during the adjustment process. Kinect Fusion Parameters
for Scene Reconstruction. Results of the camera calibration process are given in
section 4.2.2.
Figure 3.28: Infrared camera calibration underwater (a) original images (b)
enhanced IR images (c) calibration images used to calculate the parameters

93
3.4.4 Real-Time Data Collection, Scanning Rate and Parameters
Due to the computationally intensive 3D mesh construction in real time, Kinect fusion
requires that the data scanning rate be slow to avoid any blur or artifacts in the
acquired image. Since the data acquired under water have additional turbidity and
suspended particles causing unwanted blur in both the RGB and IR cameras, therefore
the scanning rate of the submerged objects had to be limited to a slow speed of a few
centimetres per second. Furthermore, as will be shown in the following sections, there
is an additional loss of depth data due to the absorption of NIR in water, for best mesh
recreation results, the scanning must be carried out so that most of the scene is
captured in the generated point cloud. Details and effects are discussed in detail in the
subsequent sections.
In addition to the scanning rate, the term ‘real-time’ in imaging applications can
be categorized as ‘firm real time’ and ‘soft real time’ as noted by [85]. The firm real-
time category requires the update rate to be at-least 30 frames per second whereas
‘soft’ real-time systems can be defined as image processing systems where the slow
processing rate of the intermediate frames does not affect the end product. Since
Kinect Fusion is significantly dependent on the hardware it is run on, including details
such as the amount of Physical RAM and VRAM available, along with the
specifications of the GPU or CPU being used, in addition to the quality of the point
cloud data being provided to the algorithm, therefore the mesh reconstructed falls in
the category of ‘soft real-time’ systems. Often, during the reconstruction process if
the quality of the point cloud does match a pre-set tracking error threshold, the mesh
reconstruction is paused until tracking is acquired again. Therefore, a reconstruction
rate of 30 fps is achievable, provided the processing hardware meet the algorithms
recommended requirements.
Kinect Fusion has several parameters that can be modified at runtime for
achieving a better working performance, such as voxel resolution, the number of
voxels per axis and the integration weight. The trade-off is the increase or decrease in
reconstruction performance versus quality of the mesh generated. As Kinect Fusion
is not designed to be a memory efficient algorithm [86] but focuses more on the speed

94
of reconstruction, the mesh being constructed cannot be very high resolution and
simultaneously cover a very large depth of scene. In order to efficiently use the
additional designed filters and refraction correction algorithm in addition to running
the memory expensive method, several parameters were tested to give the best balance
between speed and accuracy of the mesh. After much experimentation, the following
values were selected for the meshes given above and will be used throughout the
remainder of this document:
Voxel size (X-Axis): 256
Voxel size (Y-Axis): 256
Voxel size (Z-Axis): 256 or 384
Voxels per meter: 384
Integration weight: < 450 & >750
3.5 Summary
The main methodology of this thesis has been laid out in this chapter. As KinectToF is
not designed for under water use, a special casing was designed keeping in view the
various factors described in this chapter. The material selection of the transparent
sensor housing has been discussed in detail. The casing was developed using additive
manufacturing techniques, and went through rigorous simulations and stress analysis
to test if it could withhold the pressures of going under water. Results of the stress
analysis showed a large safety factor in the design. Issues regarding camera
calibration and their requirement for underwater images were also discussed in detail.
Time of flight correction to accommodate the change in measurement medium has
been described. The algorithm developed for distortion removal of the acquired depth
data and its mathematics and its implementation was explained in detail as well as
qualitative and quantitative comparisons to analyse the acquired results were
elaborated, which will be used to evaluate the results acquired in the subsequent
sections. Lastly, details about the experimental setup, the raw dataset acquired and
considerations while data acquisition were also explained.

95
RESULTS AND DISCUSSION
4.1 Overview
This chapter details the results of the complete algorithm pipeline starting from the
data collection from the Kinect inside the casing, outside and inside water. As already
defined in section 1.6, the primary objective of this research work was to investigate
the performance KinectToF sensor in underwater environment. Once the performance
has been gauged, an implementation of real-time solution for 3D reconstruction in
underwater is tested and results are generated and validated. To validate the results,
qualitative and quantitative methods are explored in detail, according to the
methodology defined in section 2.6. The resulting meshes are compared with ground
truth data collected from Kinect outside water along with comparisons with
parametric 3D meshes. Data was collected at multiple times and varying lighting and
water conditions and turbidity levels, details of which are given in the experimental
setup section below.
4.2 Performance of KinectToF Sensor in Underwater Environment
Since there is no prior information about the working of KinectToF under water, the
operation and performance of the sensor had to be evaluated before gathering any data
for reconstruction. The change in medium affects the working range and quality of
reconstruction of the sensor. These effects and the consequential performance
changes are discussed in detail in the following sections:

96
4.2.1 Kinect Depth Camera Performance in Underwater Environment
The most important and novel result for validating any further work was the proof of
concept that KinectToF can work in underwater environment. Since no prior work has
been done on this, therefore quantitative and qualitative results of Kinect’s working
were of crucial importance.
Figure 4.1: Reported vs actual depth of KinectToF in underwater environment
Since the Kinect ToF camera uses ~800-830nm NIR wavelength, the depth
measurement capability of the Kinect is strongly attenuated in underwater
environment due to the natural absorption property of water. Also, there is a hardware
limitation of the minimum depth that the KinectToF can measure, which is limited at
500mm. Experimental results showed that the Kinect successfully measures depth and
generates accurate dense point clouds of its FoV between a minimum of 500mm and
a maximum of ~850mm, as shown in Figure 2(b). However, the reliability of the any
depth data below 500 and after 850mm is dubious. This was confirmed by the results
acquired from the depth images, as shown in figure 4.2.
375
850
640
8000(mm)
4500
500
Kinect Plane
Maximum Kinect depth in air
Actual minimumdepth underwaterReported
minimumdepth underwater
(not to scale)

97
However, the images given in figure 3.3 were acquired at a different distance than
the ones reported by Kinect depth images. The actual working depth of Kinect is
around ~350 mm to ~650 mm instead of the reported depth of 500 mm to ~850 mm
working depth. This difference in the depth calculation is due to the change in the
working medium of the sensor. As previously discussed, the time of flight calculation
by the Kinect hardware assumes the sensor is working in open air. Due to the change
in the working medium, the values reported are not the actual values but are greater
than the actual depth of measurement. For a proper reconstruction, the time of flight
correction must be applied to the acquired depth images to reconstruct the scene at
the correct depth from the sensor, as detailed in section 3.3.2.
Figure 4.2: Original depth data reported by KinectToF

98
4.2.2 Camera Calibration and Distortion Correction Results
From the calibration data acquired, it can be seen that the distortion parameters under
water are greater than in air. This signifies that the distortion is enhanced significantly
when the IR camera is operated under water. The distortion parameters calculated can
then be incorporated into the Kinect Fusion code, which uses pre-coded calibration
parameters by default. By using these parameters, the effects of distortion that are
seen in the infrared and RGB cameras can be catered for while reconstructing the
scene.
Table 4.1: RGB camera calibration results in air and underwater
Parameter Name In air Underwater Focal length
(fx) 1032.66450 1947.3593 (fy) 1033.1741 1952.856
Principal Point
(qx) 972.3426 983.587 (qy) 532.6476 587.231
Distortion Coefficients
α 0.08708 1.05432 β -0.16515 -2.08232 χ -0.00321 0.01752 ζ -0.00345 0.016760
(a) (b)
Figure 4.3: RGB camera calibration results in air and under water (a) focal length
and principal axis values (b) distortion coefficients
0
500
1000
1500
2000
2500
fx fy qx qy
Inair Underwater
‐2.5
‐2
‐1.5
‐1
‐0.5
0
0.5
1
1.5
α β χ ζ
Inair underwater

99
Table 4.2: IR camera calibration results in air and underwater
Parameter Name In air Underwater Focal length
(fx) 391.096 ± 36.144 717.364895 ± 58.516 (fy) 463.098 ± 104.984 688.007761 ± 57.642
Principal Point
(qx) 243.892 ± 9.838 281.306232 ± 6.561 (qy) 208.922 ± 58.667 300.153537 ± 32.958
Distortion Coefficients
α 0.134547 1.580700 β -0.241541 -1.827172 χ -0.02839 0.204611 ζ -0.01516 -0.000325
(a) (b)
Figure 4.4: IR camera calibration results in air and under water (a) focal length and
principal axis values (b) distortion coefficients
The calibration values were tested by undistorting selected images other than
those for calibration. The results of the undistorted images are given in figure 4.5.
4.2.3 Effect of Colour and Material of Scanned Objects
Kinect works on the principle of NIR reflection from objects. If any object surface
absorbs or reflects the incoming ray in a different angle, then the device cannot get
any reading for that pixel.
0
100
200
300
400
500
600
700
800
fx fy qx qy
Inair Underwater
‐2
‐1.5
‐1
‐0.5
0
0.5
1
1.5
2
α β χ ζ
Inair underwater

100
Figure 4.5: IR image (a) original (b) undistorted using calibration parameter
This results in zero value pixels in the depth image acquired. The same was true for
objects being scanned under water, with some additional issues. Any object with a
black colour always showed zero-pixel values, irrespective of the material of the
object. This is possible because the strength of IR from the source inside Kinect is not
robust enough to get sufficient reflection from the parts. This observation was tested
on black rubber shoes, rusted metal pipes, black plastic objects and other materials.
Another observation while scanning was that rusted parts on metallic objects return
zero value whereas the remainder of the painted or non-rusted object resulted in a
depth value. Since corrosion estimation is not the focus of the research work, it leaves
an area that can be explored further in the future. Objects like small plants are hard to
reconstruct from the acquired data as the amount of noise in the depth data makes it
hard for the reconstruction to generate independent leaves etcetera. A summary of the
limitations of NIR sensing on different objects and materials listed in table 3.4 is
given below:
Table 4.3: Effect of colour and material of objects on underwater NIR scanning
Material Objects Scanning observations
Rubber Basketball, Safety shoe Black rubber parts do not reflect NIR
and return zero values. Coloured rubber parts have no negative effect
ABS plastic (painted)
House, Rubik’s Cube, Trophy stand, Decorative plant No observable negative effect on
point clouds Ceramic Coffee Mug Cement Cement Brick

101
4.3 Qualitative and Quantative Performance Evaluation
To evaluate the reconstructed 3D meshes, the performance criteria described in
section 3.3.6 was followed for the all meshes during the process. The qualitative
results without and with filtering have been described in the subsequent sections.
Intermediate results are also discussed to evaluate the performance of each of the
intermediate meshes generated after application of a filter.
Figure 4.6: Dense vs sparse point cloud under water
It is worth noting that Kinect fusion is designed to work on dense point clouds, as
it uses the entire depth frame for alignment. If the point cloud is sparse, then the
calculating the local minimum of each frame for alignment is not effective and the
tracking is lost quite frequently while scanning, as shown in figure 4.6. Due to the
effects of NIR absorption in water, significant depth data is lost and the point cloud
returned is sparse in nature.
An important consideration while reconstructing the meshes was found to be the
importance of the dense point cloud in the first frame of the mesh reconstruction.
Since ICP algorithm aligns the frames acquired in succession to the first frame of the
reconstruction, the quality of the first frame is very critical for the creation of a large

102
area mesh. Specifically, the first frame of the reconstruction should have dense point
cloud data, so the frames acquired can be aligned to it using ICP. If the first frame has
sparse point clouds, the mesh generated covers a much smaller area and should be
reset for better results. This can be done by using the ‘Reset Mesh’ button in the
software developed.
To quantitatively analyse the meshes, the meshes were compared to the ground
truth 3D models of objects. If the 3D models are not available, then a 3D scan of the
object (in open air) using Kinect was selected as the ground truth for the comparison.
The error calculation of the meshes is done using CloudCompare® a freely available
utility for 3D point cloud and triangular mesh processing. By aligning the ground truth
and the created mesh using ICP, the error in the distances after alignment is calculated
for every point. This can then be represented as an error heat map of the mesh.
Detailed discussion on the quantitative performance criteria has already been
discussed in section 3.3.6. The process followed for qualitatively and quantitatively
comparing 3D meshes generated in underwater environment can be defined by a
sequence of steps in a particular order as given in figure 4.7.
Figure 4.7: Steps for 3D mesh generation in underwater environment
In order to compare the results of all the intermediate steps, detailed comparison
of the results and each of the above steps from are presented in the sections below.
However, since the time of flight correction only adds a positive distance offset in the
entire mesh (towards the camera), therefore the results of ToF correction are already
incorporated within the results of refraction correction.
Meshfrom
KinectFusion
CameraCalibration
NoiseFiltering
TimeofFlightCorrection
RefractionCorrection

103
4.3.1 3D Reconstruction in Water by Unfiltered Kinect Fusion
The 3D meshes generated by the original and unaltered Kinect Fusion code, along
with the RGB images of the scene are given in figure. As can be seen from the images
in figure 4.8, while the general features of the scene are maintained, the meshes are
very noisy. Often, due to the noise in the data, Kinect Fusion process completely fails
to generate any mesh as the ICP algorithm fails to align the point clouds acquired.
This results in a completely noisy and garbage mesh.
Figure 4.8: (a) RGB image of scene (b) 3D reconstruction by Kinect Fusion only
(a) (b)

104
4.3.2 3D Reconstruction Results after Camera Calibration
Effect of camera calibration on the depth data is visible in Figure 4.9 where the tile
lines of the swimming pool were much straighter after incorporating camera
calibration parameters. The lens distortion correction coefficients calculated using the
GML camera calibration tool were found to be good approximations of the camera
parameters. The effect on other objects was not as visible distinguishable as on the
flat wall. There was also slight increase in the area of the mesh generated, since
camera calibration increases the area of point cloud matched by ICP.
Figure 4.9: (a) 3D reconstruction by Kinect Fusion only (b) Mesh after applying
camera calibration
(a) (b)

105
4.3.3 3D Reconstruction Results after Median Filtering
Once the mesh has been acquired in the water, noise filtering can be applied on the
mesh. Results of applying the mesh can be seen below in figure 4.10. It can be seen
that the additional unwanted noise generated by Kinect Fusion alone has been
significantly reduced. As a result of noise filtering, some sharpness in the mesh is also
reduced, but due to the overall cleaner point cloud data being passed on to ICP in
every frame, the alignment is easier, and the mesh generated are cleaner and better.
Note that the 3D mesh created are 1 voxel thick only and not generated as a solid, as
the mesh graphics are generated by ray-casting, a standard computer graphics scene
rendering technique.
Figure 4.10: Noise filtering results (a) results after camera calibration (b) mesh after
noise filtering
(a) (b)

106
4.3.4 3D Reconstruction Results after ToF and Refraction Corrections
The effects of time of flight and refraction correction on a mesh from the previous
stem (after applying noise filtering) can be seen below in figure. The objects are much
clearer around the edges and any aliasing effect on the 3D mesh are removed
efficiently, as visible in figure 4.11.
Figure 4.11: ToF and refraction correction results (a) mesh with median filter
(b) mesh after applying ToF and refraction correction
The effect of refraction correction can be seen much more clearly when a flat
surface is reconstructed, like the swimming pool wall shown previously. The pin-
cushion distortion that is generated, if the developed refraction correction filter is not
applied is quite visible, as shown in tables 4.4. This also leads to a poorly
reconstructed mesh as the alignment cannot be done if the camera moves over a
greater distance.
(a) (b)

107
Table 4.4: Front/side view of 3D reconstructed submerged swimming pool wall
3D reconstruction of submerged wall
Explanation
(a)
3D mesh of submerged wall created from
original Kinect Fusion algorithm. There
is significant amount of noise in the mesh.
Also, the centre portion is budged
significantly inwards, due to the
refraction effect, while the outer edges
are extended outwards.
(b)
3D mesh after applying camera
calibration. The centre buldge is much
flatter, the area of reconstruction inreases
slightly and the convex on the outer edges
significantly reduces.
(c)
3D mesh after applying median filter to
remove the salt and pepper noise in the
depth images while reconstructing. The
reconstruction quality is increased
significantly and noise is removed. The
significant bulge in the center also
becomes more clear.
(d)
3D mesh reconstructed after applying
camera calibration, smoothing, time of
flight and refraction correction filters.
The inward bulge in the centre is almost
gone and the error from a flat plane
reduces to
±5 mm error.
(Front) (Side)
(Front) (Side)
(Front) (Side)
(Front) (Side)

108
Figure 4.12: Alignment error maps of 3D reconstructed mesh of a submerged
swimming pool wall compared with an ideal plane, showing the refraction
correction results. green represents 0 mm error, red represents ≥ +20 mm error, blue
represents ≥ -20mm error. (From Left to right: Ideal reference plane, original Kinect
Fusion mesh, after camera calibration, after median filtering, ToF and refraction
corrected mesh)
To quantitatively analyse the effect of the proposed refraction correction
algorithm, alignment error maps of generated mesh were compared with the scanned
mesh with an ideal plane mesh as shown in Fig. 4.6 . Green colour in the heat map
represents 0 to ±5 mm error. Red represents ≥ +20 mm error whereas blue represents
≥ -20mm error. After applying median filter, quality of the mesh increased
significantly; the error decreased, and noise was removed. The significant inward
bulge in the centre (blue) due to refraction was reduced after applying refraction
correction. The mean error of the mesh after applying refraction correction was 1.3
mm with a standard deviation of 14 mm error. The slightly higher standard deviation
was due to the large errors along the edges and scattered mesh points as we move
away from the centre of the depth image. Results of RGB Image Mapped on 3D Mesh

109
Kinect Fusion allows for generating full-colour 3D meshes by mapping the
acquired RGB image on the mesh in real-time. The results can be exported in *.ply
format with all vertices and colour information. Some examples of RGB mapping on
the generated mesh are given in figure 4.13. After the data has been acquired and 3D
meshes have been generated, they can then be stitched together to form a continuous
3D mesh of the entire under water scene scanned by Kinect. Since the generation of
full-colour 3D reconstruction requires clear RGB images, there is a significant
dependency on the quality of RGB images and amount of light available in the
underwater scene. If the colour images acquired are clearer, due to the presence of
ambient light, then they can also be mapped on the reconstructed mesh. An overall
summary of the reconstructed results is given in table 4.5.
Figure 4.13: Results of RGB mapping on the generated 3D mesh (a) RGB image
acquired (b) 3D reconstructed scene (c) colour mapped mesh

110
Table 4.5: Additional object scan results in different conditions
Object Original scan in air or 3D model
Underwater scan from Kinect Fusion
code
Underwater scan with noise filtering, ToF and refraction
correction
Swimming pool wall air scan / 3D
model not available
(3D Model)
(3D Model)
(Aerial scan)
(Aerial scan)

111
Table 4.6: Error heat maps and gaussian distribution of error histogram of various
objects scanned underwater. Objects scanned are compared to original 3D CAD
model as well as with the 3D printed model scanned with KinectToF in the air
Description 3D Printed House 3D Printed Trophy
Stand 3D Printed Rubik’s
Cube
Ground truth
3D model of object
3D mesh scanned in
air
3D mesh scanned underwater
Underwater mesh vs 3D
model
Alignment error
heatmap
Error histogram statistics
(m)
Min 0.0 Min 0.0 Min 0.0 Max 0.00335 Max 0.10200 Max 0.03302 Avg. 0.00076 Avg. 0.00652 Avg. 0.00737 σ 0.00076 σ 0.00735 σ 0.00533
Underwater mesh vs air
scan
Alignment error
heatmap
Error
histogram
statistics
(m)
Min 0.0 Min 0.0 Min 0.0
Max 0.00335 Max 0.10929 Max 0.02655
Avg. 0.00076 Avg. 0.00033 Avg. 0.00430
σ 0.00076 σ 0.00684 σ 0.00399

112
Table 4.6 gives the alignment error heat maps and error histogram Gaussian
distribution of the several objects whose 3D model were available to be used as
ground truth. These objects were 3D printed and then scanned in air as well as
underwater. The corrected underwater mesh was then compared to the original 3D
model and the 3D mesh scanned in air, to generate an error histogram that is
represented as a heat map on the 3D mesh for visual clarity. As can be seen in the
results, we were able to achieve a mean error of ±6 mm with an average stand
deviation of 3 mm, thereby confirming that the reconstructed meshes were a close
approximation of the object being scanned. It is worth noting that Kinect Fusion is
designed to work on dense point clouds, as it uses the entire depth frame for alignment
using ICP. Because of NIR absorption and refraction in water, there was a significant
loss depth data and the point cloud returned was sparse in nature. If the point cloud is
sparse, then calculating the local minimum of each frame for alignment is difficult,
therefore the tracking was frequently lost while scanning. The importance of point
cloud in the first frame of the mesh reconstruction process was increased significantly
since ICP algorithm aligns the frames acquired in succession to the first frame of the
reconstructed scene.
As can be seen from the results in the results above, the meshes generated
underwater are significantly better than the ones generated by Kinect Fusion
algorithm without any additional filtering. This provides additional confidence that
the developed noise filtering and refraction correction are working as expected.
Without filtering option enabled, the mesh reconstructed is very noisy, with random
vertices being generated around the focused object or scene. It is often quite hard to
make out the target object in the scene if no filtering is used. After enabling filtering,
however, the results are quite satisfactory and the object is not only distinguishable
but also comparable to the original scans in air. While the reconstructed meshes are
not as sharp or clear as the original scans in air, the filters enable Kinect Fusion to
reconstruct meshes under water with much better accuracy compared to the original
air scans.

113
4.4 Comparison with Existing Methods
Even though RGB-D sensors appeared around 2007, there has been very little research
done for testing the performance of these cameras in underwater environment. Only
little research has been done on the various commercial depth cameras available and
only a few have actually been used fully immersed underwater, as discussed in section
0. A comprehensive list of the research done on testing RGB-D cameras underwater
has been given in table 2.2. At the time of writing of this thesis, no one has used the
KinectToF for underwater depth data acquisition before. The closest research that has
been done on data acquisition by fully submerged RGB-D sensors is by [14].
However, they have used the Intel RealSense sensor, which is a structured light sensor
similar to KinectSL. A comparison is given in table 4.7.
Table 4.7: Summary of comparison with similar work
Digumarti et al. [14] Proposed work
Sensor Intel RealSense KinectToF
Technology Structured Light Time of Flight
Fusion Technique InfiniTAM [87] Kinect Fusion [65]
Refraction correction Ray-casting based Ray-tracing based
Camera Calibration
Real-time (1 fps) (5 - 10 fps)
Scanning distance 200 mm 350 mm - 450 mm
Even though structured light uses NIR arrays to illuminate the scene in infrared
patterns, the methodology for calculating the per-pixel depth data is different as
compared to time of flight sensors. Furthermore, there is no data (point clouds, 3D
mesh or raw dataset) available for making a qualitative comparison of the output of
two methods. Therefore, a 1 to 1 comparison with their method is not possible.
However, a brief comparison of research work by Digumarti et al. [14] and our
proposed work is given in table 4.7.

114
We were able to achieve a frame rate of up to 10 fps on a system with Core-i7,
8GB Ram, Nvidia GTX, 765m graphics card and 256GB SSD storage. The increase
in mesh reconstruction performance as compared to the method proposed by
Digumarti et al. is due the change in refraction correction methodology to use a faster
ray tracing inspired method. A detailed performance analysis of the application was
performed in Visual Studio to find out the bottlenecks in the application that can be
removed or optimized to increase the performance of the code and achieve a higher
scene reconstruction frame rate. After analysing the performance proile, majority of
the computation power is taken up by the WPF framework and the data acquisition
from Kinect over USB 3.0. Secondly, out of all the implemented filters, refraction
correction and median filtering affect the performance more than the other filters and
camera calibration results. This is because even though the designed refraction
correction algorithm is efficient, it still consists of multiple trigonometric calculations
in every pass. If the code is multi-threaded and parallelized, the performance impact
of these filters can be significantly reduced.
4.5 Summary
In order to validate the proposed hypothesis of this research, the performance of
KinectToF in underwater environment was tested extensively. The sensor performed
reasonably good, by acquiring depth data at a reduced depth limit due to the
absorption of NIR in water. The point clouds acquired were analysed and the
developed time of flight and refraction correction techniques were tested on the
dataset acquired. The extensive data of RGB, IR and depth data was collected over
several experiments and in different water and lighting conditions. The algorithms
and performance have been evaluated qualitatively and quantitatively.
The overall 3D reconstruction of the objects and surfaces being scanned has been
found to be of acceptable quality. Visually, the reconstructed meshes resemble the
objects scanned. ICP registration errors were found to be low generally, with some
exceptions especially on the outlier points of the mesh which form some extended
vertices in 3D space. The refraction correction method developed provides real-time

115
performance and caters for distortions in the acquired data because of the different
media involved in the data acquisition. Lastly, since there is no work done earlier on
the KinectToF or any similar time of flight RGB-D sensor underwater, a
comprehensive quantitative analysis was not possible. However, a brief comparison
to the very few existing methods has been done.

116
CONCLUSION AND FUTURE WORK
In this thesis, a real-time underwater 3D scene reconstruction technique has been
proposed based on commercially available KinectToF sensor, which is a RGB-D time
of flight camera. The Kinect is widely used widely by roboticists and researchers for
3D scanning the normal open-air environments. In this research work, the same sensor
has been tested successfully to work underwater in an environment that it is not
designed for.
A special waterproof housing was designed that provided water ingress protection
without diminishing the performance or hindering operation of the sensor. The
complete hardware design intent and stress analysis simulations were done to evaluate
the validity of the design in higher pressures when it is submerged underwater. Kinect
was able to successfully acquire data at distances between 350 mm to 650 mm.
Camera calibration for both RGB and NIR camera was performed and a time of flight
correction methodology for adjusting ToF calculations to water was implemented. A
refraction correction technique inspired by standard ray-tracing techniques used in
computer graphics was also developed and tested sucessfully. Issues faced such as
noise and refraction correction and their counters were discussed at length.
Qualitative and quantitative results showed a mean error of ±6 mm with an average
stand deviation of 3 mm while scanning selected objects with varying material and
other properties. Comparison of the results achieved with a comparison to aerial
reconstruction versus underwater reconstruction is deliberated in detail and
characterized by comparing them with 3D CAD models and ground truth of scanned
meshes in air. A dataset of the scanned objects was developed and released publicly
for further research. Applications such as coral reef mapping and underwater SLAM
in shallow waters for a robotic solution based on ROV’s can be a viable application
area that can benefit from the results achieved by this research.

117
5.1 Contributions
Major contributions of this research work are summarized as follows:
An economical RGB-D camera has been shown to perform depth data
acquisition underwater, in a much harsher underwater environment than it was
designed for. Existing scene reconstruction algorithm Kinect Fusion has been
adapted to work underwater by pre-processing the data with noise filtering and
time of flight correction methods.
A dataset of Kinect 3D point cloud, RGB and IR data has been developed and
released publicly, including data of multiple objects with different
characteristics. The data set consist of underwater scanning experiments by
KinectToF in open air (ground truth) and in both clear and turbid underwater
setups, with varying levels of lighting.
A fast ray tracing based refraction correction technique has been developed
and implemented on acquired underwater point-cloud data. The methodology
has shown promising results by countering the effects of refraction on
underwater depth data by achieving a mean error of ±6 mm with an average
stand deviation of 3 mm.
A multi-part, waterproof, easy to assemble and 3D printable housing for
KinectToF has been developed that can be used for acquiring data underwater.
The design has also been released publicly.
5.2 Limitations and Future Work
The proposed research work adapts a sensor to work in a much harsher underwater
environment than it was designed for. Due to this, the depth measurement
performance of sensor has been reduced than its designed parameters. The distance
that the sensor can work is limited to small scale use only. Since the reconstruction
algorithms require dense point clouds for a high alignment and tracking performance,
the scanning process has to be carried out carefully. There is also some loss of detail
in the reconstructed meshes due to the noise faced in underwater environment. as the
original scene. However, since the results are promising for real-time small-scale 3D

118
reconstruction, there are several possibilities for further research and avenues for
improvement.
Since there is a scarcity of available underwater imaging datasets, the data
acquired for this research can be of valuable use for several other image processing
techniques as well as 3D reconstruction methods. Techniques like structure from
motion (SFM) and algorithms that are used for real-time colour correction and
contrast enhancement on underwater imaging data. can use the acquired dataset for a
multitude of purposes. As the refraction correction methodology is inspired from the
conventional ray-tracing techniques used in computer graphics, a parallelized
implementation can also be developed for significantly faster refraction correction
performance on real-time 3D scene reconstruction techniques.
Lastly, improved 3D scene reconstruction algorithms such as Kintinuous, that
improve on the original limitations of Kinect Fusion such as memory limit and scene
stitching for larger scene mesh can be used on the acquired data, including the
refraction correction technique developed for this research work to incorporate the
effects of refraction correction.

119
5.3 List of Publications
Journal Article
A. Anwer, S. S. A. Ali, A. Khan and F. Mériaudeau, " Underwater 3D Scene
Reconstruction Using Kinect v2 Based on Physical Models for Refraction and
Time of Flight Correction”, IEEE Access, 2017 (Q1, IF: 3.244)
Conference Proceedings
A. Anwer, S. S. A. Ali, F. Mériaudeau, "Underwater online 3D mapping and
scene reconstruction using low cost Kinect RGB-D sensor” 6th International
Conference in Intelligent and Advanced Systems (ICIAS), Malaysia, 2016
A. Anwer, S. S. A. Ali, A. Khan, F. Mériaudeau, "Real-time Underwater 3D
Scene Reconstruction Using Commercial Depth Sensor” in IEEE 6th
International Conference on Underwater System Technology: Theory and
Applications (USYS2016), Malaysia, 13-14 December 2016
A. Anwer, S. S. A. Ali, A. Khan, F. Mériaudeau, "Underwater 3D Scanning
Using Kinect V2 Time of Flight Camera” in 13th International Conference on
Quality Control by Artificial Vision (QCAV2017), Japan, 14-16 May 2017
A. Anwer, S. S. A. Ali, F. Mériaudeau, "Customized Graphical User Interface
Implementation of Kinect Fusion for Underwater Application” in IEEE 7th
International Conference on Underwater System Technology: Theory and
Applications (USYS2017), Malaysia, 18-20 December 2017

120
APPENDIX A
HOUSING DESIGN DRAWINGS
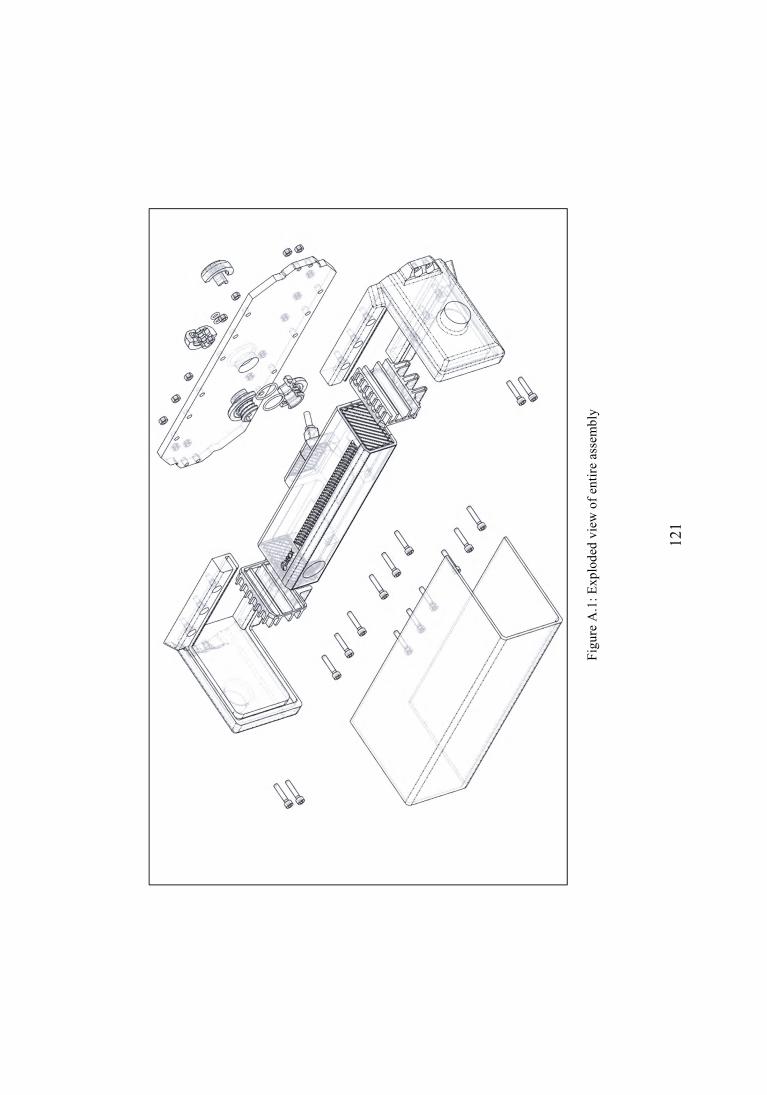
121
Fig
ure
A.1
: Exp
lode
d vi
ew o
f en
tire
ass
embl
y

122
Fig
ure
A.2
: Sid
e ho
usin
g ho
lder
s
Fig
ure
A.3
: Cas
ing
back
Pla
te

123
Fig
ure
A.4
: Cab
le g
land
(to
p an
d bo
ttom
) se
als

124
Fig
ure
A.5
: Kin
ect h
olde
rs

125
APPENDIX B
BRIEF DESCRIPTION AND WORKING OF KINECT FUSION INTERFACE

126
The software designed for this thesis is a customized implementation of the original Kinect Fusion,
available from Microsoft with the Kinect SDK 2.0. The GUI is comprised of a main window and two
sub-windows. The main window is split up in three parts, denoted by (1), (2) and (3) in the figure B.1.
The main panel (1) shows the real-time 3D scene reconstruction as Kinect is being moved in the 3D
space. The sub-panel (2) has three tabs, each showing the real-time RGB image, IR image and Delta
from reference image (more on this below). The third sub-panel (3) shows the real-time depth images
acquired.
Figure B.1: GUI of the developed software and Sub window launched from the main window
Options to control the various settings and filters are in the sub window that can be opened by
clicking the ‘Settings’ button on the main widnow. The voxel settings per axis as well as the voxel
density can be set by the sliders on the lower half of the sub windiow. If the tracking is lost during
reconstruction by Kinect Fusion, the mesh can be reset by clicking the Reset 3D mesh button (4). This
will resume the 3D mesh generation from the current frame acquired. Options to save the current RGB,
depth and IR frame is availble by clicking the ‘Save Screenshot’ button (9). This saves the three images
that are time-stamped to the ‘My Pictures’ folder by default. The generated 3D mesh can be saved by
clicking the ‘Save Point Cloud & 3D mesh’ button (10). The mesh can be saved in either *.stl, *.obj
and *.ply formats. Note that only ply format has the ability to save the mesh with the color image
mapped on top of it.
The ‘Delta from Reference Frame’ tab in the main window sub-pane (2) shows the data from the
camera tracking algorithm alignment results, color-coded by per-pixel. Values vary depending on
whether the pixel was a valid pixel used in tracking (green) or failed in different tests. It helps to
visualize how well each observed pixel aligns with the passed-in reference frame. Larger magnitude

127
values (either positive or negative) represent more discrepancy, and lower values represent less
discrepancy or less information at that pixel. The colour coding can be described by the table B.1.
Table B.1: Delta from reference frame colour coding
Value Description
White The input vertex was invalid and had no correspondences between the two point-
cloud images.
Green The outlier vertices were rejected (too large a distance between vertices)
Red The outlier vertices were rejected (too large a difference in normal angle between
the point clouds)

128
BIBLIOGRAPHY
[1] A. Hogue and M. Jenkin, “Development of an underwater vision sensor for 3D reef mapping,” in International Conference on Intelligent Robots and Systems (IROS), 2006, pp. 5351–5356.
[2] A. Khan, S. S. A. Ali, F. Meriaudeau, A. S. Malik, L. S. Soon, and T. N. Seng, “Visual feedback–based heading control of autonomous underwater vehicle for pipeline corrosion inspection,” International Journal of Advanced Robotic Systems, vol. 14, no. 3, p. 1729881416658171, 2017.
[3] “Fiskardo-Greece 2015 Underwater survey.” [Online]. Available: https://openexplorer.com/expedition/fiskardogreece2015. [Accessed: 02-Nov-2017].
[4] K. McClellan, “Evaluating the Effectiveness of Marine No-Take Reserves in St. Eustatius, Netherlands Antilles,” M.S. Thesis, Nicholas School of the Environment, Duke University, North Carolina, USA, 2009.
[5] “2G Robotics: Underwater Laser Scanners for high-resolution surveying.” [Online]. Available: http://www.2grobotics.com/. [Accessed: 03–01-2017].
[6] “Stanford’s Humanoid Diving Robot Takes on Undersea Archaeology and Coral Reefs.” [Online]. Available: http://spectrum.ieee.org/automaton/robotics/humanoids/stanford-ocean-one-humanoid-diving-robot. [Accessed: 03-Jan-2017].
[7] S. Krupinski, R. Desouche, N. Palomeras, G. Allibert, and M.-D. Hua, “Pool testing of AUV visual servoing for autonomous inspection,” IFAC-PapersOnLine, vol. 48, no. 2, pp. 274–280, 2015.
[8] A. Khan, S. S. A. Ali, A. S. Malik, A. Anwer, N. A. A. Hussain, and F. Meriaudeau, “Control of Autonomous Underwater Vehicle Based on Visual Feedback for Pipeline Inspection,” in Robotics and Manufacturing Automation (ROMA), 2016 2nd IEEE International Symposium on, 2016, pp. 1–5.
[9] J. Adams and J. Rönnby, “One of His Majesty’s ‘Beste Kraffwells’: the wreck of an early carvel-built ship at Franska Sternarna, Sweden,” International Journal of Nautical Archaeology, vol. 42, no. 1, pp. 103–117, 2013.
[10] A. Jaklič, M. Eric, I. Mihajlović, Z. Stopinšek, and F. Solina, “Volumetric models from 3D point clouds: The case study of sarcophagi cargo from a 2nd/3rd century AD Roman shipwreck near Sutivan on island Brač, Croatia,” Journal of Archaeological Science, vol. 62, pp. 143–152, 2015.
[11] S. M. Nornes, M. Ludvigsen, O. Odegard, and A. J. S.Orensen, “Underwater Photogrammetric Mapping of an Intact Standing Steel Wreck with ROV,” IFAC-PapersOnLine, vol. 48, no. 2, pp. 206–211, 2015.
[12] P. Ozog and R. M. Eustice, “Toward long-term, automated ship hull inspection with visual SLAM, explicit surface optimization, and generic graph-sparsification,” in 2014 IEEE International Conference on Robotics and Automation (ICRA), 2014, pp. 3832–3839.
[13] “3D at Depth .” [Online]. Available: http://www.3datdepth.com/. [Accessed: 05-2016].
[14] S. T. Digumarti, G. Chaurasia, A. Taneja, R. Siegwart, A. Thomas, and P. Beardsley, “Underwater 3D Capture Using a Low-Cost Commercial Depth Camera,” in Applications of Computer Vision (WACV), 2016 IEEE Winter Conference on, 2016, pp. 1–9.
[15] E. Lachat, H. Macher, T. Landes, and P. Grussenmeyer, “Assessment and Calibration of a RGB-D Camera (Kinect v2 Sensor) Towards a Potential Use for Close-Range 3D Modeling,” Remote

129
Sensing, vol. 7, no. 10, pp. 13070–13097, 2015.
[16] O. Sacks, Handbook of Chemistry and Physics. CRC press, 1999.
[17] G. M. Hale and M. R. Querry, “Optical constants of water in the 200-nm to 200-µm wavelength region,” Applied optics, vol. 12, no. 3, pp. 555–563, 1973.
[18] C. S. Inc., “Effects of Light Absorption and Scattering in Water Samples on OBS® Measurements,” no. 2Q-Q. 2008.
[19] “Colors at depth.” [Online]. Available: http://forums.watchuseek.com/f74/colors-depth-259540.html#post1889772. [Accessed: 25–12-2016].
[20] A. Khan, F. Meriaudeau, S. S. A. Ali, and A. S. Malik, “Underwater Image Enhancement and Dehazing Using Wavelet Based Fusion for Pipeline Corrosion Inspection,” in Intelligent and Advanced Systems (ICIAS), 2016 6th International Conference on, 2016, pp. 1–5.
[21] A. Khan, S. S. A. Ali, A. S. Malik, A. Anwer, and F. Meriaudeau, “Underwater image enhancement by wavelet based fusion,” in Underwater System Technology: Theory and Applications (USYS), IEEE International Conference on, 2016, pp. 83–88.
[22] A. Jordt, Underwater 3D Reconstruction Based on Physical Models for Refraction and Underwater Light Propagation, no. 2014/2. Department of Computer Science, CAU Kiel, 2014.
[23] R. Rӧttgers, D. McKee, and C. Utschig, “Temperature and salinity correction coefficients for light absorption by water in the visible to infrared spectral region,” Optics express, vol. 22, no. 21, pp. 25093–25108, 2014.
[24] M. D. Aykin and S. Negahdaripour, “On 3-D target reconstruction from multiple 2-D forward-scan sonar views,” in OCEANS, IEEE, 2015, pp. 1–10.
[25] I. Mandhouj, H. Amiri, F. Maussang, and B. Solaiman, “Sonar Image Processing for Underwater Object Detection Based on High Resolution System,” in SIDOP 2012: 2nd Workshop on Signal and Document Processing, 2012, vol. 845, pp. 5–10.
[26] X. C. J. S. N Hurtós, “Calibration of optical camera coupled to acoustic multibeam for underwater 3D scene reconstruction,” in OCEANS, IEEE, 2010, pp. 1–7.
[27] J. S. Jaffe, “Underwater Optical Imaging: The Past, the Present, and the Prospects,” IEEE Journal of Oceanic Engineering, vol. 3, no. 40, pp. 683–700, 2015.
[28] F. Bruno, G. Bianco, M. Muzzupappa, S. Barone, and A. Razionale, “Experimentation of structured light and stereo vision for underwater 3D reconstruction,” ISPRS Journal of Photogrammetry and Remote Sensing, vol. 66, no. 4, pp. 508–518, 2011.
[29] A. Sarafraz and B. K. Haus, “A structured light method for underwater surface reconstruction,” ISPRS Journal of Photogrammetry and Remote Sensing, vol. 114, pp. 40–52, 2016.
[30] F. Järemo Lawin, “Depth Data Processing and 3D Reconstruction Using the Kinect v2,” M.S. Thesis, Department of Electrical Engineering, Linköping University, Linköping, Sweden, 2015.
[31] L. K. Rumbaugh, E. M. Bollt, W. D. Jemison, and Y. Li, “A 532 nm chaotic Lidar transmitter for high resolution underwater ranging and imaging,” in Oceans-San Diego, 2013, 2013, pp. 1–6.
[32] M. Hammond, A. Clark, A. Mahajan, S. Sharma, and S. Rock, “Automated Point Cloud Correspondence Detection for Underwater Mapping Using AUVS,” in OCEANS’15 MTS/IEEE Washington, 2015, pp. 1–7.

130
[33] F. Santoso, M. A. Garratt, M. R. Pickering, and M. Asikuzzaman, “3D Mapping for Visualization 0f Rigid Structures: A Review and Cemparative Study,” IEEE Sensors Journal, vol. 16, no. 6, pp. 1484–1507.
[34] I. Rekleitis, J.-L. Bedwani, E. Dupuis, T. Lamarche, and P. Allard, “Autonomous over-the-horizon navigation using LIDAR data,” Autonomous Robots, vol. 34, no. 1–2, pp. 1–18, 2013.
[35] D. McLeod, J. Jacobson, M. Hardy, and C. Embry, “Autonomous inspection using an underwater 3D LiDAR,” in Oceans-San Diego, 2013.
[36] C. Cain and A. Leonessa, “Laser based rangefinder for underwater applications,” in American Control Conference (ACC), 2012, 2012, pp. 6190–6195.
[37] Z. Xie and Y. Wang, “Attenuation property analysis of lidar transmission in seawater,” in Measurement, Information and Control (MIC), 2012 International Conference on, 2012, vol. 2, pp. 1011–1014.
[38] B. Freedman, A. Shpunt, M. Machline, and Y. Arieli, “Depth Mapping Using Projected Patterns,” US Patent 8 50142, 13 May 2010.
[39] A. Shpunt, “Depth mapping using multi-beam illumination,” US Patent 8 350 847, 28 Jan 2010.
[40] J. Garcia and Zalevsky, “Range Mapping Using Speckle Decorrelation,” US Patent 7 433 024, 7 Oct 2008.
[41] J. Sell and P. O’Connor, “The xbox one system on a chip and kinect sensor,” IEEE Micro, vol. 34, no. 2, pp. 44–53, 2014.
[42] C. Hertzberg and U. Frese, “Detailed modeling and calibration of a time-of-flight camera,” in Informatics in Control, Automation and Robotics (ICINCO), 2014 11th International Conference on, 2014, vol. 1, pp. 568–579.
[43] K. Khoshelham, “Accuracy analysis of kinect depth data,” in ISPRS workshop laser scanning, 2011, vol. 38, no. 5, pp. 12–18.
[44] K. Shifrin, Physical optics of ocean water. American Institute of Physics, New York, 1988.
[45] J. A. Curcio and C. C. Petty, “The near infrared absorption spectrum of liquid water,” JOSA, vol. 41, no. 5, pp. 302–304, 1951.
[46] C.-L. Tsui, D. Schipf, K.-R. Lin, J. Leang, F.-J. Hsieh, and W.-C. Wang, “Using a Time of Flight method for underwater 3-dimensional depth measurements and point cloud imaging,” in OCEANS, IEEE, 2014, pp. 1–6.
[47] A. Dancu, M. Fourgeaud, Z. Franjcic, and R. Avetisyan, “Underwater reconstruction using depth sensors,” in SIGGRAPH Asia 2014 Technical Briefs, 2014, p. 2.
[48] T. Butkiewicz, “Low-cost coastal mapping using Kinect v2 time-of-flight cameras,” in Oceans-St. John’s, 2014, 2014, pp. 1–9.
[49] H. Lu, Y. Zhang, Y. Li, Q. Zhou, R. Tadoh, T. Uemura, H. Kim, and S. Serikawa, “Depth Map Reconstruction for Underwater Kinect Camera Using Inpainting and Local Image Mode Filtering,” IEEE Access, 2017.
[50] H. Sarbolandi, D. Lefloch, and A. Kolb, “Kinect range sensing: Structured-light versus Time-of-Flight Kinect,” Computer Vision and Image Understanding, vol. 139, pp. 1–20, 2015.

131
[51] B. Langmann, K. Hartmann, and O. Loffeld, “Depth Camera Technology Comparison and Performance Evaluation.,” in ICPRAM (2), 2012, pp. 438–444.
[52] “Xbox 360 Kinect Teardown.” [Online]. Available: https://www.ifixit.com/Teardown/Xbox+360+Kinect+Teardown/4066. [Accessed: 24–03-2016].
[53] H. Gonzalez-Jorge, P. Rodriguez-Gonzálvez, J. Martinez-Sánchez, D. González-Aguilera, P. Arias, M. Gesto, and L. Diaz-Vilariño, “Metrological Comparison Between Kinect I and Kinect II Sensors,” Measurement, vol. 70, pp. 21–26, 2015.
[54] “Xbox One Kinect Teardown.” [Online]. Available: https://www.ifixit.com/Teardown/Xbox+One+Kinect+Teardown/19725.
[55] L. Shao, J. Han, P. Kohli, and Z. Zhang, Computer vision and machine learning with RGB-D sensors. Springer, 2014.
[56] M. Gesto Diaz, F. Tombari, P. Rodriguez-Gonzalvez, and D. Gonzalez-Aguilera, “Analysis and Evaluation Between the First and the Second Generation of RGB-D Sensors,” Sensors Journal, IEEE, vol. 15, no. 11, pp. 6507–6516, 2015.
[57] M. Bueno, L. Diaz-Vilariño, J. Martinez-Sánchez, H. González-Jorge, H. Lorenzo, and P. Arias, “Metrological evaluation of KinectFusion and its comparison with Microsoft Kinect sensor,” Measurement, vol. 73, pp. 137–145, 2015.
[58] C. D. Mutto, P. Zanuttigh, and G. M. Cortelazzo, Time-of-flight Cameras and Microsoft Kinect (TM). Springer Publishing Company, Incorporated, 2012.
[59] H. Gonzalez-Jorge, B. Riveiro, E. Vazquez-Fernandez, J. Martinez-Sánchez, and P. Arias, “Metrological evaluation of Microsoft Kinect and Asus Xtion sensors,” Measurement, vol. 46, no. 6, pp. 1800–1806, 2013.
[60] N. M. DiFilippo and M. K. Jouaneh, “Characterization of different Microsoft Kinect sensor models,” Sensors Journal, IEEE, vol. 15, no. 8, pp. 4554–4564, 2015.
[61] M. Andersen, T. Jensen, P. Lisouski, A. Mortensen, M. Hansen, T. Gregersen, and P. Ahrendt, “Kinect Depth Sensor Evaluation for Computer Vision Applications,” Technical Report Electronics and Computer Engineering, vol. 1, no. 6, 2015.
[62] A. Corti, S. Giancola, G. Mainetti, and R. Sala, “A metrological characterization of the Kinect V2 time-of-flight camera,” Robotics and Autonomous Systems, vol. 75, pp. 584–594, 2016.
[63] E. Lachat, H. Macher, M. Mittet, T. Landes, and P. Grussenmeyer, “First experiences with kinect v2 sensor for close range 3d modelling,” The International Archives of Photogrammetry, Remote Sensing and Spatial Information Sciences, vol. 40, no. 5, p. 93, 2015.
[64] A. Maykol Pinto, P. Costa, A. P. Moreira, L. F. Rocha, G. Veiga, and E. Moreira, “Evaluation of Depth Sensors for Robotic Applications,” in Autonomous Robot Systems and Competitions (ICARSC), 2015 IEEE International Conference on, 2015, pp. 139–143.
[65] R. A. Newcombe, A. J. Davison, S. Izadi, P. Kohli, O. Hilliges, J. Shotton, D. Molyneaux, S. Hodges, D. Kim, and A. Fitzgibbon, “KinectFusion: Real-time dense surface mapping and tracking,” in Mixed and augmented reality (ISMAR), 2011 10th IEEE international symposium on, 2011, pp. 127–136.
[66] “Using Kinfu Large Scale to generate a textured mesh.” [Online]. Available: http://pointclouds.org/documentation/tutorials/using_kinfu_large_scale.php. [Accessed: 12-3/17].

132
[67] T. Whelan, J. Mcdonald, M. Kaess, M. Fallon, H. Johannsson, and J. J. Leonard, “Kintinuous: Spatially Extended KinectFusion,” in 3rd RSS Workshop on RGB-D: Advanced Reasoning with Depth Cameras, 2012.
[68] M. Solony, “Scene reconstruction from kinect motion,” in Proceeding of the 17th conference and competition student EEICT, 2011.
[69] K. Jahrmann, “3D Reconstruction with the Kinect-Camera,” M.S. thesis, Faculty of Informatics., Vienna University of Technology, Vienna, Austria, 2013.
[70] F. Endres, J. Hess, N. Engelhard, J. Sturm, D. Cremers, and W. Burgard, “An evaluation of the RGB-D SLAM system,” in Robotics and Automation (ICRA), 2012 IEEE International Conference on, 2012, pp. 1691–1696.
[71] A. Handa, T. Whelan, J. McDonald, and A. J. Davison, “A benchmark for RGB-D visual odometry, 3D reconstruction and SLAM,” in Robotics and Automation (ICRA), 2014 IEEE International Conference on, 2014, pp. 1524–1531.
[72] S. Kim and J. Kim, “Occupancy mapping and surface reconstruction using local gaussian processes with kinect sensors,” IEEE TRANSACTIONS ON CYBERNETICS, vol. 43, no. 5, pp. 1335–1346, 2013.
[73] Z. Zhu and S. Donia, “Spatial and visual data fusion for capturing, retrieval, and modeling of as-built building geometry and features,” Visualization in Engineering, vol. 1, no. 1, pp. 1–10, 2013.
[74] “Optical & Transmission Characteristics - Plexiglass.com.” [Online]. Available: http://www.plexiglas.com/export/sites/plexiglas/.content/medias/downloads/sheet-docs/plexiglas-optical-and-transmission-characteristics.pdf. [Accessed: 24–03-2016].
[75] M. Bodmer, N. Phan, M. Gold, D. Loomba, J. Matthews, and K. Rielage, “Measurement of optical attenuation in acrylic light guides for a dark matter detector,” Journal of Instrumentation, vol. 9, no. 02, p. P02002, 2014.
[76] “Camera Calibration and 3D Reconstruction.” [Online]. Available: http://docs.opencv.org/2.4/modules/calib3d/doc/camera_calibration_and_3d_reconstruction.html. [Accessed: 26–03-2017].
[77] “Correcting Barrel Distortion.” [Online]. Available: http://www.panotools.org/dersch/barrel/barrel.html. [Accessed: 03-Jan-2017].
[78] “GML C++ Camera Calibration Toolbox.” [Online]. Available: http://graphics.cs.msu.ru/en/node/909. [Accessed: 10–02-2017].
[79] Q. Zhang, L. Xu, and J. Jia, “100+ times faster weighted median filter (WMF),” in Proceedings of the IEEE Conference on Computer Vision and Pattern Recognition, 2014, pp. 2830–2837.
[80] T. Huang, G. Yang, and G. Tang, “A fast two-dimensional median filtering algorithm,” IEEE Transactions on Acoustics, Speech, and Signal Processing, vol. 27, no. 1, pp. 13–18, 1979.
[81] S. Perreault and P. Hébert, “Median filtering in constant time.,” IEEE Trans Image Process, vol. 16, no. 9, pp. 2389–94, 2007.
[82] A. Sobiecki, H. C. Yasan, A. C. Jalba, and A. C. Telea, “Qualitative comparison of contraction-based curve skeletonization methods,” in International Symposium on Mathematical Morphology and Its Applications to Signal and Image Processing, 2013, pp. 425–439.

133
[83] P. Cignoni, C. Rocchini, and R. Scopigno, “Metro: measuring error on simplified surfaces,” in Computer Graphics Forum, 1998, vol. 17, no. 2, pp. 167–174.
[84] “CloudCompare: 3D point cloud and mesh processing software” [Online]. Available: http://www.danielgm.net/cc/. [Accessed: 21–01-2017].
[85] P. A. Laplante, “Real-time imaging,” IEEE Potentials, vol. 23, no. 5, pp. 8–10, 2004.
[86] S. Izadi, D. Kim, O. Hilliges, D. Molyneaux, R. Newcombe, P. Kohli, J. Shotton, S. Hodges, D. Freeman, A. Davison, and others, “KinectFusion: real-time 3D reconstruction and interaction using a moving depth camera,” in Proceedings of the 24th annual ACM symposium on User interface software and technology, 2011, pp. 559–568.
[87] O. Kahler, V. ~A. Prisacariu, C. ~Y. Ren, X. Sun, P. ~H. ~S Torr, and D. ~W. Murray, “Very High Frame Rate Volumetric Integration of Depth Images on Mobile Device,” IEEE Transactions on Visualization and Computer Graphics (Proceedings International Symposium on Mixed and Augmented Reality 2015, vol. 22, no. 11, 2015.