real-time speech emotion analysis for smart home assistants
TRANSCRIPT
Real-time speech emotion analysis for smart home assistants
Article
Accepted Version
Manuscript
Chatterjee, R., Mazumdar, S., Sherratt, R. S. ORCID: https://orcid.org/0000-0001-7899-4445, Halder, R., Maitra, T. and Giri, D. (2021) Real-time speech emotion analysis for smart home assistants. IEEE Transactions on Consumer Electronics, 67 (1). pp. 68-76. ISSN 0098-3063 doi: https://doi.org/10.1109/TCE.2021.3056421 Available at http://centaur.reading.ac.uk/96650/
It is advisable to refer to the publisher’s version if you intend to cite from the work. See Guidance on citing .Published version at: https://doi.org/10.1109/TCE.2021.3056421
To link to this article DOI: http://dx.doi.org/10.1109/TCE.2021.3056421
Publisher: IEEE
All outputs in CentAUR are protected by Intellectual Property Rights law, including copyright law. Copyright and IPR is retained by the creators or other copyright holders. Terms and conditions for use of this material are defined in the End User Agreement .

www.reading.ac.uk/centaur
CentAUR
Central Archive at the University of Reading
Reading’s research outputs online

1
Full text version
Real-Time Speech Emotion Analysis for Smart Home Assistants
Rajdeep Chatterjee, School of Computer Engineering, KIIT, Bhubaneswar, Odisha-751024, India (e-mail:
Saptarshi Mazumdar, School of Computer Engineering, KIIT, Bhubaneswar, Odisha-751024, India (e-mail:
R. Simon Sherratt, Department of Biomedical Engineering, the University of Reading, RG6 6AY, UK (e-mail:
Rohit Halder, School of Computer Engineering, KIIT, Bhubaneswar, Odisha-751024, India (e-mail:
Tanmoy Maitra, School of Computer Engineering, KIIT, Bhubaneswar, Odisha-751024, India (e-mail:
Debasis Giri, Department of Information Technology, Maulana Abul Kalam Azad University of Technology, Nadia,
West Bengal-741249, India (e-mail: [email protected]).
Journal: IEEE Transactions on Consumer Electronics
Publication Date: February 2021
Volume: 67, Issue: 1
Page(s): 68-76
Print ISSN: 0098-3063
Online ISSN: 1558-4127
Digital Object Identifier: 10.1109/TCE.2021.3056421
Abstract
Artificial Intelligence (AI) based Speech Emotion Recognition (SER) has been widely used in the consumer field for
control of smart home personal assistants, with many such devices on the market. However, with the increase in
computational power, connectivity and the need to enable people to live in the home for longer though the use of
technology, then smart home assistants that could detect human emotion will improve the communication between a
user and the assistant enabling the assistant of offer more productive feedback. Thus, the aim of this work is to
analyze emotional states in speech and propose a suitable method considering performance verses complexity for
deployment in Consumer Electronics home products, and to present a practical live demonstration of the research. In
this paper, a comprehensive approach has been introduced for the human speech-based emotion analysis. The 1-D
convolutional neural network (CNN) has been implemented to learn and classify the emotions associated with human
speech. The paper has been implemented on the standard datasets (emotion classification) Ryerson Audio-Visual
Database of Emotional Speech and Song (RAVDESS) and Toronto Emotional Speech Set database (TESS) (Young
and Old). The proposed approach gives 90.48%, 95.79% and94.47% classification accuracies in the aforementioned
datasets. We conclude that the 1-D CNN classification models used in speaker-independent experiments are highly
effective in the automatic prediction of emotion and are ideal for deployment in smart home assistants to detect
emotion.
Index Terms
Artificial intelligence, Convolutional neural network, Emotion recognition system, Smart home assistants.

2
I. INTRODUCTION
Speech Emotion Recognition (SER) was first proposed in 1997 by Picard [1] and has attracted widespread attention. It is well
known that language communication is the preferred method when communicating with others in daily life, and human language
is first formed through speech. It can be said that speech plays a decisive supporting role in language. Human speech not only
contains important semantic information, but also implies rich emotional information [2]. The aim of SER is to obtain the
emotional states of a user derived from their speech [3], thereby achieving harmonious communication between humans or
between humans and machines, and in this paper we refer to a machine as a smart home assistant.
Emotion is a comprehensive state that occurs when an individual receives an internal or external stimulus, including
physiological reaction, subjective experience, and external behavior [4]. When the internal or external stimulus are consistent
with a user’s needs or requests, they will experience positive emotions, whereas negative emotions can be experienced with
unpleasant experiences or distress.
The ability for consumer devices to detect emotion has been a hot research topic since 2006 with the introduction of an early
music recommender system [5], and facial expression recognition [6] for personal cameras in 2010. The first emotion
recognition systems in the consumer field appeared in 2011 that used a database [7], and then biofeedback [8]. While research
into music recommender systems has been buoyant [9], [10], other interesting systems for human emotion include lighting for
emotion [11] and emotion aware service robots [12], [13]. Recent research indicates seamless human-device interaction [14].
With the advent of smart consumer home devices [15], consumers can live in their home for longer, safer [16] and to live
healthier lifestyles [17].
According to Venkataramanan and Rajamohan [18], the common feature extractions techniques that have been used in speech
analysis include the Log-Mel spectrogram, Human Factor Cepstral Coefficients, Mel scale cepstral analysis, Mel Frequency
Cepstral Coefficients and Short Term Fourier Transform. This paper is concerned with defining suitable technology and
computationally efficient algorithms to enable smart home assistants to predict the emotional state of a user, and in doing so
offer more suitable responses to questions and home events.
In this work, an Independent Component Analysis (ICA) algorithm [19] [20] has been used to identify and extract the main
audio components. The Mel Frequency Cepstral Coefficients (MFCCs) [21-23] are then used as major prediction coefficients
[24] with other feature extraction techniques [25], [26]. This work has culminated in a practical live system to demonstrate the
applicability of the research to enable smart home assistants to predict the user’s emotional state. For this, two well-known
speeches have been used (discussed in section V).Besides this, the model has been examined to detect various emotions based on
the age and the gender as well as real time experiments with six different subjects. The work has considered many classifiers and
has found that the 1-D CNN is an excellent candidate for SER when considering both recognition performance, and real-time
operation.
The paper has been organized as follows. Section II demonstrates the various approaches taken in the literature concerning
speech emotion detection. In Section III, the related background concepts have been discussed. The description about the used
datasets, the experimental details and the obtained results are discussed in Section V. The obtained empirical observations are
also compared with other state-of-the-art techniques in the same section to examine the robustness of our proposed model.
Finally, we conclude in Section VI.
II. RELATED WORKS
The detection of psychological states of mind is of great interest and has two major approaches, (a) categorical, and (b)
dimensional. The categorical approach defines the psychological state of mind as discrete classes of basic emotion, such as
happy, sad, disgust, fear, anger, surprise, and neutral [27], [28]. The dimensional approach deals with emotion as a combination
of several psychological dimensions. In 1897, it was known that Wundt [29] proposed that emotion was a combination of three
psychological dimensions, (a)strain versus relaxation, (b) arousing versus subduing, and(c) pleasurable versus unpleasant. Russel
[30], and Kuppenset al.[31]stated that emotion as a combination of only two dimensions, valence, and arousal.
Facial expression analysis and speech analysis [32], [33] are the major approaches to detect the psychological states of the
human mind. However, not all humans are able to convey the information related to their psychological states, using facial
expression or speech features. Several physiological signals including heart rate, electroencephalogram, blood pressure, skin
conductance, skin temperature, and blood volume pulse are also used in the detection of the human emotion [4]. Nowadays,
brainwaves are used in the detection of different psychological states [34], [35]. But, that has limited practical use due to a lack
of flexibility in the data (signal) recording. The hierarchical model used by Shaqraet al. [36] stated that age and gender account
for the acoustic and psychological features of the human voice. Conventional vocal feature extraction methodology, including
calculation of Mel Frequency Cepstral Coefficients, Log-Mel spectrogram have been discussed [18, 21, 25, 37]. The Short Term
Fourier Transform has been implemented to extract suitable features by Venkataramanan, and Rajamohan [18]. Finally, Long
Short Term Memory Cells (LSTM), Hidden Markov Model (HMM) and Deep Neural Networks (DNN) have been employed for

3
the detection of emotion from human speech. However, the said approaches are not robust and do not detect speech emotions
efficiently. Relevant works along with their feature extraction techniques and the classifiers used are given in Table I.
TABLE I
RELEVANT RESEARCH WORKS FOR THE SPEECH EMOTION DETECTION: A COMPARISON
Works Feature extraction techniques Used classifiers
[38] Spectral features + Source features
extraction + Sequential Minimal Optimization
Random Forest
[39] Mel Frequency Cepstrum
Coefficients + PCA
K-Means Clustering
[40] Pitch features Binary and GMM
classifiers
[36] Age and gender based features Hierarchical Classification
[37] Mel-Frequency Cepstral
Coefficients
CNN
[18] Log-Mel Spectrogram, Mel-
Frequency Cepstral
Coefficients (MFCCs), Pitch and Energy Features
CNN, LSTM and
Hidden Markov
Models
[41] Prosodic and spectral features SVM classifier
III. CONCEPTUAL BACKGROUND
This section describes some related backgrounds to introduce the proposed technique.
A. Independent Component Analysis
Independent Component Analysis (ICA) [20] helps to distillate different components from an audio. The procedure contains
following steps:
1. Each pulse of the signal has been depreciated by its mean value for the centering of a complete signal X. The correlation
between different components is removed. Then, it is followed by the calculation of their Eigen values and corresponding
Eigenvectors. Whitening of a signal refers to eigen value decomposition of the covariance matrix of it. Matrix E is an
orthogonal matrix of the eigenvectors and matrix D is a diagonal matrix of eigen values. ET is the transpose of matrix E. The
whitened signal Y can be calculated as XEDEY T =−
2
1
.
2. All the signals are then separated through several iterations (as per the Equ.(1)). After normalization, the algorithm checks
whether it has crossed the tolerance level, or not, by using Equ. 2.
Y))X)(Ytanh-(1- X)tanh(YXn
1 =Y
n
i
T2n
i
T
p
(1)
where n is the number of iterations, Yp is used for denoting new calculated value for de-mixed matrix for a single iteration as:
( )||||
1
1 p
p
j
p
j
j
T
ppY
YYYYY =−
−
=
,
Where 1 1+ YY p
T
p (2)
The source signal, matrix S, is calculated as the dot product of matrix Y and input signal X, i.e. S= Y X, where Y is the final
value of Yp. The first row of the end signal is collected as the major component.
B. Mel-Frequency Cepstral Coefficients Extraction
First, the complete signal is framed into shorter ones and their Fourier Transform is taken as mentioned in the section III-B1.
The power spectrogram is calculated. Using the Mel Filter Bank (Fig. 1.), the sum of energy of each filter is collected and fit to a
logarithm. Finally, the Discrete Cosine Transform (DCT) (section III-B3) is applied on top of log Filter Bank energies.
1) Fast Fourier Transform (FFT): Mel-Frequency Cepstrums have widely used features for speech processing. Sounds
generated by a human solemnly depend upon the structure of their vocal tract. The envelope of the time-power spectrum of any
speech signal represents the structure of a vocal track, and MFCCs are used to represent the envelope of a short time-power
spectrum. To estimate the power spectral density, the FFT is used as shown in Fig. 2. The discrete signal in frequency domain

4
X(k) is calculated as nk
N
N
n
WnxkX −
=
=1
0
)()( , where x(n) signifies the continuous time domain signal and twiddle factor
N
nkj
nk
N eW
−
=
2
.
The Radix-2-Decimation in Time Fast Fourier Transform (DIT-FFT) is used. In Equ.3, n is replaced with 2m to differentiate
between odd and even portions of a signal.
2) Filter Bank: After poly-phase decomposition of the signal stream, inputs of each phase are transmitted to separate channels.
The number of filters in a Mel-FB has a set as per the requirements. The filters are triangular and are placed according to the
convention of the Mel-scale M(f). The Mel-scale is defined as:
+=
7001log2595)( 10
ffM
(3)
where f is used to denote frequency. Normally, triangular filters are distributed from zero to the Nyquist rate ( 2 Sampling
Frequency) (see Fig. 1). As the input of Discrete Cosine Transform, collected absolute amplitudes of log filter bank are used.
3) Discrete Cosine Transform (DCT): The DCT is used to present a signal in terms of the sum of cosine functions oscillating in
at different frequencies. There are eight types of DCTs from which, MFCCs are extracted using DCT-II [42] and DCT-III [43]
as:
−
=
+
=1
0
)2
1(
cos)(N
n
kN
kn
nxX
(3)
where x(n) is signal stream and N is the total number of elements. The complete process of extraction of MFCCs is shown in Fig.
3.
4) Removal of Useless Features: After clearing the silence from each vocalization, the length of each recording changed
accordingly, this could not be fit in a model. Thus, to make the length same for all MFCCs arrays, a specific number of features
are kept, and others are discarded. The size of vectors is 120 for TESS and RAVDESS each.
Fig. 1. Mel Filter Bank (Mel-FB).
Fig. 2. Calculated Spectrum of an Angry Speech Signal using the FFT.

5
IV. PROPOSED APPROACH
The approach that involves the channelization of the raw speech (vocal) samples through Silence Filter followed by ICA [19],
[20] and mean MFCCs extractor to extract a vector of cepstral coefficients, which are then passed into the 1-D convolution
neural network (CNN) to extract the high-level features followed by a fully connected dense layers and a softmax classifier. The
proposed emotion detection approach consists of four stages, as shown in Fig. 4.
First is the collection of the voice samples. In the second step, the silences in the samples are cleared. The main component of
the sample is extracted, leaving behind the noise. In the next stage, the vectors are processed to calculate the values of the
coefficients, and convolutional operation is applied to the output vector. In the final phase, the vectors are passed through a dense
neural network followed by an output layer.
The complete system works as shown in Fig. 5. Once the human vocalization is collected, the silent portions are removed from
the input raw signal. After that, using ICA, the main speech component has been extracted and fed to a specific classification
model which gives a predicted emotion class.
A. Proposed Model Architecture
The first model used here a Convolutional Neural Network. We keep the ADAM optimizer for all the experiments due to a
comparatively better rate of convergence. Relu activation function has been used due to overcoming the unwanted loss caused by
negative value coverage. The shuffled signals are independent on future inputs for which causal padding is preferred over valid
padding. A 1D-CNN has been implemented on 7 classes (happy, sad, disgust, fear, anger, surprise, and neutral). Each layer
consists of a window of size 5 (kernel size). After a few convolutional layers, a max pool has been introduced with a window of
size 8 (pool size)to reduce the feature set. Later on, the model is tuned by adding some extra convolutional and dropout layers.
After flattening, very few Dense layers and outputs are collected at the end (see Fig. 6).
V. EXPERIMENTAL SETUP AND RESULT ANALYSIS
This section discusses the implementation environment and based on the experiments the results are analyzed. Two standard
datasets have been used for the validation of our proposed model namely, Ryerson Audio-Visual Database of Emotional Speech
and Song (RAVDESS)1 [44] and Toronto Emotional Speech Set database (TESS)2.
The “RAVDESS” dataset is rich, robust, and gender-balanced. It consists of 24 professional actors vocalizing two statements
in a neutral North American accent. There are two statements, and each statement is repeated with two different intensities,
normal and strong for each emotion except “Neutral” one. The two enacted statements are, “Dogs are sitting by the door” and
“Kids are talking by the door”, and each statement is repeated two times by each actor. The “TESS” dataset consists of 200
words spoken as “Say the word a word” by two females of age 26 and 64, respectively. Each sentence is repeated seven times
with different emotions portrayed. Both actresses having musical training, this dataset is very well balanced and have threshold
value within the normal range.
A. Preprocessing of Raw Data
A voice contains several void spaces which can lead an algorithm to faulty learning at the time of training. Testing with the
same data may give an accurate result, but ultimately at the time of real-life implementation of the model, it may overlook
critical phases. Spectral subtraction is a widely used technique to remove the background noise. For the first step, the lowest
threshold value has been set, intensities below, which are not accepted. A sumptuous data array could be achieved for each vocal
utterance. Each recording is of 3 seconds approximately. Duration became near about 2 seconds after cleaning silences, as shown
in Fig. 7. The mean of evenly weighted rolling window values with an offset of sampling_rate=10 are taken for each
vocalization with a minimum period of 2 seconds.
B. Experiments and Result Discussion
Apart from the datasets, the proposed approach is further validated using audio samples from movie clips, orientation
functions, and protests. The sample vocals are larger than the normal size of input vocals used for training. The datasets are
divided into 10 parts. The first 8 parts are used to train, whereas the remaining 2 parts are used to validate our model. The
validation accuracy is considered to be the mean of the validation accuracies around a radius of the 5 epochs ( 5 of the best
performing epoch), from the epoch that produces the maximum validation accuracy.
1https://zenodo.org/record/1188976 2https://doi.org/10.5683/SP2/E8H2MF

6
1) Experiment 1a: The Standard Experiment:
The RAVDESS and TESS standard datasets have been used and compared with the latest best performing speech emotion
detection models.
• Result Analysis on RAVDESS dataset: In Fig. 8, it can be seen that the maximum accuracy of 92.20% has been obtained
for the epoch 580. Taking the mean and the standard deviation, of the validation accuracies from epoch 575 to epoch 585 ( 5
epochs), the resultant validation accuracy obtained by our model for the RAVDESS dataset is 90.48 1.28%.
Fig. 3. Mel-Frequency cepstral coefficients extraction process.
Fig. 4. Block diagram of the proposed system.
Fig. 5. Flow chart of our proposed system.

7
Fig. 6. Model architecture.
• Result Analysis on TESS dataset: The TESS dataset is divided into two parts, young and old. For the TESS young dataset,
about the Fig. 9, the highest accuracy 96.5% has been found for the 569 th epoch. Taking the mean and the standard deviation, of
the validation accuracies from epoch 564 to epoch 574 ( 5 epochs), the resultant validation accuracy obtained by our model for
this dataset is 95.79 0.38%.
For the TESS old dataset, the highest accuracy 96.62%has been found for the 690th epoch. Taking the mean and the standard
deviation, of the validation accuracies from epoch 685 to epoch 695 ( 5 epochs), the resultant validation accuracy obtained by
our model for this dataset is 94.47 1.24% as shown in Fig. 10.
Additionally, the preprocessed data is also passed through an SVM classifier to compare the rest. The accuracy for the
RAVDESS, TESS Young and TESS Old datasets are 44.73%, 91.66%, and 90.62% respectively.
• Comparison of the classification accuracy: The proposed approach outperforms most of the approaches taken by different
researchers all over the globe. Comparative analysis ofthe validation accuracy for the RAVDESS, TESS Young, andTESS Old
datasets, respectively, has been given in Table II.
Fig. 7. Waveforms: (a) time domain signal before filteringvoids, (b) Log-Mel Spectrogram of signal after filtering voids, (c)
time domain signal after filtering voids, and (d) frequency domain signal after filtering voidsModel architecture.

8
Fig.8. Accuracy graph obtained from RAVDESS dataset.
Fig. 9. Accuracy graph obtained from the TESS YoungDataset.
Fig. 10. Accuracy graph obtained from the TESS Old dataset.
2) Experiment 1b: Gender and Age-based Speech Emotion Classification:
The models are used to classify age and gender, respectively, to increase the robustness of the system. In a similar manner, a
CNN based model has been prepared. Forage classification, the TESS dataset had been used. The model is trained with 100
epochs and having only two classes, that is, young and old, binary cross-entropy is preferred for loss function. Among all
activation functions, Sigmoid came out with a comparatively better option for the output layer. For gender classification, the
RAVDESS dataset had been used. The overall model has been kept the same for gender classification. For extraction of MFCCs,
DCT Type-III is preferred over DCT Type-II.
• Analysis on Age classification: The TESS dataset is further used to classify the age (young or old). The learning pattern is
shown in Fig. 11. The obtained highest classification accuracy equals to 97.50% at the epoch 87. Taking the mean and the
standard deviation, of the validation accuracies from epoch 77 to epoch 97 ( 5 epochs), the resultant validation accuracy
obtained by our model for the TESS dataset is 95.79 1.15%. The comparison in accuracy using CNN and SVM has been
shown in Table III.
• Analysis on Gender classification: The RAVDESS dataset is further used to classify the gender of the samples.
• The learning trend is given in Fig. 12.The obtained highest classification accuracy equals to 100.00% at epoch 45. Taking
the mean and the standard deviation, of the validation accuracies from epoch 35 to epoch 55 ( 5 epochs), the resultant
validation accuracy obtained by our model for the RAVDESS dataset is 100.00 0%. The comparison in accuracy using CNN
and SVM has been shown in Table IV.

9
3) Experiment 2: Emotion Detection from two Famous Speeches:
As a part of experimental analysis, the model has been validated using the vocals of the famous speeches of the great Indian
sage Swami Vivekanda delivered at Chicago3 [45] [46] in 11th September 1893and an inspiring speech during the promotion of
#MeToo movement4 [47] in 8th January 2018 at the Golden Globe Awards. The detailed speech emotions have been shown in
Fig. 13 and Fig. 14 respectively for the Experiment 2. Both the audio-visual clippings are longer than 9 minutes. Among which a
random 2 minute and 45 seconds, that is, 165 seconds are taken for the experimental purpose. For each experiment, the signal
sampling rate is taken as 44100 and FFT window is considered of 2048 length and hop length is taken as 512. So, the number of
MFCCs can be obtained using n-Coeffs = (len × sr) / hop, where, n-Coeffs is number of coefficients, len is the audio length,
sampling rate is denoted as sr and hop is used for number samples between successive frames. According to which, the
calculated n-Coeffs will be near about 87 (approximately) for 1 second (that is, 1×44100/512). Similarly, for 165 seconds, 14355
coefficients will be generated. We are fitting 120 coefficients for each iteration of emotion detection. Therefore, zero padding is
done in the MFCCs array to make it completely divisible. In the result, a coefficient array of length 14400 is generated. Finally,
the complete array has been divided into 120 coefficient subarrays (i.e., 14400/120).
For each iteration, the model is giving a percentage of each seven emotions present in that vocalization. In the provided charts
we can visualize the distributions for each emotion according to their percentage of intensities. The pie chart indicates the
proportional analysis of individual emotional states for 165 seconds. The intensity represented in the Y-axis is mapped according
to the model confidence representation for each emotion in percentage. The X-axis suggests the number of batches obtained from
165 seconds audio input.
Fig. 11. Classification accuracy plot obtained from the proposed age-based speech emotion detection model (Experiment-1b).
Fig. 12. Classification accuracy plot obtained from the proposed gender-based speech emotion detection model(Experiment-
1b)
Fig. 13. Results from the speech of Swami Vivekananda at Chicago (1893).
3https://youtu.be/WIOtnn6meWA 4https://youtu.be/LyBims8OkSY
10
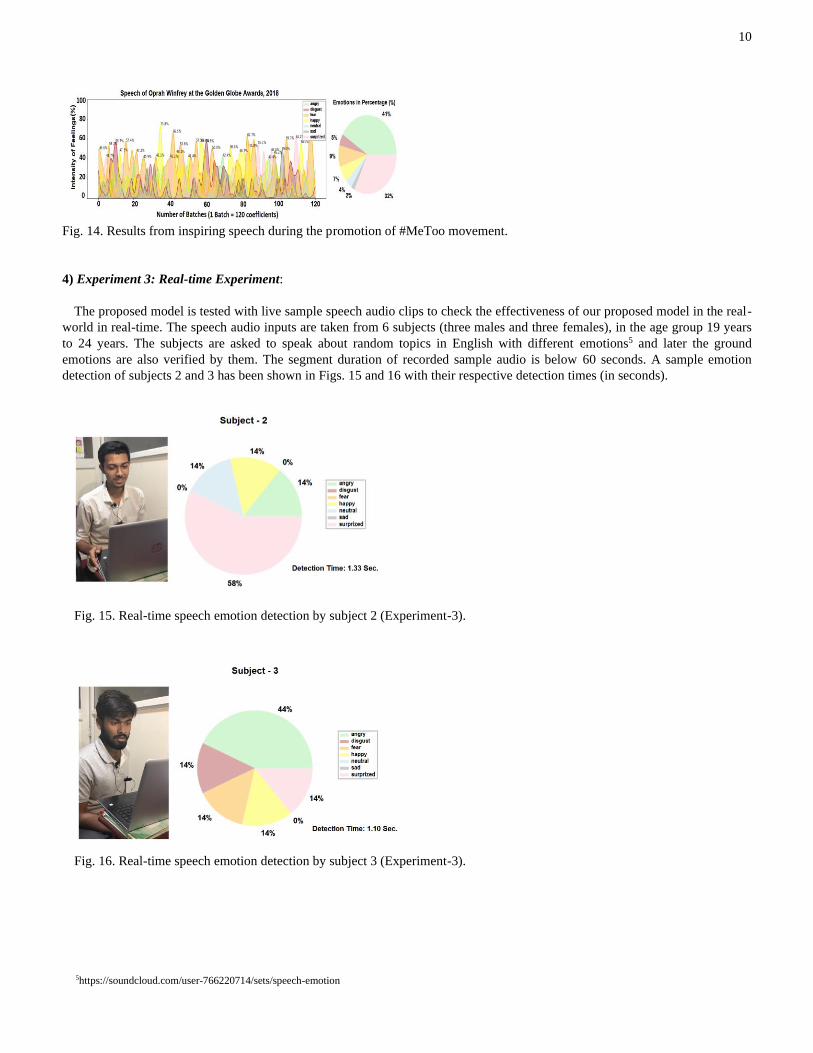
Fig. 14. Results from inspiring speech during the promotion of #MeToo movement.
4) Experiment 3: Real-time Experiment:
The proposed model is tested with live sample speech audio clips to check the effectiveness of our proposed model in the real-
world in real-time. The speech audio inputs are taken from 6 subjects (three males and three females), in the age group 19 years
to 24 years. The subjects are asked to speak about random topics in English with different emotions5 and later the ground
emotions are also verified by them. The segment duration of recorded sample audio is below 60 seconds. A sample emotion
detection of subjects 2 and 3 has been shown in Figs. 15 and 16 with their respective detection times (in seconds).
Fig. 15. Real-time speech emotion detection by subject 2 (Experiment-3).
Fig. 16. Real-time speech emotion detection by subject 3 (Experiment-3).
5https://soundcloud.com/user-766220714/sets/speech-emotion

11
The detailed results of the Experiment 3 (done by the authors to detect aggression and anger from human speech in real-time)
is shown in Table V.
TABLE II RESULTS OBTAINED FROM DIFFERENT SPEECH EMOTION
DETECTION MODELS (EXPERIMENT-1A)
Method RAVDES TESS Young TESS Old
SVM 44.73% 91.66% 90.62%
1D-CNN (proposed)
90.48 ±1.28% 95.79 ±0.38% 94.47±1.24%
TABLE III RESULTS OBTAINED FROM DIFFERENT AGE-BASED
SPEECH EMOTION DETECTION MODELS (EXPERIMENT-1B)
Method Accuracy
SVM 95.00% 1D-CNN
(proposed) 95.79 ±1.15%
TABLE IV
RESULTS OBTAINED FROM DIFFERENT GENDER-BASED
SPEECH EMOTION DETECTION MODELS (EXPERIMENT-1B)
Method Accuracy
SVM 97.6% 1D-CNN
(proposed) 100.00 ±0.00%
TABLE V
RESULTS OBTAINED FROM DIFFERENT SUBJECTS EXPERIMENTED BY THE AUTHORS (EXPERIMENT-3)
Test subject Gender Duration Top two predicted emotions Ground truth Detection time
Subject 1 male 15s Surprised, Neutral Surprised 1.28s Subject 2 male 15s Surprised, Happy Surprised 1.33s
Subject 3 male 15s Angry, Fear Angry 1.10s
Subject 4 female 36s Happy, Neutral Happy 1.21s Subject 5 female 53s Surprised, Happy Happy 1.39s
Subject 6 female 36s Surprised, Fear Surprised 1.35s
TABLE VI COMPARISON OF THE BEST SPEECH EMOTION DETECTION MODELS WITH THE PROPOSED APPROACH
Works Feature extraction
technique Used classifiers
Emotion accuracy
(TESS combined)
Emotion accuracy
(RAVDESS)
Age accuracy
(TESS)
Gender accuracy
(RAVDESS)
[18] Log Mel Spectogram 2D CNN with
global avg. pool
62% 70% - 90%
[36] OpenSimle Tool &eGeMAPS
SVM 65.1% 70.59% 87.95% 98.67%
[38] Linear Prediction Residuals
SVM with SMO 75.5% - - -
[48] eGeMAPS CNN-LSTM &
CNN
49.48% 65.67% - -
Proposed
Approach
Mel FB Cepstral Coeffs
with DCT-III
1D CNN 95.79% 90.48% 95.79% 100%

12
C. Results Comparison
The proposed model has been compared with the best performing existing detection models in Table VI. The probable reason for
achieving the best accuracy is using DCT Type-III instead of DCT Type-II and using causal padding at the time of training a
model. Features like MFCCs have always helped to acquire better results previously. Moreover, this work has prepared different
classification models for different age groups and introduced 1D CNN classifier which can lead to a better result.
VI. CONCLUSION
In this article, the Mel-Frequency Cepstral Coefficient (MFCC) features were applied to conduct speaker-independent
experiments for a Speech Emotion Recognition (SER) element of an AI based smart home assistant. The proposed approach i.e.,
CNN variant achieved a state-of-the-art classification accuracy for the commonly used benchmark speech datasets in the world.
The proposed approach provides 90.48%,95.79% and 94.47% classification accuracies for the standard datasets (emotion
classification) Ryerson Audio-Visual Database of Emotional Speech and Song (RAVDESS) and Toronto Emotional Speech Set
database (TESS) (Young and Old) respectively. We have also examined its robustness with some well-known recorded speeches
and movie scenes. It must be noted that these test cases are unknown to the model as they are not only part of the training sets
but also uncorrelated with the given validation sets. It indicates that our proposed model learns in a true sense to detect speech-
based emotions. The training time and testing time consumed were relatively short indicating an ability to operate in real-time
and as an excellent candidate for enabling AI smart home assistants to predict the emotion of the user with the aim to improve
assistance and feedback.
In future, this work will be extended to address the more number of subjects, different nationalities, multiple accents, and
various age and gender categories; and will try to develop an application that could be deployed in the real world to enhance real-
time identification with consumers. Furthermore, we will attempt to extract multiple types of acoustic features to fuse features of
advanced classification models for SER. Other indicators will also be added to evaluate the performance of a classification
model synthetically.
REFERENCES
[1] S. Poria, E. Cambria, R. Bajpai, and A. Hussain, “A review of affective computing: from unimodal analysis to multimodal fusion,” Information Fusion, vol.
37, pp. 98–125, Sep. 2017, 10.1016/j.inffus.2017.02.003. [2] Y. Sun, and X. Y. Zhang, “Characteristics of human auditory model based on compensation of glottal features in speech emotion recognition,” Future
Generation Computer Systems, vol. 81, pp. 291–296, Apr. 2018, DOI. 10.1016/j.future.2017.10.002.
[3] T. Özseven, “Investigation of the effect of spectrogram images and different texture analysis methods on speech emotion recognition,” Applied Acoustics, vol. 142, pp. 70–77, Dec. 2018, 10.1016/j.apacoust.2018.08.003.
[4] T. K. L. Hui, and R. S. Sherratt, “Coverage of emotion recognition for common wearable biosensors,” Biosensors, vol. 8, no. 2, 30, Mar. 2018,
10.3390/bios8020030. [5] X. Zhu, Y.-Y. Shi, H.-G. Kim, and K.-W. Eom, “An integrated music recommendation system,” IEEE Trans. Consum. Electron., vol. 52, no. 3, pp. 612–
618, Aug. 2006, 10.1109/TCE.2006.1706489.
[6] I. Bacivarov, P. Corcoran, and M. Ionita, “Smart cameras: 2D affine models for determining subject facial expressions,” IEEE Trans. Consum. Electron., vol. 56, no. 2, pp. 298–297, May 2010, 10.1109/TCE.2010.5505930.
[7] W.-J. Yoon, and K.-S. Park, “Building robust emotion recognition system on heterogeneous speech databases,” IEEE Trans. Consum. Electron., vol. 57,
no. 2, pp. 747–750, May 2011, 10.1109/TCE.2011.5955217. [8] D. K. Kim, J. Kim, E. C. Lim, and M. Whang, Y. Cho, “Interactive emotional content communications system using portable wireless biofeedback device,”
IEEE Trans. Consum. Electron., vol. 57, no. 4, pp. 1929–1936, Nov. 2011, 10.1109/TCE.2011.6131173.
[9] K. Yoon, J. Lee, and M.-U. Kim, “Music recommendation system using emotion triggering low-level features,” IEEE Trans. Consum. Electron., vol. 58, no. 2, pp. 612–618, May 2012, 10.1109/TCE.2012.6227467.
[10] R. L. Rosa, D. Z. Rodriguez, and G. Bressan, “Music recommendation system based on user's sentiments extracted from social networks,” IEEE Trans. Consum. Electron., vol. 61, no. 3, pp. 359–367, Aug. 2015, 10.1109/TCE.2015.7298296.
[11] D. K. Kim, S. Ahn, S. Park, and M. Whang, “Interactive emotional lighting system using physiological signals,” IEEE Trans. Consum. Electron., vol. 59,
no. 4, pp. 765–771, Nov. 2013, 10.1109/TCE.2013.6689687.
[12] J.-S. Park, J.-H. Kim, and Y.-H. Oh, “Feature vector classification based speech emotion recognition for service robots,” IEEE Trans. Consum. Electron.,
vol. 55, no. 3, pp. 1590–1596, Aug. 2009, 10.1109/TCE.2009.5278031.
[13] D.-S. Kim, S.-S. Lee, and B.-H. Chol, “A real-time stereo depth extraction hardware for intelligent home assistant robot,” IEEE Trans. Consum. Electron., vol. 56, no. 3, pp. 1782–1788, Aug. 2010, 10.1109/TCE.2010.5606326.
[14] E. Rubio-Drosdov, D. Diaz-Sanchez, F. Almenarez, P. Arias-Cabarcos, and A. Marin, “Seamless human-device interaction in the internet of things,” IEEE
Trans. Consum. Electron., vol. 63, no. 4, pp. 490–498, Nov. 2017, 10.1109/TCE.2017.015076. [15] T. Perumal, A. R. Ramli, and C. Y. Leong, “Design and implementation of SOAP-based residential management for smart home systems,” IEEE Trans.
Consum. Electron., vol. 54, no. 2, pp. 453–459, May 2008, 10.1109/TCE.2008.4560114.
[16] J. Wang, Z. Zhang, B. Li, S. Lee, and R. S. Sherratt, “An enhanced fall detection system for elderly person monitoring using consumer home networks,” IEEE Trans. Consum. Electron., vol. 60, no. 1, pp. 23–29, Feb. 2014, 10.1109/TCE.2014.6780921.
[17] N. Dey, A. S. Ashour, F. Shi, S. J. Fong, and R. S. Sherratt, “Developing residential wireless sensor networks for ECG healthcare monitoring,” IEEE Trans.
Consum. Electron., vol. 63, no. 4, pp. 442–449, Nov. 2017, 10.1109/TCE.2017.015063. [18] K. Venkataramanan, and H. R. Rajamohan, “Emotion recognition from speech,” arXiv preprint, Dec. 2019.[Online]. Available: arXiv:1912.10458.
[19] A. Hyvarinen, “Survey on independent component analysis,” Neural Computing Surveys, vol. 2, no. 4, pp. 94-128, 1999.
[20] A.Hyvärinen and E. Oja, “Independent component analysis: algorithms and applications,” Neural Networks, vol. 13, no. 4-5, pp. 411-430, June 2000, 10.1016/S0893-6080(00)00026-5.

13
[21] T. Ganchev, N.Fakotakis, and G. Kokkinakis, “Comparative evaluationof various mfcc implementations on the speaker verification task,” in Proc. SPECOM, Greece, vol. 1, no. 2005, Oct.2005, pp. 191-194
[22] F. Zheng, G. Zhang, and Z. Song, “Comparison of different implementations of mfcc,” J. Comput. Sci. Technol., vol. 16, pp. 582-589, Nov. 2001,
10.1007/BF02943243. [23] M. A. Hossan, S. Memon, and M. A. Gregory, “A novel approach for mfcc feature extraction,” in Proc. ICSPCS, Gold Coast, Australia, Dec.2010,
10.1109/ICSPCS.2010.5709752.
[24] N. Dave, “Feature extraction methods lpc, plp and mfcc in speech recognition,” Int. J. Advanced Research in Engineering and Technology, vol. 1, no. VI, July 2013.
[25] S. P. Dewi, A. L. Prasasti, and B. Irawan, “The study of baby crying analysis using mfcc and lfcc in different classification methods,” in Proc. ICSigSys,
Bandung, Indonesia, July2019, pp. 18-23, 10.1109/ICSIGSYS.2019.8811070. [26] P. Prithvi, and T. K. Kumar, “Comparative analysis of mfcc, lfcc, rasta-plp,” Int. J. Scientific Engineering and Research, vol. 4, no. 5, pp. 1-4, 2016.
[27] L. Kerkeni, Y. Serrestou, M. Mbarki, K. Raoof, and M. A. Mahjoub, “A review on speech emotion recognition: Case of pedagogical interaction in
classroom,” in Proc. ATSIP, Fez, Morocco,Oct.2017,pp. 1-7, 10.1109/ATSIP.2017.8075575. [28] P. Ekman, “An argument for basic emotions,” Cognition and Emotion, vol. 6, no. 3-4, pp. 169-200, Jan. 2008, 10.1080/02699939208411068.
[29] A. Kim, “Wilhelm maximilianwundt,” The Stanford Encyclopedia of Philosophy, fall 2016 ed., E. N. Zalta, Ed. Metaphysics Research Lab, Stanford
University, Sep. 2016, Available: https://plato.stanford.edu/entries/wilhelm-wundt/. [30] J. A. Russell, “Core affect and the psychological construction of emotion,” Psychological Review, vol. 110, no. 1, pp. 145-172, 2003, 10.1037/0033-
295X.110.1.145.
[31] P. Kuppens, F. Tuerlinckx, J. A. Russell, and L. F. Barrett, “The relation between valence and arousal in subjective experience,” Psychological Bulletin, vol. 139, no. 4, pp. 917-940, Jul.2013, 10.1037/a0030811.
[32] A. Schirmer, and R. Adolphs, “Emotion perception from face, voice, and touch: comparisons and convergence,” Trends in Cognitive Sciences, vol. 21, no.
3, pp. 216-228, Mar.2017, 10.1016/j.tics.2017.01.001. [33] L. Kerkeni, Y. Serrestou, M. Mbarki, K. Raoof, M. A. Mahjoub, and C. Cleder, “Automatic speech emotion recognition using machine learning,” Social
Media and Machine Learning, Intech Open, Mar. 2019, 10.5772/intechopen.84856.
[34] I. A. Trindade, C. Ferreira, M. Moura-Ramos, and J. Pinto-Gouveia, “An 18-month study of the effects of ibd symptomatology and emotion regulation on depressed mood,” Int. J. Colorectal Disease, vol. 32, no. 5, pp. 651-660, Feb. 2017, 10.1007/s00384-017-2774-z.
[35] R. Chatterjee, and T. Bandyopadhyay, “EEG based motor imagery classification using svm and mlp,” in Proc. CINE,Bhubaneswar, India,Sep. 2016,pp. 84-89, 10.1109/CINE.2016.22.
[36] F. A. Shaqra, R. Duwairi, and M. Al-Ayyoub, “Recognizing emotion from speech based on age and gender using hierarchical models,” Procedia Computer
Science, vol. 151, pp. 37-44, May2019, 10.1016/j.procs.2019.04.009. [37] A. Huang, and P. Bao, “Human vocal sentiment analysis,” arXivpreprint, May 2019. [Online]. Available: arXiv:1905.08632.
[38] A. R. Choudhury, A. Ghosh, R. Pandey, and S. Barman, “Emotion recognition from speech signals using excitation source and spectral features,” in Proc.
ASPCON, Kolkata, India, July 2019, pp. 257-261, 10.1109/ASPCON.2018.8748626. [39] N. Sundarprasad, “Speech emotion detection using machine learning techniques,” Master's Project, San Jose State University, CA,2018, 10.31979/etd.a5c2-
v7e2.
[40] Y. Hu, D. Wu, and A. Nucci, “Pitch-based gender identification with two-stage classification,” Security and Communication Networks, vol. 5, no. 2, pp. 211-225, Mar. 2011, 10.1002/sec.308.
[41] D. Verma, and D. Mukhopadhyay, “Age driven automatic speech emotion recognition system,” in Proc. ICCCA, Noida, India, Jan. 2017,pp. 1005-1010,
10.1109/CCAA.2016.7813862. [42] Y. Soon, S. N. Koh, and C. K. Yeo, “Noisy speech enhancement using discrete cosine transform,” Speech Communication, vol. 24, no. 3, pp. 249-257, Jun.
1998, 10.1016/S0167-6393(98)00019-3.
[43] X. Shao, and S. G. Johnson, “Type-ii/iii dct/dst algorithms with reduced number of arithmetic operations,” Signal Processing, vol. 88, no. 6, pp. 1553-1564, Jun. 2008, 10.1016/j.sigpro.2008.01.004.
[44] S. R. Livingstone, and F. A. Russo, “The ryerson audio-visual database of emotional speech and song (ravdess): A dynamic, multimodal set of facial and
vocal expressions in north American english,” PloSOne, vol. 13, no. 5, May 2018, 10.1371/journal.pone.0196391. [45] “Speech delivered in world parliament of religion”, Opening Welcome Address at the World Parliament of Religions, by S. Vivekananda,
Sep.1893.[Online]: https://www.americanrhetoric.com/speeches/swamivivekanandaworldparliamentofreligions.htm
[46] R. Neufeldt, “Reflections on swami vivekananda’s speeches at the world parliament of religions, 1893,”J. Hindu-Christian Studies, vol. 6, no. 4, p. 1-3, Jan.1993, 10.7825/2164-6279.1073.
[47] A. Tambe, “Reckoning with the silences of #metoo,” Feminist Studies ,vol. 44, no. 1, pp. 197-203, 2018, 10.15767/feministstudies.44.1.0197.
[48] J. Parry, D. Palaz, G. Clarke, P. Lecomte, R. Mead, M. Berger, and G. Hofer, “Analysis of deep learning architectures for cross-corpus speech emotion recognition,” in Proc. Interspeech, 2019, 10.21437/Interspeech.2019-2753.
Rajdeep Chatterjee received the B.E. in Computer Science and Engineering degree from The University of
Burdwan in 2008, and both the M.Tech. and Ph.D. degrees in Computer Science and Engineering from KIIT
Deemed to be University, India in 2011 and 2020, respectively.
He is currently working as an Assistant Professor at School of Computer Engineering, KIIT, India. His
research areas include Brain-Computer Interface, Computer Vision and Deep Learning.
Saptarshi Mazumdar is currently pursuing his B.Tech. degree in Computer Science Engineering from
School of Computer Engineering, KIIT, India. His research areas include Signals and Speech Processing,
Adaptive Noise Filter Preparation and Deep Learning.

14
R. Simon Sherratt (M’97-SM’02-F’12) received the B.Eng. degree in Electronic Systems and Control
Engineering from Sheffield City Polytechnic, UK in 1992, M.Sc. in Data Telecommunications in 1994 and
Ph.D. in video signal processing in 1996 from the University of Salford, UK.
In 1996, he has appointed as a Lecturer in Electronic Engineering at the University of Reading where he is
now Professor of Biosensors. His research topic is signal processing and communications in consumer devices
focusing on wearables and healthcare. He is the Emeritus Editor-in-Chief of the IEEE TRANSACTIONS ON
CONSUMER ELECTRONICS.
Rohit Halder is currently pursuing his B.Tech. degree in Computer Science Engineering from School of
Computer Engineering, KIIT, Bhubaneswar, India. His research areas include Deep Learning, Computer
Vision, and Natural Language Processing.
Tanmoy Maitra (M’16) passed M.Tech. and B.E. from WBUT and Burdwan University, India in 2009 and
2011 respectively. He did his Ph.D. from the Department of Computer Science & Engineering, Jadavpur
University, India in 2020.
Presently, he is working as an Assistant Professor, School of Computer Engineering, KIIT Deemed to be
University, Bhubaneswar-751024, Odisha, India. His research interest includes IoT, Communication in IoT,
Body Area Network, and Information Security. He is the reviewer of the many reputed international journals.
Debasis Giri (M’17) received the M.Sc., M.Tech, and Ph.D. degrees from the Indian Institute of
Technology, Kharagpur, India, in 1998, 2001, and 2009, respectively.
He is currently an Associate Professor with the Department of Information Technology, Maulana Abul
Kalam Azad University of Technology (formerly known as the West Bengal University of Technology),
Haringhata, India. Prior to this, he held academic positions, such as a Professor with the Department of
Computer Science and Engineering and a Dean with the School of Electronics, Computer Science and
Informatics, Haldia Institute of Technology, Haldia, India. His research interests include cryptography,
network security, Security based on Machine Learning data hiding and security in WSN. He is an Editorial
Board Member and a Reviewer for many reputed international journals.