real-time / remote / offline ss7 protocol analyzer · real-time / remote / offline ss7 protocol...
TRANSCRIPT

Real-Time / Remote / Offline SS7
Protocol Analyzer
USER GUIDE Document No-XX120-7.10.24-03
November 2013
GL Communications Inc. 818 West Diamond Avenue - Third Floor
Gaithersburg, MD 20878 Voice 301-670-4784 Fax 301-670-9187
Web page: http://www.gl.com/ E-mail: [email protected]

(Intentional Blank Page)

GL Communications Inc. i November 2013
TABLE OF CONTENTS
Application I - Real-time Protocol Analysis .................................................................................. 1 Section 1.0 Overview ............................................................................................................... 1
1.1 Introduction ..................................................................................................................... 1 1.2 Main features ................................................................................................................... 2 1.3 Offline / Remote Protocol Analyzer ...................................................................................... 3 1.4 Supported Protocols (SS7 ITU/ ANSI/ETSI/CHINA/UK) .......................................................... 4
Section 2.0 Getting Started ..................................................................................................... 5 2.1 Installation ...................................................................................................................... 5 2.2 Invoking Real-time Protocol Analyzer .................................................................................. 5 2.3 User Interface .................................................................................................................. 6
Section 3.0 File Menu Options ................................................................................................. 7 3.1 Start Real-time ................................................................................................................ 7 3.2 Stop/Pause ...................................................................................................................... 8 3.3 Opening Trace for Offline Analysis ...................................................................................... 9 3.4 Close Trace .................................................................................................................... 10 3.5 Save As and Close .......................................................................................................... 10 3.6 Save As ......................................................................................................................... 11 3.7 Export Details ................................................................................................................ 12 3.8 Export Summary ............................................................................................................ 12
Section 4.0 View Menu Options ............................................................................................. 13 4.1 Define Views to Display ................................................................................................... 14 4.2 Summary View ............................................................................................................... 14
4.2.1 Setting a Relative Time ............................................................................................ 14 4.2.2 Summary Column Selection ...................................................................................... 16 4.2.3 Column Resizing and Reordering ............................................................................... 17 4.2.4 Repositioning Summary View .................................................................................... 18 4.2.5 Summary Colors ..................................................................................................... 19 4.2.6 Define Views ........................................................................................................... 19
4.3 Detail View - Selecting Individual Frame ............................................................................ 20 4.3.1 Layer Copy/Show/Hide Options ................................................................................. 22
4.4 Hex Dump View .............................................................................................................. 23 4.5 Statistics View ................................................................................................................ 23 4.6 Protocol Standard ........................................................................................................... 23 4.7 User/Network Side Specification ....................................................................................... 24 4.8 Time Displays ................................................................................................................ 25
4.8.1 Relative Time .......................................................................................................... 25 4.8.2 System Time .......................................................................................................... 25 4.8.3 Date and Time ........................................................................................................ 25 4.8.4 Difference Time ....................................................................................................... 25
4.9 Latest ........................................................................................................................... 26 4.10 View Filtering Criteria .................................................................................................... 26
4.10.1 Setting Filtering Criteria ......................................................................................... 27 4.10.2 Activate Filter ........................................................................................................ 28 4.10.3 Deactivating Filter ................................................................................................. 29 4.10.4 Example - View Filter ............................................................................................. 29
4.11 Searching for Specific Frames ......................................................................................... 30 4.12 Forward Search & Backward Search ................................................................................ 31
4.12.1 Searching Towards the End of the Trace (Forward Search) ......................................... 31 4.12.2 Searching Towards the Beginning of the Trace (Backward Search) ............................... 31 4.12.3 Example - Search for particular frames .................................................................... 32
4.13 Display Trace File Name ................................................................................................ 33 4.14 Default Summary Columns ............................................................................................ 33
Section 5.0 Capture Menu Features ....................................................................................... 35

GL Communications Inc. ii November 2013
5.1 Periodic trace saving options ............................................................................................35 5.2 Setting Capturing Options ................................................................................................37
5.2.1 In Memory for High Traffic Capture Rate .....................................................................37 5.2.2 Circular Capture Buffer .............................................................................................37
5.3 Stream /Interface (Port) Selection .....................................................................................38 5.3.1 Port and Timeslots Selection ......................................................................................39 5.3.2 User/ Network Side Specification ...............................................................................39 5.3.3 Bit Inversion............................................................................................................39 5.3.4 Octet Bit Reversion ..................................................................................................40 5.3.5 HDLC FCS ...............................................................................................................40 5.3.6 Data Transmission Rate ............................................................................................40
5.4 Setting Capture Filter using Real-time Analyzer ...................................................................42 5.5 Capture Physical Layer Alarms ..........................................................................................43 5.6 GUI and Protocol Options .................................................................................................43
Section 6.0 Statistics ............................................................................................................. 45 6.1 Steps to Display Statistics ................................................................................................46
6.1.1 Selecting Field Names (Step 1) ..................................................................................47 6.1.2 Defining Use Type (UT) and Statistics Type (Step 2).....................................................49 6.1.3 Update Selected Statistics Information List (Step 3) .....................................................50 6.1.4 Example 1 - Statistics with a Key UT ..........................................................................51 6.1.5 Example 2 - Statistics with a Total and a Key ..............................................................52 6.1.6 Example 3 - Statistics Total and Field UT ....................................................................54 6.1.7 Ranges, Wildcards And Enumerated Value Sets ............................................................55 6.1.8 Modifying and/or removing configured statistics ...........................................................56
6.2 Opening and Closing Statistics View...................................................................................56 6.3 Loading Statistics ............................................................................................................57 6.4 Load and Edit Statistics ....................................................................................................57 6.5 Save Statistics ................................................................................................................57 6.6 Export Statistics ..............................................................................................................58
Section 7.0 Call Detail Records .............................................................................................. 59 7.1 Build Call Detail Record ....................................................................................................59 7.2 Select Call Detail Columns to Display .................................................................................60 7.3 Active Calls Only .............................................................................................................60 7.4 Open Call Detail Record ...................................................................................................61 7.5 Call Detail View ...............................................................................................................62
7.5.1 Active and Completed Calls .......................................................................................64 7.5.2 Call Duration ...........................................................................................................64 7.5.3 Find CDR ................................................................................................................65
7.6 Display Selected Call Summary .........................................................................................66 7.7 Display Entire Summary ...................................................................................................66 7.8 Closing Call Detail Record .................................................................................................66 7.9 Export Trace File .............................................................................................................67
Section 8.0 Protocol Analyzer Configuration ......................................................................... 69 8.1 Analyzer GUI Options and Protocol Configurations ...............................................................69
8.1.1 Selecting summary columns to display .......................................................................70 8.1.2 Menu Checked Options .............................................................................................71 8.1.3 Protocol Standard Selection .......................................................................................71 8.1.4 Network/User side Selection ......................................................................................72 8.1.5 Time Format ............................................................................................................72 8.1.6 View Filter ...............................................................................................................72 8.1.7 View Search ............................................................................................................72 8.1.8 TCP Connection Options ............................................................................................73 8.1.9 Periodic trace saving options .....................................................................................73 8.1.10 Startup Options .....................................................................................................74
8.1.10.1 Executing Tasks on Analyzer Startup .................................................................75

GL Communications Inc. iii November 2013
8.1.11 Data Link Groups (DLG) ......................................................................................... 79 8.1.12 View Font Size ...................................................................................................... 80 8.1.13 INI Decode Options ................................................................................................ 81 8.1.14 Define Summary Columns ...................................................................................... 84
8.2 Capture Options ............................................................................................................. 87 Section 9.0 Status Indicators ................................................................................................ 89
9.1 Status and Progress Indicator .......................................................................................... 89 9.2 Trace File Name ............................................................................................................. 89 9.3 Filtered and Total Frame Count ........................................................................................ 89 9.4 Error Counters ............................................................................................................... 89
Application II - Remote / Offline Analyzer ................................................................................. 91 Section 1.0 Installation ......................................................................................................... 91
1.1 Installation Procedure ..................................................................................................... 91 1.2 Dongle License Installation .............................................................................................. 91 1.3 Software Installation (Windows® XP) ................................................................................ 92
Section 2.0 Getting Started with Remote Protocol Analyzer .................................................. 95 2.1 Invoking Remote Protocol Analyzer ................................................................................... 95
2.1.1 Remote Analysis ...................................................................................................... 96 2.2 Stream /Interface Selection ............................................................................................. 97 2.3 Setting Capture Filter .................................................................................................... 100 2.4 Start Real-time Analysis ................................................................................................ 100
Section 3.0 Getting Started with Offline Protocol Analyzer .................................................. 101
Appendix A - Glossary .............................................................................................................. 103
Appendix B - Configuring SS7Prot.ini file ................................................................................. 105

GL Communications Inc. iv November 2013
(Intentional Blank Page)

GL Communications Inc. v November 2013
TABLE OF FIGURES
Figure 1: SS7 Protocol Analysis ........................................................................................................ 1 Figure 2: SS7 Network .................................................................................................................... 2 Figure 3: SS7 Protocol Stack for TDM Low- or High-Speed Links ........................................................... 4 Figure 4: Invoking the Protocol Analysis ............................................................................................ 5 Figure 5: Summary, Detail, Hex dump, Statistics Views ....................................................................... 6 Figure 6: File Menu Options .............................................................................................................. 7 Figure 7: Saving the trace file........................................................................................................... 7 Figure 8: Real-time Analysis ............................................................................................................. 8 Figure 9: Open a Trace from a File for Off-line Analysis ........................................................................ 9 Figure 10: Offline Analysis ............................................................................................................... 9 Figure 11: Open a Trace File from Command Prompt ......................................................................... 10 Figure 12: Save Trace As File Name and Close .................................................................................. 10 Figure 13: Save As ........................................................................................................................ 11 Figure 14: Exporting Trace to an ASCII File ...................................................................................... 12 Figure 15: Exporting Summary to an ASCII File ................................................................................ 12 Figure 16: View Menu Options ........................................................................................................ 13 Figure 17: Define Views to Display .................................................................................................. 14 Figure 18: Set Relative Time .......................................................................................................... 15 Figure 19: Select Columns to Display .............................................................................................. 16 Figure 20: Column Resizing and Reordering ..................................................................................... 17 Figure 21: Repositioning the Summary View..................................................................................... 18 Figure 22: Set Summary Colors ...................................................................................................... 19 Figure 23: Detail View of Individual Frame ....................................................................................... 20 Figure 24: SS7 Over IP .................................................................................................................. 21 Figure 25: MTP2 Layer Coded in HSL ............................................................................................... 21 Figure 26: Selecting Show Layer Option ........................................................................................... 22 Figure 27: Copying Detail View Information ...................................................................................... 22 Figure 28: Select Protocol Standard ................................................................................................ 23 Figure 29: User/Network Side Specifications ..................................................................................... 24 Figure 30: Time Displays ............................................................................................................... 25 Figure 31: Auto Screen Refresh During Real-time Analysis ................................................................. 26 Figure 32: Setting Filtering Criteria ................................................................................................. 27 Figure 33: Activating Filter ............................................................................................................. 28 Figure 34: Deactivating Filter ......................................................................................................... 29 Figure 35: Example - Filter Option to filter Error Frames Only ............................................................. 29 Figure 36: Setting Search Criteria ................................................................................................... 30 Figure 37: Searching Forward or Backward Options ........................................................................... 31 Figure 38: Example - Search option to search for frames of specific length........................................... 32 Figure 39: Trace File Name ............................................................................................................ 33 Figure 40: Default Summary Columns ............................................................................................. 33 Figure 41: Periodic File Saving Specifications .................................................................................... 35 Figure 42: Capturing Options .......................................................................................................... 37 Various options are available for saving trace file, refer to Periodic Trace Saving Options for details. ....... 37 Figure 43: Stream/Interface Selection ............................................................................................. 38 Figure 44: User/ Network Side Specification ..................................................................................... 39 Figure 45: Specifying Bit Inversion Option ........................................................................................ 39 Figure 46: Specifying Octet Bit Reversion Option .............................................................................. 40 Figure 47: Specifying FCS Value ..................................................................................................... 40 Figure 48: Specifying Channel Selections ......................................................................................... 40 Figure 49: Capture Filter ................................................................................................................ 42 Figure 50: Capture Filter – Select Protocol Value ............................................................................... 43 Figure 51: Protocol Analysis with Statistics View ............................................................................... 45 Figure 52: Statistics Definition Dialogue ........................................................................................... 46 Figure 53: Selecting Field Names .................................................................................................... 47 Figure 54: Field Types ................................................................................................................... 48 Figure 55: Selected Statistics Information List .................................................................................. 50 Figure 56: Define Statistics with a Key UT ........................................................................................ 51 Figure 57: Statistics with a Key UT .................................................................................................. 52 Figure 58: Select Statistics with a Total and a Key ............................................................................ 53 Figure 59: Statistics with a Total and a Key ...................................................................................... 54 Figure 60 : Range List for Numeric Fields ......................................................................................... 55 Figure 61: Wildcards for String fields ............................................................................................... 55 Figure 62: Specifying Value Sets ..................................................................................................... 56

GL Communications Inc. vi November 2013
Figure 63: Modify/Remove some or all statistics ................................................................................56 Figure 64: Opening and Closing Statistics View..................................................................................56 Figure 65: Loading Statistics ...........................................................................................................57 Figure 66: Save Statistics as Filename .............................................................................................57 Figure 67: Export Statistics as Filename ...........................................................................................58 Figure 68: Call Detail Records View ..................................................................................................59 Figure 69: Build Call Detail Record ...................................................................................................59 Figure 70: Select Call Trace Columns to Display ................................................................................60 Figure 71: Open Call Detailed Record ...............................................................................................61 Figure 72: Warning Message ...........................................................................................................61 Figure 73: Call ID Status for SS7 .....................................................................................................62 Figure 74: Active, Completes Calls, and Call Duration .........................................................................64 Figure 75: Find CDR .......................................................................................................................65 Figure 76: Specify CDR criteria ........................................................................................................66 Figure 77: Close Call Detailed Record ...............................................................................................66 Figure 78: Export Trace File ...........................................................................................................67 Figure 79: Protocol and GUI option ..................................................................................................69 Figure 80: Save Configuration Options to File ....................................................................................70 Figure 81: Load Configuration Options..............................................................................................70 Figure 82: Menu Checked Option .....................................................................................................71 Figure 83: Protocol Standard Selection .............................................................................................71 Figure 84: Network/User side Selection ............................................................................................72 Figure 85: Time Format ..................................................................................................................72 Figure 86: TCP Connection Options ..................................................................................................73 Figure 87: Startup Options .............................................................................................................74 Figure 88: Selection of Summary Columns ........................................................................................75 Figure 89: Selection of Startup Options ............................................................................................76 Figure 90: Saving Configuration File .................................................................................................77 Figure 91: Loading Configuration File ...............................................................................................78 Figure 92: Data Link Groups ...........................................................................................................79 Figure 93: View Font Size ...............................................................................................................80 Figure 94: INI Decode Option ..........................................................................................................81 Figure 95: .INI File ........................................................................................................................82 Figure 96: Warning Message ...........................................................................................................83 Figure 97: Define Summary Column ................................................................................................84 Figure 98: Popup Message ..............................................................................................................85 Figure 99: Adding the Summary Field to Display Summary Column .....................................................86 Figure 100: Added summary field ....................................................................................................87 Figure 101: Analyzer Status Indicators .............................................................................................89 Figure 102: Dongle License Installation ............................................................................................91 Figure 103: Welcome Screen...........................................................................................................92 Figure 104: License Agreement .......................................................................................................92 Figure 105: Choose Destination Folder .............................................................................................93 Figure 106: Select Program Folder ...................................................................................................93 Figure 107: Setup Status ................................................................................................................94 Figure 108: Protocol Analyzer Installation Completed .........................................................................94 Figure 109: License Error Message ...................................................................................................94 Figure 110: Invoking the Remote Protocol Analysis Application ............................................................95 Figure 111: WCS Server Connect .....................................................................................................96 Figure 112: Specifying timeslot Selection for a Remote Analyzer .........................................................97 Figure 113: Info of IP Addr/Cards ....................................................................................................99 Figure 114: Capture Filter using Remote Analyzer ............................................................................ 100 Figure 115: Open a Trace from a File for Off-line Analysis ................................................................. 101 Figure 116 : Offline Analysis ......................................................................................................... 101 Figure 117: INI Decode Option for SS7 Analyzer ............................................................................. 105 Figure 118 : Decode of INAP CS1 Layer .......................................................................................... 107 Figure 119 : Decode of INAP CS2 ITU Layer .................................................................................... 108 Figure 120 : Decode of INAP CS2 ETSI Layer .................................................................................. 109 Figure 121 : Selection of Default Summary Fields for Surveillance (TCP/IP) ........................................ 110 Figure 122 : CNAM Call Detail Records ........................................................................................... 111 Figure 123 : MTP2 Decoded in High Speed Link ............................................................................... 112
Overview
GL Communications Inc. 1 November 2013
Document Number: XX120-7.10.24-03
Application I - Real-time Protocol Analysis
Section 1.0 Overview
1.1 Introduction
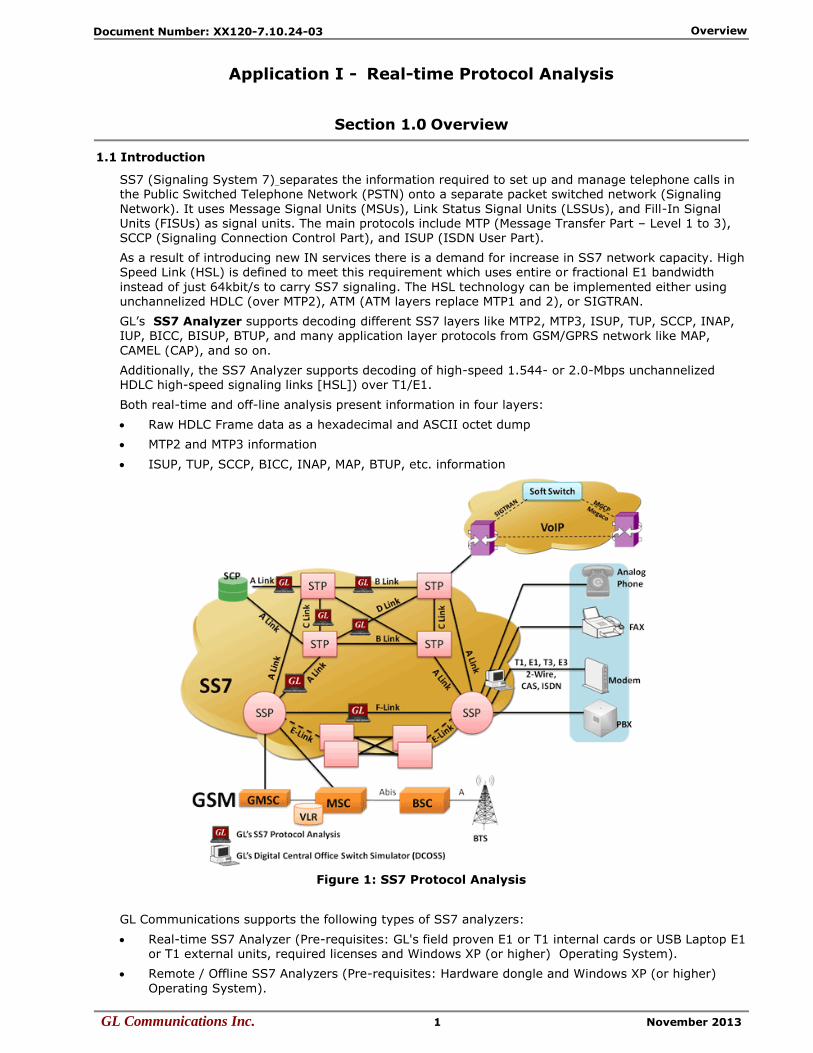
SS7 (Signaling System 7) separates the information required to set up and manage telephone calls in the Public Switched Telephone Network (PSTN) onto a separate packet switched network (Signaling
Network). It uses Message Signal Units (MSUs), Link Status Signal Units (LSSUs), and Fill-In Signal Units (FISUs) as signal units. The main protocols include MTP (Message Transfer Part – Level 1 to 3), SCCP (Signaling Connection Control Part), and ISUP (ISDN User Part).
As a result of introducing new IN services there is a demand for increase in SS7 network capacity. High Speed Link (HSL) is defined to meet this requirement which uses entire or fractional E1 bandwidth
instead of just 64kbit/s to carry SS7 signaling. The HSL technology can be implemented either using unchannelized HDLC (over MTP2), ATM (ATM layers replace MTP1 and 2), or SIGTRAN.
GL’s SS7 Analyzer supports decoding different SS7 layers like MTP2, MTP3, ISUP, TUP, SCCP, INAP,
IUP, BICC, BISUP, BTUP, and many application layer protocols from GSM/GPRS network like MAP,
CAMEL (CAP), and so on.
Additionally, the SS7 Analyzer supports decoding of high-speed 1.544- or 2.0-Mbps unchannelized HDLC high-speed signaling links [HSL]) over T1/E1.
Both real-time and off-line analysis present information in four layers:
Raw HDLC Frame data as a hexadecimal and ASCII octet dump
MTP2 and MTP3 information
ISUP, TUP, SCCP, BICC, INAP, MAP, BTUP, etc. information
Figure 1: SS7 Protocol Analysis
GL Communications supports the following types of SS7 analyzers:
Real-time SS7 Analyzer (Pre-requisites: GL's field proven E1 or T1 internal cards or USB Laptop E1 or T1 external units, required licenses and Windows XP (or higher) Operating System).
Remote / Offline SS7 Analyzers (Pre-requisites: Hardware dongle and Windows XP (or higher)
Operating System).
Overview
GL Communications Inc. 2 November 2013
Document Number: XX120-7.10.24-03
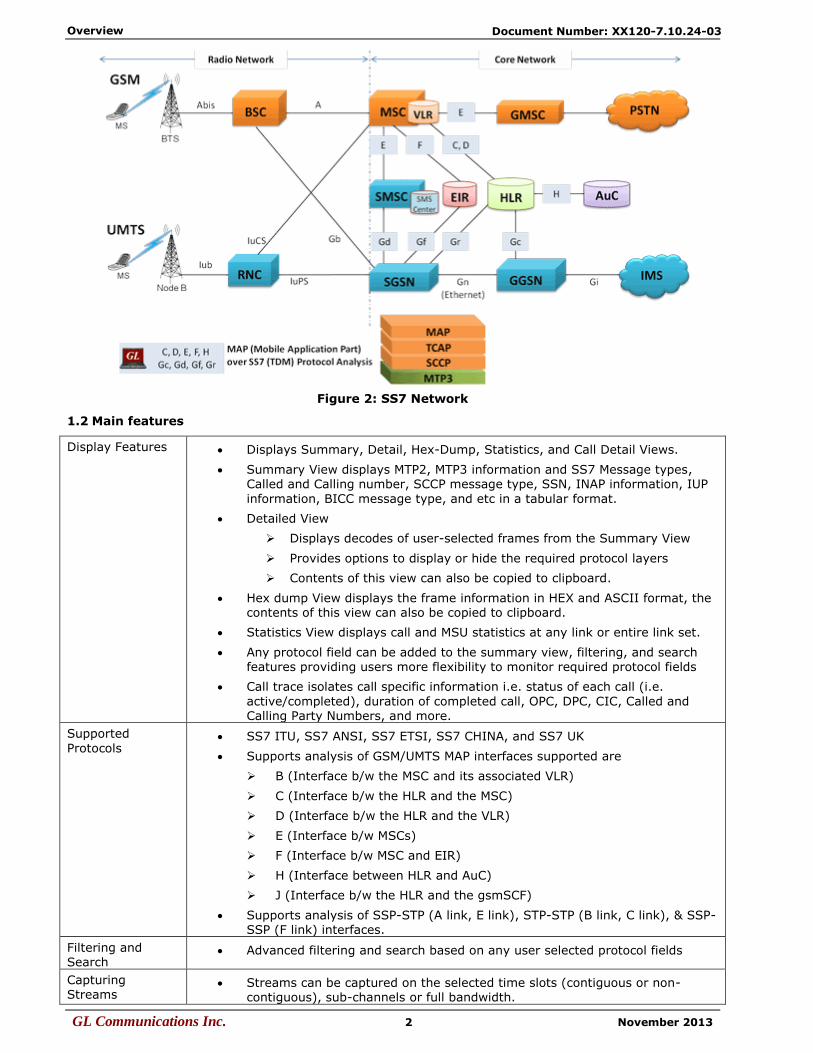
Figure 2: SS7 Network
1.2 Main features
Display Features Displays Summary, Detail, Hex-Dump, Statistics, and Call Detail Views.
Summary View displays MTP2, MTP3 information and SS7 Message types, Called and Calling number, SCCP message type, SSN, INAP information, IUP
information, BICC message type, and etc in a tabular format.
Detailed View
Displays decodes of user-selected frames from the Summary View
Provides options to display or hide the required protocol layers
Contents of this view can also be copied to clipboard.
Hex dump View displays the frame information in HEX and ASCII format, the contents of this view can also be copied to clipboard.
Statistics View displays call and MSU statistics at any link or entire link set.
Any protocol field can be added to the summary view, filtering, and search features providing users more flexibility to monitor required protocol fields
Call trace isolates call specific information i.e. status of each call (i.e.
active/completed), duration of completed call, OPC, DPC, CIC, Called and Calling Party Numbers, and more.
Supported
Protocols SS7 ITU, SS7 ANSI, SS7 ETSI, SS7 CHINA, and SS7 UK
Supports analysis of GSM/UMTS MAP interfaces supported are
B (Interface b/w the MSC and its associated VLR)
C (Interface b/w the HLR and the MSC)
D (Interface b/w the HLR and the VLR)
E (Interface b/w MSCs)
F (Interface b/w MSC and EIR)
H (Interface between HLR and AuC)
J (Interface b/w the HLR and the gsmSCF)
Supports analysis of SSP-STP (A link, E link), STP-STP (B link, C link), & SSP-SSP (F link) interfaces.
Filtering and Search
Advanced filtering and search based on any user selected protocol fields
Capturing Streams
Streams can be captured on the selected time slots (contiguous or non-contiguous), sub-channels or full bandwidth.

Overview
GL Communications Inc. 3 November 2013
Document Number: XX120-7.10.24-03
Frames can be transmitted/captured in either 64 kbps, 56 kbps, n x 64 kbps,
or n x 56 kbps data channels (hyper-channels)
Capable of decoding many important protocols from GSM/GPRS network i.e.
MAP, CAP.
Supports decoding of frames with FCS of 16 bits and 32 bits, or none.
Export Options Exports Summary View information to a comma delimited file for subsequent
import into a database or spreadsheet.
Capability to export detailed decode information to an ASCII file
Record/Playback Recorded trace files can be played back using HDLC playback application.
Remote
Monitoring Remote monitoring capability using GL's Network Surveillance System.
Call Detail Record Call details recording feature includes data link groups that help in defining
the direction of the calls in a given network and form logical groups comprised of unidirectional (either ‘Forward’ or ‘Backward’) data links.
Additional
Features Trace files for analysis can be loaded through simple command-line
arguments.
Multiple trace files can be loaded simultaneously with different GUI instances for offline analysis.
The following variations are accommodated in the software: inverted or non-
inverted data, byte reversal or non-reversal.
Multiple streams of SS7 traffic on various T1/E1 channels can be simultaneously decoded with different GUI instances.
HDLC (according to Q.921) based SS7 frames are parsed based on ANSI and ITU standards.
Ability to configure the .ini file for custom decoding options such as SSN
value of INAP, MAP, CAP, TCAP, and IS41, and more.
1.3 Offline / Remote Protocol Analyzer
GL Communications offers the Remote Access (client/server) functionality to the T1/E1 products. This
functionality allows analyzer operations to be remotely controlled by one or more clients over a LAN,
WAN, or Internet. Remote client supports Microsoft® Windows® operating systems and includes a DLL component, which may be accessed through a GUI. GL’s offline/remote protocol analyzers are available as optional software. Functionally, they are similar to real-time protocol analyzers that are integrated with T1E1 Analyzers.
With Remote Protocol Analyzer applications, users can perform real-time as well as offline protocol
analysis from any remote-site. However, with Offline Protocol Analyzers, user can decode the pre-captured files from any remote-site. For details on Remote SS7 Analyzer, refer to section Remote SS7 Analyzer
Pre-requisites of the remote functionality are:
At the site of monitoring
Dual Capture T1 E1 Cards or USB Based T1 E1 Hardware
T1 E1 Server software with HDLC capture software
At the client location
Appropriate GUI based “Remote Protocol Analyzer” at such as ISDN, SS7, and others
The RPA functionality permits:
unattended and 24/7 operation
remote accessibility for difficult connection situations
remote non-intrusive operation
remote detail diagnostic capability
Main Features
Client side consists of a PC with Ethernet connectivity and GUI Remote Protocol Analysis software – no special T1 or E1 hardware is required.
Multiple T1/E1 servers may be simultaneously connected to a single remote client using a single
GUI.
Overview
GL Communications Inc. 4 November 2013
Document Number: XX120-7.10.24-03
Multiple remote clients may access a single T1/E1 server. Also, the T1/E1 server is fully functional while being accessed as a server. Thus, a user may perform T1/E1 operations locally on the server while a client is accessing the same server, in real time.
Supports real-time and offline analysis at the remote client location.
Remote analyzers support capturing of encapsulated protocols and long frames.
Common filtering criteria can be set for T1/E1 cards located on multiple servers.
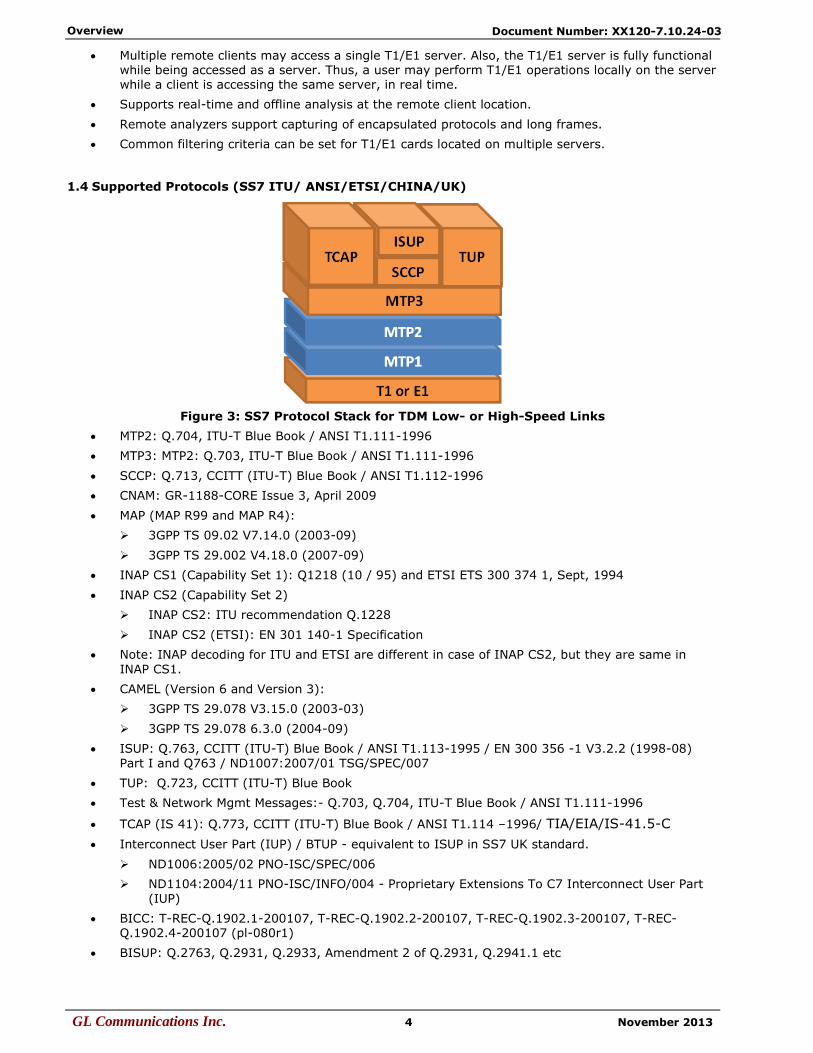
1.4 Supported Protocols (SS7 ITU/ ANSI/ETSI/CHINA/UK)
Figure 3: SS7 Protocol Stack for TDM Low- or High-Speed Links
MTP2: Q.704, ITU-T Blue Book / ANSI T1.111-1996
MTP3: MTP2: Q.703, ITU-T Blue Book / ANSI T1.111-1996
SCCP: Q.713, CCITT (ITU-T) Blue Book / ANSI T1.112-1996
CNAM: GR-1188-CORE Issue 3, April 2009
MAP (MAP R99 and MAP R4):
3GPP TS 09.02 V7.14.0 (2003-09)
3GPP TS 29.002 V4.18.0 (2007-09)
INAP CS1 (Capability Set 1): Q1218 (10 / 95) and ETSI ETS 300 374 1, Sept, 1994
INAP CS2 (Capability Set 2)
INAP CS2: ITU recommendation Q.1228
INAP CS2 (ETSI): EN 301 140-1 Specification
Note: INAP decoding for ITU and ETSI are different in case of INAP CS2, but they are same in
INAP CS1.
CAMEL (Version 6 and Version 3):
3GPP TS 29.078 V3.15.0 (2003-03)
3GPP TS 29.078 6.3.0 (2004-09)
ISUP: Q.763, CCITT (ITU-T) Blue Book / ANSI T1.113-1995 / EN 300 356 -1 V3.2.2 (1998-08)
Part I and Q763 / ND1007:2007/01 TSG/SPEC/007
TUP: Q.723, CCITT (ITU-T) Blue Book
Test & Network Mgmt Messages:- Q.703, Q.704, ITU-T Blue Book / ANSI T1.111-1996
TCAP (IS 41): Q.773, CCITT (ITU-T) Blue Book / ANSI T1.114 –1996/ TIA/EIA/IS-41.5-C
Interconnect User Part (IUP) / BTUP - equivalent to ISUP in SS7 UK standard.
ND1006:2005/02 PNO-ISC/SPEC/006
ND1104:2004/11 PNO-ISC/INFO/004 - Proprietary Extensions To C7 Interconnect User Part
(IUP)
BICC: T-REC-Q.1902.1-200107, T-REC-Q.1902.2-200107, T-REC-Q.1902.3-200107, T-REC-Q.1902.4-200107 (pl-080r1)
BISUP: Q.2763, Q.2931, Q.2933, Amendment 2 of Q.2931, Q.2941.1 etc

Getting Started
GL Communications Inc. 5 November 2013
Document Number: XX120-7.10.24-03
Section 2.0 Getting Started
2.1 Installation
The Real-time protocol analyzer is available as optional software with the GL’s T1/E1 analyzer. Users require a GL’s license to integrate the protocol analyzer with already existing T1/E1 Analyzer. Once the license has been installed properly using license installer, the application can be invoked as explained in the following section.
For installing offline and remote protocol analyzers, first install T1 E1 hardware, server software, and protocol capture software. At the remote site, install the GUI based Offline/Remote protocol analyzer application. For more details on installation of offline protocol analyzer, refer to section Offline / Remote Analyzer Installation. For details on installing T1E1 Analyzer, refer to T1E1 Installation User Manual for the required Windows® operating system.
2.2 Invoking Real-time Protocol Analyzer
Double-click the T1/E1 Analyzer icon located on the desktop to invoke the application. The T1/E1
Analyzer executable is located in the directory ‘\Program Files\GL Communications Inc’. From the main window of T1/E1 Analyzer, click Special Applications > Protocol Analysis and select the required protocol analyzer as shown below:
Figure 4: Invoking the Protocol Analysis

Getting Started
GL Communications Inc. 6 November 2013
Document Number: XX120-7.10.24-03
2.3 User Interface
The user interface comprises of main menu, toolbar, sub menu toolbar and different views, which includes Summary View at the top, followed by the Detail, Hex Dump, Statistics, and optional Call
Detail View at the bottom as shown in the figure below:
Figure 5: Summary, Detail, Hex dump, Statistics Views
The main menu tool bar comprises of File, View, Capture, Statistics, Database, Call Detail Records, Configure, and Help menu. The main menu and the tool bar are used to select an operation to perform. The status fields at the bottom of the window display miscellaneous status information. Most of the operations can be performed either using the main menu or the corresponding tool button.
The features under these menus are explained in detail later, in this document.
The protocol analyzer opens with Summary, Detail and Hex Dump as default panes. Statistics and Call Detail are optional panes, which can be viewed if required. User have the options to set the required panes by using Views > Define Views. The splitter separating the summary, detail and hex dump views can be adjusted according to user preferences. The summary view columns can be resized and
reordered.
Summary View displays various columns such as Dev#, Frame Number, Time, Length, Error, Src/dest IP addresses, Frame Type, and so on.
User selects a frame in the Summary View to get the detail protocol field information in the Detail
View.
Raw data for the selected Summary View frame is displayed in the Hex-dump View in HEX and ASCII formats.
File Menu Options
GL Communications Inc. 7 November 2013
Document Number: XX120-7.10.24-03
Section 3.0 File Menu Options
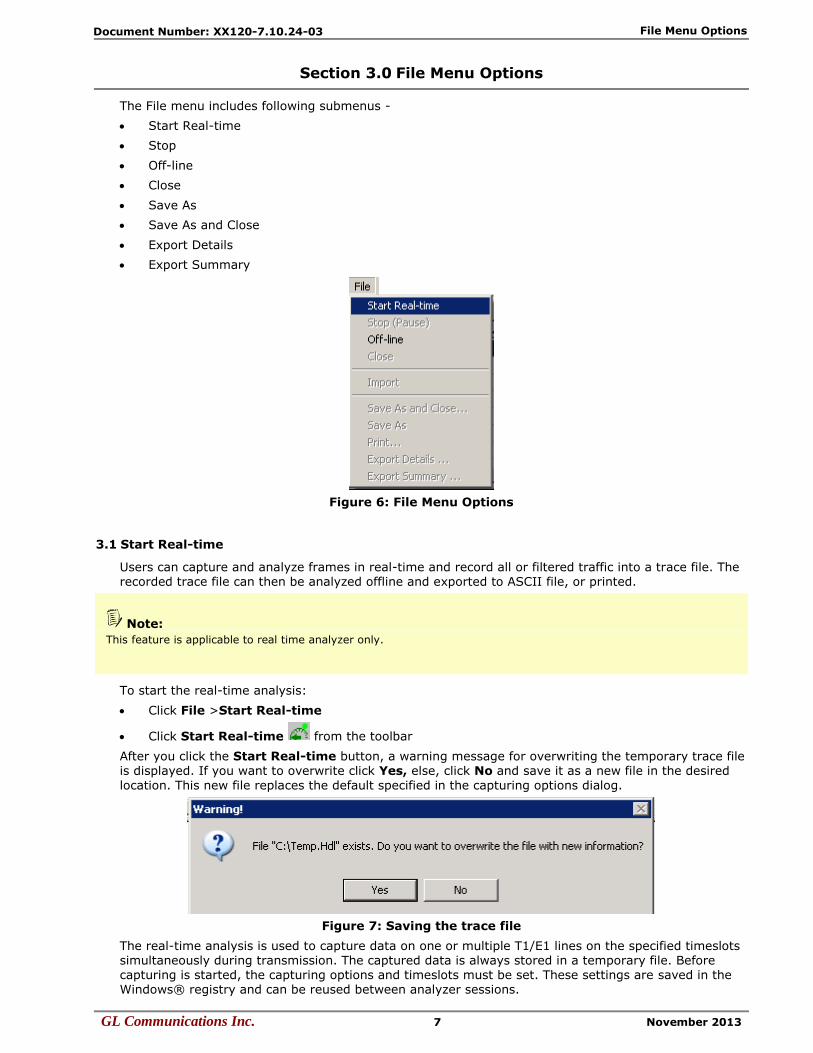
The File menu includes following submenus -
Start Real-time
Stop
Off-line
Close
Save As
Save As and Close
Export Details
Export Summary
Figure 6: File Menu Options
3.1 Start Real-time
Users can capture and analyze frames in real-time and record all or filtered traffic into a trace file. The recorded trace file can then be analyzed offline and exported to ASCII file, or printed.
Note: This feature is applicable to real time analyzer only.
To start the real-time analysis:
Click File >Start Real-time
Click Start Real-time from the toolbar
After you click the Start Real-time button, a warning message for overwriting the temporary trace file is displayed. If you want to overwrite click Yes, else, click No and save it as a new file in the desired
location. This new file replaces the default specified in the capturing options dialog.
Figure 7: Saving the trace file
The real-time analysis is used to capture data on one or multiple T1/E1 lines on the specified timeslots simultaneously during transmission. The captured data is always stored in a temporary file. Before capturing is started, the capturing options and timeslots must be set. These settings are saved in the Windows® registry and can be reused between analyzer sessions.
File Menu Options
GL Communications Inc. 8 November 2013
Document Number: XX120-7.10.24-03
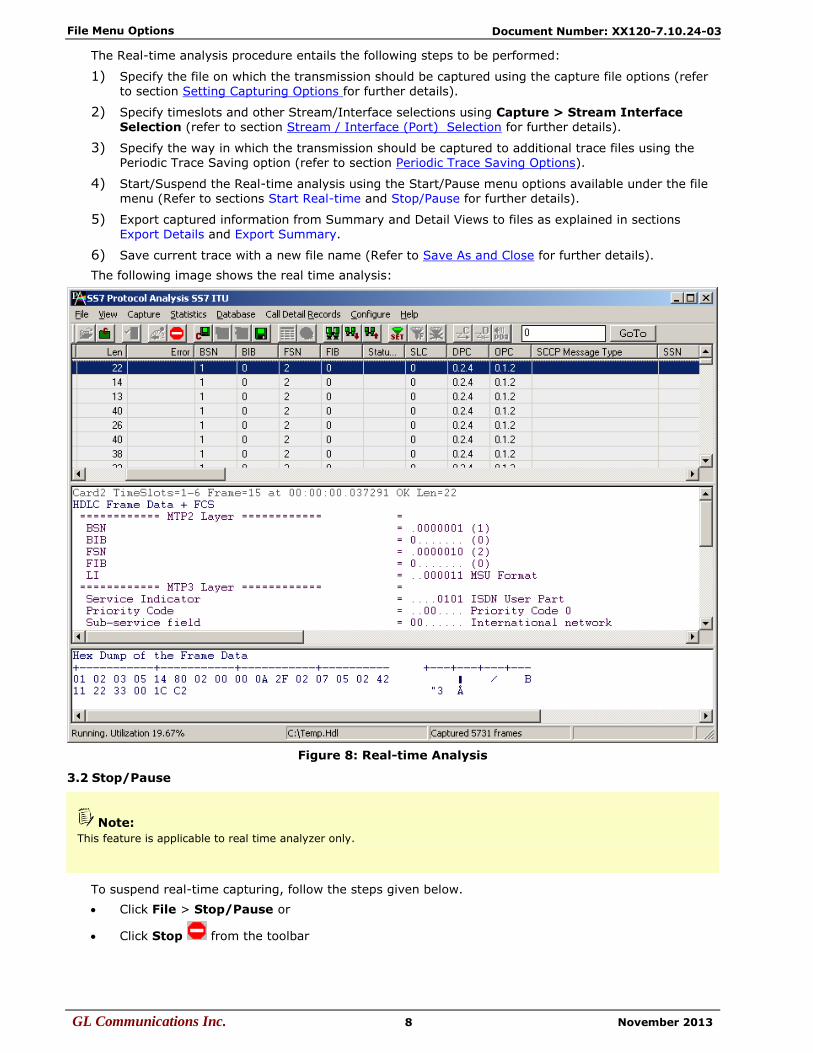
The Real-time analysis procedure entails the following steps to be performed:
1) Specify the file on which the transmission should be captured using the capture file options (refer
to section Setting Capturing Options for further details).
2) Specify timeslots and other Stream/Interface selections using Capture > Stream Interface
Selection (refer to section Stream / Interface (Port) Selection for further details).
3) Specify the way in which the transmission should be captured to additional trace files using the
Periodic Trace Saving option (refer to section Periodic Trace Saving Options).
4) Start/Suspend the Real-time analysis using the Start/Pause menu options available under the file
menu (Refer to sections Start Real-time and Stop/Pause for further details).
5) Export captured information from Summary and Detail Views to files as explained in sections
Export Details and Export Summary.
6) Save current trace with a new file name (Refer to Save As and Close for further details).
The following image shows the real time analysis:
Figure 8: Real-time Analysis
3.2 Stop/Pause
Note: This feature is applicable to real time analyzer only.
To suspend real-time capturing, follow the steps given below.
Click File > Stop/Pause or
Click Stop from the toolbar

File Menu Options
GL Communications Inc. 9 November 2013
Document Number: XX120-7.10.24-03
3.3 Opening Trace for Offline Analysis
Off-line analysis is equivalent to transmitting/capturing a file in pre-defined channels and decode
standards. During off-line analysis the users can analyze the pre-captured *.hdl files. To open the trace for Offline Analysis, follow the steps given below:
Click File > Off-line as shown in the figure below Or
Click Off line from a File from the tool bar
Figure 9: Open a Trace from a File for Off-line Analysis
Figure 10: Offline Analysis

File Menu Options
GL Communications Inc. 10 November 2013
Document Number: XX120-7.10.24-03
Additionally, the files can be loaded using the command as shown in the figure below:
Figure 11: Open a Trace File from Command Prompt
3.4 Close Trace
To close the trace file, follow the steps given below:
Select File > Close or
Click Close trace from the toolbar.
3.5 Save As and Close
To save the trace file using a different name, follow the steps given below:
Select File > Save As and Close menu item Or
Click Save Trace to a Different File Name and Close from the tool bar
Figure 12: Save Trace As File Name and Close
This feature is usually used to make sure that trace is saved in a different file than temporary trace file and will not be overwritten by accident.

File Menu Options
GL Communications Inc. 11 November 2013
Document Number: XX120-7.10.24-03
3.6 Save As
To save specific Frames/Packets in a new file or to append to an existing file, follow the steps given below:
Click File > Save As Or
Click Save As from the tool bar.
Figure 13: Save As
Select All to save all the captured frames
Select From to save all the frames whose frame length ranges within the specified values in ‘min’ to ‘max’ text boxes as shown in the above figure
Select Overwrite to overwrite the existing *.HDL files in the directory with the new captured frames
Select Append to append the frames/packets to the already existing *.HDL files in the directory.
Trace file remains open after the “Save As” operation is completed. Close the trace file and verify if
the file has been successfully saved by opening the saved *.HDL file in offline mode.

File Menu Options
GL Communications Inc. 12 November 2013
Document Number: XX120-7.10.24-03
3.7 Export Details
To export the detail information of frames to an ASCII file, follow the steps given below:
Click File > Export Details Or.
Click Export Details from the tool bar
Figure 14: Exporting Trace to an ASCII File
3.8 Export Summary
To export the summary information to comma separated values (CSV) format, follow the steps given below:
Click File > Export Summary Or
Click Export Summary to a comma delimited file from the tool bar
Select the Columns to Export and save the export summary as text file. Select Export Headers to
export a header line with column names preceding the summary data rows.
Figure 15: Exporting Summary to an ASCII File

View Menu Options
GL Communications Inc. 13 November 2013
Document Number: XX120-7.10.24-03
Section 4.0 View Menu Options
The view menu includes -
Define Views to Display- Summary View; Right-click options in Summary View; Detail View; Hex Dump View; Statistics View;
Protocol Standard
User/Network Side Specification
Time Format
Latest Frame
Set filtering criteria
Activate or Deactivate filter
Search criteria
Next, Prev
Displays trace file name
Default Summary Columns
Figure 16: View Menu Options
View Menu Options
GL Communications Inc. 14 November 2013
Document Number: XX120-7.10.24-03
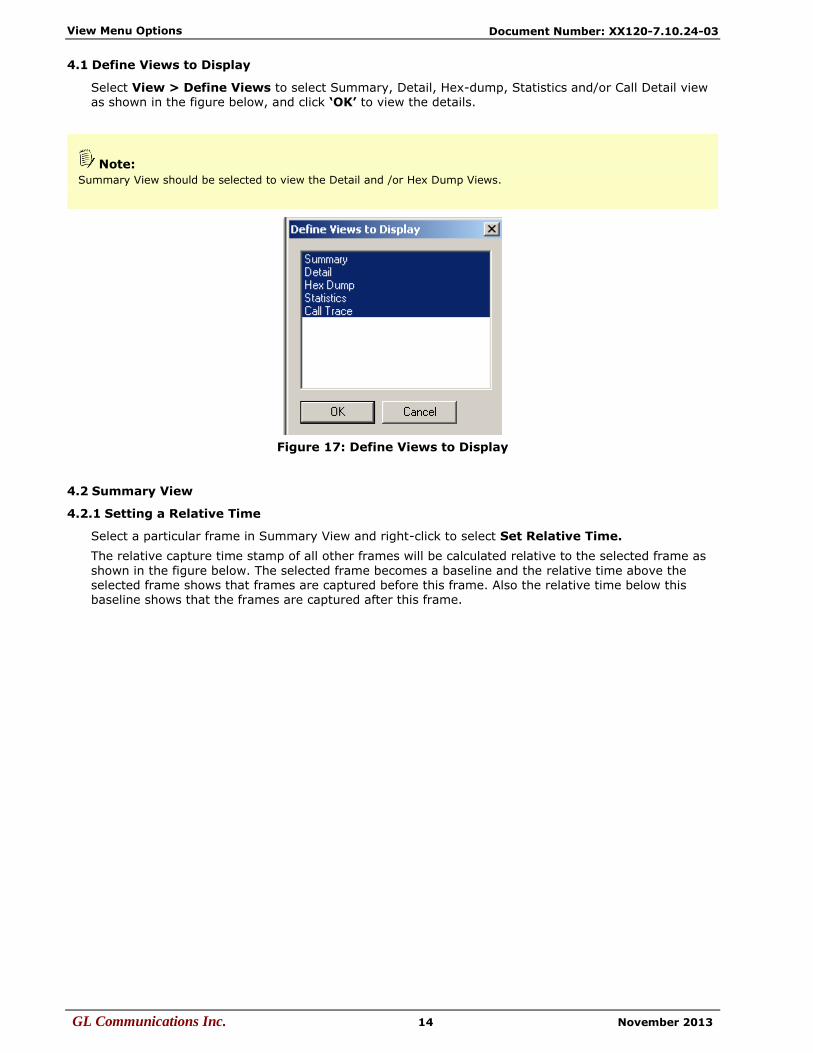
4.1 Define Views to Display
Select View > Define Views to select Summary, Detail, Hex-dump, Statistics and/or Call Detail view as shown in the figure below, and click ‘OK’ to view the details.
Note: Summary View should be selected to view the Detail and /or Hex Dump Views.
Figure 17: Define Views to Display
4.2 Summary View
4.2.1 Setting a Relative Time
Select a particular frame in Summary View and right-click to select Set Relative Time.
The relative capture time stamp of all other frames will be calculated relative to the selected frame as
shown in the figure below. The selected frame becomes a baseline and the relative time above the selected frame shows that frames are captured before this frame. Also the relative time below this baseline shows that the frames are captured after this frame.

View Menu Options
GL Communications Inc. 15 November 2013
Document Number: XX120-7.10.24-03
Figure 18: Set Relative Time
View Menu Options
GL Communications Inc. 16 November 2013
Document Number: XX120-7.10.24-03
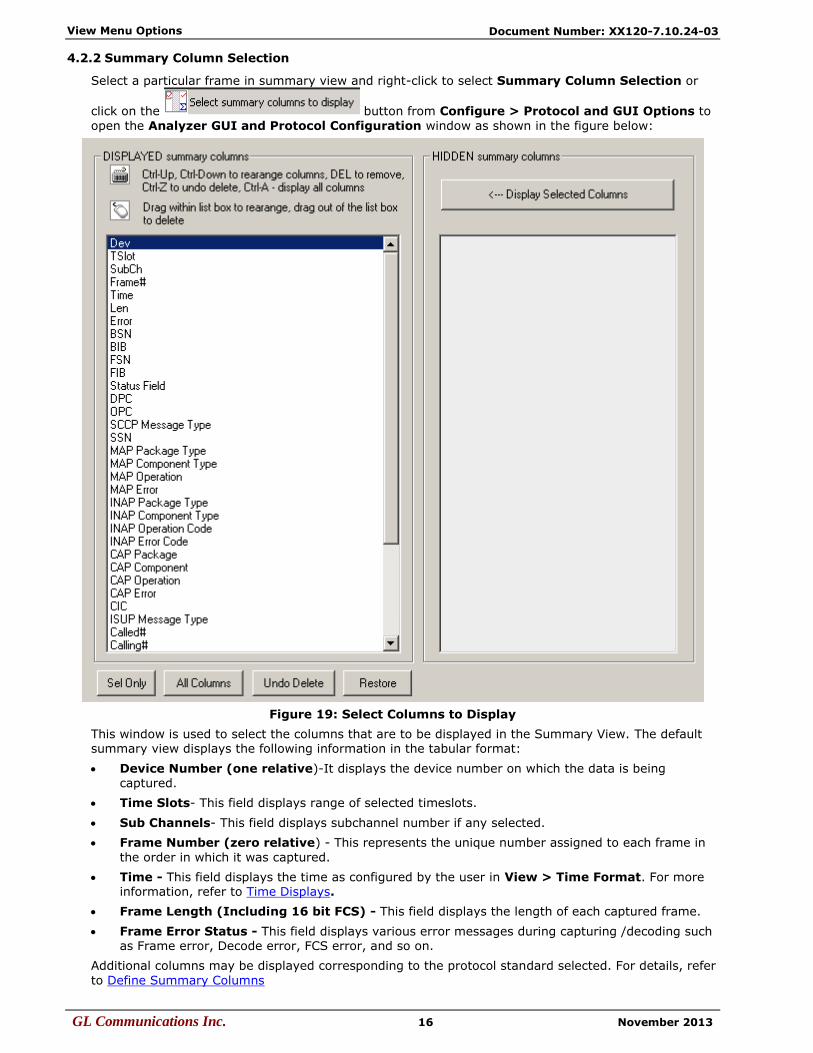
4.2.2 Summary Column Selection
Select a particular frame in summary view and right-click to select Summary Column Selection or
click on the button from Configure > Protocol and GUI Options to
open the Analyzer GUI and Protocol Configuration window as shown in the figure below:
Figure 19: Select Columns to Display
This window is used to select the columns that are to be displayed in the Summary View. The default summary view displays the following information in the tabular format:
Device Number (one relative)-It displays the device number on which the data is being
captured.
Time Slots- This field displays range of selected timeslots.
Sub Channels- This field displays subchannel number if any selected.
Frame Number (zero relative) - This represents the unique number assigned to each frame in
the order in which it was captured.
Time - This field displays the time as configured by the user in View > Time Format. For more information, refer to Time Displays.
Frame Length (Including 16 bit FCS) - This field displays the length of each captured frame.
Frame Error Status - This field displays various error messages during capturing /decoding such as Frame error, Decode error, FCS error, and so on.
Additional columns may be displayed corresponding to the protocol standard selected. For details, refer
to Define Summary Columns

View Menu Options
GL Communications Inc. 17 November 2013
Document Number: XX120-7.10.24-03
Select the desired columns to be displayed from DISPLAYED Summary columns pane to display the columns in the summary view.
Click All Columns to display all the columns in the Summary View.
Click Sel Only to display a particular column in the Summary View.
Click and drag columns up and down in the “DISPLAYED” summary column list to reorder them.
Click and drag the columns to the right side of the pane to delete them or use the keyboard “Delete” key.
Click Undo Delete or Restore to get the columns back to the left pane.
Click Display Selected Columns from the HIDDEN Summary columns pane to view the columns, which are hidden.
In addition to column selection, this window allows users to reorder the columns appearance that is
displayed in the Summary View, which is explained in the section below.
4.2.3 Column Resizing and Reordering
The users can resize and/or reorder the columns in Summary View. From Select Summary Columns
window (under Configure > Protocol and GUI Options), click and drag the columns to different
positions as shown in the figure below. The figure shows the Time (Relative) and Len columns are reordered and TSlot and Frame # columns are resized.
Figure 20: Column Resizing and Reordering
In addition to reordering, the Summary columns can be resized. Click and drag the Summary column headers to resize them.

View Menu Options
GL Communications Inc. 18 November 2013
Document Number: XX120-7.10.24-03
4.2.4 Repositioning Summary View
Enter a new current frame number to position at the top of the summary view and click GoTo button as shown in the figure below:
Figure 21: Repositioning the Summary View
This operation may be executed even during the real-time capturing. If filter is active the frame number refers to displayed (filtered out) frames.

View Menu Options
GL Communications Inc. 19 November 2013
Document Number: XX120-7.10.24-03
4.2.5 Summary Colors
Select a frame in Summary View and right-click to select Summary Colors as shown in the figure below. Summary View is shown in different colors based on the selected columns. For example, select
Len (Frame Length) option and click Ok.
Figure 22: Set Summary Colors
Observe that different colors are set based on the values in the Len column, in other words, the frames having the same length values will have a unique color set for it as shown in the figure above.
4.2.6 Define Views
For detail information on this refer to section Define Views to Display.

View Menu Options
GL Communications Inc. 20 November 2013
Document Number: XX120-7.10.24-03
4.3 Detail View - Selecting Individual Frame
Click to highlight a frame in Summary View to display the frame-specific details in the Detail View.
Each line in the detail view displays field offset and upon selection of this offset the corresponding hex
dump view bytes are highlighted,
Figure 23: Detail View of Individual Frame
The Detail View displays frame information in the following sequence:
Frame Summary Information
MTP (Message Transfer Part Level 2) Layer
MTP 3 Layer (Message Transfer Part Level 3) Layer
Layer 3 information
SCCP Layer
ISUP (ISDN User Part) Layer
MAP Layer
INAP Layer
INAP CS2 ITU Layer
INAP CS2 ETSI Layer
IUP (Interconnect User Part) Layer
Network Mgmt Messages Layer
Reg Test Messages Layer
View Menu Options
GL Communications Inc. 21 November 2013
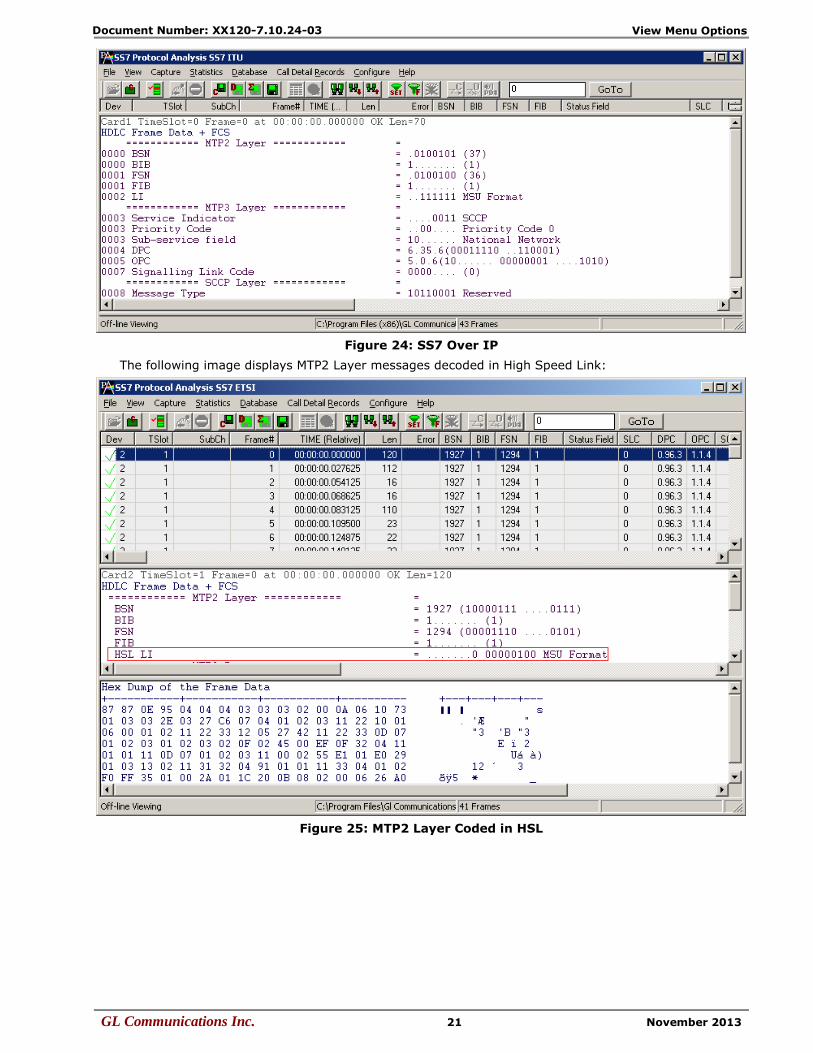
Document Number: XX120-7.10.24-03
Figure 24: SS7 Over IP
The following image displays MTP2 Layer messages decoded in High Speed Link:
Figure 25: MTP2 Layer Coded in HSL

View Menu Options
GL Communications Inc. 22 November 2013
Document Number: XX120-7.10.24-03
4.3.1 Layer Copy/Show/Hide Options
1) Right-click in the Detail View and select ‘Layer Show/Hide’ option to display or hide the required protocol layers.
Figure 26: Selecting Show Layer Option
2) One can also select the Copy option to copy the entire layer decode information to the clipboard.
Refer to the figure below:
Figure 27: Copying Detail View Information

View Menu Options
GL Communications Inc. 23 November 2013
Document Number: XX120-7.10.24-03
4.4 Hex Dump View
Hex Dump view displays raw frame data as a hexadecimal and an ASCII octet dump.
4.5 Statistics View
Various statistics can be calculated based on the protocol fields. For more information refer to the Statistics section.
4.6 Protocol Standard
Select View > Protocol to select the decoding standard to be used to parse and display information. The decoding standard does not affect information saved to a disk file and therefore can be changed at
any time.
Figure 28: Select Protocol Standard

View Menu Options
GL Communications Inc. 24 November 2013
Document Number: XX120-7.10.24-03
4.7 User/Network Side Specification
Select As Captured option button to retain the selected user/network options at the time of capturing.
Select Inverse Captured option to inverse the selected user/network options effective at the time of
capturing.
Select User Defined option button to specify the network side cards. This option can be specified when multiple cards are used. Enter the card number, which should be on the network side.
The user/network side specification is set initially using the Capture Options > Stream/ Interface dialog as explained in the section User / Network Side Specification.
Figure 29: User/Network Side Specifications

View Menu Options
GL Communications Inc. 25 November 2013
Document Number: XX120-7.10.24-03
4.8 Time Displays
Four time formats are supported for both real-time and offline analysis. These time formats can be changed during both off-line and real-time operations by selecting the required time format either from
View > Time Format menu item or by clicking on the time column header in the Summary View shown in the figure below.
Relative time
System time
Date and time
Difference time
Figure 30: Time Displays
4.8.1 Relative Time
In the Relative time format, the time of capture of each frame is displayed relative to the time of a
selected frame. In this format, time value of the selected frame when the option is activated is always 0:00:00:000000.
If, for instance, second frame has the time value as 0:00:20:000000, it means that second frame was captured after 20 seconds since the first frame was captured. Thus the time value corresponding to
each frame is obtained by the difference between the time of capture of that frame and time of capture of 0th frame. Preceding frames have negative relative time and following frames have positive relative time.
4.8.2 System Time
This option displays the system (local computer) time when frames were captured. For offline analysis, the system time option shows the time when the trace was captured earlier.
For instance, during real-time capture, if the capture time displayed for the first frame is 14:53:24:015411, it means that the first frame was captured at 2.53 P.M., 24 seconds, 015411
microseconds local system time.
4.8.3 Date and Time
Date and Time format shows local date and system (PC) time during the real-time capturing of the frames. For off-line analysis, the system time option shows the date and time when the trace was
captured earlier. The display is in the form of year, month, day, hours, minutes, seconds and
microseconds.
4.8.4 Difference Time
The Time Difference format displays the time difference between consecutive frame capture times. For each frame it is this frame time minus the preceding frame time.

View Menu Options
GL Communications Inc. 26 November 2013
Document Number: XX120-7.10.24-03
4.9 Latest
Note: This feature is applicable to real-time analyzer only.
The View > Latest option enables/disables automatic screen refresh and repositioning of the
Summary and Detail View to the latest captured frame. This option does not have any effect in the off-line analysis mode and is used only for real-time analysis to refresh screen approximately every two seconds. When the menu option is checked the automatic repositioning to the latest captured frame is enabled.
Figure 31: Auto Screen Refresh During Real-time Analysis
4.10 View Filtering Criteria
The View Filter is used real-time and offline to display and subsequently save, export and print a subset of frames satisfying a certain filtering criterion. The active filter is used as WYSIWYG (What You See Is What You Get). When filtering is active, the subsequent save as, export and or print will apply
only to the filtered frames, otherwise, all the frames will be affected by the operation.
All captured frames are preserved and will be displayed when filter is deactivated. The filtering criterion is effective either until the criterion is changed, de-activated or the analyzer is closed. After the filtering criterion has been specified, the frame filtering can be activated or de-activated at any time.
View Menu Options
GL Communications Inc. 27 November 2013
Document Number: XX120-7.10.24-03
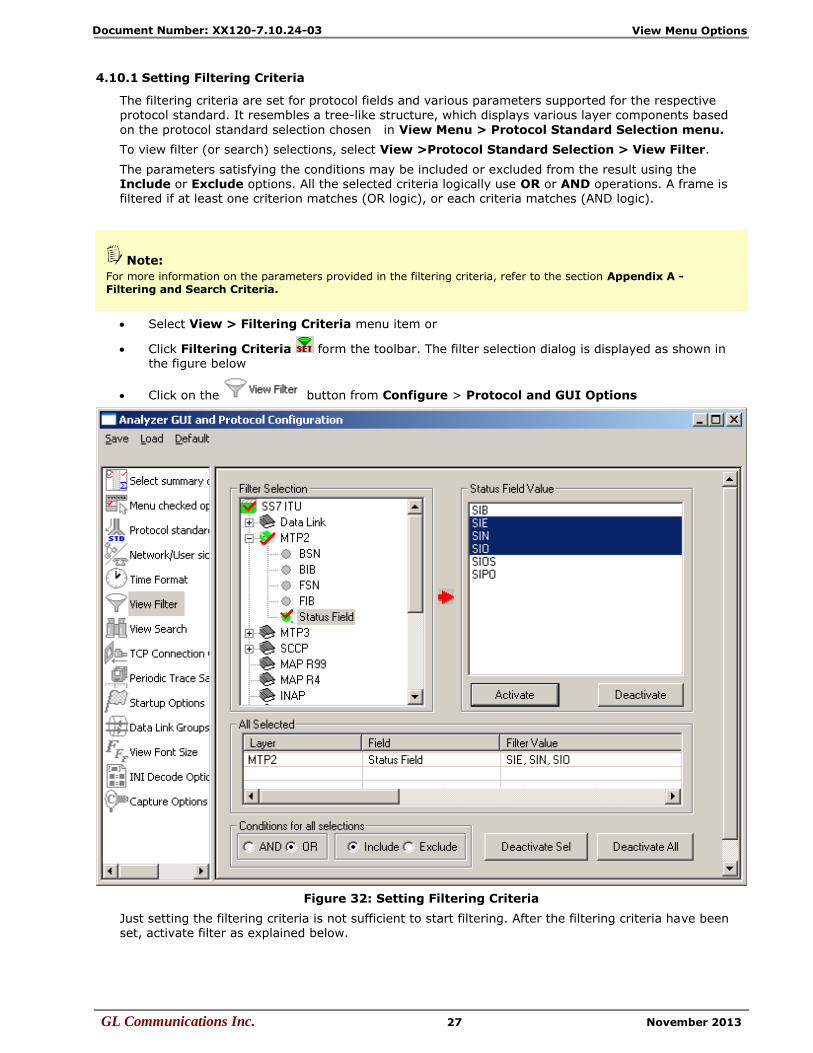
4.10.1 Setting Filtering Criteria
The filtering criteria are set for protocol fields and various parameters supported for the respective
protocol standard. It resembles a tree-like structure, which displays various layer components based
on the protocol standard selection chosen in View Menu > Protocol Standard Selection menu.
To view filter (or search) selections, select View >Protocol Standard Selection > View Filter.
The parameters satisfying the conditions may be included or excluded from the result using the Include or Exclude options. All the selected criteria logically use OR or AND operations. A frame is filtered if at least one criterion matches (OR logic), or each criteria matches (AND logic).
Note: For more information on the parameters provided in the filtering criteria, refer to the section Appendix A - Filtering and Search Criteria.
Select View > Filtering Criteria menu item or
Click Filtering Criteria form the toolbar. The filter selection dialog is displayed as shown in the figure below
Click on the button from Configure > Protocol and GUI Options
Figure 32: Setting Filtering Criteria
Just setting the filtering criteria is not sufficient to start filtering. After the filtering criteria have been set, activate filter as explained below.

View Menu Options
GL Communications Inc. 28 November 2013
Document Number: XX120-7.10.24-03
4.10.2 Activate Filter
Activate filter activates the filtering criterion and displays only filtered frames.
Select View > Activate Filter menu item as shown in the figure below or
Click Activate Filter from the toolbar
Figure 33: Activating Filter
If no filtering criterion is selected, both View > Activate Filter menu item and the corresponding button are disabled. Therefore, setting filtering criteria must precede the filter activation.
The active filter affects subsequent save, export and print operations. It works as WYSIWYG (what you see is what you get).

View Menu Options
GL Communications Inc. 29 November 2013
Document Number: XX120-7.10.24-03
4.10.3 Deactivating Filter
Deactivating filter removes filtering and displays all the frames in the trace.
Select View > No Filtering menu item as shown in the figure below or
Click Deactivate Filter from the toolbar
Figure 34: Deactivating Filter
4.10.4 Example - View Filter
To filter out frames with errors and display only the erred frames, follow the steps below:
1) Expand Data Link Layer. Select Error Frames Only option as shown in the figure below to filter all error frames.
2) Enter the character ‘y’ in the entry field and click Activate to apply the settings.
3) Select Include radio button and close the View Filter window to apply the settings.
4) If more than one filter condition is required, select the AND / OR option accordingly.
Figure 35: Example - Filter Option to filter Error Frames Only
View Menu Options
GL Communications Inc. 30 November 2013
Document Number: XX120-7.10.24-03
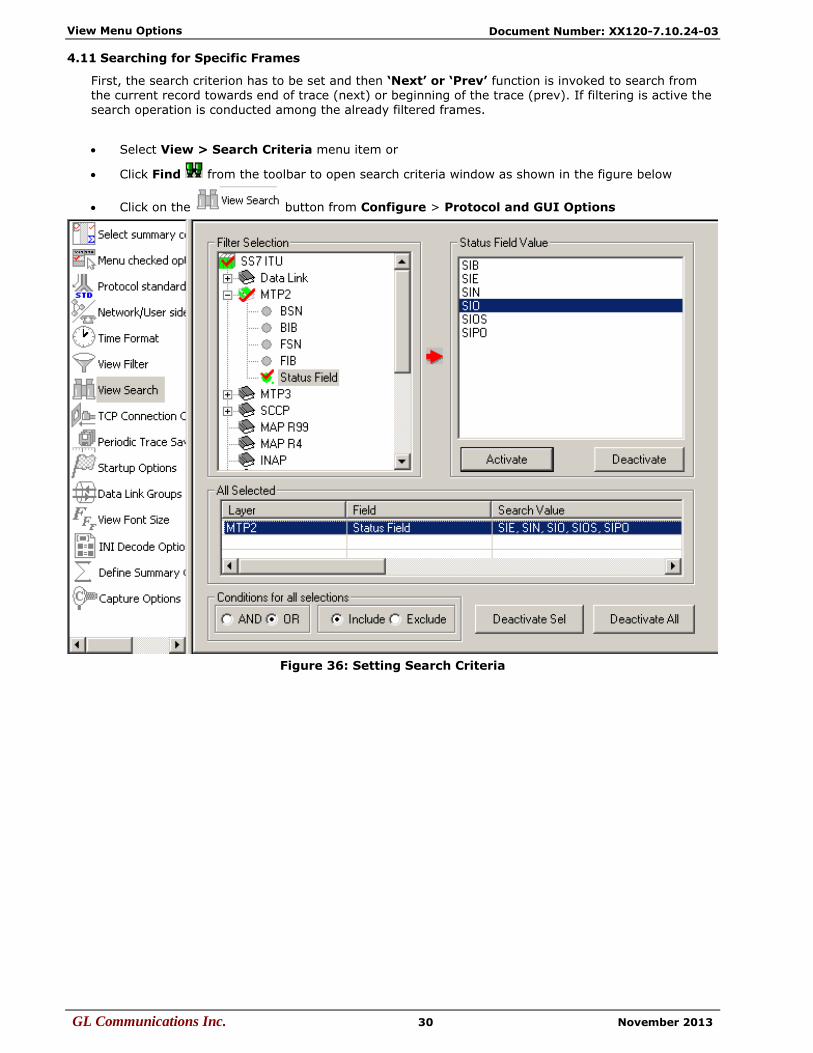
4.11 Searching for Specific Frames
First, the search criterion has to be set and then ‘Next’ or ‘Prev’ function is invoked to search from the current record towards end of trace (next) or beginning of the trace (prev). If filtering is active the
search operation is conducted among the already filtered frames.
Select View > Search Criteria menu item or
Click Find from the toolbar to open search criteria window as shown in the figure below
Click on the button from Configure > Protocol and GUI Options
Figure 36: Setting Search Criteria
View Menu Options
GL Communications Inc. 31 November 2013
Document Number: XX120-7.10.24-03
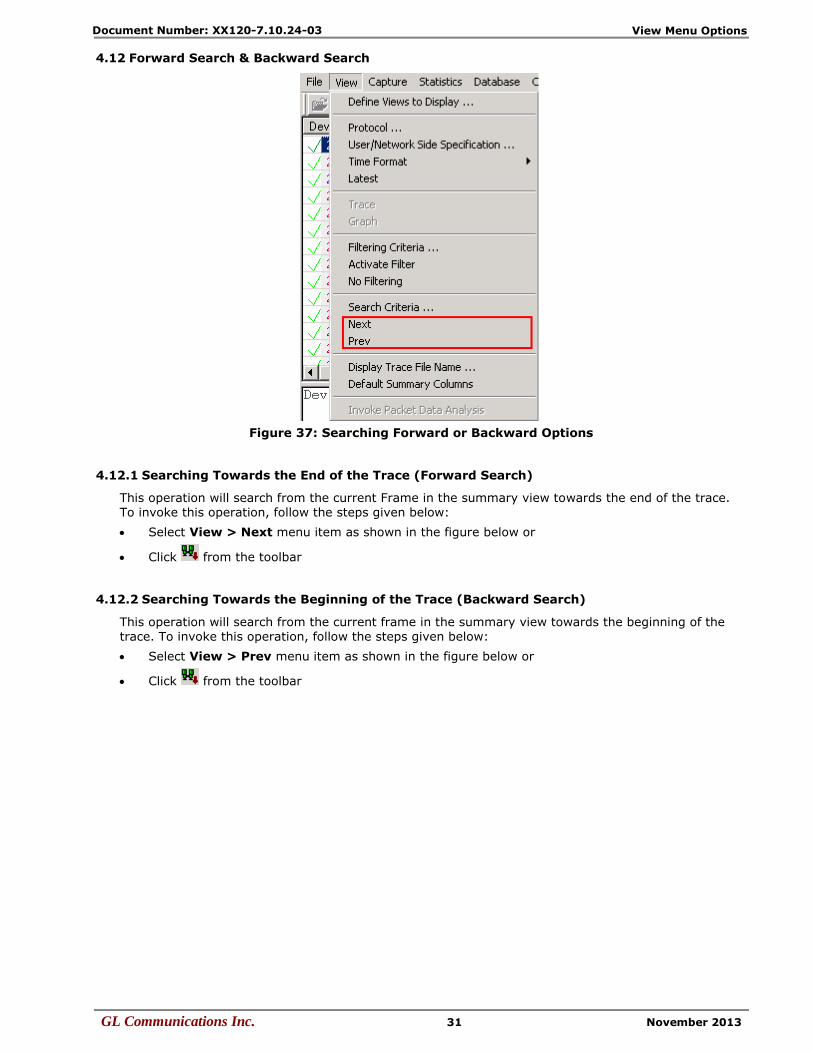
4.12 Forward Search & Backward Search
Figure 37: Searching Forward or Backward Options
4.12.1 Searching Towards the End of the Trace (Forward Search)
This operation will search from the current Frame in the summary view towards the end of the trace. To invoke this operation, follow the steps given below:
Select View > Next menu item as shown in the figure below or
Click from the toolbar
4.12.2 Searching Towards the Beginning of the Trace (Backward Search)
This operation will search from the current frame in the summary view towards the beginning of the trace. To invoke this operation, follow the steps given below:
Select View > Prev menu item as shown in the figure below or
Click from the toolbar

View Menu Options
GL Communications Inc. 32 November 2013
Document Number: XX120-7.10.24-03
4.12.3 Example - Search for particular frames
Use the search option to search for particular frames of interest, among the displayed frames. For
example, to search for all frames with frame length between 40 to 100, captured on device # 2, follow the steps below:
1) Expand Data Link Layer. Select Frame Length option as shown in the figure below.
2) Enter the range '40-100' in the entry field.
3) Further to search frames captured on a particular device, select Card.Timeslot.Subchannel.
4) Enter the value as '2' in the entry field. The format in which this information can be entered is as
follows: Card#…Card#.Timeslot#…Card#.Timeslot#.Subchannel#
5) Click Activate to apply the settings.
6) Select Include radio button and select the AND option to search for frames that meet both criteria.
7) Close the View Search window to apply the settings.
Figure 38: Example - Search option to search for frames of specific length

View Menu Options
GL Communications Inc. 33 November 2013
Document Number: XX120-7.10.24-03
4.13 Display Trace File Name
Select View > Display trace file Name menu item to view the filename under which the analyzer capture frames during real time or offline-trace as shown in the figure below. This option is useful
when the file name is very long and is truncated in the status pane.
Figure 39: Trace File Name
4.14 Default Summary Columns
To return to the Default Summary Columns from resized/reordered columns, click the View > Default Summary Columns option as shown in the figure below:
Figure 40: Default Summary Columns

View Menu Options
GL Communications Inc. 34 November 2013
Document Number: XX120-7.10.24-03
(Intentional Blank Page)
Capture Menu Features
GL Communications Inc. 35 November 2013
Document Number: XX120-7.10.24-03
Section 5.0 Capture Menu Features
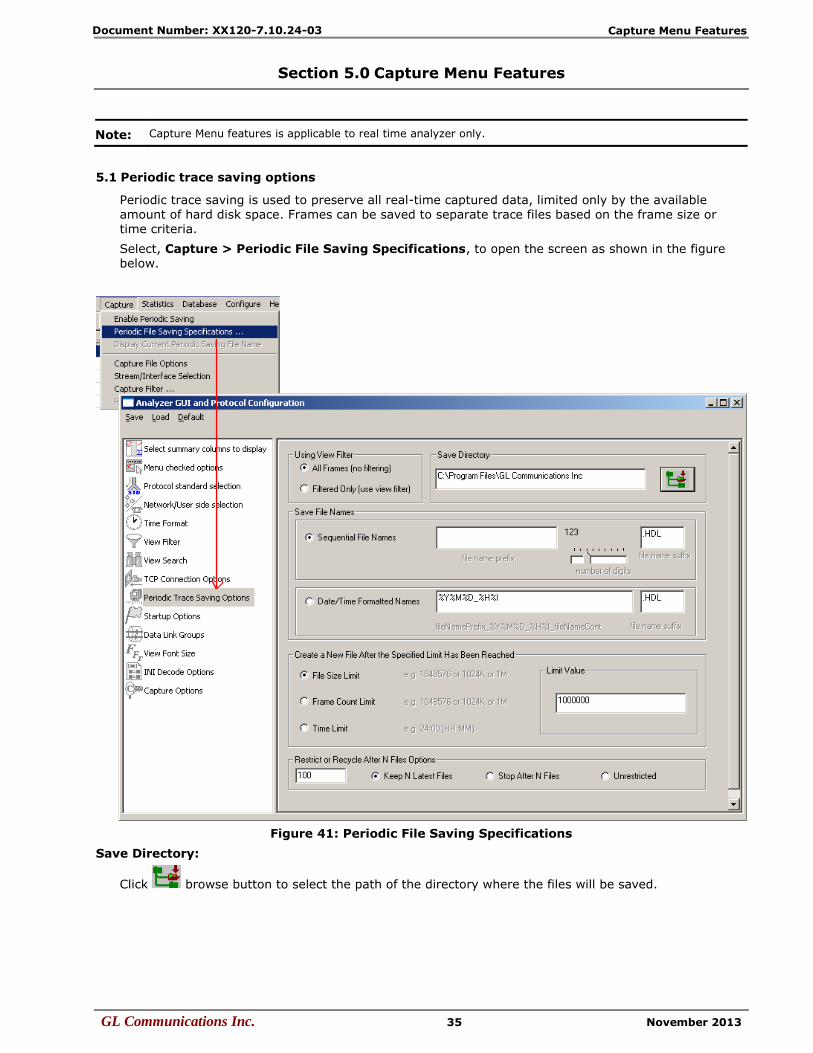
Note: Capture Menu features is applicable to real time analyzer only.
5.1 Periodic trace saving options
Periodic trace saving is used to preserve all real-time captured data, limited only by the available amount of hard disk space. Frames can be saved to separate trace files based on the frame size or time criteria.
Select, Capture > Periodic File Saving Specifications, to open the screen as shown in the figure below.
Figure 41: Periodic File Saving Specifications
Save Directory:
Click browse button to select the path of the directory where the files will be saved.

Capture Menu Features
GL Communications Inc. 36 November 2013
Document Number: XX120-7.10.24-03
Save File Names:
Sequential File Names
This file naming convention saves the trace files with user-defined prefixes along with the numbers
indicating the sequence of the file. Select Sequential File Names radio button and enter a name in
the file name prefix entry field. Use the slider control to indicate the total number of files to be saved. You can drag the slider handle to any position using the mouse or simply click to the left or right of the slider handle to move it. You can control the slider by number of digits.
Example: Enter the file name prefix as ‘ff’ and set the slider control to third position of the ruler in the
number of digits slider box. Now the files will be saved from ff000 up to ff999 in the user-defined directory.
Date/Time Formatted Names:
This file naming convention saves the trace file with date-time prefixes. Select Date/Time Formatted Names radio button to obtain the file name saved with the year, month, date, and hour.
Example:
Enter the file name prefix as %Y%M%D_%H%I in the Date/Time Formatted Names text box. Verify that the trace files are saved in ‘20050531_0953.HDL’ format in the user-defined directory. The
formatting specification refers to the year, month, day, hour and minute (date and time stamp).
Create a New File After the Specified Limit has been Reached:
Select either File Size Limit, Frame Count Limit, or Time Limit option and specify the limit in the
Limit Value entry field.
Restrict or Recycle After N Files Options:
Select Keep N Latest files, Stop After N Files, or, Unrestricted option to get the desired number of trace files.
Keep N Latest files – Restricts the file saving only for last ‘N’ number of files, where ‘N’ is the value set in the text box. When N is reached the older files will be overwritten by the most recent files keeping the total number of files equal to N.
Stop After N Files - Restricts the file saving only for first ‘N’ number of files, where ‘N’ is the value set
in the text box. After the limit has been reached, the periodic saving stops.
Unrestricted - This option does not restrict the number of files being saved. This option limits the periodic saving to the available disk space only.
For Example:
Enter the value as 10(N=10) in the entry field and select Keep N Latest files radio button. Only ten files will be kept. They will contain the latest captured data.
Enter the value as 10(N=10) in the entry field and select Stop After N Files radio button. Initial 10 files are obtained and the process is stopped.
Note: Select Enable Periodic Saving and Start real-time tracing options (provided under Configure > Startup Options) before setting the Periodic File Saving Specifications.

Capture Menu Features
GL Communications Inc. 37 November 2013
Document Number: XX120-7.10.24-03
5.2 Setting Capturing Options
Figure 42: Capturing Options
From the main menu select Capture > Capture File Options specify a temporary file name for capturing, the maximum size of this file in bytes and the capturing limit in frames or time period.
Capturing options supports handling frames on 64 bit processor.
The capture settings are saved in the Windows registry when the user exits the application. They need not be entered each time application is started.
Specific settings can also be saved using Save menu option and subsequently loaded when needed.
The file name can be either typed in the entry field or selected using the file dialog by clicking "…" button. The limit in bytes should be specified as a positive number, for example, 50000000 indicate that the maximum trace file size is 50Mb. If the limit is specified using the time format, for example, 12:22:20, then capturing stops after 12 hours, 22 minutes and 20 seconds.
Capturing stops when either the maximum trace file size in bytes is reached or the capturing limit is exceeded when circular capture buffer is not used.
5.2.1 In Memory for High Traffic Capture Rate
In case of high traffic rate (>50 Mbps), select the In Memory check box to get better performance. This will store all the frames in primary memory instead of writing to trace file on the disk till the trace
file is closed. Frames will be written to trace file only when analyzer is closed. This option is used when disk in not fast enough to keep with capturing speed but if in-memory file is large, say 500 MB it will take a while to close the trace file.
5.2.2 Circular Capture Buffer
For infinite capturing, select the "Circular Capture Buffer" check box. When end of the capturing buffer is reached, the capturing does not stop. Instead, the oldest trace records are purged from the
buffer and the new ones are placed at the end of the circular buffer.
Note:
The maximum file size in bytes can be set from 64k (2^16) to 2G (2^31-1) Only. When capturing is completed the unused reserved bytes are released. Closed trace file will shrink to the minimum size
sufficient to hold the captured information.
Various options are available for saving trace file, refer to Periodic Trace Saving Options for details.

Capture Menu Features
GL Communications Inc. 38 November 2013
Document Number: XX120-7.10.24-03
5.3 Stream /Interface (Port) Selection
The Stream /Interface Selection dialog allows a user to specify ports for monitoring, and
user/network side capture. To open the Stream /Interface Selection, follow the steps below:
Select the Capture > Stream/Interface Selection as shown in the figure or
Click Stream/Interface from the toolbar
Figure 43: Stream/Interface Selection

Capture Menu Features
GL Communications Inc. 39 November 2013
Document Number: XX120-7.10.24-03
5.3.1 Port and Timeslots Selection
The time-slot selection dialog allows user to specify devices and corresponding time slots on which the data is being captured.
For T1, all (0-23) or required timeslots may be selected.
While for E1 systems, excluding timeslots 0 and 16 (for CAS signaling only), all or the required timeslots may be selected.
Selection of timeslots may be contiguous or non-contiguous (N*64 kbps Hyper-Channel, Single channel and Sub channels).
Optionally, frames may also be captured based on their FCS (16 bits, 32 bits, none).
Note: For N*56 kbps Hyper-Channel selection, the selection of timeslots should be contiguous.
5.3.2 User/ Network Side Specification
This option is used in protocol analysis for selection of uplink or downlink monitoring.
Along with the port selections, users can specify if the card is monitoring the traffic from user-side or from network-side. If user is monitoring traffic originated from user-side (uplink), then cards should be
unchecked and for capturing traffic originated from network-side (downlink), the cards should be checked as shown in the figure below.. The user/network side specification may also be set using the View>User/Network Side Specification dialog as explained in User/Network Side Specification.
Figure 44: User/ Network Side Specification
Note: The first check box is meant for card1, the second for card2, and so on.
5.3.3 Bit Inversion
Bit inversion changes each bit in received octets from 0 to 1 and 1 to 0. (See the figure below)
Check the box as shown in the figure below to enable bit inversion.
Figure 45: Specifying Bit Inversion Option
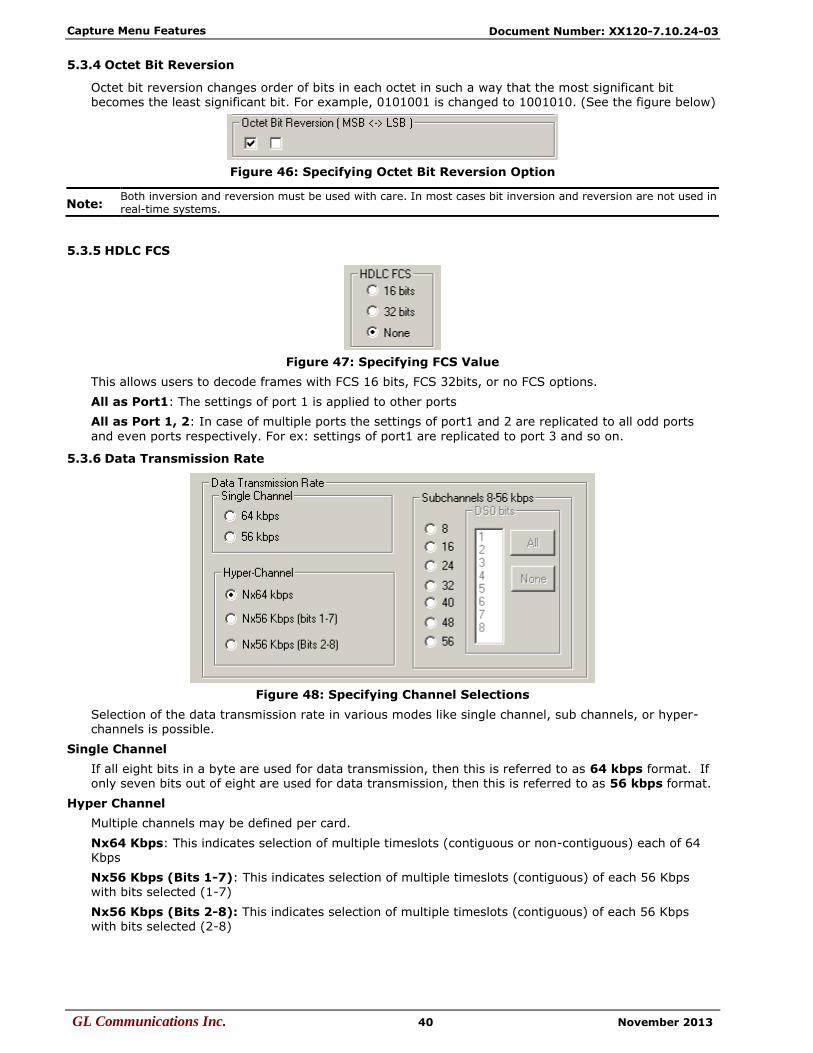
Capture Menu Features
GL Communications Inc. 40 November 2013
Document Number: XX120-7.10.24-03
5.3.4 Octet Bit Reversion
Octet bit reversion changes order of bits in each octet in such a way that the most significant bit becomes the least significant bit. For example, 0101001 is changed to 1001010. (See the figure below)
Figure 46: Specifying Octet Bit Reversion Option
Note: Both inversion and reversion must be used with care. In most cases bit inversion and reversion are not used in real-time systems.
5.3.5 HDLC FCS
Figure 47: Specifying FCS Value
This allows users to decode frames with FCS 16 bits, FCS 32bits, or no FCS options.
All as Port1: The settings of port 1 is applied to other ports
All as Port 1, 2: In case of multiple ports the settings of port1 and 2 are replicated to all odd ports
and even ports respectively. For ex: settings of port1 are replicated to port 3 and so on.
5.3.6 Data Transmission Rate
Figure 48: Specifying Channel Selections
Selection of the data transmission rate in various modes like single channel, sub channels, or hyper-channels is possible.
Single Channel
If all eight bits in a byte are used for data transmission, then this is referred to as 64 kbps format. If
only seven bits out of eight are used for data transmission, then this is referred to as 56 kbps format.
Hyper Channel
Multiple channels may be defined per card.
Nx64 Kbps: This indicates selection of multiple timeslots (contiguous or non-contiguous) each of 64 Kbps
Nx56 Kbps (Bits 1-7): This indicates selection of multiple timeslots (contiguous) of each 56 Kbps with bits selected (1-7)
Nx56 Kbps (Bits 2-8): This indicates selection of multiple timeslots (contiguous) of each 56 Kbps with bits selected (2-8)

Capture Menu Features
GL Communications Inc. 41 November 2013
Document Number: XX120-7.10.24-03
Sub channel
In addition, the data may be transmitted on any of the user-defined bits (contiguous only), in which
case, the user must select one of the options and its corresponding DS0 bits under Subchannels 8-56 kbps pane. The actual sub channels comprising a lower bandwidth pipe are selected using the
subchannel selection list box.
Depending on data transmission rate, the number of subchannels can be selected according to the
table below. Each pipe 8 - 56 kbps can be comprised only from the contiguous subchannels. For example for 32 kbps pipe the following sub channel selections are valid 1-4,2-5, 3-6, 4-7. On the other hand, selecting subchannels 1, 2, 4 and 5 for 32 kbps is invalid: the total bandwidth is 32 kbps for these four selected subchannels, however they are not contiguous.
Subchannel
Rate
Subchannels per Time Slot
Example Example Explanation
8 1,2,3,4,5,6,7,8
Three Independent
pipes are specified: 1-2, 4 and 6. Each is 8 kbps
16 1,2,3,4
Two pipes
16 kbps each are specified. These two pipes are 1-2 & 3-4
24 1,2
Two pipes 24 kbps
each are specified. First pipe 1-3 subchannels, second 6-8 subchannels
32 1,2
Two 32kbps pipes take entire DS0. First one 1-4 subchannels, second 5-8 subchannels

Capture Menu Features
GL Communications Inc. 42 November 2013
Document Number: XX120-7.10.24-03
40 1
One pipe 40 kbps
takes subchannels 1-5.
48 1 Similar to 40 kbps but 6
consecutive subchannels must be selected
56 1 Similar to 40 kbps but 7 consecutive subchannels must be selected
5.4 Setting Capture Filter using Real-time Analyzer
Select Capture > Capture Filter option to directly exclude LSSU (Link Status Signal Unit), FISU (Fill-in Signal Unit) frames or any other user-defined frames. LSSU frames (of length 5) communicate
information about the signaling link between the nodes on either end of the link. FISU frames (of length 7) support the monitoring of link traffic because they undergo error checking
For example, enter the number of the frames, say 5 and 7, and click OK as shown in the figure below. Frames of length 5 and 7 will be excluded during real-time capture.
Figure 49: Capture Filter
Note:
Capture Filter is not applicable for CAS Analyzer

Capture Menu Features
GL Communications Inc. 43 November 2013
Document Number: XX120-7.10.24-03
5.5 Capture Physical Layer Alarms
Select Capture Capture Physical Layer Alarms option to capture the status of the physical layer
alarms.
Figure 50: Capture Filter – Select Protocol Value
5.6 GUI and Protocol Options
Switches to GUI and protocol list: selecting columns, protocol standard, filtering criteria, search criteria, etc. For more information refer to Protocol Analyzer Configuration.

Capture Menu Features
GL Communications Inc. 44 November 2013
Document Number: XX120-7.10.24-03
(Intentional Blank Page)
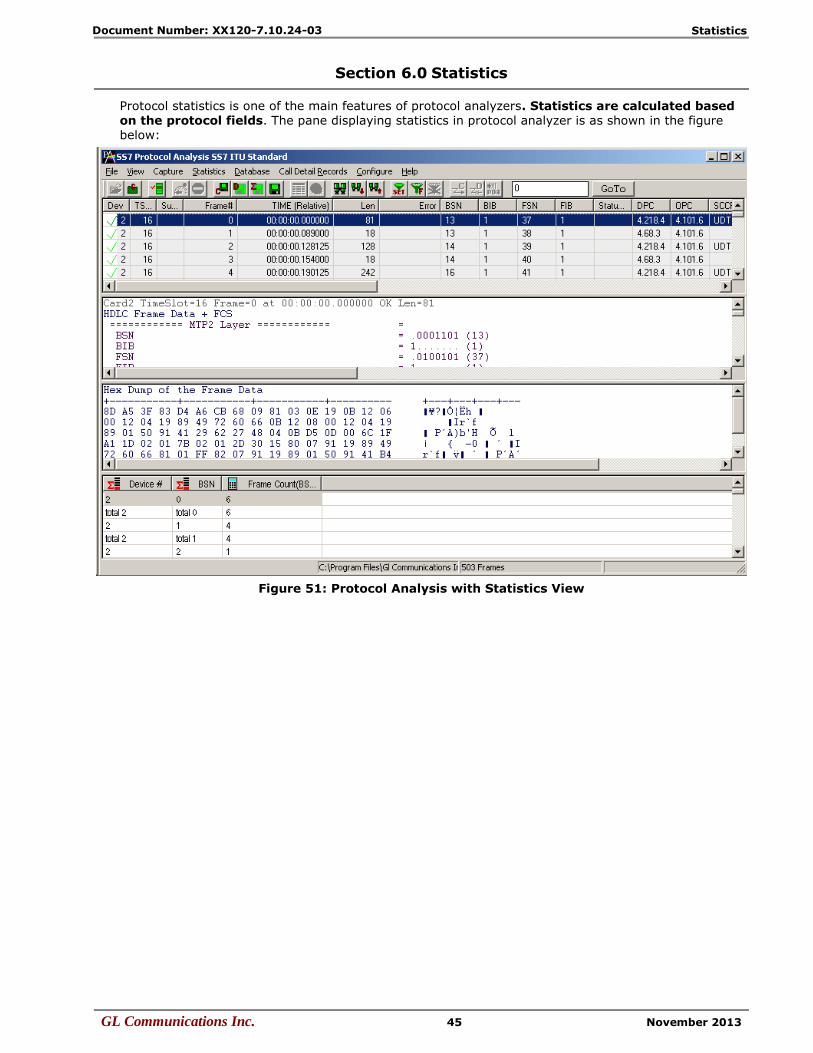
Statistics
GL Communications Inc. 45 November 2013
Document Number: XX120-7.10.24-03
Section 6.0 Statistics
Protocol statistics is one of the main features of protocol analyzers. Statistics are calculated based
on the protocol fields. The pane displaying statistics in protocol analyzer is as shown in the figure below:
Figure 51: Protocol Analysis with Statistics View
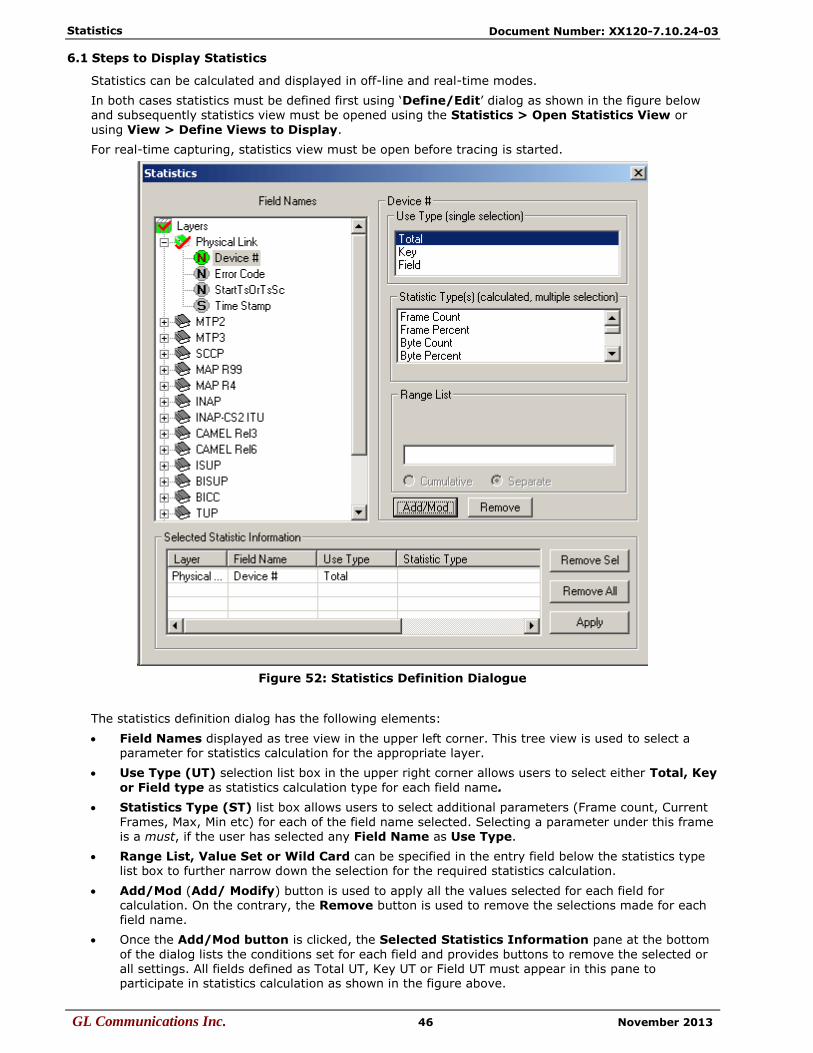
Statistics
GL Communications Inc. 46 November 2013
Document Number: XX120-7.10.24-03
6.1 Steps to Display Statistics
Statistics can be calculated and displayed in off-line and real-time modes.
In both cases statistics must be defined first using ‘Define/Edit’ dialog as shown in the figure below
and subsequently statistics view must be opened using the Statistics > Open Statistics View or
using View > Define Views to Display.
For real-time capturing, statistics view must be open before tracing is started.
Figure 52: Statistics Definition Dialogue
The statistics definition dialog has the following elements:
Field Names displayed as tree view in the upper left corner. This tree view is used to select a parameter for statistics calculation for the appropriate layer.
Use Type (UT) selection list box in the upper right corner allows users to select either Total, Key
or Field type as statistics calculation type for each field name.
Statistics Type (ST) list box allows users to select additional parameters (Frame count, Current
Frames, Max, Min etc) for each of the field name selected. Selecting a parameter under this frame is a must, if the user has selected any Field Name as Use Type.
Range List, Value Set or Wild Card can be specified in the entry field below the statistics type list box to further narrow down the selection for the required statistics calculation.
Add/Mod (Add/ Modify) button is used to apply all the values selected for each field for calculation. On the contrary, the Remove button is used to remove the selections made for each field name.
Once the Add/Mod button is clicked, the Selected Statistics Information pane at the bottom
of the dialog lists the conditions set for each field and provides buttons to remove the selected or all settings. All fields defined as Total UT, Key UT or Field UT must appear in this pane to participate in statistics calculation as shown in the figure above.

Statistics
GL Communications Inc. 47 November 2013
Document Number: XX120-7.10.24-03
6.1.1 Selecting Field Names (Step 1)
In the protocol tree view, navigate to the protocol layer to which the field item belongs and click to select this item. The supported layers for the protocol analyzer and the field parameters for respective
layer will be displayed as shown in the figure below:
Figure 53: Selecting Field Names

Statistics
GL Communications Inc. 48 November 2013
Document Number: XX120-7.10.24-03
Classifying Fields under Field Names
All field names in the protocol displayed in the tree view belong to one of three types:
Numeric
String
Enumerated (set)
Field names can be distinguished based on the icons representing them as shown in the figure below.
Figure 54: Field Types

Statistics
GL Communications Inc. 49 November 2013
Document Number: XX120-7.10.24-03
6.1.2 Defining Use Type (UT) and Statistics Type (Step 2)
Use Type (UT)
The UT can be total, key or field types. Selecting proper type defines the table displayed in the
Statistics View. At least one total or key UT must be defined. Total and Key UT directs creation of
statistics view columns for the selected fields and also rows with unique aggregate value of Total and Key columns.
Total UT has dual role. Firstly it’s used as a Key UT, defining rows with unique set of column values in the Statistics View. Secondly, it directs the statistics engine to display an additional row for totals
(sum). The latter is similar to the sum function in the spreadsheets.
Unique set of column values means that different rows have a unique combination of values in the Key/Total columns.
Field UT defines only separate columns where the calculated Statistic Type is placed for the combination of key values.
The UT can be set as Total, Key or Field. A minimum of one UT must be defined for each field selected under Field Names.
Statistics Type (ST)
The following statistic types are available:
Frame Count
Frame Percent
Byte Count
Byte Percent
Current Frames/Sec
Current Bytes/Sec
MAX Frames/Sec
MAX Bytes/Secs
MIN Frames/Sec
MIN Bytes/Sec
AVG Frames/Sec
AVG Bytes/Sec
MIN
MAX
SUM
AVG
MIN, MAX, SUM and AVG should be specified only for numeric fields. As explained in the section
Classifying Fields under Field Names, all the fields belong to one of the following categories: numeric, string and enumerated (sets). When the same ST is specified for multiple fields, a new column is created in the statistics view for each field name.
Additional columns consume resources and slow down statistics calculation process. Only MIN, MAX, SUM and AVG columns will be different for different fields, other columns like Frame Count, Frame Percent, Byte Count and more will display the same information and will not be useful.

Statistics
GL Communications Inc. 50 November 2013
Document Number: XX120-7.10.24-03
6.1.3 Update Selected Statistics Information List (Step 3)
Figure 55: Selected Statistics Information List
After selecting the required Use Type and statistics Type, click Add/Mod button to add the selected statistics in the information list.
Click Apply shown on the figure above to activate the newly defined statistics information. If the Statistics Definition dialogue is closed without clicking on the Apply button will discard all the newly defined statistics.
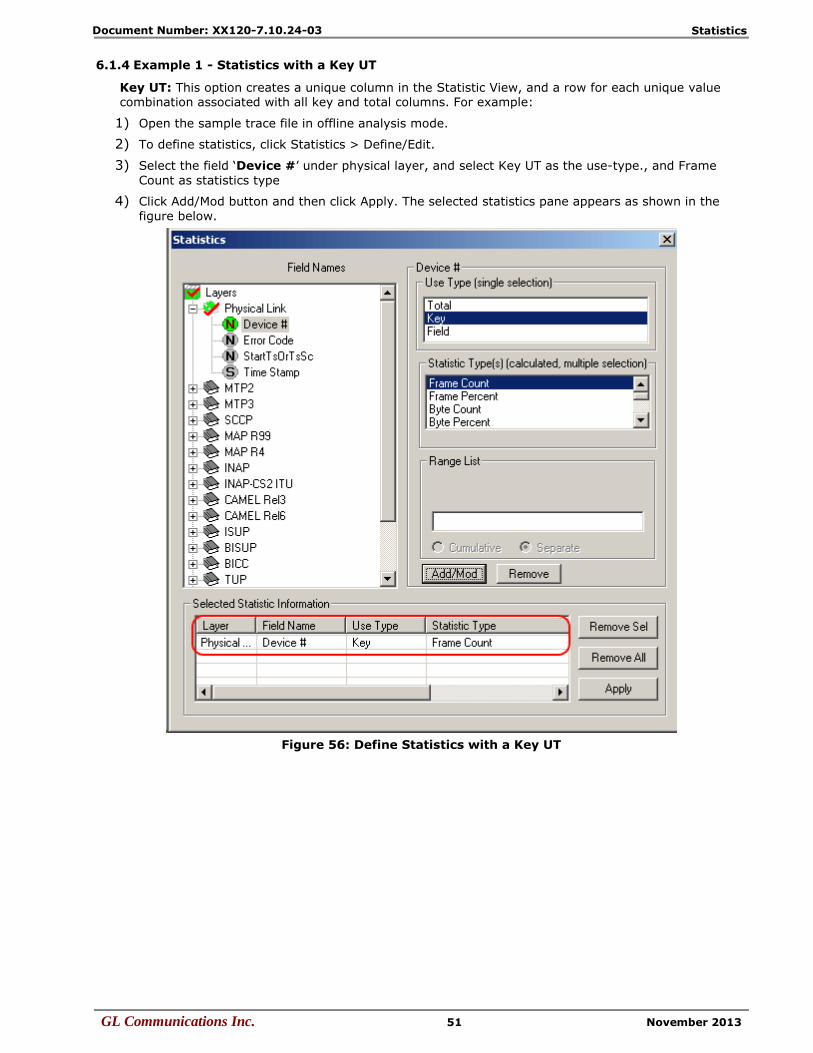
Statistics
GL Communications Inc. 51 November 2013
Document Number: XX120-7.10.24-03
6.1.4 Example 1 - Statistics with a Key UT
Key UT: This option creates a unique column in the Statistic View, and a row for each unique value combination associated with all key and total columns. For example:
1) Open the sample trace file in offline analysis mode.
2) To define statistics, click Statistics > Define/Edit.
3) Select the field ‘Device #’ under physical layer, and select Key UT as the use-type., and Frame
Count as statistics type
4) Click Add/Mod button and then click Apply. The selected statistics pane appears as shown in the
figure below.
Figure 56: Define Statistics with a Key UT

Statistics
GL Communications Inc. 52 November 2013
Document Number: XX120-7.10.24-03
5) Click Statistics > Open Statistics View to open the statistics frame which appears as shown in
the figure below:
Figure 57: Statistics with a Key UT
In the above example, the data is captured using device # 1 and 2, and therefore the key values of 1 and 2 are displayed under the Device# column.
6.1.5 Example 2 - Statistics with a Total and a Key
Total UT: This option not only makes the column a key column but also creates an additional total row for each unique value of the column.
Total UT and Key UT values combined together uniquely define a row in the Statistics View.
Key UT: Key UT defines a unique column value that can be used for calculating a Statistic Type like
frame count, sum, avg, min, max, etc. This calculated statistics will be displayed only if all the key UT values are unique and are numeric else the statistics View displays just the word ‘Total’ in the row dedicated for the same purpose. For example -
1) Open the sample trace file in offline analysis mode.
2) To define statistics, click Statistics > Define/Edit.
3) Select the field ‘Device #’ under physical layer, and choose Total UT as the use-type and then
select Frame Count as statistics type.
4) Click Add/Mod button and then click Apply.
5) Select the field ‘C/R’ under LAPD layer, and then select Key UT as the use-type.

Statistics
GL Communications Inc. 53 November 2013
Document Number: XX120-7.10.24-03
6) Click Add/Mod button and then click Apply. The selected statistics pane appears as shown in the
figure below.
Figure 58: Select Statistics with a Total and a Key

Statistics
GL Communications Inc. 54 November 2013
Document Number: XX120-7.10.24-03
7) Click Statistics > Open Statistics View to open the Statistics View as shown in the figure
below:
Figure 59: Statistics with a Total and a Key
In the above example, unique rows are defined based on field (C/R values) selected as the Key UT, and columns (frame count for each device) are defined based on the statistics type selected for this Total UT. Since the device is selected as Total UT, additional row displaying the total frame count per device are displayed.
6.1.6 Example 3 - Statistics Total and Field UT
Field UT: This option defines additional columns for the parameters selected under Statistics Type frame. Field UT creates just an additional column for the selected field. However, differently from Key
UT and Total UT, the Field UT does not create additional rows for each unique value associated with the field. For example,
1) Open the sample trace file offline.
2) To define statistics, click Statistics > Define/Edit.
3) Select the field ‘Device #’ under physical layer, and choose Total UT as use-type.
4) Select Timestamp under ‘Physical Layer’, and choose Field UT as use-type. To get the frame count for each unique timestamp, select Frame Count as the Statistics Type.
Note: Notice that setting the Timestamp as a Field UT does not create unique rows for each unique timestamp value as in the previous example where the UT was set as the Key UT.

Statistics
GL Communications Inc. 55 November 2013
Document Number: XX120-7.10.24-03
6.1.7 Ranges, Wildcards And Enumerated Value Sets
Depending on the field type additional criteria may be specified to include only frames with the matching:
Ranges for numeric fields
Wildcards for string fields
Sets of values for enumerated fields
Ranges
Depending on the field type a range list can be specified for numeric fields as space separated numbers or segments of numbers. For example, the range list 1 12-15 4-6 will include fields with the following
integer values: 1, 4, 5, 6, 12, 13, 14, and 15. Frames with all other values will be excluded from statistics see the below figure
Ranges are valid only for numeric fields.
Figure 60 : Range List for Numeric Fields
Wildcards
Valid string field values can be specified using wildcard characters ‘*’ (asterisk) and ‘?’. (question mark)
‘*’ means any zero or more characters
‘?’ means any single character
‘301*’, for example, means any string starting with ‘301’
‘301*5*’ means any string starting with ‘301’ and containing ‘5’
‘*3?4?5*’ means string containing ‘3’ followed by any single character followed by ‘4’ followed by any single character followed by ‘5’.
Wildcards are valid only for string fields.
Figure 61: Wildcards for String fields

Statistics
GL Communications Inc. 56 November 2013
Document Number: XX120-7.10.24-03
Value Sets
Enumerated fields can have a fixed set of values assigned a string name. Some of these string names
can be selected to narrow down the statistics. See the figure below.
Figure 62: Specifying Value Sets
6.1.8 Modifying and/or removing configured statistics
Figure 63: Modify/Remove some or all statistics
In the process of the statistics definition one can go to the Selected Statistics Information list
control and select a line by clicking on it. This will cause automatic repositioning of the tree view and statistics information for the selected field to be displayed in the UT, ST and Range/Wildcard/Value Set dialogue controls. User can then modify the information and click Add/Mod button to make the changes effective as shown in the figure of the Selected Statistics Information list.
Click Remove Sel button to remove selected lines from the criteria.
Click Remove All to disable statistics.
6.2 Opening and Closing Statistics View
Statistics view can be opened and closed any time during offline analysis. Opening a trace view can be a lengthy process for large traces when statistics is enabled.
Statistics view for on-line tracing must be opened before real time analysis is started.
To open Statistics View select Statistics > Open Statistics view menu item as shown in the figure
below.
Figure 64: Opening and Closing Statistics View
To close the Statistics view, select Statistics > Close statistics view menu item.
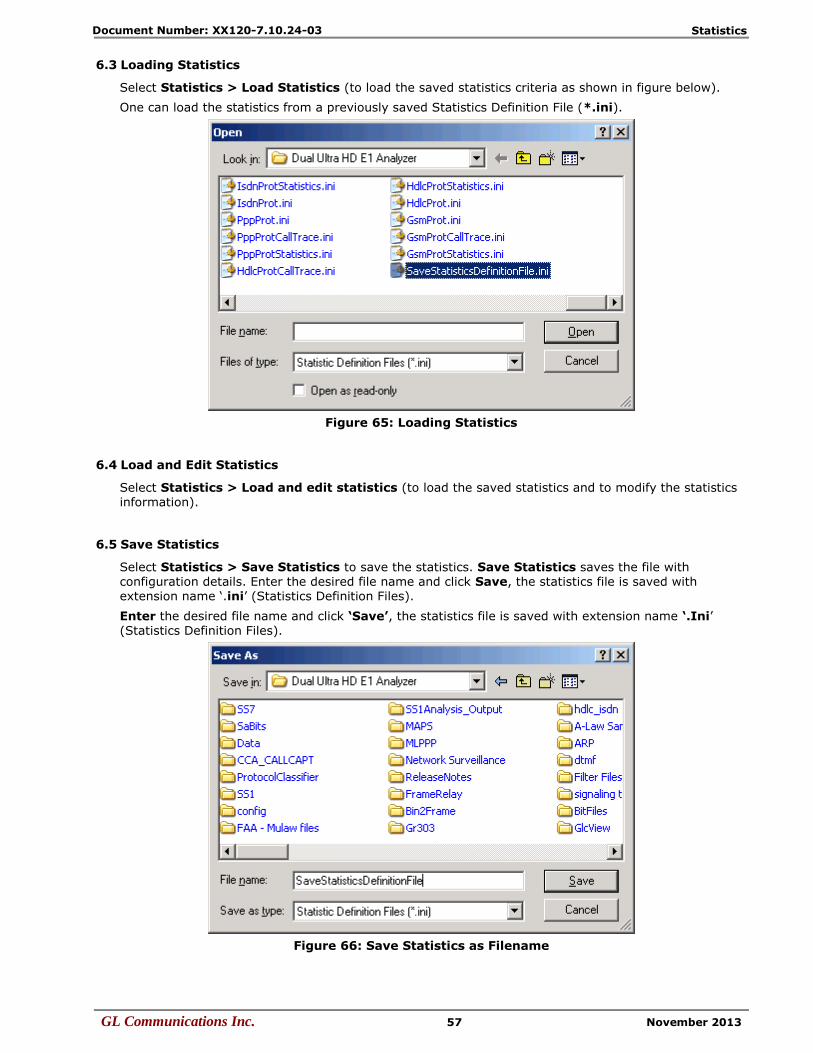
Statistics
GL Communications Inc. 57 November 2013
Document Number: XX120-7.10.24-03
6.3 Loading Statistics
Select Statistics > Load Statistics (to load the saved statistics criteria as shown in figure below).
One can load the statistics from a previously saved Statistics Definition File (*.ini).
Figure 65: Loading Statistics
6.4 Load and Edit Statistics
Select Statistics > Load and edit statistics (to load the saved statistics and to modify the statistics information).
6.5 Save Statistics
Select Statistics > Save Statistics to save the statistics. Save Statistics saves the file with configuration details. Enter the desired file name and click Save, the statistics file is saved with extension name ‘.ini’ (Statistics Definition Files).
Enter the desired file name and click ‘Save’, the statistics file is saved with extension name ‘.Ini’ (Statistics Definition Files).
Figure 66: Save Statistics as Filename
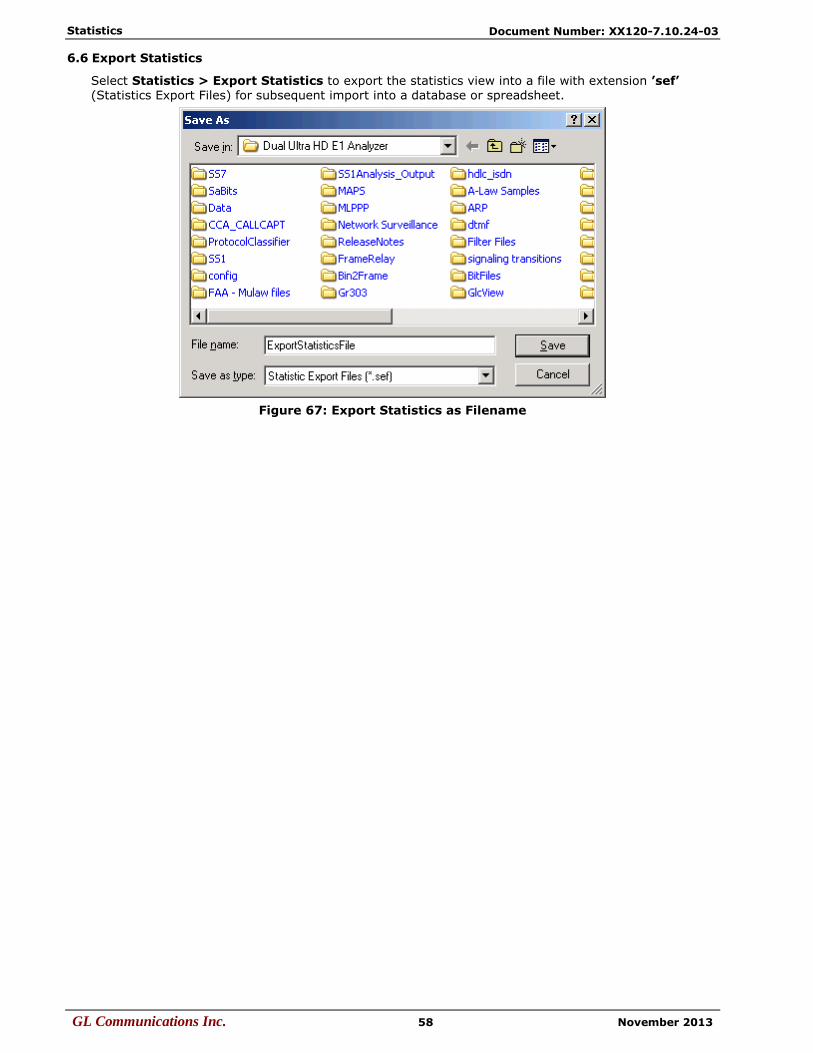
Statistics
GL Communications Inc. 58 November 2013
Document Number: XX120-7.10.24-03
6.6 Export Statistics
Select Statistics > Export Statistics to export the statistics view into a file with extension ’sef’ (Statistics Export Files) for subsequent import into a database or spreadsheet.
Figure 67: Export Statistics as Filename

Call Detail Records
GL Communications Inc. 59 November 2013
Document Number: XX120-7.10.24-03
Section 7.0 Call Detail Records
The objective of call detail record is to isolate call specific information for each individual call from the
captured data and display the information in an organized fashion. The call-detail records are displayed as shown in the figure below.
Figure 68: Call Detail Records View
7.1 Build Call Detail Record
Select Call Detail Record > Build Call Detail Record menu item as shown in the figure below. Build Call Detail Record is checked for the activation of call trace application. This should be done before starting the real-time capture or before opening an hdl file in offline mode.
Figure 69: Build Call Detail Record

Call Detail Records
GL Communications Inc. 60 November 2013
Document Number: XX120-7.10.24-03
7.2 Select Call Detail Columns to Display
Select Call Detail Record > Select Call Detail Columns to Display menu item as shown in the
figure below. This contains a list of possible Columns. Here we can select the interested columns using
ctrl key and click OK.
Note: The Columns can also be selected after opening the Call Data Record view by right-clicking on pane and choosing ‘Select Columns’ option.
Figure 70: Select Call Trace Columns to Display
Call ID details, the calling status whether the call is active or completed, calling number, called
number, call start date and time, call duration, release cause, device number, and so on, are shown in the call trace view.
7.3 Active Calls Only
Select Call Detail Record > Active Calls Only menu item to view all the active calls.

Call Detail Records
GL Communications Inc. 61 November 2013
Document Number: XX120-7.10.24-03
7.4 Open Call Detail Record
Select Call Detail Record > Open Call Detail Record menu item. Call Detail Record View can be
opened and closed in off-line trace viewing any time.
To open Call Detail Record View
Select Call Detail Record > Open Call Detail Records menu item or
Click View > Define Views menu item.
Figure 71: Open Call Detailed Record
Note: Build Call Detail Record menu item should be checked before opening Call Detail Records view. If the Call Trace view is selected from View>Define Views to Display menu item without checking Build Call
Detail Record, a warning message is displayed as shown in the figure below. Call Detail Record View for on-line tracing must be opened before on-line tracing is started.
Figure 72: Warning Message

Call Detail Records
GL Communications Inc. 62 November 2013
Document Number: XX120-7.10.24-03
7.5 Call Detail View
The following call trace details are available in the Call Detail View.
Call ID – a unique call identifier assigned to each call.
Call Status - displays the call status as “C IaArR” or “A IaA” where,
the first letter ‘A’ denotes an Active call
the first letter ‘C’ denotes Completed call
Subsequent letters are denoted as follows -
‘I’ denotes Initial Address Message
‘a’ denotes Address Complete Message
‘A’ denotes Answer Message
‘r’ denotes Release
‘R’ denotes Release Complete Message
For more information refer to the section Appendix A: Glossary.
Figure 73: Call ID Status for SS7
Disp –various call status information specific to Fairpoint.
Calling Number - identifies the calling number.
Called Number – identifies the called number.
Call Start Date and Time - the date (Y/M/D) and the time at which the call was made.
Call Duration - duration of the completed call.
Release Complete Cause - call termination cause.
Device number- port number on which the call was captured.
Timeslot (TS) - channel number on which the call was captured.
OPC –originating point code value.
DPC –destination point code value.
CIC (Circuit Identity Code) - identifies the user channel and it is unique for a call.
Link set - link group carrying signaling information.
Carrier CIC - shows the information sent in the forward direction to the transit network indicating the transit network selected by the originating subscriber.
TNS CIC - transit network for routing of a call.
International - National / International call indicator.
Charge No - number for which the call is charged.

Call Detail Records
GL Communications Inc. 63 November 2013
Document Number: XX120-7.10.24-03
OLII - (Originating Line Information) - toll class of service for the call.
JIP - geographic origination of the call.
GAPPDN - indicates a (Generic Address) pertaining to supplementary services.
Billing Duration Secs - duration for which user is charged. It is AN <->RLZ duration.
Out Going Trunk# - trunk group selected at outgoing gateway.
Original Redirecting Reason —forwarding reason for the original redirection.
Redirection Counter - number of times forwarding of a particular call.
Redirecting Reason - forwarding reason for the last redirection.
CDPN Nature - nature of called party number.
OCDN Address - Original called number.
OCDN Nature - nature of original called party number.
CgPN Nature - nature of calling party number.
FCI Bit_M - more bit indicator.
Note:
The following Call Trace Columns is displayed only for CNAM when the user edits SS7_CALLTRACE_TYPE as 2 in the ini file: Call ID, Call Status, Call Start Date & Time, Call Duration, DevNo, TS, OPC, DPC, Call Type, Originating Transaction ID, Response Transaction ID, Calling Directory Number, Generic Names, Release Cause

Call Detail Records
GL Communications Inc. 64 November 2013
Document Number: XX120-7.10.24-03
7.5.1 Active and Completed Calls
Call ID refers to the identification of each call. There are icons visible to the left of these Call ID numbers
Active Calls:
Active calls ( ) are marked in green and the call status is specified as Active. An arrow is seen above
the letter A, which indicates the direction of the call.
Completed Calls:
Completed calls ( ) are marked in grey and the call status is specified as completed. An arrow is
seen above the symbol (-), which indicates the direction of the call.
7.5.2 Call Duration
Call duration is calculated for completed calls. It is the total time for the call from start till the end of call. The value is represented in hh.mm.ss.nnnnnn format.
Figure 74: Active, Completes Calls, and Call Duration

Call Detail Records
GL Communications Inc. 65 November 2013
Document Number: XX120-7.10.24-03
7.5.3 Find CDR
This feature allows you to search for a particular call from the captured traces. Right-click on the Call Detail View and select Find CDR option to open the screen as shown below:
Figure 75: Find CDR
Select the parameters from the Column Name and enter the criteria in the Value Wildcard text box.
The parameters satisfying the conditions may be included or excluded from the result using the Include or Exclude options. All the selected criteria logically use OR or AND operations. A frame is filtered if at least one criterion matches (OR logic), or each criteria matches (AND logic).
Wildcards
All values in Call Detail View are considered as string. To search for a specific call, valid string field values can be specified using wildcard characters ‘*’ (asterisk) and ‘?’. (question mark)
‘*’ means any zero or more characters
‘?’ means any single character
‘301*’, for example, means any string starting with ‘301’
‘301*5*’ means any string starting with ‘301’ and containing ‘5’
‘*3?4?5*’ means string containing ‘3’ followed by any single character followed by ‘4’ followed by any
single character followed by ‘5’.
Wildcards are valid only for string fields.

Call Detail Records
GL Communications Inc. 66 November 2013
Document Number: XX120-7.10.24-03
For example, to search for calls with call duration more than 40 seconds, enter the value for Call Duration parameter in the wildcard textbox as ‘00:00:4????????’.
Click Add, and then click OK to exit the window.
This presents the call detail view with Next & Prev navigation button to navigate through records and find the calls matching the criteria as shown below.
Figure 76: Specify CDR criteria
7.6 Display Selected Call Summary
Select the desired call in the call trace view pane and select Call Detail Record > Display Selected Call Summary menu item to view the summary details of the specific call.
Also double click on the specific call in the call Detail Record view pane to view the summary of the selected call.
7.7 Display Entire Summary
Select Call Detail Record > Display Entire Summary menu item to view the entire summary of the calls.
7.8 Closing Call Detail Record
Call Detail Record can be closed form the Call Detail Record > Close Call Detailed Record menu item as shown in the figure below or by choosing Close Call Trace View option by right-clicking on call detail view.
Figure 77: Close Call Detailed Record

Call Detail Records
GL Communications Inc. 67 November 2013
Document Number: XX120-7.10.24-03
7.9 Export Trace File
Select Call Detail Records > Export menu item or right-click on the call detail view and choose Export Call Trace Records option to open the window as shown in the figure below to export the call
details into a file. It exports the trace file details with extension name “cte” for subsequent import into a database or spreadsheet.
Figure 78: Export Trace File

Call Detail Records
GL Communications Inc. 68 November 2013
Document Number: XX120-7.10.24-03
(Intentional Blank Page)

Protocol Analyzer Configuration
GL Communications Inc. 69 November 2013
Document Number: XX120-7.10.24-03
Section 8.0 Protocol Analyzer Configuration
8.1 Analyzer GUI Options and Protocol Configurations
This window provides a consolidated interface for all the important GUI and Protocol settings required in the analyzer. This includes various options such as protocol selection, startup options, stream/interface selection, filter/search criteria and so on.
Select Configure > Protocol and GUI from the main menu, to open the screen as shown in the figure below.
Figure 79: Protocol and GUI option
Additionally, the user can save the configuration settings done in any of these options to a file or just revert back to the default values by using the following menu options:

Protocol Analyzer Configuration
GL Communications Inc. 70 November 2013
Document Number: XX120-7.10.24-03
Menu Options
Save: Select Save from the menu to save the configuration settings done in any of the options to a file
with an extension *.ACF as shown in the figure below.
Figure 80: Save Configuration Options to File
Load: Select Load to load the previously saved *. ACF file from the location where this file was saved as shown in the figure below.
Figure 81: Load Configuration Options
Default: Click Default from the main menu to revert back to the default settings.
8.1.1 Selecting summary columns to display
For detail information on this refer to section Summary Column Selection.
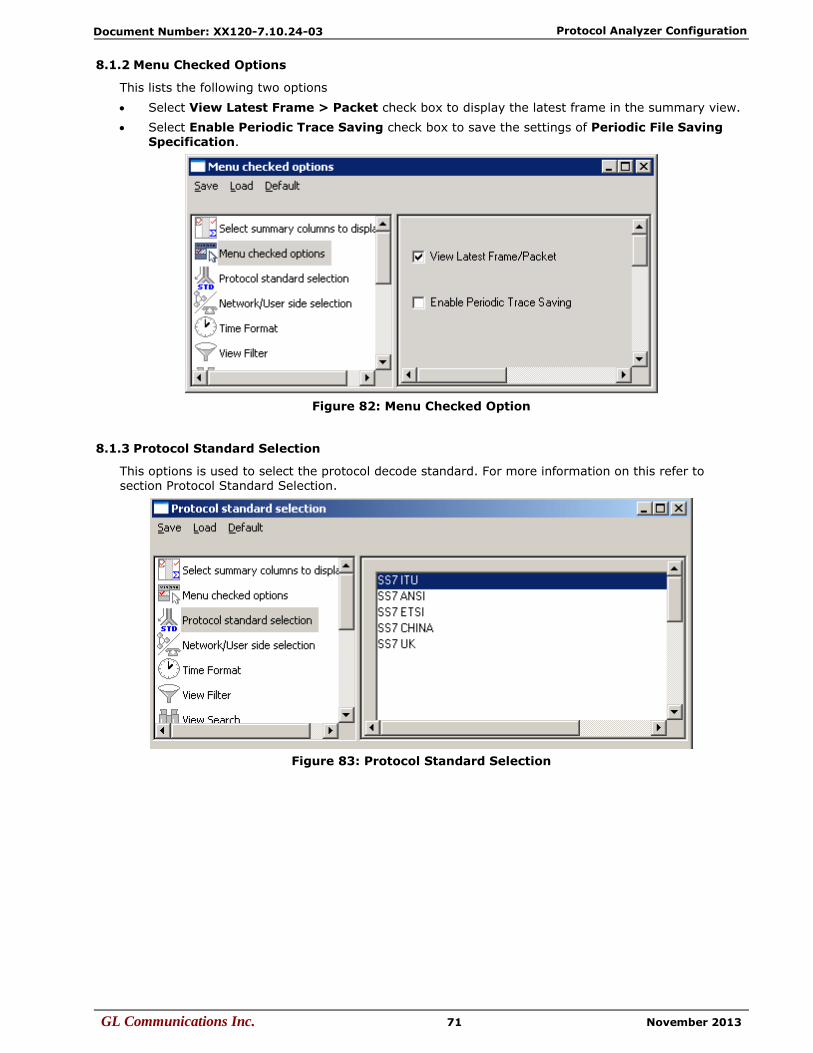
Protocol Analyzer Configuration
GL Communications Inc. 71 November 2013
Document Number: XX120-7.10.24-03
8.1.2 Menu Checked Options
This lists the following two options
Select View Latest Frame > Packet check box to display the latest frame in the summary view.
Select Enable Periodic Trace Saving check box to save the settings of Periodic File Saving Specification.
Figure 82: Menu Checked Option
8.1.3 Protocol Standard Selection
This options is used to select the protocol decode standard. For more information on this refer to section Protocol Standard Selection.
Figure 83: Protocol Standard Selection

Protocol Analyzer Configuration
GL Communications Inc. 72 November 2013
Document Number: XX120-7.10.24-03
8.1.4 Network/User side Selection
Select User /Network Side selection to open the window as shown in the figure below. For more information on this refer to section User/Network Side Specification.
Figure 84: Network/User side Selection
8.1.5 Time Format
Four time display formats are supported for both Real-time and Offline analysis. These time formats can be changed during both off-line and real-time analysis by selecting the required time format as shown in the figure below. For more information on Time Format refer to section Time Displays.
Figure 85: Time Format
8.1.6 View Filter
This option is used to filter frames displayed in the Summary View. For more information on View Filter refer to section Filtering Criteria.
8.1.7 View Search
This option is used to search the Summary View by decoded Summary column values. For more
information on View Search refer to section Setting Search Criteria.

Protocol Analyzer Configuration
GL Communications Inc. 73 November 2013
Document Number: XX120-7.10.24-03
8.1.8 TCP Connection Options
Protocol Analysis probes can run on multiple computers. They are designed to send protocol summary information and binary frame data via TCP-IP connection to a Database Loader to load data into a
database. To set the TCP-IP parameters, select TCP Connection Options from the Database menu
or click on button from Configure > Protocol and GUI Options to open the window as shown in the figure below.
Figure 86: TCP Connection Options
In order to test the TCP/IP connection, the probe IP address and the IP Port name must be entered
Prerequisites for remote protocol analysis probes are following:
Database installation and configuration
Creating and configuring protocol table
Database Loader installation and configuration
Probes can be configured to filter only subset of frames according to some criteria. For example, to
load the database with complete information, all the three data types for exporting (loading into database), i.e., frame octets, summary fields and status information must be checked or the send
call details records option must be checked. For detail information on this, refer to GL’s Net Surveyor™.
8.1.9 Periodic trace saving options
For detail information on periodic trace saving options refer to section Periodic Trace Saving Options.

Protocol Analyzer Configuration
GL Communications Inc. 74 November 2013
Document Number: XX120-7.10.24-03
8.1.10 Startup Options
Startup option is used to enable the startup tasks such as Enable periodic trace saving, Activate Filter, Build Call detail records, Connect to a remote database via TCP/IP and Start real-time tracing.
Click on from Configure > Protocol and GUI Options to open the screen as shown
below.
Figure 87: Startup Options
Load Options from File and Execute Tasks on Analyzer Startup
Check this option and click on browse button to browse the configuration file (*.acf) from the installation directory. This will load the options saved in the *.acf file on analyzer startup.
Include Physical Layer Alarms
Check this option to include alarm frequencies.
Capture Error Details
Check this option to capture details of frame errors.
Enable periodic trace saving
Enables periodic trace saving immediately when analyzer is opened. For more information on this refer to section Periodic Trace Saving Options.
Activate Filter
Activates filter when analyzer is opened. For more information on this, refer to the section Activate
Filter.
Build Call Detail Records
Activates Call Detail View when analyzer is opened. For more information, refer to Build Call Detail Record.
Note: This feature is not applicable to HDLC, MLPPP, and SaHDLC analyzers.

Protocol Analyzer Configuration
GL Communications Inc. 75 November 2013
Document Number: XX120-7.10.24-03
Connect to a remote database via TCP/IP
Note: This feature is applicable to real-time analyzer only.
Connects to remote database loader when analyzer is opened. For more information on this refer to
Net Surveyor™
Start real-time tracing
Select the Start real-time tracing check box and click Execute to start the real-time capturing. A warning message for overwriting the temporary trace file gets displayed. If you want to overwrite click Yes, else, click No and save it in a new file in the desired location. This new file replaces the default specified in the capturing options dialog. For more details refer to section Start Real-time.
Open PDA
Check this option to invoke Packet Data Analysis application automatically at startup. For more
information refer to the section PDA Startup Options.
8.1.10.1 Executing Tasks on Analyzer Startup
Click on Configure Protocol and GUI Options
Click on Select summary columns to display option and select the summary columns to be
displayed on analyzer startup. Refer to the figure below:
Figure 88: Selection of Summary Columns

Protocol Analyzer Configuration
GL Communications Inc. 76 November 2013
Document Number: XX120-7.10.24-03
Click on Startup Options and select the required options to be executed on analyzer startup. Refer to the figure below:
Figure 89: Selection of Startup Options

Protocol Analyzer Configuration
GL Communications Inc. 77 November 2013
Document Number: XX120-7.10.24-03
Click on Save to save in auto configuration file format. Refer to the figure below:
Figure 90: Saving Configuration File

Protocol Analyzer Configuration
GL Communications Inc. 78 November 2013
Document Number: XX120-7.10.24-03
In the Startup Options check ‘Load Options from File and Execute Tasks on Analyzer Startup’ option and click on browse button to browse and select the saved *.acf file. Refer to the figure below:
Figure 91: Loading Configuration File
Close and restart protocol analyzer to automatically start with the startup tasks.

Protocol Analyzer Configuration
GL Communications Inc. 79 November 2013
Document Number: XX120-7.10.24-03
8.1.11 Data Link Groups (DLG)
The data link groups help in defining the direction of the calls in a given network. It forms logical groups comprised of unidirectional (either ‘Forward’ or ‘Backward’) data links. This option is essential to
configuring call detail records (CDR) where redundant signaling links can be used on different T1/E1 ports and time slots.
The direction is an essential part of the DLG specification because for many protocols like SS7, GSM etc. the CDR fields that are used to separate calls must be swapped depending on the direction.
All unidirectional data links are grouped under a single name. The name given to DLG is just a case sensitive string used to combine multiple data links in a single DLG.
To invoke a data link group option select Configure > Protocol and GUI from the main menu, and
click to open the screen as shown in the figure below.
Figure 92: Data Link Groups
Data Link Group Specification:
One or more unidirectional links defined by card, timeslots and sub-channel selection.
Select cards, timeslots and sub-channels either directly by mouse or keyboard using extended window list box selection that includes the “shift” and “ctrl” keyboard keys for multiple extended selection or use “Odd Cards”, “Even Cards”, “All Cards”, “None” push buttons to select or deselect cards.
Note: Data Link Groups features are not applicable for HDLC, SaHDLC, GPRS Ga/Gn, ATM, UMTS, PPP, and TRAU Protocols

Protocol Analyzer Configuration
GL Communications Inc. 80 November 2013
Document Number: XX120-7.10.24-03
Specify the same “Data Link Group Name” sting to combine multiple links in a DLG and also check “Forward Link Direction” for forward direction and uncheck for backward direction. The same DLG always has the same data link group name string.
After the specification has been made, click Add to add the selection to the list of DLGs that are
displayed in the lower part of the pane.
Data Link Group Display pane
Displays the current DLG selection
Some or all of the unidirectional links can be deleted from the current selection.
“Delete Sel” button deletes the selected links from the current selection.
“Delete All” button deletes all links from the current selection.
“Default” button sets the default selection.
When the dialog is closed the current DLG selection is automatically activated.
The configuration in the above figure has two DLGs: “west” and “east”. The “west” logical link (DLG) consists of four unidirectional links on cards (ports) 1, 3 in the forward direction and 2, 6 in the backward direction. The “east” logical link consists of two unidirectional data links: a forward link on card 5 and 8 and a backward link on card 6 and 7. The data link grouping is essentially a definition how
to combine unidirectional data links in bidirectional logical links (DLGs) distinguished by their DLG
Name.
8.1.12 View Font Size
This option allows the user to choose the relevant font size to view the Summary, Detail, Hex, Statistics, and Call Detail Records views. Select the option buttons with various font sizes such as Extra Large, Large, Normal, Small and Very small.
Figure 93: View Font Size
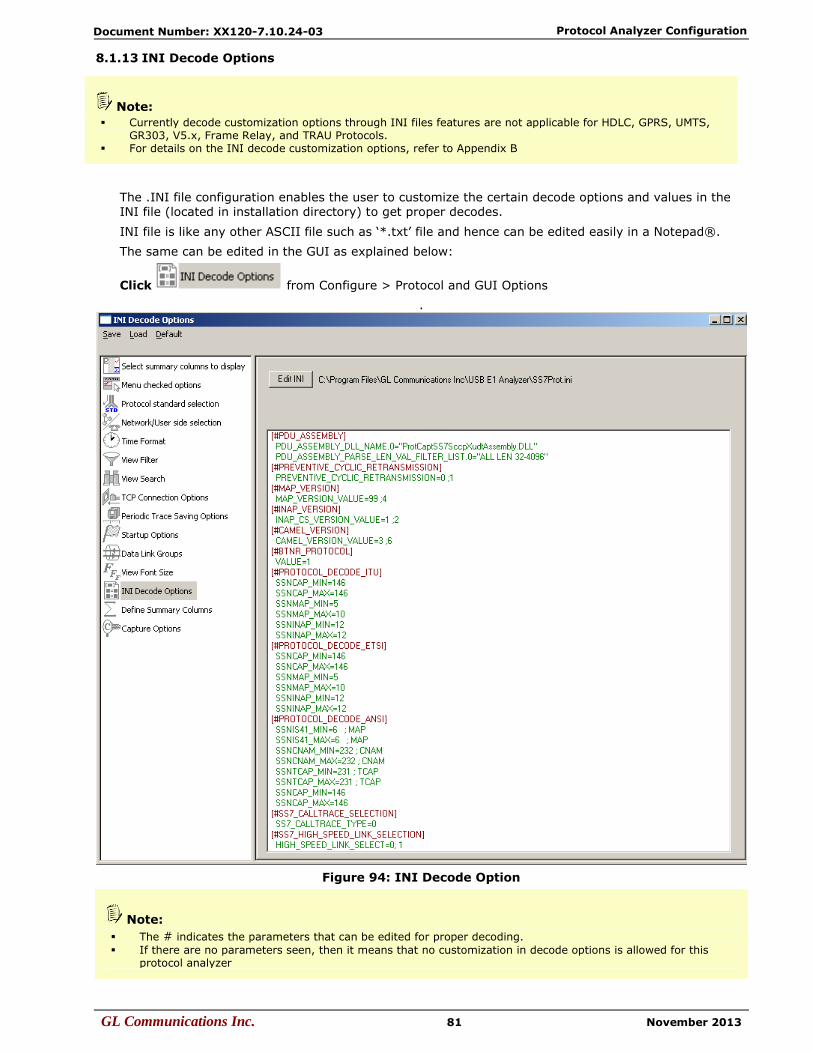
Protocol Analyzer Configuration
GL Communications Inc. 81 November 2013
Document Number: XX120-7.10.24-03
8.1.13 INI Decode Options
The .INI file configuration enables the user to customize the certain decode options and values in the INI file (located in installation directory) to get proper decodes.
INI file is like any other ASCII file such as ‘*.txt’ file and hence can be edited easily in a Notepad®.
The same can be edited in the GUI as explained below:
Click from Configure > Protocol and GUI Options
.
Figure 94: INI Decode Option
Note: The # indicates the parameters that can be edited for proper decoding.
If there are no parameters seen, then it means that no customization in decode options is allowed for this protocol analyzer
Note: Currently decode customization options through INI files features are not applicable for HDLC, GPRS, UMTS,
GR303, V5.x, Frame Relay, and TRAU Protocols. For details on the INI decode customization options, refer to Appendix B
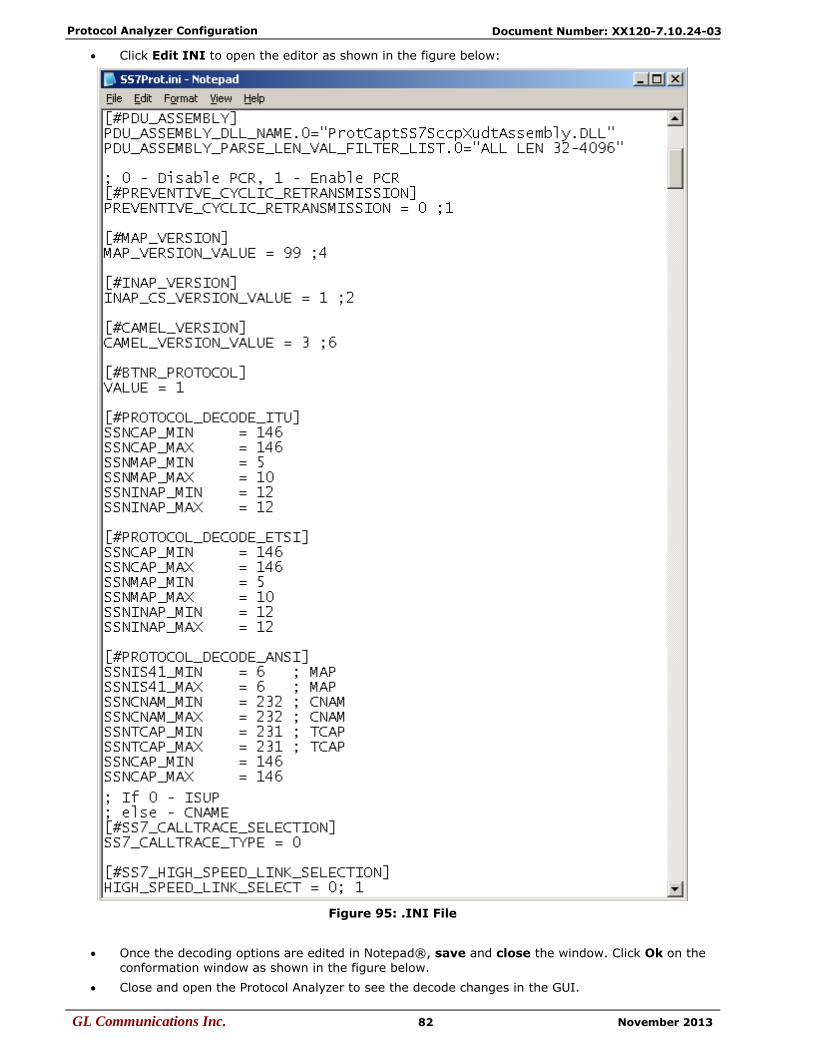
Protocol Analyzer Configuration
GL Communications Inc. 82 November 2013
Document Number: XX120-7.10.24-03
Click Edit INI to open the editor as shown in the figure below:
Figure 95: .INI File
Once the decoding options are edited in Notepad®, save and close the window. Click Ok on the
conformation window as shown in the figure below.
Close and open the Protocol Analyzer to see the decode changes in the GUI.

Protocol Analyzer Configuration
GL Communications Inc. 83 November 2013
Document Number: XX120-7.10.24-03
Figure 96: Warning Message
Note: The changes will take effect when the protocol analyzer application is restarted.
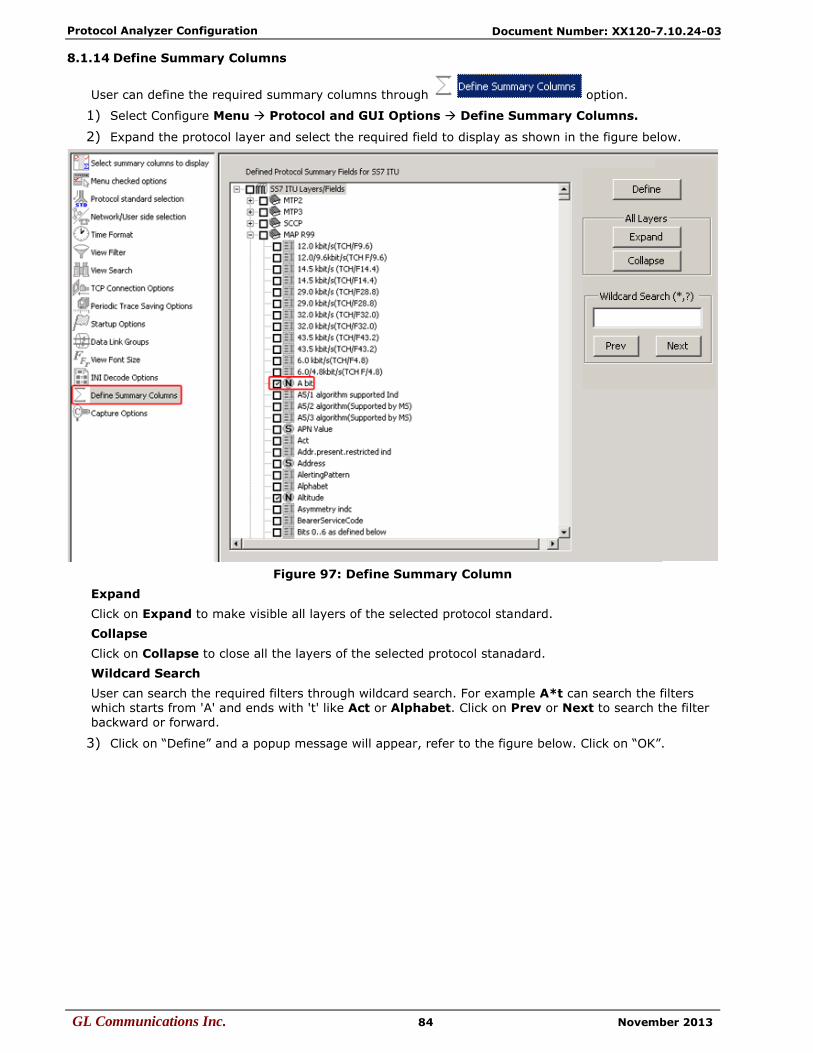
Protocol Analyzer Configuration
GL Communications Inc. 84 November 2013
Document Number: XX120-7.10.24-03
8.1.14 Define Summary Columns
User can define the required summary columns through option.
1) Select Configure Menu Protocol and GUI Options Define Summary Columns.
2) Expand the protocol layer and select the required field to display as shown in the figure below.
Figure 97: Define Summary Column
Expand
Click on Expand to make visible all layers of the selected protocol standard.
Collapse
Click on Collapse to close all the layers of the selected protocol stanadard.
Wildcard Search
User can search the required filters through wildcard search. For example A*t can search the filters which starts from 'A' and ends with 't' like Act or Alphabet. Click on Prev or Next to search the filter backward or forward.
3) Click on “Define” and a popup message will appear, refer to the figure below. Click on “OK”.
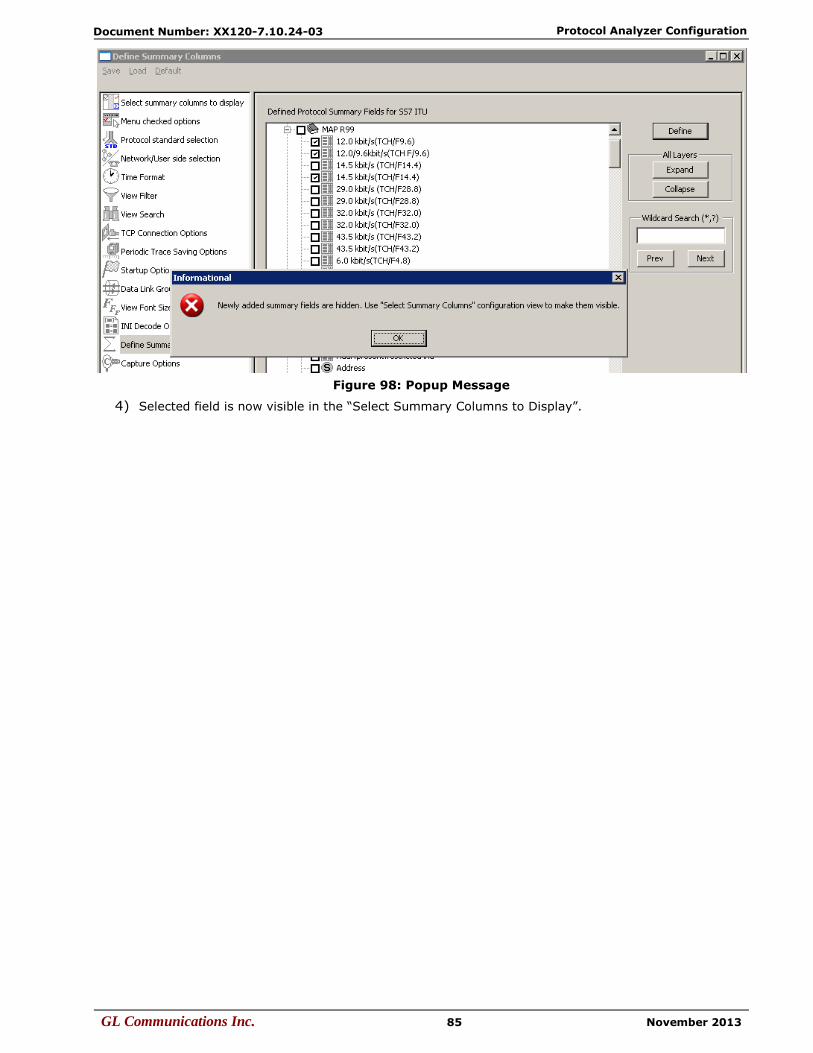
Protocol Analyzer Configuration
GL Communications Inc. 85 November 2013
Document Number: XX120-7.10.24-03
Figure 98: Popup Message
4) Selected field is now visible in the “Select Summary Columns to Display”.
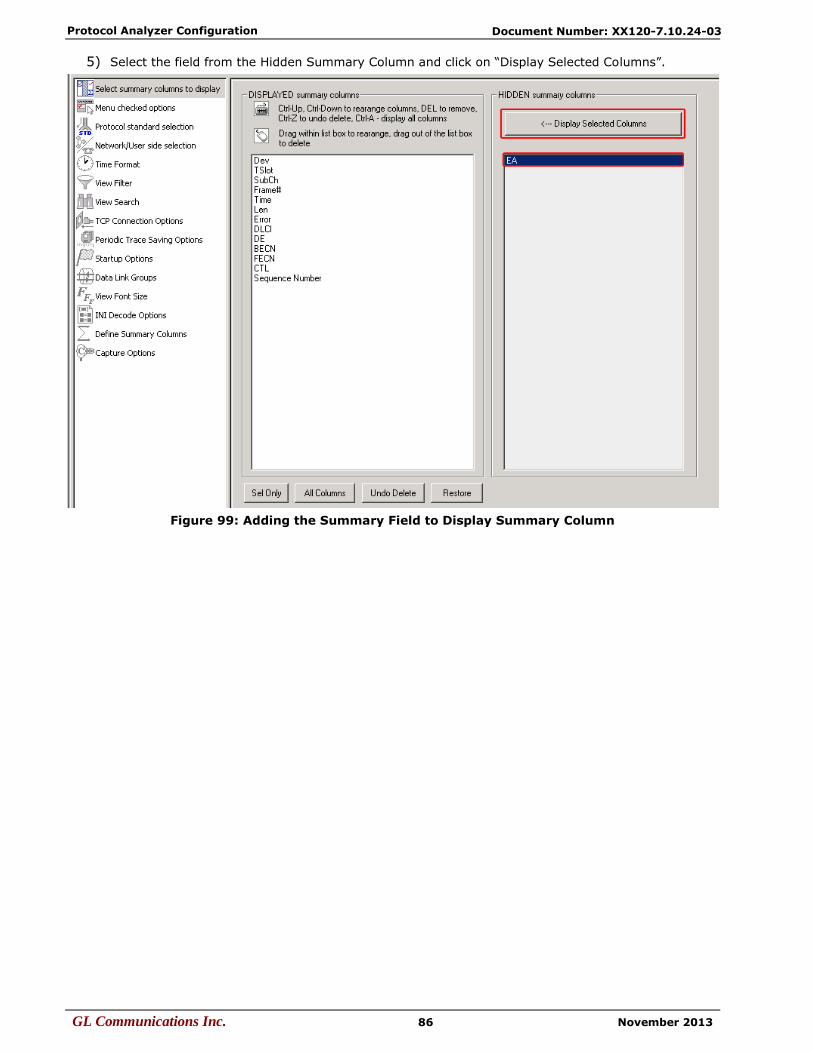
Protocol Analyzer Configuration
GL Communications Inc. 86 November 2013
Document Number: XX120-7.10.24-03
5) Select the field from the Hidden Summary Column and click on “Display Selected Columns”.
Figure 99: Adding the Summary Field to Display Summary Column

Protocol Analyzer Configuration
GL Communications Inc. 87 November 2013
Document Number: XX120-7.10.24-03
6) Selected field is now visible in the Analyzer. Refer to the figure below:
Figure 100: Added summary field
Note: To remove the selected summary field, do the following: 1. Select Configure Menu Protocol and GUI Options Define Summary Columns.
2. Select the added summary field to be removed. 3. Click on ‘Define’.
8.2 Capture Options
Note: This feature is applicable to real-time analyzer only.
This provides various options such as trace file options, card and timeslot selections, real-time filter options, etc. For detail information on this, refer to Capture Menu Features.

Protocol Analyzer Configuration
GL Communications Inc. 88 November 2013
Document Number: XX120-7.10.24-03
(Intentional Blank Page)

Status Indicators
GL Communications Inc. 89 November 2013
Document Number: XX120-7.10.24-03
Section 9.0 Status Indicators
The analyzer has status indicators at the bottom of the window as shown in figure below:
Figure 101: Analyzer Status Indicators
9.1 Status and Progress Indicator
This is the first (leftmost) indicator that displays the following information:
Bandwidth utilization (payload bytes (not counting flags) / total bytes (Frame bytes plus flags) during real-time capturing.
Real-time or off-line mode.
Real-time capturing status (Running or stopped).
Notification when a long process is in progress, for example, trace is exported, statistics are
recalculated etc. when the user interface is temporary disabled and the hourglass is being displayed.
Notification that filtering is active.
Note: Status and progress information is obtained for Real-time Analyzer Only.
9.2 Trace File Name
The second indicator displays the trace file name.
9.3 Filtered and Total Frame Count
The third indicator displays filtered and total frame count when the filtering is active and just the total frame count when filter is deactivated.
9.4 Error Counters
The fourth indicator is blank when no errors are encountered. Separated counts are displayed for cyclic redundancy check and framing errors. When there is more number of error counters click View
View Capture Error Details to extend the error counters in the status bar to display all types of errors such as CRC, Frame Error, Reassembly, Dropped, Missing, and Duplicate error counts.

Status Indicators
GL Communications Inc. 90 November 2013
Document Number: XX120-7.10.24-03
(Intentional Blank Page)

Installation
GL Communications Inc. 91 November 2013
Document Number: XX120-7.10.24-03
Application II - Remote / Offline Analyzer
Section 1.0 Installation
GL’s offline/remote protocol analyzers are available as optional software. Functionally, they are similar to real-time protocol analyzers that are integrated with T1E1 Analyzers.
With Remote Protocol Analyzer applications, users can perform real-time as well as offline protocol analysis from any remote-site.
For installing offline and remote protocol analyzers, first install T1 E1 hardware, server software, and
HDLC capture software. At the remote site, install the GUI based Offline/Remote protocol analyzer application. For details on installing T1E1 Analyzer, refer to T1E1 Installation User Manual for the required Windows® operating system.
1.1 Installation Procedure
The installation procedure for offline/remote protocol analyzer is as follows.
Dongle Installation
Software Installation
1.2 Dongle License Installation
Dongle is a hardware lock, which is installed before installing analyzer software. Each dongle has a
number uniquely associated with it. To install the dongle hardware and corresponding license, follow the steps below:
Double-click the setup.exe file in the dongle license installer directory to initiate the install-shield wizard. Dongle installs the application license
Click Finish in the installation wizard to complete the license installation as shown in the figure
below:
Figure 102: Dongle License Installation

Installation
GL Communications Inc. 92 November 2013
Document Number: XX120-7.10.24-03
1.3 Software Installation (Windows® XP)
Double-click the executable in the GL’s Remote protocol analyzer installation CD to open the installation shield wizard as shown in the figure below:
Figure 103: Welcome Screen
Click Next in the above wizard, and click ‘Yes’ to accept the license agreement as shown in the figure below:
Figure 104: License Agreement
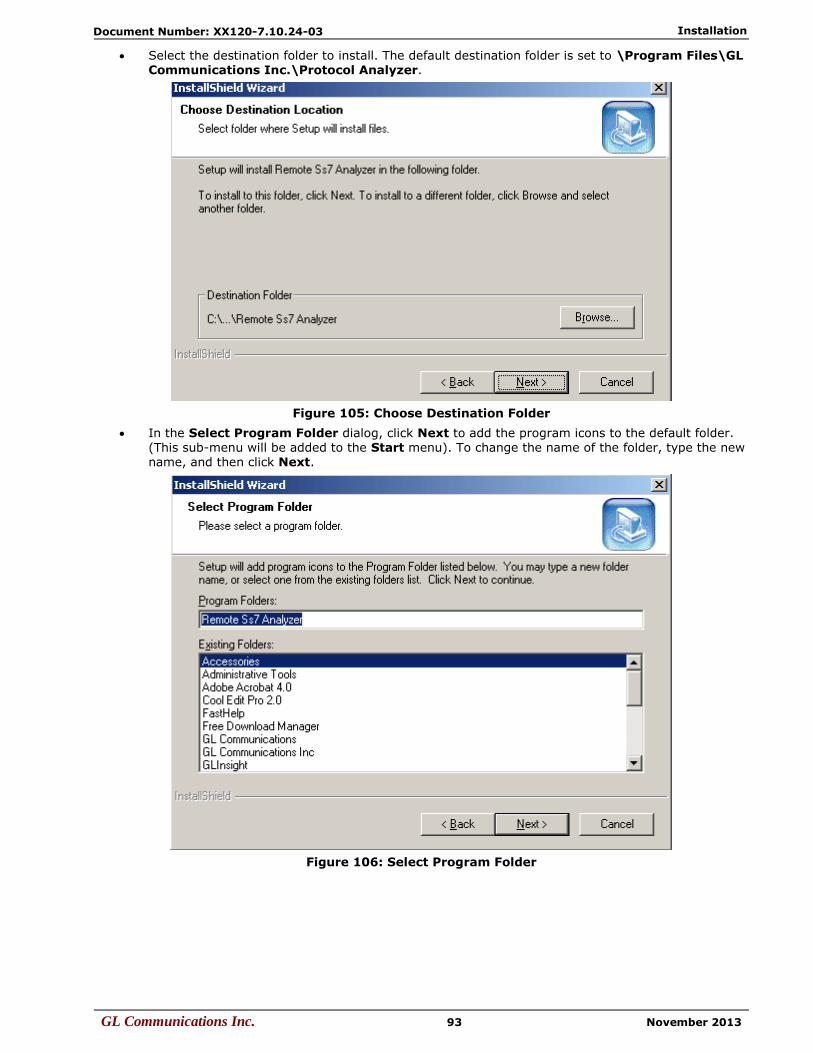
Installation
GL Communications Inc. 93 November 2013
Document Number: XX120-7.10.24-03
Select the destination folder to install. The default destination folder is set to \Program Files\GL Communications Inc.\Protocol Analyzer.
Figure 105: Choose Destination Folder
In the Select Program Folder dialog, click Next to add the program icons to the default folder. (This sub-menu will be added to the Start menu). To change the name of the folder, type the new name, and then click Next.
Figure 106: Select Program Folder
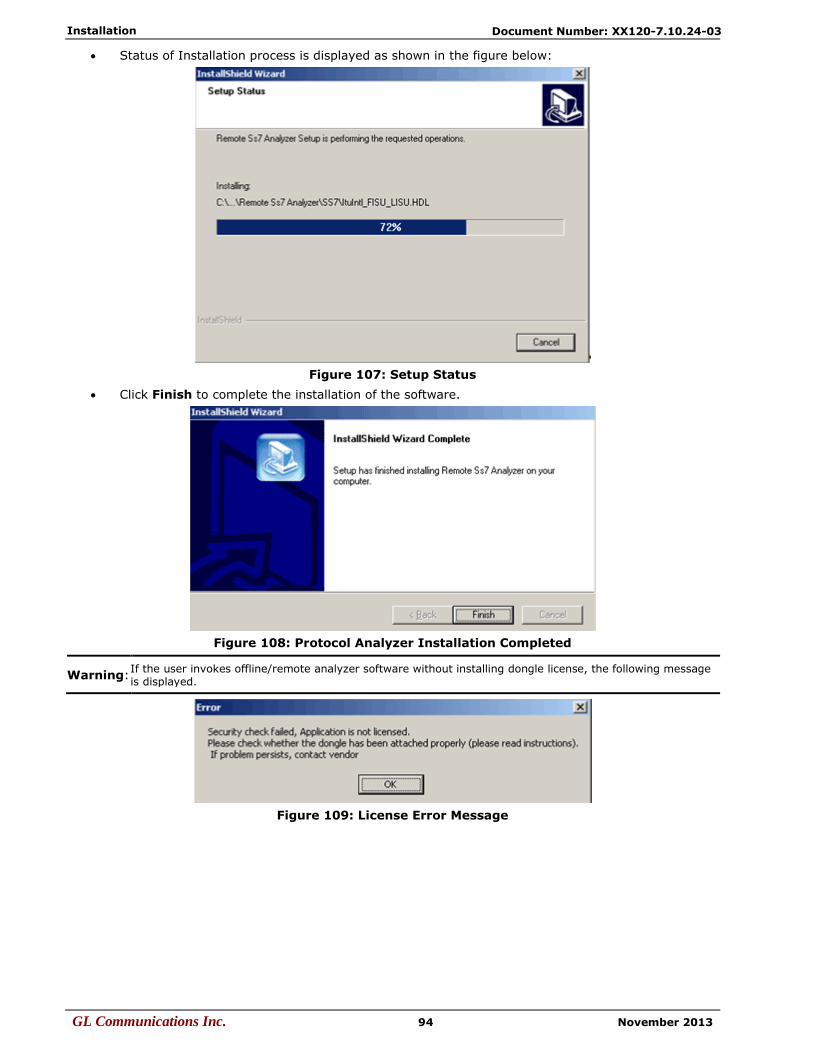
Installation
GL Communications Inc. 94 November 2013
Document Number: XX120-7.10.24-03
Status of Installation process is displayed as shown in the figure below:
Figure 107: Setup Status
Click Finish to complete the installation of the software.
Figure 108: Protocol Analyzer Installation Completed
Warning: If the user invokes offline/remote analyzer software without installing dongle license, the following message is displayed.
Figure 109: License Error Message

Getting Started with Remote Protocol Analyzer
GL Communications Inc. 95 November 2013
Document Number: XX120-7.10.24-03
Section 2.0 Getting Started with Remote Protocol Analyzer
2.1 Invoking Remote Protocol Analyzer
For HDLC based protocols, HDLC frames can be transported via TCP / IP and captured remotely with a
GUI Protocol Analyzer Client. At the client location the full capability of a real-time Protocol Analyzer is available for storing, analyzing, filtering, displaying, and processing the protocol information.
Double click the Remote Protocol Analyzer icon located on the desktop to invoke the application as
shown in the figure below. The remote protocol analyzer is located in the directory \Program Files\GL Communications\.
Figure 110: Invoking the Remote Protocol Analysis Application

Getting Started with Remote Protocol Analyzer
GL Communications Inc. 96 November 2013
Document Number: XX120-7.10.24-03
2.1.1 Remote Analysis
Click on Remote Analysis button to invoke WCS Server Connect dialog. Remote Analyzer requires
users to connect to a remote system that consists of GL’s T1/E1 cards running in server mode.
Figure 111: WCS Server Connect
Click Remote Analysis to open the WCS Server Connect screen as shown in the figure below. User can connect to the server by entering the IP Address and the IP Port in the respective fields.
Note: To connect to T1 cards, select the ports number as 17080, and to connect to E1 cards, select the ports number as 17090.
Add: Click Add to add an IP address to the Connected Servers list. You can add multiple Server IP Addresses to connect simultaneously to all T1E1 cards.
In order to connect a remote analyzer to the server, select the IP address from the Connected Servers
pane and click OK.
Delete: To delete an already added IP address, select the IP address to be deleted from the Connected Servers pane and click Delete.
IP Address: Enter an IP address of server in this field, which is used to perform the real time analysis.
IP Port: Enter the IP Port of the server depending on the T1/E1 card used. If connecting to a server, which has T1 card in it, then the IP Port will be 17080. If connecting to a server, which has E1 card in
it, then the IP Port will be 17090.
Connected Servers: In this pane, all the IP addresses and the IP port numbers are added and listed. User can select the IP address of the server and click Ok to connect to the server. Click Cancel to cancel the connection from the server.
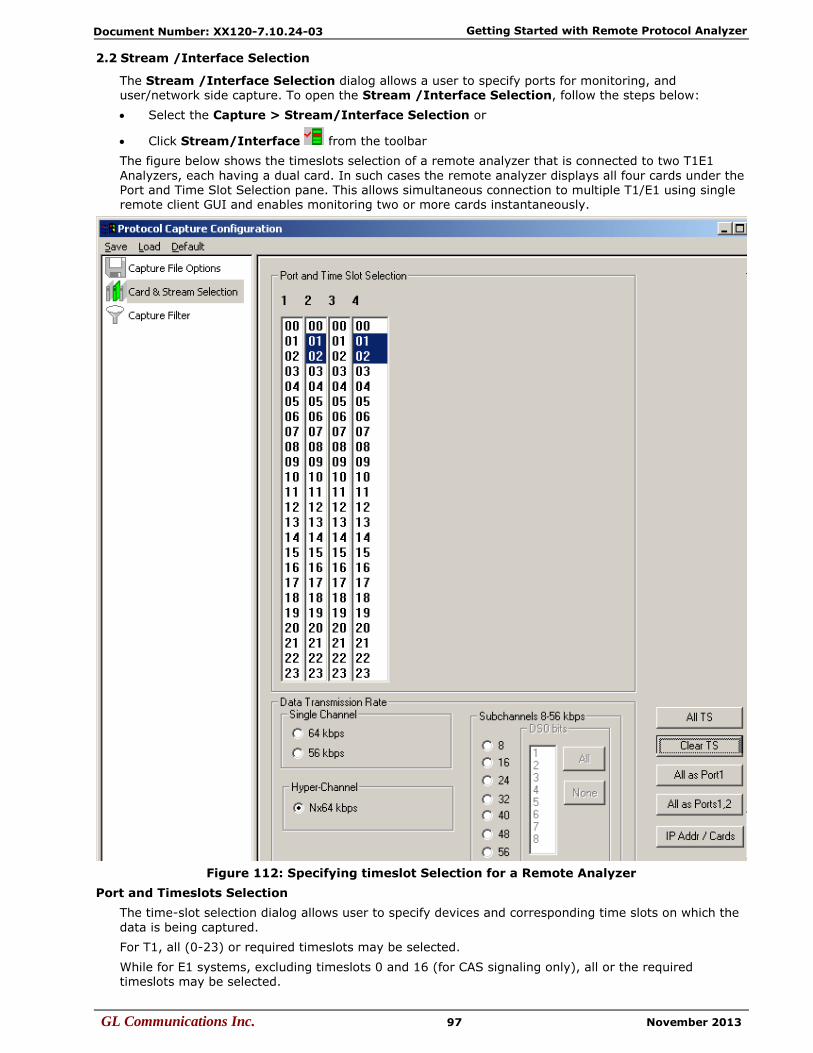
Getting Started with Remote Protocol Analyzer
GL Communications Inc. 97 November 2013
Document Number: XX120-7.10.24-03
2.2 Stream /Interface Selection
The Stream /Interface Selection dialog allows a user to specify ports for monitoring, and user/network side capture. To open the Stream /Interface Selection, follow the steps below:
Select the Capture > Stream/Interface Selection or
Click Stream/Interface from the toolbar
The figure below shows the timeslots selection of a remote analyzer that is connected to two T1E1
Analyzers, each having a dual card. In such cases the remote analyzer displays all four cards under the Port and Time Slot Selection pane. This allows simultaneous connection to multiple T1/E1 using single remote client GUI and enables monitoring two or more cards instantaneously.
Figure 112: Specifying timeslot Selection for a Remote Analyzer
Port and Timeslots Selection
The time-slot selection dialog allows user to specify devices and corresponding time slots on which the
data is being captured.
For T1, all (0-23) or required timeslots may be selected.
While for E1 systems, excluding timeslots 0 and 16 (for CAS signaling only), all or the required timeslots may be selected.
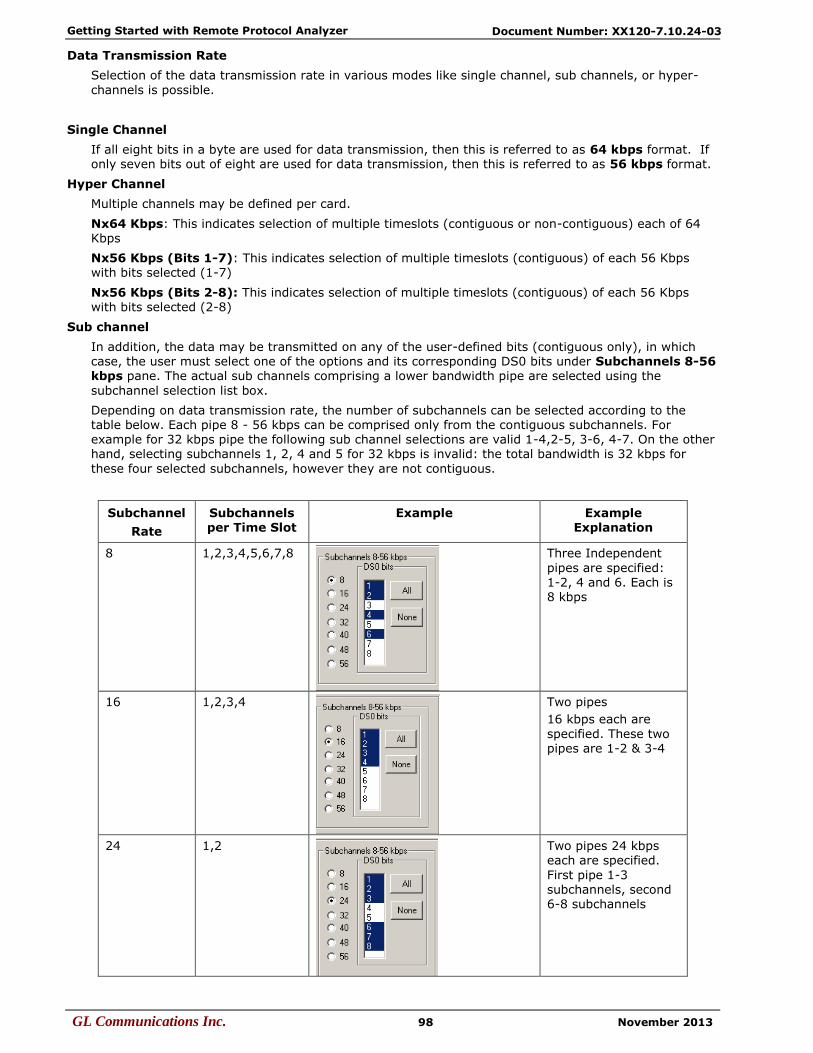
Getting Started with Remote Protocol Analyzer
GL Communications Inc. 98 November 2013
Document Number: XX120-7.10.24-03
Data Transmission Rate
Selection of the data transmission rate in various modes like single channel, sub channels, or hyper-
channels is possible.
Single Channel
If all eight bits in a byte are used for data transmission, then this is referred to as 64 kbps format. If only seven bits out of eight are used for data transmission, then this is referred to as 56 kbps format.
Hyper Channel
Multiple channels may be defined per card.
Nx64 Kbps: This indicates selection of multiple timeslots (contiguous or non-contiguous) each of 64 Kbps
Nx56 Kbps (Bits 1-7): This indicates selection of multiple timeslots (contiguous) of each 56 Kbps with bits selected (1-7)
Nx56 Kbps (Bits 2-8): This indicates selection of multiple timeslots (contiguous) of each 56 Kbps with bits selected (2-8)
Sub channel
In addition, the data may be transmitted on any of the user-defined bits (contiguous only), in which case, the user must select one of the options and its corresponding DS0 bits under Subchannels 8-56 kbps pane. The actual sub channels comprising a lower bandwidth pipe are selected using the
subchannel selection list box.
Depending on data transmission rate, the number of subchannels can be selected according to the table below. Each pipe 8 - 56 kbps can be comprised only from the contiguous subchannels. For example for 32 kbps pipe the following sub channel selections are valid 1-4,2-5, 3-6, 4-7. On the other hand, selecting subchannels 1, 2, 4 and 5 for 32 kbps is invalid: the total bandwidth is 32 kbps for
these four selected subchannels, however they are not contiguous.
Subchannel
Rate
Subchannels per Time Slot
Example Example Explanation
8 1,2,3,4,5,6,7,8
Three Independent
pipes are specified: 1-2, 4 and 6. Each is 8 kbps
16 1,2,3,4
Two pipes
16 kbps each are
specified. These two pipes are 1-2 & 3-4
24 1,2
Two pipes 24 kbps each are specified.
First pipe 1-3 subchannels, second 6-8 subchannels

Getting Started with Remote Protocol Analyzer
GL Communications Inc. 99 November 2013
Document Number: XX120-7.10.24-03
32 1,2
Two 32kbps pipes
take entire DS0. First one 1-4 subchannels, second 5-8
subchannels
40 1
One pipe 40 kbps takes subchannels 1-5.
48 1 Similar to 40 kbps but 6
consecutive subchannels must be selected
56 1 Similar to 40 kbps but 7
consecutive subchannels must be selected
IP Addr / Cards: Click IP Addr / Cards to see the IP addresses of the servers connected and the corresponding card numbers as shown in the figure below.
Figure 113: Info of IP Addr/Cards
Example Operation:
To Playback an *.HDL file on the server & capture it on the remote analyzer, follow the steps as shown below:
7) Invoke the T1/E1 analyzer application on the remote server, and start the server.
8) Invoke the Remote analyzer application and click on Remote Analysis.
9) Enter the IP Address and the IP Port of the server and click Add.
10) Select the added IP address from the Connected Server pane and click OK.
11) At the Server side, invoke the HDLC Playback application and playback an *.HDL file on card #1,
timeslot 1, 2.
12) On the remote analyzer open the stream interface selection and select the opposite card that is card
#2 and timeslots 1, 2.
13) Start the real-time analysis on the remote analyzer to capture the frames.
Note: Select All timeslots if the channel selection is not known.
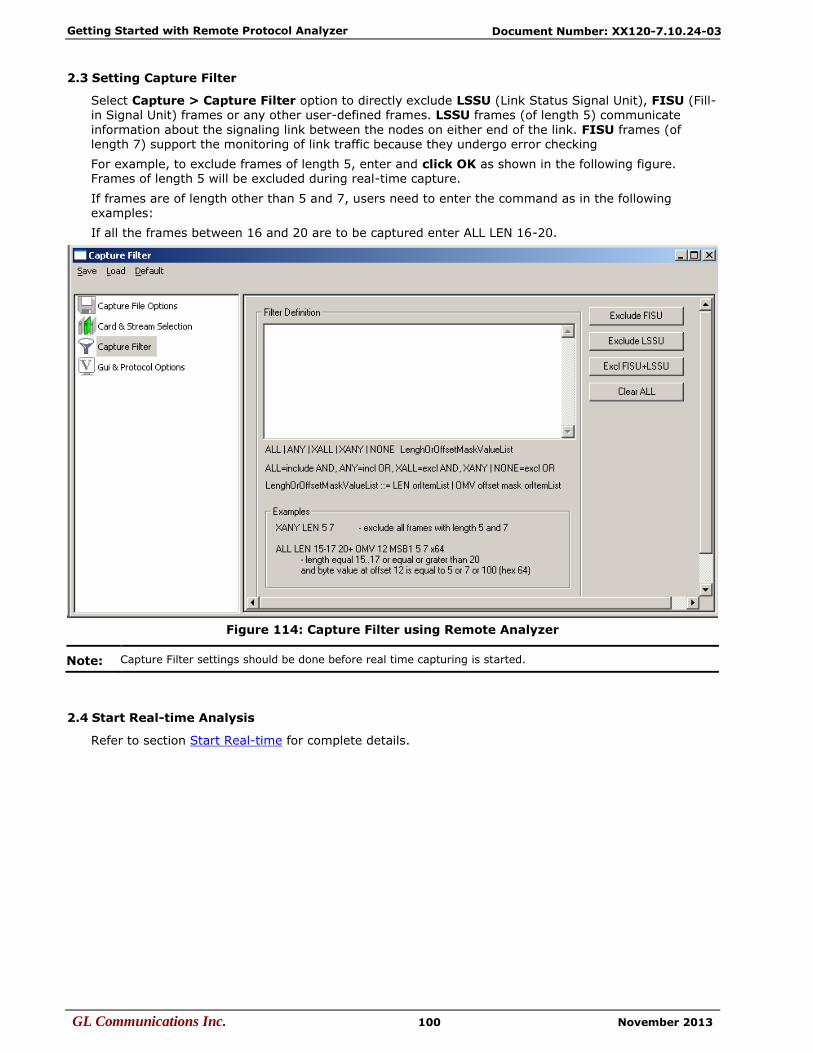
Getting Started with Remote Protocol Analyzer
GL Communications Inc. 100 November 2013
Document Number: XX120-7.10.24-03
2.3 Setting Capture Filter
Select Capture > Capture Filter option to directly exclude LSSU (Link Status Signal Unit), FISU (Fill-
in Signal Unit) frames or any other user-defined frames. LSSU frames (of length 5) communicate
information about the signaling link between the nodes on either end of the link. FISU frames (of length 7) support the monitoring of link traffic because they undergo error checking
For example, to exclude frames of length 5, enter and click OK as shown in the following figure. Frames of length 5 will be excluded during real-time capture.
If frames are of length other than 5 and 7, users need to enter the command as in the following examples:
If all the frames between 16 and 20 are to be captured enter ALL LEN 16-20.
Figure 114: Capture Filter using Remote Analyzer
Note: Capture Filter settings should be done before real time capturing is started.
2.4 Start Real-time Analysis
Refer to section Start Real-time for complete details.

Getting Started with Offline Protocol Analyzer
GL Communications Inc. 101 November 2013
Document Number: XX120-7.10.24-03
Section 3.0 Getting Started with Offline Protocol Analyzer
Click Offline Analysis to open the interface in offline analysis mode. This mode allows you to analyze the pre-captured *.hdl files. To open the trace for Offline Analysis, follow the steps given below:
Click File > Off-line as shown in the figure below Or
Click Off line from a File from the tool bar
Figure 115: Open a Trace from a File for Off-line Analysis
The GUI appears as shown below:
Figure 116 : Offline Analysis

Getting Started with Offline Protocol Analyzer
GL Communications Inc. 102 November 2013
Document Number: XX120-7.10.24-03
(Intentional Blank Page)

Appendix A - Glossary
GL Communications Inc. 103 November 2013
Document Number: XX120-7.10.24-03
Appendix A - Glossary
Device Number (one relative) -It displays the device number on which the data is being captured.
Time Slots- This field displays range of selected timeslots.
Sub Channels - This field displays subchannel number if any selected.
Frame Number (zero relative) - This represents the unique number assigned to each frame in
the order in which it was captured. Frame numbers can be any non-negative numbers and is limited only by the number of frames captured to the trace file.
Time - This field displays the time as configured by the user in View > Time Format. For more information refer to Time Displays.
Frame Length (Including 16 bit FCS) - This field displays the length of each captured frame.
OK Frames Only - Filters all frames that are error free.
Frame Error Status- This field displays various error messages during capturing /decoding such
as Frame error, Decode error, FCS error, and so on.
SS7 ITU/ ETSI/CHINA/UK Standard:
BSN/FSN (Backward/Forward Sequence Number) - This field displays BSN and FSN, (each of length 7-bit), which are used to acknowledge the message signal units from the remote end of the signaling link.
BIB/FIB (Backward/Forward Indicator Bit) - This field displays BIB and FIB, (each of length
8-bit) which are used in the basic error control and acknowledgement functions.
Status Field- Status field in LSSU frames is an 8/16-bit field that indicates initiation of link
alignment, quality of received traffic, and status of processors at either end of the link.
SLC (Signaling Link Code) - SLC Link code is a 4-bit code that identifies the link set carrying SS7 signaling information. The range of SLC is 0-15. For example, enter SLC value 23, as shown in the figure below to filter the frames that have the value as 23.
DPC (Destination Point Code) - This field displays the DPC value that represents a numeric
address used to uniquely identify the receiving signalling point.
OPC (Originating Point Code) - This field displays the OPC value that represents a numeric
address used to uniquely identify the sending signaling point. This column shows the originating point code value.
SCCP Message Type (Signaling Connection Control Part) - This field displays the SCCP that uses subsystem numbers (SSN) and various message types to allow messages to be addressed to specific applications (called subsystems) at each signaling points.
SSN - This field displays the SSN that is used to identify the specific applications (called subsystems) at each signaling points.
MAP (Mobile Application Part) Package and Component Type - MAP is a protocol that
enables real-time communication between nodes in a mobile cellular network. It encapsulates package and components types of Transaction Capabilities Application Part (TCAP) messages over a common channel network.
MAP Operation and MAP Error (Mobile Application Part (Error and operation) - This field
displays the processes that are required to invoke a MAP operation at remote node and the corresponding errors that are returned by MAP error.
INAP (Intelligent Network Application Part) Package and Component Type – INAP is a protocol that enables real-time communication between intelligent network elements. It uses basic
TCAP services and is based on various TCAP package like Begin, Unidirectional, continue and so on. It also includes various TCAP components such as Invoke the operation, Return the results of an operation i.e. success /failure etc.
INAP Operation Code and Error Code - This field displays a list of INAP operations at remote
node and the corresponding errors that are returned.
CAP (CAMEL Application Part) Package and Component - CAP is a protocol that supports the information flows between CAMEL (Customized Application for Mobile network Enhanced Logic) functional elements. It uses basic TCAP Services and is based on various TCAP package like begin, unidirectional, continue and so on. It also includes various TCAP components such as Invoke the
operation, Return the results of an operation i.e. success /failure etc.

Appendix A - Glossary
GL Communications Inc. 104 November 2013
Document Number: XX120-7.10.24-03
CAP Error - This field displays a failure code for the invoked CAP operation.
CIC (Circuit Identity Code) (ISUP/BTUP)- This is an 8bit field within the (Service Information
Field) of the ISUP (ISDN User Part) message, which identifies the links that carry user traffic.
ISUP (ISDN User Part of SS7) Message Type - This field displays the ISUP message that indicates the establishment/release of SS7 call and maintenance of the call.
Called No - This displays the destination number.
Calling No - This displays the caller related messages.
Transf/ConnRedirr# - This field represents either called party or call forwarded number.
Reg Test Message - This field displays the test messages sent across the link to test the integrity of the link.
Net Mgmt Message - This field displays the network starting that is used to manage from
maintaining active link/ standby link, decide when the link should be down/up etc.
BICC Msg Type: This field displays the BICC (Bearer Independent Call Control) message type
code that uniquely defines the function and format of each ISDN User Part message. The message types include Address complete, Answer, Call Progress, Connect, Continuity and so on.
Msg Type: The B-ISDN User Part (B-ISUP) is applicable to international B-ISDN networks. This
field displays the message type such as Address Complete, Blocking, Answer, and so on.
Interconnect User Part (IUP /BTUP) Layer - This layer includes call signaling messages required to establish, maintain & release of SS7 call between SS7 nodes. It is equivalent to ISUP in SS7 UK standard
Reg Testing Messages - These Messages are used for checking the integrity of the link. A given
pattern of octets is sent in SLTM message and if the same pattern is received in the SLTM Ack, the link functions properly.
NMPC - "Destination Point Code" in Network Management Message.
SS7 ANSI Standard:
Component Type - This field displays the component types in BER notation (TCAP ANSI) such as
Invoke, ReturnResult, ReturnError, Reject, invokeNotLast, and ReturnResult.
SLS (Signaling Link Selection) - This field displays the 8-bit SLS value that is normally used for load sharing across signaling links.
TCAP Package Type - Transactional Capabilities application part (TCAP) supports the exchange
of non-circuit related data between the applications across the SS7 network, using the SCCP connectionless service as a transport. Queries and Responses sent between SSP’s and SCP’s are carried in TCAP messages. In mobile networks (IS-41 and GSM), TCAP carries mobile application part (MAP) messages sent between mobile switches and databases to support user authentication, equipment identification and roaming.
CNAM Package Type – Calling Name Delivery allows the name of the calling party to be delivered to the called party. CNAM is an optional feature allowing the CPE connected to a switching system to receive calling party's name.
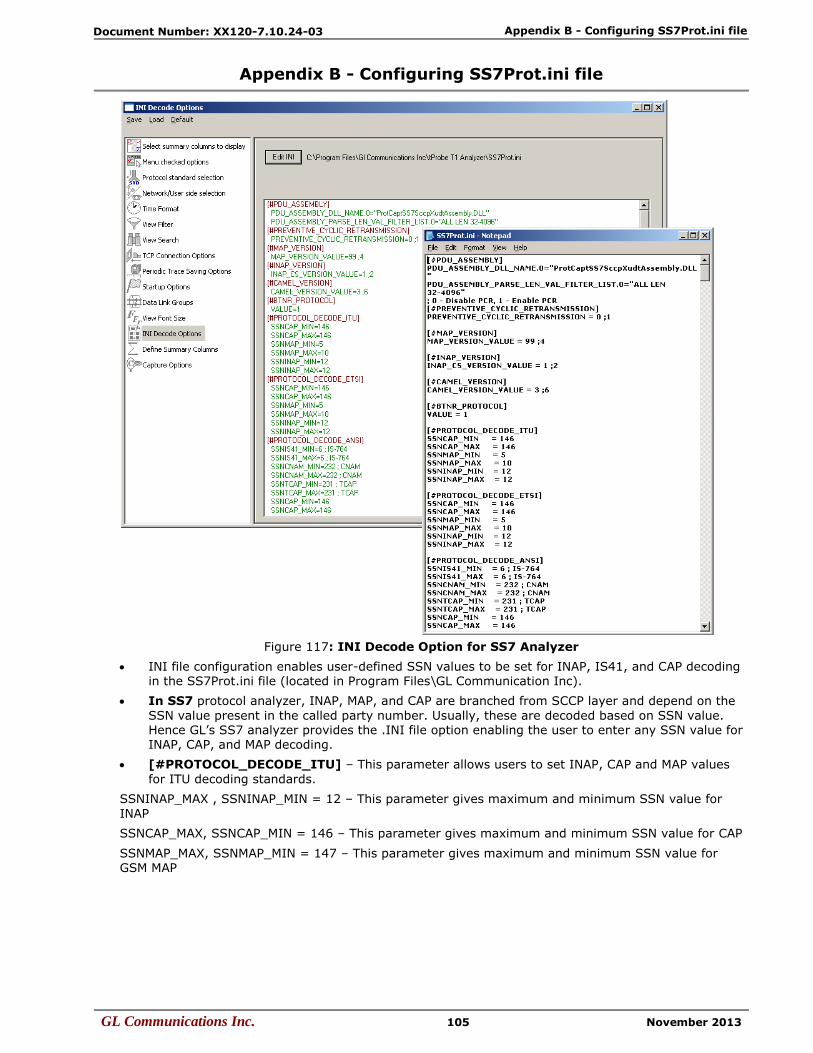
Appendix B - Configuring SS7Prot.ini file
GL Communications Inc. 105 November 2013
Document Number: XX120-7.10.24-03
Appendix B - Configuring SS7Prot.ini file
Figure 117: INI Decode Option for SS7 Analyzer
INI file configuration enables user-defined SSN values to be set for INAP, IS41, and CAP decoding in the SS7Prot.ini file (located in Program Files\GL Communication Inc).
In SS7 protocol analyzer, INAP, MAP, and CAP are branched from SCCP layer and depend on the
SSN value present in the called party number. Usually, these are decoded based on SSN value. Hence GL’s SS7 analyzer provides the .INI file option enabling the user to enter any SSN value for INAP, CAP, and MAP decoding.
[#PROTOCOL_DECODE_ITU] – This parameter allows users to set INAP, CAP and MAP values
for ITU decoding standards.
SSNINAP_MAX , SSNINAP_MIN = 12 – This parameter gives maximum and minimum SSN value for
INAP
SSNCAP_MAX, SSNCAP_MIN = 146 – This parameter gives maximum and minimum SSN value for CAP
SSNMAP_MAX, SSNMAP_MIN = 147 – This parameter gives maximum and minimum SSN value for GSM MAP
Appendix B - Configuring SS7Prot.ini file
GL Communications Inc. 106 November 2013
Document Number: XX120-7.10.24-03
[#PROTOCOL_DECODE_ETSI] – This gives SSN value to set INAP , CAP and MAP value for ETSI decoding standard.
SSNINAP_MAX , SSNINAP_MIN = 12 – This parameter gives maximum and minimum SSN value for
INAP
SSNCAP_MAX, SSNCAP_MIN = 146 – This parameter gives maximum and minimum SSN value for CAMEL
SSNMAP_MAX, SSNMAP_MIN = 147 – This parameter gives maximum and minimum SSN value for GSM MAP
SSNINAP_MIN = 12 – This parameter gives minimum value SSN for INAP.
[#PROTOCOL_DECODE_ANSI] – This header allows users to set the maximum and minimum
values for TCAP and IS41.
SSNIS41_MAX, SSN IS41_MIN = 6 ; This gives maximum and minimum value of SSN for ANSI MAP.
SSNCNAM_MAX, SSNCNAM_MIN = 232 ; CNAM– This gives maximum and minimum value of SSN for CNAM.
SSNTCAP_MAX, SSNTCAP_MIN = 231 ; TCAP– This gives maximum and minimum value of SSN for
TCAP.
SSNCAP_MAX, SSNCAP_MIN = 146– CAMEL – This gives maximum and minimum value of SSN for CAP.
Other values can also be customized as follows:
[#PDU_ASSEMBLY] – This identifier gives the related information for PDU assembly.
PDU_ASSEMBLY_DLL_NAME
PDU_ASSEMBLY_PARSE_LEN_VAL_FILTER_LIST.0
[#PREVENTIVE_CYCLIC_RETRANSMISSION] – If it is set to ‘one’ Retransmitted messages are
excluded from CDR
PREVENTIVE_CYCLIC_RETRANSMISSION = 0;1
[#MAP_VERSION] – This identifier gives the Map Version value.
MAP_VERSION_VALUE - This parameter is used to select MAP R99 or MAP R4 CS1 layer for decoding. If
it is set to 99, then MAP R99 layer will be decoded, and MAP R4 layer will be decoded if the value is set to 4.
[#INAP_VERSION] – This identifier gives the INAP Version value.
INAP_CS_VERSION_VALUE - This parameter is used to select INAP CS1 or INAP CS2 layer for decoding. If it is set to 1, then INAP CS1 layer will be decoded, and INAP CS2 layer will be decoded if the value is set to 2.
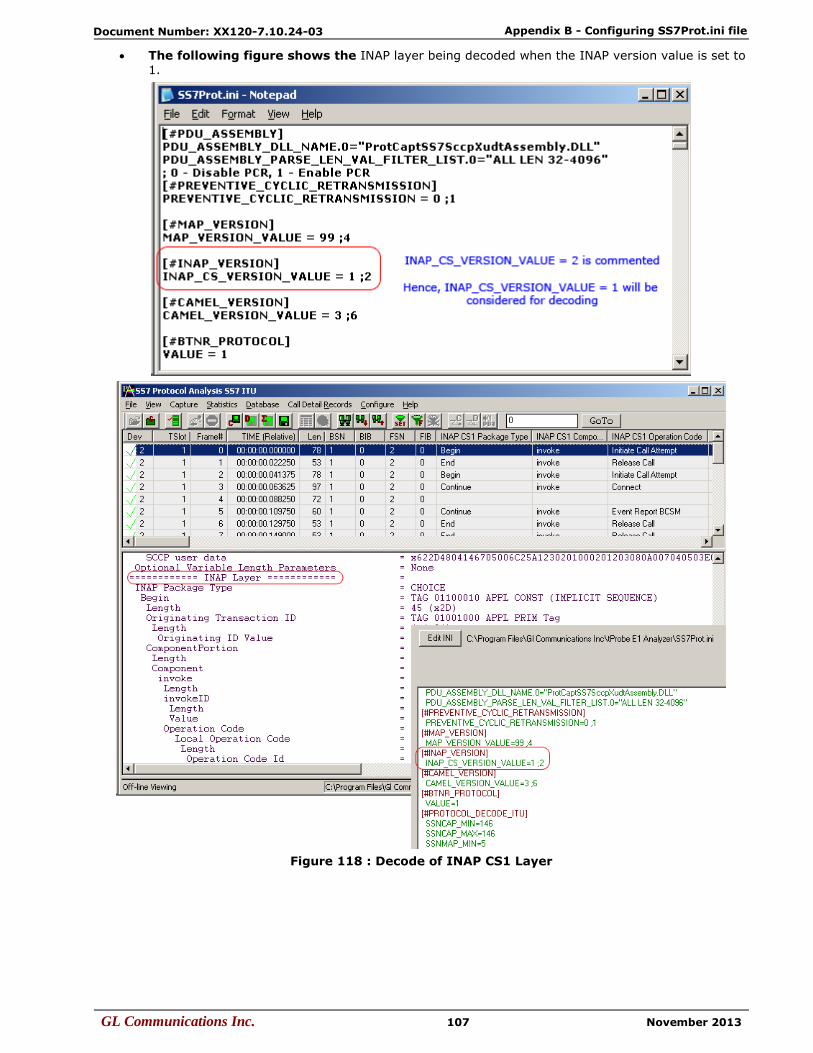
Appendix B - Configuring SS7Prot.ini file
GL Communications Inc. 107 November 2013
Document Number: XX120-7.10.24-03
The following figure shows the INAP layer being decoded when the INAP version value is set to 1.
Figure 118 : Decode of INAP CS1 Layer
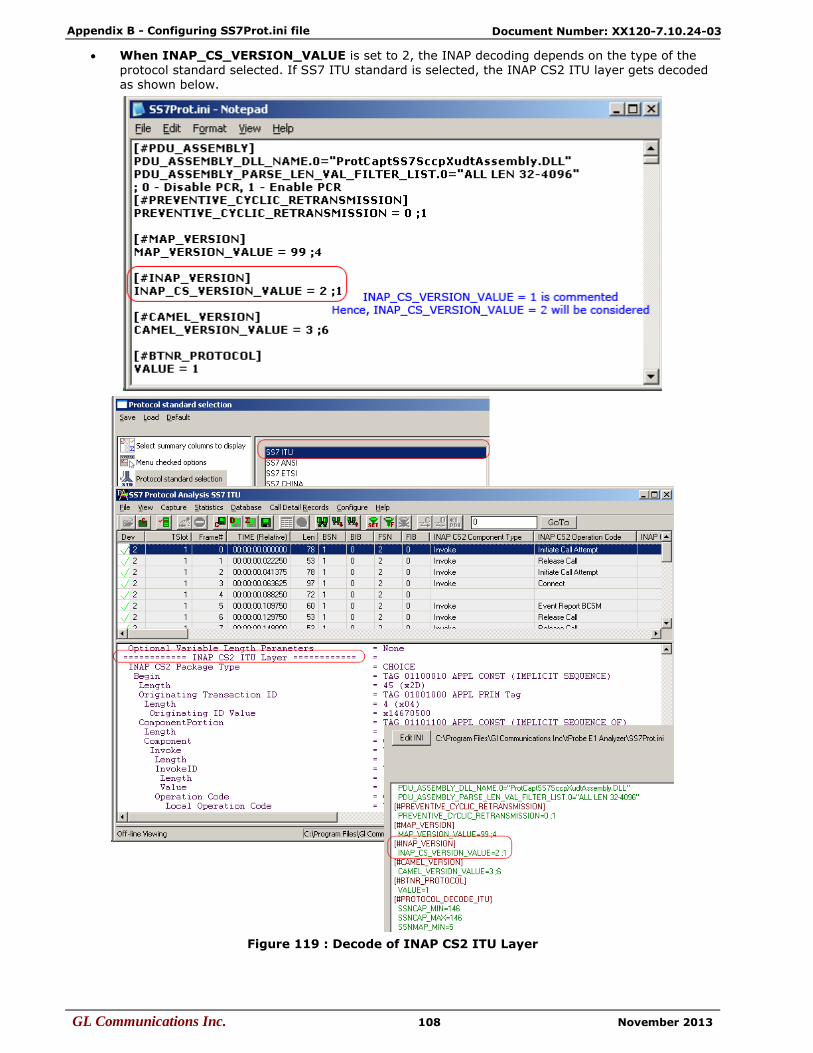
Appendix B - Configuring SS7Prot.ini file
GL Communications Inc. 108 November 2013
Document Number: XX120-7.10.24-03
When INAP_CS_VERSION_VALUE is set to 2, the INAP decoding depends on the type of the protocol standard selected. If SS7 ITU standard is selected, the INAP CS2 ITU layer gets decoded as shown below.
Figure 119 : Decode of INAP CS2 ITU Layer

Appendix B - Configuring SS7Prot.ini file
GL Communications Inc. 109 November 2013
Document Number: XX120-7.10.24-03
If SS7 ETSI standard is selected, the INAP CS2 ETSI layer gets decoded as shown below.
Figure 120 : Decode of INAP CS2 ETSI Layer
[#CAMEL_VERSION] – This identifier gives the CAMEL Version value. CAMEL_VERSION_VALUE - This parameter is used to select CAMEL Rel6 or CAMEL Rel3 layer for
decoding. If it is set to 6, then CAMEL Rel6 layer will be decoded and CAMEL Rel3 layer will be decoded if the value is set to 4.
[#BTNR_PROTOCOL] – This identifier allows users to select TUP or IUP protocols for
decoding. VALUE - This parameter is used to select TUP or IUP (BTNR) for decoding. If it is set to 1, then IUP
(BTNR) will be decoded, else TUP will be decoded.

Appendix B - Configuring SS7Prot.ini file
GL Communications Inc. 110 November 2013
Document Number: XX120-7.10.24-03
In addition, INI file can also be set to select the default summary fields for Surveillance (TCP/IP). Click EditINI button and edit as follows:
Note:
The TCP_CONNECT_SUMMARY_SELECT_DEFAULT selection is not visible in INI decode option window due to
the presence of ‘$’ before the parameter.
[$TCP_CONNECT_SUMMARY_SELECT_DEFAULT]
DEFAULT_SUM_COL_INDEX.0=0
DEFAULT_SUM_COL_INDEX.1=1
DEFAULT_SUM_COL_INDEX.2=2
DEFAULT_SUM_COL_INDEX.3=3
DEFAULT_SUM_COL_INDEX.4=4
DEFAULT_SUM_COL_INDEX.5=5
DEFAULT_SUM_COL_INDEX.6=6
DEFAULT_SUM_COL_INDEX.7=11
DEFAULT_SUM_COL_INDEX.8=12
DEFAULT_SUM_COL_INDEX.9=13
DEFAULT_SUM_COL_INDEX.10=14
DEFAULT_SUM_COL_INDEX.11=15
DEFAULT_SUM_COL_INDEX.12=16
DEFAULT_SUM_COL_INDEX.13=17
DEFAULT_SUM_COL_INDEX.14=18
DEFAULT_SUM_COL_INDEX.15=23
DEFAULT_SUM_COL_INDEX.16=24
DEFAULT_SUM_COL_INDEX.17=25
DEFAULT_SUM_COL_INDEX.18=26
DEFAULT_SUM_COL_INDEX.19=27
DEFAULT_SUM_COL_INDEX.20=37
DEFAULT_SUM_COL_INDEX.21=38
DEFAULT_SUM_COL_INDEX.22=39
This allows Analyzer to auto-select the columns on clicking Default in the configuration window as shown in the figure below:
Figure 121 : Selection of Default Summary Fields for Surveillance (TCP/IP)
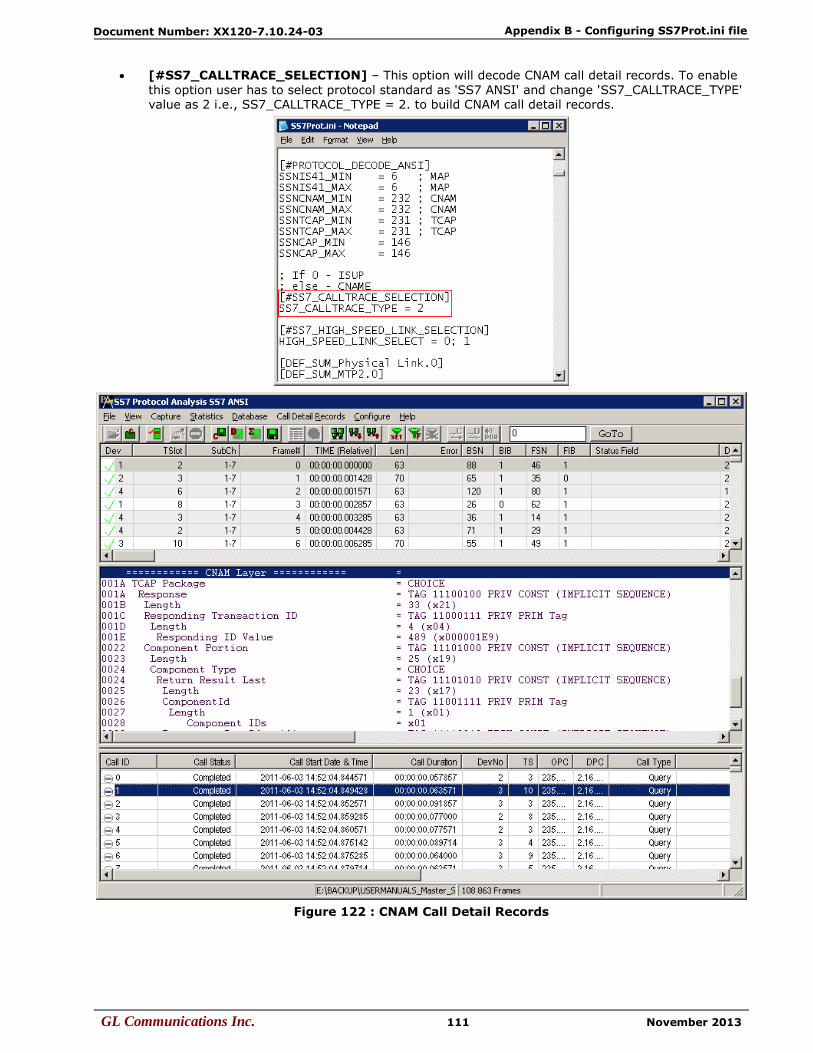
Appendix B - Configuring SS7Prot.ini file
GL Communications Inc. 111 November 2013
Document Number: XX120-7.10.24-03
[#SS7_CALLTRACE_SELECTION] – This option will decode CNAM call detail records. To enable
this option user has to select protocol standard as 'SS7 ANSI' and change 'SS7_CALLTRACE_TYPE' value as 2 i.e., SS7_CALLTRACE_TYPE = 2. to build CNAM call detail records.
Figure 122 : CNAM Call Detail Records

Appendix B - Configuring SS7Prot.ini file
GL Communications Inc. 112 November 2013
Document Number: XX120-7.10.24-03
[#SS7_HIGH_SPEED_LINK_SELECTION] – This option will make the decode the SS7 links at
higher signaling capacity SS7 links (1.536 and 1.984 Mbit/s, simply referred to as the 1.5 Mbit/s and 2.0 Mbit/s rates) are called High Speed Links. High speed links utilize the entire bandwidth of a T1
(1.536 Mbit/s) or E1 (1.984 Mbit/s) transmission facility for the transport of SS7 signaling messages. These rates can be used as a national optional.
In the SS7Prot.ini, if the user sets the ‘HIGH_SPEED_LINK_SELECT’ value to 0, then MTP2 is decoded as low speed link.
If HIGH_SPEED_LINK_SELECT is set to 1 then MTP2 is decoded as High Speed Link.
Figure 123 : MTP2 Decoded in High Speed Link