real-time heart monitoring and ecg signal...
TRANSCRIPT

Real-time Heart Monitoring and ECG Signal Processing
Fatima Bamarouf, Claire Crandell, and Shannon Tsuyuki
Advisors: Drs. Yufeng Lu and Jose Sanchez
Department of Electrical and Computer Engineering Bradley University
April 26, 2016

Contents
• Introduction and Overview
• Methods
• System Implementation
• Results
• Summary and Conclusions
2

Introduction and Overview
• Problem Description
• Objectives
• Constraints
• System Block Diagram
• Scope
• Division of Labor
3
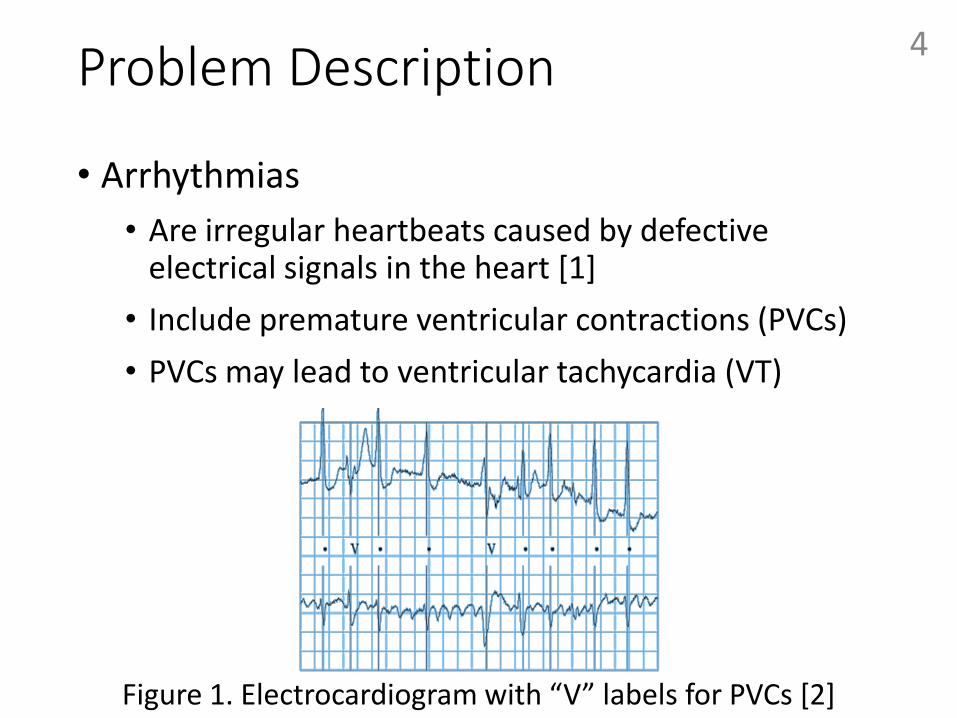
Problem Description
• Arrhythmias
• Are irregular heartbeats caused by defective electrical signals in the heart [1]
• Include premature ventricular contractions (PVCs)
• PVCs may lead to ventricular tachycardia (VT)
4
Figure 1. Electrocardiogram with “V” labels for PVCs [2]

Problem Description 5
• Normal vs. Arrhythmic Heart Rhythms
Source: http://watchlearnlive.heart.org/ [1]

Problem Description
• An electrocardiogram (ECG) describes the heart’s electrical activity
• An ECG can be recorded using a Holter monitor or event monitor
Figure 2. Features of a normal ECG [3]
6
Figure 3. Holter monitor with ECG reading [4]

Problem Description
• Holter and event monitors are limited in functionality
• Utilize some in-platform signal processing for diagnostic assistance
• Must perform some signal processing offline
• Are unable to address medical issues in real time
7

Objectives
• Develop a low-power, stand-alone embedded system for continuous heart monitoring that will
• Process ECG data in real time
• Detect PVCs accurately and consistently
• Alert the patient’s doctor wirelessly of ventricular tachycardia
8

Constraints
• Real-time ECG signal processing
• On-board signal processing computations
• Battery-powered functionality
9

System Block Diagram
Real-time Heart
Monitor System
Unprocessed Heart Data
Wireless Message
Figure 4. Overall heart monitoring system diagram
10

Scope 11
In Scope Out of Scope ECG signal processing Electrode interfacing,
battery circuit PVC and VT detection Detection of other types
of cardiac arrhythmias High-level wireless
communication Security issues
(encryption, data integrity, etc.)
TABLE I. SCOPE OF HEART MONITORING SYSTEM

Division of Labor
• MATLAB Simulation (PVC detection)
• Shannon/Fatima
• C Programming (PVC detection)
• Claire/Shannon
• Wi-Fi Communication
• Fatima/Claire/Shannon
12

Contents
• Introduction and Overview
• Methods
• System Implementation
• Results
• Summary and Conclusions
13

Functional Requirements 14
Functional Requirement
Specification Specification Met?
Filtering and/or normalizing the heart data
The filtering/normalization must ensure that the heart data is compatible with the QRS, PVC, and VT detection functionality.
Yes
Identifying each QRS complex
The QRS detection algorithm must return the R-peak indices for use in the PVC detection subsystem.
Yes
Classifying each QRS complex as PVC or non-PVC
The PVC detection algorithm must return the PVC indices for use in the VT detection subsystem.
Yes
TABLE II. FUNCTIONAL REQUIREMENTS (ALGORITHMS)
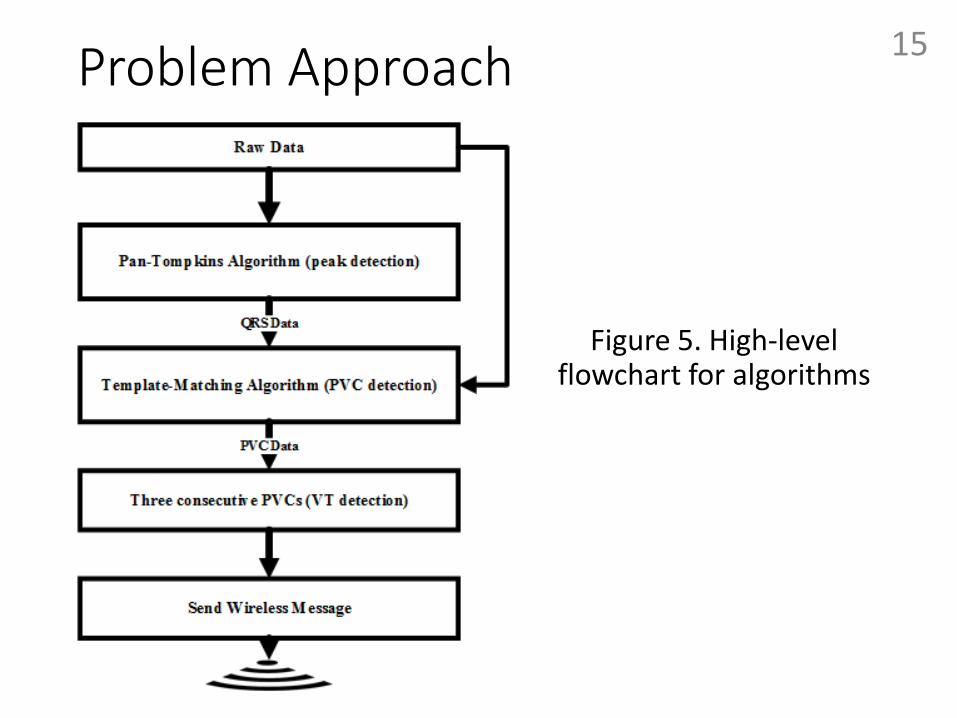
Problem Approach 15
Figure 5. High-level flowchart for algorithms

Pan-Tompkins Algorithm [5] 16
Figure 6. Flowchart for Pan-Tompkins algorithm

Functional Requirements 17
Functional Requirement
Specification Specification Met?
Filtering and/or normalizing the heart data
The filtering/normalization must ensure that the heart data is compatible with the QRS, PVC, and VT detection functionality.
Yes
Identifying each QRS complex
The QRS detection algorithm must return the R-peak indices for use in the PVC detection subsystem.
Yes
Classifying each QRS complex as PVC or non-PVC
The PVC detection algorithm must return the PVC indices for use in the VT detection subsystem.
Yes
TABLE III. FUNCTIONAL REQUIREMENTS (ALGORITHMS)

Template Generation Algorithm [6] 18
Figure 7. Flowchart for T1 and T2 generation

Beat Amplitude Series 19
Figure 8. MATLAB plot of QRS detection results.

Template Generation Algorithm 20
Figure 9. Flowchart for T1 and T2 generation

Template Generation Algorithm 21
Figure 10. Flowchart for T1 and T2 generation

Data between Two R-Peaks 22
Figure 11. MATLAB plot of QRS detection results.

Template Generation Algorithm 23
Figure 12. Flowchart for T1 and T2 generation

Template Generation Algorithm 24
Figure 13. Flowchart for T1 and T2 generation

Wavelet Transform Algorithm [7]
• QRS (T1 template) detection method
• Zero crossings of quadratic spline wavelet transform used to find QRS onset and offset
25

Wavelet Transform Algorithm [8] 26

Wavelet Transform Algorithm 27
Figure 14. QRS onsets and offsets detected using the wavelet transform

Templates T1 and T2 28
Figure 15. T1 and T2 generation

Template-Matching Algorithm 29
Figure 16. Flowchart for template-matching algorithm

Template-Matching Algorithm 30
Figure 17. Flowchart for template-matching algorithm

Template-Matching Algorithm 31
Figure 18. Flowchart for template-matching algorithm

Data between Two R-peaks 32
Figure 19. T2 (interval between R peaks) and RR-interval signal for PVC beat

Interpolation and Extrapolation 33

Normalized Correlation Coefficient
34

Template-Matching Algorithm 35
Figure 20. Flowchart for template-matching algorithm

Exponential Function Correlation 36

Contents
• Introduction and Overview
• Methods
• System Implementation
• Results
• Summary and Conclusions
37

Functional Requirements
Functions Specifications Specification Met?
Storing heart data input into memory
The internal memory of the device must be at least 25 kB.
Yes
38
TABLE IV. FUNCTIONAL REQUIREMENTS (IMPLEMENTATION)
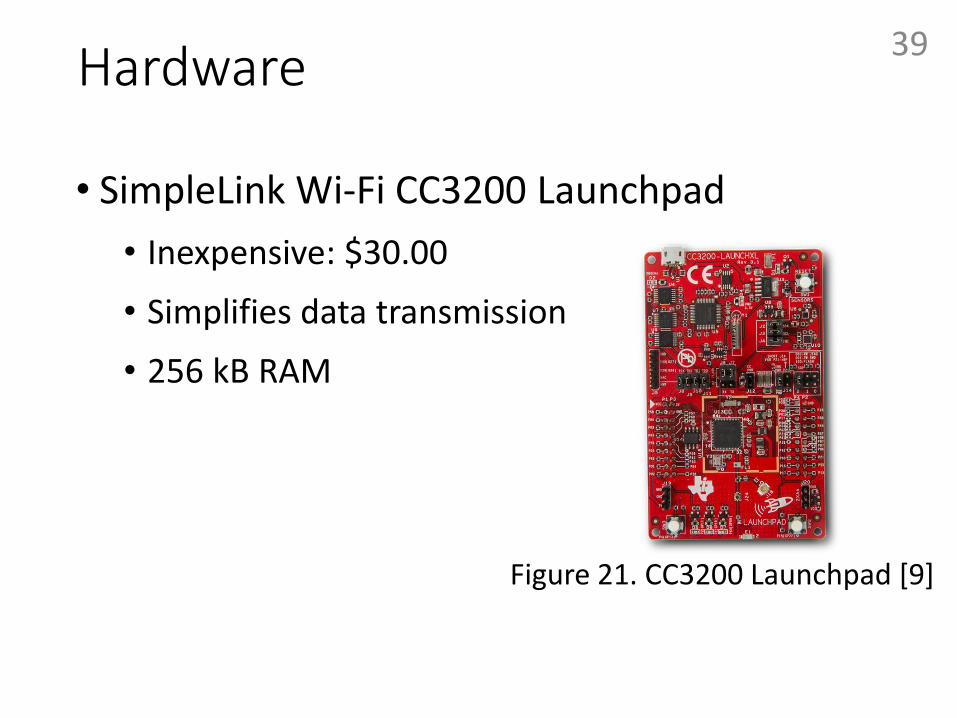
Hardware
• SimpleLink Wi-Fi CC3200 Launchpad
• Inexpensive: $30.00
• Simplifies data transmission
• 256 kB RAM
39
Figure 21. CC3200 Launchpad [9]

Communication
• µDMA (Micro Direct Memory Access) system with PC (USB connection)
• CC3200 receives buffers of heart data
• WiFi connection for web services
40

µDMA Diagram 41
CC3200
PC
µDMA Controller
ARM Cortex-M4 Processor
UART Buffer
Figure 22. UART data flow between the PC and the CC3200

PC-side Program
• Uses WFDB (Waveform Database) library functions to access the MIT-BIH arrhythmia database
• Converts the integer values into characters for µDMA transfer
42

Functional Requirements 43
Functions Specifications Specification Met?
Determining whether
ventricular tachycardia
is present using the
calculated PVC
information
The VT detection algorithm must return a 30-second interval of heart data surrounding the VT event for use in the wireless communication subsystem.
1000 data samples: about
3 seconds
Transmitting a wireless message to the patient’s doctor in the event of ventricular tachycardia
The time delay between the device transmitting the message and the doctor receiving the message must be less than one second.
approximately 2 minute delay
TABLE V. FUNCTIONAL REQUIREMENTS (IMPLEMENTATION)

CC3200 WiFi Setup
• The CC3200 was set up in station mode to access the internet
44
Figure 23. CC3200 set up in station mode [10]

Temboo
• Middleware that allows different devices (such as the LaunchPad) to access web-based services
45
Figure 24. Temboo integration with an embedded device [11]

Temboo/Twilio
• Sending an SMS message using the CC3200 LaunchPad
• Message includes text and image file
46

Temboo/Twilio 47
CC3200 LaunchPad
Temboo
Twilio API
Cell Phone
Start
Figure 25. Transmitting an SMS message using the LaunchPad

Wireless - Plotly 48
Figure 26. Sample Plotly graph of 1000 samples of heart data

System Integration
• Combined project uses Energia sketch in Code Composer Studio
• GNU compiler replaced ARM compiler
• Mixed C/C++ code
49

Contents
• Introduction and Overview
• Methods
• System Implementation
• Results
• Summary and Conclusions
50

Functional Requirements
Function Specification Specification Met?
Identifying each QRS complex
The device must have at least 90% positive predictivity and at least 90% sensitivity.
Yes
Classifying each QRS complex as PVC or non-PVC
The device must have at least 90% accuracy.
Yes
51
TABLE VI. FUNCTIONAL REQUIREMENTS (ALGORITHM METRICS)

QRS Detection Metrics [12]
• PP: positive predictivity
• SE: sensitivity
• TP (True Positive): detected QRS complex that is present in the signal
• TN (True Negative): data point between QRS complexes that does not contain a QRS peak
• FP (False Positive): incorrect identification of QRS peak
• FN (False Negative): QRS peak that was not detected by the algorithm
52
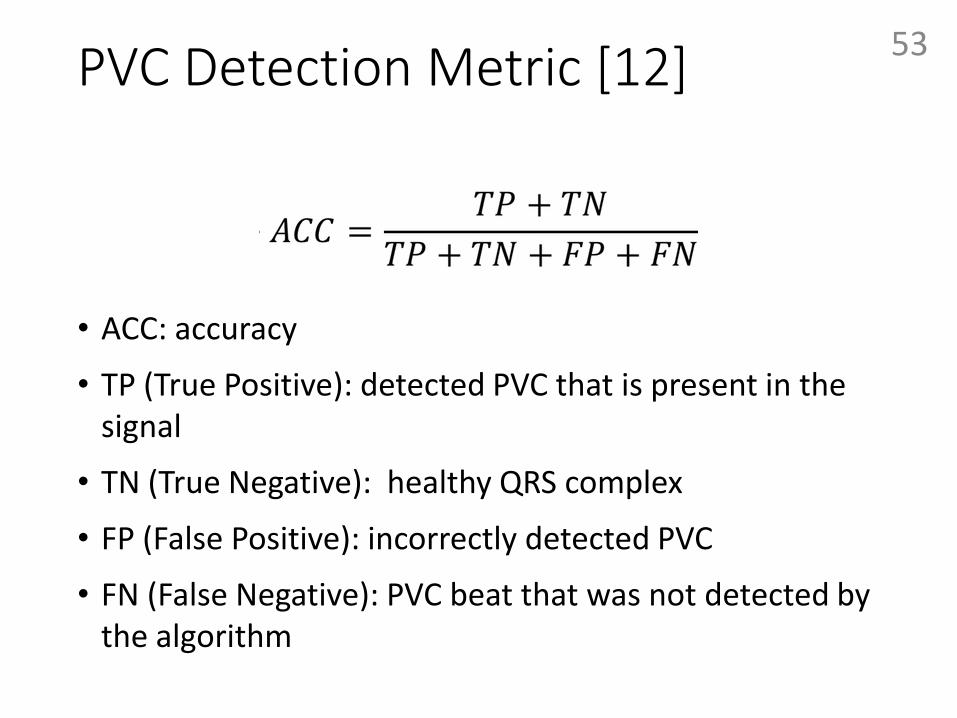
PVC Detection Metric [12] 53
• ACC: accuracy
• TP (True Positive): detected PVC that is present in the signal
• TN (True Negative): healthy QRS complex
• FP (False Positive): incorrectly detected PVC
• FN (False Negative): PVC beat that was not detected by the algorithm

Solution Testing
• MATLAB simulation of QRS, PVC, and VT detection
• Use MIT-BIH arrhythmia database for testing data
• Ensure that accuracy, sensitivity, and specificity are at least 90% using the WFDB toolbox
54

Solution Testing
• C implementation of QRS, PVC, and VT detection
• Store the heart data in the board’s memory and export the detection results to a file
55

Solution Testing
Record QRS Sensitivity (MATLAB)
QRS Sensitivity (C implementation)
106 0.9994 0.9762
116 0.9889 0.9885
119 1.0000 1.0000
201 0.9815 0.9731
203 0.9903 0.9910
208 0.9654 0.9381
Total 0.9912 0.9909
56
TABLE VII. QRS SENSITIVITY COMPARISON

Solution Testing
Record QRS Positive Predictivity (MATLAB)
QRS Positive Predictivity (C
Implementation)
106 0.9946 0.9995
116 0.9978 0.9987
119 1.0000 1.0000
201 0.9943 0.9791
203 0.9871 0.9821
208 0.9985 0.9942
Total 0.9921 0.9918
57
TABLE VIII. QRS POSITIVE PREDICTIVITY COMPARISON

Solution Testing
Record Accuracy (MATLAB)
Accuracy (C Implementation)
106 0.9390 0.9404
116 0.9957 0.9966
119 1.0000 1.0000
201 0.9682 0.9441
203 0.9284 0.8987
208 0.9702 0.9481
Total 0.9096 0.9316
58
TABLE IX. OVERALL ACCURACY COMPARISON

Results 59
Figure 27. Plotly graph of VT event

Contents
• Introduction and Overview
• Methods
• System Implementation
• Results
• Summary and Conclusions
60

Summary and Conclusions
• PVCs are irregular heartbeats that may lead to VT
• An embedded system has been developed that detects PVCs in real time and wirelessly alerts the patient’s doctor of VT
61

Summary and Conclusions
• Future Work
• Interfacing the LaunchPad with electrodes
• Additional improvements to the signal processing algorithms
62
Real-time Heart Monitoring and ECG Signal Processing
Fatima Bamarouf, Claire Crandell, and Shannon Tsuyuki
Advisors: Drs. Yufeng Lu and Jose Sanchez
Department of Electrical and Computer Engineering Bradley University
April 26, 2016

References • [1] Arrhythmias. [Online] Available: http://watchlearnlive.heart.org/CVML_Player.php?moduleSelect=arrhyt
• [2] MIT-BIH Arrhythmia Database. [Online] Available: http://www.physionet.org/physiobank/database/mitdb/
• [3] Cardiovascular System Assessments. [Online] Available: http://media.lanecc.edu/users/driscolln/RT116/softchalk/Cardia_Assessment/Cardia_Assessment_print.html
• [4] Holter Monitor. [Online] Available: http://www.hopkinsmedicine.org/healthlibrary/test_procedures/cardiovascular/holter_monitor_92,P07976/
• [5] J. Pan and W. Tompkins, “A Real-Time QRS Detection Algorithm,” IEEE Transactions on Biomedical Engineering, vol. -32, no. 3, pp. 230-236, 1985. [Online] Available: http://ieeexplore.ieee.org/xpl/articleDetails.jsp?arnumber=4122029
• [6] P. Li, et al., “A low-complexity data-adaptive approach for premature ventricular contraction recognition,” Signal, Image and Video Processing, vol. 8, no. 1, pp. 111-120, 2013. [Online] Available: http://link.springer.com/article/10.1007%2Fs11760-013-0478-6
• [7] C. Li, et al., “Detection of ECG Characteristic Points Using Wavelet Transforms.” [Online] Available: http://ieeexplore.ieee.org/xpl/login.jsp?tp=&arnumber=362922&url=http%3A%2F%2Fieeexplore.ieee.org%2Fiel5%2F10%2F8315%2F00362922.pdf%3Farnumber%3D362922
• [8] S. Mallat and S. Zhong, “Characterization of Signals from Multiscale Edges,” IEEE Transactions on Pattern Analysis and Machine Intelligence, vol. 14, no. 7, July 1992. [Online] Available: http://www.cmap.polytechnique.fr/~mallat/papiers/MallatEdgeCharact92.pdf
• [9] CC3200-LAUNCHXL. [Online] Available: http://www.ti.com/ww/en/launchpad/launchpads-connected-cc3200-launchxl.html?DCMP=cc3100cc3200&HQS=cc3200launchpad-oob
• [10] CC3200 –Getting Started with WLAN Station. [Online] Available: http://processors.wiki.ti.com/index.php/CC32xx_Getting_Started_with_WLAN_Station
• [11] Arduino: Dynamic Living-Room Lights. [Online] Available: https://www.element14.com/community/groups/arduino/blog/2014/12/22/dynamic-living-room-lights-the-yun-review--when-the-penguin-met-the-arduino
• [12] B. Ribeiro, et al., “Choosing Real-Time Predictors for Ventricular Arrhythmia Detection,” International Journal of Pattern Recognition and Artificial Intelligence, vol. 21, no. 08, pp. 1249-1263, 2007. [Online] Available: https://www.researchgate.net/publication/220359330_Choosing_Real-Time_Predictors_for_Ventricular_Arrhythmia_Detection
• [13] MSP430 Wireless Development Tool. [Online] Available: http://www.ti.com/tool/ez430-rf2500
• [14] REST API | Plotly Developers. [Online] Available: https://plot.ly/rest/
64

Code Optimization 65

T1 Alignment 66
Figure 28. T1 template and PVC QRS complex aligned to T1’s R peak index

Memory Requirements
• Sampling rate for ECG signal (MIT-BIH arrhythmia database): 360 Hz
• Number of samples required for 30 seconds of ECG data: 10,800
• Amount of memory required: 21 kB
67
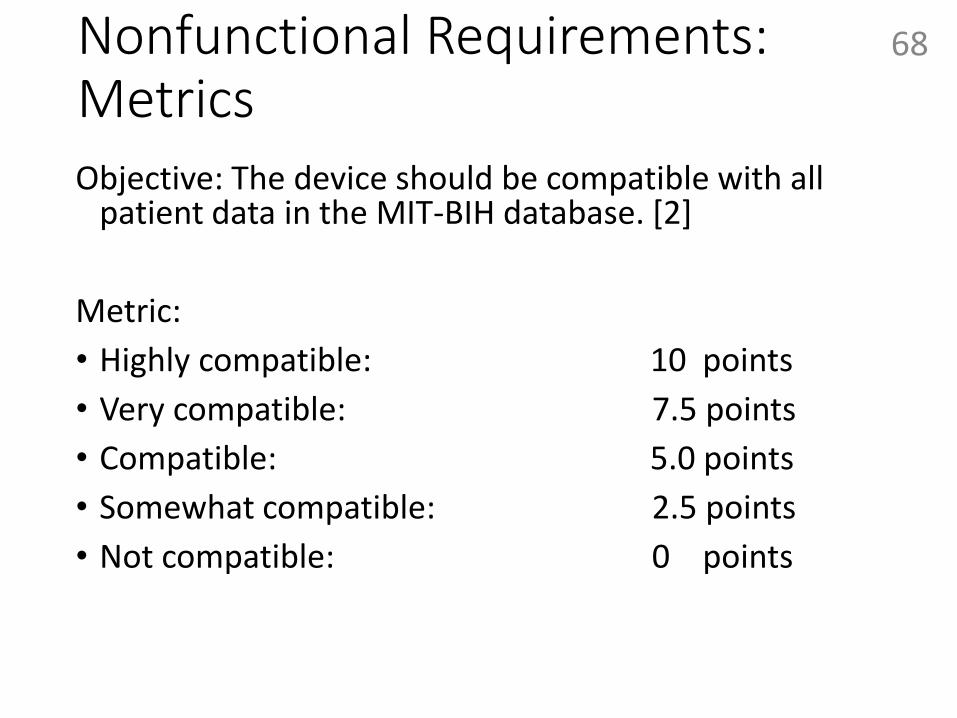
Nonfunctional Requirements: Metrics Objective: The device should be compatible with all
patient data in the MIT-BIH database. [2]
Metric:
• Highly compatible: 10 points
• Very compatible: 7.5 points
• Compatible: 5.0 points
• Somewhat compatible: 2.5 points
• Not compatible: 0 points
68

Nonfunctional Requirements: Metrics Objective: The device should be portable.
Metric:
• Very easy to carry around: 10 points
• Easy to carry around: 7.5 points
• Portable: 5.0 points
• Uncomfortable to carry around: 2.5 points
• Difficult to carry around: 0 points
69

Nonfunctional Requirements: Metrics TABLE XI. QUANTITATIVE PERFORMANCE LEVELS FOR REAL-TIME
HEART MONITORING
Power Consumption
in 24 Hours of
Continuous Use (W)
Price ($)
Value Scaled
1.50 500 10
2.50 600 7.5
3.25 700 5
4.00 800 2.5
4.75 900 0
70
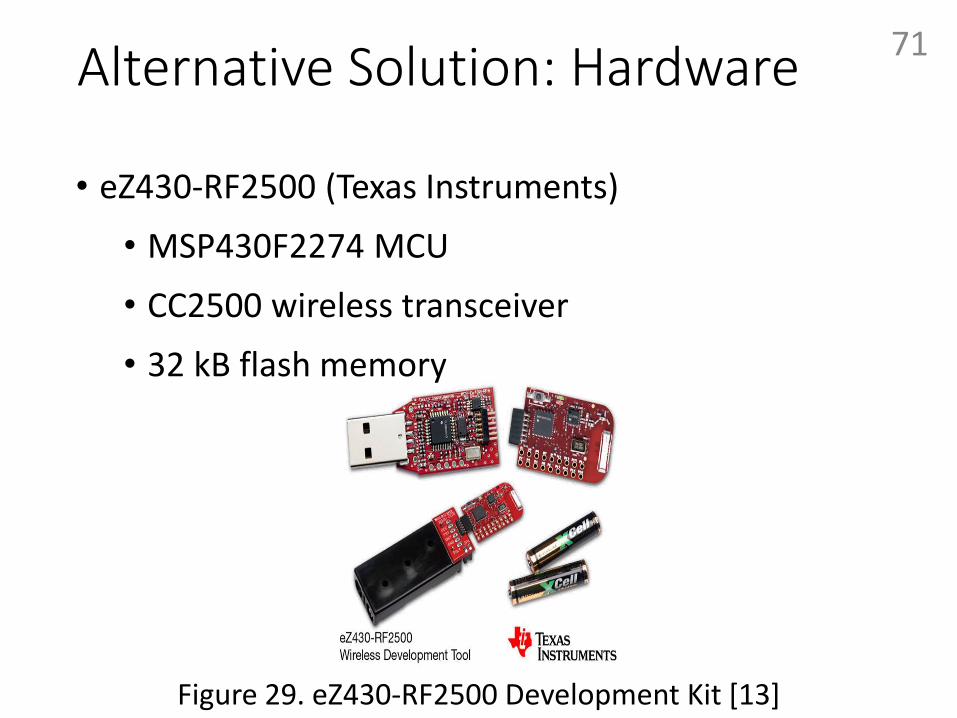
Alternative Solution: Hardware
• eZ430-RF2500 (Texas Instruments)
• MSP430F2274 MCU
• CC2500 wireless transceiver
• 32 kB flash memory
71
Figure 29. eZ430-RF2500 Development Kit [13]

Alternative Solution: Software
• PVC detection
• Wavelet transform algorithm [13]
• RR-interval algorithm [14]
72

Pan-Tompkins Algorithm [5] 73

Pan-Tompkins Algorithm

Pan-Tompkins Algorithm

Algorithm Efficacy, 100s 76
Figure 30. Performance of template-matching algorithm MATLAB simulation

Algorithm Efficacy, 200s 77
Figure 31. Performance of template-matching algorithm MATLAB simulation

WFDB Library (PC side)
• isigopen(): open a specific WFDB record
• getvec(): get the next sample in the record
78

WFDB Toolbox (MATLAB) 79
• rdsamp(): place samples from a WFDB record into a vector
• rdann(): place annotations (characters) from a WFDB record into a vector

WFDB Toolbox (MATLAB)
• wrsann(): write experimental annotations into a vector
• bxb(): generate a report (with accuracy and positive predictivity data) using experimental annotations
80

Sample BXB Report 81
Figure 30. Text file generated using the bxb() function in the WFDB toolbox

Energia and Code Composer Studio
• To be able to load the Energia sketch code from CCS, the libraries were changed to be compatible with Energia’s GNU compiler
• Hardware libraries
• DSP library
82
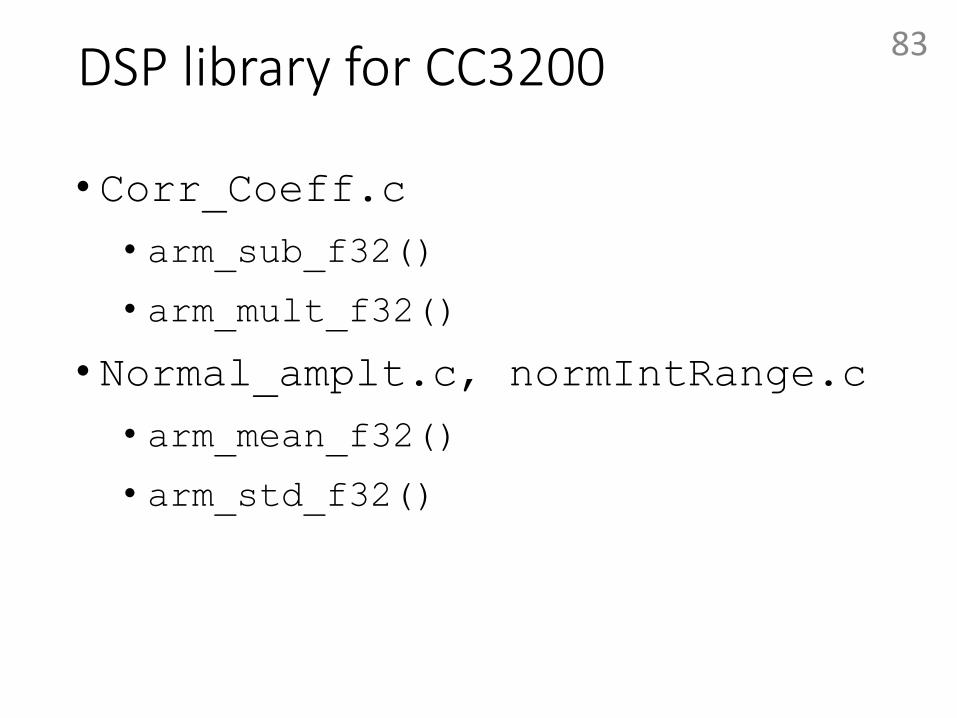
DSP library for CC3200
• Corr_Coeff.c
• arm_sub_f32()
• arm_mult_f32()
• Normal_amplt.c, normIntRange.c
• arm_mean_f32()
• arm_std_f32()
83
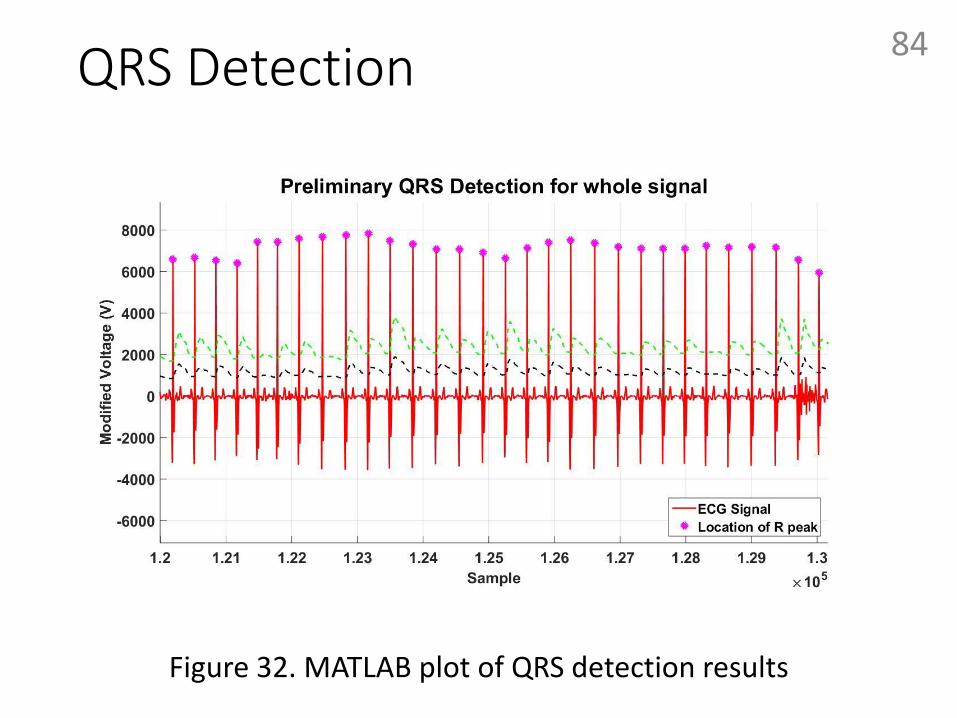
QRS Detection 84
Figure 32. MATLAB plot of QRS detection results

UART Data Transfer 85
Figure 33. UART data transfer flowchart (PC)

UART Data Transfer 86
UDMA Controller UART Interrupt Main Function
Figure 34. UART data transfer flowcharts (CC3200)
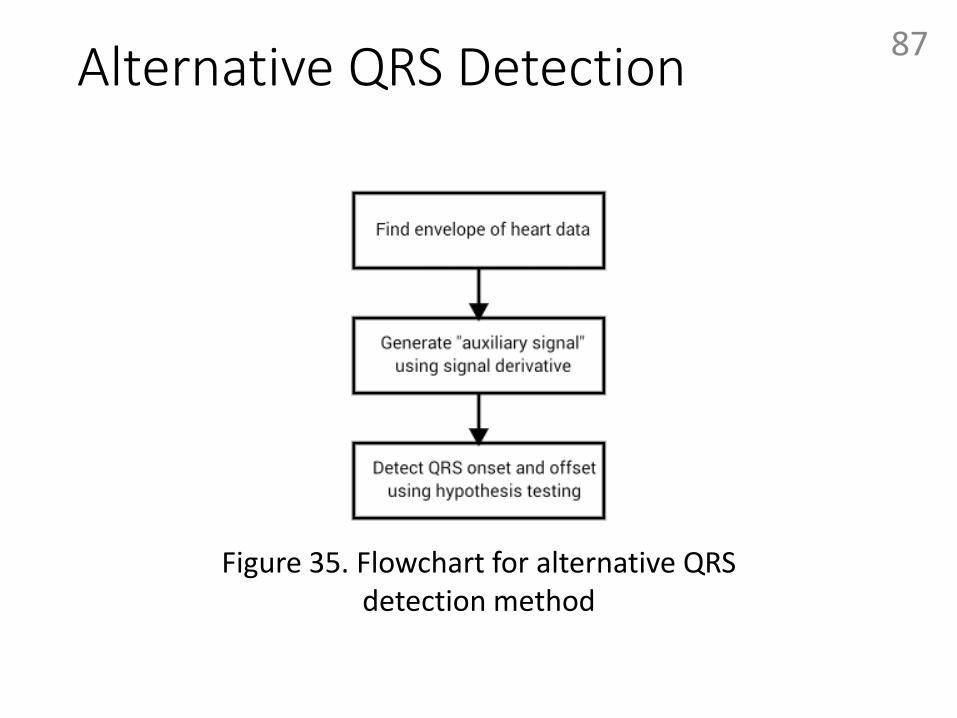
Alternative QRS Detection 87
Figure 35. Flowchart for alternative QRS detection method
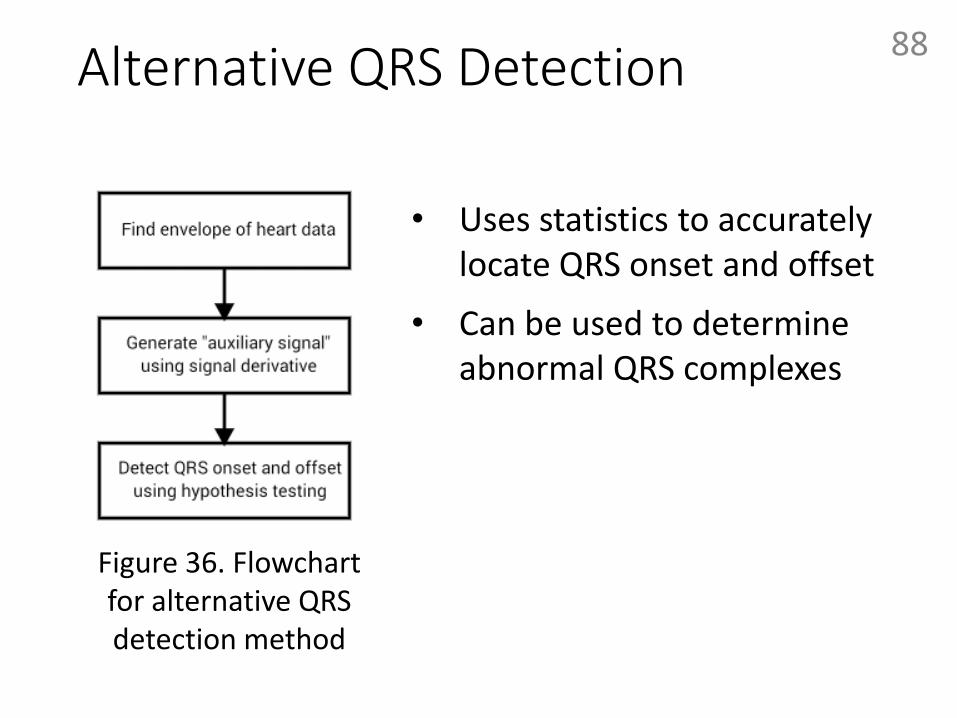
Alternative QRS Detection 88
• Uses statistics to accurately locate QRS onset and offset
• Can be used to determine abnormal QRS complexes
Figure 36. Flowchart for alternative QRS detection method

Alternative QRS Detection 89
• Use the Hilbert transform to obtain the envelope
Figure 37. Flowchart for alternative QRS detection method

Alternative QRS Detection 90
Figure 38. Flowchart for alternative QRS detection method

Alternative QRS Detection 91
• Calculate a cumulative mean for the QRS onset and offset windows
• Determine the probability density functions
Figure 39. Flowchart for alternative QRS detection method

Envelope Signal 92
Figure 40. Envelope of the initial ECG signal
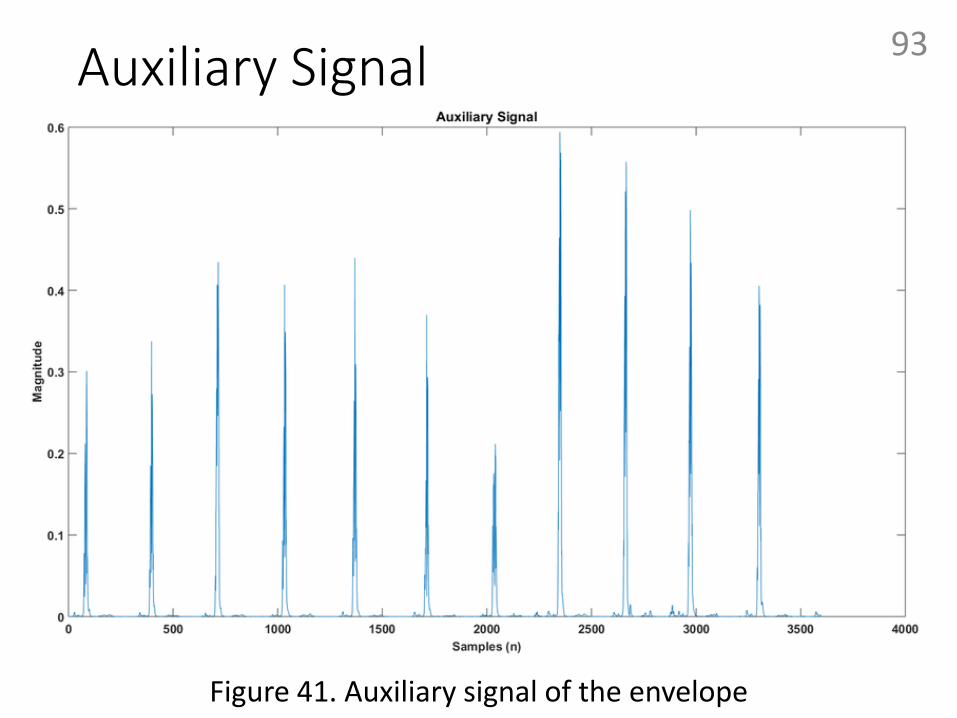
Auxiliary Signal 93
Figure 41. Auxiliary signal of the envelope

C Implementation Results 94
Figure 42. T1 (QRS complex) template generated on the CC3200

C Implementation Results 95
Figure 43. T2 (RR interval) template generated on the CC3200

System Integration
• Issues addressed
• Memory configuration
• Synchronization with PC
96
“done”
PC CC3200
LaunchPad
data buffer
Figure 44. Improved UART testing system

Example (Extrapolation) 97
n value Calculated Index
1 1
2 1.48
3 1.95
4 2.43
5 2.90
TABLE XII. INDICES AFTER EXTRAPOLATION

Wireless - Plotly
• Code language: JavaScript Object Notation (JSON)
• Language independent
• Based on JavaScript, C/C++/C#, Python, Perl, etc.
98
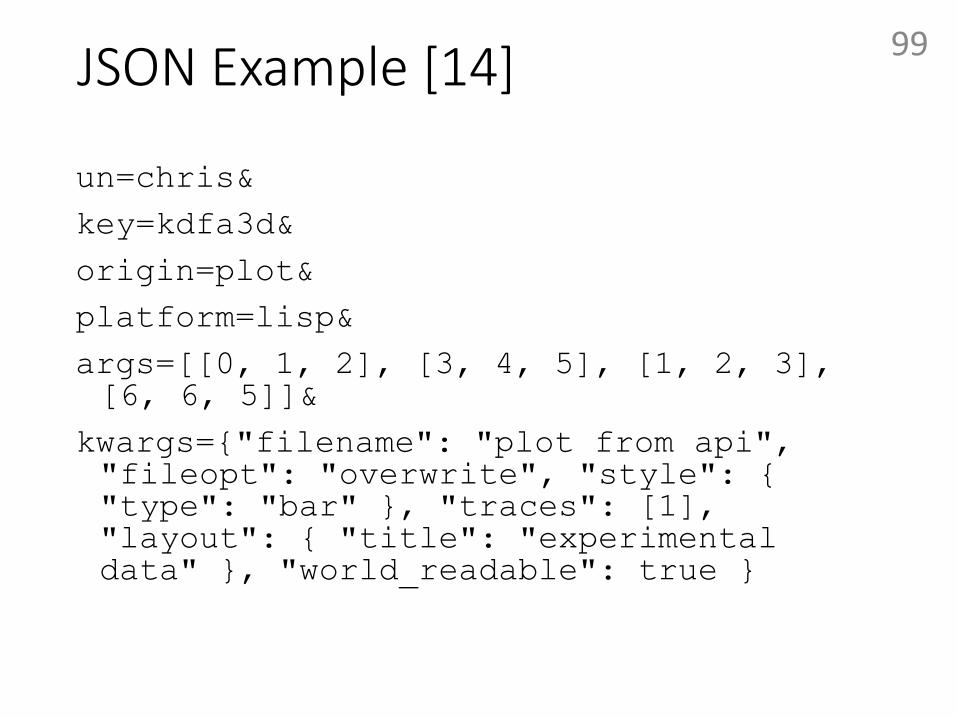
JSON Example [14]
un=chris&
key=kdfa3d&
origin=plot&
platform=lisp&
args=[[0, 1, 2], [3, 4, 5], [1, 2, 3], [6, 6, 5]]&
kwargs={"filename": "plot from api", "fileopt": "overwrite", "style": { "type": "bar" }, "traces": [1], "layout": { "title": "experimental data" }, "world_readable": true }
99

Quadratic Spline Wavelet Transform [8]
100
Order Normalization Coefficient
1 1.5
2 1.12
3 1.03
4 1.01
5 1.00
TABLE XIV. WAVELET TRANSFORM NORMALIZATION COEFFICIENTS
n (sample) H G
-1 0.125
0 0.375 -2.0
1 0.375 2.0
2 0.125
TABLE XIII. WAVELET COEFFICIENTS