real-time control of pig growth through an integrated management system
TRANSCRIPT

ARTICLE IN PRESS
doi:10.1016/j.biosystemseng.2006.10.013AP—Animal Production Technology
Biosystems Engineering (2007) 96 (2), 257–266
Real-time Control of Pig Growth through an Integrated Management System
D.J. Parsons1; D.M. Green2; C.P. Schofield3; C.T. Whittemore4
1Cranfield University, Building 42A, Cranfield, Bedford MK43 0AL, UK;e-mail of corresponding author: [email protected]
2Department of Zoology, University of Oxford, Tinbergen Building, South Parks Road, Oxford OX1 3PS, UK;e-mail: [email protected]
3Silsoe Livestock Systems Ltd., Building 68, Wrest Park, Silsoe, Bedford MK45 4HS, UK; e-mail: [email protected] University of Edinburgh School of Geosciences, Agriculture Building, West Mains Road, Edinburgh EH9 3JG, UK;
e-mail: [email protected]
(Received 7 February 2006; accepted in revised form 21 October 2006; published online 29 November 2006)
This paper describes the development and testing of the first prototype closed-loop, model-based, real-timesystem for the integrated control of pig growth and pollutant emissions. In each of two trials, growing pigswere reared from 30–50 to 65–125 kg in groups of 12 in 12 separate pens under controlled environmentconditions at ADAS Terrington (Norfolk, England). They were fed ad libitum diets in which the proteincontent was controlled for each pen. Weight, estimated by visual image analysis, and feed intake wererecorded daily for each pig. The control system was based on a mechanistic growth model. Each week, twomodel parameters were optimised using the data to improve the prediction, then the diet for each pen wasoptimised by adjusting the crude protein content between 140 and 190 g/kg [dry matter] to minimise the modelerror from a target for weight or fat depth. Part of the trial set weight gain targets of 50 and 60 kg over 70 daysusing two pens for each target. In three of the four pens the final mean weight of the pigs was within 2 kg of thetarget; in the fourth, growth was on target until it was interrupted close to the end of the trial. This trial hasdemonstrated the potential of the system to control the growth rate of pigs and has given encouraging but notconclusive results for the control of back fat depth.r 2006 IAgrE. All rights reserved
Published by Elsevier Ltd
1. Introduction
Today, livestock production systems have multipleobjectives imposed on them. As well as profit, they mustmaintain standards of animal welfare and reduceenvironmental impact (Frost et al., 1997). They havebecome complex interconnected processes: growth,health, welfare, and environmental emissions all dependon the animal’s supply of nutrients. Managing growthby controlling nutrition will therefore affect these otherfactors.Livestock management decisions are based almost
entirely on the judgement and experience of the stock-man, who must estimate or guess the likely effects of anycontrol action, with each of the individual processedinvolved controlled separately. The farm manager willusually apply a prescriptive nutritional regime designed
1537-5110/$32.00 257
in the expectation that it will produce the requiredresult. In a well-managed enterprise, the nutritionalregime will be based on a growth model.
An integrated management system (IMS) is thecombination of livestock models, monitoring equipmentand feed control systems into an automatic systemwhere control of these subsystems is delegated to anautomatic controller (Frost et al., 1997; Whittemoreet al., 2001d). This allows closed-loop control decisionsto be made in real time as and when data are collected.The improved economic efficiency and environmentalgains offered by the IMS approach are becomingincreasingly apparent to industry leaders. Integratedmanagement systems can be used to improve welfare, byenhancing the ability to provide an ideal diet at all times,will allow better control of growth to obtain uniformityin the desired composition and quality, and by not
r 2006 IAgrE. All rights reserved
Published by Elsevier Ltd

ARTICLE IN PRESS
D.J. PARSONS ET AL.258
providing nutrients to excess, reduce environmentalpollution (e.g. nitrogen). This will reduce the time thatfarm staff must spend on decision making about feedprovision, enabling them to concentrate on importantissues such as health and welfare.
Integrated management systems have already beendeveloped for poultry (Frost et al., 2003; Stacey et al.,2004; Aerts et al., 2003a, 2003b). This paper describesthe development of the first prototype closed-loop,model-based, real-time system for the integrated controlof pig growth and pollutant emissions. It demonstratesthe performance of a novel growth controller to achieveset growth rate and fat deposition targets.
2. Materials and methods
2.1. Experimental facilities and data collection
Experiments were carried out at ADAS Terrington,Norfolk, England. Two sets of trials, each with 144 pigsof a commercial breed (JSR white 12 boar-line) wereperformed in controlled environment facilities in sixrooms each containing two pens capable of holding 12pigs up to 100 kg. The temperature was maintained atapproximately 19 1C (which was adjusted if the pigsshowed adverse behavioural responses) and lighting wason a 12/12 h light/dark cycle.
Trial 1 contained equal numbers of male and femalepigs; trial 2 contained males only. In each trial, half ofthe pigs were delivered at a nominal weight of 30 kg, theremainder at 50 kg; pigs of different weights wereallocated to different rooms. There was considerablevariation about the nominal weights, especially in trial 2:the range for the 30 kg pigs was 28–40 kg, and for the50 kg pigs, 39–57 kg.Tables 1 and 2 show the allocation
TableAllocation of pigs and ta
Pen Sex Initial weight (nominal), kg Target weigh
1 F 502 M 503 F 504 M 50
5 F 30 856 M 30 857 F 30 758 M 30 75
9 F 3010 M 3011 F 5012 M 50
of pens and trial targets or treatments. The targets andtreatments are described in more detail in Section 2.5.
Each pen contained a feeder, which measured theweight of feed delivered to each pig at each visit,identified by radio frequency transponders embedded inthe pigs’ ear tags. The pigs were fed ad libitum diets thatvaried in crude protein (CP) content between pens,produced by manually blending two source diets withCP contents of 140 and 190 g/kg [dry matter]. At anytime, all the pigs in a pen received the same diet. Waterwas available ad libitum via nipple drinkers, and thetotal water use per pen was recorded weekly.
The pens had slatted floors and the slurry from eachpen was collected in a separate pit. The total volumecollected in each trial was recorded, and the slurry wassampled and analysed for total (Kjeldahl) nitrogenconcentration. The ventilation rate for each room waslogged at 1min intervals. The ammonia losses weremeasured continually using the acid trap technique(0�02M orthophosphoric acid solution); the acid trapswere changed twice weekly. It was thus possible tocalculate the total mass of nitrogen emitted by the pigsin each pen and the combined weekly emissions ofammonia for each room.
A camera was mounted above each feeder, supplyingimages to a visual image analysis (VIA) system. Thissystem measures areas and linear dimensions andestimates volumes quickly, frequently, and accurately,giving objective assessment of the size, shape, and hencegrowth of individual pigs. It has been shown to estimatethe weights of individual growing pigs with averageerrors under 3�5% (Marchant et al., 1999; Schofieldet al., 1999, 2002; White et al., 2004). The measureddimensions also enable assessment of lean meat andfatness (Doeschl et al., 2004; Doeschl-Wilson et al.,2005). The software was a version of Vista (Osborne
1rgets to pens in trial 1
t, kg Target fat depth, mm Treatment (protein level)
16161212
High (190 g/kg)High (190 g/kg)Low (140 g/kg)Low (140 g/kg)

ARTICLE IN PRESS
Table 2
Allocation of pigs and targets to pens in trial 2
Pen Sex Initial weight (nominal), kg Target weight gain, kg Target fat depth, mm Treatment (protein level)
1 M 50 122 M 50 123 M 50 164 M 50 16
5 M 30 506 M 30 507 M 30 608 M 30 60
9 M 30 Low (140 g/kg)10 M 30 High (190 g/kg)11 M 50 Low (140 g/kg)12 M 50 High (190 g/kg)
REAL-TIME CONTROL OF PIG GROWTH THROUGH AN INTEGRATED MANAGEMENT SYSTEM 259
(Europe) Ltd., North Shields, England) adapted to usethe same identification transponders as the feeder andprovide the data needed for the model and controlprogram. It recorded the daily median values for weightand 12 physical dimensions for each pig in the herd.Pigs were also weighed manually weekly, and backfat
depth measurements were taken at the P2 position(65mm from the midline at the last rib) using anultrasound scanner fitted with a 3.5MHz veterinaryexternal probe (Concept MLV, Dynamic Imaging Ltd.,Livingston, Scotland). Initial collation and processing ofthe collected data was carried out automatically by thecomputer on-farm. The processed data was thentransferred to Silsoe Research Institute at least once aweek for further processing.In the initial stages of trial 1, faults in the feed delivery
and monitoring equipment meant that there wereperiods for which the data were unreliable until repairscould be made. The worst affected pens were 1 and 5,but several others had shorter interruptions. These wereresolved, so there were few problems in trial 2.
2.2. Growth model
The system was based on a mechanistic model of piggrowth, as described by Green and Whittemore (2003,2005), using algorithms described by Whittemore et al.(2001a, 2001b, 2001c). This model predicts the growth ofan individual pig through change in composition given adescription of the current status, growth potential, feedintake, and environment of the pig.The pigs were allowed to become acclimatised to the
feeding system for 5 days, during which both the intakeand VIA data were discarded. Following this period, themedian of the VIA-derived weights for the next 3 days
was taken as the initial value for the model. Using themedian guarded against occasional false readings. Theinitial fatness (lipid weight/body weight) of the pigs F0
was unknown, so it was set according to the initialweight W0 in kg based on typical values observed intrials conducted during the development of the system:
F0
0�1 W 0p35
0�269� 5�924=W 0 W 0435
((1)
Once initialised, the model was run using the recordedfeed intakes for individuals and the blends supplied topens as inputs, after filtering the data to removeoccasional errors in the recording system. The mean-squared error of prediction (MSEP) compared with theVIA estimated weight was calculated for each pig andthe sum of these was used as a measure of how well themodel fitted the data for a given pen.
In general, the unfitted model performed well (see theresults below), but tended to underpredict the growthrate slightly. The agreement varied between pigs andbetween pens, due to slight variations in genotype,environment, health status and behaviour. This wasexpected and the system included a mechanism to adjustthe model parameters in response to observations.
2.3. Model adaptation mechanism
The system was designed to allow selected modelparameters to be optimised within defined ranges tominimise the MSEP. The optimisation used the non-linear revised simplex method of Nelder and Mead(1965) in a modified form that allowed constraints to beimposed (see Appendix A). Experiments were conductedwith other data sets using single parameters or up tothree optimised jointly; good adaptation, without

ARTICLE IN PRESS
D.J. PARSONS ET AL.260
biologically unrealistic values, was obtained by optimis-ing two parameters simultaneously. One of these,referred to as the ‘illness factor’ Fdisease (dimensionless),controlled the efficiency of use of dietary suppliednutrients (Green &Whittemore, 2005). This was allowedto vary over a range of 0�1–1�9 times its nominal value(3�0), where a low value represents high efficiency (goodhealth). The other parameter B in d�1 controlled themaximum protein retention rate (Green & Whittemore,2005), and was better determined, so was given a rangeof 0�7–1�3 times its nominal value.
2.4. Controller
When the system was required to make a controldecision the model was first adapted for each individualin the pen using the data up to that time, as described inSection 2.3 above, in order to improve its prediction offuture growth. The individual models were then usedpredictively to model growth up to the end of the trial.In order to do so, a forecast of feed intake was requiredfor each pig. Modelling voluntary intake is difficult andunreliable, and may best be obtained by observation(Schinkel & de Lange, 1996), so intake profiles werederived from results recorded in earlier trials (Green et
al., 2003). In trial 1, it was assumed that the pigs wouldfollow these profiles. In trial 2, they were adjusted by thecontrol system to account for variations between pigs, asfollows. The mean ratio between the actual intake andthe intake profile for the previous 14 days was calculatedfor each pig. It was then assumed that it would continueto consume the same proportion of the intake profile forthe next 14 days, then return to the profile over the next14. This damped out daily fluctuations, while allowingsubstantial changes in intake to be accommodated, butremained conservative about long-term intake patterns.
The controller then optimised the dietary blend, andhence the CP content, to minimise the MSEP from thetarget for the remaining period. As the blend could onlybe controlled at the pen level, the objective function usedwas the sum of the MSEPs of all the pigs in the pen.There were separate sub-trials attempting to controlweight and fat depth; joint control of both may berequired in practice, so the objective function used aweighted sum of the errors in both variables. Further-more, the objectives could be set either as a trajectory,that is a value for each day, or as up to four discretepoints. Trial 1 used trajectories and trial 2 set targetvalues for the end of the trial (day 70) only.
There was a single control variable, the dietary blend,but this could in principle be varied each day, giving upto 70 dimensions. This was reduced by having a controlvariable trajectory, in the form of a piecewise linearfunction, whose slope changed at discrete, equally
spaced nodes. Tests showed that the MSEP betweentarget and prediction reduced as the number of nodeswas increased from one to four, but showed insignificantimprovement beyond four nodes. The optimisationproblem was thus reduced to four dimensions. Theslope was constrained to restrict the rate of change ofthe protein content. If the slope took the blend for anyday outside the range [0,1], it was simply assumed totake the limiting value. A small penalty was added to theobjective function when this happened, because itimproved the efficiency of the optimisation by reducingthe time spent exploring irrelevant regions of the controlspace.
Several optimisation algorithms were tested, includinggenetic algorithms, quasi-Newton methods and the non-linear revised simplex method. The genetic algorithmswere robust, that is, not prone to instability andconsistent in finding the optimum, but they were slow.The quasi-Newton methods were capable of highprecision, which was not required in practice, andbecame slow, or even unstable, in the presence of the fullset of constraints. The constraints that representedsimple bounds on the variables were eliminated bytransforming the state space using a sine function totransform an unbounded variable to a bounded one, butthis did not improve the performance significantly. Themean speed of the revised simplex method was greaterthan the other methods, it remained stable, and theprecision was acceptable, considering the precision thatcould practically be achieved in blending the feeds. Thiscombination of features made it most the suitablemethod, and it was therefore used in all the trials.
2.5. Targets and treatments
The targets and treatments used in the two trials areshown in Tables 1 and 2. In each trial, the pigs in pens1–4 were used for a sub-trial in which the targets wereset as final P2 back fat depths. The pigs in pens 5–8 wereused for a sub-trial with final weight targets. However,due to the large variation in initial weight within eachpen in trial 2, the targets for this trial were set in terms ofweight gain rather than target weight. The target weightgains were 5 kg higher than those for trial 1, because thehealth of the pigs in the early stages of the trial wasbetter, which enabled them to grow more quickly.
No targets were set for the pigs in pens 9–12. Thesewere given fixed diets throughout using the high (190 g/kg) and low (140 g/kg) protein feeds without blending inorder to promote the development of contrasting bodyconformation as part of the analysis of the visualimaging system results. These pigs, therefore, were notused in the controller trial, but were included in themodel and adaptation testing.

ARTICLE IN PRESS
REAL-TIME CONTROL OF PIG GROWTH THROUGH AN INTEGRATED MANAGEMENT SYSTEM 261
3. Results and discussion
3.1. Growth model and model adaptation
In assessing the system performance, it is the ability topredict and control the liveweight of the pigs that ismost important, rather than the prediction by the modelof the VIA estimate of weight. All of the trial resultswere therefore compared with the results of manualweighings and P2 back fat assessments made shortlybefore slaughter. Tables 3 and 4 summarise the ability ofthe model to predict the final weight and fat depth fortrials 1 and 2, respectively. The results are shown for theinitial values of the two parameters used for adaptationand after optimising them at the end of the trial.
Tabl
Results of optimising the mode
Pen Final numberof pigs
RMSEP of weight beforeoptimisation, kg
RMSEP of weightoptimisation, kg
1 9 3�81 5�822 10 21�43 9�013 6 9�91 7�114 7 16�98 8�795 12 5�40 6�556 11 5�29 3�807 11 7�54 3�468 11 8�43 3�729 8 2�91 3�3310 7 5�45 6�1611 8 13�74 5�7312 10 10�97 3�94Herd 110 10�61 5�79
RMSEP, residual mean-squared error or prediction.
Tabl
Results of optimising the mode
Pen Final numberof pigs
RMSEP of weight beforeoptimisation, kg
RMSEP of weightoptimisation, kg
1 12 5�80 6�352 12 8�48 2�523 12 10�24 4�814 12 5�71 3�665 11 13�69 8�456 11 9�59 3�527 12 7�08 6�158 6 8�54 2�489 12 7�23 3�9710 12 7�28 3�6711 8 9�10 2�9212 12 5�60 5�80Herd 132 8�41 4�95
RMSEP, residual mean-squared error or prediction.
It can be seen that the overall agreement between themodel and the observed final weights was slightly betterin trial 2 than trial 1. In both trials, optimising the modelparameters at the end of the run using the VIA weightestimates reduced the root-mean-squared error ofprediction (RMSEP) of the model compared withmanual weights for the herd by about half. In each trialthere were a few cases where the optimisation increasedthe RMSEP slightly for a pen; generally when theagreement was already good. The largest increase was intrial 1 pen 5, which was due intermittent substantial VIAoverestimates of the weights of some of the pigs, whichcaused the optimisation to increase the prediction abovethe true weights, which were used in the calculation ofthe RMSEP. Better filtering of these outlying values
e 3
l at the end of run in trial 1
after RMSEP of fat depth beforeoptimisation, mm
RMSEP of fat depth afteroptimisation, mm
3�20 3�283�37 4�022�81 3�613�65 4�352�35 3�091�33 1�842�62 3�071�94 2�171�93 2�131�94 2�152�92 2�793�47 3�752�69 3�05
e 4
l at the end of run in trial 2
after RMSEP of fat depth beforeoptimisation, mm
RMSEP of fat depth afteroptimisation, mm
3�47 3�661�89 2�473�32 3�483�52 3�403�59 3�761�77 1�822�55 2�342�43 2�672�02 2�021�64 1�772�88 2�852�52 2�262�73 2�80
ARTICLE IN PRESS
100
80
60
40
20
00 10 20 30
Day
40 50 60 70
Wei
ght,
kg
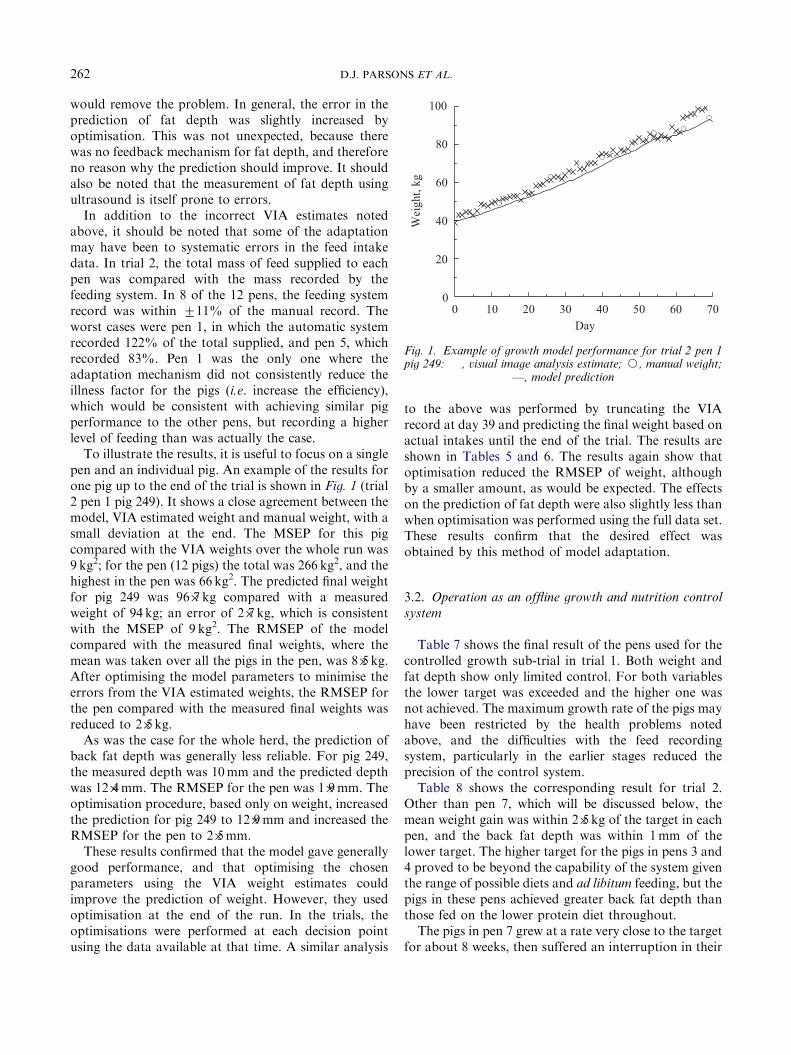
Fig. 1. Example of growth model performance for trial 2 pen 1pig 249: � , visual image analysis estimate; J, manual weight;
—, model prediction
D.J. PARSONS ET AL.262
would remove the problem. In general, the error in theprediction of fat depth was slightly increased byoptimisation. This was not unexpected, because therewas no feedback mechanism for fat depth, and thereforeno reason why the prediction should improve. It shouldalso be noted that the measurement of fat depth usingultrasound is itself prone to errors.
In addition to the incorrect VIA estimates notedabove, it should be noted that some of the adaptationmay have been to systematic errors in the feed intakedata. In trial 2, the total mass of feed supplied to eachpen was compared with the mass recorded by thefeeding system. In 8 of the 12 pens, the feeding systemrecord was within 711% of the manual record. Theworst cases were pen 1, in which the automatic systemrecorded 122% of the total supplied, and pen 5, whichrecorded 83%. Pen 1 was the only one where theadaptation mechanism did not consistently reduce theillness factor for the pigs (i.e. increase the efficiency),which would be consistent with achieving similar pigperformance to the other pens, but recording a higherlevel of feeding than was actually the case.
To illustrate the results, it is useful to focus on a singlepen and an individual pig. An example of the results forone pig up to the end of the trial is shown in Fig. 1 (trial2 pen 1 pig 249). It shows a close agreement between themodel, VIA estimated weight and manual weight, with asmall deviation at the end. The MSEP for this pigcompared with the VIA weights over the whole run was9 kg2; for the pen (12 pigs) the total was 266 kg2, and thehighest in the pen was 66 kg2. The predicted final weightfor pig 249 was 96�7 kg compared with a measuredweight of 94 kg; an error of 2�7 kg, which is consistentwith the MSEP of 9 kg2. The RMSEP of the modelcompared with the measured final weights, where themean was taken over all the pigs in the pen, was 8�5 kg.After optimising the model parameters to minimise theerrors from the VIA estimated weights, the RMSEP forthe pen compared with the measured final weights wasreduced to 2�5 kg.
As was the case for the whole herd, the prediction ofback fat depth was generally less reliable. For pig 249,the measured depth was 10mm and the predicted depthwas 12�4mm. The RMSEP for the pen was 1�9mm. Theoptimisation procedure, based only on weight, increasedthe prediction for pig 249 to 12�9mm and increased theRMSEP for the pen to 2�5mm.
These results confirmed that the model gave generallygood performance, and that optimising the chosenparameters using the VIA weight estimates couldimprove the prediction of weight. However, they usedoptimisation at the end of the run. In the trials, theoptimisations were performed at each decision pointusing the data available at that time. A similar analysis
to the above was performed by truncating the VIArecord at day 39 and predicting the final weight based onactual intakes until the end of the trial. The results areshown in Tables 5 and 6. The results again show thatoptimisation reduced the RMSEP of weight, althoughby a smaller amount, as would be expected. The effectson the prediction of fat depth were also slightly less thanwhen optimisation was performed using the full data set.These results confirm that the desired effect wasobtained by this method of model adaptation.
3.2. Operation as an offline growth and nutrition control
system
Table 7 shows the final result of the pens used for thecontrolled growth sub-trial in trial 1. Both weight andfat depth show only limited control. For both variablesthe lower target was exceeded and the higher one wasnot achieved. The maximum growth rate of the pigs mayhave been restricted by the health problems notedabove, and the difficulties with the feed recordingsystem, particularly in the earlier stages reduced theprecision of the control system.
Table 8 shows the corresponding result for trial 2.Other than pen 7, which will be discussed below, themean weight gain was within 2�5 kg of the target in eachpen, and the back fat depth was within 1mm of thelower target. The higher target for the pigs in pens 3 and4 proved to be beyond the capability of the system giventhe range of possible diets and ad libitum feeding, but thepigs in these pens achieved greater back fat depth thanthose fed on the lower protein diet throughout.
The pigs in pen 7 grew at a rate very close to the targetfor about 8 weeks, then suffered an interruption in their

ARTICLE IN PRESS
Table 5
Results of the model at the end of run after optimising at day 39 in trial 1
Pen Final numberof pigs
RMSEP of weight beforeoptimisation, kg
RMSEP of weight afteroptimisation, kg
RMSEP of fat depth beforeoptimisation, mm
RMSEP of fat depth afteroptimisation, mm
1 9 3�81 7�54 3�20 3�452 10 21�43 11�67 3�37 3�973 6 9�91 9�39 2�81 3�134 7 16�98 9�75 3�65 4�395 12 5�40 7�45 2�35 3�056 11 5�29 5�73 1�33 1�997 11 7�54 4�41 2�62 3�088 11 8�43 5�22 1�94 2�259 8 2�91 5�01 1�93 2�0910 7 5�45 8�59 1�94 1�7711 8 13�74 7�59 2�92 2�8112 10 10�97 3�95 3�47 3�75Herd 110 10�61 7�43 2�69 3�05
RMSEP, residual mean-squared error or prediction.
Table 6
Results of the model at the end of run after optimising at day 39 in trial 2
Pen Final numberof pigs
RMSEP of weight beforeoptimisation, kg
RMSEP of weight afteroptimisation, kg
RMSEP of fat depth beforeoptimisation, mm
RMSEP of fat depth afteroptimisation, mm
1 12 5�80 10�75 3�47 3�062 12 8�48 2�95 1�89 2�353 12 10�24 4�77 3�32 3�484 12 5�71 3�69 3�52 3�445 11 13�69 8�45 3�59 3�766 11 9�59 3�55 1�77 1�827 12 7�08 9�06 2�55 2�178 6 8�54 2�18 2�43 2�669 12 7�23 4�15 2�02 2�0210 12 7�28 3�90 1�64 1�8411 8 9�10 8�15 2�88 2�9412 12 5�60 6�47 2�52 2�29Herd 132 8�41 6�33 2�73 2�72
RMSEP, residual mean-squared error or prediction.
Table 7
Results of trial 1: mean deviation from target (standard error)
Pen Target weight, kg Target fat depth, mm Mean deviation of weightfrom target, kg
Mean deviation of fat depthfrom target, mm
1 16 �2�5 (2�9)2 16 �0�4 (0�7)3 12 2�3 (2�4)4 12 1�9 (2�8)5 85 �4�0 (2�2)6 85 �2�3 (2�3)7 75 0�9 (2�0)8 75 1�5 (3�2)
REAL-TIME CONTROL OF PIG GROWTH THROUGH AN INTEGRATED MANAGEMENT SYSTEM 263
growth, for reasons that cannot be determined, asshown in Fig. 2. Although they then started to recover,there was insufficient time for the controller to returnthem to the target. Their mean deviation from the targeton day 54 was �2�3 kg.
3.3. Other potential benefits
In the course of the trials, it became clear that thecombination of continuous monitoring of intake and thevisual image of the pigs provided the potential for

ARTICLE IN PRESS
Table 8
Results of trial 2: mean deviation from target (standard error)
Pen Target weight gain,kg
Target fat depth, mm Mean deviation of weightgain from target, kg
Mean deviation of fat depthfrom target, mm
1 12 �0�9 (0�53)2 12 0�2 (0�60)3 16 �2�1 (0�72)4 16 �2�4 (0�68)5 50 2�1 (2�4)6 50 2�3 (0�9)7 60 �5�8 (1�5)�
8 60 2�0 (2�4)
��2�3 kg on day 54.
100
80
60
40
20
00 10 20 30
Day
40 50 60 70
Wei
ght,
kg
Fig. 2. Growth of one pig in trial 2, pen 7, showing theinterruption in growth around days 54–64: � , visual image
analysis estimate; J, manual weight; —, model prediction
D.J. PARSONS ET AL.264
sophisticated problem detection. When a pig becamelame, the change in posture often produced a suddenchange in the area (shape) recorded by the VIA system,well before any effect on weight was detectable. If thefeed intake of a pig dropped this was often notimmediately obvious from the intake records, becauseintake was quite variable from day to day. The weightestimate from the VIA system usually required severaldays before the decline in growth rate, or weight loss,was obvious. The weight gain predicted by the modeloften responded more quickly because some of the timeconstants in the model were shorter than in themetabolism of the animals. However, the magnitude ofthe change was usually comparable. On the other hand,a reduction in weight gain, or actual weight lossestimated by the VIA system when the model predictedcontinued growth, showed that intake was unaffected,but conversion efficiency was dropping, probably as aresult of disease or other problems, such as scouring. Byadding software to monitor the intake, VIA records,
model predictions and possibly the corrections made bythe adaptation algorithm over several days, the herds-man could be automatically alerted to health andwelfare problems.
It was suggested in the introduction that IMS couldoffer environmental benefits, particularly by makingmore efficient use of protein in feeds to reduce nitrogenemissions. In the trials, the total nitrogen emitted inslurry (aggregated by pen) and ammonia (aggregated bypair of pens) were recorded. The ammonia emissionswere allocated to pens in the same ratio as the recordedslurry nitrogen; since the ammonia typically accountedfor about 3% of the nitrogen emitted, the errors thiscould introduce were small. Using these data for trial 2,the mean emission of nitrogen from the pigs in thecontrolled weight gain sub-trial (pens 5–8) was 35 g/kgweight gained. Those in pens 5, 6, and 8 emitted only30–31 g/kg, but those in pen 7, where growth problemswere observed in week 8, emitted 49 g/kg. The meanemission from the pigs on fixed feeding (pens 9–12) was45 g/kg and from those in the fat gain sub-trial (pens1–4) 51 g/kg. There were insufficient data to estimate thevariances of the emission estimates, but the tentativeconclusion from these data is that successful controlledweight gain could reduce nitrogen emissions substan-tially. Although the data were inadequate for propervalidation, the trend in the prediction of nitrogenemissions by the model was correct within each trial.In theory, it would be possible to add a total nitrogenemission objective or constraint to the control system, toreduce the environmental burdens produced; the resultsobtained so far show that this merits further study.Controlling ammonia emission would be more complex,because it depends on environmental and behaviouralfactors.
4. Conclusions
The present study has shown that pig growth modeloptimisation can be performed in real time using visual

ARTICLE IN PRESS
REAL-TIME CONTROL OF PIG GROWTH THROUGH AN INTEGRATED MANAGEMENT SYSTEM 265
image analysis (VIA) data, and that weight gain in pigscan be controlled through an integrated managementsystem using ad libitum feeding and a range of diet crudeprotein (CP) content.The results also indicate that some control of fat
depth may also be possible, although the range of dietsavailable to the trial meant that it was not possible totest this fully. Ideally, some form of feedback of fatcontent would be required, possibly by deriving aconformation measure from the VIA variables.Successful feeding for controlled weight gain appears
to reduce the total emissions of nitrogen. In principle,the system could be extended to include this as anobjective or a constraint.If VIA monitoring and intake recording were in
operation, advanced detection of some health andwelfare problems would become possible with littleadditional cost.
Acknowledgements
This work was funded under the UK Defra LINKSustainable Livestock Production Programme. Theauthors acknowledge the support of the sponsors:MLC, BOCM PAULS Ltd, PIC (UK) Ltd., andOsborne (Europe) Ltd. Experiments were conducted atADAS Terrington, Norfolk.
References
Aerts J -M; Wathes C M; Berckmans D (2003a). Dynamicdata-based modelling of heat production and growth ofbroiler chickens: development of an integrated managementsystem. Biosystems Engineering, 84, 257–266
Aerts J -M; Lippens M; De Groote G; Buyse J; Decuypere E;
Vranken E; Berckmans D (2003b). Recursive prediction ofbroiler growth response to food intake by using a time-variant parameter estimation method. Poultry Science, 82,40–49
Box M J (1965). A new method of constrained optimizationand a comparison with other methods. Computer Journal, 8,42–52
Doeschl A B; Green D M; Whittemore C T; Schofield C P;Fisher A V; Knap P W (2004). The relationship between thebody shape of living pigs and their carcass morphology andcomposition. Animal Science, 79, 73–83
Doeschl-Wilson A B; Green D M; Fisher A V; Carrol S;Schofield C P; Whittemore C T (2005). The relationshipbetween body dimensions of living pigs and their carcasscomposition. Meat Science, 70, 229–240
Frost A R; Schofield C P; Beaulah S A; Mottram T T; Lines JA; Wathes C M (1997). A review of livestock monitoring andthe need for integrated systems. Computers and Electronicsin Agriculture, 17, 139–159
Frost A R; Parsons D J; Stacey K F; Robertson A P; Welch S K;Filmer D; Fothergill A (2003). Progress towards thedevelopment of an integrated management system for
broiler chicken production. Computers and Electronics inAgriculture, 39, 227–240
Green D M; Brotherstone S; Schofield C P; Whittemore C T
(2003). Food intake and live growth performance of pigsmeasured automatically and continuously from 25 to 115 kglive weight. Journal of the Science of Food and Agriculture,83, 1150–1155
Green D M; Whittemore C T (2003). Architecture of aharmonised model of the growing pig for the determinationof dietary net energy and protein requirements and ofexcretions into the environment (IMS Pig). Animal Science,77, 113–130
Green D M; Whittemore C T (2005). Calibration andsensitivity analysis of a model of the growing pig for weightgain and composition. Agricultural Systems, 84, 279–285
Marchant J A; Schofield C P; White R P (1999). Pig growthand conformation monitoring using image analysis. AnimalScience, 68, 141–150
Nelder J A; Mead R (1965). A simplex method for functionminimization. Computer Journal, 7, 308–313
Parkinson J M; Hutchinson D (1972). An investigation into theefficiency of variants on the simplex method. In: NumericalMethods for Non-linear Optimization (Lootsma F A, ed),pp 115–135. Academic Press, London
Parsons D J (1992) Performance of constrained forms of thesimplex method for nonlinear optimization. Technical NoteTN 003, Silsoe Research Institute, Bedford (unpublished).
Schinckel A P; de Lange C F M (1996). Characterization ofgrowth parameters needed as inputs for pig growth models.Journal of Animal Science, 74, 2021–2036
Schofield C P; Wathes C M; Frost A R (2002). Integratedmanagement systems for pigs—increasing production effi-ciency and welfare. Animal Production in Australia, 24,
197–200Schofield C P; Marchant J A; White R P; Brandle N; Wilson M
(1999). Monitoring pig growth using a prototype imagingsystem. Journal of Agricultural Engineering Research, 72,205–210
Spendley W; Hext G R; Himsworth F (1962). Sequentialapplications of simplex designs in optimisation and evolu-tionary operation. Technometrics, 4, 441–461
Stacey K F; Parsons D J; Frost A R; Fisher C; Filmer D;
Fothergill A (2004). An automatic growth and nutritioncontrol system for broiler production. Biosystems Engineer-ing, 89, 363–371
Subrahmanyam M B (1989). An extension of the simplexmethod to constrained nonlinear optimization. Journal ofOptimization Theory and Applications, 62, 311–319
White R P; Schofield C P; Green D M; Parsons D J;
Whittemore C T (2004). The effectiveness of a visual imageanalysis (VIA) system for monitoring the performance ofgrowing/finishing pigs. Animal Science, 78, 409–418
Whittemore C T; Green D M; Knap P W (2001a). Technicalreview of the energy and protein requirements of growingpigs: food intake. Animal Science, 73, 3–17
Whittemore C T; Green D M; Knap P W (2001b). Technicalreview of the energy and protein requirements of growingpigs: energy. Animal Science, 73, 199–215
Whittemore C T; Green D M; Knap P W (2001c). Technicalreview of the energy and protein requirements of growingpigs: protein. Animal Science, 73, 363–374
Whittemore C T; Green D M; Schofield C P (2001d). Nutritionmanagement of growing pigs. In: Integrated ManagementSystems for Livestock, BSAS Occasional Publication No. 28

ARTICLE IN PRESS
D.J. PARSONS ET AL.266
(Wathes C M; Frost A R; Gordon F; Wood J D, eds), pp89–95. British Society of Animal Science, Edinburgh
Appendix A: Constraining the revised simplex method
Since its publication, the revised simplex method (RSM)(Nelder & Mead, 1965) has proved popular in many non-linearoptimisation applications where function derivatives are notavailable, despite its poor performance in higher dimensions,for the same reasons that it was used in this research: simplicityand robustness. The RSM was based on the earlier simplexmethod of Spendley et al. (1962); the key difference being thatthe RSM allowed the simplex to change shape to adapt to thetopography of the search space. A limitation of both methodswas the absence of an inbuilt method of handling constraints.Box (1965) found that introducing constraints into the originalsimplex method in the form of barrier functions often led tothe simplex collapsing to a false optimum at a barrier. Themethod proposed by Box, the complex method, allowed thenumber of points used to increase. However, this was in part aresponse to the limitations already addressed by Nelder andMead. More recently, Subrahmanyam (1989) proposed an-other constrained version by introducing a new delayedreflection operation to prevent the simplex collapsing (thedelayed reflection method, DRM). However, this was com-paratively complex to implement, negating one of theattractions of the method.
The method used in this study was based on unpublishedwork by Parsons (1992) that tested several simple methods ofapplying constraints to the RSM for a range of test problems.The method chosen was referred to as the new maximummethod (NMM). When a new point is generated for possibleinclusion in the simplex, it is first tested for violation of any ofthe constraints. If a constraint is violated (referred to as aninfeasible point), the new point is assigned a value mid-waybetween the current maximum (i.e. the worst point) and thenext highest point in the simplex. This allows it to be includedin the simplex, reducing the likelihood of it collapsing, butensures that no more than one point is infeasible at any time,subject to the constraint that all of the points in the initialsimplex were feasible. The only overhead is thus the need to
keep track of one point in addition to the maximum andminimum.
A modification of the RSM proposed by Parkinson andHutchinson (1972) was also included. They noted that theRSM was inefficient where progress could be made by descentin a single direction on a scale substantially larger than thesimplex (visualise a long downhill run), because this requiredseveral complete iterations, and could lead to elongation of thesimplex. By introducing an operation that they calledunlimited expansion and translation they reduced multipleiterations in the same direction to one.
The NMM was tested against fixed penalty (barrier)methods and others that allowed more infeasible points toenter the simplex, using a set of test problems with a sets ofconstraints that placed the minimum in a ‘corner’ of thefeasible region in 5 dimensions, or set very tight bounds on oneof the variables. The NMM gave the best performance onthese problems and was the only one that consistently gave thecorrect result for the second type. It succeeded by adaptingbetter to the geometry of the search space. The inclusion ofunlimited expansion and translation was beneficial where theconstraints forced a reduction in the scale of the simplex.
The NMM with unlimited expansion and translation wasthen compared with the results published by Subrahmanyamfor the DRM using four test problems with non-linearconstraints that were designed to be challenging. In two ofthese the NMM gave better results than the DRM, finding theoptimum with equivalent or higher precision in many feweriterations. In the third, which included an equality constraint,the DRM required 10 times as many iterations as the NMM,but achieved higher precision. Restarting the NMM allowed itto achieve similar precision to the DRM, but with moreiterations. Whenever possible, equality constraints should beeliminated by reformulating the problem to reduce thedimension. In this case, it resulted in a problem with linearconstraints, for which the NMM performed well. The fourthproblem used a seven-dimensional objective function with fourconstraints in five variables each. The NMM achievedsignificantly lower precision than the DRM.
It was concluded that the NMMwas the best of the methodstested, except for high-dimensional problems with complexnon-linear constraints. It was therefore well suited to theapplication described in this paper.