real money and the crash of ‘08catalogimages.wiley.com/images/db/pdf/9780470607534... · ·...
TRANSCRIPT

P1: OTA/XYZ P2: ABCc01 JWBT268-Drobny March 2, 2010 21:2 Printer Name: To Come
Part One
REAL MONEY AND THE CRASHOF ‘08
Those who cannot remember the past are condemned to repeat it.
—George Santayana
1
COPYRIG
HTED M
ATERIAL

P1: OTA/XYZ P2: ABCc01 JWBT268-Drobny March 2, 2010 21:2 Printer Name: To Come
2

P1: OTA/XYZ P2: ABCc01 JWBT268-Drobny March 2, 2010 21:2 Printer Name: To Come
Chapter 1
Rethinking Real Money
I. Why Real Money?
Real money is a commonly used term in the financial markets to de-note a fully funded, long-only traditional asset manager. Real moneymanagers are often referred to as institutional investors. The term realmoney means the money is managed on an unlevered basis. This contrastswith hedge funds, which often manage money using borrowed funds orleverage. Real money funds can and often do employ leverage, but theynormally attain leverage on a nonrecourse basis (e.g., investing as a lim-ited partner in a fund that is levered). Examples of real money managersare public and private pension funds, university endowments, insurancecompany portfolios, foundations, family offices, sovereign wealth funds,and mutual funds.
This book focuses on the mistakes made and lessons learned in2008 and attempts to incite a dialogue about how to construct bet-ter portfolios in the real money world. For this reason, mutual funds
3

P1: OTA/XYZ P2: ABCc01 JWBT268-Drobny March 2, 2010 21:2 Printer Name: To Come
4 R E A L M O N E Y A N D T H E C R A S H O F ‘ 0 8
will be excluded from the discussion, since they are usually managedunder strict mandates and asset class restrictions, rather than as broadportfolios where asset allocation decisions dominate the investmentprocess.
Real money funds are important and worth analyzing because: (1)they are some of the largest pools of capital in the world; (2) they havea direct impact on the functioning of society; (3) they lost staggeringamounts of money in 2008; and (4) in many cases, these funds are ulti-mately backstopped by the taxpayer if they fail to deliver their promises.Real money funds are in crisis and are “too big to fail.”
Size
Real money funds comprise a majority of world’s managed assets, whichtotaled $62 trillion at the end of 2008. Within this grouping, pensionsare by far the largest category, at $24 trillion, with U.S. pensions at $15trillion, or almost one-quarter of total managed assets (see Figure 1.1).
24
18.7 18.9
3.9
1.52.5
0.9
32.8
0
5
10
15
20
25
30
35
PrivateWealth
ETFsPrivateEquity
HedgeFunds
SWFsMutualFunds
InsuranceFunds
PensionFunds
Ass
ets
Un
der
Man
agem
ent
($ t
rilli
on
)
Figure 1.1 Global Fund Management Industry, End of 2008Source: IFSL estimates.

P1: OTA/XYZ P2: ABCc01 JWBT268-Drobny March 2, 2010 21:2 Printer Name: To Come
Rethinking Real Money 5
Impact on Society
Much of real money exists to deliver the promise of future retirementbenefits, to support education, to guarantee the payouts from insur-ance agreements, to support charitable activities, and even to back na-tional interests. In short, real money is the foundation for many im-portant aspects of modern society. Pensions form an important partof the fundamental social contract between workers and employers,both in the public and private sectors. Public pensions in particu-lar help ensure that basic societal functions are populated by com-petent people. Some of these functions include: police officers, fire-men, judges, sanitation workers, teachers, health workers, politicians,and soldiers, amongst many others. To give an example of how realmoney affects society, after the crash of 2008, Philadelphia city of-ficials threatened to lay off workers and cut sanitation and publicsafety services unless they could delay pension contributions. Storiessuch as these will likely become much more prevalent over the nextfew years.
2008 Losses
During the financial crisis, real money accounts suffered immense draw-downs. Pension funds globally saw their assets fall by almost 20 percent,while university endowments in the United States lost 26 percent onaverage. More surprisingly, because of the severity of investment losses,many institutions were forced to modify their operations to reflect a newreality: universities laid off staff, froze or cut salaries, issued debt, re-duced financial aid, and suspended building projects; pensions increasedemployee and employer contributions, raised retirement ages, and cutbenefits; charitable foundations canceled grants and delayed new pro-grams; families curtailed spending and in many cases have been forced tosell assets.
The severe losses in 2008 also exposed some fundamental flaws inhow real money portfolios are managed. Portfolio construction method-ologies failed to account for both worst-case scenarios and potentialilliquidity. A primary lesson of this experience is that the pain of in-vestment losses is not linear; there is a kink, after which point losses

P1: OTA/XYZ P2: ABCc01 JWBT268-Drobny March 2, 2010 21:2 Printer Name: To Come
6 R E A L M O N E Y A N D T H E C R A S H O F ‘ 0 8
begin to force changes in behavior. As a result, short-term investmentperformance has consequences even for “long-term” investors.
Taxpayer
Although all real money accounts are important to society in one wayor another, pensions are the largest and arguably the most important.Well before the crisis of 2008, demographic challenges had been steadilyputting pressure on pension systems in the developed world. Never-theless, at the end of 2007, after an extended bull run for assets, manyplans were fully funded, whereas at the end of 2008 most had becomesignificantly underfunded.
Although a university going bust or a charitable foundation closingdown is tragic for those directly involved, the effect would be relativelyisolated. On the other hand, a pension fund going bust has implicationsfor taxpayers. In the United States, the taxpayer is the explicit backstopfor public pension funds and the implicit backstop for corporate pensionfunds, the latter of which are guaranteed by the Pension Benefit GuarantyCorp. (PBGC), a federal agency. The PBGC is currently facing its owncrisis, with a reported deficit of $33.5 billion at midyear 2009, a morethan tripling of the $11 billion deficit reported at midyear 2008. Thedeficit is the largest in the agency’s 35-year history. More importantly,without confidence by workers that their benefits are intact, societybreaks down.
In Ohio, for instance, the teachers pension system reported that itcould take 41 years for its investments to meet its liabilities to retireesbased on actuarial assessments—and this was before 2008. During the2008–2009 fiscal year, the pension fund lost 31 percent, promptingofficials to claim that they would never be able to meet liabilities. Becauseof the inherent complexity and subjectivity associated with calculatingthe funding levels for pension funds, the true costs are often disguised inthe near-term (see box on page 7).
The shortfall associated with underfunded pensions can be madeup by either investment performance or pension reform (i.e., changingthe structure of the pension in some way). Yet pension reform amountsto fiscal tightening at a time when the global economy is weak and

P1: OTA/XYZ P2: ABCc01 JWBT268-Drobny March 2, 2010 21:2 Printer Name: To Come
Rethinking Real Money 7
personal budgets are stretched. At the same time, these decisions aremade by politicians, whose tenure in office does not compel them tomake difficult, long-term decisions. Because voters do not opt for moretax or less benefits, the problems are often ignored, growing bigger bythe day. Pensions loom as the next big financial crisis.
But crises often bring about change. We now have new information,which raises many important questions about what to do going forward.In order to understand more clearly what happened in 2008 and beable to formulate a plan for where we go from here, it is worthwhileto examine a brief history of real money, focusing on the U.S. pensionworld because it is the largest pool of funds and the biggest risk to thetaxpayers of the world’s largest economy.
Pension Funding LevelsPension plans have two primary elements: (1) the future benefitobligations earned through employee service; and (2) the planassets available to meet the liabilities owed to the beneficiaries.The challenge in assessing the health of pension plans is thatboth future liabilities and returns are estimates.
Since the payments to beneficiaries will be made far intothe future, actuarial assumptions are required to estimate mor-tality rates, medical costs, and future salary increases. The futurestream of assumed payments is discounted into a single presentvalue estimate, whereby the discount rate is determined by ref-erence to a benchmark yield. The higher the discount rate, thelower the benefit obligations. Very small changes in the dis-count rate have enormous real dollar implications for estimatedfunding levels.
Likewise, the value of plan assets available in the future tomeet the pension obligations is also an estimate. The futurevalue calculation is a function of expected returns on plan assets.Expected long-term returns are often developed using historicalor “assumed” rates of return. In sum, it’s a big guessing game.

P1: OTA/XYZ P2: ABCc01 JWBT268-Drobny March 2, 2010 21:2 Printer Name: To Come
8 R E A L M O N E Y A N D T H E C R A S H O F ‘ 0 8
II. The Evolution of Real Money
In the Beginning, There Were Bonds
Although pensions have existed for hundreds of years, the current struc-ture took shape after 1948. In that year, the U.S. National Labor Re-lations Board (NLRB) ruled that corporate pensions must be includedin contract negotiations between employers and employees. Before theruling, the amount of capital allocated to an employee pension scheme,if such a plan even existed, was at the employers’ discretion. This rulingdefined how much a corporation must contribute to the employee pen-sion plan annually, regardless of company performance and profits. As aresult, money began to consistently move into pension funds, creatingsignificant growth in assets and eventually leading to the large, powerful,professionally managed institutions that exist today (see Figure 1.2).
At the time, pension assets were managed very conservatively;fixed interest on bonds was matched to meet fixed commitments topensioners—simple asset/liability matching. Bonds were selected frompreapproved “legal lists” of securities, and it was common to have a limitfor equities. In 1949, public and private pension assets in the United
0
2000
4000
6000
8000
10000
12000
200520001995199019851980197519701965196019551950
Tota
l Ass
ets
($ b
illio
ns)
Figure 1.2 Growth of US Public and Private Pension Fund Assets, 1950–2008Source: Federal Reserve Flow of Funds.

P1: OTA/XYZ P2: ABCc01 JWBT268-Drobny March 2, 2010 21:2 Printer Name: To Come
Rethinking Real Money 9
States were $15.7 billion. The asset mix was roughly half in governmentbonds, and half in other fixed income and insurance company fixedannuity investment products. There was minimal exposure to equities.
Along Came Inflation
By 1970, public and corporate pension fund assets in the United Statesreached $211.7 billion, the majority of which was concentrated in fixedincome. Beginning with the 1973–1974 oil embargo, wave after waveof commodity price-induced inflation roiled fixed interest portfoliosthrough the remainder of the decade. Nevertheless, assets continued topour into pension funds because of strict commitments mandated onemployers.
At the end of the decade, U.S. pension funds had $649 billion in totalassets, and the outperformance of equities versus bonds during the pre-vious ten years did not go unnoticed by pension fund managers. Whilebond portfolios got destroyed, equities at least managed to preserve cap-ital in real terms (see Figure 1.3). Panicked and weary pension fundmanagers began rethinking their portfolios, and the shift out of bonds
–40%
–20%
0%
20%
40%
60%
80%
100%
120%
140%
198019791978197719761975197419731972197119701969
Tota
l Ret
urn
(%
)
Nominal Equity
Nominal Bonds
Real Equity
Real Bonds
Figure 1.3 U.S. Stocks and Bonds, 1970sSource: Bloomberg; U.S. Bureau of Labor Statistics, http://www.bls.gov/CPI/; and Damodaran Online,http://pages.stern.nyu.edu/∼adamodar/.

P1: OTA/XYZ P2: ABCc01 JWBT268-Drobny March 2, 2010 21:2 Printer Name: To Come
10 R E A L M O N E Y A N D T H E C R A S H O F ‘ 0 8
into stocks began in earnest. By 1980, corporate pensions had 45 percentof their assets in equities, while public pensions had 16 percent. In manycases, public plans were still capped as to how much equities they couldown. The largest U.S. pension fund, the California Public Employees’Retirement System (CalPERS), for example, had a maximum allocationto equities of 25 percent, which was eventually lifted in 1984.
The 60–40 Model and the Great Moderation
Through the 1980s and 1990s, pensions continued to shift their assets outof bonds and into stocks, ultimately moving toward the now ubiquitous60–40 policy portfolio (60 percent in stocks and 40 percent in bonds,often domestic only). The 60–40 model which became the standardbenchmark by which to judge portfolio performance. The shift intostocks, and corresponding increase in risk, occurred in lock step withFederal Reserve Chairman Paul Volcker’s famous battle with inflation,which saw the fed funds rate peak at 20 percent in 1981. In 1980, theso-called “misery index”—unemployment plus inflation—peaked at 20percent.
As the excess pessimism of the 1970s gave way to excess optimismduring the Reagan 1980s and euphoria during the technology revolu-tion of the late 1990s, 60–40 pension portfolios performed well. Thebig decisions that investors faced at this time were whether to tweakthe 60–40 allocation to, say, 65–35 or 55–45. In actuality, the marketenvironment throughout the 1980s and 1990s rendered these decisionsinconsequential as both stocks and bonds benefited greatly from fallinginflation and declining interest rates. The environment later becameknown as the Great Moderation, and was summed up well in a 2004speech by then–Federal Reserve Governor Ben Bernanke (see box).
Bernanke on the Great ModerationThe Great Moderation, the substantial decline in macroeco-nomic volatility over the past twenty years, is a striking eco-nomic development. Whether the dominant cause of the GreatModeration is structural change, improved monetary policy, orsimply good luck is an important question about which no

P1: OTA/XYZ P2: ABCc01 JWBT268-Drobny March 2, 2010 21:2 Printer Name: To Come
Rethinking Real Money 11
consensus has yet formed. I have argued today that improvedmonetary policy has likely made an important contribution notonly to the reduced volatility of inflation (which is not par-ticularly controversial) but to the reduced volatility of output aswell. Moreover, because a change in the monetary policy regimehas pervasive effects, I have suggested that some of the effectsof improved monetary policies may have been misidentified asexogenous changes in economic structure or in the distributionof economic shocks. This conclusion on my part makes me op-timistic for the future, because I am confident that monetarypolicymakers will not forget the lessons of the 1970s.
Source: Board of Governors of the Federal Reserve System, www.federalreserve.gov; Febru-ary 20, 2004.
By 1998, U.S. pension assets totaled more than $6.9 trillion, 438times the 1949 figure. Pensions were larger than the national debt andgrowing faster. Because of their immense buying power, pensions be-came powerful market players in terms of shareholder activism, gover-nance, and reform (see Figure 1.4).
0
1000
2000
3000
4000
5000
6000
7000
8000
1950 1955 1960 1965 1970 1975 1980 1985 1990 1995 2000 2005
Eq
uit
y ($
bill
ion
s)
Elephant inthe room
Figure 1.4 Equity Assets Owned by US Public and Private Pensions, 1950–2008Source: Federal Reserve Flow of Funds.

P1: OTA/XYZ P2: ABCc01 JWBT268-Drobny March 2, 2010 21:2 Printer Name: To Come
12 R E A L M O N E Y A N D T H E C R A S H O F ‘ 0 8
0%
2%
4%
6%
8%
10%
12%
14%
16%
1980 1985 1990 1995 2000
Per
cen
t (I
nfl
atio
n &
Bo
nd
Yie
ld)
0
5
10
15
20
25
30
35
Pri
ce/E
arn
ing
s (E
qu
ity)
U.S. 10-yr. Bond YieldsInflationEquity PE
Figure 1.5 Interest Rates, Inflation and Equity Multiples, 1980–2000Source: Bloomberg; Federal Reserve System, http://www.federalreserve.gov/datadownload/; and U.S.Bureau of Labor Statistics, http://www.bls.gov/bls/.
For two decades, the trend in equity markets was almost straight up,producing an entire generation of real money investors conditioned tobuy any dip and remain invested in equities for the long term. Aca-demics such as Jeremy Siegel of the University of Pennsylvania and bankstrategists such as Abbey Joseph Cohen of Goldman Sachs became cheer-leaders for the idea of owning equities for the long term, while banks andconsultants peddled the story. Pensions, other real money investors, andretail investors all made money in this environment. It was a wonderfultime to be invested (see Figure 1.5).
The Dot-Com Crash
As real money was becoming increasingly loaded up on equity risk intheir 60–40 portfolios (stocks can be anywhere from 2 to 10 times riskierthan bonds depending on what proxies are used), two decades of de-clining inflation and interest rates culminated in a technology-led stockmarket bubble that finally popped in March 2000. After the peak, globalequity markets declined relentlessly year after year, finally bottoming in

P1: OTA/XYZ P2: ABCc01 JWBT268-Drobny March 2, 2010 21:2 Printer Name: To Come
Rethinking Real Money 13
0
200
400
600
800
1000
1200
1400
1600
1995 1996 1997 1998 1999 2000 2001 2002 2003
MS
CI G
lob
al
0
500
1000
1500
2000
2500
3000
3500
4000
4500
5000
NA
SD
AQ
MSCI GlobalNASDAQ
Tech stocks fall75%
Global equitiescut in half
Figure 1.6 MSCI Global and NASDAQ, 1995–2003Source: Bloomberg.
early 2003. Stocks generally lost half their value while in-vogue tech-nology stocks dropped 75 percent from peak to trough (see Figure 1.6).Just as they had in the 1970s with bonds, real money managers becamepainfully aware of the equity concentration risk in their portfolios andbegan to look for a better, less risky approach. Pensions were facing seri-ous underfunding issues and all investors were looking for new answers.Amidst the carnage, the two largest university endowments—Harvardand Yale—rode through the dot-com bust unscathed, causing many in-vestors to explore what these large, sophisticated real money investorswere up to (see Table 1.1).
Table 1.1 Equity Returns versus Harvard and Yale Endowments
Fiscal Year(July 1–June 30) S&P500 MSCI Global Harvard Yale
2000 7.3% 11.0% 32.2% 41.0%2001 −14.8% −21.3% −2.7% 9.2%2002 −18.0% −16.3% −0.5% 0.7%2003 0.3% −4.1% 12.5% 8.8%
Source: Bloomberg and Mebane Faber, The Ivy Portfolio (Wiley).

P1: OTA/XYZ P2: ABCc01 JWBT268-Drobny March 2, 2010 21:2 Printer Name: To Come
14 R E A L M O N E Y A N D T H E C R A S H O F ‘ 0 8
We Are All Endowments Now
Just as the real money world’s attention shifted to the Harvard and YaleEndowments, David Swensen, Chief Investment Officer of the Yale En-dowment, published a seminal work in May 2000, entitled PioneeringPortfolio Management: An Unconventional Approach to Institutional Invest-ment, in which he outlined his investment process. The book becamethe bible of the real money world, and dog-eared copies can be foundon the desks or bookshelves of most real money managers. Soon afterits publication, investors from family offices to pensions and foundationsbegan trying to emulate Yale by creating their own endowment-styleportfolios.
The “Yale Model” soon came to be known as the “EndowmentModel” as the portfolio management style became pervasive amonguniversity endowment portfolios. The Endowment Model, as it waspopularly interpreted, is a broadly diversified portfolio, though with aheavy equity orientation, which seeks to earn a premium for takingon illiquidity risk. The argument behind the equity and “equity-like”orientation is that stocks produce the highest returns over time. Thisfundamental concept has roots in the very foundations of capitalism:risky equity capital should earn more than less risky bonds. The ar-gument for seeking out illiquidity risk comes from financial theory,which states that investors are paid a premium for assuming the riskof illiquid assets (you should be compensated for not being able tosell something when you want). Illiquid investments include publiclytraded illiquid securities and a host of “alternatives,” including privateequity, real estate, venture capital, infrastructure, physical commoditiesand real assets such as timber, mines, etc. The focus on illiquid assetsmade the Endowment Model particularly attractive to funds that—atleast in theory—had extremely long time horizons, such as endowmentsand pensions.
David Swensen took over the Yale Endowment in 1985, when totalassets stood at $1.3 billion, and started to shift the portfolio towardsilliquid alternative assets aggressively after 1990 (see Table 1.2). He grewassets to a reported peak of $22.87 billion by June 30, 2008, a trulyremarkable achievement. During his tenure, he shifted Yale’s endowmentfrom a classic policy portfolio (80–20 in this case) focused primarily on

P1: OTA/XYZ P2: ABCc01 JWBT268-Drobny March 2, 2010 21:2 Printer Name: To Come
Rethinking Real Money 15
Table 1.2 Yale Endowment Portfolio Composition
Asset Class 1985 1990 2008
Domestic equity 61.6% 48.0% 10.1%Foreign equity 6.3% 15.2% 15.2%Absolute return 0% 0% 25.1%Private equity 3.2% 6.7% 20.2%Real assets 8.5% 8.0% 29.3%Fixed income 10.3% 21.2% 4.0%Cash 10.1% 0.9% −3.9%
Source: Mebane Faber, The Ivy Portfolio (Wiley).
listed equities to an illiquid, equity-oriented portfolio invested in a broadarray of alternative assets, primarily managed by external managers. Hisextraordinary performance included only one negative year (–0.2 percentin fiscal 1988), so it is hardly surprising that other investors with similarmandates sought to emulate him.
In the years following the dot-com bust in 2000, and acceleratingafter 2003, slow-moving investment committees across the real moneyspectrum shifted their portfolios from the 60–40 model to versions of theEndowment Model, again spurred on by consultants and banks sellingboth expertise and products. Aggressive real money managers at pensionfunds and university endowments such as Stanford, Duke, Notre Dame,MIT, and Princeton pushed their portfolios towards high percentages ofilliquid assets and alternatives, in turn becoming the industry stars thatothers sought to emulate. David Swensen followed up his first book witha retail investor version in 2005, entitled Unconventional Success: A Funda-mental Approach to Personal Investment, in which he addressed how indi-vidual investors can mimic the Yale portfolio using low-cost instrumentsavailable to retail investors such as Exchange-Traded Funds. Meanwhile,new money management firms headed by former endowment chiefscreated endowment-style funds that were sold to retail investors throughmass distribution channels.
With so many real money and retail investors piling into the Endow-ment Model, the assets of partially liquid and illiquid alternative assetmanagers exploded. Central banks, fighting the last battle—the dot-combust—kept interest rates low, adding fuel to the fire.

P1: OTA/XYZ P2: ABCc01 JWBT268-Drobny March 2, 2010 21:2 Printer Name: To Come
16 R E A L M O N E Y A N D T H E C R A S H O F ‘ 0 8
Assets of hedge funds grew from $237 billion in 2000 to over$2 trillion in 2007. Private equity grew from $511 billion with an-other $450 billion committed in 2003, to $1.5 trillion with another$1 trillion committed in 2008. Investment in commodity indexes grewfrom $70 billion in 2005 to $180 billion in 2007 and real estate becamea worldwide bubble. Yet, as real money investors sought diversificationthrough the same methodology, their portfolios were in fact becomingmore correlated to each other while portfolio risks were becoming moreconcentrated and increasingly dependent upon illiquid equity-like in-vestments. Crowding was becoming an issue, yet the primary concernof real money investors at the time was getting capacity in the “best”managers. This stampede led investors to accept worsening terms, suchas longer lockups, less transparency, higher fees, and others that servedto increase the overall risk profile of their funds. Indeed, crowding is nota surprise since real money managers often share the same consultantsand occasionally the same board members.
In a May 31, 2007 interview in Fortune, Harvard’s endowment chiefat the time, Mohamed El-Erian, was asked about the major investmentchallenges facing Harvard Management Corporation. He had this to say:
More people are replicating what we do. The endowment model isvery much in vogue. There have been many articles in the press trum-peting how well endowments like Harvard’s and Yale’s have performed.And David Swensen, who brilliantly heads up Yale’s endowment withimpressive long-term performance, has written a great book showinghow endowment management is done. So now lots of central banksand pension funds are trying to become more like endowments. Thespace is becoming more crowded.
The Crash of ‘08
Just as real money investors became fully invested in portfolios resem-bling the Endowment Model—with hopes of achieving excess returnswith low risk—along came the crash of ‘08, reminding everyone thatexcess returns are only generated by taking on more risk, even if thatrisk remains hidden for a period of time. From a peak in October 2007to a trough in March 2009, global equities declined by almost 60 per-cent, taking down equity-oriented portfolios with them (see Figure 1.7).

P1: OTA/XYZ P2: ABCc01 JWBT268-Drobny March 2, 2010 21:2 Printer Name: To Come
Rethinking Real Money 17
600
800
1000
1200
1400
1600
1800
2003 2004 2005 2006 2007 2008 2009
Ind
ex L
evel
Global equitiesdown 60%
Figure 1.7 MSCI Global, 2003–2009Source: Bloomberg.
During the fiscal year to June 30, 2009 (which most university endow-ments report on), the S&P 500 was down 26 percent, while most realmoney investors suffered losses in the 20 to 40 percent range. Worse, asubstantial portion of the remaining assets were illiquid. It was not un-common to find real money managers stuck in portfolios that were 50 to100 percent illiquid, making cash obligations difficult to meet. The valu-ation of illiquid assets is approximate in the best of times, and they couldcontinue to drag down performance for years to come as valuations crys-talize. There have been many attempts to sell illiquid assets in secondarymarkets, and the deals that have been reported were a fraction of thevaluations on the books of other portfolios. Some private equity fundshave reportedly traded hands for as low as 20 to 30 cents on the dollar.
The crash of ‘08 highlighted flaws in the Endowment Model,namely: (1) diversification with a high equity orientation is not re-ally diversification; (2) valuation matters, whether it applies to equities,real estate, or liquidity; (3) investing in certain limited partnerships is aform of leverage; and (4) time horizons are not as long as previouslyenvisioned for investors with annual liquidity needs.
First, when you diversify your portfolio but retain an equity andequity-like orientation, you are not really diversified; all the risk eggs

P1: OTA/XYZ P2: ABCc01 JWBT268-Drobny March 2, 2010 21:2 Printer Name: To Come
18 R E A L M O N E Y A N D T H E C R A S H O F ‘ 0 8
remain in the equity basket. For example, if you are invested in in-ternational equities, long/short equity hedge funds with a long bias,private equity, and venture capital, you essentially have a one-way beton the returns of equities. Similarly, real assets offer equity-like exposurebecause they are dependent on the nominal growth in the economy.Ironically, the Endowment Model usurped the prevalence of the 60–40policy portfolio precisely because it was supposed to offer an alternativeto equity-centric investing. But not only did the concentration for theEndowment Model remain in equities, it went further, concentratingthe equity risk in illiquid investments that were often levered. The assetallocation for Yale in 2008 (see Table 1.2.) had 99.9 percent of the port-folio invested in equity and equity-like assets (4 percent in bonds but–3.9 percent in cash; the portfolio was leveraged outright by 3.9 percent,and presumably the actual leverage was much higher due to committedbut yet uncalled allocations to private equity, venture capital, and otherfunds).
The argument that equities outperform other asset classes in thelong term often fails to mention the risk undertaken to achieve thatoutperformance. Taking risk into account, history offers an alternativeanswer to the claim that equities always outperform in the long term.Through October 2009, 10-year U.S. government bonds have outper-formed the S&P 500 for the past 5 and 10 years. Twenty-year returns ofstocks and bonds are almost equivalent, but bonds have less than half thevolatility. (See Table 1.3.) Further, from 1900–2000, equities and bonds
Table 1.3 U.S. Equities and U.S. Government Bonds, Annualized Returns andVolatility through October 2009
Returns Volatility
Time Period U.S. 10-yr Bonds S&P 500 U.S. 10-yr Bonds S&P 500
5 years 8.08% –1.12% 7.36% 22.11%10 years 8.17% –1.71% 6.81% 20.05%15 years 8.03% 7.49% 8.52% 21.55%20 years 7.77% 7.79% 8.48% 19.43%25 years 8.91% 10.13% 9.50% 18.37%30 years 9.15% 10.75% 10.04% 17.50%
Source: Bloomberg; and Damodaran Online, http://pages.stern.nyu.edu/∼adamodar/.

P1: OTA/XYZ P2: ABCc01 JWBT268-Drobny March 2, 2010 21:2 Printer Name: To Come
Rethinking Real Money 19
in the United States have generated almost identical nominal returns ona risk-adjusted basis, with bonds slightly outperforming.
Second, 2008 was a reminder that valuation matters. Part of thesuccess of Yale and Harvard could be attributed to their recognitiontwo decades ago that illiquid assets were cheap. As early entrants,they were able to benefit from the increased valuations of illiquids asfollowers drove up prices. Another part of their success could be afunction of the extremely favorable macro environment, which saw de-clining interest rates and declining inflation for the past three decades.Put another way, it is not at all clear that what transpired will con-tinue to transpire. Sticking to one investment style regardless of valua-tion or environment is dangerous, but that is exactly what real moneymanagers did.
Third, although real money portfolios do not assume outright lever-age, they often attain leverage through allocations to external managers.In this sense, they were implicitly leveraged through their private equity,venture capital, real estate, and other investments that required advancedcommitments, giving a portion of their portfolio a short option-likeprofile. It became common practice for real money managers lookingto invest in these areas to “over-commit” by up to two times the targetallocation in order to achieve their desired portfolio allocation, as com-mitments are called. These types of funds draw down (i.e., ask for or“call”) the money committed to them as opportunities are identified. Assuch, only a fraction of a commitment may be used at any one time, andit can take years to fully deploy a commitment. Private equity and ven-ture capital opportunities tend to produce cash flows only after severalyears because it takes time to generate value and exit the investments. In-vestors counted on these cash flows from prior investments to fund newcapital calls, creating a recycling process. However, in 2008 and 2009,cash flows from successful exits dried up while capital calls continued.This served to increase real money managers’ exposure requiring cashprecisely when it was in short supply.
For example, on June 15, 2009, CalPERS announced they were rais-ing their investment target to private equity from 10 percent to 14 per-cent. Of course, their private equity allocation had already risen abovetheir target because of capital calls and the “denominator effect.” OnJune 30, 2009, CalPERS had $21.8 billion of its $180.9 billion portfolio

P1: OTA/XYZ P2: ABCc01 JWBT268-Drobny March 2, 2010 21:2 Printer Name: To Come
20 R E A L M O N E Y A N D T H E C R A S H O F ‘ 0 8
allocated to private equity, with another $22.5 billion committed—animplicitly levered exposure of 25 percent to private equity.
Fourth, the conventional wisdom that real money managers are“long-term” investors is misguided. Just as all of the equity instrumentswere correlated on the way up and the way down, so, too, were the illiq-uid assets. Although the illiquid investments remained illiquid, many for-merly liquid investments also became illiquid as real money and leveredinvestors alike all attempted to sell at the same time. Such a worst-casescenario was not considered despite the time-worn adage that liquidityis never there when you need it most. Even if these illiquid assets windup performing well over time, institutions had short- to medium-termcash obligations that they could not honor due to the illiquid natureof their portfolios, calling into question the true time horizons of theseinvestors.
The difference between the 2000–2003 period—when endowmentsperformed—and the 2008 period—when they didn’t—was a functionof crowding and the sheer size and percentage of assets dedicated toilliquids and alternatives (often through leverage).
Less Endowed
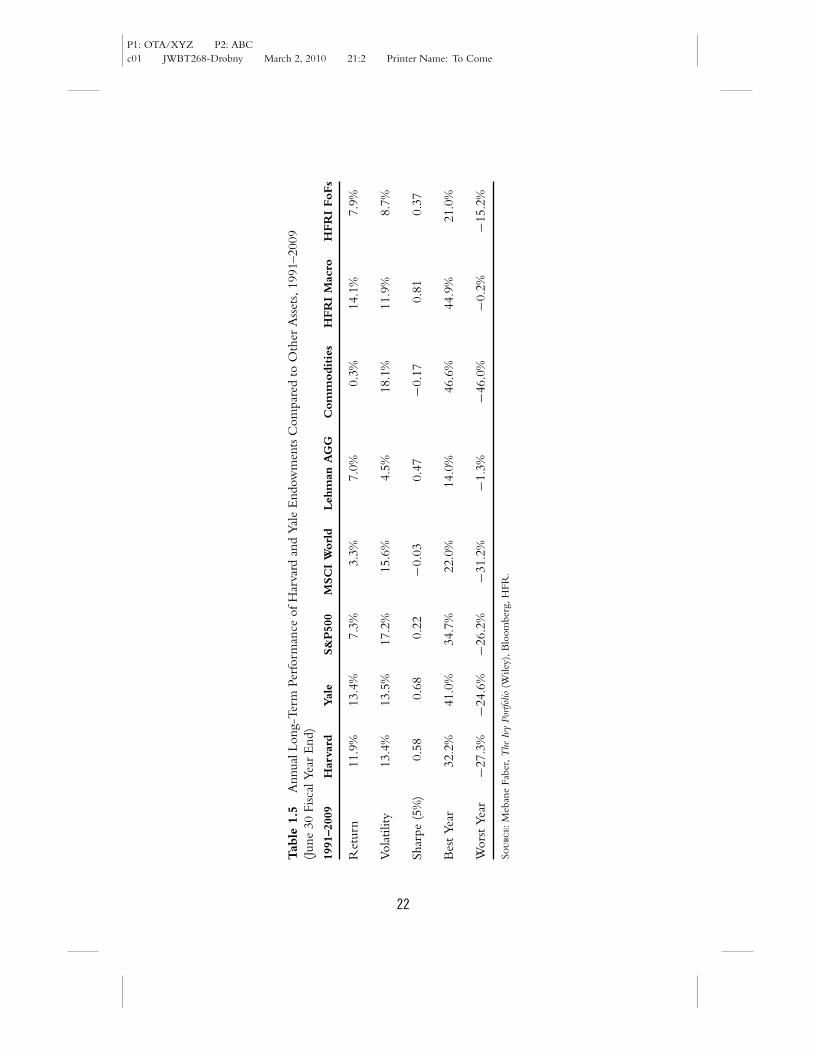
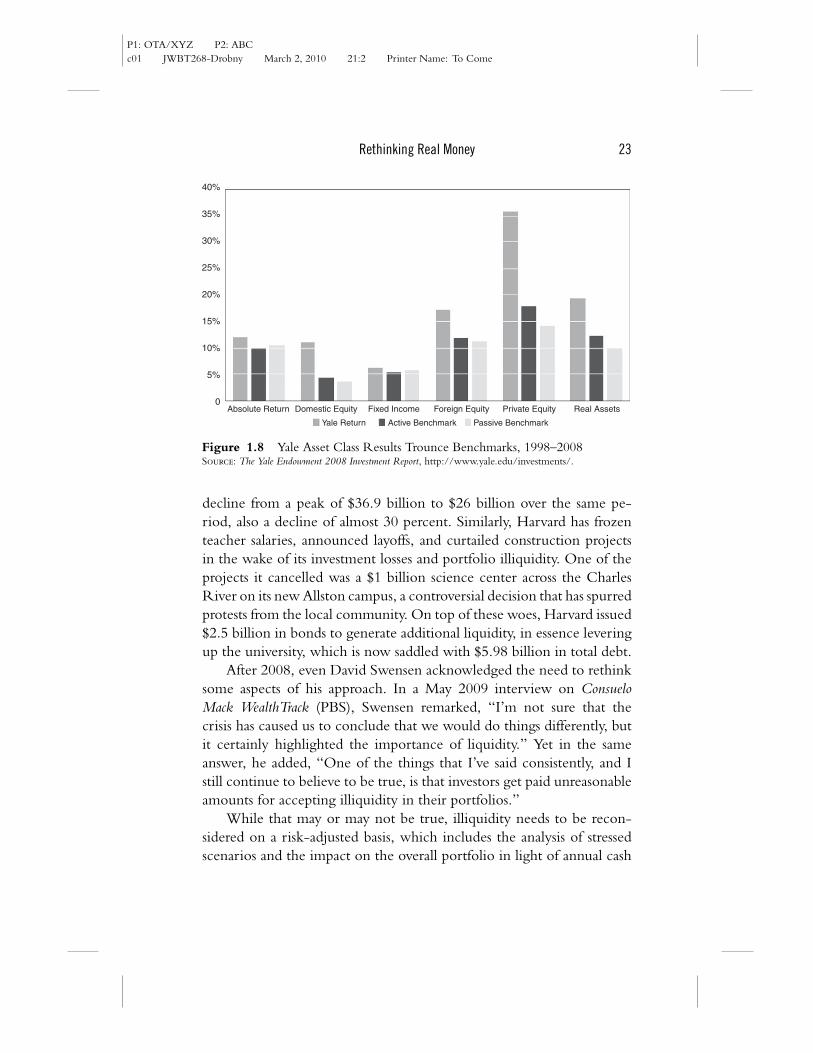
The large endowments gained a following because of strong perfor-mance, but significant losses in 2008 cast doubt upon the quality of thatperformance. Caught with high proportions of “equity-like” and illiq-uid investments, they gave back years of gains (see Table 1.4 and Table1.5). Excess returns require high risks, and the bill finally came due.The majority of Yale’s outperformance over the past decade came fromprivate equity and real assets, which currently make up half of the en-dowment portfolio (see Figure 1.8). It is worth questioning how muchof Yale’s (and other endowments’) past outperformance was attributableto superior manager selection and better portfolio construction, andhow much was simply a function of leverage, both explicit and implicit.
Yale University saw its endowment assets fall from almost $23 billionto $16.3 billion for fiscal year 2008–2009, a decline of almost 30 percent.As a result of investment losses and illiquidity, Yale postponed $2 bil-lion in construction projects and trimmed 600 jobs through voluntaryresignations and firings. Harvard University saw its endowment assets

P1: OTA/XYZ P2: ABCc01 JWBT268-Drobny March 2, 2010 21:2 Printer Name: To Come
Tab
le1.
4A
nnua
lLon
g-Te
rmPe
rfor
man
ceof
Har
vard
and
Yal
eE
ndow
men
tsC
ompa
red
toO
ther
Ass
ets,
1991
–200
8(J
une
30Fi
scal
Year
End
)
1991
–200
8H
arva
rdYal
eS&
P50
0M
SC
IW
orl
dB
arcl
ays
AG
GC
om
moditie
sH
FR
IM
acro
HFR
IFoFs
Ret
urn
14.7
%16
.0%
9.6%
5.7%
7.1%
3.8%
14.9
%9.
4%
Vola
tility
9.5%
10.0
%15
.4%
13.3
%4.
6%14
.3%
11.7
%6.
8%
Shar
pe(5
%)
1.06
1.14
0.37
0.11
0.47
−0.0
20.
890.
67
Bes
tYe
ar32
.2%
41.0
%34
.7%
22.0
%14
.0%
46.6
%44
.9%
21.0
%
Wor
stYe
ar−2
.7%
0.7%
−18.
0%−2
1.3%
−1.3
%−1
2.0%
4.2%
−0.2
%
Sour
ce:M
eban
eFa
ber,
The
Ivy
Portf
olio
(Wile
y),B
loom
berg
,HFR
.
21
P1: OTA/XYZ P2: ABCc01 JWBT268-Drobny March 2, 2010 21:2 Printer Name: To Come
Tab
le1.
5A
nnua
lLon
g-Te
rmPe
rfor
man
ceof
Har
vard
and
Yal
eE
ndow
men
tsC
ompa
red
toO
ther
Ass
ets,
1991
–200
9(J
une
30Fi
scal
Year
End
)
1991
–200
9H
arva
rdYal
eS&
P50
0M
SC
IW
orl
dLeh
man
AG
GC
om
moditie
sH
FR
IM
acro
HFR
IFoFs
Ret
urn
11.9
%13
.4%
7.3%
3.3%
7.0%
0.3%
14.1
%7.
9%
Vola
tility
13.4
%13
.5%
17.2
%15
.6%
4.5%
18.1
%11
.9%
8.7%
Shar
pe(5
%)
0.58
0.68
0.22
−0.0
30.
47−0
.17
0.81
0.37
Bes
tYe
ar32
.2%
41.0
%34
.7%
22.0
%14
.0%
46.6
%44
.9%
21.0
%
Wor
stYe
ar−2
7.3%
−24.
6%−2
6.2%
−31.
2%−1
.3%
−46.
0%−0
.2%
−15.
2%
Sour
ce:M
eban
eFa
ber,
The
Ivy
Portf
olio
(Wile
y),B
loom
berg
,HFR
.
22
P1: OTA/XYZ P2: ABCc01 JWBT268-Drobny March 2, 2010 21:2 Printer Name: To Come
Rethinking Real Money 23
40%
35%
30%
25%
20%
15%
10%
5%
0Absolute Return Domestic Equity Fixed Income Foreign Equity Private Equity Real Assets
Passive BenchmarkActive BenchmarkYale Return
Figure 1.8 Yale Asset Class Results Trounce Benchmarks, 1998–2008Source: The Yale Endowment 2008 Investment Report, http://www.yale.edu/investments/.
decline from a peak of $36.9 billion to $26 billion over the same pe-riod, also a decline of almost 30 percent. Similarly, Harvard has frozenteacher salaries, announced layoffs, and curtailed construction projectsin the wake of its investment losses and portfolio illiquidity. One of theprojects it cancelled was a $1 billion science center across the CharlesRiver on its new Allston campus, a controversial decision that has spurredprotests from the local community. On top of these woes, Harvard issued$2.5 billion in bonds to generate additional liquidity, in essence leveringup the university, which is now saddled with $5.98 billion in total debt.
After 2008, even David Swensen acknowledged the need to rethinksome aspects of his approach. In a May 2009 interview on ConsueloMack WealthTrack (PBS), Swensen remarked, “I’m not sure that thecrisis has caused us to conclude that we would do things differently, butit certainly highlighted the importance of liquidity.” Yet in the sameanswer, he added, “One of the things that I’ve said consistently, and Istill continue to believe to be true, is that investors get paid unreasonableamounts for accepting illiquidity in their portfolios.”
While that may or may not be true, illiquidity needs to be recon-sidered on a risk-adjusted basis, which includes the analysis of stressedscenarios and the impact on the overall portfolio in light of annual cash

P1: OTA/XYZ P2: ABCc01 JWBT268-Drobny March 2, 2010 21:2 Printer Name: To Come
24 R E A L M O N E Y A N D T H E C R A S H O F ‘ 0 8
liabilities. Although the Endowment Model is not dead, the flaws andshortcomings exposed in 2008 need to be considered and adjusted forwhen building real money portfolios. Whether the performance of en-dowment style portfolios snap back quickly or not doesn’t matter; wehave learned that risk-adjusted returns and drawdowns are important.If large drawdowns force action beyond the portfolio level (i.e., if theunderlying institutions must take action because of portfolio losses), thenit makes sense to do whatever is necessary to cut off that risk.
Public Pension Goes EndowmentIn the fall of 2006, I was invited to attend an offsite meeting fora state pension fund that had just been given clearance, througha November 2006 ballot vote, to invest outside of the UnitedStates for the first time. The vote essentially gave them carteblanche to invest in anything. For years, the double-digit billiondollar pension fund had invested half its assets in U.S. listed equi-ties and half in U.S. government bonds. After the vote, the statetreasurer wasted no time hiring a CIO from another compara-ble pension fund, where he had implemented the EndowmentModel. The two-day offsite was organized as an opportunity forconsultants, product providers, other experts, and constituentsto discuss the way forward. Having just published my first book,I was invited to speak about global macro—I did not have aninvestment product to sell at the time, and was allowed to staythrough all of the presentations (most product providers wereasked to leave after making their pitch). I saw bond mutual funds,funds of hedge funds, enhanced index products, private equityfunds, and others present their wares, all from leading firms.Most importantly, I saw the pension’s consultants describe howthey were going to convert a pie chart with two slices (stocksand bonds) into one with dozens of slices and a sprinkling ofportable alpha (leverage) here and an over-commitment to pri-vate equity there. Despite the obvious complications and chal-lenges with transitioning such a large pool of capital, the planwas to execute this major shift in asset allocation as quickly as
P1: OTA/XYZ P2: ABCc01 JWBT268-Drobny March 2, 2010 21:2 Printer Name: To Come
Rethinking Real Money 25
possible, through swaps, special purpose vehicles, and blocktrades. It all sounded so easy. The plan was agreed and initi-ated during 2007, just in time for the credit crisis. During 2008,the pension’s total assets fell by a third and much of the remainingassets are illiquid. Still, despite getting absolutely crushed, theywon an industry award for sweeping reform and leading edge de-sign implementation. Meanwhile, had the 2006 vote not passedand the original portfolio remained intact, pension assets wouldbe approximately 20 percent higher today, equating to a fewbillion dollars.
Pensions Are Different
Whatever pension-cost surprises are in store for shareholders downthe road, these jolts will be surpassed many times over by those expe-rienced by taxpayers. Public pension promises are huge and, in manycases, funding is woefully inadequate. Because the fuse on this timebomb is long, politicians flinch from inflicting tax pain, given thatproblems will only become apparent long after these officials have de-parted. Promises involving very early retirement—sometimes to thosein their low 40s—and generous cost-of-living adjustments are easy forthese officials to make. In a world where people are living longer andinflation is certain, those promises will be anything but easy to keep.
—Warren Buffett, Berkshire Hathaway 2007 Letter
While troubles with endowments and universities are worrisome,endowments only represent a little more than $400 billion of capital.Pensions, however, are almost 60 times larger in terms of assets and theymore directly impact a wider proportion of society because the taxpayerultimately foots the bill for their shortcomings. Over the past decade,pension funds piled headlong into the Endowment Model, the ultimateverdict for which is still out; but pensions could wind up being the reallosers. For years, demographic challenges have been putting stress on thepension system, and 2008 investment losses exacerbated these issues. Ac-cording to Watson Wyatt, the 11 largest pension markets saw assets fall by19 percent in 2008. The consultancy noted a “significant deterioration in

P1: OTA/XYZ P2: ABCc01 JWBT268-Drobny March 2, 2010 21:2 Printer Name: To Come
26 R E A L M O N E Y A N D T H E C R A S H O F ‘ 0 8
solvency, raising the probability of plan defaults and producing pressuresfor revised strategies.”
CalPERS is emblematic of the broader pension world. For its fund-ing calculations, it has been reporting an expected rate of return of7.75 percent for the past eight years, and 8.25 percent prior to that.Meanwhile, the actual annualized return over the past decade—fromfiscal year 2000 to fiscal year 2009—is only 2.46 percent, and in 2008,it lost over 27 percent. CalPERS, combined with its cross-town rival,CalSTRS (the second largest pension in the United States), had reportedpeak assets of $436 billion in late 2007, and suffered a peak-to-troughdrawdown of $164 billion by early 2009. The California state taxpayeris the backstop.
By way of comparison, when the Orange County pension fundblew up in 1994 amidst great scandal, losses only amounted to$1.64 billion, yet services were cut drastically. Today, California has abudget crisis that has seen state worker furloughs, payments in the formof IOUs, layoffs, and other services cut. California already has the one ofthe highest state income tax rates in the United States at 10.55 percent,and has been losing businesses and state residents (taxpayers) for years.Not a very solid backstop.
But it is not all dire. Some forward-thinking pension fund managersare asking good questions about the looming issues. At a September2009 meeting in Sacramento with Joseph Dear, the newly appointedCIO of CalPERS, we discussed the daunting issues facing Californiapensions. Faced with significant underfunding and demographic chal-lenges, a pension has two options to address the situation: (1) increasecontribution levels, reduce benefits, or inject cash from outside sources;and/or (2) improve investment performance. Dear had this to say duringour discussion:
One of the really big questions I am trying to address is how to doasset allocation in this environment because the standard method thatwe use, that is sold by consultants and is deemed prudent is predicatedon a set of assumptions which are empirically false. The whole edificeis built on the assumption that returns are normally distributed andthat this is a formula driven exercise whereby returns, volatilities andcorrelations can be derived by looking at history. As a result, everyone’sportfolio ends up looking like everyone else so it is deemed okay if

P1: OTA/XYZ P2: ABCc01 JWBT268-Drobny March 2, 2010 21:2 Printer Name: To Come
Rethinking Real Money 27
you lose money along with everyone else. But it does not adequatelyaddress risk. It does not adequately address inter time period fundingissues whereby the 20 year horizon may work but you may run outof money in the intermediate period. The main question I am facedwith is how to run a large pension fund in light of these issues.
Addressing the “risk” side of the equation head-on is a step in theright direction.
III. RETHINKING REAL MONEY—MACRO PRINCIPLES
One of the main conclusions to come out of this book is that theaccepted standard practice of real money no longer works. Real moneymanagement needs to be rethought as the old methodologies have failed.The massive growth of real money funds took place in a very benignenvironment where inflation was falling and virtually all assets performedwell. In such conditions, static rule based strategies such as buy and hold,stocks for the long run, and the Endowment Model worked. But in anew, less benign world of higher volatility, a change in standard practiceis required.
Despite the widespread pain and colossal losses endured by mostinvestors in 2008, there were a few bright spots. Global macro hedgefunds, in aggregate, proved resilient by effectively managing risk andkeeping a sharp focus on liquidity. The most successful made substan-tial gains, in large part due to tactical risk management techniques. Inaggregate, global macro hedge funds, as measured by the HFRI MacroIndex, returned 4.83 percent in 2008 and were up 4.03 percent for2009. Since 1990, the HFRI Macro Index has returned an average ofapproximately 14 percent annually with annualized monthly volatilityof 7.8 percent and only one losing calendar year—down 4.3 percent in1994 (see Figure 1.9).
One of the primary factors enabling global macro funds to exhibitsuch strong long-term performance is the avoidance of significant draw-downs. Consistently compounding positive returns leads to strong long-term performance, whereas significant, even if infrequent, drawdownsdestroy performance. Because of the phenomenon of negative com-pounding, big losses are very hard to recover from. “Siegel’s Paradox”

P1: OTA/XYZ P2: ABCc01 JWBT268-Drobny March 2, 2010 21:2 Printer Name: To Come
28 R E A L M O N E Y A N D T H E C R A S H O F ‘ 0 8
–100%
100%
300%
500%
700%
900%
1100%
1300%
1500%
1990
1992
1993
1994
1995
1996
1997
1998
1999
2000
2001
2002
2003
2004
2005
2006
2007
2008
2009
Tota
l Ret
urn
HFRI Macro
Yale
Harvard
S&P500HFRI FoFsCalPERSBarclays AGG
MSCI WorldCommoditiesCRB
MSCI EM
HFRI MacroAnnualized return: 13.8%Annualized volatility: 7.8%
1991
Figure 1.9 Cumulative Returns, 1990–2009Source: Bloomberg; HFR, CalPERS Annual Reports, http://www.calpers.ca.gov/; and Mebane Faber,The Ivy Portfolio (Wiley).
explains how gains and losses are not symmetric, losses are much worse.For example, a loss of 50 percent requires a gain of 100 percent just tobreak even. In other words, the bigger the hole, the harder it is to digout of (see Table 1.6).
This book offers a contribution towards a new model for real moneymanagement leaning heavily on the methods used by many global macrohedge funds and by looking at the lessons learned in 2008. Although Ispoke with many real money managers for background on this project,few had the performance in 2008 that would warrant their inclusion.When discussing the concept of this book with a chief investment officerat a billion dollar university endowment, he said:
Who are you interviewing for the real money part? Most people gotsmoked—including me—and don’t warrant an interview. We shouldhave all just been long 50 percent emerging market equities and 50percent government bonds for the last 6–7 years and learned to surf.

P1: OTA/XYZ P2: ABCc01 JWBT268-Drobny March 2, 2010 21:2 Printer Name: To Come
Rethinking Real Money 29
Table 1.6 Siegel’s Paradox
LossesReturns Needed toGet Back to Even
0% 0%−10% 11%−20% 25%−30% 43%−40% 67%−50% 100%−60% 150%−70% 233%−80% 400%−90% 900%
Instead, we did all this work to fool ourselves into thinking we foundthe next best manager since Medallion, and we completely missed outon the macro.
Even Yale endowment chief David Swensen recognized the need totake a more forward-looking, global macro approach. In the May 2009interview on Consuelo Mack WealthTrack (PBS), Swensen said:
One of the difficulties of this current crisis is that we have to thinkabout securities markets more from a top-down basis or macro basisthan is the case when we’re not facing the type of crisis we livedthrough in the past six or nine months or a year. I am religiouslybottom up in everything we do . . . but the crisis forces you to thinktop-down in ways that would, I think, be unproductive in normalcircumstances, but are absolutely necessary in the midst of a crisis. Youhave to think about the functioning of the credit system. You have tothink about the potential impact of monetary policy on markets overthe next 5 or 10 or 15 years.
The question is: Why wait for a crisis to take a global macro ap-proach when arguably it is already too late? Why not incorporate certainglobal macro principles into a real money investment approach, meldingthe best from both worlds? Understanding how global macro managersavoided large losses and made money in 2008 offers a unique opportunity

P1: OTA/XYZ P2: ABCc01 JWBT268-Drobny March 2, 2010 21:2 Printer Name: To Come
30 R E A L M O N E Y A N D T H E C R A S H O F ‘ 0 8
for new ideas and approaches to be adopted by real money managersand all investors.
The real successes of 2008 occurred when managers took decisiveaction rather than sat still and hoped that everything would be okayin the long run. The way that global macro managers approach riskdistinguishes them from other hedge fund strategies and real moneymanagers. Regardless of valuation metrics or the general attractivenessof an opportunity, a macro manager will always want to know howmuch he can lose in his portfolio at any given time. The entire portfolioconstruction process is anchored in risk: What will this specific tradestrategy add in terms of overall risk to the portfolio? What are the truerisks assumed for each position? In a worst-case scenario, how much canthe portfolio or the position lose?
Analyzing the world through a risk prism in no small way enabledmacro managers to avoid the pitfalls that befell other investors during2008. Steadily compounding positive returns while avoiding large draw-downs may sound boring, but it is an effective way to build capital overthe long-term. Ironically, conventional wisdom in the investment worldholds that global macro hedge funds are risky while real money fundsare prudent and safe.
It is now clear that real money managers need to reorient theirthought process and approach towards improving the portfolio con-struction process, especially if they have annual cash needs. Specifically,a more forward looking risk-based approach should be at the foundationof real money portfolios. Real money managers should:
1. Replace return targets with risk-adjusted return targets. Bigdrawdowns and volatility matter. Focusing on return targets missesthe damage to performance caused by large drawdowns and highvolatility. Portfolios should be constructed such that extreme worst-case scenarios are accounted for and dealt with in the investmentprocess, either through the use of overlays, hedges to cut off tail risk,or less aggressive asset allocation with truly diversifying exposures.
2. Look forward, not backward. Historical asset class or fund per-formance is not a good indicator of the future. Real money portfo-lios should not be constructed to fit the recent past no matter howcomfortable that may be. The macro environment matters greatly

P1: OTA/XYZ P2: ABCc01 JWBT268-Drobny March 2, 2010 21:2 Printer Name: To Come
Rethinking Real Money 31
and should be considered first and foremost when constructingportfolios.
3. Rethink liquidity. Do not undervalue liquidity when the worldlooks benign and volatility remains low. Low probability events bydefinition escape most models, but this does not mean that theyshould be ignored. On the contrary, it is the fiduciary duty of realmoney managers to manage to potential scenarios where liquiditycan disappear. Similarly, real money managers should not overvaluethe return received from taking on illiquidity. Time horizons aremuch shorter than generally believed.
The following interviews offer a wealth of new ideas and strategiesfor rethinking real money. While I don’t pretend to have all the answers,this book is a good starting point for developing a new model andframework for real money managers.

P1: OTA/XYZ P2: ABCc01 JWBT268-Drobny March 2, 2010 21:2 Printer Name: To Come
32