real-iime mapping alert system: characteristics and
TRANSCRIPT

REAL-IIME MAPPING ALERT SYSTEM: CHARACTERISTICS AND CAPABILITIES
By Luis A. Torres, Susan C. Lambert, and Timothy D. Liebermann
U.S. GEOLOGICAL SURVEY Open-File Report 95-375
Columbia, South Carolina 1995

U.S. DEPARTMENT OF THE INTERIOR
Bruce Babbitt, Secretary
U.S. GEOLOGICAL SURVEY
Gordon P. Eaton, Director
For additional information write to:
District Chief U.S. Geological Survey Stephenson Center- Suite 129 720 Gracern Road Columbia, SC 29210-7651
Copies of this report can be purchased from:U.S. Geological SurveyEarth Science Information CenterOpen-File Reports SectionBox 25286, Mail Stop 517Denver Federal CenterDenver, CO 80225
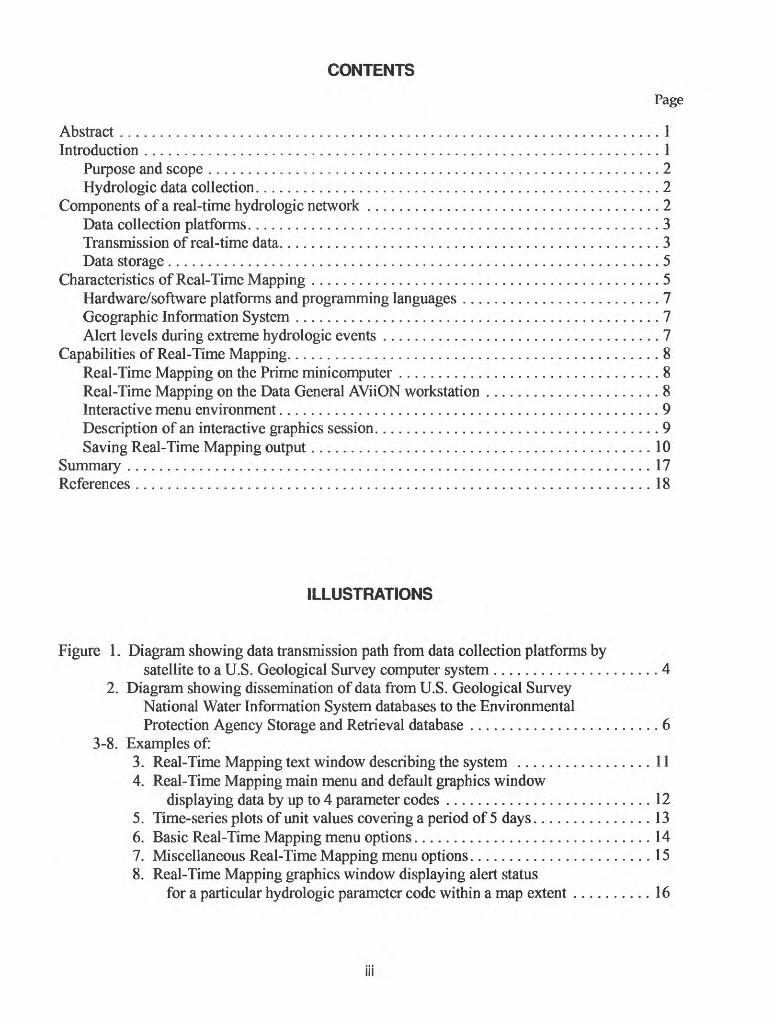
CONTENTS
Page
Abstract .................................................................... 1Introduction ................................................................. 1
Purpose and scope ......................................................... 2Hydrologic data collection................................................... 2
Components of a real-time hydrologic network ..................................... 2Data collection platforms.................................................... 3Transmission of real-time data................................................ 3Data storage.............................................................. 5
Characteristics of Real-Time Mapping ............................................ 5Hardware/software platforms and programming languages ......................... 7Geographic Information System .............................................. 7Alert levels during extreme hydrologic events ................................... 7
Capabilities of Real-Time Mapping............................................... 8Real-Time Mapping on the Prime minicomputer ................................. 8Real-Time Mapping on the Data General AViiON workstation ...................... 8Interactive menu environment................................................ 9Description of an interactive graphics session.................................... 9Saving Real-Time Mapping output........................................... 10
Summary .................................................................. 17References ................................................................. 18
ILLUSTRATIONS
Figure 1. Diagram showing data transmission path from data collection platforms bysatellite to a U.S. Geological Survey computer system ..................... 4
2. Diagram showing dissemination of data from U.S. Geological Survey National Water Information System databases to the Environmental Protection Agency Storage and Retrieval database ........................ 6
3-8. Examples of:3. Real-Time Mapping text window describing the system ................. 114. Real-Time Mapping main menu and default graphics window
displaying data by up to 4 parameter codes .......................... 125. Time-series plots of unit values covering a period of 5 days............... 136. Basic Real-Time Mapping menu options.............................. 147. Miscellaneous Real-Time Mapping menu options....................... 158. Real-Time Mapping graphics window displaying alert status
for a particular hydrologic parameter code within a map extent .......... 16
in

ACRONYMS AND DEFINITIONS
AD APS AML ANSI ARC
ARC/INFOCPLDCPDAPSDCSDG/UXDOMSATEPAESRIFORTRAN 77CISGOESINFOLRGSMIDASNOAANWISPRIMOSRTMAPREAL-TIMESTORETUNIX
WATSTORE
Automated Data Processing SystemArc Macro LanguageAmerican National Standards InstituteA continuous string of x,y coordinate pairs (vertices) having length,direction, but no area. It represents line features, borders of areafeatures, or both.Registered software trademark of ESRI for handling GIS dataCommand Procedure LanguageData Collection PlatformDCS Automated Processing SystemData Collection SystemData General UNIX Operating SystemDomestic SatelliteU. S. Environmental Protection AgencyEnvironmental Systems Research InstituteFormula Translation Programming Language Standard 1977Geographic Information SystemGeostationary Operational Environmental SatelliteA relational database management system property of ESRILocal Readout Ground StationMultiple Index Data Access SystemNational Oceanic and Atmospheric AdministrationNational Water Information SystemPrime Operating SystemReal-Time MappingAn actually occurring eventStorage and RetrievalAn operating system based on the C programming language that couldbe easily ported to different computer systemsWater Storage and Retrieval
Any use of trade, product, or firm names in this report is for identification purposes only and does not constitute endorsement by the U.S. Government.
IV

REAL-TIME MAPPING ALERT SYSTEM: CHARACTERISTICS AND CAPABILITIES
By Luis A. Torres, Susan C. Lambert, and Timothy D. Liebermann
ABSTRACT
The U.S. Geological Survey has an extensive hydrologic network that records and transmits precipitation, stage, discharge, and other water-related data on a real-time basis to an automated data processing system. Data values are recorded on electronic data collection platforms at field sampling sites. These values are transmitted by means of orbiting satellites to receiving ground stations, and by way of telecommunication lines to a U.S. Geological Survey office where they are processed on a computer system. Data that exceed predefined thresholds are identified as alert values. The current alert status at monitoring sites within a state or region is of critical importance during floods, hurricanes, and other extreme hydrologic events. This report describes the characteristics and capabilities of a series of computer programs for real-time mapping of hydrologic data. The software provides interactive graphics display and query of hydrologic information from the network in a real-time, map-based, menu-driven environment.
INTRODUCTION
An extensive monitoring network is used by the U.S. Geological Survey (USGS) to collect and transmit hydrologic data to the Automated Data Processing System (ADAPS) (Dempster, 1990) that operates on a minicomputer. The hydrologic data are referenced by parameter codes that correspond to stage, discharge, precipitation, specific conductance, and other characteristics. Values that exceed predefined thresholds are flagged as alert values. Information on current hydrologic conditions at monitoring sites within a state or region is of critical importance to government agencies during floods, droughts, hurricanes, and other extreme hydrologic events. There is an increasing need for the USGS and other agencies to visualize hydrologic events as they are actually occurring (real-time). Public water and power utilities, civil defense, environmental protection, natural resource, county, regional, and local cooperators can use this information for effective responses to emergency situations. A Real-Time Mapping (RTMAP) alert system was developed to satisfy USGS requirements and to enhance the dissemination of hydrologic data.
The RTMAP alert system is a series of computer programs that provides interactive graphics display and query of hydrologic data in a map-based, menu-driven environment. The hydrologic data, along with site-header information are retrieved automatically from AD APS and processed into a Geographic Information System (GIS). Monitoring sites are identified on a state or regional map and flagged according to their alert status. When a site and associated parameter code are selected, a time-series graph of the current value, and values from the previous 5-day period, can be displayed within a graphics window on a computer screen. Plot files of the current map, graph, entire graphics window, or time-tagged tabular information can be sent directly to a postscript laser printer. Additional capabilities are incorporated in the RTMAP alert system to give the user a wide range of options for investigation and analysis of hydrologic data.
Purpose and Scope
The purpose of this report is to present the characteristics and capabilities of the RTMAP alert system, version 1.2.1. The report explains the hardware and software resources used for collecting, transmitting, storing, and mapping hydrologic data. The report also explains how the RTMAP software works. The scope of the report is confined to the usage of hydrologic data by the RTMAP alert system within a GIS environment.
Hydroloqic Data Collection
Hydrologic data collection provides the USGS with a database for evaluating the surface and ground-water resources of the nation. Standardized procedures are used to collect a wide variety of data including stage, discharge, reservoir or lake elevation, ground-water levels, and the quality of surface water and ground water. Parts of the data are available on a real-time basis to determine saltwater intrusion, minimum discharge requirements, drought conditions, industrial water-use criteria, and flood-control procedures.
COMPONENTS OF A REAL-TIME HYDROLOGIC NETWORK
The components of a typical USGS hydrologic network include monitoring sites, telecommunication media, and receiving stations. Sophisticated computer systems are used to process, store display, and analyze data reflecting current hydrologic conditions. In this report, the term 'site' refers to a field station equipped with instrument sensors connected to a data collection platform (DCP). A site can provide data from either one or several instrument sensors. There are more than 4,000 monitoring sites within the United States and its territories equipped with DCP's (Shope, 1994). In this report, the term 'real-time' refers to events that are actually occurring or have occurred within a time period of 15 minutes or less. Each DCP is capable of collecting and transmitting data on a real-time basis. The USGS offices in the Caribbean, Florida, Kansas, New York, North Carolina, Pennsylvania, and South Carolina have real-time hydrologic networks in operation. In some USGS offices, real-time hydrologic networks perform better than average. For example, the Caribbean District often receives data from its hydrologic network within just 5 minutes.

Data Collection Platforms
The DCP converts analog sensor signals from monitoring instruments into digital form and transmits the data by means of orbiting satellites, radio relays, or telephone lines. In most instances, the USGS prefers to transmit DCP data by satellite, because it is less expensive and more reliable, especially if sites are located in remote areas. The DCP can be programmed to collect hydrologic data at various time intervals, store data in memory, and then transmit the data on a specific channel and at preset time intervals assigned by the National Oceanic and Atmospheric Administration (NOAA). Under normal conditions, DCP's collect data every 15 minutes or longer, and then transmit every 4 hours. The USGS consults with NOAA to determine the time of the first transmission of the day, and subsequent time thereafter. For example, if NOAA determines that the first DCP transmission of the day for a particular site is at 0200 hours, then the next scheduled transmissions must be at 0600, 1000, 1400, 1800, and 2200 hours. The assigned schedule is strictly followed, because other agencies share the same satellite for their data transmission. A DCP may transmit outside the scheduled time and at shorter intervals, depending on the severity of the hydrologic condition being monitored. In that case, an emergency channel is used. Transmissions occurring at the preset time interval are identified as self-timed transmissions, and transmissions occurring outside the preset time interval are identified as random transmissions. NOAA allows the USGS to define the time interval for random transmissions, which are usually set to intervals of 5 minutes or longer. The channel used for carrying random transmissions is commonly known as the random channel. The self-timed and random transmissions are allowed through assigned channels only. After the DCP collects and transmits the instrument sensor measurements, the block of data is relayed by orbiting satellites to one or more receiving ground stations. The data are then processed into USGS computers.
Transmission of Real-Time Data
Most of the DCP's used by the USGS transmit real-time data to a Geostationary Operational Environmental Satellite (GOES) system. The primary mission of the GOES system is to continuously observe weather phenomena through satellites orbiting approximately 23,000 miles from Earth. As a secondary function, the GOES system supports a radio relay or Data Collection System (DCS). The DCS enables the relay of a large variety of environmental data from point sources on land and sea, through GOES and back to Earth where they are disseminated to various computer users. The DCS Automated Processing System (DAPS), a software package developed for NOAA, supports the increased volume and complexity of data collection since the inception of real-time hydrologic networks. The DAPS software resides in a large computer system located at the NOAA Command and Data Acquisition facility on Wallops Island, Va. This facility continually monitors 266 GOES data channels for incoming DCP messages. Currently (1995), more than 7,000 platforms are active in the DCS. The DAPS software continuously transmits all incoming DCP messages to a Domestic Communication Satellite (DOMSAT) system (Integral Systems Inc., 1993). The DOMSAT system broadcasts the signal, which is received by Local Readout Ground Stations (LRGS) at USGS offices throughout the nation (fig. 1).

Figu
re 1
.-- D
ata
trans
mis
sion
pat
h fro
m d
ata
colle
ctio
n pl
atfo
rms
by s
atel
lite
to a
U
.S.
Geo
logi
cal S
urve
y co
mpu
ter
syst
em.

Data Storage
When the data are received by a LRGS, they are immediately forwarded to a Prime minicomputer by telecommunication lines and processed by AD APS, which is a part of the USGS National Water Information System (NWIS) database. Each instrument-sensor measurement processed by AD APS acquires a time tag that is derived from the date and time the DCP data were actually transmitted. Time-tagged measurements are known as unit values. Unit values are then aggregated to generate daily values. On a regular basis, the data are sent to the USGS National Water Data Storage and Retrieval (WATSTORE) database in Reston, Va. Data from WATSTORE are accessible to Federal, state and local agencies, and the private sector. Water- quality data are ported to the U.S. Environmental Protection Agency (EPA) Storage and Retrieval (STORE!) database in Washington, D.C. (fig. 2) (Edwards, 1987).
Monitoring sites within AD APS are identified with an USGS downstream order number, varying from 8 to 15 digits (example, 021169500), or with a 15-digit identifier composed of latitude, longitude, and a sequence number. Instrumentation at some sites records river stage or gage-height. Stage data may be converted to discharge by using pre-established rating curves. Instrumentation at other sites records the amount of precipitation with rain gages, and provides information about current water-quality conditions.
Each type of data collected at a monitoring site is assigned a 5-digit parameter code. The same numbering system is used by the EPA and the USGS (Hutchinson, 1975). For example, the parameter code 00010 denotes water temperature in degrees Celsius, and 00400 denotes pH in standard units. For a given monitoring site, unit values are stored by parameter code within AD APS and also are aggregated into daily values (Smith, 1993).
CHARACTERISTICS OF REAL-TIME MAPPING
During major hydrologic events, water-resource specialists and managers need up-to-date information on the hydrologic status at monitoring sites within the area of their concern. Real- time information is important for making operation and management decisions. The RTMAP system of computer programs provides the user with interactive display and query of current data from a hydrologic alert network using a map-based, menu-driven, graphics environment. The USGS is presently (1995) using the RTMAP system in many district offices for a variety applications.

OTHERUSGSPRIME
COMPUTERSYSTEMS
USGSPRIME
COMPUTERSYSTEM
NWIS DATABASE
NWIS SOFTWARE
USGSWATSTORE
DATABASE INRESTON,
VIRGINIA
EPASTORET
DATABASE
Figure 2.-Dissemination of data from U.S. Geological Survey National Water Information System databases to the Environmental Protection Agency Storage and Retrieval database.

Hardware/Software Platforms and Programming Languages
The RTMAP alert system currently (1995) depends on two distinct computer platforms; the Prime minicomputer and the Data General AViiON workstation. The Prime minicomputer contains the hydrologic data needed for processing, and the Data General AViiON workstation contains the computer resources enabling interaction with the user. Consequently, the RTMAP computer programs had to be coded in Command Procedure Language (CPL), Prime Fortran 77, Arc Macro Language (AML), and Green Hills Fortran-88000. The CPL and Prime Fortran 77 programs on the Prime minicomputer run within the Prime Operating System (PRIMOS) environment. The AML and Green Hills Fortran-88000 programs on the Data General AViiON workstation run within the UNIX Operating System (DG/UX) environment. The Green Hills Fortran-88000 programs follow the American National Standards Institute (ANSI) technical specifications, and are self-contained. They do not require the addition of other program libraries during creation of the executable code. The AML programs are interpreted and run by ARC/ INFO, a commercial software package used by the USGS for the handling of GIS data. The AML programs were written during 1991-92 using revision 5.0.1 of the ARC/INFO software (Liebermann, and others, 1992), and in early 1993 were modified using revision 6.1.1. At present (1995), the USGS intends to transfer all stored hydrologic data from the Prime minicomputer to the Data General AViiON workstation as soon as possible. The RTMAP software is be modified accordingly.
Geographic Information System
The RTMAP software relies on GIS technology to show a hydrologic network and the associated real-time data on regional maps. The software takes advantage of the menu-driven environment of ARC/INFO by offering many point-and-click options; thus, one does not need extensive training to use it. A user can overlay maps depicting geographic features, such as hydrologic units, county boundaries, river basins, or points that indicate monitoring sites. The RTMAP software allows the user to query the underlying database of map features, either by pointing to them or selecting them from a list.
Alert Levels During Extreme Hydrologic Events
The RTMAP software uses threshold values that can be set either within or outside AD APS. Each installation of RTMAP has its own list of sites, parameters, and thresholds. The RTMAP software highlights monitoring sites containing unit values exceeding alert thresholds, and also determines the alert level of the hydrologic event for each site. The RTMAP software treats monitoring sites with undefined alert thresholds as sites where unit values are within normal range.

CAPABILITIES OF REAL-TIME MAPPING
The RTMAP programs on the Prime minicomputer are capable of retrieving and sending data to an outside computer by way of network communication lines. The RTMAP programs in the Data General AViiON workstation are capable of processing data coming from the Prime computer or any other source and providing a user-friendly, interactive graphics session.
Real-Time Mapping on the Prime Minicomputer
The first component of the RTMAP software contains CPL and Fortran 77 programs that retrieve hydrologic data stored by ADAPS on the Prime minicomputer. They extract and decompress data from Multiple Index Data Access System (MIDAS) files. They also transfer the extracted data to the Data General AViiON workstation. These programs usually run at fixed intervals using the PRIMOS job-timer utility. Two data files, 'mapdat' and 'mapdatS', are created during the retrieval process. The 'mapdat' file contains the most current data for sites and parameter codes for which threshold values have been defined. As many as 4 parameter codes can be retrieved for each site. The 'mapdatS' file contains the unit values for the previous 5-day period. The two files are transferred to the Data General AViiON workstation for further processing.
Two additional files, 'rtsite' and 'rthresh', are created. The 'rtsite' file contains site- description data, including latitude and longitude coordinates and the active parameters (instrument sensors) configured for each site. The 'rthresh' file contains alert thresholds for any or all parameters configured for each site. These files must be transferred whenever site descriptions or threshold data have changed. Changes to site descriptions and alert thresholds are made by USGS personnel using NWIS software. The 'rtsite' and 'rthresh' files can also be modified by the user with a text editor.
Real-Time Mapping on the Data General AViiON Workstation
The second component of the RTMAP software is composed of about 30 AML programs and 5 Green Hills Fortran-88000 programs. These programs generate a series of menus that pro vide the interactive link with the user. Although the programs were primarily developed for a Data General AViiON workstation or file-server, they could run on various UNIX-based worksta tions made by other manufacturers. The principles of design for the menus are similar to those described by Lanfear (1991).
There are three principal AML programs that initiate all activities on the workstation. The first two generally process data into ARC/INFO format; the third initiates the interactive graphics session. Data-processing functions begin with the program GEN_RTSITE.AML. This program reads the site description file and creates a spatial database or coverage (in ARC/INFO

terminology) containing one point for each site in the hydrologic alert network. This program needs to be executed when information regarding sites or associated parameter codes has changed. A second program, PROC_RTSITE.AML, processes the data files 'mapdat' and 'mapdatS'. The program produces summary files, creates INFO database files from the current data, and relates these files to the point coverage. This program should be executed when new data have been retrieved from ADAPS. Both AML programs can be initiated by a system administrator or can be executed at regular intervals using a job-timer utility. The third program, RTMAP.AML, is the entry point to the interactive display and query of the real-time data. It invokes the primary menu, which in rum controls an extensive set of AML programs, other menus, and Fortran programs. It is executed when a user examines alert data.
Interactive Menu Environment
The interactive menus are designed with the goal of presenting a simple, intuitive set of choices that provide flexibility to the user. The RTMAP graphics system is self-documenting. A complete set of on-line documentation can be displayed or printed. Each pull-down sub-menu contains a help feature that explains the listed options. Extensive additional menu functions are incorporated into the RTMAP graphics system to give the user a wide range of options for analyzing data and creating custom printed output. These include the capability to select and display sets of features from coverages, both within the default work space and a user-defined work space, and the identification of coverage features and their attributes. For example, the user can redisplay the state or regional map by defining a quadrangular area, include only sites monitoring a particular parameter, include a roads coverage, exclude the streams coverage, insert markers into the current graphics windows, save to a file, output to a postscript printer, and so forth.
Description of an Interactive Graphics Session
At the beginning of the interactive graphics session, an initial window describes the RTMAP system (fig. 3), followed by a graphics window (fig. 4). County boundaries, hydrographic features, and monitoring sites are drawn for the state or region. The current data values are drawn for each site by use of symbols designed to provide a quick summary of hydrologic conditions. Each monitoring site is represented by a multi-colored square. Each square is divided in 4 sub-squares that represent 4 parameters. A red sub-square indicates that the parameter is in extreme or very high alert status. An orange sub-square indicates that the parameter is in high alert status. A green sub-square indicates that the parameter is in the normal range or non-alert status. A non-colored sub-square indicates that no current data exist for the parameter at that site.

The RTMAP software also offers the user the capability to draw a graph of data for the previous 5-day period. After a specific site and parameter have been selected using point-and- click operations, a time-series graph can be created. The graph is placed in the upper-right corner of the graphics window. A major hydrologic event at two sites is shown in figure 5. Concurrent precipitation values are drawn above the main graph. The programming code that produces the time-series graph is flexible; it contains generic subroutines and functions for producing a wide variety of graphs within the ARC/INFO plotting environment.
The user can choose from a wide range of menu options to access and display hydrologic data in greater detail (fig. 6 and 7). In general, the user can make choices by a point-and-click operation, with information listed in popup displays. Two typical operations are selecting a single parameter code for display, and zooming a smaller section of the map extent.
An example of the graphics window for these typical operations is shown in figure 8. Selecting a single parameter code allows more information to be displayed, such as extreme low, low, normal, high, and extreme high alerts. The insert that shows the alert symbols also summarizes the number of sites for each category of alert status. The area of the current map display is shown as an outline box on the map extent index.
Saving Real-Time Mapping Output
The user can choose at any time to save graphic displays to postscript files, or to map compositions. The current map, graph, or entire graphics screen can be saved, and also sent to a postscript laser printer for output. All displayed graphics are automatically saved to ARC/INFO files, known as map compositions, to enable a faster printing process. The information in the relational database management system INFO, which supports all attribute data associated with the point coverage of the monitoring sites, also can be printed. This gives the user the capability of documenting an extreme hydrologic event with maps, graphs, and unit-value data collected at monitoring sites in high alert status.
10

arc
Real-Time MappingRTMAPof Hydrologic Alert Data
Rev. RTMAP*1*2, Authors:
Office of Water Data Coordination Water Resources Division U,S. Geological Survey
January 7, 1993Tim Liebermann, Carson City, NV Janet C, Ciegler, Columbia, SC Susan Lambert, Columbia, SC
Within the U.S. Geological Survey, an extensive hydrologic network is used to record and transmit remotely sensed data to the Automated Data Processing System CADAPS). Hydrologic data from each sampling site are referenced by parameter codes that correspond to stage, strearnflow, precipitation, specific conductance, and other characteristics. Values that exceed predefined thresholds are flagged as "alert values." Knowledge of the current alert status at sampling sites within a State is of critical importance during flpods, hurricanes, and other extreme hydrologic events*
A system of computer programs called RTMAP (real-time mapping), written in Arc Macro Language (AMD and Fortran, provides interactive graphics display and query of hydrologic data from the network in a map-based, menu-driven environment. Data are processed within a range pf 15 minutes to 4 hours after being recorded, resulting in a "near real time" data base. Site-header information and unit-values data are retrieved automatically from ADAPS and processed into an Arc/Info point coverage and related fiies^ The macro RTHAP + AML controls the menu-driven display and query of the data, Hydrologic sites are displayed on a state or regional map and flagged according to their alert status. If a site and associated parameter code are selected, a time-series graph pf the current value, and values from the previous 5-day period, can be drawn to the graphics screen* Plot files of the current map, graph, or entire graphics screen can be sent directly to a postscript laser printer , Extensive additional functions are incorporated into the RTMAP graphics system to give the user a wide range of options for investigating the available data.
Figure 3.--Real-Time Mapping text window describing the system.
11
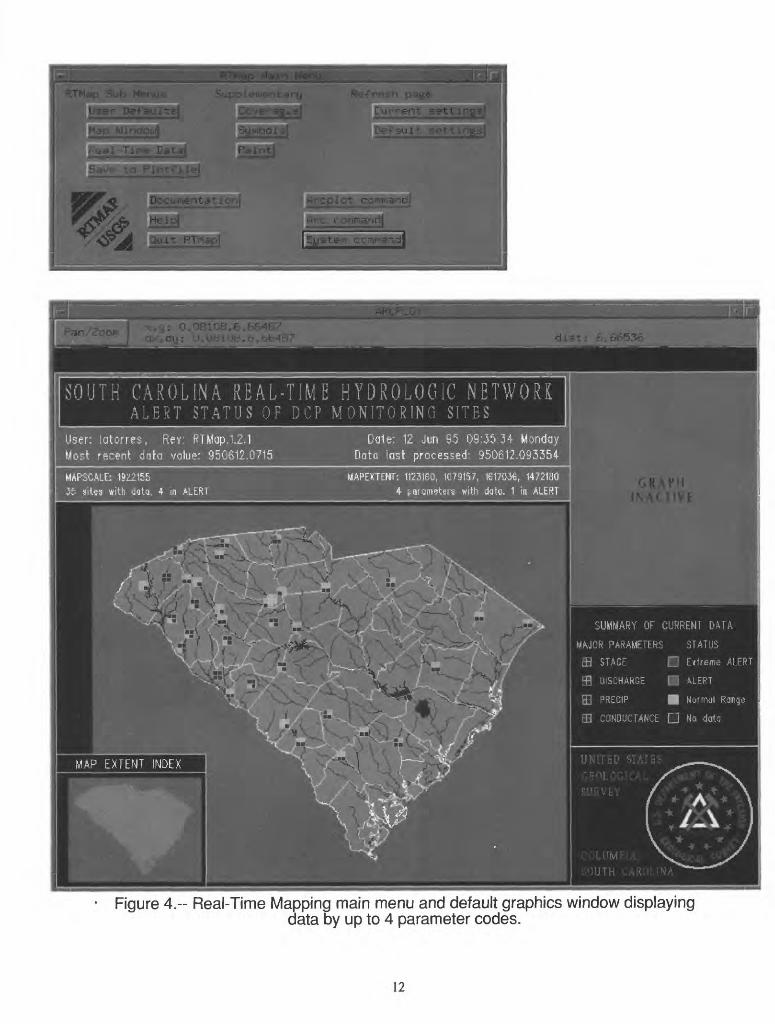
Figure 4.-- Real-Time Mapping main menu and default graphics window displayingdata by up to 4 parameter codes.
12

SITE
: 02
1852
00LI
TTLE
RI
VER
NEAR
W
ALH
ALLA
, .
.
PARA
MET
ER:
0006
0DI
SCHA
RGE,
IN
CUBI
C FE
ET
PER
SECO
ND10
7 va
lues
SITE
: 02
1960
00ST
EVEN
5 CR
EEK
NEAR
M
ODOC
, 5C
PARA
MET
ER:
0006
0DI
SCHA
RGE,
IN
CUBI
C FE
ET
PER
SECO
ND
Aug
ust
I I
^1^^
^^^^
^^^^
^^^^
^-^
Figu
re 5
.--T
ime-
serie
s pl
ots
of u
nit v
alue
s co
verin
g a
perio
d of
5 d
ays.

General
Change parameter)
List dataj
Print data
Sites
Drauj sites(
Identify site)
Select site S parmf^
Select neu> parmj
Graph site & partr.)
PiP corwian >. Help!
Popupurrent parameter: 0 ++t MAJOR PflRMS
MAJOR FARMSPRECIP DISCHARGE m
Other}
Refresh current, mapi
Change Graph Window
Point n Click!
Default|
Refresh currentj
Cancel}
Measure
Where <Lat /Long ) j
Uhere <
Length
Miscel laneousSearcht-olerance}
Map info}
ftP commandj Helpj
Close t-his menilf
J
Figure 6. Basic Real-Time Mapping menu options.
14

Draw
Paint SubMer
Box
Uge.r 3Def au I tB Submenu
Da-ta display L I Connt. ies
_j Hydro Logic unite
j- Streams
PointsBBMBMI^B
Lines
Polygons]
Polygon shadej
Polugon text!
Query coveragesType of feature
iPoint' Linel Pols jM^M^MMrJ- - -J
Identifyl
Statisticsl
List items)
List info'
;RTData Targe
sate? 0 Site namct Parameterj 0 Current dataHost recent measurement;Data value ana alert status;
at
Supplemertary data C.MAPDAT5): Beginning date anc; timei Ending date and time: Numbe*-- a 1 d^ta valuer.t flange of data valL-Ps;
kraph characteristics:^-;;is iLinear Log]
p"~j ftrea shading
Mark ALERT values
_, Time interval average
Internal, in hoars
Include precipit^ition-r if e
g graph) Qu|
at
to:n alert status
Figure 7.--Miscellaneous Real-Time Mapping menu options.
15

dx.d
y:
Isdis
t:
2.1
08U
SOUT
H CA
ROLI
NA R
EAL-
TIM
E HY
DROL
OGIC
NET
WOR
KA
LER
T ST
ATU
S OF
D
CP
MO
NIT
OR
ING
SI
TES
SITE
: G
2154
500
Hffi
TH
PAC
QlE
f Rf
oER
AT F
INGE
RVIL
LE,
5.
C,P
tfME
TER
: W
«5
STAG
E.
IN FE
ET
hto
rre
s,
Rev
:re
cent
do
te
valu
ef^5
Q61
2.G
7,
3065
ST
AGE,
tl
FEET
Dat
e-
12
Jun
95
T3T1
3:58
?a
ta
last
pr
oces
sed
9506
12
MAP
EXTE
NT:
1200
459,
I3
1812
b,
1361
970
CURR
ENT
VALU
ES
OF
0006
5
A
Extre
me
High
AL
ERT
A
High
AL
ERT
With
in
norm
al
rang
e
' Le
w AL
ERT
V
Extre
me
Low
ALEt
tT
No
curr
ent
data
+ Fa
rm
not
avai
labl
e
Figu
re 8
.--R
eal-T
ime
Map
ping
and
gra
phic
s w
indo
w d
ispl
ayin
g al
ert s
tatu
s fo
r a
parti
cula
rhy
drol
ogic
par
amet
er w
ithin
a m
ap e
xten
t.

SUMMARY
The U.S. Geological Survey has an extensive monitoring network designed to collect and transmit data about hydrologic events on a real-time basis, that is, as these events are actually occurring or have occurred within a time period of 15 minutes or less. Most monitoring sites are equipped with data collection platforms that transmit data by means of orbiting satellites to receiving ground stations. Sophisticated telecommunication and computer systems are used to process, store, display, and analyze data reflecting current hydrologic conditions. Each type of data received from a monitoring site is identified with a 5-digit parameter code (example, 00065 for river stage, 00060 for discharge, 00045 for precipitation). Data that exceed predefined thresholds are identified as alert values. Knowledge of the alert status at monitoring sites is of critical importance during major hydrologic events.
A two-component system of computer programs for real-time mapping (RTMAP) was developed to effectively map and display hydrologic data received from the monitoring network. The first component, currently (1995) installed in a Prime minicomputer, retrieves and transfers data at regular intervals. The second component, currently (1995) installed on Data General AViiON workstations, receives and process the transferred data, and interacts with the computer user through a menu-driven, graphics window system. Monitoring sites are identified on a state or regional map and highlighted according to their alert status. Area maps, and time-series graphs, can be generated and printed.
The RTMAP software is written in CPL, Prime Fortran 77, AML, Green Hills Fortran- 88000. It provides computer users a variety of options for display, query, and output of real-time hydrologic data.
17

REFERENCES
Dempster, G.R., Jr., 1990, National Water Information System User's Manual Volume 2, Chapter 3. Automated Data Processing System: U.S. Geological Survey Open-File Report 90-116, 317 p.
Edwards, M.D., 1987, NAWDEX A key to finding water data: U.S. Geological Survey general interest publication, 15 p.
Hutchinson, N.E., ed., 1975, WATSTORE: National water-quality data storage and retrieval system of the U.S. Geological Survey User's guide: U.S. Geological Survey Open-File Report 75-426, 791 p.
Integral Systems, Inc., 1993, DOMSAT Receive Station, Version 2.1 Users Guide, Integral Systems, Lanham Md., 97 p.
Lanfear, K.J., 1991, Design Experiences with Interactive Menus for Users Not Trained in Geographic Information Systems, Conference Proceedings of the Eleventh Annual ESRI Users Conference 1991, Palm Springs, Calif., v. 2, p. 537-543.
Liebermann, T.D., Ciegler, J.C., and Lambert, S.C., 1992, Interactive Display and Query of 'Near Real-Time' Data from a Hydrologic Alert Network, Palm Springs Ca., Twelfth Annual ESRI User Conference, June 8-13, 1992, 7 p., Conference Proceedings.
Shope, W.G., 1994, Hydrologic Data Collection Via Satellite: U.S. Geological Survey Open-File Report 94-28, 2 sheets.
Smith, E.T., comp., 1993, Water Resources Activities of the USGS: U.S. Geological Survey Open-File Report 92-117, 82 p.
18