real estate issues estate issues ® published by the ... bowen h. mccoy, cre. real estate issues...
TRANSCRIPT

REAL ESTATE ISSUES®
Published by THE COUNSELORS OF REAL ESTATE® Volume 39, Number 1, 2014
The Boom and Bust of the Greek Housing MarketNicholas Chatzitsolis, CRE, FRICS, and Prodromos Vlamis, Ph.D.
Watch Your Real Estate Language!Jack P. Friedman Ph.D., CRE, FRICS, MAI
Barry A. Diskin, Ph.D., CRE; and Jack C. Harris, Ph.D.
Landfi lls: Operations and OpportunitiesJoe W. Parker, CRE, MAI, FRICS, and Curtis A. Gentry IV, MAI
Form-Based Zoning from Theory to PracticeDavid Walters and Dustin C. Read, Ph.D., J.D.
Historic Tax Credit Transactions in the Wake of Revenue Procedure 2014-12
Doug Banghart, J.D., LL.M., and Jeff Gaulin, J.D.
Accuracy of Zillow Home EstimatesCharles Corcoran, Ph.D., CFA, and Fei Liu
Renewables, Tax Credits and Ad Valorem Taxes: Are Policies Aligned?
P. Barton DeLacy, CRE, FRICS, MAI
FEATURES AND PERSPECTIVES
RESOURCE REVIEWS
VIEWPOINT
The Metropolitan Revolution: How Cities and Metros are Fixing our Broken Politics and Fragile Economy
Reviewed by Owen M. Beitsch, Ph.D., CRE
The End of the Suburbs: Where the American Dream Is Moving
Reviewed By Roy J. Schneiderman, CRE, FRICS
www.cre.org
The Death of Corporate ReputationBowen H. McCoy, CRE


REAL ESTATE ISSUES Volume 39, Number 1, 2014
2014 EDITORIAL BOARD
BOARD MEMBERS
1
EDITOR IN CHIEF
Mary C. Bujold, CREMaxfi eld Research, Inc., Minneapolis, MN
ASSOCIATE EDITOR
P. Barton DeLacy, CREDeLacy Consulting, LLC, Chicago, IL
LIAISON VICE CHAIR
William P.J. McCarthy, CREW.P.J. McCarthy and Company Ltd.,
Burnaby, BC, Canada
Mahlon ‘Sandy’ Apgar IV, CREBaltimore, MD
Owen M. Beitsch, Ph.D., CREReal Estate Research Consultants, Inc., Orlando, FL
Charles T. Brigden, CRE Clarion Associates, Inc., Chicago, IL
Peter C. Burley, CRERichard J. Rosenthal Center for Real Estate Studies,
Chicago, IL
Maura M. Cochran, CREBartram & Cochran, Inc., Hartford, CT
K.C. Conway, CRE Colliers International, Lilburn, GA
John A. Dalkowski III, CRE PHOENIX Real Estate Counselors, Inc., New York, NY
Anthony F. DellaPelle, Esq., CRE McKirdy & Riskin, PA, Morristown, NJ
Barry A. Diskin, Ph.D., CRE Diskin Property Research, Tallahassee, FL
Geoffrey Dohrmann, CRE Institutional Real Estate, Inc., San Ramon, CA
Anthony Downs, CREThe Brookings Institution, Washington, DC
Jack P. Friedman, Ph.D., CREJack P. Friedman & Associates, Richardson, TX
Tom Hamilton, Ph.D., CRE University of St. Thomas, Minneapolis, MN
John J. Hentschel, CRE Hentschel Real Estate Services, Abingdon, MD
Paul G. Johnson, CREThe Paul G. Johnson Company, Inc., Phoenix, AZ
David Charles Lennhoff, CRE SC&H Appraisal Services, McLean, VA
Mark Lee Levine, CRE University of Denver, Denver, CO
Gerald M. Levy, CREGerald M. Levy & Co. LLC, New York, NY
David J. Lynn, Ph.D., CRELynn Capital Management, Montara, CA
George R. Mann, CRE Robbins, NC
Jonathan J. Miller, CRE Miller Samuel Inc., New York, NY
Steven R. Norris, CRE Norris Realty Advisors, Pasadena, CA
Martha A. O’Mara, Ph.D., CRE Corporate Portfolio Analytics, Cambridge, MA
Peter Oberlechner, LL.M, CRE Wolf Theiss Attorneys At Law, Vienna, Austria
Joe W. Parker, CREAppraisal Research Company, Inc., Jackson, MS
Martha S. Peyton, CRE TIAA-CREF, Newport Beach, CA
Kenneth P. Riggs, Jr., CREReal Estate Research Corporation, West Des Moines, IA
Richard J. Roddewig, CRE Clarion Associates, Inc., Chicago, IL
Charles Noel Schilke, CREThe Johns Hopkins Carey School of Business,
Washington, DC
Roy J. Schneiderman, CRE Bard Consulting LLC, San Francisco, CA
Daniel L. Swango, Ph.D., CRE Swango International, Tucson, AZ
MANAGING EDITOR
Carol ScherfCOPYEDITOR
Mary Jane RummingerDESIGN/PRODUCTION
Charles Kulma
The articles/submissions printed herein represent the opinions of the authors/contributors and not necessarily those of The Counselors of Real Estate®or its members. The Counselors assumes no responsibility for the opinions expressed/citations and facts
used by the contributors to this publication regardless of whether the articles/submissions are signed.
Published by The Counselors of Real Estate, a not-for-profi t organization of the National Association of REALTORS®, 430 N. Michigan Ave., Chicago, IL, 60611. Copyright 2014 by The Counselors of Real Estate of the National Association of REALTORS. All rights reserved. (Printed in USA.)
Third class postage paid in Chicago. Real Estate Issues® publishes three times annually. Subscription rates are: $60 for one year (3 issues); $99 for two years; $120 for three years; $52 per year to students and faculty; $85 for two years; $97 for three years; $67 for one year (3 issues)
foreign rate, $115 for two years; $142 for three years - submit in U.S. currency; single copy $25. Remittance may be made by credit card or personal check, payable to The Counselors of Real Estate. Remittance, change of address notices, undeliverable copies, orders for subscriptions and editorial
material should be sent to Real Estate Issues. The Counselors of Real Estate, 430 N. Michigan Ave., Chicago, IL, 60611. Phone 312.329.8427; Fax: 312.329.8881; Email: [email protected]; Website: www.cre.org. Library of Congress card number LC 76-55075.
Real Estate Issues is a registered trademark of The Counselors of Real Estate, a not-for-profi t organization.
PRESIDENT AND CHIEF EXECUTIVE OFFICER
Mary Walker Fleischmann
REAL ESTATE ISSUES®
Published by THE COUNSELORS OF REAL ESTATE®

REAL ESTATE ISSUES Volume 39, Number 1, 2014
4Editor’s NoteMary C. Bujold, CRE
5Contributors
FEATURES AND PERSPECTIVES
9The Boom and Bust of the Greek Housing Market
Nicholas Chatzitsolis, CRE, FRICS, and Prodromos Vlamis, Ph.D.
Th e Greek housing market may be characterized as imperfect and opaque. Th e aim of this article is to present a review of the recent developments in the Greek residential market and identify the possible links with all of its “peculiarities.” Considerations under assessment include socioeconomic factors such as the ill-based concept that every family must own at least one residential unit for “security” purposes; the extensive land fragmentation in Greece; the trend to concentrate residential development in virtually two cities (Athens and Th essaloniki); and the “unique”—by global standards—development process known as “counter performance.” Th e authors expect their analysis of the Greek residential market to be useful for industry professionals, policymakers and real estate investors alike.
18Watch Your Real Estate Language!
Jack P. Friedman Ph.D., CRE, FRICS, MAI; Barry A. Diskin, Ph.D., CRE; and Jack C. Harris, Ph.D.
Th e same word, spelling and all, can take on diff erent meanings. In this article, the authors hope to illustrate that when using a real estate term that has a diff erent meaning in another profession, oft en as used in accounting, it may be necessary to explain the defi nition used in order to avoid misunderstanding.
21Landfi lls: Operations and Opportunities
Joe W. Parker, CRE, MAI, FRICS, and Curtis A. Gentry IV, MAI
Landfi lls are unique properties that present both questions and opportunities for real estate professionals. In this article, the authors emphasize that the better that real estate professionals understand what landfi lls are and how they work, the better they can help their clients who either have or anticipate business issues related to landfi lls.
29Form-Based Zoning from Theory to Practice
David Walters and Dustin C. Read, Ph.D., J.D.
In this article, the authors explore the potential advantages and disadvantages of form-based zoning to understand how it can be
used eff ectively to support development that is fi nancially viable and socially benefi cial.
Instead of focusing mainly on “use” as the controlling factor in regulating development, form-based zoning is primarily intended to enhance the “public good” derived from private sector development by defi ning the “urban character” of neighborhoods and districts. Th is involves managing the siting, massing and frontage design of buildings in ways that create safe, attractive and effi cient public spaces for movement and public activities.
By emphasizing urban design features, as opposed to use restrictions, and by the inclusion of key “by-right” provisions in the code, form-based zoning can provide real estate developers with greater fl exibility to respond to market forces. If properly administered, form-based zoning can also reduce the amount of uncertainty faced by developers in the entitlement process. However, both these advantages can be compromised through the structure and (mis)application of local regulations.
37Historic Tax Credit Transactions in the Wake of Revenue Procedure 2014-12
Doug Banghart, J.D., LL.M., and Jeff Gaulin, J.D.
Th e historic rehabilitation tax credit (HTC) market was all but frozen by the highly controversial Historic Boardwalk Hall, LLC, v. Commissioner (HBH) court decision of August 2012. Th en last December, the HTC market was given new life by the Internal Revenue Service’s highly anticipated issuance of Revenue Procedure 2014-12. Th is article summarizes the HTC, describes typical investment structures before HBH, recounts the court case and its impact on those structures, and analyzes the practical implications of the Revenue Procedure. While the HTC industry is still adjusting to the new HTC landscape, the authors suggest that investors and principals should be able to craft arrangements that, though not free from risk for developers or investors, have far more tax certainty for both sides than was the case immediately aft er HBH. For that reason they anticipate the Revenue Procedure will bring old as well as new investors into the HTC market.
45Accuracy of Zillow Home Estimates
Charles Corcoran, Ph.D., CFA, and Fei Liu
Th is article compares Zillow.com’s home estimate values (Zestimates) with actual sale prices of 2,005 single-family residential properties in two markets in November 2013. A Zillow “four-star” market in suburban St. Paul, Minnesota, and a Zillow “one-star” market in suburban St. Louis, Missouri, are analyzed in terms of Zestimate accuracy between these two markets, as well as within specifi c price ranges. In aggregate, for both markets and within all prices ranges, the mean diff erence between Zestimates and sale prices is 24.8 percent. Comparing the two markets, Zestimate accuracy is signifi cantly better in
CONTENTS
2
REAL ESTATE ISSUES®
Published by THE COUNSELORS OF REAL ESTATE®

REAL ESTATE ISSUES Volume 39, Number 1, 2014
the four-star market as compared with the one-star market, with a mean diff erence between Zestimates and sales prices of 17.15 percent and 30.48 percent, respectively. However, with the possible exception of the middle market price range, $203,000–$253,000, diff erences between Zestimates and sale prices are so great as to render doubt about the usefulness of Zestimates, regardless of the market’s star rating. Diff erences usually are overestimates, with subsequent sale prices below Zestimate values.
50Renewables, Tax Credits and Ad Valorem Taxes: Are Policies Aligned?
P. Barton DeLacy, CRE, FRICS, MAI
As the renewable energy industry matures, growing controversy swirls around its funding and, ironically, its sustainability. Left unchecked, local assessors can undermine the operating effi ciencies of wind and solar farms with assessments based on replacement cost rather than market value.
In this article, the author explores the implications of how wind and solar farms are project fi nanced and poses two questions that bear directly on their ad valorem assessment:
1. Given that, but for production or investment tax credits, most projects would not be built—do these credits accrue to market value, or are they a form of inverse economic obsolescence?
2. Th e relative productivity of a wind or solar farm is a function of its nameplate capacity. A “Net Capacity Factor” measures its effi ciency. Might the latter serve as a measure of functional obsolescence?
Th ese issues now are being raised in Lost Creek Wind LLC v. DeKalb County Assessor before the State Tax Commission and Circuit Court of Missouri.
VIEWPOINT
26The Death of Corporate Reputation
Bowen H. McCoy, CRE
For more than a century law fi rms, investment banks, accounting fi rms, credit rating agencies and companies seeking regular access to U. S. capital markets made large investments in their reputations. Th ey generally treated their customers well and occasionally even endured losses to maintain their reputations as faithful brokers, dealers, issuers and gatekeepers. Many would conclude that this has changed. In this “Viewpoint,” the fi rst of more to come, the author expresses his concern that today’s
leading capital market participants no longer treat customers as valued counterparties whose trust must be earned and nurtured, but as distant counterparties to whom no duties are required. Th e rough and tumble norms of the marketplace have replaced the long standing fi duciary model in U. S. fi nance. Th e result has been unrelenting fi nancial scandal.
RESOURCE REVIEWS
59The Metropolitan Revolution: How Cities and Metros are Fixing our Broken Politics and Fragile Economy
Reviewed by Owen M. Beitsch, Ph.D., CRE
In Th e Metropolitan Revolution: How Cities and Metros are Fixing our Broken Politics and Fragile Economy, Bruce Katz and Jennifer Bradley, both of the Brookings Institution, off er a blueprint for action which can rebuild economies and is determinedly self-reliant. Th ey speak of a revolution in thought and actions stemming from “cities and metropolitan areas [as] the engines of economic prosperity and social transformation in the United States.” If they are correct in their outlook, they are capturing the essence of a sustainable movement because cities matter, and the strategic solutions breed largely from locally renewable resources.
Covering a range of community-building activities, Katz and Bradley make the case that local developers and their local governments can achieve an extraordinary range of major improvements by linking with grass root activists, civic institutions, local foundations, and local banks historically bypassed in favor of federal resources. Reviewer Owen Beitsch, CRE, gives the book a “thumbs up” saying “the kernels in this book…shine.”
62The End of the Suburbs: Where the American Dream Is Moving
Reviewed By Roy J. Schneiderman, CRE, FRICS
Not oft en does a book reviewed in Real Estate Issues get a “thumbs down,” but reviewer Roy J. Schneiderman, CRE, FRICS, recommends “giving a pass” to this one. “Th e End of the Suburbs presents a fairly superfi cial treatment of the issues, where all roads lead to “the end of the suburbs”—or at least some of the suburbs,” says Schneiderman. “No doubt this book will be very well-received by people who already agree with the title thesis. But it will do nothing to infl uence those who disagree, and little to inform those who are trying to form an opinion.”
3

BY MARY C. BUJOLD, CRE
Editor’s Note
REAL ESTATE ISSUES Volume 38, Number 2, 20134
Welcome to our fi rst issue of 2014! Th is year, we will be publishing three issues during the calendar year, a slight departure from past years. To that end, we are working hard to secure a full slate of interesting articles and features to bring to you. We are always looking for article submissions, both from our own CRE members and from others outside of the CRE organization. If you have an article or an idea for an article, we would like to hear from you.
Just back from an exciting and jam-packed session in Austin, Texas, we were treated, as always, to a wealth of information that will continue to fuel our consulting practices and the real estate industry. We continue to expand on ideas for Real Estate Issues (REI) and we always welcome your comments.
At the end of the Austin Midyear Meetings sessions, we were treated to a sneak peek of the External Aff airs’ Top Ten List of Issues Aff ecting Real Estate for 2014. Th ese issues will remain under wraps until released to the public by 2014 CRE Board Chair Hugh Kelly in June of this year at the annual conference of the National Association of Real Estate Editors. REI has, as one of its initiatives, a commitment to provide a deeper look into the topics that comprise the Top Ten. Once these issues are released, we will continue to source articles that expand on these topics for our membership.
In this issue we are launching a new category for articles entitled “Viewpoint.” Th is category may appear periodically as we receive material that fi ts the criteria for this segment, which highlights the ability of an author
to more fully express an opinion. I am pleased to be able to launch this fi rst category with an essay by CRE Buzz McCoy on the “Th e Death of Corporate Reputation.” Buzz’ submission of this piece was very timely.
We continue to feature articles on topics from our CRE members overseas. As our world is now globally connected, and an increasing number of CREs are working and collaborating with CREs and groups in other countries, it is important that we continue to expand our understanding and knowledge of real estate issues in other geographic locations. In this issue, CRE Nicholas Chatzitsolis and Prodromos Vlamis, Ph.D., have written about the current state of the Greek housing market and how historical patterns of ownership and housing development led to a housing bubble from which the market has yet to recover. Development structures and government regulations are identifi ed, and how they have contributed to the current situation is described. Th e authors also off er several suggestions on how to improve the current housing situation and how to correct some of the imbalances that exist.
David Walters, Ph.D., a British architect and Dustin Read, Ph.D., J.D., the director of Real Estate at UNC Charlotte, have written an article on form-based zoning. Th e focus of the article is to “explore the potential advantages and disadvantages of form-based zoning in the hope of determining how it can be used more eff ectively to support development that is fi nancially viable and socially benefi cial.” Form-based zoning is a hot topic and we are pleased to be able to feature this in REI.

REAL ESTATE ISSUES Volume 39, Number 1, 2014
Similarly, in the development vein, is the article by Doug Banghart, J.D. and Jeff Gaulin, J.D., that discusses the new IRS 2014-12 Revenue Procedure for Historic Tax Credit allowable under Section 47 of the Internal Revenue Code of 1986. According to the authors, this revenue procedure is expected to break open the historic tax credit market which had been frozen because of a controversial legal decision in Historic Boardwalk LLC vs. Commissioner in May of 2013.
“Watch Your Real Estate Language,” an article by Jack Friedman, Ph.D., CRE, Barry Diskin, Ph.D., CRE, and Jack Harris, Ph.D., discusses the use of language in describing real estate activities and how the proper use of words in real estate work and transactions can be critical. Although we may not oft en think of how we use some words such as “value” and “investment,” these words can and oft en mean diff erent things to diff erent parties. It is important that we consider how we, as real estate practitioners, use these terms.
As you will note, our cover photo is somewhat unique this time and shows a landfi ll. Joe Parker, CRE, MAI, FRICS, and Curtis Gentry IV, MAI, have written a substantive piece on landfi lls. As they were submitting this piece to REI, I happened to be driving one day past a landfi ll in Wisconsin and considered their function and operation in our society. Th eir article is timely, informative, and provides a discussion on business opportunities for real estate practitioners associated with these unique operations.
Barton DeLacy, CRE, FRICS, ASA, MAI, presents an article on renewable energy focusing on wind and solar, but discussing the property tax treatments for these types of projects across jurisdictions. Th is article sets the stage for additional treatment of energy-focused topics which are slated to be a focus of our second issue of REI for 2014. Th is is a thoughtful and insightful perspective on how, perhaps, the country as a whole needs to consider how property taxes are allocated towards alternative energy developments.
Charles Corcoran, Ph.D., CFA, and Fei Liu, Ph.D. candidate, present us with a review and discussion of the accuracy of Zillow’s home estimates in large and small markets as a test of how its technology is performing at the local level.
Although not an article in this issue, I want to mention a topic that is of signifi cant importance to all of us as real estate practitioners, and one that is currently fl ying “under the radar screen.” Congress is currently working on budget allocations for the 2020 Census and for the American Community Survey (ACS). In the 2010 Census, the long form was removed and information that was previously collected through the Decennial Census (such as household income) and many housing structural and housing utilization variables were shift ed to the ACS, which is now published annually. Th e accuracy of the ACS relies heavily on having a suffi cient number of households in each area of the country fi ll out and return the forms accurately and in a timely manner. In addition, Congress must continue to support an adequate budget for the dissemination of the survey and its subsequent analysis.
Th e information collected through the Census and the ACS touches all of our lives in many ways. For the real estate practitioner, the information related to population and household growth, employment characteristics, average and median household incomes, owner and rental tenure are critical to development, appraisal work, and the informed and sustained growth and development of communities of all sizes and locations. Without critical data collected through the Census and the ACS, these decisions would be, at best, “guesstimates,” and the costs associated to obtain this information privately would be exorbitant and generally unable to be borne by private entities. I urge all our readers to become more informed on this topic and to understand how the lack of this information could signifi cantly aff ect all of us in the future.
Enjoy this issue!!
MARY C. BUJOLD, CREEDITOR IN CHIEF
5
REAL ESTATE ISSUES Volume 39, Number 1, 2014
REAL ESTATE ISSUES®
Published by THE COUNSELORS OF REAL ESTATE®
CONTRIBUTORS
Doug Banghart, a partner at Jones Day, Boston, practices in the areas of state and federal tax credit syndication, partnership taxation, and nonprofi t organizations. Banghart represents major institutional investors, developers, local governments, community development entities, and nonprofi t organizations, primarily in real estate redevelopment projects. He has extensive experience in closing new markets tax credit leverage fund transactions, including acting as lead attorney on the largest single qualifi ed equity investment ever closed, and twinned historic and new markets tax credit transactions. Banghart frequently speaks on issues related to partnership taxation and the legal and tax implications of various incentive programs. He served as executive editor (1999–2000) and associate editor (1998–1999) of the Capital Defense Journal. He is a member of the Massachusetts Bar Association and the Virginia Bar Association (Young Lawyers Division, Executive Council, 2003–2004).Banghart received his bachelor of arts degree. from Th e College of Wooster, where he was awarded the Raymond R. Day Prize in Urban Studies and the Pew Research Fellowship. He received his juris doctor degree from Washington and Lee University and his master of laws (LL.M) degree in Taxation from the University of Florida.
Owen M. Beitsch, Ph.D., CRE, FAICP, is a senior principal with Real Estate Research Consultants, an Orlando-based fi rm affi liated with GAI that provides economic advisory services to public and private clients throughout the United States. Beitsch serves on the editorial board of Real Estate Issues and is a research associate and adjunct faculty member at the University of Central Florida.
Nicholas Chatzitsolis, CRE, FRICS, managing director, CBRE, Athens, Greece, began his career with Barclays Bank Property Division in London in the 1980s and has more than 25 years of experience as a real estate professional. He has worked for the Greek Public Estates and for the Lambert Smith Hampton Athens offi ce. Since 2008, Chatzitsolis has been managing CBRE – Axies, the appraisal company of CBRE Group in Greece. Chatzitsolis’ work experience includes specialised areas such as industrial plants, oil refi neries, major hotel developments, as well as all types of commercial property. He also has been a member of feasibility study teams examining all aspects of town planning and development appraisal. Chatzitsolis has appeared as an expert witness in British, U.S. and Greek courts in property-related cases.He is a member of the Greek Technical Chamber and a board member of the European Chapter of CRE. He is also a former member of the local (Greek) Board of RICS and a former member of RICS Governing Council. He also served as chairman of RICS Europe during 2001–03. Chatzitsolis has been a visiting lecturer at Panteion University, Athens, since 1999. Chatzitsolis’ earned a bachelor of science degree in Land Admin-istration and a diploma in Estate Management from North East London University U.K., and a master of science degree in Urban Land Appraisal from the University of Reading U.K.
Charles P. Corcoran, Ph.D., CFA, is a professor and chair of the Accounting and Finance Department at the University of Wisconsin/River Falls. His recent publications have appeared in Asset International’s CIO, Global Journal of Business Research, Journal of International Business and Economics, Th e Journal of Accounting and Finance Research, the Journal of Instructional Pedagogy, among others. Corcoran teaches Real Estate Finance. He received his Ph.D. from the University of Minnesota.
P. Barton DeLacy, CRE, FRICS, ASA, MAI, is principal at DeLacy Consulting, LLC, a Chicago-based boutique real estate advisory fi rm specializing in valuation counsel, property tax consulting and Green Energy Valuation. DeLacy’s corporate experience includes practice leadership at Arthur Andersen, Cushman & Wakefi eld and CBRE.Focusing on the real estate implications of power generation, DeLacy has built valuation models and studied property value impacts for geo-thermal, solar, wind- and coal-fi red power generation. He has also developed adaptive re-use studies for obsolete thermal plants. Published in Th e Appraisal Journal, Real Estate Issues and Th e Journal of the American Planning Association, he has prepared testimony for federal and state circuit courts and energy siting councils. He has qualifi ed to testify as an expert witness in tax court in several states. DeLacy holds a master’s degree in Urban Planning from Portland State University and a bachelor of arts degree from Willamette University. He previously served as adjunct professor at the Business School at Portland State University.
Barry A. Diskin, Ph.D., CRE, is professor and Francis J. Nardozza Scholar in the College of Business at Florida State University. Diskin teaches valuation classes to real estate majors at the undergraduate and graduate levels. His focus and research has been on natural gas pipelines for eminent domain cases, property tax challenges, contamination matters, and contract disputes. Previously, Diskin published in The Appraisal Journal, the Journal of Real Estate Research, Real Estate Economics, the Journal of the American Bar Association, and other real estate journals. He has been interviewed on national television about home buying issues and testifi ed before the Florida legislature about mobile home park legislation. Diskin is principal in the fi rm Diskin Property Research and has qualifi ed as an expert witness in six states. His doctorate degree is from Georgia State University.
Jack P. Friedman Ph.D., CRE, FRICS, MAI, SREA, ASA, CPA, is principal and CEO of Jack P. Friedman & Associates, Richardson, Texas, a real estate appraisal and economics consulting fi rm. He is nationally recognized as an author, appraiser and consultant in real estate economics and related disciplines. Friedman’s work in recent years has been in litigation support (principally appraisal review and appraisal) regarding ad valorem tax cases, environmental damages, condemnation, construction defects, contract disputes, and a variety of economic issues. Formerly, he served as senior research economist and head of research of Texas A&M University’s Texas Real Estate Research Center, and was the Laguarta Professor in the Department of Finance. Friedman has written more than 20 books and 200 articles, and has been published in Th e Appraisal Journal, Real Estate Issues, Real Estate Review, Real Estate Finance, and other journals.
6

REAL ESTATE ISSUES Volume 39, Number 1, 2014
He served on the national Real Estate Accounting Committees of the AICPA and Texas Society of Certifi ed Public Accountants and was a member of the Appraiser Qualifi cations Board of the Appraisal Foundation. Friedman earned his doctorate degree from Georgia State University.
Jeff Gaulin, a partner at Jones Day, Boston, has extensive experience in structuring transactions involving the historic rehabilitation tax credit, the new markets tax credit and state tax credits. Gaulin represents major institutional investors, developers, community development entities, and nonprofi t organizations in projects that utilize a combination of various tax credits and other fi nancing sources including mixed-use real estate developments, hotels, commercial real estate projects, and renewable energy facilities. He also has signifi cant experience in corporate and partnership tax law.Gaulin frequently speaks on issues related to the new markets tax credit program, as well as various other incentive programs and has contributed to industry publications. He received his bachelor of science and juris doctor degrees from Boston College.
Curtis A. Gentry IV, MAI, Madison, Mississippi, is a senior analyst and partner at Appraisal Research Company. He earned an undergraduate degree in Recreation Tourism with a concentration in Resort Management from the University of Florida, and a master’s degree in business administration with a concentration in Finance from the University of Mississippi. Gentry entered the real estate appraisal profession in 1994 and joined Appraisal Research Company as a partner in 2004. Gentry has a wide range of commercial real estate appraisal experience that includes a signifi cant concentration in medical facilities, industrial facilities and landfi lls. He also is an active real estate investor.
Jack C. Harris, Ph.D., is an instructor at Florida State University and a CAP course reviewer for the Appraisal Foundation. He formerly served as research economist at the Real Estate Center at Texas A&M University.
Fei Liu is a visiting scholar at the University of Wisconsin/River Falls. Fei is pursuing a Ph.D. in Trade and Finance from Central China Agricultural University, Wuhon, China.
Bowen H. ‘Buzz’ McCoy, CRE, is past president of Th e Coun-selors of Real Estate. McCoy was employed at Morgan Stanley for 27 years. He is the author of the award-winning and broadly used case study on values-based leadership “Th e Parable of the Sadhu.” His book on values-based leadership entitled Living Into Leadership was published by Stanford University in 2006.
Joe W. Parker, CRE, MAI, FRICS, is president of Appraisal Research Company and senior vice president of Equity Solutions USA. He fi rst entered the real estate profession in 1974 and established Appraisal Research Company in 1978. In 2003, he co-founded Equity Solutions USA, an appraisal management company that provides appraisal services to regional and national banks.Parker has appraised commercial real estate throughout the South and Lower Midwest with appraisal experience in environmentally contaminated properties, fi ber optic corridors, cemeteries, golf courses and country clubs, colleges and schools, hospitals, wetlands, conservation easements and historic properties. As well as regularly advising clients on a variety of real estate matters, Parker oversees all appraiser credentialing and reviewing processes at Equity Solutions USA.
Parker also serves as an expert witness on such issues as construction defects, mortgage fraud, title defects, environmental contamination and stigma. He was trained as a Mediator at the University of Houston’s Bauer College of Business and at Harvard Law School.
Dustin C. Read, Ph.D., J.D., serves as the director of the Center for Real Estate at UNC Charlotte. He earned his doctorate degree in public policy at UNC Charlotte and his juris doctor at the University of Missouri. Read’s research interests include land use policy, public-private partnerships, and sustainable development practices.
Roy J. Schneiderman, CRE, FRICS, principal, Bard Consulting LLC, San Francisco, has provided real estate consulting services since 1984. Prior to founding Bard Consulting in 2001, Schneiderman was a partner for Sedway Group (acquired by CBRE in 1999). He earlier worked as a real estate consultant at Deloitte, a global accounting and consulting fi rm. Schneiderman’s areas of expertise include real estate investment analysis, quantitative analysis, asset and manager workouts, investment manager due diligence, development feasibility, real estate investment strategy formation, land-oriented investment strategies, and real estate litigation. His professional affi liations include: Fellow of the Royal Institute of Chartered Surveyors; Th e Counselors of Real Estate; Pension Real Estate Association; National Council of Real Estate Investment Fiduciaries; Editorial Board member of Real Estate Issues journal; Editorial Board member of The Institutional Real Estate Newsletter–North America; and NASD Dispute Resolution Board of Arbitrators. Schneiderman earned a master’s degree in business administration from Education University of California/Berkeley; a master’s degree in philosophy from Yale University in New Haven, Connecticut; and a bachelor’s degree in philosophy and religious studies from Beloit College in Beloit, Wisconsin.
Prodromos Vlamis, Ph.D., is an economist specializing in fi nancial analysis of the real estate markets. Currently, he is an associate of the Department of Land Economy/University of Cam-bridge, a research fellow at the Centre of Planning and Economic Research, and a member of the board of directors of the National Bank of Greece Real Estate Investment Company/Greece. Vlamis has held research and teaching posts in the U.K. at the London School of Economics and Political Science; in the U.S. at Harvard University; and in Greece at Athens University of Economics and Business, National and Kapodistrian University of Athens, and the University of Piraeus. Vlamis earned a doctorate degree in Real Estate Finance and a master of philosophy degree in Land Economy, both from the University of Cambridge, a master of science degree in Econom-ics from the University of York, and a bachelor of arts degree in International Economics from the Athens University of Economics and Business.Vlamis has published as a sole or co-author more than 28 papers in international and Greek peer-reviewed academic journals including Th e Journal of Real Estate Finance and Economics, Journal of Real Estate Literature, Journal of European Real Estate Research, Journal of Property Investment and Finance, Journal of Policy Modeling, Review of Development Economics, Emerging Markets Finance and Trade, Panoeconomicus, Journal of Computational Optimization in Economics and Finance, Journal of Economic Asymmetries and the International Journal of Economics, and in international and Greek edited volumes. He also has contributed chapters to books and produced research reports for research institutes.
7

REAL ESTATE ISSUES Volume 39, Number 1, 2014
Th e Counselors of Real Estate® is seeking original manuscripts for publication in Real Estate Issues (REI), a peer-reviewed journal published three times annually. Th e journal reaches a lucrative segment of the real estate industry as well as a representative cross-section of professionals in related industries.
Specifi cally, we are seeking articles on energy/environment topics as they aff ect real estate. Additionally, we are seeking articles on housing issues. To read detailed information on issues of interest to the journal and to the CRE organization, visit http://www.cre.org/external_aff airs/.
Real Estate Issues subscribers are primarily the owners, chairmen, presidents and vice presidents of real estate companies, fi nancial corporations, property companies, banks, management companies, fi nancial corporations, property companies, banks, management companies, libraries and REALTOR® boards throughout the country. Other subscribers include professors and university personnel, and professionals in insurance companies and law fi rms.
REVIEW PROCESS
Member and nonmember authors should submit manuscripts as Microsoft Word documents, preferably via email, to [email protected] or [email protected] or at:
Real Estate IssuesC/O Th e Counselors of Real Estate430 N. Michigan Ave.Chicago, IL 60611
Suggested topics of interest for REI are:
■ Low Interest and Capitalization Rate Risks;
■ Health Care as relates to housing and medical facilities;
■ Capital Market Resurgence;
■ Event Risks with regard to dealing with terrorist attacks, natural disasters, etc.;
■ Eff ects of Climate Change/Weather on Coastal Properties;
■ Echo Boomer Housing Demand Defi nes;
■ Increased U.S. Natural Gas Mining and Reserves as related to activities such as fracking and how it may aff ect real estate;
■ Global Real Estate Growth and Risk;
■ Impact of Technology on Offi ce Space
■ Retail Malaise and Repositioning
See the Editorial Calendar and further submission guidelines at www.cre.org under “Publications” for more information. ■
REAL ESTATE ISSUES Volume 38, Number 1, 20138
Call for Articles
REAL ESTATE ISSUES®
Published by THE COUNSELORS OF REAL ESTATE®

REAL ESTATE ISSUES Volume 39, Number 1, 2014
FEATURE
The Boom and Bust of the Greek Housing MarketBY NICHOLAS CHATZITSOLIS, CRE, FRICS, AND PRODROMOS VLAMIS, PH.D.
INTRODUCTION
The Greek residential market (and the Greek property market in general) has always been one of the pillars of economic growth in Greece. Since the early 1950s the development industry has been one of the major contributors to and one of the most important sectors of the Greek economy.1 Th e construction industry in particular signifi cantly aff ected the country’s economic growth and because of that, its importance for the growth prospects of the Greek economy has never been questioned. Th e construction sector’s contribution to the GDP since the year 2000 ranges between six and eight percent in both current and constant prices,2 while it employs more than seven percent of the total country’s labour force.3 Also, the construction sector aff ects heavily, although indirectly, other sectors of the Greek economy such as mining, building material, electrical equipment, etc.4
During the fi rst four years of the economic crisis, public investment for development projects was dramatically reduced. To illustrate this point further, focusing on the construction industry in particular, according to the Hellenic Statistical Authority, a steady annual decline of more than eight percent since 2006 has been registered every year in terms of building permits issued. Th us, the crisis that the Greek residential market is currently facing can mainly be attributed to the current fi scal stance of the Greek economy.5 Th e 2008 crisis in the United States subprime loans market and the increase in oil prices are still aff ecting liquidity in markets, the cost of capital, economic growth and capital markets at large. Th is negative economic environment aff ects the European Union countries and Greece, too. Economic repercussions of the crisis cannot be entirely estimated since the crisis is ongoing.
Th e Greek housing market may be characterized as imperfect and opaque. Th ough the commercial market has gone through a phase of regulation during the late 1990s and the early years of the 21st century, the residential market still retains all its peculiarities and is seen by the average Greek as the “peoples’ investment market.” Regardless of various fi scal and taxation measures aimed at regulating this market, a number of cultural, social and fi nancial considerations, along with a recent dramatic drop in terms of property values, have prevented its improvement.
Nicholas Chatzitsolis, CRE, FRICS, managing director, CBRE, Athens, Greece, began his career with Barclays Bank Property Division in London in the 1980s and has more than 25 years of experience as a real estate professional. He has worked for the Greek Public Estates and the Lambert Smith Hampton Athens offi ce. Since 2008, Chatzitsolis has been managing CBRE – Axies,
the appraisal company of CBRE Group in Greece.
Chatzitsolis’ work experience includes specialised areas such as industrial plants, oil refi neries, major hotel developments, as well as all types of commercial property. He also has been a member of feasibility study teams examining all aspects of town planning and development appraisal. Chatzitsolis has appeared as an expert witness in British, U.S. and Greek courts in property-related cases.
He is a member of the Greek Technical Chamber and a board member of the European Chapter of CRE. He is also a former member of the local (Greek) Board of RICS and a former member of RICS Governing Council. He also served as chairman of RICS Europe during 2001–03. Chatzitsolis has been a visiting lecturer at Panteion University, Athens, since 1999.
Chatzitsolis’ earned a bachelor of science degree in Land Administration and a diploma in Estate Management from North East London University U.K., and a master of science degree in Urban Land Appraisal from the University of Reading U.K.
About the Authors
9

REAL ESTATE ISSUES Volume 39, Number 1, 2014
FEATURE
The Boom and Bust of the Greek Housing Market
Th e purpose of this article is to present a general overview and a critical discussion of the developments in the Greek residential market and identify and analyse the possible links with all its “peculiarities.” Th ese peculiarities include: 1) the “counter performance” development process, which is unique by global standards; 2) the ill-based concept that every family must own two or three residential units for “security” purposes—and that this type of security was favoured, in light of the high infl ation environment of the 70s, 80s and mid 90s, as the best type of infl ation hedge investment by virtually all diff erent income classes of Greek households; 3) the extensive land fragmentation6 in Greece; 4) the high rate of owner occupation; and, 5) the trend to concentrate residential development in virtually two cities (Athens and Th essaloniki).
Our analysis indicates that the above considerations result from a number of socioeconomic problems that are hard to resolve. Th is fact along with lack of demand for the acquisition of new homes makes developers more conscious and selective when measuring their risk. Residential real estate experts now state that recovery of the housing market may take up to eight years in order to reach 2007–2008 levels. Recovery, however, depends on property taxes—namely capital transfer tax and capital gains tax.
Th is article presents data regarding the recession in the Greek housing market, a number of considerations under assessment as well as their impact on the residential market, and the authors’ conclusions.
THE GREEK HOUSING MARKET AND THE CURRENT CRISIS
Th e latest available data from the Hellenic Statistical Authority7 reveals that the Greek economy is still in recession, with the growth rate of GDP being -2.6 percent (measured in fi xed prices, base year 2005) in 2013Q4 (in comparison to 2012Q4). Th is recession is reinforced by the existing negative psychology—crisis of confi dence—because the market participants are afraid of the not-yet-seen repercussions of the Greek debt crisis. Moreover, frequent changes to tax laws create uncertainty and reduce business confi dence.8 Th is is expected to negatively aff ect property transactions and, consequently, the companies engaged in the Greek construction sector, real estate services, etc. Also, the so-called “objective values”9 of real assets for both urban and rural areas are to be reviewed upwards—sometime between now and 2016—because
they are unchanged since the year 2007. Th is might have a further negative eff ect on property transactions.
VOLUME OF RESIDENTIAL PROPERTY TRANSACTIONS
Data recently published by the (Central) Bank of Greece10 show that the number of real estate transactions continues to fall, from 74,586 in 2009 to 74,457 in 2010; 42,814 in 2011; 30,964 in 2012 and 23,801 in 2013 (Figure 1).
Th e Quarter-on-Quarter (QOQ) picture for the volume of the residential property transactions for 2012 and 2013 shows that property sales continue to fall, from 5,074 in 2013Q2 to 4,321 in 2013Q3, and 3,841 in 2013Q4 (Figure 2).
10
Prodromos Vlamis, Ph.D., is an economist specializing in fi nancial analysis of the real estate markets. Currently, he is an associate of the Department of Land Economy/University of Cambridge, a research fellow at the Centre of Planning and Economic Research, and a member of the board of directors of the National Bank of Greece Real Estate Investment Company/Greece. Vlamis
has held research and teaching posts in the U.K. at the London School of Economics and Political Science; in the U.S. at Harvard University; and in Greece at Athens University of Economics and Business, National and Kapodistrian University of Athens, and the University of Piraeus. Vlamis earned a doctorate degree in Real Estate Finance and a master of philosophy degree in Land Economy, both from the University of Cambridge, a master of science degree in Economics from the University of York, and a bachelor of arts degree in International Economics from the Athens University of Economics and Business.
Vlamis has published as a sole or co-author more than 28 papers in international and Greek peer-reviewed academic journals including The Journal of Real Estate Finance and Economics, Journal of Real Estate Literature, Journal of European Real Estate Research, Journal of Property Investment and Finance, Journal of Policy Modeling, Review of Development Economics, Emerging Markets Finance and Trade, Panoeconomicus, Journal of Computational Optimization in Economics and Finance, Journal of Economic Asymmetries and the International Journal of Economics, and in international and Greek edited volumes. He also has contributed chapters to books and produced research reports for research institutes.
About the Authors

REAL ESTATE ISSUES Volume 39, Number 1, 2014
Volume of estimated Residential Property Transactions (with fi nancial institution intermediation) and percentage change (%)
Source: Bank of Greece (2014a)
Volume of Residential Property Transactions in Greecefor 2012-2013 (Q-o-Q, in thousands)
12,000
10,000
8,000
6,000
4,000
2,000
02012 2012 2012 2012 2013 2013 2013 2013 Q1 Q2 Q3 Q4 Q1 Q2 Q3 Q4
Figure 2
FEATURE
The Boom and Bust of the Greek Housing Market
Volume of Residential Property Transactions in Greecefor 2009-2013 (in thousands)
80,000
60,000
40,000
20,000
02009 2010 2011 2012 2013
Volume of estimated Residential Property Transactions (with fi nancial institution intermediation) and percentage change (%)
Source: Bank of Greece (2014a)
Figure 1
11

REAL ESTATE ISSUES Volume 39, Number 1, 2014
FEATURE
The Boom and Bust of the Greek Housing Market
BUILDING ACTIVITY
Th e latest available data published by the Hellenic Statistical Authority11 reveals that the volume of the overall (private and public) building activity across the country (measured by the number of building permits, both residential and commercial)12 has decreased by 27.4 percent during the period January – November 2013 (in comparison with the period January – November 2012). As well, recently published data by the Hellenic Statistical Authority13 reveals that the production index
in construction has fallen by 8.3 percent in 2013Q3 (in comparison with 2012Q3).
BANK CREDIT FOR THE DOMESTIC PRIVATE SECTOR: RESIDENTIAL MORTGAGES
Th e crisis that the Greek property market is experiencing also has been crucially linked to the Greek banking crisis and the consequent credit crunch that has emerged; commercial banks are facing liquidity constraints and thus, since December 2010, they keep reducing the available funds to the domestic private sector14 (Figure 3).
Bank Credit to the Domestic Private Sector: Residential Mortgages(percentage change)
4
3
2
1
0
-1
-2
-3
-4
January
FebruaryMarc
hApril May June
JulyAugust
September
October
November
December
Year 2010 Year 2011 Year 2012 Year 2013Source: Bank of Greece (2014b)
Figure 3
12

REAL ESTATE ISSUES Volume 39, Number 1, 2014
FEATURE
The Boom and Bust of the Greek Housing Market
PRICE INDEX FOR GREEK HOUSING
Th e severe crisis the Greek property market is currently facing has been mirrored by considerably lower housing prices. Th e excess supply of newly built houses for sale across the country is estimated by real estate market participants to be approximately 200,000. Moreover, household demand for newly built houses has been consistently decreasing because of the macroeconomic
instability, which raises households’ concerns about future incomes and employment. Figure 4 presents how the price index for newly built houses (less than fi ve years old) and for older houses (more than fi ve years old) has evolved since the year 2009. A price index of apartment prices by geographical area is also presented in the same fi gure. As evident from Figure 4, house prices today stand at approximately 36 percent of what they were in 2008.
2009 2010 2011 2012 2013
Overall price index for housing (yearly average)Index of apartment prices by age: Newly built houses (less than 5 years old)Index of apartment prices by age: Older houses (more than 5 years old)Index of apartment prices by geographical area: Athens
Index of apartment prices by geographical area: ThessalonikiIndex of apartment prices by geographical area: Other big citiesIndex of apartment prices by geographical area: The rest of theGreek cities
Source: Bank of Greece (2014a)
Price Index (base year 2007:100) and Percentage Change (%)
120
100
80
60
40
20
0
Figure 4
13
REAL ESTATE ISSUES Volume 39, Number 1, 2014
FEATURE
The Boom and Bust of the Greek Housing Market
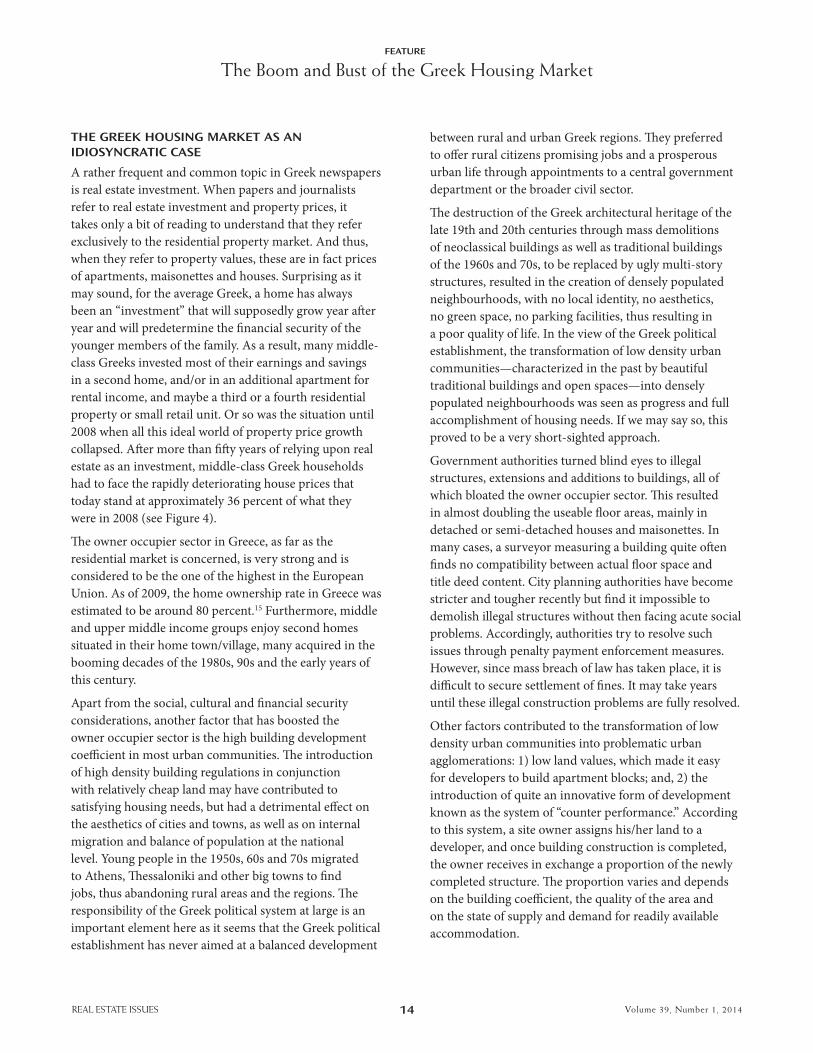
THE GREEK HOUSING MARKET AS AN IDIOSYNCRATIC CASE
A rather frequent and common topic in Greek newspapers is real estate investment. When papers and journalists refer to real estate investment and property prices, it takes only a bit of reading to understand that they refer exclusively to the residential property market. And thus, when they refer to property values, these are in fact prices of apartments, maisonettes and houses. Surprising as it may sound, for the average Greek, a home has always been an “investment” that will supposedly grow year aft er year and will predetermine the fi nancial security of the younger members of the family. As a result, many middle- class Greeks invested most of their earnings and savings in a second home, and/or in an additional apartment for rental income, and maybe a third or a fourth residential property or small retail unit. Or so was the situation until 2008 when all this ideal world of property price growth collapsed. Aft er more than fi ft y years of relying upon real estate as an investment, middle-class Greek households had to face the rapidly deteriorating house prices that today stand at approximately 36 percent of what they were in 2008 (see Figure 4).
Th e owner occupier sector in Greece, as far as the residential market is concerned, is very strong and is considered to be the one of the highest in the European Union. As of 2009, the home ownership rate in Greece was estimated to be around 80 percent.15 Furthermore, middle and upper middle income groups enjoy second homes situated in their home town/village, many acquired in the booming decades of the 1980s, 90s and the early years of this century.
Apart from the social, cultural and fi nancial security considerations, another factor that has boosted the owner occupier sector is the high building development coeffi cient in most urban communities. Th e introduction of high density building regulations in conjunction with relatively cheap land may have contributed to satisfying housing needs, but had a detrimental eff ect on the aesthetics of cities and towns, as well as on internal migration and balance of population at the national level. Young people in the 1950s, 60s and 70s migrated to Athens, Th essaloniki and other big towns to fi nd jobs, thus abandoning rural areas and the regions. Th e responsibility of the Greek political system at large is an important element here as it seems that the Greek political establishment has never aimed at a balanced development
between rural and urban Greek regions. Th ey preferred to off er rural citizens promising jobs and a prosperous urban life through appointments to a central government department or the broader civil sector.
Th e destruction of the Greek architectural heritage of the late 19th and 20th centuries through mass demolitions of neoclassical buildings as well as traditional buildings of the 1960s and 70s, to be replaced by ugly multi-story structures, resulted in the creation of densely populated neighbourhoods, with no local identity, no aesthetics, no green space, no parking facilities, thus resulting in a poor quality of life. In the view of the Greek political establishment, the transformation of low density urban communities—characterized in the past by beautiful traditional buildings and open spaces—into densely populated neighbourhoods was seen as progress and full accomplishment of housing needs. If we may say so, this proved to be a very short-sighted approach.
Government authorities turned blind eyes to illegal structures, extensions and additions to buildings, all of which bloated the owner occupier sector. Th is resulted in almost doubling the useable fl oor areas, mainly in detached or semi-detached houses and maisonettes. In many cases, a surveyor measuring a building quite oft en fi nds no compatibility between actual fl oor space and title deed content. City planning authorities have become stricter and tougher recently but fi nd it impossible to demolish illegal structures without then facing acute social problems. Accordingly, authorities try to resolve such issues through penalty payment enforcement measures. However, since mass breach of law has taken place, it is diffi cult to secure settlement of fi nes. It may take years until these illegal construction problems are fully resolved.
Other factors contributed to the transformation of low density urban communities into problematic urban agglomerations: 1) low land values, which made it easy for developers to build apartment blocks; and, 2) the introduction of quite an innovative form of development known as the system of “counter performance.” According to this system, a site owner assigns his/her land to a developer, and once building construction is completed, the owner receives in exchange a proportion of the newly completed structure. Th e proportion varies and depends on the building coeffi cient, the quality of the area and on the state of supply and demand for readily available accommodation.
14

REAL ESTATE ISSUES Volume 39, Number 1, 2014
FEATURE
The Boom and Bust of the Greek Housing Market
It should be noted that at least fi ve years preceding the crisis, as a result of continuously rising demand and increasing housing prices, developers could no longer acquire land cheaply. Once the crisis started, the eff ect was detrimental; they were left with empty apartments and houses, which today exceed 200,000, almost half of the total vacant housing stock (this fi gure may be low by American standards but should be considered in the context of the population of Greece, which does not exceed 11 million people). Most developers—usually small local fi rms—acquired expensive land and paid high construction costs aiming for high specifi cation buildings that refl ected high selling prices. When the recession hit, nobody could aff ord to pay a high price for an apartment or a house. Th ere was simply no market for residential units that would sell at 2007–2008 price levels.16 With so much development originally concentrated in the central cities of Athens and Th essaloniki, and still so many of these homes vacant—upwards of 200,000 units—it does not make sense to try to develop new housing in outlying areas.
A signifi cant fact in post-crisis Greece is that regardless of the 400,000 empty residential properties (200,000 newly built units plus 200,000 older homes), the country is faced with a huge number of homeless persons. Even in the post-Second World War era of the 1940s and 1950s, this phenomenon was unknown in contemporary Greece. Greeks used to bitterly criticize homeless Parisians, Londoners and New Yorkers who sleep in the streets or in the subway waiting areas. Nowadays, the increasing number of homeless can be seen virtually everywhere in the large Greek cities. It is a relatively recent development (starting only fi ve years ago) refl ecting the results of the fi scal crisis.
Th e low quality urban residential environment in conjunction with lack of social housing and social services has had a detrimental eff ect on the quality of living of the average Greek citizen. Th is is certainly more acute in Athens and the major urban centers. We propose a number of solutions that could, in our view, help solve some of the housing problems that currently exist in Greece:
1. Housing for the homeless. Th e higher proportion of homeless is among the indigenous Greek population and the unemployed immigrants, most of whom are living in the country illegally. Th e government owns several abandoned public buildings, former army camps, etc., that
could be utilised for this purpose. Furthermore, regardless of the situation in the economy, there are some funds that could be allocated for renovation, construction and property management.
2. Government subsidies for low income tenants with high personal debt. Th e irony is that most of them are forced to pay enormous taxes to the state with virtually no return benefi ts. In Greece there is a graduated income tax system based on the amount earned. Th ere are, however, heavy taxes on property, on “luxurious living,” on car possession (for vehicles over 2,000cc) and on car use, as well as a levy for all self-employed professionals that has to be paid regardless of earnings. It is undoubtedly an unfair system and has been subject to severe criticism.
3. Improved environment in most urban centers, mainly in Athens and Th essaloniki. Improving blighted inner city areas should help generate local and international tourism; consequently raising retail rental values along with interest in investment and the provision of services. Investment in such urban and social infrastructure will pay back benefi ts: increase overall consumer and commercial demand, stimulate the frozen property market and certainly attract investment from both home and abroad.
4. Rationalize taxation of property ownership and take special care of fi rst-time home buyers. Paying enormous taxes to the state just because someone has inherited an apartment or a house has no rationale. In most developed countries, ownership taxes go to local governments and are used for the improvement of the urban environment, for services provided to local residents and for the maintenance of neighbourhoods. In Greece, most ownership taxes go directly to the central government and no one understands whether good use is made of the funds. Moreover, the unbelievable and unprecedented continuous change in terms of legislation can confuse even the most experienced tax expert who has good knowledge of government legislation.17 A permanent and rational taxation system, friendly to homeowners, potential buyers and investors, and accepted by all economic groups of society will only bring benefi ts to the government and investors alike. In light of this, the Greek government has recently announced a series of measures aiming to attract foreign direct investments. Th ese measures include an ambitious privatisation plan aiming to generate employment, simplifi ed procedures for the establishment of fi rms and enterprises, provide resident permits for foreigners outside the EU who acquire expensive property,
15

REAL ESTATE ISSUES Volume 39, Number 1, 2014
FEATURE
The Boom and Bust of the Greek Housing Market
and tax relief for international investors. Th e response from the market so far has not been that enthusiastic since the taxation situation is rather obscure at the moment, and it may take time until the potential benefi ts of the announced measures are realized.
CONCLUDING COMMENTS
Th e implementation of strict austerity programmes, designed by the Greek government to reduce the budget defi cit and stabilize public debt, caused a substantial decrease in demand for goods and services, pushing the Greek economy and consequently the property market into deep recession.18 Th e severe crisis the Greek property market is currently facing is refl ected in a deteriorating volume of residential property transactions; a low volume of overall (private and public) building activity across the country; reduced bank credit availability for the domestic private sector (residential mortgages); and eventually the considerably lower prices for housing. In this article, we also identifi ed and critically discussed possible links between the recent developments in the Greek residential market and its peculiarities, such as the counter performance development process; the ill-based concept that every family must own two or three residential units for security purposes; the extensive land fragmentation in Greece; the high rate of owner occupation; and the concentration of residential development in two urban areas (Athens and Th essaloniki).
Th e possibility of the Greek residential market’s coming out of the recession is crucially linked to market participants’ expectations, improvement of the lending terms of construction companies, and the recovery of the economy at large. Th is is the case because the factors that contributed to the exemplary growth performance of the Greek property sector in Greece, particularly aft er the year 2000 (ample funding for public infrastructure; implementation of stabilizing macroeconomic rules and policies that led to low-cost fi nancing; the organization of the Athens 2004 Olympic Games, which signifi cantly boosted investment activity; and the inclusion of new land in the National City Plan, which expanded the available space for new construction) have now ceased to exist.19
Finally, we off ered a number of useful policy proposals regarding the steps Greek policymakers should take in order to achieve the necessary property tax system reform. If such reform is implemented, a friendly environment for potential investors in the Greek real estate market will be created and fast, customized, investor friendly solutions for development projects on the residential market will
become available. Eventually, hopefully, all of the above will contribute to the restarting of the Greek economy and fuel economic growth.
ACKNOWLEDGEMENTS
Part of this article was completed while Prodromos Vlamis was a visiting fellow at the Hellenic Observatory, London School of Economics and Political Science, during the academic year 2011–2012. Th e paper has greatly benefi ted from the constructive suggestions of Vassilis Monastiriotis. Th e authors would like to thank discussants of the paper and conference participants at the 12th Annual Conference of the Hellenic Finance and Accounting Association (University of Macedonia, Th essaloniki, December 13–14, 2013, Greece), the ERSA-GR 2013 Conference (University of Patras and Hellenic Open University, June 14–15, 2013, Patra, Greece), and seminar participants at the Centre for Planning and Economic Research (March 16, 2011, Athens, Greece), for useful comments and discussions. Authors also wish to thank Nikolaos Philippas and Antonis Rovolis for valuable comments. ■
ENDNOTES
1. Kalfamanoli, K. and P. Vlamis, “Trends, Prospects and Weaknesses of the Greek Real Estate Market,” (in Greek), Volume of Essays in Honour of the late Professor P. Livas, University of Piraeus Press, Greece, 2010, pp. 61–89.
2. Hellenic Statistical Authority (2012), ‘‘Annual National Accounts: Gross Added Value by Industry (Years 2000–2012),’’ Athens, Greece, available at: http://www.statistics.gr/portal/page/ portal/ESYE/PAGE-themes?p_param=A0702&r_param=SEL12&y_ param=2012_00&mytabs=0 (Accessed 25-02-2014).
3. Hellenic Statistical Authority (2014), ‘‘Labour Force Survey – Th ird Quarter 2013,’’ (press release in Greek), Athens, Greece.
4. Benos, N., S. Karagiannis and P. Vlamis, “Spatial Eff ects of the Property Sector Investment on Greek Economic Growth,” Journal of Property Investment and Finance, Vol. 29, No. 3, 2011, pp. 233–50.
5. Vlamis, P., “Greek Fiscal Crisis and Repercussions for the Property Market,” Journal of Property Investment and Finance, Vol. 32, No. 1, 2014, pp. 21–34.
6. Th e number of owners of estates of substantial size is relatively small. Most land is fragmented into small parcels and a signifi cant proportion of the population is property owners. Lack of a modern land registry, particularly in rural areas, creates disputes between individual land owners on many occasions, while trespassing is not uncommon. In urban centers, on the other hand, condominium principles are not applied in the same manner as in the U.S. In multi-story residential apartments, management and building
16

REAL ESTATE ISSUES Volume 39, Number 1, 2014
FEATURE
The Boom and Bust of the Greek Housing Market
maintenance is sometimes a diffi cult task, as some co-owners may not agree between themselves and building management rules cannot, in practice, be applied.
Other associated problems are concerned with public land that, on numerous occasions, has been trespassed on. Many cases of dispute between private individuals and the government are pending in courts for years. As a result of these disputes, on many occasions, the government cannot develop or off er land for sale or lease to investors.
Finally, in cases in which a large development project may take place—on a coastal picturesque site for example—the unifi cation of small parcels becomes an extremely diffi cult task, as some owners do not agree to sell, while others require exorbitant sums of money in order to sell their properties.
Th e good news, however, is that a long-term solution can now be seen in the not too distant future, as a new National Land Registry is already underway and has produced, even at this early stage, positive results. Th e completion of the land registry may take a few years, but once concluded, property management will most certainly become more effi cient.
7. Hellenic Statistical Authority (2014), ‘‘Quarterly National Accounts – Fourth Quarter 2013,’’ (press release in Greek), Athens, Greece.
8. Kalfamanoli, K. and P. Vlamis, “Th e Greek Real Estate Market for the Interested Foreign Investors: Prospects and Problems,” (in Greek), Journal of International Economy and Politics “Agora without Frontiers,” Vol. 13, No. 3, 2008, pp. 194–211.
9. Th e “objective value” of the real estate assets is, in fact, the “taxable value” of transactions in the Greek real estate market. Sometimes the objective value of a property is lower than its actual market value. To adjust for the diff erence between the objective value and the market value of a property, the former is frequently reviewed (particularly when Greek governments are short of tax revenues). In most cases, the objective value distorts actual prevailing market conditions and is not substantiated by comparable evidence. Objective values for the diff erent types of real estate assets are exogenously set by the Greek government and their estimations are theoretically based on prevailing market conditions (demand and supply).
10. Bank of Greece, ‘‘Indices of House Prices and Residential Property Transactions–Fourth Quarter 2013,’’ (in Greek), February 14, 2014, Athens, Greece, available at: http://www.bankofgreece.gr/Pages/ en/Bank/News/PressReleases/DispItem.aspx?Item_ID=4520&List_ ID=1af869f3-57fb -4de6-b9ae-bdfd83c66c95&Filter_by=DT (Accessed 25-02-2014).
11. Hellenic Statistical Authority (2014), ‘‘Building Activity [volume] – November 2013 Provisional Data,’’ (press release in Greek), Athens, Greece.
12. It is worth mentioning here that data published by the Hellenic Statistical Authority regarding the volume of the private and public building activity across Greece does not distinguish between residential and commercial building permits. In other words,
residential and commercial building permits are both included in one single number and the Hellenic Statistical Authority does not disentangle the two fi gures.
13. Hellenic Statistical Authority (2014), ‘‘Production Index in Construction – Th ird Quarter 2013 Provisional Data,’’ (press release in Greek), Athens, Greece.
14. Bank of Greece (2014), “Bank Credit to the Domestic Private Sector: December 2013,” Athens, Greece, available at: http://www. bankofgreece.gr/Pages/en/Bank/News/PressReleases/Di spItem.aspx?Item_ID=4493&List_ID=1af869f3-57fb -4de6-b9ae- bdfd83c66c95&Filter_by=DT (Accessed 25-02-2014).
15. “List of countries by home ownership rate,” Wikipedia, available at: http://en.wikipedia.org/wiki/List_of_countries_by_home_ownership_ rate (Accessed 25-02-2014).
16. Most of the Greek construction companies rushed to build new houses before the introduction of VAT on new residential buildings (eff ective from 01–01–2006). When they completed the construction of the houses in 2006–2007, demand for new houses had already started decelerating. Potential buyers are now looking for older properties (between 2–10 years old) due to lower and far more competitive values rather than buying the more expensive brand new ones. Th e Greek construction companies appear to be unwilling to start selling at lower prices the stock of newly built houses they own because if they do so, they will realize huge losses. Moreover, the majority of companies in the Greek construction industry are family-owned small- and medium-sized companies, which are not highly leveraged. Th ey mostly use equity capital to fi nance the construction of new houses (by using the so-called “counter performance” process in the housing development fi eld) and thus, they are sort of immune to interest rate volatility. Finally, most of the Greek construction companies accumulated considerable profi ts during the boom phase of the business cycle (1994–2007) and now they feel comfortable to follow a “wait-and-see” policy, believing the holding costs of these vacant homes will not exceed the potential loss the construction companies will take. On the one hand, if their assumptions are valid they will continue to hold onto these homes, hoping the market will rebound rapidly. It seems they are willing to wait until that happens. On the other hand, according to the new law the Greek government recently passed (Law 4223/2013), Greek construction companies will have to pay property tax on these units even if they are not occupied and not producing any income. Th is is something they will have to seriously take into account.
17. Vlamis, P., “Institutional Reform as a Prerequisite for the Exploitation of Public Real Estate Assets,” (in Greek), forthcoming Aeixoros Texts of Urban Planning, Planning and Urban Development Journal, 2014.
18. Kouretas, G. and P. Vlamis, “Th e Greek Crisis: Causes and Implications,” Panoeconomicus, Vol. 57, Νο. 4, 2010, pp. 391–404.
19. Karousos, E. and P. Vlamis, “Th e Greek Construction Sector: An Overview of Recent Developments,” Journal of European Real Estate Research, Vol. 1, No. 3, 2008, pp. 254–66.
17

REAL ESTATE ISSUES Volume 39, Number 1, 2014
FEATURE
Watch Your Real Estate Language!
BY JACK P. FRIEDMAN, PH.D., CRE; BARRY A. DISKIN, PH.D., CRE; AND JACK C. HARRIS, PH.D.
“I meant what I said and I said what I meant.” Dr. Seuss’ elephant character Horton provides speakers with a worthy goal. Th e same applies to writers.
In the English language, the same word can have many diff erent meanings. Th e word run reportedly has 100 diff erent defi nitions, from a score in baseball to a tear in a knitted fabric. Th e word strike means one thing in baseball, another in bowling, still another in a fi ght, and something entirely diff erent in a labor union activity. When an entrepreneur strikes out into a new venture, we wish him luck, but a salesman who strikes out has failed in a sales call. In the latter case, the baseball meaning of “strike out” is used fi guratively.
It should be no surprise that many words have special meanings in real estate activities. Th is can cause misunderstanding between parties, whether intentional or not. For example, a real estate appraiser may provide a report with the word value in it. When modifi ed by investment to become “investment value,” it is related to but quite diff erent from “market value.” Investment bankers may not understand the diff erence in these terms when packaging a real estate off ering for sale.
An appraiser of a regulated public utility explains that the term cost is important because historical cost is the amount that determines regulated utility rates charged to customers and returns to capital providers. Th e same appraiser then determines replacement cost new for the property, which is an entirely diff erent, much higher amount that is not warranted while the property is within its regulatory shackles.
Th e misunderstandings oft en result from reports prepared by appraisers and accountants. Terms that the two professions share take on entirely diff erent defi nitions, sometimes without either profession recognizing the validity of the other’s use.
Jack P. Friedman, Ph.D., CRE, MAI, SREA, ASA, FRICS, CPA, is principal and CEO of Jack P. Friedman & Associates, Richardson, Texas, a real estate appraisal and economics consulting fi rm. He is nationally recognized as an author, appraiser and consultant in real estate economics and related disciplines. Friedman’s work in recent years has been in litigation support (principally appraisal
review and appraisal) regarding ad valorem tax cases, environmental damages, condemnation, construction defects, contract disputes, and a variety of economic issues. Formerly, he served as senior research economist and head of research of Texas A&M University’s Texas Real Estate Research Center, and was the Laguarta Professor in the Department of Finance. Friedman has written more than 20 books and 200 articles, and has been published in The Appraisal Journal, Real Estate Issues, Real Estate Review, Real Estate Finance, and other journals. He served on the national Real Estate Accounting Committees of the AICPA and Texas Society of Certifi ed Public Accountants and was a member of the Appraiser Qualifi cations Board of the Appraisal Foundation. Friedman earned his doctorate degree from Georgia State University.
Barry A. Diskin, Ph.D., CRE, is professor and Francis J. Nardozza Scholar in the College of Business at Florida State University. Diskin teaches valuation classes to real estate majors at the undergraduate and graduate levels. His focus and research have been on natural gas pipelines for eminent domain cases, property tax
challenges, contamination matters, and contract disputes. Previously, Diskin published in The Appraisal Journal, the Journal of Real Estate Research, Real Estate Economics, the Journal of the American Bar Association, and other real estate publications. He has been interviewed on national television about home buying issues and testifi ed before the Florida legislature about mobile home park legislation. Diskin is principal in the fi rm Diskin Property Research and has qualifi ed as an expert witness in six states. His doctorate degree is from Georgia State University.
About the Authors
18
REAL ESTATE ISSUES Volume 39, Number 1, 2014
Th e gap increases with education, as each group feels more strongly about its own lexicon and refuses to recognize any other. Anyone with a college degree in business administration has taken Accounting 101 (literally), where the accounting defi nition of terms such as depreciation, amortization, capitalization, and lower of cost or market are drilled in. Nearly all business majors get through their degree program without a course in real estate, and at least 99 percent without a course in real estate appraisal or fi nance. When the college graduate hears one of these terms, he/she may not recognize the diff erent vernacular used by the real estate professional and may view the other party with misunderstanding or distrust, assuming that the real estate professional is ignorant of the proper (accounting) usage.
Here we explore a few of the commonly encountered terms in real estate and explain how the real estate defi nitions diff er from other well-known uses. Th e list will be considered in alphabetical order.
AMORTIZATION
Th e most common use of amortization in real estate is the systematic reduction of a debt through payments toward the principal. Whenever a periodic debt payment exceeds the interest requirement, the excess reduces (or amortizes) the principal balance.
In accounting, amortization is the periodic write-down of an intangible asset over time, which may be its estimated useful life or another period, based on tax or accounting regulation.
AUDIT
To an accountant, audit means a test of the fairness of presentation (validity and accuracy) of fi nancial statements. Taxpayers, however, may dread the audit that is an investigation to validate their compliance with tax laws, frequently concerning reported taxable income.
For real estate owners, an audit may be a test to determine the validity of the rent rolls or of tenant lease terms. It could be an eff ort to determine the accuracy of expense pass-throughs to commercial tenants or whether sales reports comply with overage rent requirements.
CAPITALIZATION
In real estate and economics, capitalization is a process of valuation of an income stream whereby the expected future income is converted into one lump-sum capital value.
In accounting, capitalization is establishing an asset on a balance sheet. To qualify as capital rather than an expense, an acquisition must cost over a certain threshold amount set by corporate policy at, say, $1,000 to avoid cluttering the balance sheet with trivial amounts, and the asset must have a useful life of more than one year.
Th e cost of repair to a roof or a parking lot may be expensed or capitalized in fi nancial accounting statements depending on the amount and whether the repair will extend the useful life of the asset.
CASH EQUIVALENT
Th e fi nancing of real estate, whether good or bad, is likely to infl uence the price paid. Th e cash equivalent is the result of converting the amount paid for real estate that comes with debt to an amount equal to what would be paid for the same property in cash. Land bought with below-market-rate seller fi nancing may have a higher selling price associated with the sale than if it had been bought with cash. Th e process of cash equivalence then reduces the face value of the debt and the face selling price of the real estate to what it would have been in an all-cash transaction.
In fi nancial statements, cash equivalents include corporate investments that are virtually the same as cash in value and liquidity. Treasury bills (which mature in a year or sooner) may be shown as an asset in an account called “Cash or Cash Equivalents.”
COST
Generally, cost is the amount historically paid for an asset that was acquired.
Original cost in real estate is the amount the very fi rst purchaser paid. Historical cost is the amount paid by the current owner. Trended cost is original or historical cost increased (or decreased) by changes in the price over time for that type of property. Reproduction cost new is the
FEATURE
Watch Your Real Estate Language!
Jack C. Harris, Ph.D., is an instructor at Florida State University and a Course Approval Program reviewer for the Appraisal Foundation. He formerly served as research economist at the Real Estate Center at Texas A&M University. Harris earned his doctorate degree from Georgia State University.
About the Authors
19

REAL ESTATE ISSUES Volume 39, Number 1, 2014
current cost of a replica, while replacement cost new is the current cost to acquire an asset with equivalent function, built to modern standards.
For accounting purposes, cost is the initial amount paid, including freight and installation. Replacement cost is the amount required to purchase the same asset, in its current age and condition, in the market.
DEPRECIATION
In economics, depreciation is a loss in market value from all sources. In most real estate situations, depreciation is a reduction from reproduction or replacement cost new in appraisal, having three possible sources: physical, functional and external (also called environmental or economic).
Depreciation expense for accounting purposes is generally original cost spread over useful life. Th e method applied may be straight-line (equal each period) or accelerated (more in early years). Th is is a method of allocation, not valuation. Should depreciation accounting approximate the economic loss in value over time, it is likely to be due largely to a knowledgeable selection of life and method from experience, or to coincidence.
For regulated utilities, the historical cost of prudent investments is accepted in the rate base, and depreciation is generally applied based on that amount, spread over its estimated useful life allowed by regulation.
Depreciation allowed for income tax purposes is based on tables with lives for diff erent types of assets, as stated in tax law. Tax lives allowed for buildings have ranged widely, from as little as 15 years for assets acquired in 1981–1984 to the current 27.5 years for apartments and 39 or 40 years for commercial property.
EXTRAORDINARY ASSUMPTION
In real estate appraisal, an extraordinary assumption is an assumption directly related to a specifi c assignment, as of the eff ective date of the assignment results, which, if found to be false, could alter the appraiser’s opinions or conclusions. It is a term of art describing an appraiser’s presumption as fact otherwise uncertain information about physical, legal, or economic characteristics of the subject property; or about conditions external to the property, such as market conditions or trends; or about the integrity of data used in an analysis.
Since the dictionary defi nition of extraordinary will be something like “going beyond what is usual, regular or customary,” it may appear that an extraordinary
assumption is one that is unwarranted or indefensible, and the appraiser’s explanation may fall on deaf ears when provided to an attorney who wishes to discredit the appraisal in litigation.
FAIR VALUE
Aft er numerous modifi cations, the Financial Accounting Standards Board (FASB) developed Accounting Standards Codifi cation Topic 820 (ASC 820), previously FAS 157, to explain the accounting application of concepts related to value.
ASC 820 embraces many of the same concepts of market value that real estate appraisers use for fi nancial institution appraisals. However, there are many nuances of ASC 820 that distinguish fair value measurement from the market value used by real estate appraisers.
LOWER OF COST OR MARKET
Th is is an accounting concept applied by CPAs to assets, carefully applied to inventory, but the term also has been embraced by business appraisers, with diff erent meanings.
In accounting, “cost” is the amount in the company’s records based on the cost paid plus freight-in and installation. For inventory, costs of purchases may be kept as fi rst-in-fi rst-out (FIFO), last-in-fi rst-out (LIFO), average cost, moving average cost, and retail method. “Market” is the amount required to currently acquire the same products from suppliers.
In one appraisal meaning of “lower of cost or market,” “cost” is the amount that must be paid to replace or reproduce the product. “Market” is the amount a willing buyer and willing seller (presuming the current owner would sell) would agree upon for the sale of that product.
DR. SEUSS CONCLUDES
Horton said, “I meant what I said, and I said what I meant.” But do listeners hear what Horton said, or understand it as it was intended? Or do they hear something diff erent, based on their diff erent understanding of the words?
When the defi nition of a term is crucial to the execution of a transaction, it is oft en important to determine the writer’s or speaker’s understanding of a term, to be assured that the listener or reader is on the same page. It is particularly important when real estate appraisers or consultants are dealing with other professionals having their own technical vocabularies that use the same words with diff erent meanings. ■
FEATURE
Watch Your Real Estate Language!
20

REAL ESTATE ISSUES Volume 39, Number 1, 2014
INTRODUCTION
Landfills are unique properties that present both questions and opportunities for real estate professionals. Th e better that we real estate professionals understand what landfi lls are and how they work, the better we can help our clients who either have or anticipate business issues related to landfi lls.
A landfi ll is essentially a short- to long-term, going-concern business that is operated on a parcel of real estate. Generally speaking, a landfi ll is a hole in the ground that is operated as a business. Th e hole may exist before the landfi ll is opened, or it may be created as an early part of the construction process. A landfi ll’s value is based on a combination of factors, but primarily on what can legally be dumped into it, the market demand to dump it there, at what price the market dictates it can be dumped, and the remaining capacity of the landfi ll.
LANDFILL CLASSES
Types of landfi lls range from the most basic Class I rubbish landfi lls to the more complicated Class III municipal landfi lls. Th e regulations for those classes may vary somewhat from state to state, even to the point of a Class I landfi ll in one state being called a Class One landfi ll in another state, but the diff erences usually are minimal.
Class I landfi lls generally do not require a liner and are designed to accept land-clearing debris and debris that will not endanger the groundwater, such as unwanted dirt, brush, tree stumps and limbs, etc. Household garbage and products containing petroleum, PCBs and other chemicals are not allowed in Class I landfi lls. Obtaining a Class I landfi ll permit is usually a fairly simple process, provided that zoning regulations allow it and that there are adequate buff ers and distances from the landfi ll to residences, schools and drinking water sources.
INSIDER’S PERSPECTIVE
Landfi lls: Operations and Opportunities
BY JOE W. PARKER, CRE, AND CURTIS A. GENTRY IV, MAI
Joe W. Parker, CRE, MAI, FRICS, is president of Appraisal Research Company and senior vice president of Equity Solutions USA. He fi rst entered the real estate profession in 1974 and established Appraisal Research Company in 1978. In 2003, he co-founded Equity Solutions USA, an appraisal management company that provides
appraisal services to regional and national banks.
Parker has appraised commercial real estate throughout the South and Lower Midwest with appraisal experience in environmentally contaminated properties, fi ber optic corridors, cemeteries, golf courses and country clubs, colleges and schools, hospitals, wetlands, conservation easements and historic properties. As well as regularly advising clients on a variety of real estate matters, Parker oversees all appraiser credentialing and reviewing processes at Equity Solutions USA.
Parker also serves as an expert witness on such issues as construction defects, mortgage fraud, title defects, environmental contamination and stigma. He was trained as a Mediator at the University of Houston’s Bauer College of Business and at Harvard Law School.
Curtis A. Gentry IV, MAI, Madison, Mississippi, is a senior analyst and partner at Appraisal Research Company. He earned an undergraduate degree in Recreation Tourism with a concentration in Resort Management from the University of Florida, and a master’s degree in business administration with a
concentration in Finance from the University of Mississippi. Gentry entered the real estate appraisal profession in 1994 and joined Appraisal Research Company as a partner in 2004.
Gentry has a wide range of commercial real estate appraisal experience that includes a signifi cant concentration in medical facilities, industrial facilities and landfi lls. He also is an active real estate investor.
About the Authors
21

REAL ESTATE ISSUES Volume 39, Number 1, 2014
Class I landfi lls oft en reverse an earlier process that created the hole in the ground. Perhaps it was once a gravel pit or a dirt pit from which good quality construction dirt was removed and sold. Th e resultant hole in the ground creates an opportunity to both generate additional income and fi ll a community need. Builders, contractors and others haul unwanted dirt, rocks, tree brush, stumps and roots into the landfi ll where they pay a fee to the landfi ll operator to dump the unwanted materials. Th e dumping fee can be based on the weight of the materials if the landfi ll has truck scales, or it can be a dollar amount per load, per cubic yard or even per truck axle.
During this re-fi lling process, the landfi ll operator uses construction equipment, usually a landfi ll compactor which is essentially a steel-wheeled bulldozer, to spread the dumped materials and compact them as much as possible since compaction density and remaining space are keys to the value of the landfi ll. Once a Class I landfi ll is full, regulations usually require it to be reclaimed by adding a layer of soil directly on top of it. Depending on the location, regulations may require that trees or other vegetation be planted as part of the reclamation process. In some states, the landfi ll owner has ongoing liabilities for a Class I landfi ll for several years aft er it has been reclaimed.
Once the reclamation process is completed, the Class I landfi ll evolves into a tract of timberland or pastureland. Due to the nature of the dumped materials and the inability to uniformly compact the materials that were dumped there, a reclaimed landfi ll usually lacks the soil-bearing capacity for buildings to be constructed on it. Properly done, the reclamation process leaves a parcel of grasslands or woodlands that shows no trace of having ever been a landfi ll.
Class II landfi lls are legally allowed to accept a wider range of materials and matter, including a number of household items, but stopping short of municipal solid waste. Th ese are usually mom-and-pop operations where the operator or an employee greets each arriving vehicle, eyes the contents to make sure nothing illegal is included and estimates the size of the load, and then shouts a dumping fee number to the driver who can then either pay the fee or drive off with what is usually unwanted junk. Exceptions are the more sophisticated landfi lls that charge by weight using truck scales. A Class II landfi ll is oft en a graveyard for old sofas, mattresses, televisions and household junk.
Class III landfi lls, oft en referred to as municipal landfi lls, are equipped to take biodegradable food and a variety of bio products including municipal and industrial solid waste. Th e garbage truck that picks up your trash at the street curb once or twice a week takes it to a Class III landfi ll. Dumping fees are almost always calculated on a price per ton, with long-term contracts in place for high-volume customers, oft en at reduced rates.
Th ere are also specialty landfi lls. One may limit its intake to storing contaminated materials, while another may be designed for recycling. Two popular recycling projects involve concrete and asphalt paving. When concrete is recycled, the dumped concrete is crushed into smaller pieces, and any reinforcing metal is separated from the concrete and then melted down for recycling. Both the recaptured metal and the recycled concrete are re-used, usually with minimal loss of materials. Old asphalt paving is recycled in much the same way.
Both Class II and Class III landfi lls require liners to prevent infi ltration of the decaying materials into the groundwater and onto other nearby properties. Liners are usually constructed of either rubber or plastic materials and are called geomembranes. Much like a vinyl liner in a swimming pool, landfi ll liners keep the dumped materials in the landfi ll and protect the adjoining lands from contamination as the dumped materials deteriorate. Landfi ll liners constitute a major expense for owners. Th e required thickness and type of the liner are based on the soil type. Landfi lls with heavy clay soils underlying the bottom and sides of the landfi ll can utilize thinner and less expensive liners than landfi lls with more porous soils. Th us, examining soil types is a major component in landfi ll site selection. Both Class I and Class II facilities are required to have run-off ponds or detention areas to keep rainwater on the sites.
In Class II and Class III landfi lls, dumping takes place in areas called cells, which are specifi c areas within the landfi ll. Compaction is a key since there is only so much air space within each cell. Operators strive for a compaction rate of 1,600 to 1,800 pounds of dumped material per cubic yard of air space, but they oft en get less, depending on the nature of the materials being dumped. Regulations for Class III facilities require that each cell be completely covered with at least six inches of dirt at the end of each day to deter air contamination.
Astute developers will move and store onsite the soil that was removed from the “hole” when the landfi ll was fi rst
INSIDER’S PERSPECTIVE
Landfi lls: Operations and Opportunities
22

REAL ESTATE ISSUES Volume 39, Number 1, 2014
INSIDER’S PERSPECTIVE
Landfi lls: Operations and Opportunities
created, thus having a ready supply of dirt on hand to complete the required daily covering processes. However, novice developers sometimes make the mistake of fully removing that dirt from the landfi ll site early on, thus resulting in signifi cant additional future expense when the operator has to purchase “cover” dirt to replace the original dirt.
As the layers of cover dirt build up every day, the top elevation of the landfi ll rises. Landfi lls generally are permitted for a specifi c height restriction, but regulatory bodies oft en will grant variances that allow an existing landfi ll to fi ll to an elevation higher than that called for in the original permit, especially when there are no other operational landfi lls in the area or when remaining capacity of other area landfi lls is short.
As rainwater fl ows into a landfi ll, some of it seeps into the ground and mixes with decomposing matter, forming a liquid called leachate. To control the leachate in Class III landfi lls, the operator installs perforated pipes that enable it to be redirected to a containment area or facility where it can be chemically treated.
Methane gas also forms as the dumped materials decompose. It is usually collected and routed to the surface via pipes. As the landfi ll rises in height, the operator simply adds to the height of the pipes and those pipes get taller. Th e methane gas oft en is burned off above ground with a fl are that operates much like an oil well fl are. In some cases where it is economically feasible to do so, the methane gas is collected and used to produce alternative energy.
Landfi lls are not without liability. Aft er an operator reclaims and closes a Class III landfi ll, the operator is required to monitor and maintain the landfi ll for an additional 30 years. Th e potential liability associated with the deteriorating matter, the leachate, the methane gas and the continued integrity of man-made liners is substantial.
Landfi ll owners and operators range from small mom-and-pop establishments to large multi-national corporations. Many landfi lls across the U.S. were started by small companies or mom-and-pop establishments. Many of those smaller operations have been sold to larger corporations that operate numerous other landfi lls, and many of the municipal landfi lls are owned and operated by cities and counties.
Th e larger operators simply have honed landfi ll operations into an art. Th ey also understand that if they can control the market, they can control the price. Th ey may also better understand how to achieve the maximum possible compaction ratios that add to the profi tability of a landfi ll. Aft er all, a landfi ll is a depleting, fi nite asset. Maximum compaction is essential because there are only so many cubic yards of space available, and when that space is fi lled, nothing is left but the ongoing liability.
THE PERMITTING PROCESS
Most real estate is considered to have a long, useful life. However, that is not the case with a landfi ll operation. Landfi lls cannot be created without a permit, and permits for Class II and Class III facilities particularly are extremely diffi cult to acquire. Th ere are numerous legal, governmental and environmental steps, procedures and requirements that a parcel of land must overcome to even be considered for a landfi ll permit. Obviously, the more simplistic the landfi ll, the fewer requirements or steps an operator has to go through in order to get a site permitted. For example, a Class 1 rubbish landfi ll does not have nearly the number of legal and environmental hurdles to clear in the permitting process that a Class III municipal landfi ll faces. Because of the household and industrial products a Class III landfi ll takes in, the permitting and approval process can sometimes take years.
Once a permit is obtained, it will generally indicate to what degree or how much of a parcel of land can be utilized for the storage of whatever materials the land is permitted to take in for disposal. A landfi ll’s life is directly related to its available air space. Air space is generally described as cubic yards of remaining storage area. A permitted landfi ll essentially sells air space to customers. Th ose customers bring whatever waste disposal they have to a particular landfi ll that is permitted for that waste, and they are charged per cubic yard.
Th e capacity of a landfi ll is generally described in cubic yards but also can be described in metric tons. However, the cubic yard unit of measurement is generally the most accepted. Th e remaining capacity can generally be calculated based on how much of the permitted air space remains available to use and the anticipated average compaction ratio for the materials likely to be dumped. Typically, permits will allow a certain landfi ll to go so deep into the ground and so high up into the air. A term known
23

REAL ESTATE ISSUES Volume 39, Number 1, 2014
INSIDER’S PERSPECTIVE
Landfi lls: Operations and Opportunities
as “tree tops” stipulates that the landfi ll can go no higher than the surrounding local tree vegetation. Over a landfi ll’s life, it is common for operators to petition governing environmental agencies for more depth or more height on their permitted acreage to thus increase their air space.
OPPORTUNITIES FOR REAL ESTATE PROFESSIONALS
Landfi lls present opportunities for real estate professionals with varying practice types. For a developer with the capital, connections and the sheer endurance to get a new site permitted, a landfi ll presents a relatively secure, long-range source of income. Th ere also are opportunities for investors to fi nd and acquire existing landfi lls to purchase.
For the real estate attorney, there are opportunities to assist with purchasing and permitting. Permitting is usually a long, drawn out process with many regulatory hurdles. Knowledgeable attorneys can alleviate many of the permitting pains for an owner. Th ey can help with applications and hearings, and even negotiate with other nearby landowners who may not want the landfi ll in their backyard.
For brokers, there are oft en buy and sell situations. Learning where to look for buyers and sellers, and how to motivate those buyers and sellers to action, can lead to good sales transactions. One sale oft en leads to another since landfi ll sales oft en are at signifi cant price numbers that call for tax-deferred exchanges, rather than highly taxed sales. Th ere also are opportunities to locate and negotiate purchases of new sites for landfi ll operators.
For appraisers, there are valuation problems to be solved quite regularly, such as for fi nancing, sales and purchases, and for estate and gift transactions. Some of the larger operations need them regularly for fi nancial reporting purposes.
Landfi lls typically are valued using a discounted cash fl ow analysis, with valuations based on an annual absorption of air space, which is sold on the market at a rate generally supported by history of the appraised landfi ll and by market rates of neighboring or competing landfi lls. When long-term contract rates are involved for some customers, they can be adjusted for and weighted based on the amount of air space those particular customers are likely to purchase or consume per year. However, the potential gross revenue of a landfi ll generally is almost always
subject to how much air space can be sold in a year, the density to which it is likely to be compacted, and at what rate the remaining air space can be sold.
Th e landfi ll’s annual net cash fl ow is then projected for each year over a holding period. Th ere is no set holding period for a landfi ll in terms of an investment vehicle. Typically smaller mom-and-pop landfi lls have a relatively short holding period of fi ve to seven years. Th eir plan oft en is to build the business up and then sell the landfi ll. Larger municipal landfi lls, typically owned by large corporations, have longer holding periods, but the value is still based on the amount of its remaining air space.
Once the appraiser has projected the gross annual income based on the amount of air space to be sold per month or per year at an average market price per cubic yard, expenses are then deducted over each time period in the holding period. Expenses can run the gamut depending on the Class of landfi ll being appraised. With a simple Class I rubbish landfi ll, operational expenses usually are no more than several employees, one or two bulldozers, and truck and scale equipment. Equipment expenses usually are projected based on long-term rental rates for the required equipment unless the owned equipment is part of the valuation.
Other expenses typical of investment real estate such as real estate taxes, insurance and other general fi xed and variable expenses must also be considered and deducted. With larger Class III landfi lls, the expenses grow exponentially, and they continue well past the time when the landfi ll is expected to generate income.
Once expenses are deducted, the analyst selects a discount rate in order to arrive at the net present value of those income streams, including the value of any reversion. Th e reversion generally is always expressed as the price at which the landfi ll is expected to sell at a specifi ed point in the future, assuming a certain amount of remaining air space, although a landfi ll nearing the end of its useful life may have a reversion only as a parcel of reclaimed land. Th e reversion number can vary signifi cantly if the analyst does not accurately forecast absorption. For instance, if the analyst underestimates or overestimates the absorption, the reversion may be misstated.
Th e income-producing life of a landfi ll operation basically ends once all of the permitted air space has been consumed. Once that occurs and the reclamation process
24

REAL ESTATE ISSUES Volume 39, Number 1, 2014
INSIDER’S PERSPECTIVE
Landfi lls: Operations and Opportunities
has been completed, a landfi ll usually holds very little value. Some landfi lls require monitoring and attention years aft er all the useful space has been fi lled. However, simpler landfi lls such as Class 1 rubbish landfi lls can be covered with dirt, landscaped and utilized as other types of real estate such as recreational land. Municipal landfi lls, however, have much less leeway in what the property can be used for once all the air space has been absorbed and sold.
An appraiser also can apply a “Sales Comparison” approach in appraising a landfi ll by collecting data on sales of landfi lls where the unit of comparison can be expressed as the price per cubic yard of remaining air space at the time it sold. For example, if a Class I rubbish landfi ll that had approximately one million remaining cubic yards of air space sold for $2,000,000, the unit sales price was $2 per cubic yard. Adjustments certainly can be made to each sale to account for such things as competition and location. Such sales data can be diffi cult to fi nd and confi rm, but it does exist.
In conclusion, landfi lls are and have been an important part of society for disposal of the basic by-products that we produce as a society. New and innovative ways of recycling will perhaps change the industry in the future but, as for now, most of the waste we generate needs to be stored in some type of landfi ll. As long as that continues, there will be opportunities for real estate professionals to help clients solve business issues related to landfi lls.
ACKNOWLEDGMENT
Th e authors would like to thank David Briggs for his assistance in helping them prepare this article. Briggs is retired from a 25-year career with Waste Management. Beginning as a driver, he rose through the ranks to the position of market vice president where he was responsible for all facets of the company operation in Mississippi. In that position, Briggs also oversaw the operations of several municipal landfi lls in major cities in Mississippi and Alabama. He provided invaluable insight to the authors pertaining to day-to-day landfi ll operations. ■
25

REAL ESTATE ISSUES Volume 39, Number 1, 2014
VIEWPOINT
The Death of Corporate Reputation
BY BOWEN H. MCCOY, CRE
Editor’s Note: the “Viewpoint” column is intended to off er CRE members and others an opportunity to present their viewpoint on a topic that has an impact and/or implications for the real estate industry or other business-related topics.
For more than a century law firms, investment banks, accounting fi rms, credit rating agencies and companies seeking regular access to U. S. capital markets made large investments in their reputations. Th ey generally treated their customers well and occasionally even endured losses to maintain their reputations as faithful brokers, dealers, issuers and gatekeepers.
Many would conclude that this has changed. Today’s leading capital market participants no longer treat customers as valued counterparties whose trust must be earned and nurtured, but as distant counterparties to whom no duties are required. Th e rough and tumble norms of the marketplace have replaced the long-standing fi duciary model in U. S. fi nance. Th e result has been unrelenting fi nancial scandal.
Th is change in values has been described in a recent book entitled Th e Death of Corporate Reputation: How Integrity Has Been Destroyed on Wall Street, by Jonathan R. Macey, professor of law at Yale. Th e author asserts that reputation matters far less than it used to for three reasons. First, improvements in information technology have lowered the costs of discovering information about people. As a result, individuals involved in the fi nancial markets focus far more on the development of their own individual reputation rather than on the reputation of the companies for which they work. Second, law and regulation serve as a substitution for reputational capital. Participants have come to rely far more on the protections of the law and far less on the comfort provided by reputation. Th ird, the world of fi nance has become so complex that the rocket scientists who design complex fi nancial instruments have replaced the simple, high reputation practitioners of “Old School Finance.”
An ironical thesis of the book is that fi rms that are subject to systematic and pervasive laws and regulations will have weak incentives to invest in developing and maintaining their reputations. Another thesis is that fi rms will expend human and fi nancial capital maintaining a reputation only so long as there is a payoff in the marketplace for doing so. Firms that can make creditable commitments to clients that they are honest and reliable become more desirable contracting partners and should be able to charge more for their services. Historically, loss of reputation was fatal to accounting fi rms such as Arthur Anderson, and to law fi rms like Vinson and Elkins, and to credit rating agencies like Moody’s. Such fi rms no longer depend on maintaining their reputations as a key to survival. Instead, regulations oft en require companies that issue securities to retain various Wall Street service providers. Because the demand for the services of these fi rms is driven by regulations, the fi rms do not need to maintain their reputations in order to attract business. Th us, reputation is no longer an asset in which it is rational to invest.
Th e primary purpose of investment in regulation is to assure investors that they can invest with some degree of confi dence that they will not be defrauded. Like
About the AuthorBowen H. ‘Buzz’ McCoy, CRE, is past president of The Counselors of Real Estate®. McCoy was employed at Morgan Stanley for 27 years. He is the author of the award-winning and broadly used case study on values-based leadership “The Parable of the Sadhu.” His book on values-based leadership entitled Living Into Leadership was published by
Stanford University in 2006.
26

REAL ESTATE ISSUES Volume 39, Number 1, 2014
regulation, which is costly, developing and maintaining a reputation for honesty is very expensive. It is more expensive to be honest than it is to be dishonest. Profi t-maximizing fi rms can be trusted to make costly investments in reputation only as long as the investments pay off . If the costs of investing in reputation are greater than the benefi ts, really honest people will be driven out of business (Gresham’s Law), because businesses lose money by investing in reputation.
Th e traditional theory of reputation still appears to have more force in the fi nancial world than in the worlds of manufacturing and technology where customers can receive product warranties. Financial markets, trading pieces of paper, have value only when there is an underpinning of trust that the relative value will always be there.
Th e decline in the value of reputation can be traced to the fall of Drexel. Th ree critical lessons emerged from the Drexel scandal. Th e traditional theory of reputation stated that sharp business practices were only mildly profi table. Drexel proved that sharp practices can be enormously profi table. Drexel also showed that the costs of swindling and cheating were far less than had been thought. Employees of companies that lose their reputations survive and thrive performing similar work at other companies. Th e Drexel scandal proved that individual reputations are no longer fi rmly linked to the reputations of the fi rms they work for. Other than the few who go to jail, scandals do not destroy the futures of the people involved in the scandals. Criminal indictments remain a horrifi c event, but civil indictments, even when brought by the SEC, have lost most of their shaming eff ect. Finally, the traditional theory of reputation was that people and companies have a single, unitary reputation. Th at theory has fallen to the immense rise in individual autonomy and free agency.
Macey asserts the regulatory environment over-enforces highly technical rules and under-enforces simple fraud, thereby undermining the reputational signaling of SEC action. All major investment banks and accounting fi rms have been involved in litigation, destroying the ability of investors to use regulation as a means of identifying good or bad companies. Th e fi rms also settle nearly all the cases brought against them without admitting wrongdoing, further complicating the information that investors can infer from regulation. As a result, regulation has become decoupled from reputation in modern fi nancial markets.
For decades the SEC has kept the insider trading rules vague and undefi ned. Th is ambiguity increases the SEC’s power and enables government lawyers to pick and choose among prosecution targets. Large brokerage fi rms expend huge resources in order to gain informational advantages over their competitors. Some of this informational advantage is legal, some is not. Th e government purposefully fails to provide clear guidance as to what is illegal insider trading and what is legitimate, aggressive research.
A reasonable interpretation of the traditional theory of reputation is that reputation is so important to the operation of the fi nancial markets that such markets could virtually disintegrate and perhaps even cease to operate in the absence of trust. Unknown companies that wanted to raise capital by selling their securities used to be able to “rent” the reputations of powerful reputational intermediaries such as accounting fi rms, law fi rms, credit rating agencies and investment banks. People are also more willing to trust others with whom they share common characteristics such as culture, ethnicity, national identity and creed. As communities become more diverse, people tend to trust each other less.
My own experience was that of a “legacy partner” of a major investment bank where I was employed from 1962 to 1990. Th e early days were Dickensian, when we underpaid apprentices fi lled out huge sheets of yellow accounting papers with calculations made on electromagnetic calculators. Th e senior partners did not bother to learn our names. I don’t know how we survived it, but it was mainly through humor and shared misery.
Yet the fi rm’s values became deeply imprinted on each of us. As one of our founders once stated: “We shall do only fi rst-class business, and that in a fi rst-class way.” Our work product had to be error-free and excellent. Everyone paid attention to the details. Th ere were no short cuts. Th e clients’ interests were put before those of the fi rm. Teamwork was vital. We were a true partnership, meeting all together twice a week, most of us owning equal percentages of the business. It was unthinkable to let the partnership down. We were the fi rm. We lived it out.
When I joined the fi rm, there were 140 employees. When l was elected a general partner eight years later, there were 250 of us. Today the fi rm numbers more than 55,000 employees. In the smaller fi rm, it was far easier to communicate and live out values. In the annual
VIEWPOINT
The Death of Corporate Reputation
27

REAL ESTATE ISSUES Volume 39, Number 1, 2014
promotion cycle, each of the candidates was well known to those making the decisions. It was possible to rank order candidates and maintain consistent standards. Today, in the large remaining banks, it is promotion by assertion. Th e New York-based senior offi cers cannot be expected to know candidates located in India or Hong Kong or Des Moines. Likewise, it is diffi cult to transmit and engender a coherent culture. All the major banks have been sued for insider trading or other securities law violations. Fift y years ago it was possible to describe individual banks or accounting fi rms by their unique cultures. Today all the monolithic banks appear the same. It is interesting that Bill Hewlett and Dave Packard, founders of Hewlett Packard, felt that the largest business unit that could sustain their culture as they grew was 1,000. When a group reached that size, it was hived off to a new location.
Th e focus in the fi nance industry at present seems to be on establishing rules for regulation, negotiating rules, bending rules, getting around rules and the like. Responsible leadership involves living beyond the rules, living out personal values, respecting clients and customers, and educating the young people in our businesses on responsible leadership. Rather than trading off , compromising, maximizing outcomes, placing personal autonomy ahead of the group, values-based leadership changes the focus to: what are we willing to lose for? As Professor Macey points out, cheaters do prosper.
In my spare time I attempt to facilitate discussions of business ethics among MBA students. I emphasize the value of reputation to a fi rm and the need to constantly renew and reinforce values. I ask them, as professionals, what responsibility they feel they have in promoting values and good practice. I ask them to assume they are CEO of a company that has just been raided. You are frightened, angry and concerned about the loss of your large salary, corporate jet, tickets to Super Bowl and the Masters. First thing you must do is hire an investment banker to mount your defense. It comes down to two fi rms. Th e fi rst has a stellar reputation and a fairly good record in takeover defense. Th e second is known as being a little sharp, playing it close to the edge, pushing the murkier aspects of the law, but it has the best record in defending companies. Which would you choose? Th e vote is usually two to one in favor of the edgier fi rm with the best record. I conclude the discussion by asking them what responsibility do they feel they have, as well educated professionals, to protect and raise the standards of American business? How do things ever get better?
Th e role of a true leader is to help clear away the debris and focus on the primary issues. It is to develop an orderly procedure for prioritizing important issues. It is to evaluate, admire and defend good practice and to critically and objectively evaluate bad practice. It is to create an atmosphere of professionalism and calm in the midst of controversy. It is, as usual, to help guide our associates to do the right thing. ■
VIEWPOINT
The Death of Corporate Reputation
28

REAL ESTATE ISSUES Volume 39, Number 1, 2014
INTRODUCTION
Form-based zoning has a long history and is increasingly being used by municipal governments throughout the United States to infl uence the composition of urban areas. Th ese regulations off er real estate developers fl exibility in project size, allowable land uses and product mix in exchange for the imposition of specifi c controls on some of the external features of buildings that infl uence how these structures interact with the public realm.1 Th ere are reasons to believe both the public and private sectors can derive signifi cant benefi ts from this approach when it is managed appropriately.2 However, some policymakers and planning departments have an established record of implementing form-based zoning in a manner that is inconsistent with its underlying principles. Reluctance on the part of municipal governments to provide true by-right fl exibility, coupled with cumbersome aesthetic requirements extending beyond controls on urban form, contribute to tenuous support for these regulations amongst real estate developers. Th e purpose of this article is to explore the potential advantages and disadvantages of form-based zoning in the hope of determining how it can be used more eff ectively to support development that is fi nancially viable and socially benefi cial. Th is is accomplished by fi rst reviewing the features of this type of land use regulation, before shift ing attention to the ways in which it can aid or frustrate real estate development initiatives. Th e analysis concludes with a summary of best practices that can be adopted by municipalities to maximize the value of form-based codes in an eff ort to make their jurisdictions more attractive for real estate development projects capable of stimulating economic activity.
THE FUNDAMENTALS OF FORM-BASED ZONING
Although the scope and purpose varies across jurisdictions, eff ective form-based codes contain two unifying principles. First, they impose relatively strict
controls on the external form and scale of buildings in order to defi ne the character of a neighborhood or district in a desired way. Second, they provide broad fl exibility in allowable land uses and by-right entitlements to developers willing to construct projects in conformance with a community’s articulated vision. Both of these features represent sharp departures from traditional zoning ordinances that oft en discourage mixed-use development and subject developers to time-consuming and costly project entitlement processes.
A key to understanding form-based zoning is recognition that this type of land use regulation is primarily intended to enhance the “public good” derived from private sector development. Th is involves managing the siting, massing and frontage layout of buildings in ways that create public spaces promoting pedestrian interaction, usually through the incorporation of active streetscapes and squares.
INSIDER’S PERSPECTIVE
Form-Based Zoning from Theory to Practice
BY DAVID WALTERS AND DUSTIN READ, PH.D., J.D.
David Walters, a British architect and urban designer, directs the Master of Urban Design program at UNC Charlotte, and is senior urban designer at the Lawrence Group.
Walters is the author of two books on urban design and planning, Design First: Design-based Planning for Communities, co-authored with his wife Linda Luise Brown, and Designing Community: Charrettes, Masterplans and Form-based Codes.
Dustin C. Read, Ph.D., J.D., serves as the director of the Center for Real Estate at UNC Charlotte. He earned his doctorate degree in public policy at UNC Charlotte and his juris doctor at the University of Missouri. Read’s research interests include land use policy, public-private partnerships, and sustainable development practices.
About the Authors
29

REAL ESTATE ISSUES Volume 39, Number 1, 2014
INSIDER’S PERSPECTIVE
Form-Based Zoning from Theory to Practice
Some basic examples include requiring buildings to be lined up along streets, with parking facilities moved to the rear, in order to create a pedestrian-friendly street edge. Th e objective is not to impose draconian aesthetic requirements upon real estate developers, but rather to better connect public spaces and reinforce the urban character of an area by incentivizing a specifi c type of built environment. Long before any specifi c development is proposed, stakeholders have the opportunity to help defi ne the desired urban character by participating in design planning through public hearings and other forums for community engagement.3 Once consensus is reached through this pluralistic process and design codes are established, planning departments and policymakers are expected to entitle conforming projects. Examples of street design guidelines, district standards, and site and building standards from a prototypical form-based code can be found in Figures 1-3.
Form-based zoning encourages mixed-use development by providing real estate developers with broad discretion to horizontally or vertically integrate civic, commercial and residential space. Allowable use tables guide development within these zoning districts; with the authorized product mix becoming more permissive as locations become more urban in character. Building height is generally regulated by the number of stories, rather than the number of feet, to make diff erences in fl oor-to-fl oor heights less problematic across diff erent product types. Th e ability to shift between allowable land uses over the course of a project is provided by-right in eff ective form-based codes, thereby providing the private sector with the ability to quickly respond to market forces without incurring rezoning costs that can mount into the hundreds of thousands of dollars in some jurisdictions. Th is fl exibility, granted within the confi nes of controls on the external form of new development, benefi ts the public and private sectors by removing regulatory hurdles that have historically stifl ed mixed-use development projects. Zoning in this way ensures land uses are separated only when they are incompatible, not simply because they are diff erent.
Th ere are several ways in which municipalities can implement form-based zoning to achieve the aforementioned goals.4 Some communities regulate all development within their jurisdiction in this manner, while others have opted for application in much smaller geographies. Th e latter approach is more common, and is typically accomplished through the use of form-based overlays adopted for specifi c corridors or activity nodes. As opposed to the broad-reaching aesthetic requirements typically imposed through the conditional rezoning process, form-based overlays tend to focus primarily on factors infl uencing how buildings interact with streetscapes and public areas. Th is provides real estate developers with a higher level of predictability throughout the entitlement process.
At its very best, form-based zoning off ers a means of liberating real estate markets and providing developers with the ability to respond to consumer preferences by delivering pedestrian-oriented, mixed-use projects that refl ect the aspirations of a community. Th is can be illustrated by example. Consider a real estate developer interested in constructing a mixed-use project with residential units over ground fl oor retail. Regulatory entitlements are obtained by satisfying siting, massing and building frontage requirements clearly articulated in an existing form-based overlay. Should market conditions change, the developer has the by-right ability to alter the product mix to satisfy the existing tenant demand so long as the form and arrangement of buildings continues to meet the requirements of the code. A costly and time consuming rezoning is not necessary to modify the project in this manner. Th e predictability of the regulatory process reduces the time required to complete the project and the developer’s risk exposure, thereby putting downward pressure on construction costs, rental rates and housing prices. Th e end result is a more aff ordable project that remains consistent with the urban character called for by community stakeholders. Examples of two projects completed using form-based zoning can be found in Figure 4.
30

REAL ESTATE ISSUES Volume 39, Number 1, 2014
INSIDER’S PERSPECTIVE
Form-Based Zoning from Theory to Practice
Subdivision & Infrastucture Standards - I 6.8 Street Design & Classifi cation (adapts 9.1.1, 11.1 and 11.2)*
Figure 1.
*Reproduced by permission of Th e Lawrence Group. Th e sample page presented in this fi gure is illustrative of the content and layout of a modern form-based code, but cannot be interpreted in isolation without the supporting information provided in the remainder of the code.
31

REAL ESTATE ISSUES Volume 39, Number 1, 2014
INSIDER’S PERSPECTIVE
Form-Based Zoning from Theory to Practice
Figure 2.
District Standards I 2.2 District Standards*
*Reproduced by permission of Th e Lawrence Group. Th e sample page presented in this fi gure is illustrative of the content and layout of a modern form-based code, but cannot be interpreted in isolation without the supporting information provided in the remainder of the code.
32

REAL ESTATE ISSUES Volume 39, Number 1, 2014
INSIDER’S PERSPECTIVE
Form-Based Zoning from Theory to Practice
Figure 3.
Site & Building Design Standards I 4.6 General Building Design Requirements*
*Reproduced by permission of Th e Lawrence Group. Th e sample page presented in this fi gure is illustrative of the content and layout of a modern form-based code, but cannot be interpreted in isolation without the supporting information provided in the remainder of the code.
33

REAL ESTATE ISSUES Volume 39, Number 1, 2014
INSIDER’S PERSPECTIVE
Form-Based Zoning from Theory to Practice
Figure 4.
Rosedale is a multi-use development project horizontally integrating multifamily housing and grocery-anchored retail.
Birkdale Village is a mixed-use development project with offi ce space and multifamily units over street level retail.
Development Projects Completed Using Form-Based Zoning:Rosedale and Birkdale Village in Huntersville, North Carolina*
* “Rosedale:” Photo courtesy of David Walters and the Town of Huntersville* “Birkdale Village:” Photo courtesy of David Walters, Shook Kelley and Crosland Inc.
34

REAL ESTATE ISSUES Volume 39, Number 1, 2014
FORM-BASED ZONING FROM THEORY TO PRACTICE
Th e analysis presented to this point appears to suggest real estate developers should largely embrace form-based zoning, but this is not always the case, for a variety of reasons. Most concerns stem from an application of this regulatory tool in a manner inconsistent with its core principles or in confl ict with market realities. Some of the most common criticisms found throughout the planning literature are summarized in this section to inform both policymakers and real estate developers.
Form-based zoning is widely praised for its ability to reduce the amount of uncertainty faced by real estate developers in the entitlement process. Th is outcome is, however, largely dependent upon the structure of local regulation. Municipalities enacting form-based codes oft en take diff erent approaches when balancing their need for predictability and fl exibility.5 Some codes authorize by-right development so long as stringent design standards are satisfi ed, while others favor a more discretionary approach recognizing “design sensibilities” and evolving stakeholder demands.6 Th e latter strategy is problematic because it amplifi es regulatory uncertainty as form-based zoning eff ectively devolves into negotiated zoning. Even when established form-based standards are rigorously enforced, there is some concern that predictability may come at the cost of creativity in urban design.7 Th is critique has been raised by architects and planners alike who fear municipalities will seek out uniformity as a second-best alternative to thoughtful regulation.8 However, this critique can be overstated, as good urban design is predicated more on the consistency of functional public spaces, rather than on building style and aesthetics.
Form-based zoning is also criticized for seeking to recreate urban environments from the past, which developed in response to economic issues and technological constraints that may or may not continue to exist.9 Th is can result in the imposition of shape and bulk restrictions that do not refl ect evolving consumer preferences, fi nancial considerations or tenant demands. Consensus building activities and stakeholder participation throughout the policymaking process help ensure form-based codes refl ect community interests, but there is no reason to believe the resulting design standards will be economically viable from the perspective of the private sector. Such is
the risk of allowing social and political agendas to dictate regulatory standards, as opposed to market realities. Th is concern can be addressed by ensuring form-based codes do not seek to recreate pastiche historical settings; rather they should rely on time-tested types of urbanism, such as public streets, squares, alleys and urban parks as the armatures of space-making for contemporary civic and economic life.
By emphasizing external design features, as opposed to use restrictions, form-based zoning can clearly provide real estate developers with greater fl exibility to respond to market forces.10 Nonetheless, the magnitude of these benefi ts is mitigated by the amount of discretion a municipality is willing to grant the private sector. It is not uncommon for codes purported to be “form-based” to include use restrictions similar to those found in conventional zoning ordinances.11 Th is is problematic because it may stifl e innovation and discourage market-driven solutions throughout the development process.12 It also eff ectively eliminates any intended development incentives that are derived from a by-right entitlement process. When up-front design requirements are subject to being arbitrarily expanded upon during a lengthy negotiated zoning process, the result is comparable to taking away a carrot and hitting the developer with two sticks.
Finally, and arguably most important, there appears to be considerable disagreement in the private sector regarding the economic merits of form-based zoning. Th is is evidenced by the fact that many jurisdictions have found it necessary to impose mandatory form-based regulations, as opposed to voluntary ones allowing developers to opt into form-based restrictions in exchange for more latitude in allowable uses.13 Th ose in favor of mandatory codes argue that they provide regulatory predictability; encourage improvements to the public realm that are capitalized into rental rates; and safeguard a developer’s investment by ensuring nearby property owners conform to form-based design requirements. Th ose opposed to mandatory codes contend that developers throughout a market should voluntarily embrace shape and bulk restrictions if they do in fact increase fl exibility and property values. Additional research is needed to assess the economic merits of both of these positions.
INSIDER’S PERSPECTIVE
Form-Based Zoning from Theory to Practice
35

REAL ESTATE ISSUES Volume 39, Number 1, 2014
CONCLUSIONS
Despite the concerns, form-based zoning has extraordinary potential to align the interests of the public and private sectors when it is implemented in a thoughtful and productive way. Municipalities considering this approach should assess their willingness to provide real estate developers with meaningful by-right fl exibility, as well as their resolve to stand by adopted development standards in the face of the inevitable political pressure from neighborhood groups. Furthermore, municipalities must balance their desire for a defi ned urban character against the needs of the tenants who make neighborhoods and districts economically viable. Th is is necessary to ensure design codes do not unduly impinge on the marketability of buildings or simply price otherwise desirable tenants out of the market. Finally, municipalities must fi ght the urge to impose extensive aesthetic building
design requirements upon real estate development projects in ways that go beyond the urban design issues of how buildings interact with the surrounding public space. Th is is essential to preserve the legitimacy of this regulatory approach in the eyes of the private sector. All of these steps are anticipated to help ensure form-based codes contribute to economic development at the local level by making a jurisdiction a more attractive place for private sector real estate investmen t. ■
ACKNOWLEDGMENT
Th e authors would like to thank the Crosland Foundation for its fi nancial support of this project, as well as the Piedmont Public Policy Institute¹s advisory board for the thoughtful feedback provided throughout the preparation of the manuscript. Any errors or omissions are solely attributable to the authors.
INSIDER’S PERSPECTIVE
Form-Based Zoning from Theory to Practice
ENDNOTES
1. Sitkowski, R. J. and B.W. Ohm, “Form-Based Land Development Regulations, Th e Urban Lawyer, Vol. 38, No. 1, Winter 2006, pp. 163–172.
2. Parolek, D. G., K. Parolek and P.C. Crawford, “Form Based Codes: A Guide for Planners, Urban Designers, Municipalities, and Developers,” John Wiley & Sons, Inc., Hoboken, NJ, 2008.
3. Walters, D., Designing Community: Charrettes, master plans and form-based codes, Elsevier, Ltd., Oxford, U.K., 2007.
4. Godschalk, D. R., “Th e Devil Is in the Defi nitions,” Journal of the American Planning Association, Vol. 73, Issue 4, 2007, pp. 451–453.
5. Sitkowski, R. J., “Form and Substance: What Land Use Lawyers Need to Know About Form-Based Land Development regulations,” Zoning and Planning Law Report, Vol. 30, No. 3, 2007, pp. 1–9.
6. Talen, E., “Design by the Rules: Th e Historical Underpinnings of Form-Based Codes,” Journal of the American Planning Association, Vol. 75, Issue 2, 2009, pp. 144–160.
7. Talen, E., “Zoning For and Against Sprawl: Th e Case for Form-Based Codes,” Journal of Urban Design, Vol. 18, Issue 2, 2013, pp. 175–200.
8. Carmona, M., S. Marshall and Q. Stevens, “Design codes: their use and potential,” Progress in Planning, Vol. 65, Issue 4, 2006, pp. 209–289.
9. Inniss, L. B., “Back to the Future: Is Form-Based Code an Effi cacious Tool for Shaping Modern Civic Life?” University of Pennsylvania Journal of Law and Social Change, Vol. 11, Issue 1, 2007, pp. 75–103.
10. Kayden, J. S., “Reconsidering Zoning: Expanding an American Land-Use Frontier,”Zoning Practice, Issue 1, 2004, pp. 1–15; M. Carmona, “Design Coding and the Creative, Market and Regulatory Tyrannies of Practice,” Urban Studies, Vol. 46, No. 12, 2009, pp. 2643–2667.
11. Morphis, T. C., Jr., and W. Grimes, “An Introduction to Form-Based Zoning,” Land Use Law Quarterly, Vol. 5, No. 3, 2010, pp. 5–9.
12. Staley, S. R. and E.R Claeys, “Is the Future of Development Regulation Based in the Past? Toward a Market-Oriented, Innovation Friendly Framework,” Journal of Urban Planning and Development, Vol. 31, 2005, pp. 202–213.
13. Barry, J. M., “Form-Based Codes: Masured Success Th rough Both Mandatory and Optional Implementation,” Connecticut Law Review, Vol. 41, Issue 1, pp. 307–339.
36

REAL ESTATE ISSUES Volume 39, Number 1, 2014
FEATURE
Historic Tax Credit Transactions in the Wake of Revenue Procedure 2014-12
BY DOUG BANGHART, J.D., LL.M., AND JEFF GAULIN, J.D.
INTRODUCTION
On December 30, 2013, the Internal Revenue Service issued a widely anticipated revenue procedure related to the historic rehabilitation tax credit (HTC) allowable under Section 47 of the Internal Revenue Code of 1986, as amended (the Code). Revenue Procedure 2014-12 (as revised on January 9, 2014, the Rev Proc) is expected to break open the historic tax credit equity markets, which had been all but frozen by the 3rd U.S. Circuit Court of Appeals’ highly controversial decision in Historic Boardwalk Hall, LLC, v. Commissioner1 in May 2013 (HBH). Th is article provides an overview of the HTC and typical pre-HBH deals, discusses HBH and its eff ect on the HTC market, summarizes the Rev Proc, and concludes with some thoughts on the practical eff ect the Rev Proc is likely to have on HTC transactions in the future.
OVERVIEW OF THE HTC AND TYPICAL PRE-HBH DEAL STRUCTURE
Tax incentives (which took the form of accelerated depreciation allowances) with respect to the renovation of historic buildings were fi rst enacted by Congress in 1976 and were intended to encourage the rehabilitation of buildings that the National Park Service (NPS) determined were of important historic signifi cance.2 Th e HTC itself was passed soon thereaft er in 1978.3 Congress recognized that historic rehabilitation projects oft en are more expensive than new construction and involve signifi cantly more construction risk. Th e HTC was intended by Congress to turn an activity it deemed important (historic rehabilitation)—but was not profi table on a pretax basis—into one that was profi table on an aft er-tax basis.4 To date, approximately 39,622 historic rehabilitation projects have been certifi ed, resulting in 2.4 million jobs and more than $69 billion in investment; in 2013 alone 803 projects were certifi ed, representing almost $3.4 billion in investment.5
Doug Banghart, J.D., LL.M., a partner at Jones Day, Boston, practices in the areas of state and federal tax credit syndication, partnership taxation, and nonprofi t organizations. Banghart represents major institutional investors, developers, local governments, community development entities, and nonprofi t organizations, primarily in real estate
redevelopment projects. He has extensive experience in closing new markets tax credit leverage fund transactions, including acting as lead attorney on the largest single qualifi ed equity investment ever closed, and twinned historic and new markets tax credit transactions.
Banghart frequently speaks on issues related to partnership taxation and the legal and tax implications of various incentive programs. He served as executive editor (1999–2000) and associate editor (1998–1999) of the Capital Defense Journal. He is a member of the Massachusetts Bar Association and the Virginia Bar Association (Young Lawyers Division, Executive Council, 2003–2004).
Banghart received his bachelor of arts degree from The College of Wooster, where he was awarded the Raymond R. Day Prize in Urban Studies and the Pew Research Fellowship. He received his juris doctor degree from Washington and Lee University and his master of laws (LL.M) degree in Taxation from the University of Florida.
Jeff Gaulin, J.D., a partner at Jones Day, Boston, has extensive experience in structuring transactions involving the historic rehabilitation tax credit, the new markets tax credit and state tax credits. Gaulin represents major institutional investors, developers, community development entities, and nonprofi t organizations in projects that
utilize a combination of various tax credits and other fi nancing sources including mixed-use real estate developments, hotels, commercial real estate projects, and renewable energy facilities. He also has signifi cant experience in corporate and partnership tax law.
Gaulin frequently speaks on issues related to the new markets tax credit program, as well as various other incentive programs, and has contributed to industry publications. He received his bachelor of science and juris doctor degrees from Boston College.
About the Authors
37

REAL ESTATE ISSUES Volume 39, Number 1, 2014
FEATURE
Historic Tax Credit Transactions in the Wake of Revenue Procedure 2014-12
In general, the owner of an income producing historic building who undertakes a “substantial rehabilitation”6 of that building in accordance with the Secretary of the Interior’s Standards for Rehabilitation (NPS Standards), 36 C.F.R. 67 (2013), is entitled to the HTC. Th e HTC is a federal income tax credit (a dollar for dollar reduction of federal income tax liability) equal to 10 percent or 20 percent of “qualifi ed rehabilitation expenditures” (QREs). QREs roughly correlate to (but will not necessarily equal) the depreciable basis of the rehabilitated building less acquisition costs.7
In order to qualify for the HTC, the owner must navigate the requirements of the Code and, in the case of the 20 percent credit, the requirements of the NPS. Th e 10 percent credit is available with respect to buildings that were fi rst placed in service before 1936,8 whereas the 20 percent credit is available with respect to buildings that are either individually listed on the National Register of Historic Places or determined to contribute to the historic signifi cance of a historic district that is listed on the register.9 To obtain either designation, the owner must fi le a Part 1 application with the NPS (unless, of course, the historic building is already so designated). In the authors’ experience, most historic rehabilitations are intended to qualify for the 20 percent credit because the subsidy is obviously signifi cantly deeper than is the case with the 10 percent credit.
Th e primary distinction in the requirements for qualifying for the 10 percent versus the 20 percent credit is the need to satisfy the NPS Standards. With respect to a 10 percent credit rehabilitation, the NPS does not review the rehabilitation plans, but the Code and associated regulations require that a certain percentage of the walls and fl oor space of the rehabilitated building be retained. By contrast, the 20 percent credit requires that the owner submit detailed plans to the NPS (called a Part 2 application) so that the NPS can determine if the rehabilitation is in keeping with the historic character of the building as set forth in the NPS Standards. When the owner completes this rehabilitation, it then must submit a Part 3 application to the NPS to confi rm that the rehabilitation was undertaken as set forth in the Part 2 application.
To qualify for the HTC (either the 10 percent or 20 percent credit), the historic building must be income producing. Th is requirement would, for example, exclude a personal residence from qualifying for the HTC. In addition, and in order to prevent taxpayers from stringing
together a series of routine repairs into a tax credit project, the amount of rehabilitation costs incurred by the owner over a two-year (or fi ve-year in certain phased rehabilitations) period must exceed the greater of $5,000 or the basis of the historic building as of the start of the rehabilitation.10 Finally, the HTC is earned entirely in the taxable year during which the building is placed in service but is subject to a fi ve-year recapture period during which the building, may not (among other things) cease being a certifi ed historic structure.11 A variety of other issues can aff ect the availability and the timing of the HTC (for example the tax-exempt property rules are very complex), but those issues are beyond the scope of this article.
It will be helpful to defi ne some terms used by the Rev Proc in explaining the typical pre-HBH deal structure; the defi ned terms used hereinaft er are the same as those used in the Rev Proc. Th e Rev Proc refers to developers as Principals. Because many Principals do not have suffi cient federal income tax liability to effi ciently use the HTC on their own account, Principals and taxpayers who have federal income tax liabilities and low costs of funds (Investors) would form a partnership, with the Investor contributing capital and receiving in return the HTCs and a typically modest economic return. Th e most common deals included a negotiated one to three percent preferred return that was intended to give the Investors a minimum amount of cash distributions.
Th e Rev Proc acknowledges two diff erent partnerships related to the two diff erent HTC deal structures. Th e fi rst, a Developer Partnership, is a partnership that owns and rehabilitates the building. Th e second, a Master Tenant Partnership, is a partnership that leases the rehabilitated building from the Developer Partnership. In what is called in the tax credit world a “single tier” deal, there is no Master Tenant Partnership and the Investor invests directly in the Developer Partnership in exchange for a 99.99 percent profi ts interest in the Developer Partnership. For a number of reasons that are beyond the scope of this article, few transactions are structured as single tier deals. Instead, most transactions are structured as a so-called “lease pass-through” deal in which the Investor invests in the Master Tenant Partnership in exchange for a 99.99 percent profi t interest in the Master Tenant Partnership. Because the construction occurs at the Developer Partnership, the Master Tenant Partnership typically needs to get the proceeds of the Investor’s capital contribution to the Developer Partnership. Th is occurs in a number of ways: additional rent, as a loan, or more commonly as a
38

REAL ESTATE ISSUES Volume 39, Number 1, 2014
FEATURE
Historic Tax Credit Transactions in the Wake of Revenue Procedure 2014-12
capital contribution to the Developer Partnership. In all events, the Developer Partnership makes a special election under Section 50(d) of the Code to pass the HTC through to the Master Tenant Partnership; the Master Tenant Partnership is then treated as having incurred the QREs and therefore may allocate the HTCs to its partners.
In both the single tier and lease pass-through structures, the Investor typically received strong guarantees from the Principal and/or its affi liates of its anticipated returns, largely because those expected returns (the HTCs and the modest economics) were so limited.
As discussed above, although the HTC is earned entirely in the year in which the rehabilitated building is placed in service, Section 50 of the Code imposes a fi ve-year recapture period that commences on the date the rehabilitated building is placed in service and prohibits the Investor from transferring more than a third of its interest in the partnership. At the end of the fi ve-year HTC recapture period, the Investor would ordinarily have the right to put its interest to the Principal for a fi xed price, usually between fi ve and 15 percent of its initial equity investment. If the Investor did not exercise the put, the Principal typically had the right to call the Investor’s interest at fair market value. Because of the Investor’s modest economic return, that fair market value was generally far less than the amount of the Investor’s capital contribution, although it was usually greater than the put price. In the authors’ experience, most of the time the Investors exercised the put option for a variety of economic and non-economic reasons.
To summarize, prior to HBH, Investors would oft en invest their capital at or post completion and in some instances over the entire fi ve-year compliance period. Investors required a fi xed preferred return in addition to residual cash fl ow. Investors received a guarantee from the Principal and/or its affi liates, oft en covering nearly all aspects of the deal—completion, operations and tax credit recapture or disallowance. Investors would negotiate a put price fi xed at some percentage of their capital contribution and Principals had the right to call the Investors’ interests at fair market value.
Because of the relative certainty and stability of the foregoing, a large and effi cient market developed over the last 20 years in which Principals would typically receive competing bids from multiple Investors. Th is would appear to be an ideal situation from a public policy standpoint. Assuming that the historic building is rehabilitated in accordance with the NPS Standards and
otherwise qualifi es for the HTC, presumably someone should get the tax credit Congress enacted to incentivize that behavior, and if the government’s fi sc is to forego a dollar of revenue in the process, the closer the Investor’s investment per HTC is to a dollar, the more effi cient the tax credit.
HBH AND ITS EFFECT ON THE HTC MARKET
In HBH,12 the Th ird Circuit Court of Appeals addressed a historic rehabilitation tax credit transaction involving a project partnership (HBH Partnership), an outside investor and the New Jersey Sports and Exposition Authority (NJSEA), a state agency acting as developer.
Th e building in question was an iconic building located on the Atlantic City Boardwalk in New Jersey, known commonly as the East Hall. Th e East Hall was completed in 1929 and was most famous for hosting the Miss America Pageant. It was placed on the National Register of Historic Places in 1987.
In 1992 the NJSEA was tasked with acquiring, renovating and operating the East Hall, and in that same year it leased the East Hall from the Atlantic County Improvement Authority under a 35-year lease for one dollar per year. Construction began in 1998 with funding from the Casino Reinvestment Development Authority (the Casino Authority). Th e Casino Authority was a state agency tasked with divvying up the proceeds from the state’s casinos among development and community projects throughout New Jersey.13 By 1999, the Casino Authority had agreed to backstop any costs related to the East Hall project in excess of a contemplated bond issuance.14 Th e project was completed in October of 2001.15
Upon appeal from a judgment in favor of the taxpayer in the Tax Court, the Th ird Circuit reversed and ruled that the investor was not a partner for tax purposes and thus could not share in the historic rehabilitation tax credits. First, based on a tax credit guarantee and other protections, the court determined that the investor “had no meaningful downside risk because it was, for all intents and purposes, certain to recoup the contributions it had made to HBH Partnership and to receive the primary benefi t it sought—the [HTCs] or their cash equivalent.”16 Second, the court determined that the investor had no meaningful upside potential. Although the documents gave the investor a 99.9 percent interest in any residual cash fl ow of HBH Partnership, the court noted that even what the court viewed as unreasonably rosy projections showed that there would never be any such residual cash
39

REAL ESTATE ISSUES Volume 39, Number 1, 2014
FEATURE
Historic Tax Credit Transactions in the Wake of Revenue Procedure 2014-12
fl ow.17 In addition, the court said “[e]ven if there were an upside, however, NJSEA could exercise its Consent Option, and cut [the investor] out by paying a purchase price unrelated to any fair market value.”18 Th e court ultimately concluded that the way the HBH Partnership was constructed left the investor without a “meaningful stake in the success or failure of the enterprise.”19
While we disagree with the analysis set forth in HBH, the ruling raised several questions with respect to a typical HTC transaction. May an Investor defer its capital contribution until aft er completion and if so, by how much? Are all guarantees suspect or are only those that serve to “fi x” a return invalid? Investors oft en required developers to provide guarantees even if the guarantor was unlikely to be able to make the Investor whole. Are these guarantees treated the same as the guarantor in HBH, which had substantial assets and revenue? Is an Investor’s attempt to fi x some portion of its return problematic, or is it only problematic if the Investor’s entire return is fi xed?
One issue left eff ectively untouched by HBH was whether a taxpayer who claims a tax credit intended to encourage behavior that Congress apparently believes is unproductive on a pretax basis must expect a pretax return and negotiate a transaction consistent with same.
Th e uncertainty created by HBH, coupled with an apparent surge of HTC audit activity, caused most Investors to withdraw from the market pending the issuance of guidance from the IRS. Th is stalled projects across the country. Particularly hard hit were projects with limited economics, such as historic theatres.
SUMMARY OF THE REV PROC
In the aft ermath of HBH, the IRS appeared to grasp the issues created by the disruption to the HTC marketplace. Th e IRS, aft er consultation with industry participants, concluded that the best means of clarifying the practical implications of HBH would be through a “safe harbor,” similar to the wind ruling safe harbor.20
Th e good news about the Rev Proc is that it and subsequent statements by the IRS and the Department of the Treasury make it clear that the Investor does not need to expect to receive a pretax profi t. Th e bad news—which is in fairness a mix of good and bad—is that the Rev Proc is not exactly the “safe harbor” many in the industry wished for because it isn’t just a simple checklist of required magic words that give taxpayers a clear path to a free pass; as discussed below, some of its language
can be interpreted either as being fl exible enough to accommodate a wide variety of economic arrangements or vague enough to allow the IRS to challenge good faith attempts at compliance.
So what isn’t the Rev Proc? By its terms, the Rev Proc does not apply to any tax credit other than the HTC. Th e Rev Proc also makes it clear that it is an all-or-nothing proposition: If you comply with each and every requirement of the Rev Proc, the safe harbor applies; if you miss even one, there is no “close enough” and the Rev Proc does not apply. Finally, compliance with the Rev Proc merely takes one item off of the table for the IRS: whether the IRS will challenge the allocations of the HTCs to the Investor. Th e valid existence of the HTCs themselves and other structural issues still must be analyzed and could be subject to IRS attack notwithstanding compliance withthe Rev Proc.
So how does a taxpayer comply with the Rev Proc? Th ere are four main categories of requirements, each of which is discussed below.
REQUIREMENTS RELATED TO THE PRINCIPAL’S AND INVESTOR’S INTERESTS
Principals must have a minimum one percent interest in material partnership tax items. Th is requirement likely will not pose many structural challenges, but it seems an odd issue to focus on, given the issue in HBH was that the Investor, not the Principal, was not a partner. Presumably, if the Principal was not a partner in the Partnership, the Investor would own a fee interest in the building (in a single tier deal) or a leasehold interest in the building (in a lease pass-through deal) outright, and there would be no doubt that the Investor would be entitled to all of the HTCs.
Th ere are three requirements with respect to the Investor’s interest in the Partnership. First, the Investor must at all times maintain a minimum interest in each material tax item equal to fi ve percent of the Investor’s largest share of each such material tax item. So if the Investor has a 99 percent share in the bottom-line profi ts of the Partnership at closing, the Investor’s interest in bottom-line profi ts cannot “fl ip” below 4.95 percent thereaft er.
Th e second and third requirements applicable to the Investor’s interest represent the crux of the IRS’s theory regarding the division of partnership economics. As explained below, the gist of it appears to be that the size of the pie does not matter so long as the pie is sliced
40

REAL ESTATE ISSUES Volume 39, Number 1, 2014
FEATURE
Historic Tax Credit Transactions in the Wake of Revenue Procedure 2014-12
appropriately (the second requirement) and the parties do not play games to artifi cially minimize the size of the pie (the third requirement).
With respect to the second requirement, regarding the slicing versus size of the pie, the fi rst two sentences of 4.02(b) provide as follows:
Th e Investor’s Partnership interest must constitute a bona fi de equity investment with a reasonably anticipated value commensurate with the Investor’s overall percentage interest in the Partnership, separate from any federal, state, and local tax deductions, allowances, credits, and other tax attributes to be allocated by the Partnership to the Investor. An Investor’s Partnership interest is a bona fi de equity investment only if that reasonably anticipated value is contingent upon the Partnership’s net income, gain, and loss, and is not substantially fi xed in amount.
Th ere are two points to unravel in this paragraph. Th e fi rst, and the one that has by far caused the most consternation in the HTC markets, is what the words “reasonably anticipated value commensurate with the Investor’s overall percentage interest in the Partnership” means. Does the “reasonably anticipated value” need to tie in some way to the size of the Investor’s capital contribution? Th e clear answer from the IRS in a number of informal settings has been that the answer is “no,” and the critical issue is simply how one divides whatever are the Partnership’s economics. For instance, the examples in the Rev Proc contemplate a one percent/99 percent split (which would insure 99 percent of the HTCs end up with the Investor) followed by a 95 percent/fi ve percent fl ip in favor of the Principal (which minimizes the amount of cash going to the Investor) in year fi ve. Th at economic sharing arrangement, combined with any other special rights to cash, is the Investor’s “overall percentage interest.” Must the parties structure the transaction with these exact cash fl ow splits? No; this is the baseline, or fl oor. It appears that the parties can vary the economic arrangement between them in any way they like as long as the Investor ends up with a projected value, presumably incorporating time value of money concepts, which is equal to at least the fl oor.
Th e second point, again related to the pie slicing, deals with what constitutes a “bona fi de equity investment.” Given the last sentence’s clarifi cation that the Investor’s return must be based on partnership operations and not fi xed in amount, this is presumably intended to give the IRS a facts and circumstances argument that a transaction
that otherwise meets the requirements of the Rev Proc but nevertheless is more properly characterized as debt (which is very hard to imagine) falls outside the Rev. Proc’s safe harbor.
We will turn now to the third requirement, which as discussed above relates to the size of the pie. Th e main point is that although the size of the pie doesn’t generally matter, it is a problem if the transaction is structured to artifi cially reduce the size of the pie by stripping cash that would otherwise go to the Investor out of transaction. Any arrangements that move cash out of the Partnership must not be “unreasonable as compared to” a comparable arrangement in a transaction not involving HTCs.
Th e Rev Proc singles out subleases back to the Principal for special attention unless they are “mandated by a third party unrelated to the Principal.” Developers are a creative bunch and many who are on friendly terms with their lenders adeptly noticed a hole through which to drive their many busses with respect to this exception. Th e IRS has indicated informally that it is on to this and expects a tiny fraction of transactions will actually have such a “requirement.” We believe collusion between the Principal and the “third party” will eff ectively be assumed absent regulatory requirements clearly requiring the sublease.
REQUIREMENTS RELATED TO THE INVESTOR’S CAPITAL CONTRIBUTION
Two related concepts apply to the Investor’s capital contribution. First, the Investor must contribute at least 20 percent of its total expected capital contribution prior to the date that the building is placed in service. Th e Rev Proc also indicates that this amount (and presumably not a greater amount) must remain in the partnership for the duration of its ownership in the partnership. Interestingly, this ostensibly permits Investors to structure the capital pay-in in a way that reduces or nearly eliminates construction risk (by contributing the 20 percent required capital immediately prior to completion) and reduces operating and HTC recapture risk (by paying in the remaining capital over a longer period of time and only aft er the satisfaction of negotiated benchmarks). Th e mitigation of these risks was one of the issues raised by the court in HBH as indicative of the Investor acting as something other than a true partner.
Th e second point relates not to what the Investor must contribute, but instead to what amount the Investor must agree to contribute by when. Specifi cally, “[a]t least 75 percent of the Investor’s total expected capital
41
REAL ESTATE ISSUES Volume 39, Number 1, 2014
FEATURE
Historic Tax Credit Transactions in the Wake of Revenue Procedure 2014-12
contributions must be fi xed in amount before the date the Building is placed in service.” Th e IRS and Treasury have made it clear that “fi xed in amount” does not require that the capital contributions cannot be subject to reasonable conditions, although the Investor must reasonably expect to make its capital contributions when due.
Th e Rev Proc also makes it clear that the Investor cannot borrow the funds to make its capital contributions from any of the Developer Partnership, Master Tenant Partnership, or any of their respective Principals.
GUARANTEES IN FAVOR OF THE INVESTOR
As discussed above, prior to HBH, Investors typically required a number of guarantees from Principals and occasionally required those guarantees to be collateralized. Th e Rev Proc puts certain restrictions on this practice.
At the outset, only “unfunded” guarantees are permitted. A guarantee is funded (and therefore not “unfunded”) if cash (other than a reserve not in excess of the Partnership’s reasonably projected operating expenses for a twelve-month period) or property is set aside to fund the guarantee or if any person agrees to a minimum net worth covenant in connection with the guarantee. Note no mention is made of, for example, liquidity covenants, which are presumably permitted.
Th e Rev Proc then divides the universe of guarantees into two boxes: those related to the tax credits themselves and those related to the operations of the Partnership. Th e underlying obligations related to the former are typically called “tax credit adjusters” in the tax credit industry and govern the circumstances under which the Partnership must make a payment or distribution to the Investor with respect to HTCs that the Investor expected but did not receive. Th e scope of that liability was always a point of negotiation prior to HBH, and a broader tax credit adjuster usually accompanied a larger proposed capital contribution from the Investor. Some Investors were comfortable eff ectively limiting the scope of the adjusters merely to the acts or omissions of the Principals. Other Investors went much further and required the Principal to make a payment if the Investor did not receive the HTCs for any reason other than the acts or omissions of the Investor.
Th e Rev Proc deals with guarantees of tax credit adjusters by defi ning what they can and cannot be. A loss of HTCs
can relate to any acts necessary to claim the HTCs, as well as any acts or omissions of the Principal that would cause the Partnership not to qualify for the HTCs or that would result in a recapture of the HTCs. Examples of these acts would be failing to complete construction or failing to satisfy the NPS Standards. Th is type of guarantee is permissible.
On the other side of the spectrum, if the IRS challenges the “transactional structure” of the Partnership, then no party can guarantee the HTCs and no party can pay or indemnify the Investor for its costs related to any challenge to the HTCs (apparently even if unrelated to the transactional structure). Th e Rev Proc explicitly permits the purchase of third-party insurance, which presumably would include tax credit insurance. It is important to note that nothing in the Rev Proc prevents the Investor from receiving a cash distribution from the partnership itself for the loss of HTCs, even if caused by a challenge to the “transactional structure.”
Th e Rev Proc also contemplates more traditional guarantees, including completion guarantees, operating defi cit guarantees, environmental indemnities, and fi nancial covenants. Financial covenant guarantees presumably must not contain minimum net worth covenants, as doing so would cause the guarantee to no longer be “unfunded,” as discussed above.
In pre-HBH transactions, as noted above, Investors oft en received a guarantee of payment from the Principals with respect to a negotiated annual cash-on-cash return, typically in the one to three percent range. Th at type of guarantee is now explicitly prohibited under the Rev Proc.
PURCHASE AND SALE RIGHTS
As discussed above, in the pre-HBH world, the Investor typically had the right to put its interest in the Partnership for a fi xed price, usually a percentage of the Investor’s capital. If the Investor did not exercise that right, the Principal generally had the right to call the Investor’s interest for its fair market value.
Th e Rev Proc permits the Investor to have a put right, so long as the price with respect thereto does not exceed fair market value at the time of exercise. Th e Rev Proc explicitly forbids call rights held by the Principal, even if for fair market value (although it does not, of course, forbid a present sale).
42

REAL ESTATE ISSUES Volume 39, Number 1, 2014
FEATURE
Historic Tax Credit Transactions in the Wake of Revenue Procedure 2014-12
CONCLUSION
So what does all of this boil down to? From a practical perspective, there are six main changes from the Principal’s point of view. Of course, these are the same changes from the Investor’s point of view as well, only in reverse.
First, all Investors, at least those who intend to comply with the Rev Proc, are now going to be contributing a minimum of 20 percent of their equity prior to completion of the project. In pre-HBH transactions, many Investors made their fi rst substantive capital contribution immediately following completion.
Second, Principals and Investors will have substantial fl exibility in structuring their economic arrangements. So long as the “reasonably anticipated value” of the Investor’s interest is expected to be “commensurate with” the Investor’s “overall percentage interest,” the Principal maintains a one percent interest, and the Investor’s interest does not fall below fi ve percent of its largest interest, the parties should be able to divide economics as they choose, including the economics available aft er the put rights have expired. Whether the IRS will agree with the parties’ decisions about what “reasonably anticipated value” and “commensurate” means is, of course, anybody’s guess. But in theory, because it is how the pie is sliced, not the size of the pie (absent “unreasonable” mechanisms to reduce the size), that matters, deals with naturally thin economics, like historic theatres, should be much easier to structure.
Th ird, Principals will no longer have the comfort of fair market value call options. In pre-HBH transactions, Principals typically had the right to call the Investor’s interest for fair market value if the Investor did not exercise its put price. Th e Rev Proc makes it clear that call rights, even at fair market value, are prohibited. Th e comfort of holding a fair market value call right should logically be limited because, as an academic matter, the Principal should be indiff erent to the choice of paying the Investor the fair market value of its interest and having the Investor remain a partner. However, we anticipate this restriction may cause a signifi cant amount of concern to Principals who want to retain some level of control over the Investor’s exit.
Fourth, Principals should expect an easing on guarantee requirements. So-called “structural” tax credit guarantees
are prohibited, as are guarantees of priority returns and any guarantee that is “funded.” However, the cash fl ow of the partnership itself is still available to compensate the Investor for a loss of tax credits, even if caused by a structural issue. Th erefore, Investors can be expected to require priority cash distributions or deferrals to any fl ip in the event of an HTC loss for which the Investor is not made whole by a guarantee.
Fift h, Principals can expect substantial scrutiny to be placed on related party fees, in particular developer fees. Prior to HBH, the development budgets of most historic tax credit projects included a fee equal to 20 percent of the project’s costs. Th e Rev Proc appears to say that if even a single fee is “unreasonable” compared to fees charged in a non-HTC project, the Partnership will not qualify for the safe harbor. Th e problem this presents for HTC projects relates to trying to fi nd accurate comparables; the services provided by HTC developers are unique. How does one make accurate comparisons to the services an HTC developer provides without looking to the services other HTC developers provide?
Finally, Principals can expect substantial scrutiny related to the amount of the master lease payments. Again, the payments will be compared to those in non-HTC transactions, presumably with respect to similar asset classes and geographic locations.
As of this writing, the HTC industry is still digesting the Rev Proc and the verdict is not in as to what its long-term eff ect will be. It is clear that Principals will be unable to structure transactions in which they all but insure the Investor will not get a penny more than the Investor paid; by the same token, the Investor will not be able to button down its position so tightly that it is all but assured it will not lose any portion of its return. But Investors and Principals should be able to craft arrangements that, though not free from risk on either side, have far more economic and tax certainty on both sides than was the case immediately aft er HBH. For that reason we anticipate the guidance will bring old as well as new Investors into the HTC market. All of that is good public policy because it increases competition and raises equity pricing, which provides a greater return on investment for the government with respect to its tax expenditure. ■
43

REAL ESTATE ISSUES Volume 39, Number 1, 2014
FEATURE
Historic Tax Credit Transactions in the Wake of Revenue Procedure 2014-12
ENDNOTES 1. 694 F.3d 425 (3d Cir. 2012), cert. denied U.S., No. 12-901, May 28, 2013.
2. See Staff of the Joint Committee on Taxation, General Explanation of the Tax Reform Act of 1976, p. 643.
3. Revenue Act of 1978, Pub. L. No. 95-600, 92 Stat. 2763 (1978).
4. See, e.g., Staff of the Joint Committee on Taxation, General Explanation of the Tax Reform Act of 1986, p. 149: “Th e Congress concluded that the incentives granted to rehabilitations in 1981 remain justifi ed. Such incentives are needed because the social and aesthetic values of rehabilitating and preserving older structures are not necessarily taken into account in investors’ profi t projections. A tax incentive is needed because market forces might otherwise channel investments away from such projects because of the extra costs of undertaking rehabilitations of older or historic buildings.”
5. Federal Tax Incentives for Rehabilitating Historic Buildings, Statistical Report and Analysis for 2013, U.S. Department of the Interior.
6. Code § 47(c)(1)(C).
7. Code § 47(c)(2).
8. Code § 47(a)(1).
9. Code § 47(a)(2).
10. Code § 47(c)(1)(c).
11. Code § 50(a).
12. Historic Boardwalk Hall, LLC, v. Commissioner, 694 F.3d 425,455 (3d Cir. 2012).
13. Ibid., (court opinion) note 8.
14. Ibid., p. 443.
15. Ibid., note 16.
16. Ibid., p. 455.
17. Ibid., p. 459–60 and note 63.
18. Ibid., p. 460.
19. Ibid., p. 454.
20. Rev. Proc. 2007-65, which establishes the requirements under which the IRS will respect the allocation of Code § 45 wind energy production tax credits by partnerships in accordance with Section 704(b) of the Code.
44

REAL ESTATE ISSUES Volume 39, Number 1, 2014
FEATURE
Accuracy of Zillow’s Home Value EstimatesBY CHARLES CORCORAN, PH.D., CFA, AND FEI LIU
INTRODUCTION
Zillow is a real estate website that enjoys tremendous name recognition. Buyers use it to search for homes; sellers type in their addresses and get what they believe to be a value of their homes. But is the site accurate and should consumers rely upon it?
LITERATURE REVIEW
In recent years, home value estimates have been subject to heightened scrutiny, with a housing price bubble followed by a sharp downturn. Interested parties such as appraisers, tax assessors, buyers and sellers seek reliable data from which they can derive an unbiased estimate of value. Th e real estate industry is based on “information asymmetry,” which means that one party (typically the seller) knows more about a product than the other (the buyer). It’s an opaque market that encourages obfuscation and leads to fl awed pricing. A motivation behind the founding of Zillow.com in 2006 was to make real estate more like a stock exchange, a transparent market where all information about every property is readily available and, as a result, pricing is less imperfect.1
Zillow provides an estimate of market value for more than 100 million homes based on a proprietary formula. In general, it off ers free value estimates, or “Zestimates,” using data from appraisal districts and from multiple listing services (MLSs), depending on availability. Zillow uses a “static” formula employing tax information, and applies it uniformly across the country. Th eir stated mission is “to empower consumers with information and tools to make smart decisions about homes, real estate and mortgages.”2 Zillow is a home and real estate marketplace created to help homeowners, homebuyers, sellers, renters, real estate agents, mortgage professionals, landlords and property managers fi nd and share vital information about homes, real estate, mortgages and home improvement. Th ey assert to be “transforming the way consumers make home-related decisions and connect with professionals.”
Zillow partnered with Yahoo! in 2011 to provide the vast majority of Yahoo’s real estate listings online, cementing their place as the largest real estate network on the Web according to several online measurement agencies.3
Th e focus of this article is to determine whether Zillow’s Zestimates refl ect actual sale prices. Realtors generally have been critical of the values produced by Zillow, claiming the data are secondhand, not locally sourced and out of date. Realtors with specifi c market knowledge are more likely to know specifi c factors aff ecting the sale of a home such as the overall condition of the home, room fl ow, landscaping, views, traffi c noise and privacy. Th ese factors have been called unzillowable.4
Hagerty5 studied the accuracy of Zillow’s estimates and found that they “oft en are very good, frequently within a few percentage points of the actual price paid. But
Charles P. Corcoran, Ph.D., CFA, is a professor and chair of the Accounting and Finance Department at the University of Wisconsin/River Falls. His recent publications have appeared in Asset International’s CIO, Global Journal of Business Research, Journal of International Business and Economics, The Journal of Accounting and Finance Research, the Journal of
Instructional Pedagogy, among others. Corcoran teaches Real Estate Finance. He received his Ph.D. from the University of Minnesota.
Fei Liu is a visiting scholar at the University of Wisconsin/River Falls. Fei is pursuing a Ph.D. in Trade and Finance from Central China Agricultural University, Wuhon, China.
About the Authors
45
REAL ESTATE ISSUES Volume 39, Number 1, 2014
FEATURE
Accuracy of Zillow’s Home Value Estimates
when Zillow is bad, it can be terrible.” O’Brien6 asserts that “Zillow has Zestimated the value of 57 percent of U.S. housing stock, but only 65 percent of that could be considered ‘accurate’—by its defi nition, within 10 percent of the actual selling price. And even that accuracy isn’t equally distributed.” Th e article cites the state of Louisiana as an example, where “the site is just about worthless.” Th e National Community Reinvestment Coalition fi led a complaint with the Federal Trade Commission stating that Zillow was “intentionally misleading consumers and real-estate professionals to rely upon the accuracy of its valuation services, despite the full knowledge of the company offi cials that their valuation Automated Valuation Model (AVM) mechanism is highly inaccurate and misleading.”7
Zillow oft en overestimates home values, much as homeowners themselves do. Goodman and Ittner8 compare owners’ estimates of value with subsequent sale prices; their results indicate that homeowners overestimate value by approximately six percent. Riel and Zabel9 fi nd an 8.4 percent overestimate compared to sale prices. Th ese fi ndings suggest that Zillow estimates are not as accurate as homeowners’ estimates. Hollas, Rutherford and Th omson10 fi nd that Zillow estimates overvalue homes by 10 percent compared to the sale price. Zillow also overestimates values for approximately 80 percent of the houses in their sample by at least one percent. Th ey conclude that homeowners’ estimates of value may be more accurate than Zillow’s estimates. Th e coeffi cients on a Zillow model compared to the coeffi cients on a sale price model indicate that Zillow prices some housing characteristics diff erently than the market. Specifi cally, vacant properties are overvalued. It appears that Zillow does not track the occupancy of a property, yet vacancy is known to aff ect value. Moreover, Doshan11 asserts that Zestimates are “gamed.” Zillow uses the Zestimate “on or before the sales date.” In other words, they use the Zestimate aft er the listing price becomes public. Th at makes their Zestimate look more accurate than it really is since the Zestimate can be drastically aff ected by the listing price.
In response to homeowners’ complaints about the quality of the data Zillow extracts from public archives across the United States, in 2011 Zillow added tools that enable homeowners to edit facts and add information about their properties. Zillow also off ers listing services for homeowners and real estate agents, which enable these users to edit and add information, both manually and
through automated data feeds. Th ese tools are becoming increasingly popular. At present, nearly 20 percent of archived properties have been edited through such tools. By default, Zillow shows the facts that are supplied by the owner or agent, and these facts are supplemented by public data. Zillow also uses the user-contributed facts when computing Zestimates. Zillow’s website declares: “we’ve made it easier for our users to help us improve accuracy by incorporating edited home facts into our Zestimate calculations.”12 Zillow asserts that the improved algorithm models have improved the Zestimate median margin of error to 8.5 percent from 12.7 percent. However, Gelman and Wu13 fi nd that edited facts improve the completeness of the information that Zillow has in store, but the “accuracy of Zillow’s edited facts is not high.”
An inherent shortcoming in Zillow’s AVM formulation is its reliance on assessed valuation. If a property happens to be in a Proposition Th irteen (California) type of jurisdiction, with limited periodic assessment increases, over time its assessed valuation could be well below market value. Recent sales and reassessments of valuation impact the Zestimate. So Zestimate values can be “off ” signifi cantly for a property with no sales history, in a jurisdiction where assessed value is not signifi cantly increased until a sale occurs.
Zillow’s no-cost, no-hassle model seems to stand apart from most competitors. Redfi n14 off ers a free, no-strings-attached service but its model is rudimentary, considering only comparables in deriving value. Trulia.com and HomeValues.com require a return contact from a realtor; RealEstate.com requires registration, including disclosure of phone number and email address; RealEstateABC.com relies on Zillow’s Zestimates. FreddieMac off ers its Home Value Explorer. Th is AVM tool generates an estimate of property value quickly, relying on a proprietary algorithm that blends model estimates, a repeat sales model and a hedonic model. Th is product is licensed and serviced through a distributor network. Each distributor adds services and charges fees.15 LexisNexis provides a seemingly sophisticated AVM model incorporating price indexing, tax assessment values, and a hedonic model that utilizes comparables sold in the previous year. Th ere is a fee for this service.16
METHODOLOGY
Th e objective of this research is to compare diff erences between Zillow’s Zestimates and actual sale prices in diff erent markets and at diff erent price ranges for single-
46
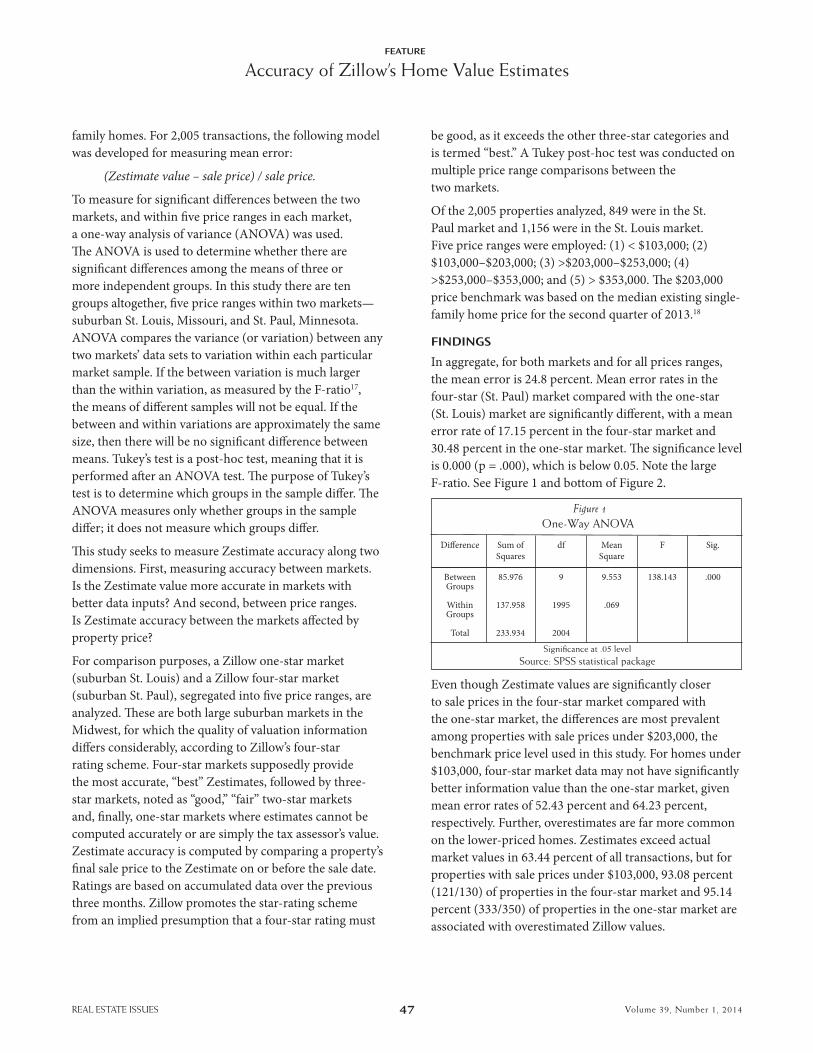
REAL ESTATE ISSUES Volume 39, Number 1, 2014
FEATURE
Accuracy of Zillow’s Home Value Estimates
family homes. For 2,005 transactions, the following model was developed for measuring mean error:
(Zestimate value – sale price) / sale price.
To measure for signifi cant diff erences between the two markets, and within fi ve price ranges in each market, a one-way analysis of variance (ANOVA) was used. Th e ANOVA is used to determine whether there are signifi cant diff erences among the means of three or more independent groups. In this study there are ten groups altogether, fi ve price ranges within two markets—suburban St. Louis, Missouri, and St. Paul, Minnesota. ANOVA compares the variance (or variation) between any two markets’ data sets to variation within each particular market sample. If the between variation is much larger than the within variation, as measured by the F-ratio17, the means of diff erent samples will not be equal. If the between and within variations are approximately the same size, then there will be no signifi cant diff erence between means. Tukey’s test is a post-hoc test, meaning that it is performed aft er an ANOVA test. Th e purpose of Tukey’s test is to determine which groups in the sample diff er. Th e ANOVA measures only whether groups in the sample diff er; it does not measure which groups diff er.
Th is study seeks to measure Zestimate accuracy along two dimensions. First, measuring accuracy between markets. Is the Zestimate value more accurate in markets with better data inputs? And second, between price ranges. Is Zestimate accuracy between the markets aff ected by property price?
For comparison purposes, a Zillow one-star market (suburban St. Louis) and a Zillow four-star market (suburban St. Paul), segregated into fi ve price ranges, are analyzed. Th ese are both large suburban markets in the Midwest, for which the quality of valuation information diff ers considerably, according to Zillow’s four-star rating scheme. Four-star markets supposedly provide the most accurate, “best” Zestimates, followed by three-star markets, noted as “good,” “fair” two-star markets and, fi nally, one-star markets where estimates cannot be computed accurately or are simply the tax assessor’s value. Zestimate accuracy is computed by comparing a property’s fi nal sale price to the Zestimate on or before the sale date. Ratings are based on accumulated data over the previous three months. Zillow promotes the star-rating scheme from an implied presumption that a four-star rating must
be good, as it exceeds the other three-star categories and is termed “best.” A Tukey post-hoc test was conducted on multiple price range comparisons between the two markets.
Of the 2,005 properties analyzed, 849 were in the St. Paul market and 1,156 were in the St. Louis market. Five price ranges were employed: (1) < $103,000; (2) $103,000–$203,000; (3) >$203,000–$253,000; (4) >$253,000–$353,000; and (5) > $353,000. Th e $203,000 price benchmark was based on the median existing single-family home price for the second quarter of 2013.18
FINDINGS
In aggregate, for both markets and for all prices ranges, the mean error is 24.8 percent. Mean error rates in the four-star (St. Paul) market compared with the one-star (St. Louis) market are signifi cantly diff erent, with a mean error rate of 17.15 percent in the four-star market and 30.48 percent in the one-star market. Th e signifi cance level is 0.000 (p = .000), which is below 0.05. Note the large F-ratio. See Figure 1 and bottom of Figure 2.
Even though Zestimate values are signifi cantly closer to sale prices in the four-star market compared with the one-star market, the diff erences are most prevalent among properties with sale prices under $203,000, the benchmark price level used in this study. For homes under $103,000, four-star market data may not have signifi cantly better information value than the one-star market, given mean error rates of 52.43 percent and 64.23 percent, respectively. Further, overestimates are far more common on the lower-priced homes. Zestimates exceed actual market values in 63.44 percent of all transactions, but for properties with sale prices under $103,000, 93.08 percent (121/130) of properties in the four-star market and 95.14 percent (333/350) of properties in the one-star market are associated with overestimated Zillow values.
Figure 1One-Way ANOVA
Diff erence Sum ofSquares
df Mean Square
F Sig.
Between Groups
Within Groups
Total
85.976
137.958
233.934
9
1995
2004
9.553
.069
138.143 .000
Signifi cance at .05 levelSource: SPSS statistical package
47

REAL ESTATE ISSUES Volume 39, Number 1, 2014
FEATURE
Accuracy of Zillow’s Home Value Estimates
For homes priced between $103,000 and $203,000, the four-star market does provide an outcome signifi cantly diff erent from the one-star market, with mean error rates of 10.77 percent and 19.68 percent, respectively.
Within higher price ranges, above $203,000, diff erences between the two markets are not signifi cant, with mean error rates ranging from 9.53 percent to 14.63 percent. See Figure 2.
CONCLUSION
Th e four-star market had a signifi cantly lower mean error rate than the one-star market, 17.15 percent versus 30.48 percent. High mean error rates are concentrated among lower-priced homes. At prices above the median home price of $203,000, diff erences between the four-star and one-star markets are not signifi cant.
While diff erences between the two markets are signifi cant for homes selling for less than $103,000, the mean error rates are so great that they are of little value in either the four-star or one-star markets. A four-star’s mean error of 52.43 percent indicates little more credibility than a one-star’s 64.23 percent. While diff erences at all price levels in both markets are usually overestimates, at this lowest price level they are almost always overestimates.
Diff erences between the two markets are also signifi cant in the $103,000–$203,000 price range. But with a mean error in the four-star market of 10.77 percent, this is close to the
10 percent error level noted by O’Brien as an acceptable threshold. So for properties in this price range, a four-star rating may be meaningful.
For the three price ranges beginning with the national median of $203,000 and above, diff erences between the four-star and one-star markets are not signifi cant. With the exception of the $203,000–$253,000 price range, this does not imply improved outcomes in the four-star market for the top two price ranges. Diff erences in both markets, while not statistically signifi cant, are quite large, with mean error rates ranging from 11.54 percent to 14.63 percent.
Within the middle price range, $203,000–$253,000, the smallest diff erences are found within both markets. In the four-star market, the mean error rate is 9.53 percent, while in the one-star market it is 12.38 percent. Th is diff erence is, again, statistically insignifi cant.
Zillow’s value as a pricing tool is questionable. With the possible exception of the $203,000–$253,000 price range, the four-star designation is of little value. Even the best results in the four-star market produce mean error rates approaching 10 percent. In both markets and for all other price levels, mean error rates are above the 10 percent level. Accuracy of 10 percent still implies an error of more than $20,000 for an average price property. While Zillow may be a useful tool, providing an ever-changing snapshot of home prices, don’t bet the ranch on it. ■
ENDNOTES1. For details about Zillow’s estimation methods and models, see http://www.zillow.com/zestimate/#what.
2. http://www.zillow.com/corp/About.htm.
3. http://websearch.about.com/od/Alternative-Search-Engines/p/ Zillow-Com-Real-Estate-Search-Made-Simple.htm.
4. http://forsalebylocals.wordpress.com/2006/08/18/unzillowable-the- perfect-term/
5. Hagerty, James R., “How Good Are Zillow’s Estimates?” Th e Wall Street Journal, Feb. 14, 2007, sec. D.
6. O’Brien, Jeff rey, “What’s Your House Really Worth?”, Fortune, Feb. 15, 2007.
Figure 2Tukey Post-Hoc Test for Multiple Comparisons
Price (x1000)
<103
103-203
<203-253
<253-353
<353
All
Diff erences between markets
(mean values)SP - SL
-.11793235*
-.08910191*
.02845627
.008355306
.02245725
Signifi cance
.001
.000
.997
1.000
1.000
SP
0.52434 (130)
0.10771 (434)
0.09531 (133)
0.11541 (99)
0.12386 (53)
0.17147 (849)
SL
0.64227 (350)
0.19682 (344)
0.12376 (138)
0.12376 (208)
0.14632 (116)
0.30475 (1,156)
*denotes signifi cance at the .05 level.SP=St. Paul, SL= St. Louis
Source: SPSS statistical package
Mean percent difference within markets, (sample size)(Zest.-sale price)/sale price
48

REAL ESTATE ISSUES Volume 39, Number 1, 2014
FEATURE
Accuracy of Zillow’s Home Value Estimates
7. http://www.housing-information.org/articles/ft c_complaint_against_ zillow_online_appraisal_site.
8. Goodman, John L., Jr., and John B. Ittner, “Th e Accuracy of Home Owners’ Estimates of House Value,” Journal of Housing Economics, Vol. 2, Issue 4, December 1992, pp. 339–357.
9. Kiel, Katherine A. and Jeff rey E. Zabel, “Th e Accuracy of Owner- Provided House Values: Th e 1978-1991 American Housing Survey,” Real Estate Economics, Vol. 27, Issue 2, 1999, pp. 263–298.
10. Hollas, Daniel, Ronald Rutherford and Th omas Th omson, Appraisal Journal, Winter 2010, Vol. 78, Issue 1, pp. 26–32.
11. Doshan, Brett, http://www.HomeVisor.com, Oct. 19, 2012.
12. http://www.zillow.com/zestimate/#update, April 4, 2014.
13. Gelman, Irit and Ningning Wu, Proceedings of the 44th Hawaii International Conference on System Sciences, p. 9, Jan. 5, 2011.
14. https://www.redfi n.com/what-is-my-home-worth?estPropertyId= 51230374&src=landing-page, April 5, 2014.
15. http://www.freddiemac.com/hve/distributors.html, April 5, 2014.
16. http://www.lexisnexis.com/legalnewsroom/lexis-hub/b/legaltoolbox/ archive/2011/09/23/automated-valuation-models-from-lexisnexis.aspx.
17. Th e F ratio is the ratio of the variance between groups to the variance within groups, i.e., the ratio of the explained variance to the unexplained variance.
18. Op. cit. at 12.
49

REAL ESTATE ISSUES Volume 39, Number 1, 2014
FEATURE
Renewables, Tax Credits and Ad Valorem Taxes: Are
Policies Aligned?
P. Barton DeLacy, CRE, FRICS, ASA, MAI, is principal at DeLacy Consulting, LLC, a Chicago-based boutique real estate advisory fi rm specializing in valuation counsel, property tax consulting and Green Energy Valuation. DeLacy’s corporate experience includes practice leadership at Arthur Andersen, Cushman & Wakefi eld and CBRE.
Focusing on the real estate implications of power generation, DeLacy has built valuation models and studied property value impacts for geo-thermal, solar, wind- and coal-fi red power generation. He has also developed adaptive re-use studies for obsolete thermal plants. Published in The Appraisal Journal, Real Estate Issues and The Journal of the American Planning Association, he has prepared testimony for federal and state circuit courts and energy siting councils. He has qualifi ed to testify as an expert witness in tax court in several states.
DeLacy holds a master’s degree in Urban Planning from Portland State University and a bachelor of arts degree from Willamette University. He previously served as adjunct professor at the Business School at Portland State University.
About the Author
50
BY P. Barton DeLacy, CRE, FRICS, ASA, MAI
INTRODUCTION
Renewable energy projects, particularly wind and solar farms, are seldom built absent a portfolio of incentives. At the federal level, these incentives include tax credits and favorable depreciation treatment. State and local governments have property taxes to play with. Long supported by public policy, power-generating projects relying on renewable fuels are oft en sold as economic development for rural communities.
Yet, while hundred-million-dollar construction projects are not unusual, few permanent jobs are ever created. Maintenance can be managed remotely. Th e power is uploaded to a regional grid, not distributed locally. Th us, expansion of the property tax base may be the only way renewable energy projects benefi t the local economy.
However, we have found no consistency across U.S. jurisdictions for property tax treatment of utility-scale renewable energy projects. For instance, what type of property is a wind turbine or an array of solar panels: real or personal? In some places personal property is exempt from property taxes. In many other places, developers have proposed so-called Payment in Lieu of Taxes (PILOT) programs. Such programs are designed to replace or defer property taxes while securing local political support for necessary entitlements to build. Some states have passed ad hoc legislation promoting some renewables, but not others. Finally, the lack of any consensus on appropriate valuation methodology, when ad valorem taxes are imposed, robs the industry of certainty and inhibits the commonwealth from enjoying the real benefi ts of green energy.
AD VALOREM PROTOCOLS FOR PURPOSE-BUILT IMPROVEMENTS
Property taxes are typically administered at the county level with the actual assessment or appraisal functions undertaken by an assessor at the township or county level. Some states also have Department of Revenue staff appraisers for complex properties. Ideally, assessed value is based on market value, derived from qualifi ed arm’s length transactions. Th is system works well for single-family

REAL ESTATE ISSUES Volume 39, Number 1, 2014
FEATURE
Renewables, Tax Credits and Ad Valorem Taxes: Are Policies Aligned?
51
houses, agricultural land and conventional commercial structures. Th e diffi culty comes with purpose-built structures like a semi-conductor fabrication plant, a hospital or a wind farm. If special purpose properties do not regularly trade, then assessors typically turn to replacement cost as the best measure of value.
While few would dispute actual construction costs for either a wind or solar power plant, this article explores what the taxable residual asset is worth aft er incentives are earned.
Th e obsolescence concepts discussed here aff ect both the wind and solar facilities; however, the case has been fi rst developed for wind.
HOW RENEWABLE ENERGY PROJECTS ARE FINANCED
In practical terms, renewable energy projects share characteristics of both real and personal property. Th e turbine tower, for example, constructed of steel sections that are bolted together, is attached permanently to a reinforced concrete foundation. Th e foundation is poured, beginning ten feet below grade. Th e turbine blades are manufactured of composite material and attached to a nacelle atop the 350-foot towers. Th e nacelle, the size of a boxcar, houses the generator and other necessary mechanical apparatus.
Similarly, photovoltaic solar panels are attached to steel racks, bolted to poles driven into the ground.
Renewable energy power plants are typically funded through project fi nancing. Th e anticipated revenue stream from sale of the power is used to pay off the debt. However, project fi nancing seldom covers total installation costs. Th e diff erence, oft en up to a third of cost, must be made up by some type of tax credit or cash incentive.
Th e following considerations drive the enterprise value of a particular renewable energy project:
• Available investment incentives (to overcome the relative high capital construction costs);
• Th e quality of the renewable resource in a particular location;
• Proximity, availability and cost to connect to the local power transmission grid;
• Revenues generated by the Power Purchase Agreement (PPA) to an off loading entity.
Other variables, such as the effi ciency of the turbine or the panels and the quantity of power generated are refl ected in Net Capacity Factors (NCF). Curtailment is the occurrence of downtime for repair or because of grid capacity constraints. Curtailment rates may vary with location and with the age, design and performance of individual turbines or solar arrays. Hence, while we might develop a formula, or model to uniformly assess power-generating facilities, the actual assessment of value must be made on a case-by-case basis, much like any other uniquely located parcel of real estate.
At issue here is the market value of the installed renewable energy power plant and what should be the appropriate ad valorem assessment given project costs, risks, potential revenue and public policy.
Wind or solar farms are appraised as whole plant enterprises combining value contributions from all asset classes including real property, personal property and intangibles. Most assessing authorities are limited to taxing only tangible assets since intangible value can be taxed in some other form as income.
THE METRICS OF RENEWABLE ENERGY
Th e metrics of renewable energy count the installed “nameplate” power capacity as the best measure of market presence. Th is capacity can be expressed in terms of multiple megawatts, a common unit of energy comparison. Hence a utility scale solar farm might be rated as “10 megawatts (MW).” A single wind turbine might be rated as “2 MW,” while a large wind farm can be rated in the hundreds of MW in capacity.
Today, as of late 2013, the U.S. has at least 60,000 MW, or 60 gigawatts (GW) of installed wind power; from Alaska and Hawaii to Maine and south to Texas.1 Of interest, there are virtually no signifi cant wind installations east of Texas and south of Tennessee. Th e wind resource is simply not very good in the humid, southeastern U.S.
Solar development is growing more rapidly, but is not yet as pervasive as wind, accounting for 4,751 GW of nameplate capacity, about eight percent of total installed wind capacity in the U.S. However, according to the Energy Information Administration (EIA) of the U.S. Department of Energy (DOE), solar technology may have better long-term upside.
For perspective, consider that the average wind turbine installed today is rated between 1.0 and 2.0 MW. Hence,

REAL ESTATE ISSUES Volume 39, Number 1, 2014
FEATURE
Renewables, Tax Credits and Ad Valorem Taxes: Are Policies Aligned?
52
there are at least 50,000 wind turbines operating at that capacity today across the U.S. Yet, at best, wind accounts for less than two percent of all electrical power produced in the U.S.
One could compare a large 250 MW wind farm (say 150-plus turbines spread over 30,000 acres) with a small 500 MW coal-fi red power plant. Th e power plant might be sited on as few as 10 acres, plus a cooling pond. While nameplate capacity suggests the coal plant could barely double the output of the wind farm, in fact, the wind farm would produce far less. Wind blows intermittently and at inconsistent velocity. If the coal-fi red plant has fuel to burn, it can generate power 24/7.
In general, a wind energy power plant (referred to as “utility-scale” and typically having suffi cient turbines to produce 10 MW or more power) will generate its nameplate capacity 30–35 percent of the time. For coal, that number is closer to 90 percent. Coal-fi red units are curtailed only periodically for servicing. Natural gas “peaker” units, much more compact and effi cient, can be brought online at the fl ick of a switch.
THE ADVANCE OF RENEWABLES: POWERED BY PRODUCTION TAX CREDITS
Th e issue of government subsidies for energy production is controversial. It can be argued all energy resource development has benefi ted from some form of subsidy. From ongoing oil depletion allowances to Depression-era dam-building projects, the federal government has helped fund the building of U.S. energy infrastructure for decades.
Yet, but for enabling state and federal policies, most renewable energy projects would not have been built. Th e steady increase in installed capacity has been propelled by two critical incentives:
1. Production Tax Credits (PTC);
2. State by State Renewables Portfolio Standards.
In 2012, the wind industry suff ered a near death experience when Congress delayed renewing the PTC program until the last minute and then only for one year. Industry advocates have long lobbied for a permanent entitlement to better sustain the renewable energy business and its domestic supply chain for components and parts. Solar tax credits expire in 2016.
Th e American Wind Energy Association (AWEA) explains that the late extension of the PTC and historic levels of installation during the fourth quarter of 2012,
led to the anemic levels of turbine installations through 2013. Without tax credits, the growth in renewable energy projects is expected to slow. Profi ts and performance will then shift to operational effi ciencies. Property taxes are the major variable operating expense confronting many of these projects. Hence, debate over appropriate taxation of these power plants is unlikely to abate any time soon.
THE CONTEXT FOR THE AD VALOREM TAXATION OF RENEWABLES
Although the fi rst utility-scale renewable energy projects date to the 1970s in Southern California, the proliferation nationwide did not commence until the present century. As with other nascent industries responding to shift ing public policies, renewable energy projects looked to incentives as much as the resource. Oft en seen as an economic boon to sparsely populated rural counties, how the power plants might be taxed evolved ad hoc.
Renewable energy development provides short-term construction jobs, sales and use taxes, but limited long-term employment. Th us local governments and school districts covet potential contributions to the property tax base.
As with rural zoning codes, renewable energy projects had not been foreseen by most taxing jurisdictions. Just as many rural planning commissions legislated variances or exceptions to allow electric power generation in farm and pastureland, so too, taxing jurisdictions had to decide if a wind turbine or solar array was some type of farm implement or an industrial power plant.
Not surprisingly, state and local ad valorem assessment practices have yet to converge on any uniform treatment. An excellent resource detailing this variance is the Database of State Incentives for Renewable Energy (DSIRE), maintained by the EIA. DSIRE inventories the 41 states and Puerto Rico, where renewable energy incentives have been put in place.
See http://www.dsireusa.org/incentives/incentive.cfm?Incentive_Code=PA26F.
INCONSISTENT AD VALOREM POLICIES
To highlight inconsistent ad valorem tax policies for renewable energy projects, we will concentrate, going forward, on “big wind,” where the fi scal impacts of property tax policy is greatest.
Across the 35 or so states where utility-scale wind farms have been installed (defi ned as over 10 MW in size), ad valorem valuation practice ranges from complete

REAL ESTATE ISSUES Volume 39, Number 1, 2014
FEATURE
Renewables, Tax Credits and Ad Valorem Taxes: Are Policies Aligned?
53
exemption to conventional depreciated replacement cost. We must remember, wind farms have two unique characteristics:
1. Th e land they occupy is oft en leased, not owned outright. Lease terms may vary and include a fi xed rate, a royalty-type percentage of output from the turbine, or a combination of the two income streams.
2. Th e wind turbine is properly characterized as a machine bolted to its reinforced concrete base, and thereby secured to the ground.
Some jurisdictions merely tax the increment in value created by the land lease where personal property is not assessed. Other jurisdictions have deferred the ad valorem issue by accepting PILOTs. Seldom has the issue been dealt with legislatively. A brief overview of some state assessment practices demonstrates this variability:
• Some states, like Wisconsin, exempt renewables from ad valorem taxation.
• In Pennsylvania, non-realty assets are not subject to property taxes. A 2006 statute classifi es towers, blades, nacelles and all transmission infrastructure as non-realty. Only the concrete base and road improvements are subject to replacement cost valuation. Leased land is valued using an income approach if comparable sales are not available.
• California, Washington and Oregon tax real and personal property and provide no special tax incentives for wind. Oregon and California, however, do incentivize distributed renewable energy, where power produced is consumed onsite rather than merely uploaded to the grid.
• Colorado exempts facilities under 2.0 MW in nameplate capacity, but otherwise applies a template that factors in nameplate rating and the NCF to calculate assessed values. Importantly, Colorado assessment rates are tied to the relative productivity of utility-scale wind farms as power generators.
• Other states, such as New York, accepted so-called PILOTs from developers in exchange for go- forward exemptions limited to a period of years. Otherwise, New York had had a 15-year exemption for property taxes on renewable energy installations. Oklahoma has a fi ve-year exemption period.
• In New York and Pennsylvania, modest income from turbine land leases off sets unrelated declines in small dairies, making small 200–300 acre landholdings marginally sustainable. Township and county assessing authorities in poor districts have been reluctant to discourage wind development by being too aggressive on taxes.
• In Missouri, the legislature has seen fi t to exempt solar farms from property taxes, but is silent on wind.
• However, at least one state, Illinois, reached a fair legislative solution. Prior to 2007, wind energy devices generating electricity for commercial sale were assessed diff erently depending on where they were located. Some counties valued the entire turbine structure (tower plus generation equipment) as “real property,” subject to taxation, while others deemed only the tower portion as taxable property. Th is diff erence varied from county to county, and sometimes from township to township. Th is created dramatically diff erent tax loads and complicated siting projects that crossed jurisdictional lines.
Hence, a legislative compromise was craft ed whereby the statutory “value “of a wind farm in Illinois is based on approximately $360,000 per MW, about one-third the installed costs. A formula is then applied to that “market value” to calculate an actual assessed value. As shall be shown, the Illinois formula may have gotten it right.
Th e contribution of industrial utility-scale wind projects to local economies is mixed. Property tax receipts in Sherman County, Oregon, a remote wind swept jurisdiction of 1,800 people in the Columbia River Gorge, have reaped tens of millions of dollars for local governments—a literal “windfall.” Yet the balance between enrichment and the perceived degradation of scenic landscapes varies with population density and the proximity of wind farm to urban area.
Notwithstanding the variable socio-economic political environment of a particular state, professional valuers should still be ready to advise local assessors on best practices for valuing this complex improvement to the land.

REAL ESTATE ISSUES Volume 39, Number 1, 2014
APPLICABILITY OF THE THREE APPROACHES TO VALUING RENEWABLE ENERGY PROJECTS
In this section, the applicability of each of the three approaches to value is discussed. In the end, most assessing authorities will likely rely on a cost approach. As with any purpose-built facility where it may be diffi cult to demonstrate a discrete property market, assessors will look at actual costs or defer to a cost service like Marshall Valuation.
A. The Income Approach
Most utility-scale renewable energy developments are project fi nanced. Th is means lenders tie debt repayment to the anticipated revenues to be generated by the PPA. Th e fi nancial model is essentially a discounted cash fl ow analysis where the revenue of the project has been predicated based on wind studies, the effi ciencies of the installed turbines and the price paid for the power to be offl oaded to the grid. Th is is an enterprise model with no relation to the real estate except for the land lease; an incidental operating cost. Assessors will value the land separately, in part because another party typically owns it in fee.
Th e PPA, which drives the value, is an intangible asset, typically ineligible for ad valorem taxation. While the PPA is modeled like a net lease, it is tied to electricity output and the price of that commodity.
B. The Sales Comparison Approach
Renewable energy projects do occasionally sell, but those transactions also have been at the enterprise level without clear allocations of value to the tangible asset classes involved. Hence, we fi nd that the Cost Approach to value is the default indicator for taxing authorities. Further, as we shall show, obsolescence theory can be used to refl ect some of the unique attributes of operating wind farms.
C. The Cost Approach
Whenever transactional market data is limited, assessing authorities typically look to a traditional Cost Approach to estimate ad valorem market value. In essence, the Cost Approach is comprised of two components; the market value of the land, as if vacant, and the depreciated replacement cost of the improvements. Th is method is also appropriate for special use properties where use value can approach market value if the case can be made for a viable enterprise within a stable or growing industry.
We fi rst start with replacement cost or actual costs if available. Replacement Cost is the estimated cost to construct as of the eff ective date of value, a substitute, using contemporary materials, standards, design and layout.2 Component costs can be volatile, so the valuer should consider construction costs as of the valuation date. Costs may actually decline as the supply chain mobilizes to serve demand.
MISSOURI WIND FARM AS CASE STUDY
To demonstrate how these theories on obsolescence might work, we cite the following example as a case study. Lost Creek Wind Farm is a 150 MW, 100-turbine renewable energy projects, built in northwestern Missouri. It has operated since mid-2010. Th e owners are appealing the county’s ad valorem assessment.
Th e DeKalb County assessor based her ad valorem assessment on reported actual construction costs. Th e taxpayer has argued that actual market value (the basis for tax assessment) is much lower because earned tax credits constitute economic obsolescence, while the inverse of the NCF constitutes functional obsolescence for this power plant.
Estimating Replacement Cost New
Actual construction costs are based on an contract engineering, procurement and construction contract where the contractor designs the installation, procures necessary components and builds the project. Th e chart below shows how replacement cost might be evaluated on a per installed turbine basis.
FEATURE
Renewables, Tax Credits and Ad Valorem Taxes: Are Policies Aligned?
54
Figure 1Replacement Cost New
1.5 MW Turbine cost Installation (per EPC contact)Soft CostsTotal installed cost/turbineInstalled cost/MW
$1,700,000$ 510,000$ 102,000$2,312,000$1,541,333
30.00%6.00%/turbine/MW
Source: P. Barton DeLacy, CRE

REAL ESTATE ISSUES Volume 39, Number 1, 2014
Th ese costs can then be applied to the entire project. We have assumed one hundred 1.50 MW turbines.
Th ese costs include labor, materials, supervision, contractor’s profi t and overhead, architect’s plans and specifi cations, sales taxes and insurance.
Th e overall cost per megawatt is a signifi cant indicator here because when compared with the costs to install alternate means of conventional thermal power, wind and solar plants have had a signifi cantly higher installed cost per megawatt of nameplate capacity. When the NCF is included, the up-front cost diff erential becomes even more dramatic.
For perspective, consider that conventional combined natural gas-fi red turbines can cost less than $1 million per MW installed (compared to more than $1.5 million per MW for a wind turbine in this example). Natural gas-powered turbines have a much higher NCF, meaning they can be effi ciently operated close to 90 percent of the time, where even the best wind farms struggle to have an NCF higher than 40 percent.
Th e EIA has published a comparison of Total System Levelized Costs that calculates overall costs on a per kilowatt-hour (kWh) basis over an expected 30-year fi nancial cycle and “duty” life of a power plant. Th is model surcharges coal for creating greenhouse gas externalities and takes into account the relative low fuel costs for wind and solar power.
Th ese costs are projected fi ve years out and will vary regionally. Th ey emphasize the relative economy of wind over time and may not account for sustained low natural gas pricing.
Th e fact remains that as of 2014, capital costs for wind development in the U.S exceed the present value of the revenue wind farms generate at an acceptable rate of return. Th us, wind development remains dependent on tax credits and/or other incentives to help overcome wind’s relative high capital costs. Th is leads to discussion on what forms of obsolescence, both functional and economic, should properly be applied in a cost approach for ad valorem assessments.
APPLICATION OF DEPRECIATION CONCEPTS
Th e key to appealing or modifying assessor cost estimates of wind farms is the careful application of accepted depreciation concepts. Application of a conventional Cost Approach contemplates application of the three types of accrued depreciation:
1. Physical deterioration
2. Economic obsolescence
3. Functional obsolescence
FEATURE
Renewables, Tax Credits and Ad Valorem Taxes: Are Policies Aligned?
55
MWMW
/turbine
Project Nameplate Rating
Total Project Cost
A Number of TurbinesB Nameplate Rating System Peak Rating (AxB)
Total installed cost/turbine Number of Turbines Total Project cost
100.001.50
150.00
$2,312,000100.00
$231,200,000Source: Barton P. DeLacy, CRE
Figure 2
* DOE EIA Projections w/o tax credits or incentives, assumes 30 yr. life
Source: P. Barton DeLacy, CRE
Levelized Cost Projections 2018*
Plant Type
Conventional CoalNatural GasNG Combined CycleNG Conv. CombustionGeothermalBiomassWindSolar PV
NCF 85.00%
87.00%30.00%92.00%83.00%34.00%25.00%
Levelized cost/kWh
$100.10
$ 67.10 $130.30 $ 89.60 $111.00 $ 86.60 $144.30
Wind 34.00% $ 86.60
Figure 3

REAL ESTATE ISSUES Volume 39, Number 1, 2014
FEATURE
Renewables, Tax Credits and Ad Valorem Taxes: Are Policies Aligned?
Assuming the absence of any incurable defect, most assessors acknowledge a traditional straight-line age-life method for simple physical depreciation. Alternatively, they rely on a cost service or other conventions.
Th e application of economic and functional obsolescence to the high replacement costs helps bring wind farm assessments into line with other means of conventional power generation. As noted above, installation costs for wind, based on the electric power it produces, are signifi cantly higher than gas-fi red alternatives.
The Case for External Obsolescence
Does the necessity of a signifi cant tax credit to make a wind farm a viable investment constitute an externality, qualifying as economic obsolescence?
External obsolescence is the adverse eff ect on value resulting from infl uences outside the property. External obsolescence may be the result of lagging rental rates, high infl ation, excessive construction costs, restricted access, the lack of an adequate labor force, changing land use patterns and market conditions, or proximity to an objectionable use or condition.
Th is means the high capital costs to develop wind power capacity can cancel out the benefi ts to investors, save for fi nancial incentives like PTCs. Th e AWEA and the DOE have shown that wind farm development falls off dramatically as these credits expire. In our cost model we show that the need for up-front capital incentives should be treated as economic obsolescence. Th e present value of such tax credits can amount to 30–35 percent of total project cost.
It can be argued that but for the PTCs, most U.S. wind projects would not get built. In fact, as AWEA predicted, wind farm development has once again stalled, as it has in the past, because of continued uncertainty over PTC incentives. Th ey were extended through 2013, but are once again in limbo.
Hence, we fi nd this necessary supplement a potential measure of inverse economic obsolescence. If the PTC goes away, many planned wind farms will stay on the drawing board pending some other form of subsidy or change in the economics of electric power generation.
An analogous situation is the treatment of Low-Income Housing Tax Credits LIHTC, a federal subsidy also referred to as Section 42 credits, referencing the applicable section in the Internal Revenue Code. Many (though not all) taxing jurisdictions exempt or deduct tax credits from ad valorem assessments.
Tax credits are provided for low income housing because the government regulates the maximum rents that can be collected based on the income level of the occupant; it also limits the number of occupants who earn above a certain income level. Th ese regulatory limitations restrict the developer’s cost recovery. But for the tax credits, subsidized housing would not be built.
Th e tax credits, created under the Tax Reform Act of 1986, were intended to incentivize private investment in aff ordable housing. Typically the all-in cost to deliver qualifying units exceeds any capitalized market value based on net income aft er allowing for restricted rents. Th e owner’s value thus falls well below costs to build. While selling tax credits to qualifying investors can make up the diff erence in construction cost, those benefi ts cannot be passed on to the next buyer. Th us, the argument goes, ad valorem property taxes should be based on an income approach. Th e amount of the tax credit subsidy would be deducted from any replacement cost estimate to reconcile with the lower net value projected by the income approach (without the subsidies).
With renewables, the long-term PPA, based on local avoided utility costs, seldom is suffi cient to generate an acceptable return on cost to the project developer. Should the valuer deduct the outright subsidies off ered by such tax credits as a type of economic obsolescence?
The Case for Functional Obsolescence
According to the Appraisal Institute, functional obsolescence can be caused by changes in market conditions that have made some aspect of a structure, material or design, obsolete by current market standards. Functional obsolescence can also be curable or incurable.
To be curable, the cost to correct the defi ciency must be equal to or less than the anticipated increase in value. We discussed the NCF as a relative measure of wind farm effi ciency. It is a particularly useful metric to compare the effi ciency of one type of power generator with another. Since the price of the power derived from wind farm operations is predicated on the cost of alternate fossil fuels, then the cost to use alternative fuels must be balanced against the relative effi ciency of its generation. Hence, the inverse of the NCF is considered a reliable method to gauge functional obsolescence, as we will calculate in our model.
As mentioned above, individual renewable energy projects can be distinguished from one another by their relative effi ciency as measured by their NCF. Essentially, an NCF
56

REAL ESTATE ISSUES Volume 39, Number 1, 2014
FEATURE
Renewables, Tax Credits and Ad Valorem Taxes: Are Policies Aligned?
calculates what percentage of the time a renewable energy project is actually generating electricity. It also refl ects the relative mechanical profi ciency of the installed power plant, regardless of its fuel.
Th e NCF of a coal-fi red power plant might be close to 90 percent because it operates 24/7. In contrast the NCF of a solar farm can be as low as 10–12 percent of its nameplate capacity because of cloud cover, night darkness, etc. Wind falls somewhere in the middle.
Hence, the NCF can be used as a measure of functional obsolescence for renewable energy projects where the NCF can vary from 10–40 percent of nameplate capacity, based on the fuel resource, coupled with the performance of the power plant. It should be noted that the NCF for wind farms using larger, more advanced turbines is approaching 50 percent. Th is suggests this measure of utility can be improved with technology.
Calculation of Values: Wind Farm Example
In the table below we have calculated a market value for ad valorem assessment purposes based on the following assumptions:
1. Replacement Cost New (RCN) based on turbine and wind farm specifi cations discussed above;
2. We have assumed that the net present value of PTCs and other incentives would account for 30 percent of total costs to install the hypothetical 100-turbine wind farm on leased land;
3. Given a leased land scenario, land value or land assessments are not included;
4. Th e RCN is fi rst adjusted for economic obsolescence: with wind farms, this is quantifi ed by tax credit incentives that can average as much as 30 percent of project costs;
5. Net RCN adjusted for tax credits then must be charged for physical depreciation; here we project four percent per year based on an expected 25-year economic life. In this example, the plant is assumed to be two years old.
6. A NCF of 35 percent would mean the plant produces its nameplate output only 35 percent of the time; thus, it is the inverse, or 65 percent impaired by the intermittency of the wind.
Th e resulting market value for assessment purposes is $52,112,480 in this example. Th at is equivalent to approximately $521,000 per turbine or $347,000 per megawatt of nameplate capacity. Th is value should be compared, on a net capacity basis, with assessed values for alternate means of generating electric power.
Based on these assumptions, not atypical for a utility-scale wind power plant of this size, we have reduced the nominal replacement cost value by more than 75 percent. Absent market sales of wind power plants to challenge theory, the appraiser must apply his/her best curbside judgment and ponder, “Is this reasonable?”
57
Project Nameplate Rating
Total Project Cost
Depreciation and Obsolescence Factors
Application of Age and Obsolescence Factors
A Number of TurbinesB Nameplate Rating System Peak Rating (AxB)
C Total installed cost/turbineD Number of TurbinesE Total Project Cost (CxD)
F AgeG Tax Credits as % of RCNH Net Capacity Factor (NCF)
J Total Replacement Cost New (RCN)K Economic-less TC incentives (GxJ)L Net RCN les econ. obs. (J+K)M Physical (straight-line/yr.)N Accrued Phys. Dep. (L+N)O RCN less Phys. Dep. (L+N)P Functional Utility (1-H)Q Adj> for Functional OBS. (OxP)R MV based on Cost Approach (O+Q)S MV/turbine (R/D) MV/MW (S/B)
100.001.50
150.00
$2,312,000100.00
$231,200,000
230.00%35.00%
$231,200,000
-$69,360,000
$161,840,000-$6,473,600
-$12,947,200$148,892,800
65.00%-$96,780,320
$52,112,480
$521,125$347,417
MWMW
/turbine
years
4.00%
Source: P. Barton DeLacy, CRE
Figure 4

REAL ESTATE ISSUES Volume 39, Number 1, 2014
PERSPECTIVE: WIND AND SOLAR FARMS AS POWER PLANTS
Renewable energy projects are fundamentally electrical power generating plants. Th eir fuel may be wind, sunlight or biomass. In the case of wind, it performs the same function that pressurized steam does in a compact gas-fi red thermal plant or falling water in a hydroelectric dam. In each case, the kinetic energy of turning rotors in a turbine spin magnets generating electricity. Th us it can be argued, for perspective, the valuer should look to relative costs or the occasional sale of a power plant in use to test the reasonableness of these adjustments.
Th e critical value drivers here are the tax credit incentive and the NCF. Both can vary with the renewable energy project. Th e tax credit provides a subsidy when the negotiated PPA does not pay enough over time to yield an adequate return to the investor. Th e PPA is typically a 20–25 year contract negotiated with the off loading utility and is based, in part, on avoided costs of electric power generated conventionally. When natural gas or coal prices are high, the PPA will be higher and wind more competitive.
At the same time, renewable energy projects of identical specifi cation will perform dramatically diff erently depending on the long-term consistency of the local wind or sunlight resource.
We have focused here on wind farms, the major consumer of tax credits to date. In some locations the NCF for wind farms approaches 50 percent. Off shore wind can raise the effi ciency further. However, when incentives are increased, wind can be built where the NCF is below 30 percent. Finally, the turbine itself can be made more effi cient by increasing its height.
Th e wind industry and public policies pursuing renewable energy solutions are still young. As the industry matures and power plants age, operating effi ciencies will demand closer attention. Volatile property taxes and unsettled ad valorem policies will create economic ineffi ciencies and potentially hinder power delivery.
Th is article has attempted to raise issues for further study and, inevitably, debate. ■
Editor’s Note: Portions of this article have been previously published in Th e M&TS Journal.
ENDNOTES1. AWEA U.S. Wind Industry Second Quarter 2013 Market Report.
2. Ibid., p. 385.
FEATURE
Renewables, Tax Credits and Ad Valorem Taxes: Are Policies Aligned?
58

REAL ESTATE ISSUES Volume 39, Number 1, 201459
RESOURCE REVIEW
The Metropolitan Revolution:How Cities and Metros are Fixing our Broken Politics and Fragile Economyby Bruce Katz and Jennifer Bradley (© 2013, Brookings Institution Press, 288 pages)
REVIEWED BY OWEN M. BEITSCH, PH.D., CRE
Reliant on shared funds, grants and direct expenditures from federal sources, the next big ideas in many parts of the country are being reduced in scale or abandoned altogether. In more aggressive settings, the ideas are being retooled as local ventures, cobbled together using the strength of community capital and vision.
For the real estate industry, oft -given federal incentives or inducements to engage in complex public-private initiatives have not infrequently been the means to support workers, address environmental or social obligations, correct technological defi ciencies, construct transportation projects, and provide other infrastructure. In the past, dollars for these activities fl owed generously from the nation’s capital, not uncommonly controlled by party loyalists. Such funds will become more diffi cult to secure, impossible in many cases, forcing both the entrepreneurial community and the entrepreneurial developer to fi nd and implement new approaches to assure their own success. Party loyalty may be a discriminator at some point but it isn’t a strategy for funding. America’s cities and its urban places, it seems, are on their own. Going forward, they must chart their own way into a brighter and more prosperous future. Anything else: wishful thinking.
For those with local government clients, the models constructed decades ago may no longer be suffi ciently robust. Certainly, that is oft en the case when local priorities may not interface well with the objectives of federal programs where bipartisan voices are much louder and angrier.
In Th e Metropolitan Revolution: How Cities and Metros are Fixing our Broken Politics and Fragile Economy, Bruce Katz and Jennifer Bradley, both of the Brookings Institution, describe the experiences of several communities. Th e pair describes projects, they believe, off er a blueprint for action which can rebuild economies and is determinedly self-reliant. Th ey speak of a revolution in thought and actions stemming from “cities and metropolitan areas [as] the engines of economic prosperity and social transformation in the United States.” If they are correct in their outlook,
Owen M. Beitsch, Ph.D., CRE, FAICP, is a senior principal with Real Estate Research Consultants, an Orlando-based fi rm affi liated with GAI that provides economic advisory services to public and private clients throughout the United States. Beitsch serves on the editorial board of Real Estate Issues and is a research associate and adjunct faculty
member at the University of Central Florida.
About the Reviewer

REAL ESTATE ISSUES Volume 39, Number 1, 201460
RESOURCE REVIEW
The Metropolitan Revolution: How Cities and Metros are Fixing our Broken Politics and Fragile Economy
they are capturing the essence of a sustainable movement because the critical and strategic solutions breed largely from locally renewable resources.
Covering a range of community-building activities, Katz and Bradley make the case that local developers and their local governments can achieve an extraordinary range of major improvements by linking with grass root activists, civic institutions, local foundations, and local banks historically bypassed in favor of federal resources. Indeed, they make the case that local creativity succumbs to inertia and economic malaise when it patiently, but unwisely, awaits competitive capitalization doled out by Congress. Today the near-term success of urbanization projects depends on local actions and political leaders. Close to the resources in their communities, they can build the partnerships to achieve results by asserting fi nancial independence.
Th e real estate industry is a natural advocate to push for these kinds of changes since many of its professionals claim to be fi scally conservative and eschew Washington’s fi nancial generosity. Further the industry is comprised of risk-takers and community builders, large and small. Key decisions respond to trends at a local level because they drive demand for the products and services of the real estate industry. Since “cities and metropolitan areas are...on the frontlines of America’s demographic change,” those who would harness those trends must be able students and stewards of the social order. In these urban settings, “every major demographic trend that the United States is experiencing—rapid growth, increasing diversity, an aging demographic—is happening at a faster pace, a greater scale and higher level of intensity.” It is oft en the local real estate entrepreneur with the creative skills and business network that can assemble the planning and implementation team willing to both rebuild and redeploy essential community assets in this evolving context.
Th e Metropolitan Revolution charts success stories in New York, Denver and Houston, among others. Th ese are both organic and inorganic places. Th ese are communities with diversity and challenges. Nonetheless, they have a wellspring of talent and skills that are making transformative investments in public-private ventures. Th ese eff orts will facilitate streams of continued investment and long-term growth. As we think about the
momentum being unleashed in these cities, we might also acknowledge that there is an “inversion of the hierarchy of power in the United States.”
Suddenly, cities and regions do matter. But haven’t they always? It is not without some historical irony—think Savannah, Charleston, New Orleans, and Philadelphia—cities and regions that literally created the economic framework on which the nation still thrives. As much as anything, Th e Metropolitan Revolution pushes us to recall that the federal system is a series of related local and regional areas that must function together as both economically independent units and functioning socially dependent units.
America’s local leaders and its development community can and should set the agenda for the direction of our civic and private spaces. Ironically, Katz and Bradley explain that many of these changes were already underway—quietly, changes were already occurring—but, less quietly now, they are accelerated by the paralysis in Washington and the disruptive technologies being experienced locally. Because entrepreneurial spirit is such a local phenomenon, it is not a surprise to realize that rebuilding our economy also means rebuilding our cities and their infrastructure, however broadly that term is defi ned. And if cities do matter, then they should matter to all real estate professionals active within them.
To be clear, the case studies comprising the backbone of Th e Metropolitan Revolution are not about steely resolve to resist federal monies. Th ey are about a resolve to resist dependence upon those monies. Th ere are important distinctions between dollars that make a good project better or that advance its timetable. Th ere are distinctions between a stimulus and maintenance. And sometimes (dare it be said), federal funds are appropriate because of their high value multiplier eff ects across regions that are the same whether your loyalties lie with Keynes or Reagan.
Likewise, states are implicit and complicit in what their regions may accomplish. Statehouse partisanship in some parts of the country is no less divisive. Consider the states capable of building or expanding their rail and health care industries based on an infusion of federal dollars, ultimately paired with local dollars tied to local ventures. Much of that money has been turned away. In several cases, these amount to opportunities squandered.
REAL ESTATE ISSUES Volume 39, Number 1, 2014
RESOURCE REVIEW
The Metropolitan Revolution: How Cities and Metros are Fixing our Broken Politics and Fragile Economy
State or federal, locals must have a role and should have a voice, if not a vote, in ranking the options. In both cases, the theme is about harnessing and leveraging capital. But, only on terms keyed to clearly articulated local objectives.
It is well that Katz and Bradley have outlined the reasons and the principles basic to jumping the nation’s local economies. Nonetheless, details do matter, and some cities will fail to recognize their own barriers or their particular advantages. Despite the branding, bunting and banners pushed as economic development in many communities, critical thinking remains at the center of the next local idea. Progress may occur only incrementally as part of a longer-term initiative. Occasionally, it may even
be necessary to curry the support of objective outsiders but not if the fi nal strategies and implementation mean surrendering local leadership.
Whatever their quick lessons overlook, the kernels in this book still shine. Set aside the old-fashioned boosterism that rings across almost every chapter, and simple, but valuable, lessons remain. With patience and care, their energy can be plowed into our communities making them more prosperous. If Richard Florida’s science has a claim, the regenerative benefi ts of the creative class are nurtured by the power of the local settings in which they take root.
Sometimes, the genie and magic lamp just ain’t enough…. ■
61

REAL ESTATE ISSUES Volume 39, Number 1, 2014
RESOURCE REVIEW
There are many interesting and important issues to discuss with respect to the residential real estate sector in America today: regional population shift s, aging demographics, changing immigration patterns, the impact of transportation costs, heightened environmental awareness, rapidly changing technologies, and generational preferences
(either cyclical or structural), just to name a few.
If someone is interested in a thoughtful, well-researched, and balanced discussion of these issues, I recommend giving a pass to Th e End of the Suburbs by Leigh Gallagher. Rather, Th e End of the Suburbs presents a fairly superfi cial treatment of the issues, where all roads lead to “the end of the suburbs”—or at least some of the suburbs, a point which will be examined later in this review. No doubt this book will be very well-received by people who already agree with the sentiment implicit in the title. But the book will do nothing to infl uence those who disagree, and only moderately inform those who are trying to form an opinion.
Th e book contains interviews with a diverse group of people in support of its central thesis: urbanites who think the suburbs are ended, former suburbanites who think the suburbs are ended, homebuilders who think the suburbs are ended, homemakers who believe the suburbs are ended, academics who believe the suburbs are ended, and activists who believe the suburbs are ended. Well, you get the idea. Homebuilder Toll Brothers, frequently both praised and quoted throughout the book, is used to represent both the suburban and the urban perspective.
Th e End of the Suburbs acknowledges that there are still many people living in the suburbs, but for whatever reason, Ms. Gallagher cannot seem to locate them—at least not those that are happy. Th ere is also very limited reference to academics or essayists who challenge the book’s thesis, although dissenting voices do make a cameo appearance starting on page 192 of the 273-page book, including one fairly bland generic reference to the prolifi c New Urbanism skeptic Joel Kotkin.
The End of the Suburbs: Where the American Dream Is Movingby Leigh Gallagher (© 2013, Penquin Group, 273 pages)
REVIEWED BY ROY J. SCHNEIDERMAN, CRE, FRICS
Roy J. Schneiderman, CRE, FRICS, principal, Bard Consulting LLC, San Francisco, has provided real estate consulting services since 1984. Prior to founding Bard Consulting in 2001, Schneiderman was a partner for Sedway Group (acquired by CBRE in 1999). He earlier worked as a real estate consultant at Deloitte, a global accounting and consulting
fi rm. Schneiderman’s areas of expertise include real estate investment analysis, quantitative analysis, asset and manager workouts, investment manager due diligence, development feasibility, real estate investment strategy formation, land-oriented investment strategies, and real estate litigation. His professional affi liations include: Fellow of the Royal Institute of Chartered Surveyors; The Counselors of Real Estate; Pension Real Estate Association; National Council of Real Estate Investment Fiduciaries; Editorial Board member of Real Estate Issues journal; Editorial Board member of The Institutional Real Estate Newsletter–North America; and NASD Dispute Resolution Board of Arbitrators. Schneiderman earned a master’s degree in business administration from Education University of California/Berkeley; a master’s degree in philosophy from Yale University in New Haven, Connecticut; and a bachelor’s degree in philosophy and religious studies from Beloit College in Beloit, Wisconsin.
About the Reviewer
62

REAL ESTATE ISSUES Volume 39, Number 1, 2014
Interestingly, the author acknowledges that 2013, the year of the book’s publication, does not mark the end of all suburbs. Indeed the last chapter of the book contains a fairly balanced discussion, wherein it is acknowledged that the future will likely contain a multitude of living options. And an earlier chapter ends with the eminently reasonable “[People] will increasingly be able to choose their own adventure, whether that’s a house in classic suburbia, an urbanized suburb like the ones preferred by the New Urbanists and a growing number of traditional developers are creating—or, as ever increasing numbers of singles, boomers and even young families are opting for, the urbanized lifestyle of settling down in a big city.”
Th us, it is both surprising and unsurprising to fi nd that the central thesis of Th e End of the Suburbs is not actually that the suburbs are ending. Ms. Gallagher frequently mentions that there are good suburbs that are walkable, have a diverse housing stock and utilize certain contemporary design characteristics. Th ese “good” suburbs are not ending. It is only “bad” suburbs that are “ending.” An entire chapter entitled “Th e Urban Burbs” is devoted to this suburban version New Urbanism, a concept which is also interspersed throughout the book.
So, on the one hand it is argued that the suburbs are ending because of issues like long commutes, high transportation costs and a lack of diversity. Th is points toward a “return to the city.” But more oft en, Ms. Gallagher’s criticism is with the design of some suburbs and great praise is heaped upon older suburbs that maintain or adopt New Urbanism principles or new suburbs designed with New Urbanism specifi cations, even though these locations oft en suff er from long commutes, high transportation costs, do not necessarily have a diverse population, etc. On balance, the book is at least as much about redesigning suburbs as it is about suburbanites returning en masse to the cities, although many of the personal testimonials in the book are of the latter nature.
Th e book also has a tendency to latch onto specifi c statistics and declare a sea change. For example, Ms. Gallagher writes “Our nation’s big cities have blossomed in the last decade. Reversing a 90-year trend, in 2011 our largest cities grew more quickly than their combined suburbs” and sources a Brookings Institute piece based upon Census Bureau data. Fair enough. But is a short break in an almost century-long trend enough to draw the conclusion that the “trend reversal” is permanent or even long-term? Certainly not according to the author of
the Brookings Institute piece, William Frey, who writes (emphasis added) “At least temporarily, this puts the brakes on a longstanding staple of American life—the pervasive suburbanization of its population….” And he continues “Th is … reversal can be attributed to a number of forces. Some are short-term and related to the post-2007 slowdown of the suburban housing market, coupled with continued high unemployment which has curtailed population mobility, now at a historic low. However, at least some cities may be seeing a population renaissance based on eff orts to attract and retain young people, families and professionals.” While Mr. Frey and the author of this review see an interesting statistic that may point in a certain direction, for certain cities, Ms. Gallaher sees a demographic sea change that needs little further examination.
And as a matter of fact, in the previous decade, Suburb handily outgrew Primary City as shown in the graphic below from the same Brookings Institute piece cited in Th e End of the Suburbs, which suggests, but by no means proves, that the 2010/2011 reversal is not the result of a long-term, inexorable shift of sentiment, but could be a short-term blip.
Although the book does occasionally address facts or thoughts pointing in confl icting directions, more oft en they are left unexamined. Th e partial tension that exists between the “back to the city” thesis and the
RESOURCE REVIEW
The End of the Suburbs: Where the American Dream Is Moving
City and Suburb Growth ShiftPercent of U.S. Primary City and Suburb population growth
from 2000-2010 (annual average) to July 2010-2011 for metro areas with populations exceeding one million
Figure 1
1.6%
1.4
1.2
1.0
0.8
0.6
0.4
0.2
0.00.4
1.4
1.1
Primary CitySuburb
Annual Avg. Growth2000-2010
Source: William H. Frey Census Bureau estimates, July 2010-2011. and U.S. Decennial Censuses, 2000 and 2010
July 2000-2010
0.9
63

REAL ESTATE ISSUES Volume 39, Number 1, 2014
RESOURCE REVIEW
The End of the Suburbs: Where the American Dream Is Moving
“New Urbanism” thesis is mentioned, but not explored in any depth.
Other representative examples include Millennials being identifi ed as wanting “lots of space for entertaining, enough room for the Wii, open kitchens to cook for themselves and their friends, outdoor fi re pits, maybe a space for their dog.” Th en one page later it is noted that there is “a rush to build what the market thinks Millennials are going to want in cities: hyper-small apartments and condos….” Th e book praises multi-generational homes constructed by Lennar without noting that most of those are being built in the suburbs— many in traditional suburbs. Libertyville, Illinois, is praised for its New Urbanism development in one chapter, and then noted for losing a corporate headquarters that
is moving to downtown Chicago in another. While these items may point in disparate directions, it is not impossible to reconcile them. However, to do so requires an acknowledgement that changing housing patterns involve a complex set of issues that defy the generally unchallenged pronouncements and isolated data-points that make up much of Th e End of the Suburbs.
By way of disclosure, although born in a city, the author of this review spent almost all of his childhood and high school years in the suburbs, and has lived in walkable, urban infi ll neighborhoods ever since. he does not, however, believe that the suburbs are ended just yet. ■
64

REAL ESTATE ISSUES Volume 39, Number 1, 2014

430 N. Mich igan Ave .Ch icago , IL 60611-4089
Te lephone : 312 .329 .8427E-ma i l : i n fo@cre .o rg
Webs i t e : www.c re .o rg
w w w. c r e . o r g