real estate brokerage - your resource for business plans! sample business plan.pdf · three year...
TRANSCRIPT

Real Estate Brokerage
Strategic Business and Marketing Plan
The information in this document is confidential and is to be only read
by authorized parties. Please refer to the confidentiality agreement for
further details. This business plan is not an offering for securities.

Real Estate Brokerage
2
Confidentiality Agreement
The undersigned reader acknowledges that the information provided in this business plan is confidential; therefore, the reader agrees not to disclose it without the express written permission of or an authorized agent of Real Estate Brokerage, Inc. It is acknowledged by the reader that information furnished in this business plan is in all respects confidential in nature, other than information which is in the public domain through other means and that any disclosure or use of same by reader, and may cause serious harm or damage to aforementioned parties. This business plan is not to be copied or reproduced by any means without the sole written consent of an authorized agent of Real Estate Brokerage, Inc. Upon request, this document is to be immediately returned. __________________________________ _______________
Signature Date
_______________________________
"ame (typed or printed)

Real Estate Brokerage
3
Table of Contents
1.0 Executive Summary ...................................................................................................... 4 1.1 The Services .............................................................................................................. 4 1.2 Financing................................................................................................................... 4 1.3 Mission Statement ..................................................................................................... 4 1.4 Management Team.................................................................................................... 4 1.5 Sales Forecasts .......................................................................................................... 5 1.6 Expansion Plan.......................................................................................................... 5
2.0 Company and Financing Summary............................................................................... 6 2.1 Registered Name and Corporate Structure................................................................ 6 2.2 Required Funds ......................................................................................................... 6 2.3 Investor Equity .......................................................................................................... 6 2.4 Management Equity .................................................................................................. 7 2.5 Exit Strategy.............................................................................................................. 7 2.6 Investor Divestiture ................................................................................................... 7
3.0 Real Estate Services ...................................................................................................... 8 3.1 Real Estate Brokerage Services................................................................................. 8 3.2 Property Management ............................................................................................... 8
4.0 Strategic and Market Analysis ...................................................................................... 9 4.1 Economic Outlook..................................................................................................... 9 4.2 Industry Analysis....................................................................................................... 9 4.3 Customer Profile ....................................................................................................... 9 4.4 Competition............................................................................................................. 10
5.0 Marketing Plan ............................................................................................................ 11 5.1 Marketing Objectives .............................................................................................. 11 5.2 Marketing Strategies ............................................................................................... 11 5.3 Pricing ..................................................................................................................... 11
6.0 Organizational Plan and Personnel Summary............................................................. 12 6.1 Corporate Organization ........................................................................................... 12 6.2 Organizational Budget............................................................................................. 12 6.3 Management Biographies........................................................................................ 13
7.0 Financial Plan.............................................................................................................. 14 7.1 Underlying Assumptions......................................................................................... 14 7.2 Sensitivity Analysis................................................................................................. 14 7.3 Source of Funds....................................................................................................... 14 7.4 General Assumptions .............................................................................................. 14 7.5 Profit and Loss Statements...................................................................................... 15 7.6 Cash Flow Analysis................................................................................................. 16 7.7 Balance Sheet .......................................................................................................... 17 7.8 Breakeven Analysis................................................................................................. 18 7.9 Business Ratios ....................................................................................................... 18
Three Year Profit and Loss Statement .............................................................................. 19 Three Year Cash Flow Analysis ....................................................................................... 19

Real Estate Brokerage
4
1.0 Executive Summary
The purpose of this business plan is to raise $100,000 for the development of a real estate brokerage while showcasing the expected financials and operations over the next three years. The Real Estate Brokerage, Inc. (“the Company”) is a New York based corporation that will provide real estate brokering and property management services to customers in its targeted market. The Company was founded in 2007 by John Doe.
1.1 The Services
The primary business of the Real Estate Brokerage is to assist homebuyers and home owners with purchasing and selling property. The Company will receive commissions of up to 7% of the transaction value for each home sold by the business. As the current market conditions of the real estate market are lackluster, Mr. Doe intends to use a number of marketing strategies to ensure that the business can generate a client list at the start of business. The Company will also provide property management services to residential and commercial property owners. The third section of the business plan will further detail the operations and services offered by the Real Estate Brokerage.
1.2 Financing
Mr. Doe is seeking to raise $100,000 from an investor. The terms, dividend payouts, and aspects of the deal are to be determined at negotiation. This business plan assumes that an investor will receive 50% of the Company’s stock, a regular stream of dividends, and a seat on the board of directors. The financing will be used for the following:
• Development of the Company’s office.
• Financing for the first six months of operation.
• Capital to purchase a company vehicle. Mr. Doe will contribute $10,000 to the venture.
1.3 Mission Statement
The Real Estate Brokerage’s mission is to become the recognized leader in its targeted market for real estate brokering and property management services.
1.4 Management Team
The Company was founded by John Doe. Mr. Doe has more than 10 years of experience in the real estate brokerage and property management industry. Through his expertise, he will be able to bring the operations of the business to profitability within its first year of operations.

Real Estate Brokerage
5
1.5 Sales Forecasts
Mr. Doe expects a strong rate of growth at the start of operations. Below are the expected financials over the next three years.
Proforma Profit and Loss (Yearly)
Year 2008 2009 2010
Sales $806,778 $968,134 $1,132,716
Operating Costs $321,317 $349,003 $378,006
EBITDA $404,783 $522,317 $641,439
Taxes, Interest, and Depreciation $157,746 $202,409 $247,675
Net Profit $247,037 $323,837 $397,692
$0
$200,000
$400,000
$600,000
$800,000
$1,000,000
$1,200,000
2008 2009 2010
Year
Sales, Operating Costs, and Profit Forecast
Sales
EBITDA
Net Profit
1.6 Expansion Plan
The Founder expects that the business will aggressively expand during the first three years of operation. As the real estate market returns to normal conditions, the Real Estate Brokerage will be an excellent position to capture a significant portion of its targeted market. In the future, the business may also develop mortgage brokering operations to assist homebuyers with financing their purchases.

Real Estate Brokerage
6
2.0 Company and Financing Summary
2.1 Registered "ame and Corporate Structure
Real Estate Brokerage, Inc. The Company is registered as a corporation in the State of New York.
2.2 Required Funds
At this time, the Real Estate Brokerage requires $100,000 of investor funds. Below is a breakdown of how these funds will be used:
Projected Startup Costs
Business Startup Year 2008
Initial Lease Payments (3 Months) $10,000
Working Capital $25,000
FF&E $23,000
Leasehold Improvements $5,000
Security Deposits $5,000
Insurance $2,500
Opening Supplies $17,000
Marketing Budget $7,500
Miscellaneous and Unforeseen Costs $5,000
Total Startup Costs $100,000
Use of Funds
10%
24%
23%5%5%
3%
17%
8% 5%
Initial Lease Payments (3 Months)
Working Capital
FF&E
Leasehold Improvements
Security Deposits
Insurance
Opening Supplies
Marketing Budget
Miscellaneous and Unforeseen
Costs
2.3 Investor Equity
John Doe intends to sell 50% of the Real Estate Brokerage in exchange for the capital.

Real Estate Brokerage
7
2.4 Management Equity
John Doe will retain 50% of the business once the capital is raised.
2.5 Exit Strategy
If the Real Estate Brokerage is very successful, Mr. Doe may seek to sell the business to a third party for a significant earnings multiple. Most likely, the Company will hire a qualified business broker to sell the business on behalf of the Real Estate Brokerage. Based on historical numbers, the business could fetch a sales premium of up to 4 times earnings.
2.6 Investor Divestiture
This will be discussed during negotiations.

Real Estate Brokerage
8
3.0 Real Estate Services
Below is a description of the real estate services offered by the Real Estate Brokerage.
3.1 Real Estate Brokerage Services
The Company’s principal service consists of selling residential real estate its targeted market, and surrounding market area.
The Real Estate Brokerage services provide clients with an international network of buyers and sellers through the multiple listing service (MLS). Because of the Company’s capabilities to network with other brokers, the brokerage will sell homes faster than our clients could if they tried to market their home without the assistance of a licensed real estate agent.
3.2 Property Management
In addition to providing real estate brokering services, the business will also manage residential and commercial properties for customers in the targeted market. This is an important part of the business as it will provide the Company with a recurring stream of revenue. This is especially important in today’s real estate market as real estate sales have slowed.

Real Estate Brokerage
9
4.0 Strategic and Market Analysis
4.1 Economic Outlook
Real estate brokerages have exploded with growth over the last ten years. As interest rates decreased, and the overall value of properties skyrocketed, the number of agents in this market has more than tripled. Currently, the economic market condition in the United States is moderate. The meltdown of the sub prime mortgage market coupled with increasing gas prices has led many people to believe that the US is on the cusp of an economic recession. This slowdown in the economy has also greatly impacted real estate sales, which has halted to historical lows. As will be discussed later, the business will generate income from managing properties, which will offset the risks associated with the real estate brokering aspect of the business.
4.2 Industry Analysis
The real estate brokerage industry is one of the United State’s biggest industries. It is estimated that there are over 221,000 establishments actively engaged in the business of acting as broker or agent for real estate transactions. Each year, these businesses aggregately generate more than $138 billion dollars of revenue and provide jobs for more than 1.1 million people. Gross average annual payrolls are now exceeding $30 billion dollars per year. The growth rate of this industry has been tremendous with gross receipts tripling over the last ten years. The extreme growth of the real estate market over the past five years has caused the number of establishments to increase significantly as the revenues generated by the industry have grown in step with increased value of real estate. This trend is expected to continue, as smaller local and regional brokerages can now compete with large national franchised and non-franchised brokerages. As stated earlier, the advent of the Internet has allowed brokers of all sizes to actively engage the business of real estate brokering by maintaining a presence on the Internet.
4.3 Customer Profile
Many people require the services of real estate agents. People that sell their homes “for sale by owner” have had tremendous difficulty with selling their homes in the last year. As such, Mr. Doe has developed an extensive demographic profile that Real Estate Brokerage will use in regards to its target market. These demographics include:
• Currently owns a property as their primary residence or rental unit
• Annual Household income of $45,000+ per year
• Home value exceeding $250,000+
Real Estate Brokerage
10
4.4 Competition
The field of real estate brokering is an extremely competitive industry. As such, Mr. Doe will use the marketing strategies discussed in the next section to assist the business in reaching a large audience within the target market. Within the targeted market, there are approximately 90 businesses that will compete directly with the Real Estate Brokerage. Major competitors in this market include:
• ERA
• ReMax
• Century 21
• Prudential

Real Estate Brokerage
11
5.0 Marketing Plan
The Real Estate Brokerage intends to maintain an extensive marketing campaign that will ensure maximum visibility for the business in its targeted market. Below is an overview of the marketing strategies and objectives of the Real Estate Brokerage.
5.1 Marketing Objectives
• Develop an online presence by acquiring accounts for major online real estate portals.
• Implement a local campaign with the Company’s targeted market via the use of flyers, local newspaper advertisements, and word of mouth.
• Establish relationships with other real estate brokers and agents within the targeted market.
5.2 Marketing Strategies
Property and home buyer marketing will be the most difficult portion of the marketing strategy. This is because one of the essential elements to reaching this audience is that the Company must build a brand affinity with the customer. This task will be accomplished through the business’s broad marketing campaign throughout its targeted market. The Real Estate Brokerage will also use an internet based strategy. This is very important as many people seeking real estate for purchase or rent use the Internet to conduct their preliminary searches. Mr. Doe will register the Real Estate Brokerage and its agents with these online portals so that potential buyers/renters can easily reach the Real Estate Brokerage. The Company will also develop its own online website. The Company will maintain a sizable amount of print and traditional advertising methods within local markets to promote the homes and properties that the Company is selling.
5.3 Pricing
For each transaction, the Company will receive 7% of the aggregate value of the sale or purchase. In co-brokering transactions, the business may receive up to 3.5% of the face value. In regards to property management, the Company will receive 10% of each month’s rent

Real Estate Brokerage
12
6.0 Organizational Plan and Personnel Summary
6.1 Corporate Organization
6.2 Organizational Budget
Personnel Plan - Yearly
Year 2008 2009 2010
Owners $80,000 $82,400 $84,872
Real Estate Agent Manager $35,000 $36,050 $37,132
Marketing Staff $32,500 $33,475 $34,479
Non-Commissioned Agents $37,500 $51,500 $66,306
Administrative Staff $44,000 $45,320 $46,680
Total $229,000 $248,745 $269,469
Numbers of Personnel
Year 2008 2009 2010
Owners 2 2 2
Real Estate Agent Manager 1 1 1
Marketing Staff 1 1 1
Non-Commissioned Agents 3 4 5
Administrative Staff 2 2 2
Totals 9 10 11
Senior Management
Operations Staff
Administrative Staff
Accounting
Sales - Marketing
Administrative
Agent Management
Listing Procurement
Commission Disbursement

Real Estate Brokerage
13
6.2 Organizational Budget (Cont.)
Personnel Expense Breakdown
36%
15%14%
16%
19%
Owners
Real Estate AgentManager
Marketing Staff
Non-CommissionedAgents
Administrative Staff
6.3 Management Biographies
Mr. John Doe is a highly experienced real estate professional with more than 10 years in the industry. Since beginning his career as a real estate agent, Mr. Doe has acquired his real estate brokerage license, and he is now ready to launch his own brokerage. John’s skill set includes:
• The ability to oversee agents and employees
• A complete understanding of accounting Licensure to operate as a real estate broker
Real Estate Brokerage
14
7.0 Financial Plan
7.1 Underlying Assumptions
The Company has based its proforma financial statements on the following:
• Real Estate Brokerage will have an annual revenue growth rate of 18% per year.
• The Owner will acquire $125,000 of investor funds to develop the business.
• Real Estate Brokerage will not seek debt financing in the first three years of operations.
7.2 Sensitivity Analysis
The Company’s revenues can change depending on the general economic climate of the real estate industry. In times of economic recession, the Real Estate Brokerage may have issues with its top line income as fewer sales will be made. However, the Real Estate Brokerage will generate income from its property management business, which will reduce the risks associated with this business.
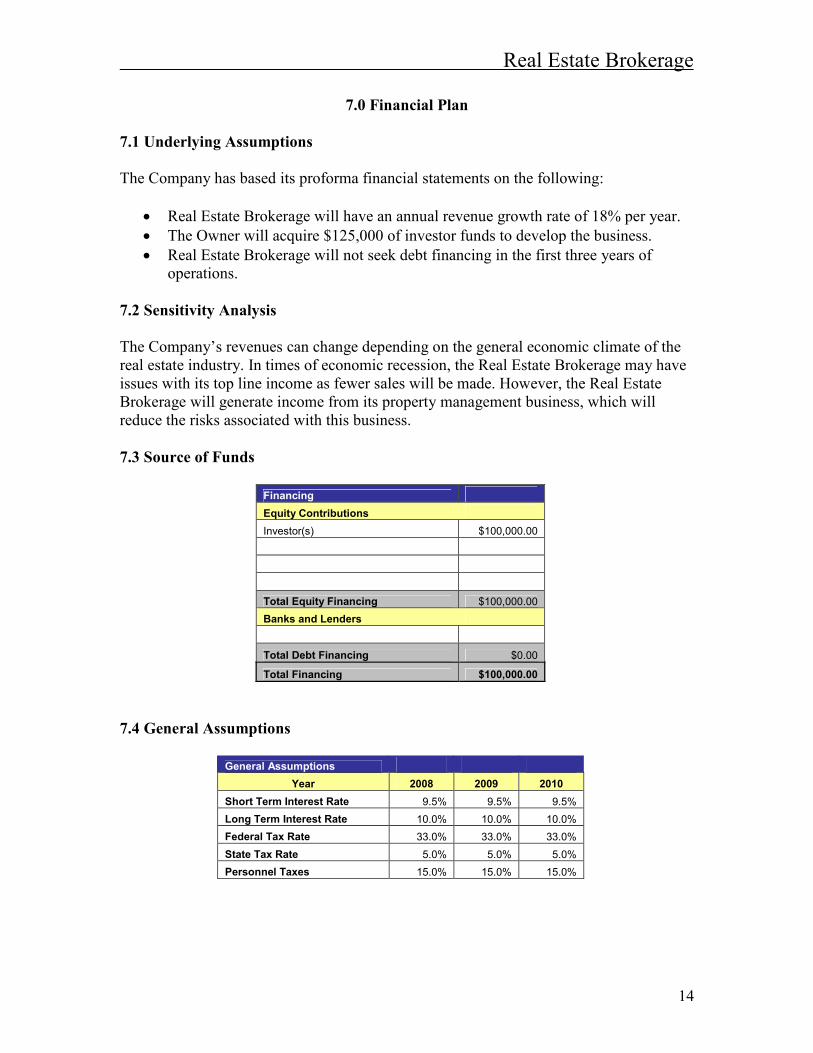
7.3 Source of Funds
Financing
Equity Contributions
Investor(s) $100,000.00
Total Equity Financing $100,000.00
Banks and Lenders
Total Debt Financing $0.00
Total Financing $100,000.00
7.4 General Assumptions
General Assumptions
Year 2008 2009 2010
Short Term Interest Rate 9.5% 9.5% 9.5%
Long Term Interest Rate 10.0% 10.0% 10.0%
Federal Tax Rate 33.0% 33.0% 33.0%
State Tax Rate 5.0% 5.0% 5.0%
Personnel Taxes 15.0% 15.0% 15.0%

Real Estate Brokerage
15
7.5 Profit and Loss Statements
Proforma Profit and Loss (Yearly)
Year 2008 2009 2010
Sales $806,778 $968,134 $1,132,716
Cost of Goods Sold $80,678 $96,813 $113,272
Gross Margin 90.00% 90.00% 90.00%
Operating Income $726,100 $871,320 $1,019,445
Expenses
Payroll $229,000 $248,745 $269,469
General and Administrative $25,200 $26,208 $27,256
Marketing Expenses $4,034 $4,841 $5,664
Professional Fees and Licensure $5,219 $5,376 $5,537
Insurance Costs $1,987 $2,086 $2,191
Travel and Vehicle Costs $7,596 $8,356 $9,191
Rent and Utilities $4,250 $4,463 $4,686
Miscellaneous Costs $9,681 $11,618 $13,593
Payroll Taxes $34,350 $37,312 $40,420
Total Operating Costs $321,317 $349,003 $378,006
EBITDA $404,783 $522,317 $641,439
Federal Income Tax $133,578 $172,365 $211,675
State Income Tax $20,239 $26,116 $32,072
Interest Expense $0 $0 $0
Depreciation Expenses $3,929 $3,929 $3,929
Net Profit $247,037 $323,837 $397,692
Profit Margin 30.62% 33.45% 35.11%
$0
$200,000
$400,000
$600,000
$800,000
$1,000,000
$1,200,000
2008 2009 2010
Year
Sales, Operating Costs, and Profit Forecast
Sales
EBITDA
Net Profit

Real Estate Brokerage
16
7.6 Cash Flow Analysis
Proforma Cash Flow Analysis - Yearly
Year 2008 2009 2010
Cash From Operations $250,965 $327,765 $401,621
Cash From Receivables $0 $0 $0
Operating Cash Inflow $250,965 $327,765 $401,621
Other Cash Inflows
Equity Investment $100,000 $0 $0
Increased Borrowings $0 $0 $0
Sales of Business Assets $0 $0 $0
A/P Increases $37,902 $43,587 $50,125
Total Other Cash Inflows $137,902 $43,587 $50,125
Total Cash Inflow $388,867 $371,353 $451,746
Cash Outflows
Repayment of Principal $0 $0 $0
A/P Decreases $24,897 $29,876 $35,852
A/R Increases $0 $0 $0
Asset Purchases $56,854 $81,941 $100,405
Dividends $175,676 $229,436 $281,135
Total Cash Outflows $257,427 $341,253 $417,391
Net Cash Flow $131,441 $30,099 $34,355
Cash Balance $131,441 $161,540 $195,895
$0
$100,000
$200,000
$300,000
$400,000
$500,000
2008 2009 2010
Year
Proforma Cash Flow (Yearly)
Total Cash Inflow
Total Cash Outflows
Cash Balance

Real Estate Brokerage
17
7.7 Balance Sheet
Proforma Balance Sheet - Yearly
Year 2008 2009 2010
Assets
Cash $131,441 $161,540 $195,895
Amortized Expansion Costs $15,000 $23,194 $33,235
Inventory $25,000 $86,456 $161,760
FF&E $15,000 $27,291 $42,352
$0 $0
Miscellaneous Assets $13,000 $14,950 $17,193
Accumulated Depreciation ($3,929) ($7,857) ($11,786)
Total Assets $195,512 $305,574 $438,648
Liabilities and Equity
Accounts Payable $13,005 $26,716 $40,990
Long Term Liabilities $0 $0 $0
Other Liabilities $8,200 $8,528 $8,869
Total Liabilities $21,205 $35,244 $49,859
Net Worth $174,307 $270,330 $388,789
Total Liabilities and Equity $195,512 $305,574 $438,648
$0
$50,000
$100,000
$150,000
$200,000
$250,000
$300,000
$350,000
$400,000
$450,000
2008 2009 2010
Year
Proforma Balance Sheet
Total Assets
Total Liabilities
Net Worth

Real Estate Brokerage
18
7.8 Breakeven Analysis
Monthly Break Even Analysis
Year 2008 2009 2010
Monthly Revenue $29,752 $32,315 $35,001
Yearly Revenue $357,019 $387,781 $420,006
$0
$100,000
$200,000
$300,000
$400,000
$500,000
2008 2009 2010
Year
Break Even Analysis
Monthly Revenue
Yearly Revenue
7.9 Business Ratios
Business Ratios - Yearly
Year 2008 2009 2010
Sales
Sales Growth 0.0% 20.0% 17.0%
Gross Margin 90.0% 90.0% 90.0%
Financials
Profit Margin 30.62% 33.45% 35.11%
Assets to Liabilities 9.22 8.67 8.80
Equity to Liabilities 8.22 7.67 7.80
Assets to Equity 1.12 1.13 1.13
Liquidity
Acid Test 6.20 4.58 3.93
Cash to Assets 0.67 0.53 0.45

Real Estate Brokerage
19
Three Year Profit and Loss Statement
Profit and Loss Statement (First Year)
Months 1 2 3 4 5 6 7
Sales $66,500 $66,633 $66,766 $66,899 $67,032 $67,165 $67,298
Cost of Goods Sold $6,650 $6,663 $6,677 $6,690 $6,703 $6,717 $6,730
Gross Margin 90.0% 90.0% 90.0% 90.0% 90.0% 90.0% 90.0%
Operating Income $59,850 $59,970 $60,089 $60,209 $60,329 $60,449 $60,568
Expenses
Payroll $19,083 $19,083 $19,083 $19,083 $19,083 $19,083 $19,083
General and Administrative $2,100 $2,100 $2,100 $2,100 $2,100 $2,100 $2,100
Marketing Expenses $336 $336 $336 $336 $336 $336 $336
Professional Fees and Licensure $435 $435 $435 $435 $435 $435 $435
Insurance Costs $166 $166 $166 $166 $166 $166 $166
Travel and Vehicle Costs $633 $633 $633 $633 $633 $633 $633
Rent and Utilities $354 $354 $354 $354 $354 $354 $354
Miscellaneous Costs $807 $807 $807 $807 $807 $807 $807
Payroll Taxes $2,863 $2,863 $2,863 $2,863 $2,863 $2,863 $2,863
Total Operating Costs $26,776 $26,776 $26,776 $26,776 $26,776 $26,776 $26,776
EBITDA $33,074 $33,193 $33,313 $33,433 $33,552 $33,672 $33,792
Federal Income Tax $11,010 $11,032 $11,054 $11,076 $11,099 $11,121 $11,143
State Income Tax $1,668 $1,672 $1,675 $1,678 $1,682 $1,685 $1,688
Interest Expense $0 $0 $0 $0 $0 $0 $0
Depreciation Expense $327 $327 $327 $327 $327 $327 $327
Net Profit $20,068 $20,162 $20,256 $20,351 $20,445 $20,539 $20,634

Real Estate Brokerage
20
Profit and Loss Statement (First Year Cont.)
Month 8 9 10 11 12 2008
Sales $67,431 $67,564 $67,697 $67,830 $67,963 $806,778
Cost of Goods Sold $6,743 $6,756 $6,770 $6,783 $6,796 $80,678
Gross Margin 90.0% 90.0% 90.0% 90.0% 90.0% 90.0%
Operating Income $60,688 $60,808 $60,927 $61,047 $61,167 $726,100
Expenses
Payroll $19,083 $19,083 $19,083 $19,083 $19,083 $229,000
General and Administrative $2,100 $2,100 $2,100 $2,100 $2,100 $25,200
Marketing Expenses $336 $336 $336 $336 $336 $4,034
Professional Fees and Licensure $435 $435 $435 $435 $435 $5,219
Insurance Costs $166 $166 $166 $166 $166 $1,987
Travel and Vehicle Costs $633 $633 $633 $633 $633 $7,596
Rent and Utilities $354 $354 $354 $354 $354 $4,250
Miscellaneous Costs $807 $807 $807 $807 $807 $9,681
Payroll Taxes $2,863 $2,863 $2,863 $2,863 $2,863 $34,350
Total Operating Costs $26,776 $26,776 $26,776 $26,776 $26,776 $321,317
EBITDA $33,911 $34,031 $34,151 $34,271 $34,390 $404,783
Federal Income Tax $11,165 $11,187 $11,209 $11,231 $11,253 $133,578
State Income Tax $1,692 $1,695 $1,698 $1,702 $1,705 $20,239
Interest Expense $0 $0 $0 $0 $0 $0
Depreciation Expense $327 $327 $327 $327 $327 $3,929
Net Profit $20,728 $20,822 $20,917 $21,011 $21,105 $247,037

Real Estate Brokerage
21
Profit and Loss Statement (Second Year)
2009
Quarter Q1 Q2 Q3 Q4 2009
Sales $193,627 $242,033 $261,396 $271,077 $968,134
Cost of Goods Sold $19,363 $24,203 $26,140 $27,108 $96,813
Gross Margin 90.0% 90.0% 90.0% 90.0% 90.0%
Operating Income $174,264 $217,830 $235,256 $243,970 $871,320
Expenses
Payroll $49,749 $62,186 $67,161 $69,649 $248,745
General and Administrative $5,242 $6,552 $7,076 $7,338 $26,208
Marketing Expenses $968 $1,210 $1,307 $1,355 $4,841
Professional Fees and Licensure $1,075 $1,344 $1,451 $1,505 $5,376
Insurance Costs $417 $522 $563 $584 $2,086
Travel and Vehicle Costs $1,671 $2,089 $2,256 $2,340 $8,356
Rent and Utilities $893 $1,116 $1,205 $1,250 $4,463
Miscellaneous Costs $2,324 $2,904 $3,137 $3,253 $11,618
Payroll Taxes $7,462 $9,328 $10,074 $10,447 $37,312
Total Operating Costs $69,801 $87,251 $94,231 $97,721 $349,003
EBITDA $104,463 $130,579 $141,026 $146,249 $522,317
Federal Income Tax $34,473 $43,091 $46,538 $48,262 $172,365
State Income Tax $5,223 $6,529 $7,051 $7,312 $26,116
Interest Expense $0 $0 $0 $0 $0
Depreciation Expense $982 $982 $982 $982 $3,929
Net Profit $63,785 $79,977 $86,454 $89,692 $319,908

Real Estate Brokerage
22
Profit and Loss Statement (Third Year)
2010
Quarter Q1 Q2 Q3 Q4 2010
Sales $226,543 $283,179 $305,833 $317,161 $1,132,716
Cost of Goods Sold $22,654 $28,318 $30,583 $31,716 $113,272
Gross Margin 0.0% 0.0% 0.0% 0.0% 0.0%
Operating Income $203,889 $254,861 $275,250 $285,445 $1,019,445
Expenses
Payroll $53,894 $67,367 $72,757 $75,451 $269,469
General and Administrative $5,451 $6,814 $7,359 $7,632 $27,256
Marketing Expenses $1,133 $1,416 $1,529 $1,586 $5,664
Professional Fees and Licensure $1,107 $1,384 $1,495 $1,550 $5,537
Insurance Costs $438 $548 $591 $613 $2,191
Travel and Vehicle Costs $1,838 $2,298 $2,482 $2,574 $9,191
Rent and Utilities $937 $1,171 $1,265 $1,312 $4,686
Miscellaneous Costs $2,719 $3,398 $3,670 $3,806 $13,593
Payroll Taxes $8,084 $10,105 $10,913 $11,318 $40,420
Total Operating Costs $75,601 $94,501 $102,062 $105,842 $378,006
EBITDA $128,288 $160,360 $173,189 $179,603 $641,439
Federal Income Tax $42,335 $52,919 $57,152 $59,269 $211,675
State Income Tax $6,414 $8,018 $8,659 $8,980 $32,072
Interest Expense $0 $0 $0 $0 $0
Depreciation Expense $982 $982 $982 $982 $3,929
Net Profit $78,556 $98,441 $106,395 $110,372 $393,764

Real Estate Brokerage
23
Three Year Cash Flow Analysis
Cash Flow Analysis (First Year)
Month 1 2 3 4 5 6 7 8
Cash From Operations $20,068 $20,162 $20,256 $20,351 $20,445 $20,539 $20,634 $20,728
Cash From Receivables $0 $0 $0 $0 $0 $0 $0 $0
Operating Cash Inflow $20,068 $20,162 $20,256 $20,351 $20,445 $20,539 $20,634 $20,728
Other Cash Inflows
Equity Investment $100,000 $0 $0 $0 $0 $0 $0 $0
Increased Borrowings $0 $0 $0 $0 $0 $0 $0 $0
Sales of Business Assets $0 $0 $0 $0 $0 $0 $0 $0
A/P Increases $3,159 $3,159 $3,159 $3,159 $3,159 $3,159 $3,159 $3,159
Total Other Cash Inflows $103,159 $3,159 $3,159 $3,159 $3,159 $3,159 $3,159 $3,159
Total Cash Inflow $123,226 $23,320 $23,415 $23,509 $23,603 $23,698 $23,792 $23,886
Cash Outflows
Repayment of Principal $0 $0 $0 $0 $0 $0 $0 $0
A/P Decreases $2,075 $2,075 $2,075 $2,075 $2,075 $2,075 $2,075 $2,075
A/R Increases $0 $0 $0 $0 $0 $0 $0 $0
Asset Purchases $56,854 $0 $0 $0 $0 $0 $0 $0
Dividends $0 $0 $0 $0 $0 $0 $0 $0
Total Cash Outflows $58,929 $2,075 $2,075 $2,075 $2,075 $2,075 $2,075 $2,075
Net Cash Flow $64,297 $21,246 $21,340 $21,434 $21,529 $21,623 $21,717 $21,812
Cash Balance $64,297 $85,543 $106,883 $128,317 $149,846 $171,469 $193,186 $214,998

Real Estate Brokerage
24
Cash Flow Analysis (First Year Cont.)
Month 9 10 11 12 2008
Cash From Operations $20,822 $20,917 $21,011 $21,105 $247,037
Cash From Receivables $0 $0 $0 $0 $0
Operating Cash Inflow $20,822 $20,917 $21,011 $21,105 $247,037
Other Cash Inflows
Equity Investment $0 $0 $0 $0 $100,000
Increased Borrowings $0 $0 $0 $0 $0
Sales of Business Assets $0 $0 $0 $0 $0
A/P Increases $3,159 $3,159 $3,159 $3,159 $37,902
Total Other Cash Inflows $3,159 $3,159 $3,159 $3,159 $137,902
Total Cash Inflow $23,981 $24,075 $24,169 $24,264 $384,939
Cash Outflows
Repayment of Principal $0 $0 $0 $0 $0
A/P Decreases $2,075 $2,075 $2,075 $2,075 $24,897
A/R Increases $0 $0 $0 $0 $0
Asset Purchases $0 $0 $0 $0 $56,854
Dividends $0 $0 $0 $175,676 $175,676
Total Cash Outflows $2,075 $2,075 $2,075 $177,751 $257,427
Net Cash Flow $21,906 $22,000 $22,095 -$153,487 $127,512
Cash Balance $236,904 $258,904 $280,999 $127,512 $127,512

Real Estate Brokerage
25
Cash Flow Analysis (Second Year)
2009
Quarter Q1 Q2 Q3 Q4 2009
Cash From Operations $65,553 $81,941 $88,497 $91,774 $327,765
Cash From Receivables $0 $0 $0 $0 $0
Operating Cash Inflow $65,553 $81,941 $88,497 $91,774 $327,765
Other Cash Inflows
Equity Investment $0 $0 $0 $0 $0
Increased Borrowings $0 $0 $0 $0 $0
Sales of Business Assets $0 $0 $0 $0 $0
A/P Increases $8,717 $10,897 $11,769 $12,204 $43,587
Total Other Cash Inflows $8,717 $10,897 $11,769 $12,204 $43,587
Total Cash Inflow $74,271 $92,838 $100,265 $103,979 $371,353
Cash Outflows
Repayment of Principal $0 $0 $0 $0 $0
A/P Decreases $5,975 $7,469 $8,067 $8,365 $29,876
A/R Increases $0 $0 $0 $0 $0
Asset Purchases $16,388 $20,485 $22,124 $22,944 $81,941
Dividends $45,887 $57,359 $61,948 $64,242 $229,436
Total Cash Outflows $68,251 $85,313 $92,138 $95,551 $341,253
Net Cash Flow $6,020 $7,525 $8,127 $8,428 $30,099
Cash Balance $133,532 $141,057 $149,183 $157,611 $157,611

Real Estate Brokerage
26
Cash Flow Analysis (Third Year)
2010
Quarter Q1 Q2 Q3 Q4 2010
Cash From Operations $80,324 $100,405 $108,438 $112,454 $401,621
Cash From Receivables $0 $0 $0 $0 $0
Operating Cash Inflow $80,324 $100,405 $108,438 $112,454 $401,621
Other Cash Inflows
Equity Investment $0 $0 $0 $0 $0
Increased Borrowings $0 $0 $0 $0 $0
Sales of Business Assets $0 $0 $0 $0 $0
A/P Increases $10,025 $12,531 $13,534 $14,035 $50,125
Total Other Cash Inflows $10,025 $12,531 $13,534 $14,035 $50,125
Total Cash Inflow $90,349 $112,937 $121,971 $126,489 $451,746
Cash Outflows
Repayment of Principal $0 $0 $0 $0 $0
A/P Decreases $7,170 $8,963 $9,680 $10,038 $35,852
A/R Increases $0 $0 $0 $0 $0
Asset Purchases $20,081 $25,101 $27,109 $28,113 $100,405
Dividends $56,227 $70,284 $75,906 $78,718 $281,135
Total Cash Outflows $83,478 $104,348 $112,696 $116,870 $417,391
Net Cash Flow $6,871 $8,589 $9,276 $9,619 $34,355
Cash Balance $164,482 $173,071 $182,347 $191,966 $191,966