real estate assessments office finance department prince …s3.amazonaws.com/zanran_storage/ ·...
TRANSCRIPT

REAL ESTATE ASSESSMENTS OFFICE
FINANCE DEPARTMENT
PRINCE WILLIAM COUNTY, VIRGINIA


Finance Department Real Estate Assessments Office
Prince William County, Virginia
Board of County Supervisors
Corey A. Stewart Chairman At-Large Michael C. May Occoquan District Martin E. Nohe Coles District Wally E. Covington Brentsville District
Maureen S. Caddigan Dumfries District John D. Jenkins Neabsco District John T. Stirrup, Jr. Vice Chairman Gainesville District Frank J. Principi Woodbridge District
ACTING COUNTY EXECUTIVE
Susan Roltsch

This page intentionally left blank

Estate Assessments Office 2009 Annual Report
Real Estate Assessments Office Organizational Chart as of July 1, 2009
Director of FinanceChristopher E. Martino, CPA
Assistant Director of FinanceSteve Ferlotti
Real Estate Assessments Division ChiefAllison Lindner
Appraiser IISupervisorKen Baxter
Appraiser IISupervisor
John E. Malone, RES
Appraiser IISupervisor
Pam Stepanick
Appraiser IISupervisor
Charlie Tolbert
Title ResearcherTheresa Harris
Appraiser IMichelle Turner
Appraiser ILaura Fallon
Appraiser ICynthia Pitts
Appraiser TraineeDave Cottingham
Appraiser I (part-time)Bridget Affeldt
Appraiser IMick Majdi
Appraiser ILaPointe Crismond
Appraiser IJessika Kontur
Appraiser ILeslie Stover
Appraiser IJohn Oakes
Appraiser IMaryleen Dudley
Appraiser IDerek Bauckman
Appraiser TraineeLaura Reuter
Appraiser TraineeJohn Duffy
Title ResearcherBarbara Hill
Title ResearcherClaire Lapham
Accounting Assistant IBrenda Wilson
Management & Fiscal Analyst IIIVictor Molina
Appraiser IICommercial Supervisor
Isabel Salumbides-Calangi
Assessments CoordinatorKerem Oner, CAE
Accounting Assistant IDebra Vedder
Appraiser I (part-time)Simar Singh
Appraiser ISherman Lambert
Appraiser TraineeJonathan Dakon
Financial Systems Analyst I(OIT)
Valerie Fawcett
Administrative Support Assistant III
Diane Honeycutt
GIS AnalystDebra Watson-Grady
Accounting Assistant IJennifer Fey
Appraiser IJeffrey Chaparro
Director of FinanceChristopher E. Martino, CPA
Assistant Director of FinanceSteve Ferlotti
Real Estate Assessments Division ChiefAllison Lindner
Appraiser IISupervisorKen Baxter
Appraiser IISupervisor
John E. Malone, RES
Appraiser IISupervisor
Pam Stepanick
Appraiser IISupervisor
Charlie Tolbert
Title ResearcherTheresa Harris
Appraiser IMichelle Turner
Appraiser ILaura Fallon
Appraiser ICynthia Pitts
Appraiser TraineeDave Cottingham
Appraiser I (part-time)Bridget Affeldt
Appraiser IMick Majdi
Appraiser ILaPointe Crismond
Appraiser IJessika Kontur
Appraiser ILeslie Stover
Appraiser IJohn Oakes
Appraiser IMaryleen Dudley
Appraiser IDerek Bauckman
Appraiser TraineeLaura Reuter
Appraiser TraineeJohn Duffy
Title ResearcherBarbara Hill
Title ResearcherClaire Lapham
Accounting Assistant IBrenda Wilson
Management & Fiscal Analyst IIIVictor Molina
Appraiser IICommercial Supervisor
Isabel Salumbides-Calangi
Assessments CoordinatorKerem Oner, CAE
Accounting Assistant IDebra Vedder
Appraiser I (part-time)Simar Singh
Appraiser ISherman Lambert
Appraiser TraineeJonathan Dakon
Financial Systems Analyst I(OIT)
Valerie Fawcett
Administrative Support Assistant III
Diane Honeycutt
Accounting Assistant IJennifer Fey
Appraiser IJeffrey Chaparro
GIS AnalystDebra Watson-Grady
Real

This page intentionally left blank

TABLE OF CONTENTS
INTRODUCTION ................................................................................................................. 3 MAINTAINING PROPERTY RECORDS......................................................................... 4 ASSESSING REAL PROPERTY ........................................................................................ 6
Reassessing Existing Properties................................................................................6 Assessment Performance ..........................................................................................9 Assessing New Construction ..................................................................................10 Assessment Notification .........................................................................................12
REAL ESTATE TAX RELIEF PROGRAMS.................................................................. 14
Tax Relief for the Elderly and Disabled .................................................................14 Tax Relief Based on Use Value Assessment ..........................................................17 Partial Tax Exemption for Rehabilitated Real Estate .............................................18
PROVIDING CUSTOMER SERVICE............................................................................. 20
Walk-in Customers .................................................................................................20 Telephone Requests ................................................................................................20 Internet Access........................................................................................................21
REAL ESTATE VALUES .................................................................................................. 22
Landbook Values: Growth and Appreciation .........................................................23 Residential...............................................................................................................24 Apartments ..............................................................................................................27 Commercial and Industrial......................................................................................27 Undeveloped Land ..................................................................................................29 Supplemental Assessments .....................................................................................30 Tax-Exempt Properties ...........................................................................................30
STATISTICAL APPENDIX.............................................................................................A-1
Table 1: History of Property Record Maintenance Activity................................ A-3 Table 2: History of Tax Relief for the Elderly and Disabled............................... A-3 Table 3: History of Appeals Activity................................................................... A-3 Table 4: History of Adjustments.......................................................................... A-3 Table 5: Use Value Assessment Summary .......................................................... A-4 Table 6: Average Assessed Value History of Residential Property .................... A-5 Table 7: Assessed Values and Estimated Market Values .................................... A-6 Table 8: History of the Real Estate Tax Base ...................................................... A-8 Table 9: Public Service and Commercial/Industrial Assessments....................... A-9 Table 10: Assessment Performance Statistics.................................................... A-10

Table 11A: Growth and Appreciation................................................................ A-11 Table 11B: History of Appreciation Rates......................................................... A-12 Table 11C: History of Growth Rates ................................................................. A-12 Table 11D: History of Appreciation and Inflation............................................. A-13 Table 12: Top Fifty Real Estate Taxpayers ....................................................... A-14 Table 13: Tax Rates ........................................................................................... A-15
ADDENDA ......................................................................................................................... B-1
Addendum A: Sample Notice of Reassessment ...................................................B-3 Addendum B: Tax Savings for Rehabilitated Properties......................................B-5 Addendum C: Tax Relief Programs for Elderly and Disabled Persons................B-7 Addendum D: Sample Tax Bill.............................................................................B-9
Page 2

Real Estate Assessments Office 2009 Annual Report
Introduction
The Finance Department’s Real Estate Assessments Office is responsible for annually assessing all real property in Prince William County, maintaining property ownership records, and administering the County’s tax relief programs. In order to perform these duties, the Real Estate Assessments Office gathers and maintains data on every property in the County. The Real Estate Assessments Office also collects and analyzes data pertaining to real estate market indicators such as sales and property income and expense data. This information enables staff to assess property at fair market value as required by law.
The Finance Department
provides quality customer service
through financial and fiduciary management
Real estate assessments and taxes are based on the “tax year”, which
coincides with the calendar year. Assessments for 2009 were made effective on January 1, 2009, and were entered into the County’s 2009 landbook. Tax payments are divided into two equal installments. Payment for the first installment is due July 15 and payment for the second installment is due December 5. The County accounts for the revenues from this tax during the fiscal year in which the due dates fall. That is, real estate assessments and taxes for tax year 2009 are recognized as fiscal year 2010 County revenues.
Tax year 2008 (fiscal year 2009) information is presented in this report. Tax year 2009 (fiscal year 2010) information is also presented although supplemental assessments and rollback taxes for tax year 2009 are not yet available and are estimated. All references regarding years are tax (calendar) years rather than fiscal years unless otherwise noted.
The Real Estate Assessments Office performs the following key functions:
• Maintains property records • Reassesses existing properties • Assesses new construction • Facilitates assessment notification and appeal • Administers real estate tax relief programs • Provides quality customer service
Page 3

Real Estate Assessments Office 2009 Annual Report
Maintaining Property Records The Real Estate Assessments
Office maintains property records
for purposes of assessment and
taxation
The Real Estate Assessments Office is responsible for determining
taxable ownership of property. This requires interpreting all legal documents relating to real estate. The documents (deeds, plats, wills, court orders, etc.) are recorded by the Clerk of Circuit Court in Manassas, Virginia. The recorded documents contain information regarding transfers, consolidations, subdivisions, and other legal changes.
By reading each document, a determination is made whether it affects the taxable ownership, size, or configuration of the property. If it does, the necessary changes are made to property records. In some cases, information contained in the deed is conflicting. The Real Estate Assessments Office may send correspondence to settlement attorneys and title companies documenting a title issue with a deed and requesting clarification. This process ensures up-to-date records with accurate legal descriptions.
There are four types of documents and transactions handled by the Real Estate Assessments Office:
• Wills – instruments recorded upon the death of an individual. They may or may not transfer real estate.
• New Lots – parcels that are created from a subdivision or consolidation of existing land.
• Deeds – legal instruments recorded that convey an estate or interest in real property. One deed may transfer no parcels or several hundred parcels.
• Transfers – legal changes in ownership of property.
Page 4

Real Estate Assessments Office 2009 Annual Report
Property Record Maintenance Activity
-
5,000
10,000
15,000
20,000
25,000
30,000
35,000
Num
ber
of O
ccur
renc
es
Wills and Deeds 24,368 31,244 20,280 21,950 28,687
FY 2005 FY 2006 FY 2007 FY 2008 FY 2009
Types of Property Maintenance Activity
0
5,000
10,000
15,000
20,000
25,000
30,000
35,000
Wills 829 1,453 1,146 1,067 1,169
New Lots 4,762 3,710 1,852 1,815 587
Deeds 23,539 29,791 19,134 20,883 27,518
Transfers 25,584 22,272 15,039 23,177 20,207
FY 2005 FY 2006 FY 2007 FY 2008 FY 2009
Types of property record maintenance activity for the most recent five years are shown above. A more detailed history of property record maintenance activity is shown in the Statistical Appendix, Table 1, page A-3.
Property record maintenance activity
has increased by 6,737 transactions
or 23.48% from FY2008 to FY2009.
Sales transactions are used as the
basis for valuing most residential properties in the
County
Page 5

Real Estate Assessments Office 2009 Annual Report
Assessing Real Property Prince William
County has performed annual
assessments of property since
l979
The Real Estate Assessments Office provides services to all taxpayers in the form of accurate, equitable assessments. In this manner, the Real Estate Assessments Office supports the Finance Department’s mission in providing quality customer service through financial and fiduciary management.
Reassessing Existing Properties The Code of Virginia, § 58.1-3252, requires counties to reassess real
estate at least every four years, and § 58.1-3253 authorizes annual and biennial assessments. Prince William County has performed annual assessments of property since l979, when technology made this feasible. Tax policy organizations recommend annual reassessment because assessments at longer intervals may result in large disparities and inequities between properties, especially during periods of rapid changes in the real estate market.
Maintaining equity is a primary
goal when assessing real
estate for taxation Regular reassessment helps maintain equity between properties as
market conditions change. The standard for all assessments in Virginia is established in the Virginia Constitution, Article X, Section 2, which requires assessment at “fair market value”. The only exception to this requirement is for certain agricultural, forestal, horticultural, and open space property in the Use Value Assessment Program (see page 17). The Code of Virginia §58.1-3253 further provides that annual assessments are to be made as of January 1 of each year. To perform equitable assessments, the Real Estate Assessments Office must gather accurate and consistent property information and perform proper analyses of sales and other market indicators.
Data Collection The Real Estate Assessments Office collects information on property descriptions, sales, income and expenses, and other real estate market data. To ensure property descriptions are accurate, County appraisers periodically inspect properties and verify current data. Property characteristics are relatively stable, and physical inspections of each property are not necessary every year. However, physical characteristics such as condition do change
Page 6
Real Estate Assessments Office 2009 Annual Report
slowly over time, and properties are reviewed approximately every five years to ensure assessments are based on accurate information.
Sales and income data are the primary data sources for establishing the value of real estate. Sales transactions are used as the basis for valuing most residential properties in the County. Since inaccurate sales information can lead to incorrect conclusions about property values, sales must be reviewed to verify the physical and financial circumstances that led to a particular sale price. Surveys are mailed monthly to verify information on the sale that was obtained from documents at the courthouse. Further review may include a physical inspection of the property to confirm its condition. The review may also include contact with the buyer, seller, or other parties involved in the transaction to verify the presence and amount of unusual financial terms that may have affected the sale price. To aid in valuing commercial and industrial property using the income approach, the Real Estate Assessments Office collects income and expense information from commercial property owners.
Sales and income data are the primary data
sources for establishing the
value of real estate
Analysis of Data The Real Estate Assessments Office analyzes the information about
market activity (sales, income, etc.) and values property based on the real estate market. Properties are reassessed each year. Therefore, each year the most recent sales, income information, and other market factors are studied and values are re-assessed according to the current real estate market.
Several standard appraisal
methods are used to value
property
Application of Results Appraisers use several approaches to value property for assessment
purposes. These approaches are as follows:
Cost Approach: In the cost approach, the improvement value is determined by first estimating the cost to replace the building with a new one, and then subtracting depreciation, which makes the existing building worth less than the cost of a new one. Depreciation can be caused by physical deterioration, functional obsolescence (poor functional design), or by economic obsolescence (effects of factors outside the property such as high traffic). The improvement value is added to the land value to produce total value by the cost approach.
Cost Approach
Page 7

Real Estate Assessments Office 2009 Annual Report
Sales Comparison Approach: The sales comparison approach is based on the principle of substitution by comparing a property with similar properties that have sold. In this approach, several similar properties that have recently sold are selected. Each of the sale prices is adjusted for differences between the property that sold and the subject property. This gives an indication of what each of the buyers would likely have paid for their property had it been identical to the subject property.
Sales Comparison
Approach
Income Capitalization Approach: The income capitalization approach produces a value indication by converting an income stream into property value. In this approach, the effective gross income of a property is estimated by considering market rents, vacancy rates, and collection losses. Estimated normal operating expenses are deducted to generate an estimate of net operating income. This income is capitalized into an estimate of value by application of an appropriate market capitalization rate. Capitalization rates can be derived from market data by dividing the income stream by sale price. There are also reliable published sources for national, regional, and local capitalization rates within each major commercial sector.
Income Capitalization
Approach
Page 8
Real Estate Assessments Office 2009 Annual Report
Assessment Performance The tool used to measure the accuracy of assessments is the
assessment-to-sale ratio, which is calculated by dividing the assessment by the selling price. For example, a single family home assessed for $450,000 that sells for $475,000 has an assessment-to-sale ratio of 94.7%. This ratio is calculated for all valid sales in the County and is used to monitor the level and equity of assessments. The median assessment-to-sale ratio is called the level of assessment. The median (midpoint of arrayed ratios) is used to reduce the effect of outlying ratios.
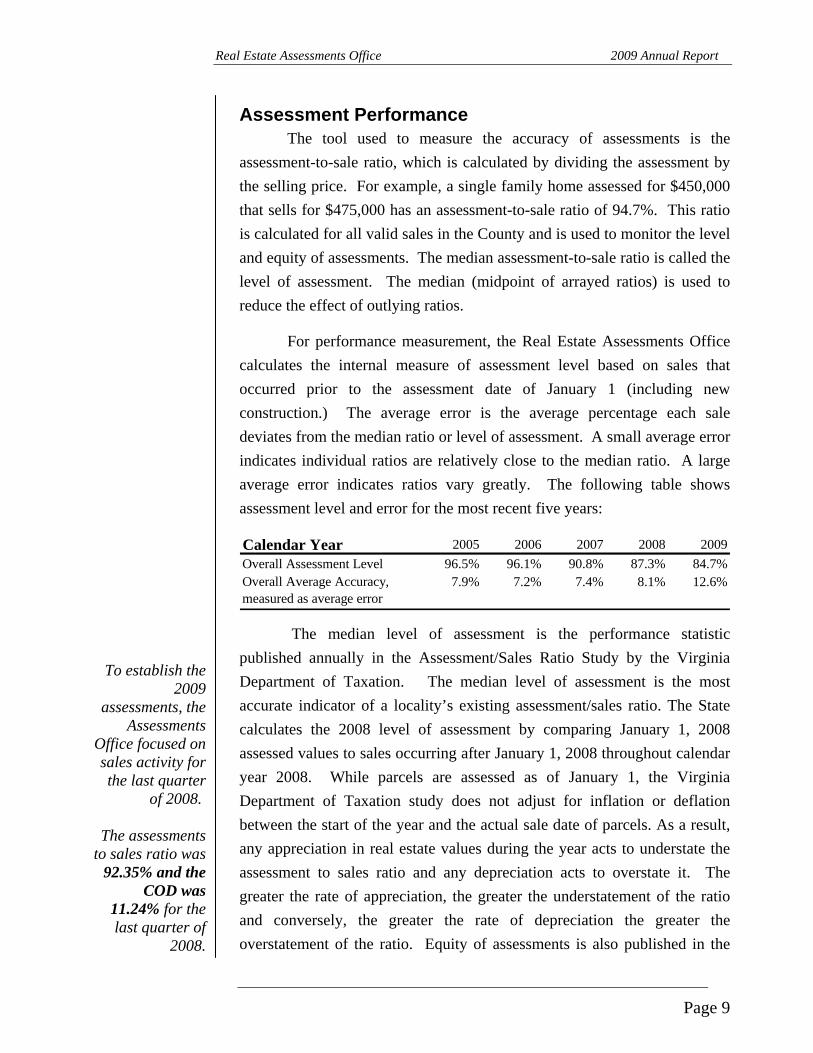
For performance measurement, the Real Estate Assessments Office calculates the internal measure of assessment level based on sales that occurred prior to the assessment date of January 1 (including new construction.) The average error is the average percentage each sale deviates from the median ratio or level of assessment. A small average error indicates individual ratios are relatively close to the median ratio. A large average error indicates ratios vary greatly. The following table shows assessment level and error for the most recent five years:
Calendar Year 2005 2006 2007 2008 2009Overall Assessment Level 96.5% 96.1% 90.8% 87.3% 84.7%
7.9% 7.2% 7.4% 8.1% 12.6%Overall Average Accuracy, measured as average error
The median level of assessment is the performance statistic published annually in the Assessment/Sales Ratio Study by the Virginia Department of Taxation. The median level of assessment is the most accurate indicator of a locality’s existing assessment/sales ratio. The State calculates the 2008 level of assessment by comparing January 1, 2008 assessed values to sales occurring after January 1, 2008 throughout calendar year 2008. While parcels are assessed as of January 1, the Virginia Department of Taxation study does not adjust for inflation or deflation between the start of the year and the actual sale date of parcels. As a result, any appreciation in real estate values during the year acts to understate the assessment to sales ratio and any depreciation acts to overstate it. The greater the rate of appreciation, the greater the understatement of the ratio and conversely, the greater the rate of depreciation the greater the overstatement of the ratio. Equity of assessments is also published in the
To establish the 2009
assessments, the Assessments
Office focused on sales activity for the last quarter
of 2008.
The assessments to sales ratio was
92.35% and the COD was
11.24% for the last quarter of
2008.
Page 9

Real Estate Assessments Office 2009 Annual Report
Assessment/Sales Ratio Study and indicates the uniformity in real property assessment by measuring average error. This information is reported in Table 10 of the Appendix.
Assessing New Construction Building permit
activity decreased 7% from FY2008
During the year, the Real Estate Assessments Office receives information on building permits issued by the County for new structures, additions, and remodeling of buildings. The Real Estate Assessments Office monitors the progress of activity indicated on the permits. New construction requires field inspections during the construction process for accurate measurements and descriptions. The following tables show the number and estimated dollar amount of building permits issued by the County from FY2005 through FY2009. The data comes from the Construction Activity Report produced by The Department of Public Works.
The total value of new
residential permits
increased 19% from FY2008
Number of Permits Issued, Taxable Properties
0
2,000
4,000
6,000
8,000
10,000
12,000
Residential Structures andAdditions
12,326 10,537 7,622 5,142 4,776
Non-Res. Structures andAdditions
725 927 884 816 755
Total 13,051 11,464 8,506 5,958 5,531
FY 2005 FY 2006 FY 2007 FY 2008 FY 2009
Non-Residential Structures and additions were corrected from the 2008 Annual Report.
Page 10

Real Estate Assessments Office 2009 Annual Report
Estimated Dollar Amount of Permits Issued for Structures and Additions, Taxable Properties
0
100
200
300
400
500
600
700
800
in millions($)
New Residential $718,148,110 551,634,397 396,977,945 228,398,969 272,469,789
Residential Additions, etc. 89,154,877 221,397,905 71,953,763 49,046,569 172,830,272
New Non-Residential 113,650,930 458,310,242 236,724,607 142,729,138 119,029,584
Non-Residential Additions, etc. 34,553,231 44,401,844 121,237,291 50,098,482 84,619,304
FY 2005 FY 2006 FY 2007 FY 2008 FY 2009
Page 11

Real Estate Assessments Office 2009 Annual Report
Assessment Notification The Code of Virginia § 58.1-3330 requires the County to notify
property owners whenever reassessment results in an increase in assessed value. The County has chosen to notify all property owners of reassessment, even if there was a reduction or no change in the value. This notification takes place in March of each year and advises the taxpayer of the previous year’s assessment and the current assessment. (See Addendum A, page B-3 for a sample Notice of Reassessment.)
The Real Estate Assessments
Office mailed out over 120,000 reassessment
notices in 2009
Appeal Procedures Taxpayers who are uncertain about the accuracy of their assessment
on the basis of value or equity with other properties can request a review of their property value. The County appraiser considers market information relative to the property and information provided by the taxpayer. If this information shows the assessed value should be changed, the appraiser makes the necessary adjustment. If the evidence does not support a change, the appraiser explains the reasons for sustaining the assessment.
Taxpayers may also appeal to the Board of Equalization (BOE) or Circuit Court. Taxpayers are not required to appeal to the Real Estate Assessments Office before appealing to the BOE or Circuit Court. The BOE is comprised of eight County taxpayers and is established by the Board of County Supervisors to render an independent third party opinion in cases of disagreement between the taxpayer and the assessing official. Although the BOE is a quasi-judicial board, there is no application fee and an attorney is not required.
Appeal Adjustments As a result of an appeal to the Real Estate Assessments Office, the
BOE, or Circuit Court, an assessment may be revised. Developers may appeal many residential lots at the same time and each lot appealed is counted separately. Upon review, the Real Estate Assessments Office may change any or all of the lot values. Since each lot is counted separately, the number of appeals and the number changed by the assessor may be large and may fluctuate substantially from year to year. Some properties are appealed to both the Real Estate Assessments Office and to the BOE. In tax
Page 12

Real Estate Assessments Office 2009 Annual Report
year 2008 there were two cases appealed in Circuit Court and as of June 30, 2009, there were 2 court cases pending.
The table below shows appeal activity for tax year 2004 to tax year 2008. A history of appeals and the resulting adjustments can be found in Table 3 of the Statistical Appendix, page A-3.
Appeal Activity TY 2004 TY 2005 TY 2006 TY 2007 TY 2008Appeals to Assessor 247 197 176 254 731Changed by Assessor 84 81 57 39 111% Changed1 34% 41% 32% 15% 15%Appeals to BOE2 95 138 62 73 611Changed by BOE 12 4 11 12 67% Changed1 13% 3% 18% 16% 11%Appeals to Court 1 0 0 1 2Total Appeals 343 335 238 328 1,344Appeals as % of Total Parcels 0.32% 0.30% 0.21% 0.29% 1.21% 1. May be increase or decrease. 2. 2004 BOE appeals include an appeal of one subdivision with 44 lots. 2007 BOE appeals include an appeal of one subdivision with 44 lots. 2008
BOE appeals include 12 subdivision appeals with a total of 408 lots.
Page 13

Real Estate Assessments Office 2009 Annual Report
Real Estate Tax Relief Programs Prince William County provides relief from real estate taxes and
personal property taxes for those who are elderly or disabled and meet specified income and net worth requirements. Certain land uses may also qualify for tax relief to encourage preservation of agriculture, forestry, and open space. Lastly, older properties which undergo substantial renovations can receive a partial tax exemption for the increase in taxes caused by the renovation.
Tax Relief for the Elderly and Disabled Elderly or disabled persons are eligible for relief from all or part of
the real estate taxes on their home and a home site of 1 acre if they meet the following criteria:
• Are over 65 years of age on or before December 31, or are totally and permanently disabled.
• Have less than $340,000 in total assets (residence and up to 25 acres excluded). During calendar year
2008 there were 510 new applicants
accepted in the Tax Relief for the Elderly
and Disabled Program
• Do not exceed the maximum combined income requirements set forth in local ordinances.
The following table summarizes exemptions of 2009 taxes for
different ranges of income. The income ranges are based on the Housing and Urban Development (HUD) low income limit and are adjusted annually. For 2009, the HUD low income limit used was $49,200 and each range is determined using a percentage of that value.
Income Limits for 2009 Tax Relief Program
Combined Percentage ofIncome Tax Relieved
$0-$49,200 100%$49,201-$56,600 75%$56,601-$64,000 50%$64,001-$71,300 25%
Page 14

Real Estate Assessments Office 2009 Annual Report
The Real Estate Assessments Office provides information to taxpayers about the tax relief program in the following ways:
The Real Estate Assessments Office
utilizes many communication
methods to reach citizens regarding the
Tax Relief Program for the Elderly and
Disabled
o The notice of reassessment is sent to all property owners in March and contains the criteria for tax relief and the deadline for filing (see Addendum A, page B-3).
o The real estate tax bills, personal property tax bills and personal property verification forms briefly address the Tax Relief Program.
o Advertisements in the Potomac News. o Annual advertisement on the Marquee in front of McCoart and on
Channel 23. o A representative from the Real Estate Assessments Office visits the
Harbour House Senior Citizen Home and Merriwood in Manassas from February to April to assist applicants in completing the application.
o A tax relief brochure (in both English and Spanish) containing specific information regarding eligibility and application is available in the Real Estate Assessments Office and various other County agencies (see Addendum C, page B-7), including Finance Department counters and senior citizens' centers.
o The County’s website: www.pwcgov.org
The County sends renewal applications to those who received tax relief the preceding year. Applications are also available on the County’s website.
A summary of real estate tax relief for the elderly and disabled is shown in the following table. Additional historical information about real estate tax relief is provided in the Appendix, Table 2, page A-3.
Page 15

Real Estate Assessments Office 2009 Annual Report
Summary of Tax Relief for the Elderly and Disabled
Real Estate TY2005 TY2006 TY2007 TY2008 TY2009Households Exempted 2,220 2,412 2,453 2,594 2,806 Total Amount Relieved 5,083,034$ 5,900,724$ 6,075,078$ 6,679,427$ 5,781,858$ Avg. Amount Exempted 2,290$ 2,446$ 2,477$ 2,575$ 2,061$
Personal PropertyApplicants 2,317 2,583 2,642 2,832 2,997 Total Amount Relieved* n/a n/a n/a 442,747$ 390,000$ Avg. Amount Exempted* n/a n/a n/a 156$ 130$
Notes: • Data as of July 30, 2009. • Taxpayers may qualify for real estate tax relief, personal property, or both. • Exemption may be 100%, 75%, 50%, or 25%. If the applicant turned 65 or became totally and permanently disabled during calendar year 2009, the
exemption is prorated based on the date the applicant turned 65 or became totally and permanently disabled. • Personal Property Total Amount Relieved and Average Amount Relieved not available prior 2008.
Page 16

Real Estate Assessments Office 2009 Annual Report
Tax Relief Based on Use Value Assessment The Prince William County Use Value Assessment Program
provides tax relief to certain agricultural, forestal, horticultural, and open space property owners. The program allows qualifying land to be taxed according to its use value rather than its market value. The State Land Evaluation Advisory Committee (SLEAC) suggests values for land in the program. These values range from $10 per acre to $210 per acre, depending on the type of land. Buildings do not have use value assessments and are therefore assessed at full market value.
The tax difference is deferred, but not automatically forgiven. The deferred tax remains payable for six years. There are currently 820 parcels in the Use Value Assessment Program. The table below shows the market value, the use value, and the taxes deferred for years 2005 through 2009:
Use Value Assessment Summary TY2005 TY2006 TY2007 TY2008 TY2009
Number of Acres 36,717 34,328 33,544 33,756 32,958 Number of Parcels 801 794 848 851 820 Market Value Assessment 576,895,200$ 718,257,600$ 821,259,100$ 790,938,200$ 563,731,200$ Deferred Assessment (511,674,900) (625,407,200) (721,749,200) (691,425,100) (496,543,200)
Use Value Assessment 65,220,300$ 92,850,400$ 99,509,900$ 99,513,100$ 67,188,000$ Deferred Tax (4,656,242)$ (4,740,587)$ (5,680,166)$ (6,706,823)$ (6,018,104)$ Rollback Taxes 868,692 952,995 45,877 931,844 100,000 Net Tax Deferred (3,787,550)$ (3,787,591)$ (5,634,290)$ (5,774,980)$ (5,918,104)$
Notes: • Rollback taxes for previous years were updated. • Rollback taxes for TY2009 are estimated.
When property owners of land in the Use Value Assessment Program change the use to a non-qualifying use or re-zone their property to a more intensive zoning, they must pay a “rollback tax”, which is the difference between the property’s market value and its use value for the current year and the five most recent complete tax years (including interest.)
Page 17
Real Estate Assessments Office 2009 Annual Report
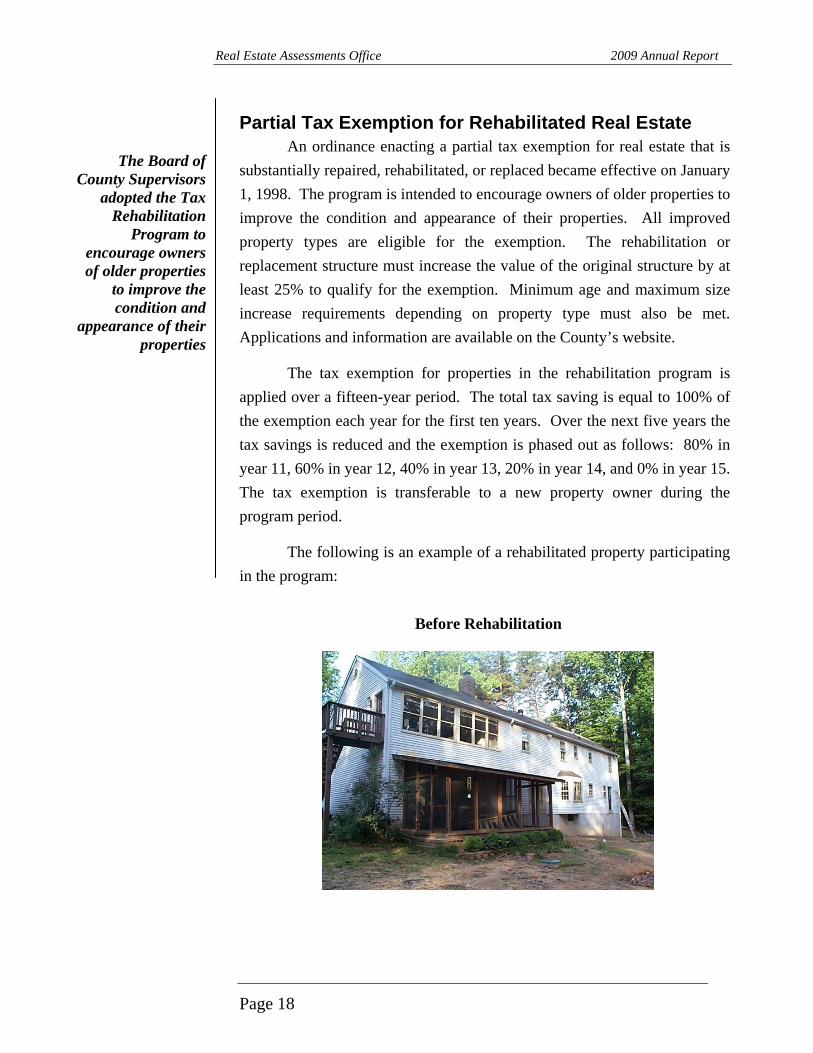
Partial Tax Exemption for Rehabilitated Real Estate An ordinance enacting a partial tax exemption for real estate that is
substantially repaired, rehabilitated, or replaced became effective on January 1, 1998. The program is intended to encourage owners of older properties to improve the condition and appearance of their properties. All improved property types are eligible for the exemption. The rehabilitation or replacement structure must increase the value of the original structure by at least 25% to qualify for the exemption. Minimum age and maximum size increase requirements depending on property type must also be met. Applications and information are available on the County’s website.
The Board of County Supervisors
adopted the Tax Rehabilitation
Program to encourage owners of older properties
to improve the condition and
appearance of their properties
The tax exemption for properties in the rehabilitation program is applied over a fifteen-year period. The total tax saving is equal to 100% of the exemption each year for the first ten years. Over the next five years the tax savings is reduced and the exemption is phased out as follows: 80% in year 11, 60% in year 12, 40% in year 13, 20% in year 14, and 0% in year 15. The tax exemption is transferable to a new property owner during the program period.
The following is an example of a rehabilitated property participating in the program:
Before Rehabilitation
Page 18

Real Estate Assessments Office 2009 Annual Report
After Rehabilitation
Summary of Tax Exemption for Rehabilitated Real Estate
2003 2004 2005 2006 2007 2008 2009
Residential 1999 1 $ 2,988 $ 2,988 $ 2,988 $ 2,988 $ 2,988 $ 2,988 $ 2,390 Commercial 2000 4 67,955 67,955 67,955 67,955 67,955 67,955 67,955Commercial 2001 1 1,910 1,910 1,910 1,910 1,910 1,910 1,910Residential 2001 3 3,489 3,489 3,489 3,489 3,489 3,489 3,489Residential 2002 2 1,791 1,791 1,791 1,791 1,791 1,791 1,791Residential 2003 3 1,378 1,378 1,378 1,378 1,378 1,378 1,378Residential 2004 4 2,145 2,145 2,145 2,145 2,145 2,145Residential 2005 3 733 733 1,093 1,093 1,092Residential 2006 2 1,900 1,900 1,900 1,900Commercial 2007 5 143,696 143,696 143,696Residential 2007 5 5,946 5,946 5,946Residential 2008 2 2,869 2,869
35 $ 79,511 $ 81,657 $ 82,390 $ 84,290 $ 234,292 $ 237,161 $ 236,563
Tax Savings Year
Total Tax Savings
Year Exemption
Began
Property Type
Number of Properties
Page 19

Real Estate Assessments Office 2009 Annual Report
Providing Customer Service The Real Estate Assessments Office provides services to all taxpayers
in the form of accurate, equitable assessments. In addition, each year the Real Estate Assessments Office provides direct assistance to thousands of citizens on an individual basis. One of the most direct forms of customer service is responding to appeals by taxpayers who are not certain their assessment is correct. Taxpayer appeals are explained in the “Appeal Procedures” section, page 12. Several other direct customer services provided by the Real Estate Assessments Office are as follows:
The Real Estate Assessments
Office pledges to do the right thing for the customer
and the community every
time
Walk-in Customers The Real Estate Assessments Office has two main types of walk-in
customers: taxpayers and real estate professionals. When taxpayers come to the Real Estate Assessments Office for assistance with tax relief programs, the office staff works directly with them to help them to understand and apply for tax relief. The Real Estate Assessments Office also has brochures about tax relief for rehabilitated properties (see Addendum B, page B-5) and tax relief for the elderly and disabled (see Addendum C, page B-7). Appraisers and real estate agents use the Real Estate Assessments Office sales lists and on-line access to the assessment database for research purposes.
Telephone Requests Many citizens call for information about the method of assessment
used in valuing their property or about tax due dates and other general facts. The Real Estate Assessments Office also provides tax professionals with ownership, tax and property data.
Page 20

Real Estate Assessments Office 2009 Annual Report
Internet Access Real estate assessment information is available free-of-charge on the County’s website. Ownership information, physical descriptions, sales history, and assessment history for each property in the County are provided on the website at http://www.pwcgov.org/realestate. The County’s Internet statistics reports consistently demonstrate that the Real Estate Assessments Office has the highest number of views (a count of hits to pages) and visitor sessions within the County’s website. A summary of customer service activity is shown in the following table:
“Landrover” is the most widely used
application on the County’s Website
FY2005 FY2006 FY2007 FY2008 FY2009Walk-in Customers 2,235 2,454 2,363 2,541 4,642 Citizen/Public Agency Calls 18,519 20,360 21,446 21,984 23,095 Internet User Sessions* 860,370 824,531 818,865 862,366 774,786 Total 881,124 847,345 842,674 886,891 802,523
* Internet User Sessions for March and April of 2009 are estimated. Notes: A user session is a session of activity (all hits) for one user of the website. By default, a user session is terminated when a user is inactive for more than thirty minutes.
Real Property Assessments Internet System
Page 21

Real Estate Assessments Office 2009 Annual Report
Real Estate Values For the purpose of comparing and analyzing real estate assessments,
property in the County has been divided into several categories. The following table compares assessed values for each type of property for tax years 2008 and 2009.
The total locally assessed values
decreased 25.4% from
January 1, 2008 to January 1, 2009
Assessed Values from 2008 to 2009
2008 2009 Percentage Change
Taxable Real EstateResidential 41,806,019,900$ 29,748,827,100$ -28.84Apartments 1,904,867,400 1,800,770,500 -5.46
Total Residential 43,710,887,300 31,549,597,600 -27.82Commercial and Industrial 7,523,842,000 6,676,770,600 -11.26Public Service(2) 1,471,669,059 1,412,802,296 -4.00
Total Commercial and Industrial 8,995,511,059 8,089,572,896 -10.07Undeveloped Land 271,391,300 214,436,100 -20.99
Total Assessed - Local 51,506,120,600 38,440,804,300 -25.37Total Assessed - Non-Local 1,471,669,059 1,412,802,296 -4.00Total Real Estate 52,977,789,659 39,853,606,596 -24.77Supplements(1)
Residential 174,622,200 161,800,400 Apartments - - Commercial and Industrial 71,685,900 69,954,300 Undeveloped Land 1,646,100 1,176,800
Total Supplements 247,954,200 232,931,500 -6.06Total Tax Base 53,225,743,859 40,086,538,096 -24.69Rollbacks (3) 96,066,340 8,250,825 -91.41Tax Exempt 3,722,542,600 3,451,862,900 -7.27Deferred Use Value (4) 691,425,100 496,543,200 -28.19Total Assessed Value 57,735,777,899$ 44,043,195,021$ -23.72
Improved existing residential values declined 29.79%
from January 1, 2008 to
January 1, 2009
Notes: 2008 and 2009 Assessed Values form the basis for FY2009 and FY2010 revenues, respectively. 1. Supplements are taxes billed for construction completed during the year. Supplemental assessments include prorated
assessments on newly completed construction and prorated assessments for properties which become taxable during the year. Supplements 1, 2 and 3 for 2009 are not currently available. The values shown are estimated.
2. Public Service assessments are received by the County from the State in September of each year. 2009 Public Service assessment is estimated.
3. Rollbacks account for properties that were eliminated from the use value program due to re-zoning or development. Rollbacks for 2009 are estimated and are calculated using the base tax rate of $1.212 per $100 of assessed value.
4. Deferred use value is the difference between the market value and use value of properties in the Use Value Assessment Program.
Page 22

Real Estate Assessments Office 2009 Annual Report
Composition of Tax Base—2009 Assessed Values
Apartments4%
Residential74%
Undeveloped Land1%
Commercial17%
Public Service4%
Each year, changes in the Landbook are attributed to growth
and appreciation
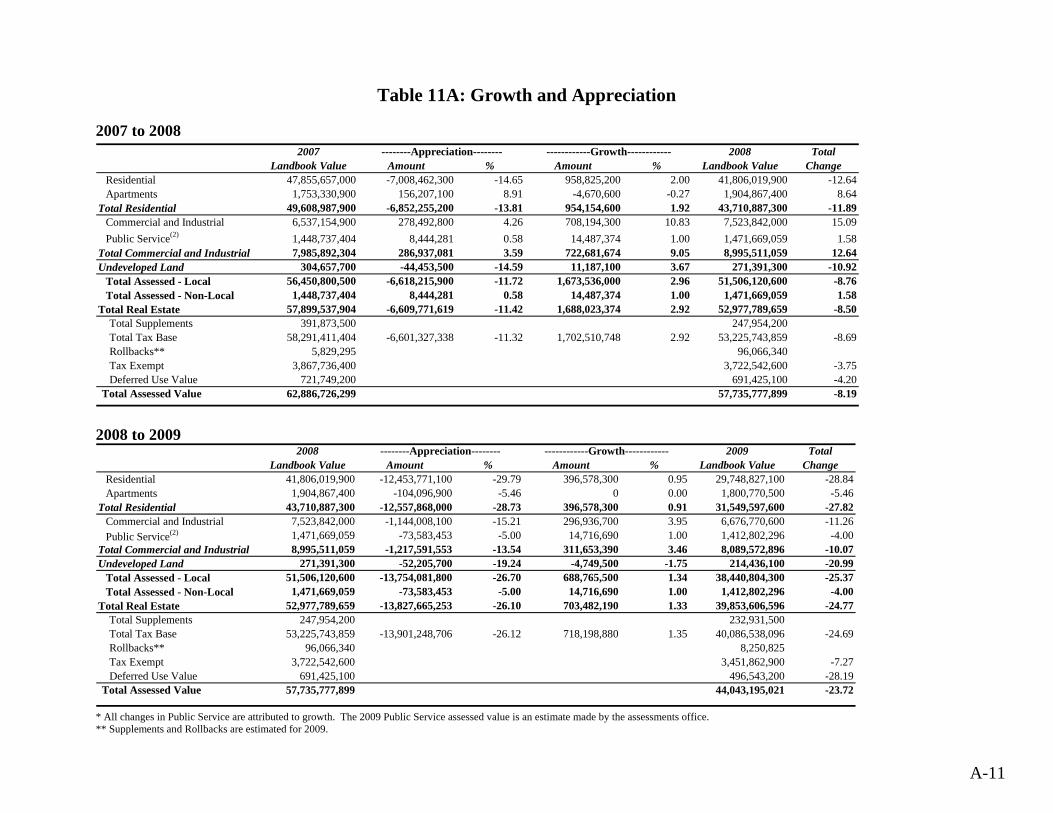
Landbook Values: Growth and Appreciation
The 2009 landbook contains assessed values for all properties in the County as of January 1, 2009. The following categories of assessments are not included in the landbook:
• Assessments for state-valued public service properties (these are received from the State in September each year)
• Supplemental assessments (these are made after January 1, 2009)
Each year, changes in landbook values for each category can be divided into two main influences: growth and appreciation. Changes in value due to growth result from the construction of new buildings and from land subdivisions. As the table on the following page shows, the residential, commercial and industrial categories experienced positive growth, while apartments remained unchanged from 2008. Subdivisions and changes in code class designations caused a contraction in undeveloped land.
Changes in value due to appreciation or depreciation are the result of changes in real estate market conditions, changes in property descriptions, physical deterioration, renovations and additions. For the 2009 landbook, these factors caused existing residential, commercial, apartment properties, and undeveloped land to decrease in value. Overall, the landbook value increased 1.33% for growth but it depreciated by 26.10%, resulting in a total net decrease
Page 23

Real Estate Assessments Office 2009 Annual Report
of 24.77% in the 2009 landbook value. The table below shows the 2008 to 2009 landbook changes attributable to growth and appreciation. Detailed and historical data are in the Statistical Appendix page A-11.
Changes in Landbook Percent Percent TotalValues - 2008 to 2009 Growth Appreciation Percent ChangeResidential 0.95 -29.79 -28.84Apartments 0.00 -5.46 -5.46Commercial/Industrial 3.95 -15.21 -11.26Undeveloped Land -1.75 -19.24 -20.99Total Landbook 1.33 -26.10 -24.77 Landbook values of
new and existing residential
properties decreased more than 28%
Residential
The residential category includes improved and unimproved parcels zoned for residential use except multifamily rental apartment units. Improved parcels in this category are single family homes, townhouses, and condominiums. Growth caused a 0.95% increase in the residential assessed value. There were 1,794 new residential units with an average value of $330,995 added to the tax base for tax year 2009. Depreciation however, caused a 29.79% decrease in the residential landbook for a total net change in the 2009 residential landbook of -28.84%. The table below shows the landbook value of residential property for the last five years and the following page shows the composition of the residential category, the composition of new construction, and the average assessed values of residential properties.
Residential Landbook Assessments % ChangeCalendar Year2005 $35,545,112,500 31.20%2006 $47,981,517,800 34.99%2007 $47,855,657,000 -0.26%2008 $41,806,019,900 -12.64%2009 $29,748,827,100 -37.84%
Page 24

Real Estate Assessments Office 2009 Annual Report
Types of Residential Property - 2009 Landbook
Single Family73.27%
Vacant Land3.56% Other
0.25%
Condominiums4.34%
Townhouses18.57%
Notes: This table is not a count of dwelling units in the County. Some parcels in the Single Family category may have more than one dwelling unit. New homes that were partially built as of January 1, 2009 are counted as if they were complete, although their value is discounted depending on the level of completion. Tax-exempt properties and apartment units are not included in this table.
Of the 1,794 new homes built in the County during 2008, 50% were single-family homes and townhouses assessed at over $300,000 for tax year 2009. The average assessment of all residential new construction decreased from $427,378 in 2008 to $330,995 in 2009. The following table shows the breakdown of new homes by type and value:
Type of NewResidential Construction Count Average Count Average Count Average
Single Family 872 413,014$ 188 271,748$ 1,060 387,959$ Townhouses 22 320,427 256 252,820 278 258,170 Condominiums 13 538,584 443 234,301 456 242,976 Total Residential 907 412,568 887 247,583 1,794 330,995
Average Residential Real Estate Tax for New Homes (Tax Rate = $1.212 per $100) 4,012$
All New UnitsNew Units Under $300,000New Units Over $300,000
Note: This table includes residential homes completed during 2008. Homes partially built as of January 1, 2009 have been excluded.
Page 25

Real Estate Assessments Office 2009 Annual Report
Single-family homes and townhouses experienced decreases in average assessed value from 2008 to 2009. Listed below are the average assessments of residential dwelling types for the last five years.
From January 1, 2008 to January 1, 2009, the average
residential assessment registered a
decrease of over 29% to $248,946
Average Residential Assessments by Type
2005 2006 2007 2008 2009Single Family Detached 381,548$ 487,255$ 468,079$ 402,105$ 290,216$ Townhouses 251,764$ 330,359$ 318,980$ 270,937$ 173,170$ Condominiums 182,287$ 257,384$ 260,084$ 232,760$ 162,247$ All Types 333,510$ 429,745$ 413,870$ 354,333$ 248,946$
Note: These averages do not include tax-exempt properties, vacant lots, residences on commercial or agricultural land, parcels with more than one residence, or houses that were partially complete as of January 1, 2009.
Comparison of Average Residential Assessments by Type
$-
$100
$200
$300
$400
$500
$600
Single FamilyDetached
Townhouses Condominiums All Types
Thou
sand
s
2005 2006 2007 2008 2009
The average single family dwelling value
decreased from $402,105 in 2008 to
$290,216 in 2009
New houses can influence the overall average assessed value of all homes positively or negatively, depending on the size, quality, and type of new construction. In general, new houses are more expensive than typical existing houses in the County and therefore cause an increase in the overall average assessed value. As a result, even if market factors or physical deterioration cause a decline in the value of existing properties, construction of new units may cause the overall average value to increase. In recent years, there has been a decreasing trend of average values in residential properties in the County. A ten-year history of average values is included in the Statistical Appendix, Table 6, page A-5.
Page 26

Real Estate Assessments Office 2009 Annual Report
Apartments Apartments include residential rental and vacant land zoned for
apartments. The unit count for 2008 including the small apartment complexes is 17,537, and the average assessment per unit is $99,885.
Apartment values decreased 5.46% from 2008 to 2009, compared to a 8.64% decrease from 2007 to 2008. The totality of the contraction is attributed to depreciation. The following table is a summary of apartment unit information for the last five years, excluding vacant land:
Apartment Summary 2005 2006 2007 2008 2009Number of Apartment Parcels 181 194 184 190 194 Number of Apartment Units 16,239 16,776 17,504 17,411 17,595 Average Assessment per Unit 79,622$ 92,237$ 97,017$ 106,202$ 99,885$ Improved Parcels Only 1,292,986,000 1,547,362,100 1,698,198,000 1,851,762,400 1,768,380,000 Undeveloped Apartment Land 28,252,000 32,784,800 55,132,900 53,105,000 32,390,500 Total Landbook Values 1,321,238,000$ 1,580,146,900$ 1,753,330,900$ 1,904,867,400$ 1,800,770,500$ Notes: • Tax-exempt properties are not included in this table. • 2008 figures were updated.
Commercial and Industrial
Locally-Valued Properties The assessed value of
commercial and industrial properties
decreased 11.26 % from 2008 to 2009
Locally-valued commercial and industrial properties consist of all non-residential uses such as retail, office, hotel, industrial, warehouse, and vacant parcels with commercial or industrial zoning. Properties owned by public service companies such as utility companies and railroads are valued by the state but taxed locally.
Locally assessed commercial and industrial property values decreased 11.26% from 2008 to 2009, as compared to 15.09% increase from 2007 to 2008. Approximately 2.8 million square feet of commercial space was completed during 2008. Roughly 87% of the new commercial square footage was built within the retail and industrial sectors. Several new office buildings and condominiums were completed adding a total of 276,813 square feet within the office sector during 2008, compared to 944,712 square feet added during 2007. A new hotel was completed and added 56,013 square feet. There were several special use properties such as recreational facilities completed during 2008, adding over 30,000 square feet. The table below contains landbook assessment information about locally assessed commercial properties overall.
Page 27
Real Estate Assessments Office 2009 Annual Report
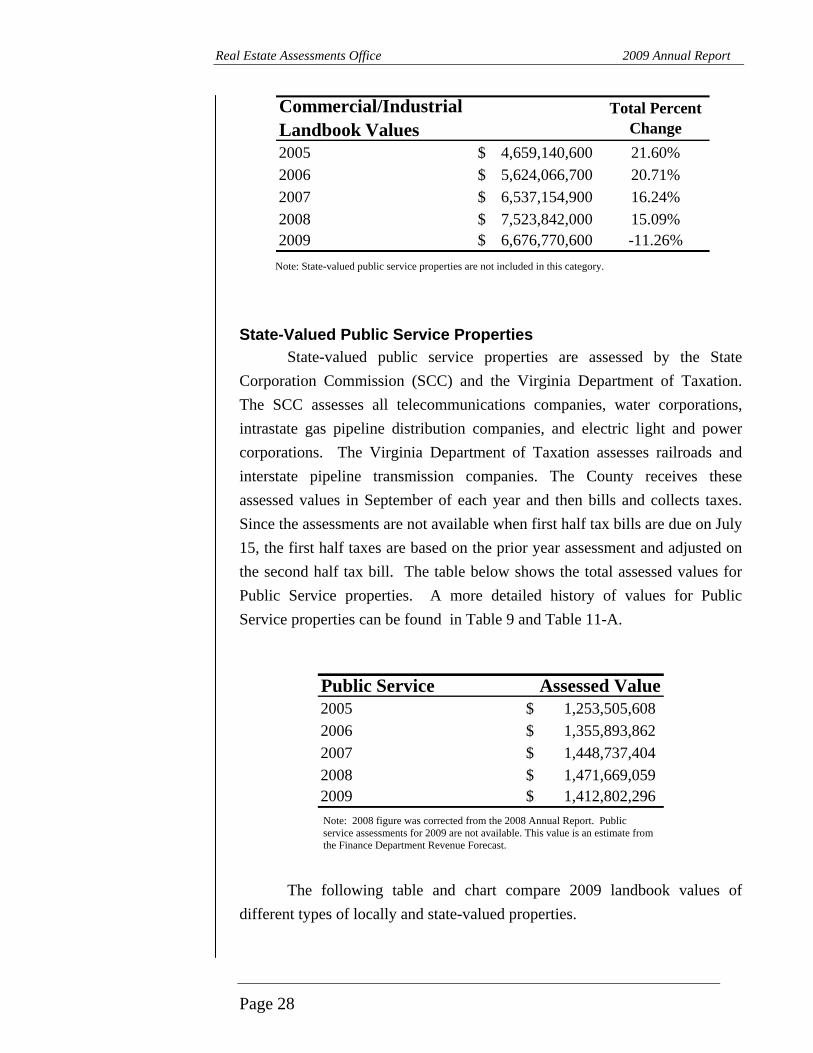
Commercial/IndustrialLandbook Values2005 4,659,140,600$ 21.60%2006 5,624,066,700$ 20.71%2007 6,537,154,900$ 16.24%2008 7,523,842,000$ 15.09%2009 6,676,770,600$ -11.26%
Total Percent Change
Note: State-valued public service properties are not included in this category.
State-Valued Public Service Properties State-valued public service properties are assessed by the State
Corporation Commission (SCC) and the Virginia Department of Taxation. The SCC assesses all telecommunications companies, water corporations, intrastate gas pipeline distribution companies, and electric light and power corporations. The Virginia Department of Taxation assesses railroads and interstate pipeline transmission companies. The County receives these assessed values in September of each year and then bills and collects taxes. Since the assessments are not available when first half tax bills are due on July 15, the first half taxes are based on the prior year assessment and adjusted on the second half tax bill. The table below shows the total assessed values for Public Service properties. A more detailed history of values for Public Service properties can be found in Table 9 and Table 11-A.
Public Service Assessed Value2005 1,253,505,608$ 2006 1,355,893,862$ 2007 1,448,737,404$ 2008 1,471,669,059$ 2009 1,412,802,296$ Note: 2008 figure was corrected from the 2008 Annual Report. Public service assessments for 2009 are not available. This value is an estimate from the Finance Department Revenue Forecast.
The following table and chart compare 2009 landbook values of
different types of locally and state-valued properties.
Page 28

Real Estate Assessments Office 2009 Annual Report
Comparison of Types of Commercial/Industrial Property 2009 Landbook
Retail38.67%
Offices10.05%Hotels
3.14%Industrial13.42%
Technology Services1.56%
Other5.21%
Vacant Land10.54%
State Valued17.41%
Locally Assessed Retail 1,244 3,138,802,500$ 38.67% Offices 1,243 815,705,100 10.05% Hotel 40 254,551,900 3.14% Industrial 706 1,089,381,200 13.42% Technology Services 4 126,500,100 1.56% Other 497 422,578,500 5.21% Vacant Land 1,203 855,787,400 10.54%Total Locally Assessed 4,937 6,703,306,700$ 82.59%Total State Valued 1,412,802,296$ 17.41%Total Commercial/Industrial 8,116,108,996$ 100.00%
Percent of Total
Commercial/Industrial Property Types
Number of Parcels Value, 2009 Landbook
Note: Public service assessments for 2009 are not available. This value is estimated in the Revenue Forecast, by the Finance Department.
Undeveloped Land Undeveloped land consists of large acreage tracts of farm land and other undeveloped properties greater than twenty acres. From 2008 to 2009, there was a 20.99% decrease in value compared to a 10.92% decrease from 2007 to 2008, and a 28.81% decrease from 2006 to 2007. The current decrease is
Page 29

Real Estate Assessments Office 2009 Annual Report
attributed to a 19.24% depreciation and a 1.75% growth reduction due to changes to class code designations and additional properties qualifying for use value assessments. The following table reflects the landbook values of this category for 2005 through 2009.
Vacant Land Values2005 274,871,400$ 2006 427,927,900$ 2007 304,657,700$ 2008 271,391,300$ 2009 214,436,100$
Some of these undeveloped parcels qualify for the Use Value Assessment Program and are not taxed at market value. These values typically range from $10 to $210 per acre (see “Tax Relief Based on Use Value Assessment,” page 17 for more information).
Supplemental Assessments Supplemental assessments include prorated assessments on newly
completed construction and prorated assessments for properties which become taxable during the year. When construction is completed during the year, the increase in assessed value between the January 1 assessment and the completed value is prorated based on the number of months the property is substantially completed or fit for use and occupancy. The owner of the property receives a supplemental tax bill for the prorated increased value.
Supplemental Assessments2005 685,960,300$ 2006 687,294,800$ 2007 391,873,500$ 2008 247,954,200$ 2009 (Estimated) 232,931,500$
Tax-Exempt Properties The Code of Virginia § 58.1-3200 requires the County to place an
assessment on all property except road rights-of-way and State-valued public service properties. Therefore, the County is required to assess all tax-exempt properties. For 2009, there were 1,999 tax-exempt parcels consisting of
Page 30

Real Estate Assessments Office 2009 Annual Report
federal, state, and County-owned properties, as well as properties owned by churches, schools, and other tax-exempt organizations.
The total assessed value of exempt properties for 2009 is $3,451,862,900 and the total amount of taxes exempted is $41,836,578. A summary of the assessed values of tax-exempt properties by category for 2005 through 2009 and a chart showing the relative proportion of each category of tax-exempt properties for 2009 follows.
Tax-exempt properties are 7.84%
of the total County tax base
Religious9%
Educational16% Other
2%
Charitable2%
Federal27%
State5%
Regional1%Local
38%
Values of Tax Exempt PropertiesCalendar Years 2005 2006 2007 2008 2Federal 750,911,100$ 947,685,300$ 1,344,097,800$ 1,104,841,600$ 919,713,900$ State 132,510,500 156,161,600 175,671,600 188,752,700 162,640,000 Regional 24,380,500 22,757,800 24,303,700 46,402,000 41,526,700 Local 1,170,487,700 1,365,215,800 1,645,432,400 1,442,134,400 1,310,320,300 Religious 216,548,800 248,070,000 319,096,600 347,476,000 323,950,600 Charitable 46,352,900 50,892,500 52,817,100 57,832,800 60,483,800 Educational 174,780,000 197,547,100 222,507,500 445,871,900 554,466,000 Other
009
51,613,600 61,269,200 83,319,700 89,231,200 78,761,600 Total Tax Exempt 2,567,585,100$ 3,049,599,300$ 3,867,246,400$ 3,722,542,600$ 3,451,862,900$
% of Total County Value 5.47% 4.96% 6.15% 6.45% 7.84%
Page 31

This page intentionally left blank

Statistical Appendix

This page intentionally left blank

Table 1: History of Property Record Maintenance Activity
FY 2000 FY 2001 FY 2002 FY 2003 FY 2004 FY 2005 FY 2006 FY 2007 FY 2008 FY 2009Wills 550 580 408 404 329 829 1,453 1,146 1,067 1,169New Lots 3,189 3,867 4,779 3,701 4,140 4,762 3,710 1,852 1,815 587Deeds 12,941 16,100 20,317 20,919 23,429 23,539 29,791 19,134 20,883 27,518Transfers 14,831 16,652 20,239 21,854 23,822 25,584 22,272 15,039 23,177 20,207
Table 2: History of Tax Relief for the Elderly and Disabled
TY 2000 TY 2001 TY 2002 TY 2003 TY 2004 TY 2005 TY 2006 TY 2007 TY 2008 TY 2009Real EstateNumber Exempted 712 864 827 1,385 1,632 2,220 2,412 2,453 2,594 2,806 Amount Exempted 998,470$ 1,176,134$ 1,439,894$ 2,589,472$ 3,317,670$ 5,083,034$ 5,900,724$ 6,075,078$ 6,679,427$ 5,781,858$ Number Deferred 204 131 139 n/a n/a n/a n/a n/a n/a n/aAmount Deferred 297,292 207,490 257,400 n/a n/a n/a n/a n/a n/a n/aPersonal PropertyNumber Exempted 1,234 1,217 1,223 1,506 1,752 2,317 2,583 2,642 2,832 2,997 Amount Exempted n/a n/a n/a n/a n/a n/a n/a n/a 442,747$ 390,000$
Deferrals were eliminated with the 2003 program and all income limits were increased to capture anyone who may otherwise have been deferred. Personal Property Amount Exempted not available prior 2008.
Table 3: History of Appeals Activity
TY 1999 TY 2000 TY 2001 TY 2002 TY 2003 TY 2004 TY 2005 TY 2006 TY 2007 TY 2008Appeals to Assessor 736 624 352 254 193 247 197 176 254 731Changed by Assessor* 373 517 214 98 66 84 81 57 39 111% Changed 51% 83% 61% 39% 34% 34% 41% 32% 15% 15%Appeals to BOE 126 141 85 290 82 95 138 62 73 611Changed by BOE** 50 18 4 5 8 12 4 11 12 67% Changed 40% 13% 5% 2% 10% 13% 3% 18% 16% 11%Appeals to Court 2 1 0 1 1 1 0 0 1 2Total 864 766 437 545 276 343 335 238 328 1,344
*May have been decrease or increase. ** 2004 BOE appeals include an appeal of one subdivision with 44 lots. 2007 BOE appeals include an appeal of one subdivision with 44 lots. 2008 BOE appeals include 12 subdivision appeals with a total of 408 lots.
Table 4: History of Adjustments TY 1999 TY 2000 TY 2001 TY 2002 TY 2003 TY 2004 TY 2005 TY 2006* TY 2007 TY 2008
Number Adjusted 808 858 746 638 447 504 392 654 405 449Tax Amt. Reduced $829,138 $707,867 $1,258,958 $923,841 $790,081 $1,066,612 $1,254,980 $976,945 $766,770 $1,781,207
Note: These numbers include all adjustments as a result of appeals and highway takings.
A-3

Table 5: Use Value Assessment Summary
Year # of Parcels Acres Market Value
AssessmentUse Value
AssessmentAssessment Reduction
Percent Reduction
Tax Rate per $100
Tax Reduction
Rollback Taxes*
Net Annual Deferral
2000 862 47,296 292,415,900 40,347,300 252,068,600 86.20 1.340 3,377,719 366,864 3,010,8562001 856 45,326 280,506,300 37,887,100 242,619,200 86.49 1.300 3,154,050 1,667,785 1,486,2652002 840 43,487 307,671,000 37,426,100 240,718,000 78.24 1.230 2,960,831 1,409,661 1,551,1702003 821 41,122 392,281,700 35,456,000 356,825,700 90.96 1.160 4,139,178 1,992,396 2,146,7822004 808 38,808 441,901,300 58,910,400 382,990,900 86.67 1.070 4,098,003 1,675,725 2,422,2782005 801 36,717 576,895,200 65,220,300 511,674,900 88.69 0.910 4,656,242 868,692 3,787,5502006 794 34,328 718,257,600 92,850,400 625,407,200 87.07 0.758 4,740,587 952,995 3,787,5912007 848 33,544 821,259,100 99,509,900 721,749,200 87.88 0.787 5,680,166 45,877 5,634,2902008 851 33,756 790,938,200 99,513,100 691,425,100 87.42 0.970 6,706,823 931,844 5,774,9802009 820 32,958 563,731,200 67,188,000 496,543,200 88.08 1.212 6,018,104 100,000 5,918,104
*2008 rollback taxes are estimated. Previous years were updated.
A-4

Table 6: Average Assessed Value History of Residential Property
Year Single Family and Duplexes Townhouses Condominiums All Residential Percent
ChangeTotal Number
of Units*1999 160,347 99,785 73,264 136,841 3.33% 76,0092000 170,719 103,867 74,778 144,979 5.95% 79,0972001 189,567 112,962 78,672 160,116 10.44% 82,2732002 224,474 133,259 91,495 189,946 18.63% 86,2692003 263,961 161,247 110,323 225,149 18.53% 90,7882004 309,307 195,017 133,597 266,502 18.37% 95,4692005 381,548 251,764 182,287 333,510 25.14% 100,4622006 487,255 330,359 257,384 429,745 28.86% 106,0142007 468,079 318,980 260,084 413,870 -3.69% 110,0182008 402,105 270,937 232,760 354,333 -14.39% 112,8872009 290,216 173,170 162,247 248,946 -29.74% 114,650
* The units included in this table are all residential properties in the Single Family Detached, Duplex, Townhouse and Condominium categories. Houses on commercially zoned or agricultural parcels and houses that were partially complete as of January 1, 2008 are not included. Tax exempt properties and parcels owned by homeowners associations are also not included. The difference between the unit counts in successive years does not always equal the number of new houses added since during reassessment some properties are reclassified to or from a non-residential type.
Average Assessed Value—All Residential
1999-2009
$0$50
$100$150$200
$250$300$350$400$450
$500
1999
2000
2001
2002
2003
2004
2005
2006
2007
2008
2009
Thou
sand
s
-40%
-30%
-20%
-10%
0%
10%
20%
30%
40%Average Overall Assessment% Change
A-5

Table 7: Assessed Values and Estimated Market Values
--------------Residential-------------- --------------Apartments-------------- -------------Commercial------------- Estimated Estimated Estimated Assessed Market Assessed Market Assessed Market
Year Value(1) Ratio (2) Value Value Ratio Value Value Ratio Value1999 11,098,693,500 92.67% 11,977,029,005 643,008,800 92.98% 691,556,034 2,257,215,900 91.72% 2,460,985,499
2000 12,227,392,600 88.74% 13,778,393,691 665,511,800 93.78% 709,652,165 2,473,855,100 89.57% 2,761,923,747
2001 13,995,424,800 82.38% 16,989,397,840 770,902,200 82.31% 936,583,890 2,797,877,700 75.35% 3,713,175,448
2002 17,609,309,900 81.81% 21,524,642,342 895,236,300 81.77% 1,094,822,429 3,135,551,700 74.21% 4,225,241,477
2003 22,066,665,100 82.24% 26,831,794,535 1,036,502,100 82.23% 1,260,491,426 3,279,610,800 82.23% 3,988,338,563
2004 27,573,301,100 76.54% 36,024,729,144 1,190,201,200 92.85% 1,281,853,743 3,868,983,500 71.59% 5,404,363,040
2005 36,143,674,500 74.99% 48,199,834,829 1,338,215,100 79.22% 1,689,238,955 4,721,937,700 63.98% 7,380,334,011
2006 48,617,154,300 94.22% 51,600,905,212 1,588,254,500 94.10% 1,687,836,876 5,667,015,500 69.51% 8,152,806,071
2007 48,185,629,400 100.22% 48,079,647,334 1,759,042,900 99.98% 1,759,394,779 6,592,385,200 81.45% 8,093,781,707
2008 41,980,642,100 84.77% 49,522,741,785 1,904,867,400 84.71% 2,248,692,480 7,595,527,900 74.99% 10,128,721,029 (1) Assessed values include landbook values plus all supplements. (2) Ratios are from the Department of Taxation Sales Ratio Study. Since the ratios for the two most current years are not available, estimates from the Real Estate Assessments Office are
reported.
Note: All ratios were updated. Where no ratio is calculated because of insufficient sales, the County average is used.
A-6

A-7
Table 7: Assessed Values and Estimated Market Values (cont.)
--------------Land------------- -----------------Public Service----------------- --------------------Totals--------------------
Use Estimated Estimated Public Estimated Total Total Total Total
Value Market Use Market Service Market Use Value Market Estimated Estimated
Year Assm't (3) Assm't Ratio Value Value Equal Ratio Value Assessment(4) Assessment Ratio Use Value Market Value
1999 421,488,000 675,241,100 92.98% 453,310,389 726,221,876 871,897,315 92.98% 937,725,656 15,292,303,515 15,546,056,615 92.57% 16,520,606,584 16,793,518,070
2000 378,120,400 630,189,000 86.95% 434,871,075 724,771,708 877,768,069 86.95% 1,009,508,993 16,622,647,969 16,874,716,569 88.89% 18,694,349,670 18,984,250,303
2001 337,530,000 580,149,200 82.31% 410,071,680 704,834,407 887,525,905 82.31% 1,078,272,269 18,789,260,605 19,031,879,805 81.26% 23,127,501,128 23,422,263,854
2002 249,277,100 489,995,100 81.77% 304,851,535 599,235,783 901,202,422 81.77% 1,102,118,652 22,790,577,422 23,031,295,422 80.68% 28,251,676,435 28,546,060,683
2003 227,277,000 584,102,700 82.23% 276,391,828 710,327,982 945,931,059 82.23% 1,150,347,877 27,555,986,059 27,912,811,759 82.24% 33,507,364,228 33,941,300,383
2004 257,785,900 640,776,800 54.48% 473,175,294 1,176,168,869 1,249,775,269 76.50% 1,633,693,162 34,140,046,969 34,523,037,869 75.84% 44,817,814,382 45,520,807,957
2005 282,495,500 794,170,400 62.95% 448,761,716 1,261,589,198 1,253,505,608 74.95% 1,672,455,781 43,739,828,408 44,251,503,308 73.50% 59,390,625,291 60,203,452,773
2006 428,529,800 1,053,937,000 94.10% 455,398,300 1,120,018,066 1,355,893,862 94.10% 1,440,907,399 57,656,847,962 58,282,255,162 91.06% 63,337,853,856 64,002,473,623
2007 305,616,500 1,027,365,700 49.92% 612,212,540 2,058,024,239 1,448,737,404 99.98% 1,449,027,209 58,291,411,404 59,013,160,604 96.05% 59,994,063,569 61,439,875,268
2008 273,037,400 964,462,500 84.71% 322,320,151 1,138,546,217 1,471,669,059 84.71% 1,737,302,631 53,225,743,859 53,917,168,959 83.24% 63,959,778,077 64,776,004,142 (3) Certain agricultural and forestal land is granted special use value assessment.
(4) Figures do not include rollbacks.
Note: All ratios were updated. Where no ratio is calculated because of insufficient sales, the County average is used.

A-8
Table 8: History of the Real Estate Tax Base*
Amount Percent Amount Percent Amount Percent Amount Percent
Residential 17,609$ 77.27 22,067$ 80.08 27,573$ 80.77 36,144$ 82.63
Apartments 895 3.93 1,037 3.76 1,190 3.49 1,338 3.06
Commercial/Ind. 3,136 13.76 3,280 11.90 3,869 11.33 4,722 10.80
Agricultural 249 1.09 227 0.82 258 0.76 282 0.65
Total Local 21,889 96.05 26,610 96.57 32,890 96.34 42,486 97.13
Public Service 901 3.95 946 3.43 1,250 3.66 1,254 2.87
Total 22,791$ 100.00 27,556$ 100.00 34,140$ 100.00 43,740$ 100.00
----------2005--------------------2002---------- ----------2004--------------------2003----------
Amount Percent Amount Percent Amount Percent Amount Percent
Residential 48,617$ 84.32 48,186$ 82.66 41,981$ 78.87 29,911$ 74.62
Apartments 1,588 2.75 1,759 3.02 1,905 3.58 1,801 4.49
Commercial/Ind. 5,667 9.83 6,592 11.31 7,596 14.27 6,747 16.83
Agricultural 429 0.74 306 0.52 273 0.51 216 0.54
Total Local 56,301 97.65 56,843 97.51 51,754 97.24 38,674 96.48
Public Service 1,356 2.35 1,449 2.49 1,472 2.76 1,413 3.52
Total 57,657$ 100.00 58,291$ 100.00 53,226$ 100.00 40,087$ 100.00
----------2006---------- ----------2008--------------------2007---------- ----------2009----------
*Assessments include original landbook plus supplements. Note: All amounts are in millions. Supplements are estimated for 2009.

A-9
Table 9: Public Service and Commercial/Industrial Assessments
As a Percentage of the Tax Base
2000 2001 2002 2003 2004 2005 2006 2007 2008 2009
Public Service 5.28% 4.72% 3.95% 3.43% 3.66% 2.87% 2.35% 2.49% 2.76% 3.52%
Commercial/Ind. 14.88% 14.89% 13.76% 11.90% 11.33% 10.80% 9.83% 11.31% 14.27% 16.83%
Apartments 4.00% 4.10% 3.93% 3.76% 3.49% 3.06% 2.75% 3.02% 3.58% 4.49%
Total 24.17% 23.72% 21.64% 19.10% 18.48% 16.72% 14.94% 16.81% 20.61% 24.85%
Notes: Supplements are included.
Supplements for 2009 are estimated.
0%
5%
10%
15%
20%
25%
Pe
rce
nta
ge
of T
ax B
ase
2000 2001 2002 2003 2004 2005 2006 2007 2008 2009
Commercial/Ind. Public Service Apartments

A-10
Table 10: Assessment Performance Statistics Level of Assessments(1)
2000 2001 2002 2003 2004 2005 2006 2007 (4) 2008 (4) Standard (3)
Residential Urban 89.31% 82.55% 81.81% 82.22% 76.47% 74.96% 94.36% 100.33% 84.87% 100.00%Residential Suburban 85.14% 80.98% 81.81% 82.44% 77.17% 75.25% 92.92% 99.44% 83.72% 100.00% Weighted Average (Residential) 88.74% 82.38% 81.81% 82.22% 76.54% 74.99% 94.22% 100.22% 84.77% 100.00%Apartment 86.95% 82.31% 81.77% 82.23% 92.85% 79.22% 94.10% 99.98% 84.71% 100.00%Commercial/Industrial 89.57% 75.35% 74.21% 82.23% 71.59% 63.98% 69.51% 81.45% 74.99% 100.00%Agricultural * * * * * * * * * 100.00%Overall Median 86.95% 82.31% 81.77% 82.23% 76.50% 74.95% 94.10% 99.98% 84.71% 100.00%
Equity of Assessments(2)
2000 2001 2002 2003 2004 2005 2006 2007 (4) 2008 Standard (3)
Residential Urban 6.46% 7.34% 8.52% 7.77% 9.39% 8.56% 7.08% 8.03% 12.41% 10.00%Residential Suburban 11.33% 12.55% 13.63% 10.80% 11.97% 12.78% 11.67% 12.61% 13.22% 10.00% Weighted Average (Residential) 7.12% 7.91% 9.04% 8.06% 9.65% 8.95% 7.53% 8.59% 12.48% 10.00%Apartment * * * * 23.19% 14.98% ** ** ** 15.00%Commercial/Industrial 22.86% 26.62% 28.61% ** 22.65% 28.43% 20.99% 21.49% 22.92% 15.00%Agricultural ** ** ** ** ** ** ** 9.08% 12.61% 20.00%Overall Equity 7.42% 8.25% 9.31% 8.09% 9.86% 9.17% 7.82% 9.08% 12.61% 10.00%
* Insufficient sales. ** Equity of Assessments data are unavailable. (1) "Assessment Level" refers to the median ratio of assessment to selling price as reported by the Department of Taxation. (2) "Equity of Assessments" is the average percentage sales deviate from the median ratio. (3) Standards are provided by the International Association of Assessing Officers. (4) Estimates utilizing state formula from the Assessments Office.
A-11
Table 11A: Growth and Appreciation
2007 to 2008 2007 --------Appreciation-------- ------------Growth------------ 2008 Total
Landbook Value Amount % Amount % Landbook Value ChangeResidential 47,855,657,000 -7,008,462,300 -14.65 958,825,200 2.00 41,806,019,900 -12.64Apartments 1,753,330,900 156,207,100 8.91 -4,670,600 -0.27 1,904,867,400 8.64
Total Residential 49,608,987,900 -6,852,255,200 -13.81 954,154,600 1.92 43,710,887,300 -11.89Commercial and Industrial 6,537,154,900 278,492,800 4.26 708,194,300 10.83 7,523,842,000 15.09Public Service(2) 1,448,737,404 8,444,281 0.58 14,487,374 1.00 1,471,669,059 1.58
Total Commercial and Industrial 7,985,892,304 286,937,081 3.59 722,681,674 9.05 8,995,511,059 12.64Undeveloped Land 304,657,700 -44,453,500 -14.59 11,187,100 3.67 271,391,300 -10.92
Total Assessed - Local 56,450,800,500 -6,618,215,900 -11.72 1,673,536,000 2.96 51,506,120,600 -8.76Total Assessed - Non-Local 1,448,737,404 8,444,281 0.58 14,487,374 1.00 1,471,669,059 1.58
Total Real Estate 57,899,537,904 -6,609,771,619 -11.42 1,688,023,374 2.92 52,977,789,659 -8.50Total Supplements 391,873,500 247,954,200Total Tax Base 58,291,411,404 -6,601,327,338 -11.32 1,702,510,748 2.92 53,225,743,859 -8.69Rollbacks** 5,829,295 96,066,340Tax Exempt 3,867,736,400 3,722,542,600 -3.75Deferred Use Value 721,749,200 691,425,100 -4.20
Total Assessed Value 62,886,726,299 57,735,777,899 -8.19 2008 to 2009
2008 --------Appreciation-------- ------------Growth------------ 2009 TotalLandbook Value Amount % Amount % Landbook Value Change
Residential 41,806,019,900 -12,453,771,100 -29.79 396,578,300 0.95 29,748,827,100 -28.84Apartments 1,904,867,400 -104,096,900 -5.46 0 0.00 1,800,770,500 -5.46
Total Residential 43,710,887,300 -12,557,868,000 -28.73 396,578,300 0.91 31,549,597,600 -27.82Commercial and Industrial 7,523,842,000 -1,144,008,100 -15.21 296,936,700 3.95 6,676,770,600 -11.26Public Service(2) 1,471,669,059 -73,583,453 -5.00 14,716,690 1.00 1,412,802,296 -4.00
Total Commercial and Industrial 8,995,511,059 -1,217,591,553 -13.54 311,653,390 3.46 8,089,572,896 -10.07Undeveloped Land 271,391,300 -52,205,700 -19.24 -4,749,500 -1.75 214,436,100 -20.99
Total Assessed - Local 51,506,120,600 -13,754,081,800 -26.70 688,765,500 1.34 38,440,804,300 -25.37Total Assessed - Non-Local 1,471,669,059 -73,583,453 -5.00 14,716,690 1.00 1,412,802,296 -4.00
Total Real Estate 52,977,789,659 -13,827,665,253 -26.10 703,482,190 1.33 39,853,606,596 -24.77Total Supplements 247,954,200 232,931,500Total Tax Base 53,225,743,859 -13,901,248,706 -26.12 718,198,880 1.35 40,086,538,096 -24.69Rollbacks** 96,066,340 8,250,825Tax Exempt 3,722,542,600 3,451,862,900 -7.27Deferred Use Value 691,425,100 496,543,200 -28.19
Total Assessed Value 57,735,777,899 44,043,195,021 -23.72
* All changes in Public Service are attributed to growth. The 2009 Public Service assessed value is an estimate made by the assessments office. ** Supplements and Rollbacks are estimated for 2009.

A-12
Table 11B: History of Appreciation Rates Public
Landbook Residential Apartments Commercial Service Land Overall2000 4.31% 3.24% 1.76% 0.67% -1.23% 3.49%2001 7.60% 9.05% 9.87% 1.11% 2.30% 7.47%2002 17.47% 10.78% 6.65% 1.54% 7.99% 14.57%2003 17.44% 12.27% 2.92% 4.96% 16.58% 15.11%2004 18.30% 11.07% 11.68% 32.12% 20.46% 17.21%2005 22.98% 6.89% 15.74% 0.30% 29.05% 21.58%2006 27.20% 11.88% 17.27% 8.17% 82.44% 25.97%2007 -3.83% 8.79% 10.93% 1.00% -3.99% -1.98%2008 -14.65% 8.91% 4.26% 0.58% -14.59% -11.42%2009 -29.79% -5.46% -15.21% 0.00% -19.24% -26.10%
Table 11C: History of Growth Rates
PublicLandbook Residential Apartments Commercial Service Land Overall
2000 5.71% 0.00% 7.89% 0.00% -7.16% 5.15%2001 6.60% 4.03% 2.88% 0.00% -13.31% 5.19%2002 8.25% 8.28% 6.20% 0.00% -33.82% 6.86%2003 8.25% 3.19% 1.65% 0.00% -25.97% 6.69%2004 6.55% 3.27% 5.92% 0.00% -6.34% 6.23%2005 8.22% 5.20% 5.86% 0.00% -22.42% 7.59%2006 7.79% 7.72% 3.44% 0.00% -26.75% 7.07%2007 3.57% 2.17% 5.30% 0.00% -24.82% 3.49%2008 2.00% -0.27% 10.83% 0.00% 3.67% -8.50%2009 0.95% 0.00% 3.95% 0.00% -1.75% 1.33%
Notes: These tables included Public Service properties in addition to the landbook categories. All changes in Public Service are attributed to growth. Public service figures for prior years were updated. Public Service for 2009 is estimated. These tables do not include supplements. These rates represent the effects of growth and appreciation from the prior year on the landbook for the year shown.

A-13
Table 11D: History of Appreciation and Inflation
0.00%0.00%
17.44%17.47% 18.30%
-5.00%
22.98%
27.20%
-3.83%
-14.65%
-29.79%
-10.00%
10.93%
17.27%
-15.21%
4.26%
-35%
-25%
-15%
-5%
5%
15%
25%
CY
80, F
Y82
CY
82, F
Y84
CY
84, F
Y86
CY
86, F
Y88
CY
88, F
Y90
CY
90, F
Y92
CY
92, F
Y94
CY
94, F
Y96
CY
96, F
Y98
CY
98, F
Y00
CY
00, F
Y02
CY
02, F
Y04
CY
04, F
Y06
CY
06, F
Y08
CY
08, F
Y10
CY
10, F
Y12
CY
12, F
Y14
CY of Value, FY of Revenue
Actual Residential Appreciation: Actual Avg. 5.8%, w ith Forecast, 4.7%
Inflation Rate, Annual Avg. 3.6%
FY09-13 Residential App. ForecastCommercial Appreciation

A-14
Table 12: Top Fifty Real Estate Taxpayers –FY2009
Rank Owner Name 2008
Assessment% of Tax
Base Rank Owner Name 2008 Assessment
% of Tax Base
1 VA ELECTRIC & POWER COMPANY 711,527,541$ 1.343% 26 POTOMAC FESTIVAL LTD PTNSHP 56,706,800$ 0.107%2 MALL AT POTOMAC MILLS LLC 482,954,200 0.912% 27 BANK OF NEW YORK TR 56,285,900 0.106%3 NORTHERN VIRGINIA ELECTRIC CO-OP 270,425,602 0.510% 28 LCOR RAVENS CREST LLC 55,046,600 0.104%4 VERIZON SOUTH INC. 160,498,891 0.303% 29 WOODBRIDGE FORD PARTNERS II LLC 53,700,900 0.101%5 DOMINION COUNTRY CLUB LP 130,069,100 0.246% 30 IBV-IMMOBILIENFONDS INT'L 2 USA LP 53,532,600 0.101%6 WNH LIMITED PARTNERSHIP 113,684,100 0.215% 31 ROSEMARY RIDGE LLC 53,149,900 0.100%7 DEUTSCHE BANK NATIONAL TRUST COMPANY 108,747,800 0.205% 32 PRINCETON COMMONS APARTMENTS LTD PTS 51,906,500 0.098%8 STELLAR CHATSWORTH LLC 107,566,300 0.203% 33 UNIVERSITY VILLAGE LLC 50,695,400 0.096%9 BROOKFIELD MORRIS LLC 105,951,000 0.200% 34 SUMMERLAND HEIGHTS LP 50,652,300 0.096%10 WASHINGTON GAS LIGHT COMPANY 99,454,302 0.188% 35 GAINESVILLE ASSOCIATES LLC 49,331,300 0.093%11 TR ROLLING BROOK CORP 94,885,000 0.179% 36 MAGAZINE CARLYLE STATION LP 48,633,100 0.092%12 KIR SMOKETOWN STATION LP 94,294,700 0.178% 37 DALE FOREST INVESTMENTS L L C 48,090,100 0.091%13 PRINCE WILLIAM SQUARE INVESTORS LLC 78,967,700 0.149% 38 SAUL HOLDINGS LIMITED PARTNERSHIP 47,296,800 0.089%14 LEE CAROLINA LLC 77,861,600 0.147% 39 HYLTON CECIL D ESTATE 46,439,300 0.088%15 VIRGINIA GATEWAY RETAIL LC 77,612,600 0.147% 40 PULTE HOME CORPORATION 46,198,100 0.087%16 MANASSAS OWNER LLC 73,567,900 0.139% 41 WASHINGTON HOMES INC OF VA 45,179,100 0.085%17 US BANK NATIONAL ASSN TR 72,354,300 0.137% 42 MCI WORLDCOM NETWORK SERVICES, INC. 44,238,861 0.084%18 BULL RUN PLAZA LLC 72,147,300 0.136% 43 TANGLEWOOD APARTMENTS LLC 44,079,500 0.083%19 UNITED DOMINION REALTY TRUST INC 67,424,000 0.127% 44 WELLS FARGO BANK NA TR 43,792,900 0.083%20 BIG CREST LANE LLC 64,066,900 0.121% 45 WINDSOR POTOMAC VISTA LTD PTNSHP 43,606,000 0.082%21 D R HORTON INC 61,595,200 0.116% 46 TARGET CORPORATION 43,524,000 0.082%22 AOL LLC 60,405,700 0.114% 47 SRK MISTY RIDGE ASSOCS LTD PTNSHP 43,168,200 0.081%23 PORPOISE VENTURES LLC 59,883,500 0.113% 48 ATLAS WALK LC 43,131,200 0.081%24 WESTGATE APARTMENTS LMTD PARTNRSHP 59,518,400 0.112% 49 M/I HOMES OF DC LLC 42,941,700 0.081%25 WESTMINSTER PRESBYTERIAN RETIREMEN 58,190,600 0.110% 50 BAYVUE APARTMENTS JOINT VENTURE 42,904,400 0.081%
Top 50 as a % of Total Landbook: 8.62%
Total 2008 Landbook Plus Public Service Assessments: $52,977,789,659
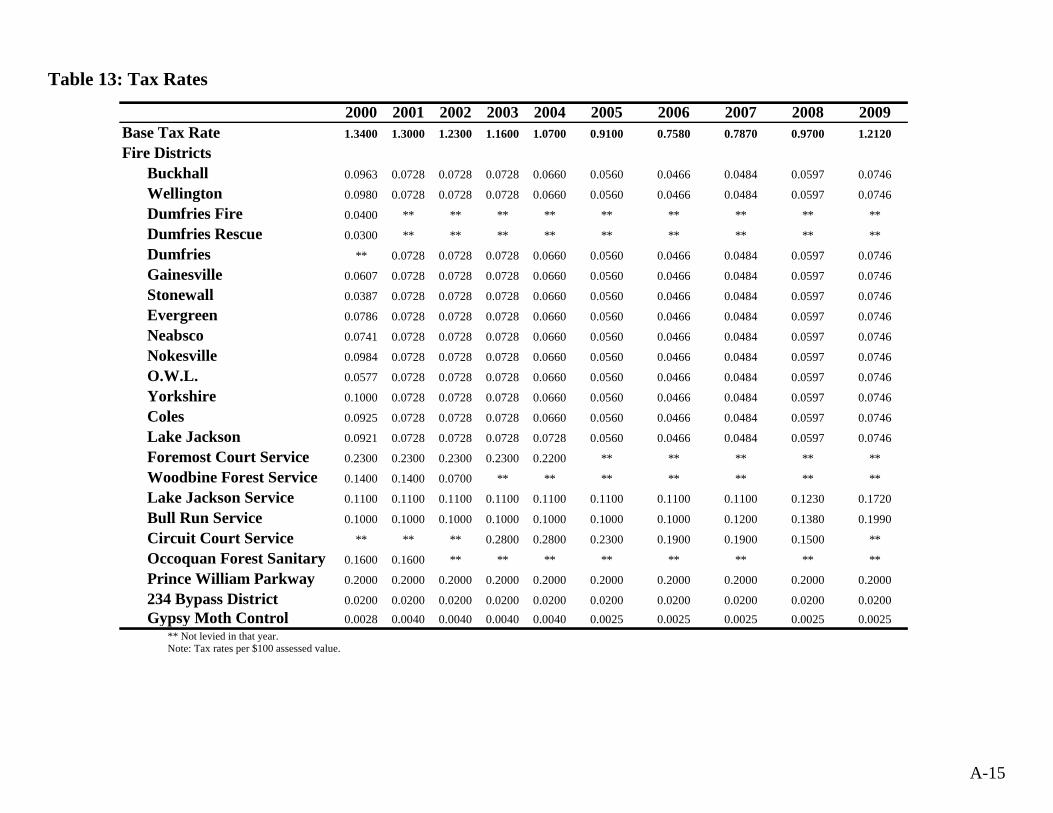
A-15
2000 2001 2002 2003 2004 2005 2006 2007 2008 2009Base Tax Rate 1.3400 1.3000 1.2300 1.1600 1.0700 0.9100 0.7580 0.7870 0.9700 1.2120
Fire DistrictsBuckhall 0.0963 0.0728 0.0728 0.0728 0.0660 0.0560 0.0466 0.0484 0.0597 0.0746
Wellington 0.0980 0.0728 0.0728 0.0728 0.0660 0.0560 0.0466 0.0484 0.0597 0.0746
Dumfries Fire 0.0400 ** ** ** ** ** ** ** ** **
Dumfries Rescue 0.0300 ** ** ** ** ** ** ** ** **
Dumfries ** 0.0728 0.0728 0.0728 0.0660 0.0560 0.0466 0.0484 0.0597 0.0746
Gainesville 0.0607 0.0728 0.0728 0.0728 0.0660 0.0560 0.0466 0.0484 0.0597 0.0746
Stonewall 0.0387 0.0728 0.0728 0.0728 0.0660 0.0560 0.0466 0.0484 0.0597 0.0746
Evergreen 0.0786 0.0728 0.0728 0.0728 0.0660 0.0560 0.0466 0.0484 0.0597 0.0746
Neabsco 0.0741 0.0728 0.0728 0.0728 0.0660 0.0560 0.0466 0.0484 0.0597 0.0746
Nokesville 0.0984 0.0728 0.0728 0.0728 0.0660 0.0560 0.0466 0.0484 0.0597 0.0746
O.W.L. 0.0577 0.0728 0.0728 0.0728 0.0660 0.0560 0.0466 0.0484 0.0597 0.0746
Yorkshire 0.1000 0.0728 0.0728 0.0728 0.0660 0.0560 0.0466 0.0484 0.0597 0.0746
Coles 0.0925 0.0728 0.0728 0.0728 0.0660 0.0560 0.0466 0.0484 0.0597 0.0746
Lake Jackson 0.0921 0.0728 0.0728 0.0728 0.0728 0.0560 0.0466 0.0484 0.0597 0.0746
Foremost Court Service 0.2300 0.2300 0.2300 0.2300 0.2200 ** ** ** ** **
Woodbine Forest Service 0.1400 0.1400 0.0700 ** ** ** ** ** ** **
Lake Jackson Service 0.1100 0.1100 0.1100 0.1100 0.1100 0.1100 0.1100 0.1100 0.1230 0.1720
Bull Run Service 0.1000 0.1000 0.1000 0.1000 0.1000 0.1000 0.1000 0.1200 0.1380 0.1990
Circuit Court Service ** ** ** 0.2800 0.2800 0.2300 0.1900 0.1900 0.1500 **
Occoquan Forest Sanitary 0.1600 0.1600 ** ** ** ** ** ** ** **
Prince William Parkway 0.2000 0.2000 0.2000 0.2000 0.2000 0.2000 0.2000 0.2000 0.2000 0.2000
234 Bypass District 0.0200 0.0200 0.0200 0.0200 0.0200 0.0200 0.0200 0.0200 0.0200 0.0200Gypsy Moth Control 0.0028 0.0040 0.0040 0.0040 0.0040 0.0025 0.0025 0.0025 0.0025 0.0025
** Not levied in that year. Note: Tax rates per $100 assessed value.
Table 13: Tax Rates

This page intentionally left blank

Addenda

This page intentionally left blank

B-3
Addendum A: Sample Notice of Reassessment

B-4
Addendum A: Sample Notice of Reassessment (cont.)

B-5
Addendum B: Tax Savings for Rehabilitated Properties

B-6
Addendum B: Tax Savings for Rehabilitated Properties (cont.)

B-7
Addendum C: Tax Relief Programs for Elderly and Disabled Persons
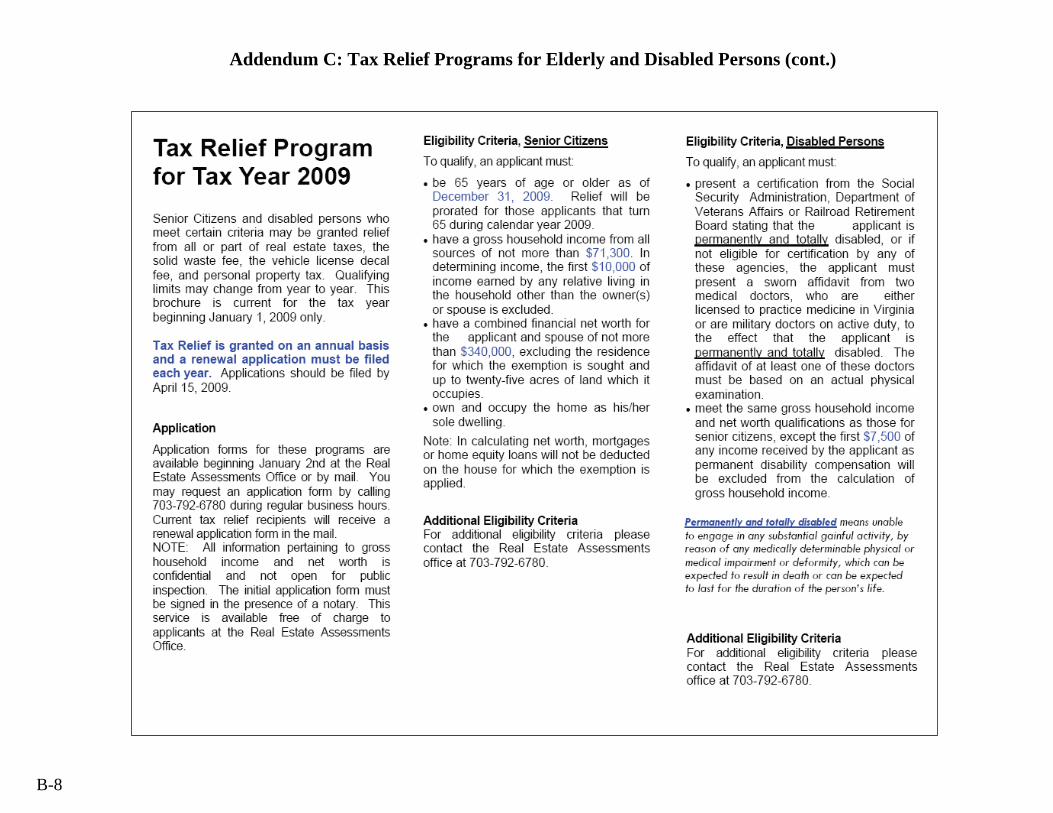
Addendum C: Tax Relief Programs for Elderly and Disabled Persons (cont.)
B-8

B-9
Addendum D: Sample Tax Bill

This page intentionally left blank

