real effects of financial reporting quality and ... · real effects of financial reporting quality...
TRANSCRIPT
Real Effects of Financial Reporting Quality and Credibility: Evidence from the PCAOB Regulatory Regime
Nemit Shroff
Massachusetts Institute of Technology [email protected]
Current draft: October, 2015 Comments welcome
Abstract: I examine whether financial reporting quality and credibility affect a company’s financing and investment decisions. I use PCAOB inspections of non-U.S. auditors as exogenous shocks to the reporting quality of non-U.S. companies audited by PCAOB inspected auditors. I then use the subsequent public revelation of the inspection as exogenous shocks to the reporting credibility of non-U.S. companies that employ PCAOB inspected auditors. Using a difference-in-differences design, I find that although PCAOB inspections improve accrual quality for non-U.S. companies audited by the inspected auditors, there is no evidence that these improvements in accrual quality lead to changes in investment, investment efficiency or debt financing. However, I find that when PCAOB inspection reports are subsequently made public, non-U.S. companies audited by PCAOB inspected auditors increase their long-term debt (investment) by 11.5% (10.9%) and become more responsive to their investment opportunities. These effects are stronger for financially constrained companies and companies with non-big four auditors. Overall, the evidence in this paper suggests that regulatory oversight of the auditor helps improve reporting credibility, which in turn facilitates corporate investment by increasing companies’ external financing capacity.
I thank Daniel Aobdia, Beth Blankespoor, Lisa De Simone, Michelle Hanlon, Jonas Heese (discussant), Becky Lester, Rodrigo Verdi, and seminar participants at the Dartmouth Accounting Research Conference, PCAOB Center for Economic Analysis, Stanford University, and University of North Carolina for many helpful comments and suggestions. I thank Niketa Shroff for help with data collection. I gratefully acknowledge financial support from the MIT Junior Faculty Research Assistance Program. All errors are my own.

1
1. Introduction
In this paper, I examine (i) whether financial reporting quality affects a company’s
financing and investment decisions, and (ii) holding reporting quality constant, whether financial
reporting credibility affects a company’s financing and investment decisions. I define reporting
quality as the extent to which financial statements reflect the underlying economic performance
of a company, and reporting credibility as the faith investors have in the accuracy of the financial
statements presented to them. From a theoretical perspective, one of the primary purposes of
financial reporting is to facilitate capital allocation by increasing contracting efficiency and
reducing information asymmetry among capital market participants (Watts and Zimmerman
1978; Kothari et al. 2010). Improvements in reporting quality serve to provide investors with
more accurate information and thus can reduce information asymmetry and increase contracting
efficiency. Thus, improvements in reporting quality can increase a company’s access to external
finance and ultimately lead to increases in investment and investment efficiency.
Aside from reporting quality, the extent to which investors rely on the information
reported in financial statements depends on the credibility of those financial statements.
Typically, companies establish the credibility of their financial statements by having an
independent auditor verify the accuracy of those disclosures. However, the effect of auditing on
financial statement credibility depends on the independence of the auditor and the rigor with
which the audit is performed (Watts and Zimmerman 1983; DeFond and Zhang 2014). An
increase in reporting credibility can increase the degree to which investors rely on financial
statement information for both contracting and learning about companies’ operations and
performance, which can increase the company’s access to external finance and
investment/investment efficiency.
Empirically, it is very challenging to identify the economic effects of reporting quality
and credibility because differences in reporting quality across companies (or over time) can be

2
due to differences in the underlying economic reality rather than its measurement (Leuz and
Wysocki 2015). Although a number of recent papers document associations between reporting or
disclosure quality and investment efficiency (see e.g., Biddle and Hilary 2006; McNichols and
Stubben 2008; Biddle et al. 2009; Chen et al. 2011; Balakrishnan et al. 2014), the lack of an
instrument or setting to isolate exogenous changes in reporting quality limits the extent to which
the results of these studies can be interpreted as causal (Leuz and Wysocki 2015). Further,
isolating the economic effect of reporting credibility is especially challenging because, in
addition to typical endogeneity concerns, changes in reporting credibility are almost always
accompanied by changes in reporting quality (or the amount of disclosure). Thus, the economic
effects of reporting credibility are typically confounded by those of reporting quality/quantity.
To overcome the above empirical challenge, I use a natural experiment that first leads to
improvements in reporting quality, which is followed by a subsequent increase in reporting
credibility. In 2005, the Public Company Accounting Oversight Board (PCAOB) began
inspecting non-U.S. auditors that audited one or more companies registered with the Securities
Exchange Commission (SEC) (i.e., a U.S. public company or cross-listed foreign company). My
empirical tests (and concurrent work by Fung et al. 2015) show that these PCAOB inspections of
non-U.S. auditors increase the reporting quality of all clients audited by the non-U.S. auditor,
even those companies not registered with the SEC and thus not subject to any SEC/PCAOB
regulation. That is, PCAOB inspections of non-U.S. auditors essentially lead to reporting quality
spill-over effects for non-U.S. companies audited by these inspected auditors. I use this
observation as the main catalyst for my analyses and research design, which are as follows.
First, I construct a sample of non-U.S. companies that are audited by PCAOB-inspected
auditors but are not directly subject to any SEC/PCAOB regulation. These companies serve as
my treatment sample because their reporting quality improves following the PCAOB inspection
of their auditor. Second, I construct a sample of matched control companies that are observably
3
similar to the treatment companies in terms of the determinants of investment and financing but
are not affected by PCAOB inspections because their auditor does not audit any SEC registered
company (see Figure 1 for an illustration of the manner in which I identify treatment and control
companies). Finally, I exploit the fact that the PCAOB inspection reports of non-U.S. auditors
are not publicly disclosed for several months after the completion of the inspection (the average
delay is 863 days in my sample). Improvements in reporting quality for clients of PCAOB-
inspected auditors occur soon after the completion of the PCAOB inspection. However, the
public disclosure of the PCAOB inspection and the associated increases in reporting credibility
that follow such a disclosure occur much later than the changes in reporting quality, thereby
allowing me to separately analyze the economic effects of reporting quality and credibility.1
The PCAOB international inspection setting offers a number of unique advantages that
allow me to identify the economic effects of reporting quality and credibility using a difference-
in-differences design (see Figure 2 for a graphical illustration of the research design). First, since
my treatment sample is comprised exclusively of non-U.S. companies that are free of SEC
regulation, any economic consequences of better reporting accruing to these companies are not
confounded by the effects of other U.S. regulation. Second, the control sample is comprised of
companies that operate in the same country as the treatment companies and thus are subject to
the same economic and regulatory environment as the treatment companies.2 Third, the PCAOB
inspections are staggered over time and thus affect different companies at different points in
time. As a result, the benchmark companies not only include companies whose auditors go
untreated altogether but also companies whose auditors are not yet treated by the PCAOB
1 Empirical tests confirm that companies audited by PCAOB-inspected auditors benefit from an improvement in reporting quality soon after the PCAOB inspection but there is no further effect on reporting quality upon public disclosure of the PCAOB inspection. 2 A similar research design is not viable in a U.S. setting because all auditors of U.S. public companies are subject to PCAOB inspections, precluding me from constructing a sample of treatment and control companies from the same country. Further, the inspection program went into effect simultaneously with other provisions of SOX, making it difficult to identify the cause of any change in firm behavior (Coates and Srinivasan 2014; Leuz and Wysocki 2015).
4
inspection (or inspection report). Fourth, PCAOB inspections are likely to have a larger effect on
reporting quality and credibility of non-U.S. companies (relative to U.S. companies) because the
base-line disclosure and governance environment in other countries is typically poorer than that
in the U.S. (Leuz and Verrecchia 2000). Finally, using PCAOB inspections as shocks to
reporting quality/credibility side steps the need to explicitly measure these constructs, which are
notoriously hard to do, increasing the power of my design (Leuz and Wysocki 2015).
Before proceeding, note that throughout this paper I refer to public accounting firms that
conduct audits as either “auditors” or “audit firms,” and the companies that receive audits as
“clients” or “companies” for expositional clarity.
My tests reveal that treatment companies observe an increase in their accruals quality
(measured using the Jones (1991) and Dechow and Dichev (2002) models) following the
PCAOB inspection of their auditor; however, there is no significant change in the treatment
companies’ debt, investment, and investment efficiency following the PCAOB inspection of
their auditor. These initial results do not support the hypothesis that reporting quality affects a
company’s financing and investment behavior, which is in contrast to prior evidence
documenting a positive association between reporting quality proxies and investment efficiency.
Next, I examine whether the public revelation that a company’s auditor was inspected by
the PCAOB leads to an increase in financing and investment. Consistent with my prediction, I
find that treatment companies significantly increase their long-term debt and investment and
become more responsive to their growth opportunities following the public disclosure that their
auditor was inspected by the PCAOB. In terms of economic magnitude, the coefficients imply
that treatment companies increase debt by approximately 11.5% and investment by
approximately 10.9% following the disclosure of their auditor’s PCAOB inspection report. I
interpret these results as suggesting that the disclosure of PCAOB inspection reports increase the
financial statement credibility of companies audited by PCAOB-inspected auditors. This increase
5
in reporting credibility allows companies to obtain more external financing, which leads to an
increase in investment and the responsiveness of investment to investment opportunities.
The main assumption of my difference-in-differences design is that the investment and
financing behavior of the treatment and control companies would have trended similarly had it
not been for the PCAOB inspections/reports. I empirically show that this parallel trends
assumption is satisfied in the pre-treatment years. To further validate my inferences, I also
conduct two cross-sectional tests. First, I examine whether the economic effects of disclosing
PCAOB inspection reports are stronger for financially constrained companies relative to that for
unconstrained companies. To the extent PCAOB inspections increase reporting credibility and
thus a company’s access to external finance, the inspection report is likely to be more beneficial
for financial constrained companies, which is exactly what I find. Second, I examine whether the
PCAOB induced effects are stronger for companies audited by less reputed auditors (i.e., non-big
four auditors). Given that the big four auditors are internationally known and reputed, the
incremental credibility benefit to their clients from a PCAOB inspection is likely to be smaller
compared to that for clients of non-big four auditors. Here again, my tests confirm the above
prediction: PCAOB inspection reports have a stronger effect on the investment behavior of
companies audited by a non-big four auditor.
The evidence in this paper is important for three reasons. First, my analyses document
and quantify the importance of reporting credibility in the capital allocation process. By its very
nature, reporting credibility (i.e., the faith investors have in the accuracy of financial statements)
is unobservable, in large part because the audit process conducted to verify the accuracy of
financial statements is unobservable. Given the unobservable nature of reporting credibility,
empirically identifying the benefits of credibility is challenging and my paper lends support to
the importance of this construct.
6
Second, the results in this paper shed light on the importance of public oversight of
auditors in capital allocation process. One of the primary purposes of auditing is to assure
investors that the financial statements of a company are accurate and prepared in accordance
with a set of rules. However, since auditors are hired by companies (in most countries) and the
auditing process is mostly unobservable, the extent to which investors rely on the audited reports
often depends on ex post mechanisms such as the ability to sue auditors or the loss in auditor
reputation in the event of an audit failure. In such a setting, it is plausible that a regulator could
help increase the value of an audit. However, the effectiveness of regulation is not ex ante
obvious because of concerns such as regulatory capture by special interest groups (e.g., the big
four auditors). My results contribute to the literature on regulation by showing that having a
public regulator oversee the auditing process can be beneficial in terms of increasing reporting
credibility and ultimately facilitating company financing and investment.
Finally, the results in this paper call into question the interpretation of the growing body
of evidence documenting an association between reporting quality and investment efficiency
(e.g., Biddle and Hilary 2006; McNichols and Stubben 2008; Biddle et al. 2009; Chen et al.
2011; Balakrishnan et al. 2014). While it is certainly possible that my setting or analyses is not
powerful enough to document this association; at its face value, the results in this paper suggest
that improvements in reporting quality on its own might not be sufficient to reduce financing
frictions and facilitate investment. Rather, the results suggest that along with improvements in
reporting quality, companies need to convince investors of the credibility of those numbers
before they derive any economic benefits.3
Before proceeding, it is important to note that my analyses are based on a sample of non-
U.S. companies that operate in countries with weaker regulatory environments than the U.S. 3 A related body of research also finds that financial reporting affects investment and investment efficiency of peer companies (e.g., Durnev and Mangen 2009, Badertscher et al. 2013, Shroff et al. 2014). The evidence in this paper does not speak to this related area of research on disclosure and investment because they concern peer companies rather than the effect of reporting quality/quantity on disclosing company’s behavior.
7
(e.g., India and Japan). Thus I suggest caution generalizing the results of this paper to companies
operating in U.S. At a minimum, the economic magnitudes of the credibility effects documented
in this paper are likely to be smaller for companies operating in more stringent regulatory
environments such as the U.S.
The rest of the paper proceeds as follows. Sections 2 and 3 discuss my hypotheses,
setting and data. Section 4 presents the research design and results, and Section 5 concludes.
2. Institutional Setting and Hypotheses
2.1. PCAOB’s International Inspection Program and Related Research
The Public Company Accounting Oversight Board (PCAOB) was established in 2002 via
Section 101 of the Sarbanes-Oxley Act (SOX). Section 104 of SOX requires the PCAOB to
inspect the auditing procedures of all public accounting firms (i.e., auditors) that issue audit
reports opining on the financial statement of SEC registered companies.4, 5 Companies that
access U.S. capital markets, even if located abroad, are required to comply with all SEC
requirements, including periodic filing of audited financial statements and SEC registration. As a
result, non-U.S. auditors of SEC registered companies located abroad are subject to PCAOB
inspections. Under SOX and the PCAOB’s rules, non-U.S. audit firms are subject to PCAOB
inspections “in the same manner and to the same extent” as U.S. based audit firms (SOX Section
106). PCAOB commenced its inspection of non-U.S. audit firms in 2005. Auditors that issue
audit reports for more than 100 SEC registered companies (i.e., issuers) are subject to annual
inspections; auditors that issue an audit report for at least one but no more than 100 issuers are
subject to triennial inspections.
4 SEC registered companies are essentially (i) all public U.S. companies, (ii) foreign companies listed (or cross-listed) on the major U.S. stock exchanges and (iii) private companies that raise public debt. 5 The PCAOB might also inspect auditors that play a substantial role in preparing (but do not issue) audit reports of an SEC registered company or its foreign subsidiary (SOX Section 106(a), PCAOB Rule 2100 and 4000).
8
Before the start of an inspection, the PCAOB staff notifies the audit firm of when it plans
to conduct the inspection. It also requests information such as the list of audits of SEC registered
companies performed by the auditor, the personnel performing those audits, and the audit firm’s
quality control program. In most cases, the inspection fieldwork occurs at the audit firm. PCAOB
inspections involve two parts: (i) an analysis of the audits performed by the audit firm and, (ii) an
examination of the audit firm’s quality control systems.
For the first part of the inspection, the PCAOB may review all the audit engagements (of
SEC registered companies) of smaller audit firms that have only a few engagements. For larger
audit firms, the PCAOB inspectors select audit engagements for inspection based on a risk-
weighted system. An inspection typically does not cover the entire audit engagement (i.e., the
PCAOB does not re-do the audit), but rather concentrates on areas that appear to the inspectors
to present significant challenges (PCAOB Release No. 2013-001). For each audit selected, the
inspection team meets with the audit engagement team and examines the audit work papers. The
inspectors’ goal is to analyze how the audit was performed and to answer key questions such as:
(i) does the auditor follow the procedures required under the PCAOB’s auditing standards, (ii)
did the auditor identify any areas in which the financial statements did not conform to GAAP in
a material respect and how the auditor handled potential adjustments to the financial statements
in such cases, and (iii) are there any indications that the auditor is not independent. Overall, the
purpose of such an examination of the audit work papers is to “identify and address weaknesses
and deficiencies related to how a firm conducts audits” (PCAOB Annual Report 2012).
The second part of the inspection concerns the audit firm’s quality control system.
Examples of the types of issues that are addressed include: (i) review of management structure
and processes, including the tone at the top (e.g., whether management instills in its employees a
9
culture of commitment to integrity, independence, and audit quality) (ii) review of partner
management (e.g., processes for partner evaluation, compensation, admission to partnership, and
disciplinary actions) (iii) review of the firm’s processes for monitoring audit performance (e.g.,
how the audit firm identifies, evaluates, and responds to possible indicators of deficiencies in its
performance of audits) and (iv) review of engagement acceptance and retention such as policies
and procedures for identifying and assessing the risks involved in accepting or continuing audit
engagements (see PCAOB Annual Report 2012).
Upon competition of each inspection, the PCAOB prepares a written report on the
inspection and subsequently makes portions of the reports available to the public, subject to
statutory restrictions on public disclosure. Specifically, the public portion of the inspection
reports describes audit deficiencies found within the sample of audit engagements examined by
PCAOB inspectors. These deficiencies typically concern instances where the auditor failed to
gather sufficient audit evidence to support an audit opinion (see PCAOB Release No. 2012-003).
However, the report does not divulge any deficiencies in the quality control systems of the
inspected audit firm, so long as the audit firm satisfactorily addresses concerns raised by the
PCAOB within one year of the issuance of the inspection report (SOX Section 104).
A number of recent studies examine the effects of PCAOB inspections on audit and
reporting quality and the overall audit market. The research on this topic can be broadly
classified into two groups, one that examines the effects of PCAOB’s inspection program in the
U.S., and another that examines the effects of PCAOB’s international inspection program. Prior
research finds mixed evidence on whether PCAOB inspections of U.S. auditors improve
audit/reporting quality and whether PCAOB inspections are valued by investors. For example, on
one hand, Gramling et al. (2011) find that PCAOB inspections lead to an increase in the number
10
of going concern opinions issued by inspected auditors; DeFond and Lennox (2011) find that
PCAOB inspections incentivize lower quality auditors to exit the market, thereby improving
average audit quality in the U.S.; and Abbott et al. (2013) find that auditors criticized by the
PCAOB for having GAAP deficiencies in their audits are replaced by auditors without such a
criticism. On the other hand, the results above apply only to smaller audit firms that are inspected
triennially even though the vast majority of public companies in the U.S. are audited by one of
the larger national auditing firms. Further, Lennox and Pittman (2010) provide evidence
suggesting that PCAOB inspections are uninformative about audit quality. Most recently, Gipper
et al. (2015) use a clever difference-in-differences design that exploits the staggered nature of
PCAOB inspections within the U.S. to show that PCAOB inspections increase earnings
credibility (measured using short-window earnings response coefficients) for both big-four and
smaller U.S. auditors, thereby tilting the evidence towards concluding that PCAOB inspections
have a positive effect of on financial reporting even in the U.S.
The evidence on whether PCAOB’s inspection of non-U.S. auditors improves client
audit/reporting quality is relatively more consistent. Carcello et al. (2011) document negative
stock market reactions to a series of disclosures by the PCAOB relating to its difficulties in
conducting inspections of auditors located in the European Union, Switzerland, China, and Hong
Kong. Lamoreaux (2013) finds that non-U.S. auditors are more likely to issue going concern
opinions and report internal control weaknesses following an increase in the threat of a PCAOB
inspection. Krishnan et al. (2014) find that the clients of PCAOB inspected non-U.S. auditors
have lower abnormal accruals and more value relevant earnings post-inspection.6
In contrast to prior research, my tests exclusively focus on non-U.S. companies that are
not listed on a U.S. exchange and as such free of SEC regulation. The auditors of these non-U.S.
6 See Abernathy et al. (2013), DeFond and Zhang (2014) and Donovan et al. (2014) for reviews of the literature.
11
companies are inspected by the PCAOB because one (or more) of their clients is registered with
the SEC. In other words, I examine whether PCAOB inspections of non-U.S. auditors affects the
financing/investment decisions of their non-U.S. clients not subject to SEC oversight (see Figure
1). Thus, my tests require that PCAOB inspections lead to improvements in the overall auditing
practices of non-U.S. auditors at the audit firm-level as opposed to the client-level. A concurrent
working paper by Fung et al. (2015) finds that non-U.S. companies, even though not subject to
SEC oversight, have lower discretionary accruals and a lower likelihood of reporting a small
profit following the PCAOB inspection of their auditor. Their results support the notion that
PCAOB inspections have spillover effects on the audit quality of all clients of inspected auditors.
2.2. Hypothesis Development
Information asymmetry between managers and investors, as well as among investors, is
one of the most important frictions affecting capital markets around the world. Since managers
are better informed than investors about the future prospects of their companies, the decision to
issue equity (or pay a higher interest rate) introduces adverse selection concerns for investors
(Stiglitz and Weiss 1981; Myers and Majluf 1984). Further, since managers and investors often
have different objective functions, and managerial actions are at best imperfectly observed,
investors also face moral hazard concerns (Jensen and Meckling 1976).
To reduce these information asymmetry frictions, companies disclose financial
information on a periodic basis and have an independent outside party audit those disclosures.
These periodic financial statements reduce information frictions by serving as a platform to write
contracts on, and by providing investors with information about the operations of companies.
Prior research finds that better quality financial statements increases contracting efficiency and
reduces information asymmetry frictions (see Armstrong et al. (2010) for a literature review).

12
Building on the notion that financial reporting reduces financing frictions, prior research
argues that higher quality reporting increases investment efficiency by (i) reducing the cost of
capital and (ii) facilitating external investor monitoring. Consistent with these arguments, a
growing body of research documents an association between reporting quality and investment
efficiency (e.g., Biddle et al. 2009; Chen et al. 2011; Balakrishnan et al. 2014). These studies are
an important first step to documenting the effect of reporting quality on investment. However, as
Leuz and Wysocki (2015) discuss, prior studies examining the real effects of reporting quality
use cross-sectional variation to estimate the links to investment, and therefore more research is
needed to establish the relation between reporting quality and investment.
I argue that the PCAOB inspections of non-U.S. auditors serve as exogenous
improvements to the financial reporting quality of all clients of the inspected auditors, including
those not subject to SEC regulation. This argument is supported by the empirical evidence in
Fung et al. (2015) and additional tests in this paper. Further, the idea that PCAOB inspections
improve reporting quality of the clients of inspected auditors is in line with the PCAOB’s main
objective to improve audit quality, and by extension, financial reporting quality.7 In fact, the
PCAOB believes that its inspections lead to an immediate improvement in audit/reporting
quality. For example, Mark Olson, a former chairman of the PCAOB, testified to the U.S. House
of Representatives Committee on Financial Services that, “When [PCAOB] inspectors find an
7 Keeping in line with the objective to improve audit/reporting quality, the PCAOB takes a supervisory approach to oversight and incentivizes auditors to improve their practices and procedures. For example, if the inspection team identifies a facet of an audit that it believes may not have been performed in accordance with PCAOB standards, it initiates a dialogue with the audit firm. If the inspectors’ concerns cannot be resolved through discussion, the team will issue a “comment form” requesting the audit firm to respond in writing to those concerns. The comment form process provides an opportunity for the audit firm to present its views on aspects of the audit that the inspectors have questioned. Similarly, every PCAOB inspection report that includes a quality control criticism alerts the audit firm to the opportunity to prevent the criticism from becoming public. The inspection report specifically encourages the firm to initiate a dialogue with the PCAOB’s inspection staff about how the audit firm intends to address the criticisms (PCAOB Release No. 104-2006-077). Thus audit firms inspected by the PCAOB are likely to improve audit quality and consequently, their client’s financial reporting quality.

13
audit that is not satisfactory, they discuss with the [audit] firm precisely what the deficiency is.
Often this dialogue leads to immediate corrective action” (Olson 2006).8 Consistent with these
arguments, Hermanson et al. (2007), Church and Shefchik (2012), and the PCAOB (see Release
No. 2013-001) document a decline in the number of audit deficiencies identified over time,
suggesting that audit firms work towards addressing PCAOB’s concerns.
Inspected audit firms have strong incentives to address PCAOB’s concerns because
failure to do so could lead to disciplinary actions that impose significant costs on the auditor
(Boone et al. 2015). Even non-U.S. auditors face litigation risk under Rule 10b-5 of the
Securities Exchange Act if they audit an SEC registered company and fail to comply with
PCAOB (or SEC) rules. For example, PCAOB imposed a $1.5 million fine on PwC India for its
failure to comply with PCAOB rules in connection with the audit of Satyam Computer Services
– an Indian company cross-listed in the U.S. In addition to imposing monitory penalties, the
PCAOB can bar an auditor from accepting new SEC registered clients or even completely
prohibit the auditor from auditing any SEC registered client. Given these incentives to address
both engagement-level deficiencies and audit firm-level quality control deficiencies identified by
the PCAOB, it is likely that PCAOB inspections lead to improvements in audit and reporting
quality, especially for non-U.S. auditors. This discussion leads to my first hypothesis.
H1: PCAOB auditor inspections improve financial reporting quality of the inspected auditors’ clients, which reduces financing frictions faced by clients and thus increases external financing, investment, and investment efficiency.
Financial statements are valuable as a contracting tool or as an information source only to
the extent investors perceive the information reported in those statements as being credible. One
8 Similarly, in his April 2005 testimony to the U.S. House of Representatives Committee on Financial Services, William McDonough, former Chairmen of the PCAOB indicated that auditor inspections are the PCAOB’s primary vehicle for improving audit practice. Specifically, he stated that, “I want to emphasize the unique importance of the PCAOB’s inspection function…Through inspections we can assess claims that auditors do not seem to be making good decisions, ascertain the cause, and then do something about it.”
14
of the primary mechanisms to add credibility to the disclosures of a company is to have an
independent outside party audit or verify those disclosures. Theory suggests this assurance
benefit of an audit reduces financing frictions, such as adverse selection and moral hazard
between managers and capital providers, which improves resource allocation and contracting
efficiency (Jensen and Meckling 1976; Watts and Zimmerman 1983). Consistent with theory,
prior research finds that an audit (and even the choice to subject oneself to an audit) lowers the
cost of external financing (e.g., Blackwell et al. 1998, Minnis 2011, Kausar et al. 2015).
The extent to which an audit increases financial statement credibility critically depends
on the independence of the auditor and the rigor with which the audit is performed (Watts and
Zimmerman 1983; DeFond and Zhang 2014). I argue that PCAOB inspections increase financial
statement credibility of the inspected auditors’ clients in both ways: increasing investor
confidence in the auditor’s independence and increasing confidence that the audit work is
performed thoroughly. Specifically, the PCAOB’s in-depth analysis of a select subset of audit
engagements is geared towards identifying deficiencies in the way in which an audit is conducted
and, providing the audit firms incentives to correct deficiencies identified during the inspection.
PCAOB inspectors also look for any evidence that the audit firm was not independent as
required under SEC and PCAOB rules. Further, the PCAOB inspection of the auditors’ quality
control systems reviews the audit firms’ management structure, culture, partner evaluation, etc.
with the goal of ensuring that the audit firm has a commitment to integrity and independence. In
sum, PCAOB inspections are likely to increase investor confidence that auditors are diligent in
their examination of their clients’ disclosures and have systems in place to stay independent of
the client, thereby increasing the credibility of the inspected auditors’ clients’ financial
statements. The above discussion leads to my second hypothesis.

15
H2: Disclosure that an auditor was inspected by the PCAOB increase financial statement credibility of the inspected auditors’ clients, which reduces financing frictions faced by clients and thus increases external financing, investment, and investment efficiency.
Since financial statement credibility is unobservable, my analyses on the economic
consequences of financial reporting credibility is based on the joint hypothesis that (i) the public
disclosure of a PCAOB inspection report increases the reporting credibility and, (ii) reporting
credibility increases firms’ access to finance and thus their investment. Failure to document a
change in investment and/or financing behavior following the disclosure of a PCAOB inspection
could be either because the inspection does not change reporting credibility or because reporting
credibility does not affect investment/financing.
2.3. Advantages of the PCAOB International Inspection Setting
The PCAOB international inspection setting is well suited to examine the real effects of
reporting quality and credibility for six reasons. First, this setting allows me to construct a
sample of treatment companies that observe an increase in reporting quality and credibility
simply because their auditor is inspected by the PCAOB. These treatment companies themselves
are free of SEC regulation, and thus any economic consequences of better reporting accruing to
these companies are uncontaminated by the confounding effects of regulation in the U.S. In other
words, this setting allows us to understand the precise cause for the increase in reporting quality
and credibility of the treatment companies and examine its economic consequences. Coates and
Srinivasan (2014) and Leuz and Wysocki (2015) discuss inferential difficulties faced by existing
studies examining U.S. companies due to the confounding factors around the enactment of SOX.
Second, this setting allows me to construct a sample of matched control companies
located in the same country, operating in the same industry and having similar size and growth as
the treatment companies. These companies serve as useful benchmarks to control for changes in

16
economic conditions and home country regulation that affect treatment companies’ financing and
investment decisions for reasons unrelated to the improvements in reporting quality/credibility
induced by PCAOB inspections (see Figures 1 and 2).
Third, the PCAOB began its international inspection program in 2005 but the inspections
themselves are staggered over time. There are two reasons why the inspections are staggered:
First, the PCAOB enters into agreements with foreign governments to conduct inspections of
non-U.S. auditors (in some cases) and this agreement was reached at different points in time with
different countries. Second, all non-U.S. auditors inspected by the PCAOB (except the Big Four
Canadian auditors) are subject to triennial inspections because they audit 100 or fewer SEC
registered companies. The latter point results in a staggering of inspection dates, and thus the
treatment effect, within each country. The benefit of having treatment effects staggered over time
is that my research design allows companies audited by PCAOB-inspected auditors in one year
to serve as a control for companies audited by PCAOB-inspected auditors in other years, thereby
further reducing economic differences between treatment and control companies.
Fourth, the PCAOB inspection setting provides a unique opportunity to separate out the
economic effects of changes in financial report quality and credibility because the public
revelation of the inspection is delayed for many months after the completion of the inspection.
The mean (median) lag between the inspection report date and the inspection completion date for
all international inspections reports released as of December 2014 is 538 (440) days. The lag
between the inspection report and inspection completion dates is even greater for the initial
inspection of an auditor (with a mean [median] lag of 637 [553] days). Part of the reason for this
delay is because inspected audit firms are given an opportunity to review and comment on a draft
of the report before the PCAOB issues it, thus increasing the lead time to issue a final report.

17
Further, the PCAOB, similar to most regulatory agencies, is resource-constrained and thus slow
to issue the final inspection report. As discussed earlier, reporting quality is likely to improve
soon after a company’s auditor is inspected by the PCAOB. However, reporting credibility is
likely to improve only when investors find out that the company’s auditor was subject to a
PCAOB inspection.9 The time lag between the PCAOB inspection and its public disclosure
allows me to empirically separate the economic effects of reporting quality and credibility.
Fifth, a non-U.S. setting is arguably more powerful than a U.S. setting to test the real
effects of reporting quality and credibility because the U.S. disclosure and governance
environment is already rich (Leuz and Verrecchia 2000). Thus, U.S. companies are less likely to
benefit from improvements in reporting quality/credibility relative to non-U.S. companies given
the rich base-line disclosure environment in the U.S.10
Finally, PCAOB inspections and the inspection reports serve as exogenous improvements
in the reporting quality and credibility of the inspected auditors’ clients’ financial statements,
respectively. As a result, this setting circumvents the need to empirically proxy for reporting
quality and credibility, which is notoriously hard to do.
3. Data Sources and Sample Selection
I obtain the complete list of non-U.S. auditors inspected by the PCAOB, as well as the
date when the inspection reports are made public, from PCAOB’s website as of November 10,
2014.11 I then hand collect data on the inspection date from the individual inspection reports
9 My empirical tests (and those in Fung et al. 2015) confirm that reporting quality changes soon after a company’s auditor is inspected by the PCAOB, but that there is no such change following the public filing of the inspection report. 10 Differences in the information/governance environment across countries is perhaps why prior research finds mixed evidence that PCAOB inspections improves audit quality for U.S. auditors while the evidence that PCAOB inspections improves audit quality for non-U.S. auditors is more consistent across a variety of studies with different methodologies and different proxies for audit/reporting quality. 11 See: http://pcaobus.org/International/Inspections/pages/internationalinspectionreports.aspx

18
downloaded from PCAOB’s website. All my analyses are conducted on non-U.S. companies
operating in countries with at least one PCAOB inspected auditor. I obtain the financial
statement information of non-U.S. companies from the Compustat Global Vantage database and
hand collect the auditor identities from the S&P Capital IQ database for all company-year
observations in the intersection of Compustat Global and Capital IQ.12 Although Compustat
Global has a variable identifying the auditor for its sample company-years, I hand collect auditor
data from Capital IQ for three reasons: (i) over 60% of the company-year observations in
Compustat Global have auditors classified in a generic category “Other;” (ii) Of the identified
auditors, the vast majority of company-years are those using a big-four auditor; (iii) Prior
research finds that the auditor variable in Compustat Global is often erroneous (Francis and
Wang 2008), which I confirm ex post in my sample when I compare the auditor identities in
Compustat Global with that in Capital IQ. As a final step to identify the auditor for each
company-year in my sample, I manually clean the auditor identities for the observations in my
sample as the auditor names are not uniformly coded in the Capital IQ database.
My sample period begins in 2003 (i.e., four years before the first PCAOB inspection in
my sample) and ends in 2014 (the most recent year on Compustat Global). I require company-
years to be in the intersection of the Compustat Global and Capital IQ databases and have non-
missing values for total assets, capital expenditure, Tobin’s Q, and cash flow. Next, I require
each observation to have non-missing data for the variables I match on in the three years
immediately preceding the year of the observation. These filters result in a sample of 89,225
company-year observations. I then construct two samples: one for the analyses of PCAOB
inspections (henceforth, “inspection sample”) and another for the analyses of public disclosure of
the inspections (henceforth, “report sample”). The pre- and post-treatment periods differ due to
12 Although the Datastream database has greater company coverage than Global Vantage, I use the latter because the primary source of auditor data is Capital IQ, and Datastream does not share a reliable company identifier with Capital IQ. GVKEY serves as a common company identifier for observation in Global Vantage and Capital IQ.
19
differences in PCAOB inspection and report dates, which is why I construct two sets of matched
samples for the analyses of reporting quality effects and reporting credibility effects.
Requiring treatment companies to have a matched control companies reduces the
inspection (report) sample size to 13,740 (13,334); of this, 11,979 (11,308) treatment company-
years have matching control company-years in the inspection (report) sample. I retain only those
observations within four years of the treatment effect to center the sample on the treatment date
and mitigate the likelihood of confounding events in the pre- or post-treatment periods. Dropping
SEC registered non-U.S. company-years and observations where the PCAOB publicly disclosed
its quality control criticism (because the inspected auditor failed to satisfactorily address
PCAOB’s concerns) results in a final sample of 20,401 (19,727) company-year observations in
the inspection sample (report sample). Table 1 outlines the sample selection procedure in detail.
4. Research Design and Results
4.1. Research Design
I estimate the following difference-in-differences regression to test my predictions:
, β1 _ _ ,
β2 _ , ′ , 1
where i, t, ind, and c indexes companies, years, industries, and countries, respectively; , is
capital expenditure scaled by lag assets (INVESTMENT) or the natural log of long-term debt
(LN(DEBT)), , , , and are company, year, industry (3-digit NAICS), and country
indicators, TREATMENT_CO is an indicator variable that equals one (zero) for treatment
(control) companies, POST_TREAT is an indicator variable that equals one for the fiscal years
ending after a PCAOB inspection date or PCAOB report date, and X is a vector of controls
(discussed below). Since control companies do not have PCAOB inspections, POST_TREAT
equals one for them when their matched treatment companies’ auditors are inspected by the
20
PCAOB or when their matched treatment companies’ auditors’ PCAOB inspection report
becomes public. The main effect of TREATMENT_CO is absorbed by the company indicators,
but POST_TREAT is identified despite having country-industry-year indicators because the post-
treatment period varies at the company-level (depending on the company’s auditor and the
timing of its PCAOB inspection/report, which is staggered over time).
When the dependent variable is INVESTMENT, the vector of control variables includes:
Tobin’s Q (TOBIN’S_Q), cash flows from operations (CFO), company size (LN(MVE)), leverage
(LEVERAGE), and cash (CASH). When the dependent variable is DEBT, the vector of control
variables includes: Tobin’s Q (TOBIN’S_Q), cash flows from operations (CFO), company size
(LN(MVE)), cash (CASH), the ratio of tangible to total assets (ASSET_TANGIBILITY), growth
(SALES_GR), and profitability (ROA). The list of control variables included in my regressions
follows prior research (e.g., Kaplan and Zingales 1997; Whited 2006; Hadlock and Pierce 2010;
Badertscher et al. 2013; Kausar et al. 2015).13 All continuous variables are winsorized at the 1st
and 99th percentile of their empirical distribution. I cluster standard errors at the matched
company-pair level to allow for within-company and within-pair correlation in the residuals.
4.2. Parallel Trends Assumption and Discussion of Research Design
The identifying assumption essential to the interpretation of my difference-in-differences
coefficient is that the treatment and control companies have parallel trends in debt and
investment. To satisfy this assumption, I match the treatment companies to control companies
based their pre-treatment period growth opportunities and access to finance. Specifically, I match
13 A potential concern of controlling for leverage in the investment regression is that the PCAOB treatment effect could affect debt-levels (as I predict) and thus affect leverage too. As a result, controlling for leverage could (i) dampen the treatment effect in the investment regressions and/or (ii) introduce an endogeneity bias via the “back-door” channel discussed in Gow et al. (2015). I still choose to control for leverage following Asker et al. (2015) but in untabulated analyses verify that my inferences are robust to dropping leverage from the set of control variables.

21
on the following variables within each country, industry, and year in the three years before
treatment: TOBIN’S_Q and SALES_GR, which proxy for growth opportunities; LN(MVE) and
CASH, which proxy for financing needs. I use nearest neighbor matching within caliper
(Rosenbaum and Rubin 1985). To test whether the matching procedure is effective, Table 2
compares the mean values of the matching variables for my treatment and control samples, each
year in the pre-treatment period. Since the treatment period is company-specific, I do not have a
fixed set of pre-treatment years. Thus I report the results of the matching procedure in each of the
four pre-treatment years, which are labeled ‘t-1’ to ‘t-4.’14 Panel A (B) reports the results of the
matching procedure for the PCAOB inspection sample (report sample). The table indicates that
my matching procedure results in no statistically significant difference between my treatment
and control companies with respect to the matched variables, thereby showing that they are
observably similar in terms of their pre-treatment growth opportunities and access to finance.
Next, I examine and find that the pre-treatment trends in both investment and debt are
indistinguishable in both the inspection sample (Table 3, Panel A) and report sample (Table 3,
Panel B). The question then is whether the post-treatment trends would have continued to be
parallel had it not been for the PCAOB inspection of the treated companies’ auditors. My
empirical design takes several steps to mitigate the concern that the treatment companies’ trend
in investment or debt would have changed even in the absence of the inspections. First, I include
country-industry-year fixed effects in all the regressions. This fixed effects structure controls for
a dynamic time trend within each country-industry, and essentially differences away observable
and unobservable trends in debt and investment at the country-industry level. Second, I include
company-fixed effects in all the regressions, which differences away company-specific trends in
14 Recall that I retain only those observations within four years of the treatment effect to reduce the likelihood of confounding events in the pre- or post-treatment periods.

22
debt and investment. Finally, I control for standard company-level characteristics (such as size,
growth, and profitability) that could cause trends to diverge post-treatment for reasons unrelated
to the PCAOB inspection induced effects.
Below are a few important observations about my research design. First, the treatment
and control companies have different auditors by construction. Therefore, a potential concern is
that a company’s auditor choice creates a selection bias in my tests. It is important to note that
my identifying assumption is not random assignment of auditor; it is that the treated and control
companies’ investment and debt would have trended similarly in the absence of the PCAOB
inspection of the treated company’s auditor. As discussed above, descriptive tests suggest that
investment and debt empirically trended similarly for treatment and control companies in the
pre-treatment years. Further, any effect of auditor selection is likely to be differenced away in
my regressions so long as the selection effects are the same before- and after-PCAOB inspection
and report dates. To further mitigate selection concerns, I also exploit the fact that the PCAOB
was established in 2002 as part of SOX. Thus, companies whose auditor choice pre-dates the
PCAOB are unlikely to be affected by selection effects. I verify that all my inferences are robust
to examining just those companies whose auditor choice pre-dates the creation of the PCAOB.
Another important observation about my research design is that I use PCAOB inspections
and the disclosure of PCAOB inspection reports as shocks to reporting quality and reporting
credibility, respectively. As a result, I assume that PCAOB inspections and the disclosure of
those inspections affect reporting quality and credibility even though such as assertion is not
without controversy (Palmrose 2006; Glover et al. 2009; Lennox and Pittman 2010). While I
conduct some empirical tests to validate these assumptions, it is important to note that if these
assumptions are not true then my tests are biased towards the null hypothesis.

23
4.3. Descriptive Statistics
Table 4 presents a number of descriptive statistics for my sample. Panel A presents the
distribution of the number of observations in each country as well as the number PCAOB auditor
inspections and PCAOB inspection reports in each country. Panels B and C report the summary
statistics for the variables of interest for the treatment sample and the matched control sample,
respectively. Panel A shows that the majority of observations in my sample belong to Japanese
companies. Thus, in untabulated analyses I verify that my inferences are robust to dropping
Japanese companies from my analyses. The Panel A also shows that there are 111 PCAOB
auditor inspections and 90 PCAOB inspection reports in my sample.
Panels B and C shows that treatment and control companies are similar along most
dimensions. In Panel B (C) the average company spends 4.7% (4.6%) of total assets on
investment and the average company has 1.1 billion (980 million) in debt in its local currency.15
Both the treatment and control companies are on average growing, profitable, and generate
positive cash flows. Overall, the descriptive statistics suggest that my sample companies are not
atypical in any observable way. Panel C also shows that the average lag between the PCAOB
inspection date and the PCAOB report date is 863 days, thus allowing a sufficient gap to test the
differential effects of PCAOB inspections and reports.
4.4. PCAOB Inspections and Financial Reporting Quality
I begin my analyses by examining whether PCAOB inspections and the subsequent
disclosure of these inspections lead to changes in the inspected auditor’s clients’ reporting
quality. Specifically, I examine whether there is a reduction in discretionary accruals and an
increase in accrual quality following PCAOB inspections, and the absence of such an effect
15 I do not convert debt (and the other variables measured in levels) into a uniform currency because exchange rate fluctuation adds noise to my results.
24
following the disclosure of PCAOB inspection via the PCAOB inspection reports. I measure
discretionary accruals using the modified Jones model (Jones 1991; Dechow et al. 1995; Ecker et
al. 2013) and accruals quality following Dechow and Dichev (2002).
To stay consistent with the research design in the following sections of the paper, I use a
matched sample difference-in-differences estimator. I match treatment and control companies
within each country, industry and year on the following variables: size, growth, performance, the
standard deviation of sales and the standard deviation of cash flows in the three years before
treatment. I match on size, growth and performance following Kothari et al. (2005) and
Albuquerque (2009) among others. I also match on the standard deviation of sales and cash flows
following Hribar and Nichols (2007). Table 5 presents the results from my tests.
Panel A shows that there is a statistically significant reduction in the absolute value of
discretionary accruals in the four years after a company’s auditor is inspected by the PCAOB.
However, I do not observe any further reduction in discretionary accruals following the public
disclosure that a company’s auditor was inspected by the PCAOB. Panel B repeats the above
tests using accrual quality as the dependent variable. Here again, I find that a company’s accrual
quality improves after its auditor is inspected by the PCAOB. However, no such effect exists
following the public disclosure of the inspection. These results are consistent with my
expectations, comments by the PCAOB staff, and concurrent work by Fung et al. (2015).
4.5. Test of H1 and H2: Effects of Reporting Quality and Credibility on Debt
Next, I examine whether companies audited by PCAOB-inspected auditors increase their
debt levels following the PCAOB inspection (hypothesis 1), and following the public disclosure
of the PCAOB inspection (hypothesis 2). Table 6, Panel A presents the results. The first column
tabulates results showing the effect of PCAOB inspections. In this regression, the POST_TREAT
25
variable equals one for fiscal years ending after the PCAOB inspection is complete. The second
column tabulates results showing the effect of PCAOB reports; the POST_TREAT variable
equals one for fiscal years ending after the PCAOB inspection report becomes public. The
coefficient of interest in both regressions is POST_TREAT × TREATMENT_CO.
In the first regression, I find that the coefficient for POST_TREAT × TREATMENT_CO is
0.049 and is statistically insignificant (t-statistic=1.06). This result suggests that PCAOB
inspections do not lead to an increase in the debt levels of companies audited by PCAOB-
inspected auditors. Combined with the results in Table 5 that shows that PCAOB inspections
lead to reporting quality improvements, these results suggest that PCAOB inspection induced
improvements in reporting quality do not lead to increases in debt.
The second regression in the table shows that the coefficient for POST_TREAT ×
TREATMENT_CO is 0.109 and is statistically significant at the 1% level (t-statistic=2.55). This
coefficient suggests that companies audited by PCAOB-inspected auditors increase their debt
levels once their auditors’ PCAOB inspection reports are made public. I interpret this result as
suggesting that increases in financial reporting credibility increase companies’ access to capital
and thus leads to an increase in debt. In terms of economic magnitude, the difference-in-
difference coefficient suggests that treatment companies increase their debt levels by 11.5%.
To further corroborate the inference above, I examine the dynamic effects of both
PCAOB inspections and its public disclosure on the debt levels of the treatment companies.
Specifically, I replace the POST_TREAT indicator variable with the following four indicator
variables: POST_TREAT [-1], POST_TREAT [0], POST_TREAT [1], and POST_TREAT [+2].
POST_TREAT [-1] is an event time indicator that equals one for the fiscal year immediately
preceding the PCAOB inspection date in the first regression and the PCAOB report date in the
second regression. Similarly, POST_TREAT [0], POST_TREAT [1], and POST_TREAT [+2] are
26
indicator variables that equal one for fiscal years ending in the (i) year immediately after, (i) one
year after, and (iii) two or more years after the PCAOB inspection/PCAOB report date,
respectively. These indicator variables enter my regressions as interactions with the
TREATMENT_CO indicator as well as main effects. Their main effects are identified despite the
inclusion of country × industry × year fixed effects because the post treatment period is
company-specific. To the extent the PCAOB inspections and the disclosure of those inspections
via PCAOB reports are relatively exogenous events and not part of any pre-existing trend, I
should find that the treatment companies increase their debt only after the treatment takes place.
Table 6, Panel B presents the results. I find that the coefficient for POST_TREAT [-1] ×
TREATMENT_CO is statistically insignificant in both regressions (inspections and reports),
suggesting that there is no significant change in debt before treatment. Further, the coefficients
for POST_TREAT [0] × TREATMENT_CO and POST_TREAT [1] × TREATMENT_CO are
statistically insignificant in the regression examining the effect of PCAOB inspections. Although
the coefficient for POST_TREAT [+2] × TREATMENT_CO is statistically significant in this
regression (coef.=0.122; t-stat.=1.67), this coefficient becomes insignificant once I remove
company-years that cross into the period following the PCAOB report date (untabulated).
Overall, this result shows that PCAOB inspections do not lead to an increase in the debt levels of
companies audited by PCAOB-inspected auditors (consistent with the results in Panel A).
However, I find that the coefficients for POST_TREAT [1] × TREATMENT_CO, and
POST_TREAT [+2] × TREATMENT_CO are statistically significant at the 1% level in the
regression examining the effect of PCAOB inspection reports. These results support the
hypothesis that the disclosure of PCAOB inspections increases the reporting credibility of the
treated companies and consequently leads to an increase in their debt levels. The insignificant
coefficient for POST_TREAT [0] × TREATMENT_CO suggests that treatment companies do not

27
change debt levels in the year of treatment. This is perhaps because the PCAOB delays the
disclosure of quality control criticisms for a year after the PCAOB report or alternatively because
of adjustment cost induced delays (e.g., Leary and Roberts 2005). Overall, the dynamic
specification helps mitigate endogeneity concerns related to the existence of a pre-existing trend
in the debt levels of the treatment companies. The results in Table 6 suggest that PCAOB
induced improvements in reporting quality does not affect the debt levels of treated companies
but an increase in reporting credibility leads to increases in the debt levels of treated companies.
4.6. Test of H1 and H2: Effects of Reporting Quality and Credibility on Investment
Next, I examine whether companies audited by PCAOB-inspected auditors increase
investment following the PCAOB inspection of their auditor, and the public disclosure of that
inspection report. Table 7, Panel A (B) presents the results for the static (dynamic) specification.
As in Table 6, the first column tabulates results on the effect of PCAOB inspections and second
column tabulates results on the effect of PCAOB reports. The coefficient of interest in both
regressions is POST_TREAT × TREATMENT_CO, which captures the change in investment for
the treated companies post treatment compared to that for the control companies.
Panel A shows that the coefficient for POST_TREAT × TREATMENT_CO is -0.000 with
a t-statistic of -0.29 in the regression examining the effect PCAOB inspections on investment.
This result suggests that companies audited by PCAOB-inspected auditors do not change their
investment any differentially than control companies following the PCAOB inspection of their
auditor. This result complements the evidence in Table 6, which shows that companies do not
change their debt levels following PCAOB inspections of their auditor. Collectively, the results
in tables 5 to 7 suggest that PCAOB inspections lead to improvements in report quality but do
not lead to increases in company financing and investment.

28
The second regression in the table shows that the coefficient for POST_TREAT ×
TREATMENT_CO is 0.005 and is statistically significant at the 1% level (t-statistic=3.42). This
coefficient suggests that companies audited by PCAOB-inspected auditors increase investment
once their auditors’ PCAOB inspection reports are made public. I interpret this result as
suggesting that increases in financial reporting credibility increase companies’ access to capital
and thus leads to an increase in debt (as observed in Table 6) and an increase in investment
(Table 7). In terms of economic magnitude, the difference-in-difference coefficient suggests that
treatment companies increase their investment by 10.9%.
Table 7, Panel B presents the results from the dynamic regression specification where I
replace the POST_TREAT indicator variable with four indicator variables: POST_TREAT [-1],
POST_TREAT [0], POST_TREAT [1], and POST_TREAT [+2]. The table shows that the
coefficient for POST_TREAT [-1] × TREATMENT_CO is statistically insignificant in both
regressions (as expected), suggesting that there is no pre-treatment trend in investment. The table
also confirms that PCAOB inspections do not have a positive effect on companies’ investment
behavior in any of the post-treatment years (consistent with the results in Table 7, Panel A and
the previous tables). Surprising, I find that the coefficient for POST_TREAT [1] ×
TREATMENT_CO is negative and significant (t-stat.=-1.68), suggesting that companies audited
by PCAOB-inspected auditors reduce investment in the year immediately following the
inspection relative to control companies. This coefficient is inconsistent with my expectations.
Lastly, Table 7, Panel B shows that the coefficients for POST_TREAT [1] ×
TREATMENT_CO, and POST_TREAT [+2] × TREATMENT_CO are positive and statistically
significant at the 1% level in the regression examining the effect of PCAOB reports on
investment. These results support the hypothesis that the disclosure of PCAOB inspections
29
increases the reporting credibility of the treated companies and as a result leads to an increase in
investment. Consistent with that observed in Table 6 for debt, the coefficient for POST_TREAT
[0] × TREATMENT_CO is insignificant, which suggests that treatment companies do not change
investment levels in the year of treatment. As stated before, this is perhaps because the PCAOB
delays the disclosure of any quality control criticisms for a year (or perhaps because of
adjustment cost delays). Overall, the results thus far suggest that PCAOB induced improvements
in reporting quality does not affect the debt and investment of treated companies but an increase
in reporting credibility leads to increases in the debt and investment of treated companies.
4.7. Effects of Reporting Quality and Credibility on Investment Efficiency
Finally, I examine whether companies audited by PCAOB-inspected auditors become
more responsive to their investment opportunities following the PCAOB inspection/inspection
report. To examine this question, I augment equation 1 by including additional interaction terms
with TOBIN’S_Q. My coefficient of interest is POST_TREAT × TREATMENT_CO ×
TOBIN’S_Q, which captures the change in the sensitivity of investment to growth opportunities
following the PCAOB inspection/inspection report for treatment companies compared to that for
control companies.
Table 8, Panel A (B) presents the results for the static (dynamic) specification. In the
static specification in Panel A, I find that coefficient for POST_TREAT × TREATMENT_CO ×
TOBIN’S_Q is insignificant when treatment comes from PCAOB inspections (t-stat.=0.70) and
only marginally significant when the treatment comes from the disclosure of the PCAOB
inspections (t-stat.=1.44; one-tailed p-value=0.075). These results initially suggest that PCAOB
inspection induced changes in reporting quality does not affect a company’s responsiveness to its
investment opportunities and the reporting credibility effects are weak. However, the dynamic

30
specification in Panel B shows that the coefficients for POST_TREAT [1] × TREATMENT_CO ×
TOBIN’S_Q, and POST_TREAT [+2] × TREATMENT_CO × TOBIN’S_Q are positive and
significant at the 5% level in the regression examining the effect of PCAOB reports. These
results are consistent with the hypothesis that the disclosure of PCAOB inspections increases the
reporting credibility of the treated companies and thus leads to an increase in investment
efficiency as observed by a greater responsiveness to investment opportunities. And consistent
with earlier results, there is no evidence that PCAOB inspections have any effect on the
sensitivity of investment to investment opportunities.
To summarize, the results paint a consistent picture: PCAOB inspections lead to an
improvement in reporting quality but do not affect company financing, investment or investment
efficiency. However, the disclosure of PCAOB inspection reports lead to an increase in debt,
investment and investment efficiency. These economic effects manifest only a year after the
disclosure of the inspection report, which coincides with the time when the PCAOB is likely to
report any unresolved quality control criticisms at the audit firm. I interpret these results as
suggesting that an increase in reporting credibility reduces financing frictions and thus affects
company financing and investment behavior.
4.8. Heterogeneity in Treatment Effects
To further corroborate my inferences regarding the economic effects of reporting
credibility, I conduct two cross-sectional tests. First, I examine whether the treatment effect of
PCAOB inspection reports documented in the earlier sections is greater for financially
constrained companies. If PCAOB inspection reports enhance reporting credibility and thereby
increase access to external finance, then the economic effects of PCAOB inspection reports
should be larger for financially constrained companies. To test this prediction, I augment
31
equation 1 by including additional interaction terms with my proxy for financing constraints. I
proxy for financing constraints using an indicator variable that equals one for company-years
that do not pay a dividend (NO_DIVIDEND). My coefficient of interest is POST_TREAT ×
TREATMENT_CO × NO_DIVIDEND, which captures the incremental change in debt/investment
for non-dividend paying companies following the disclosure of PCAOB inspection reports, while
the coefficient for POST_TREAT × TREATMENT_CO captures the effect for dividend paying
companies.
These results are presented in Table 9. Consistent with my expectation, Table 9 shows
that the coefficient for POST_TREAT × TREATMENT_CO × NO_DIVIDEND is positive and
statistically significant at the one-tailed 5% level when the dependent variable is long-term debt.
However, I find that this coefficient is statistically insignificant when the dependent variable is
investment. These results suggest that financially constrained companies increase their external
financing by a significantly larger magnitude than unconstrained companies following PCAOB
induced improvements in their reporting credibility. However, the changes in investment
following PCAOB induced improvements in their reporting credibility are no different for
financially constrained and unconstrained companies.
Second, I examine whether the effect of PCAOB induced improvements in reporting
credibility is greater for companies audited by a non-big four auditor. The idea is that the big
four auditors are relatively more reputed than the non-big four auditors, and thus the clients of
the non-big four auditors are likely to derive greater benefits from PCAOB induced
improvements in reporting credibility. That is, to the extent the big four auditors have a
reputation for producing high quality audits, the incremental credibility benefit of a PCAOB
inspection is likely to be smaller for the clients of the big-four auditors.
32
To test this prediction, I augment equation 1 by including additional interaction terms
with an indicator variable that equals one for treatment companies audited by a non-big four
auditor (NO_BIG4_TREAT). The coefficient of interest in this regression is POST_TREAT ×
TREATMENT_CO × NO_BIG4_TREAT, which captures the incremental change in
debt/investment for clients of non-big four auditors following the disclosure of their PCAOB
inspection reports. These results are presented in Table 10. The table shows that the coefficient
for POST_TREAT × TREATMENT_CO × NO_BIG4_TREAT is positive and insignificant
(significant) when long-term debt (investment) is the dependent variable. These results suggest
that companies audited by a non-big four auditor increase their investment by a significantly
larger magnitude than those audited by a big-four auditor following PCAOB induced
improvements in their reporting credibility. However, the changes in long-term debt following
PCAOB induced improvements in their reporting credibility are similar for both, companies
audited big-four and non-big four auditors. Note that almost 92% of the treatment companies are
audited by a big-four auditor (see Table 4); the above results should be interpreted in-light of this
observation.
5. Conclusion
In this paper, I use the PCAOB international inspection program as a setting to examine
the effects of financial reporting quality and financial reporting credibility on a company’s
financing and investment decisions. Even though non-U.S. companies are not subject to any
SEC/PCAOB regulation, their auditors can be subject to PCAOB inspections if the auditor has
one or more clients that are cross-listed in the U.S. Thus, the PCAOB inspections of non-U.S.
auditors can serve as exogenous shocks to the reporting quality and credibility of non-U.S.
companies audited by inspected auditors but who are otherwise free of U.S. regulation.

33
My results based on a difference-in-differences matching estimator suggest that even
though non-U.S. companies audited by PCAOB inspected auditor see an improvement in their
accrual quality following the inspection of their auditor, they do not change their financing or
investing behavior in any way following the inspection. However, when non-U.S. investors learn
about the PCAOB inspection of a company’s auditor via the disclosure of the inspection report,
the non-U.S. companies audited by inspected auditors increase their long-term debt and
investment, and become more responsive to their investment opportunities. These treatment
effects are stronger for (i) financially constrained companies, and (ii) companies audited by a
non-big four auditor.
Overall, my results suggest that improvements in reporting quality might not have a
measurable effect on a company’s financing and investment behavior which in contrast to prior
research. However, improvements in reporting credibility have significant effects on both a
company’s ability raise external financing and increase investment. I interpret these results as
suggesting that reporting credibility increase companies’ access to external finance, which
subsequently leads to an increase in investment and investment efficiency. Notwithstanding the
evidence in this paper, I caveat that the PCAOB setting might not be sufficiently powerful to
document the effect of reporting quality on investment efficiency. Further, it is also possible that
prior research captures the joint effect of reporting quality and credibility, and it is reporting
credibility that drives the association. In any case, I believe more research is needed before we
can draw reliable conclusions about whether and how reporting quality affects investment and
investment efficiency.
The evidence in this paper is important for at least two reasons. First, this paper
documents and quantifies the importance of reporting credibility in the capital allocation process.
Separating the economic effects of reporting credibility from reporting quality or quantity is very
34
challenging because reporting credibility is inherently unobservable. The PCAOB inspection
setting provides a rare opportunity to distinguish between these constructs. Second, this paper
sheds light on the importance of regulatory oversight of auditors. Most studies examining the
effect of regulation face identification challenges because of the lack of an appropriate control
sample (Coates and Srinivasan 2014; Leuz and Wysocki 2015). The PCAOB international
inspection setting provides an opportunity to compare two companies that are located in the same
country and are observably similar but are yet subject to different levels of regulatory oversight
because of their auditors’ other clients.
Before concluding, I stress that my inferences are based on a sample of non-U.S.
companies that operate in countries with weaker regulatory and institutional environments than
that in the U.S. Thus the results of this paper, especially the economic magnitude of the
credibility effects, might not generalize to companies in the U.S.

35
References
Abbott, L., Gunny, K., Zhang, T. 2013. When the PCAOB talks, who listens? Evidence from client firm reaction to adverse, GAAP-deficient PCAOB inspection reports. Auditing: A Journal of Practice and Theory 2: 1-31.
Abernathy, J. L., Barnes, M., & Stefaniak, C. (2013). A summary of 10 years of PCAOB research: What have we learned? Journal of Accounting Literature, 32(1), 30-60.
Albuquerque, A., 2009. Peer firms in relative performance evaluation. Journal of Accounting and Economics, 48, 69–89.
Armstrong, C. S., Guay, W. R., & Weber, J. P. (2010). The role of information and financial reporting in corporate governance and debt contracting. Journal of Accounting and Economics, 50(2), 179-234.
Badertscher, B., N. Shroff, and H. White. 2013. Externalities of public firm presence: Evidence from private firms’ investment decisions. Journal of Financial Economics 109, 682-706.
Balakrishnan, K., Core, J. E., & Verdi, R. S. (2014). The Relation between reporting quality and financing and investment: Evidence from Changes in Financing Capacity. Journal of Accounting Research, 52(1), 1-36.
Biddle, G. and G. Hilary, 2006, Accounting quality and firm-level capital investment, The Accounting Review 81, 963-982.
Biddle, G.C., G. Hilary, and R.S. Verdi. 2009. How does financial reporting quality relate to investment efficiency? Journal of Accounting and Economics 48 (2-3): 112-131.
Blackwell, D. W., T. R. Noland, & D. B. Winters. 1998. The value of auditor assurance: Evidence from loan pricing. Journal of Accounting Research 36(1): 57-70.
Boone, J. P., I. K. Khurana, and K. K. Raman. 2015. Did the 2007 PCAOB Disciplinary Order against Deloitte Impose Actual Costs on the Firm or Improve Its Audit Quality? The Accounting Review 90(2): 405-441.
Carcello, J.V., B.T. Carver, and T.L. Neal. 2011. Market reaction to the PCAOB’s inability to conduct foreign inspections. Working paper.
Chen, F., O. Hope, Q. Li, and X. Wang. 2011. Financial reporting quality and investment efficiency of private firms in emerging markets. The Accounting Review 86 (4): 1255-1288.
Church, B.K., and L.B. Shefchik. 2012. PCAOB inspections and large accounting firms. Accounting Horizons 26 (1): 43-63.
Coates, J. C., & Srinivasan, S. (2014). SOX after ten years: A multidisciplinary review. Accounting Horizons, 28(3), 627-671.
36
Dechow, P. and I. Dichev, 2002. The quality of accruals and earnings: The role of accrual estimation errors. The Accounting Review 77, 35-59.
Dechow, P. M., Sloan, R. G., Sweeney, A. P. 1995. Detecting earnings management. The Accounting Review 70 (2): 193-225.
DeFond, M.L., and C.S. Lennox. 2011. The effect of SOX on small auditor exits and audit quality. Journal of Accounting and Economics 52 (1): 21-40.
DeFond, M., and J. Zhang. 2014. A review of archival auditing research. Journal of Accounting and Economics, 58(2-3), 275-326.
Donovan, J., Frankel, R., Lee, J., Martin, X., & Seo, H. (2014). Issues raised by studying DeFond and Zhang: What should audit researchers do? Journal of Accounting and Economics, 58(2-3), 327-338.
Durnev, A., and C. Mangen, 2009, Corporate investments: Learning from restatements, Journal of Accounting Research 47, 679–720.
Ecker, F., Francis, J., Olsson, P., Schipper, K. 2013. Estimation sample selection for discretionary accruals models. Journal of Accounting and Economics 56, 190-211.
Fung, S. Y. K., Raman, K. K., Zhu, X. K., Does the PCAOB’s International Inspection Program Provide Spillover Audit Quality Benefits for Investors Abroad? Working paper.
Gipper, B., C. Leuz, M. Maffett. 2015. Public Audit Oversight and Reporting Credibility: Evidence from the PCAOB Inspection Regime. NBER working paper.
Glover, S. M., Prawitt, D. F., Taylor, M. H. 2009. Audit standard setting and inspection of US Public Companies: A critical assessment and recommendations for fundamental change. Accounting Horizons 23(June): 221–237.
Gow, I., Larcker, D., Reiss, P., 2015. Causal Inference in Accounting Research. Stanford University Working paper.
Gramling, A.A., J. Krishnan and Y. Zhang. 2011. Are PCAOB-identified audit deficiencies associated with a change in reporting decisions of triennially inspected audit firms? Auditing: A Journal of Practice and Theory 30 (3): 59-79.
Hadlock, J.H. & Pierce, J. R., 2010. New evidence on measuring financial constraints: Moving beyond the KZ index. Review of Financial Studies, 23(5): 1909-1940.
Hermanson, D. R., R. W. Houston, and J. C. Rice. 2007. PCAOB inspections of smaller CPA firms: Initial evidence from inspection reports. Accounting Horizons 21 (June): 137–152.
Hermanson, D.R., R.W. Houston, and Z. Ye. 2010. Accounting restatements arising from PCAOB inspections of small audit firms. The CPA Journal 80 (9): 68-70.

37
Hribar, P. and D. C. Nichols, 2007. The use of unsigned earnings quality measures in tests of earnings management. Journal of Accounting Research 45, 1017-1053.
Jensen, M. C., & Meckling, W. H. (1976). Theory of the Firm: Managerial Behavior, Agency Costs and Ownership Structure. Journal of Financial Economics, 3(4), 305-360.
Jones, J., 1991. Earnings management during import relief investigations. Journal of Accounting Research 29, 193–228.
Kaplan, Steven, and Luigi Zingales, 1997, Do financing constraints explain why investment is correlated with cash flow?, Quarterly Journal of Economics 112, 169-215.
Kausar, A, N. Shroff, and H. White. 2015. Real effects of the audit choice. MIT working paper.
Kothari, S. P., Leone, A. J., Wasley, C. E. 2005. Performance matched abnormal accrual measures. Journal of Accounting and Economics 39 (1): 163-97.
Kothari, S.P., K. Ramanna, and D. Skinner, 2010, Implications for GAAP from an Analysis of Positive Research in Accounting. Journal of Accounting and Economics 50, 246-286.
Krishnan, J., J. Krishnan and H. Song. 2014. PCAOB international inspection and audit quality. Working paper, Temple University.
Lamoreaux, P. T. (2013). Does PCAOB inspection exposure affect auditor reporting decisions? Working paper.
Leary, M. and M. Roberts (2005), “Do firms rebalance their capital structures?” Journal of Finance 60(6), 2575-2619.
Lennox, C., and J. Pittman. 2010. Auditing the auditors: Evidence on the recent reforms to the external monitoring of audit firms. Journal of Accounting and Economics 49: 84-103.
Leuz, C., Verrecchia, R., 2000. The economic consequences of increased disclosure. Journal of Accounting Research, 38 : 91-124.
Leuz, C., Wysocki, P., 2015. Regulation of Disclosure and Financial Reporting: U.S. and International Evidence. University of Chicago Working Paper.
McNichols, M., and S. Stubben, 2008. Does earnings management affect firms’ investment decisions? The Accounting Review 83 (6), 1571–1603.
Minnis, M., 2011. The value of financial statement verification in debt financing: Evidence from private U.S. firms. Journal of Accounting Research 49, 457–506.
Myers, S., Majluf, N., 1984. Corporate financing and investment decisions when firms have information that investors do not have. Journal of Financial Economics 13, 187– 221.

38
Palmrose, Z. 2006. “Maintaining the Value and Viability of Auditors as Gatekeepers Under SOX: An Auditing Master Proposal” Book: Yasuyuki Fuchita and Robert E. Litan, eds, (2006) Financial Gatekeepers: Can They Protect Investors? Brookings Institution Press and the Nomura Institute of Capital Markets Research pp.103-135.
Rosenbaum, P. R., & D. B. Rubin. 1985. Constructing a Control Group Using Multivariate Matched Sampling Methods That Incorporate the Propensity Score. The American Statistician 39(1): 33-38.
Shroff, N., Verdi, R. S., & Yu, G. (2014). Information environment and the investment decisions of multinational corporations. The Accounting Review, 89(2), 759-790.
Stiglitz, J. and Weiss, A. 1981. Credit Rationing in Markets with Imperfect Information. American Economic Review 71, 393-410.
Watts, R. L., & Zimmerman, J. L. (1983). Agency problems, auditing, and the theory of the firm: Some evidence. Journal of law and Economics, 613-633.
Watts, R. L., & Zimmerman, J. L. (1978). Towards a positive theory of the determination of accounting standards. Accounting review, 112-134.
Whited, T., 2006. External finance constraints and the intertemporal pattern of intermittent investment. Journal of Financial Economics 81, 467–502.

39
Appendix A Variable Definitions
This table provides a detailed description of the procedure used to compute each variable used in our analyses. Our data are obtained either through Compustat Global, Capital IQ, or the PCAOB website. All continuous variables are winsorized at 1% and 99% of the distribution and all dollar amounts are in millions. The variables are listed according to alphabetical order.
Variable Definition
ACCRUAL QUALITY
Accrual quality is computed using the following model:
WC Accuralsit=α0 + α1 CFOit-1/Assetsit-1 + α2 CFOit/Assetsit-1 + α3 CFOit+1/Assetsit-1 + εit
Where WC Accrualsit = company i’s working capital accruals in year t, measured as the change in current assets (adjusted for the change in cash) minus the change in current liabilities (adjusted for current liabilities used for financing) minus depreciation expense. The absolute value of the residuals from estimating the above equation in the cross section of companies in size deciles within each country-year averaged over the preceding two years and multiplied by –1 provides the measure of accrual quality (i.e., [|εit-1|+|εit-2|] / 2 × –1). This estimation approach follows Dechow and Dichev (2002). The use of size deciles to estimate the regression model follows Ecker et al. (2013).
ASSET_TANGIBILITY The ratio of total tangible assets measured as net property, plant and equipment (data PPENT) scaled by total assets (data AT) as of the fiscal year preceding the dependent variable measurement date.
BIG4 An indicator that equals one for companies using one of the big four audit firms as their auditor. The big four auditors include Deloitte, E&Y, KPMG, and PwC.
BIG4_TREAT An indicator that equals one for treatment companies audited by a big-four auditor. Control companies are assigned the same value as their matched treatment companies.
CASH Total cash balance (data CH) scaled by lag total assets (data AT) as of the fiscal year preceding the dependent variable measurement date.
CFO Operating cash flows (data OANCF) scaled by lag total assets (data AT) as of the fiscal year preceding (concurrent to) the dependent variable measurement date in the debt (investment) regression.
|DISCRETIONARY ACCRUALS|
Discretionary accruals is computed using the following model:
Accuralsit=α0 + α1 (1/Assetsit-1) + α2 (ΔSalesit – ΔARit)/Assetsit-1 + α3 (PPEit /Assetsit-1) + α4 (ROAit /Assetsit-1) + εit
Where Accrualsit = company i’s total accruals in year t, measured as income before extraordinary items minus cash flows from operations. The absolute value of the residuals from estimating the above equation in the cross section of companies in size deciles within each country-year provides the absolute value of discretionary accruals (i.e., |εit|). This estimation approach follows Jones (1991), Dechow et al. (1995), and Kothari et al. (2005). The use of size deciles to estimate the regression model follows Ecker et al. (2013).
DIVIDEND An indicator that equals one for company-years with positive dividend payments (data DVC > 0).
INSPECTION_COUNT The number of PCAOB inspections that an auditor has been subjected to.
INVESTMENT Capital expenditure (data CAPX) scaled by lag total assets (data AT).
LEVERAGE The ratio of the sum of short- and long-term debt (data DLC + DLTT) to total assets (data AT) as of the fiscal year preceding the dependent variable measurement date.
40
LN(ASSETS) The natural log of a company’s total assets in the company’s home currency (data AT).
LN(DEBT) The natural log of a company’s long-term debt in the company’s home currency (data DLTT).
LN(MVE) The natural log of a company’s market value of equity in the company’s home currency (data PRCC_F × CSHO) as of the fiscal year preceding the dependent variable measurement date.
NO_PG_REPORT The number of pages in the public portion of the PCAOB report as measured by the page number of the last page in the report. This variable is hand collected from the PCAOB reports.
POST_TREAT Indicator variable that equals one for fiscal years following the PCAOB inspection date or the PCAOB report date. Control companies are assigned the same values for this variable as their matched treatment companies.
REPORT_LAG The number of days between the PCAOB inspection end date and the date the PCAOB report is released on its website.
ROA Return on assets is measured as income before extraordinary items (data IB) divided by lag total assets (data AT) as of the fiscal year preceding the dependent variable measurement date.
SALES_GR Percentage change in sales (data SALE) as of the fiscal year preceding the dependent variable measurement date.
STDEV_CFO Standard deviation of operating cash flows (data OANCF) in the three the fiscal years preceding the dependent variable measurement date scaled by lag total assets (data AT).
STDEV_SALES Standard deviation of sales (data SALE) in the three the fiscal years preceding the dependent variable measurement date scaled by lag total assets (data AT).
TOBIN’S_Q Market value of equity (data PRCC_F × CSHO) plus the book value of short- and long-term debt (data DLC + DLTT) scaled by total assets (data AT) measured at the fiscal year preceding the dependent variable measurement date.
TREATMENT_CO An indicator variable that equals one for companies audited by PCAOB-inspected auditors.

41
FIGURE 1 Diagrammatic representation of the identification of treatment and control companies
Notes: This figure presents an example in which I list a sub-sample of five clients belonging to three different Indian audit firms. Of the three auditors, two of them (KPMG India and Deloitte India) have at least one client that is listed on a U.S. stock exchange. As a result, these auditors are subject to PCAOB inspections. My treatment sample is composed of the non-U.S. clients of these auditors. In other words, in the example above, Infosys, Wipro, Tata Motors and HDFC Bank do not enter my sample; rather it is the other clients of KPMG India and Deloitte India (i.e., Reliance Mediaworks, Mythra Energy, Aztecsoft, GSFC, Ashok Leyland, Clariant Chemicals) that compose my treatment sample. The clients of auditors such as Lodha & Co., which do not have any SEC registered client, compose my control sample.
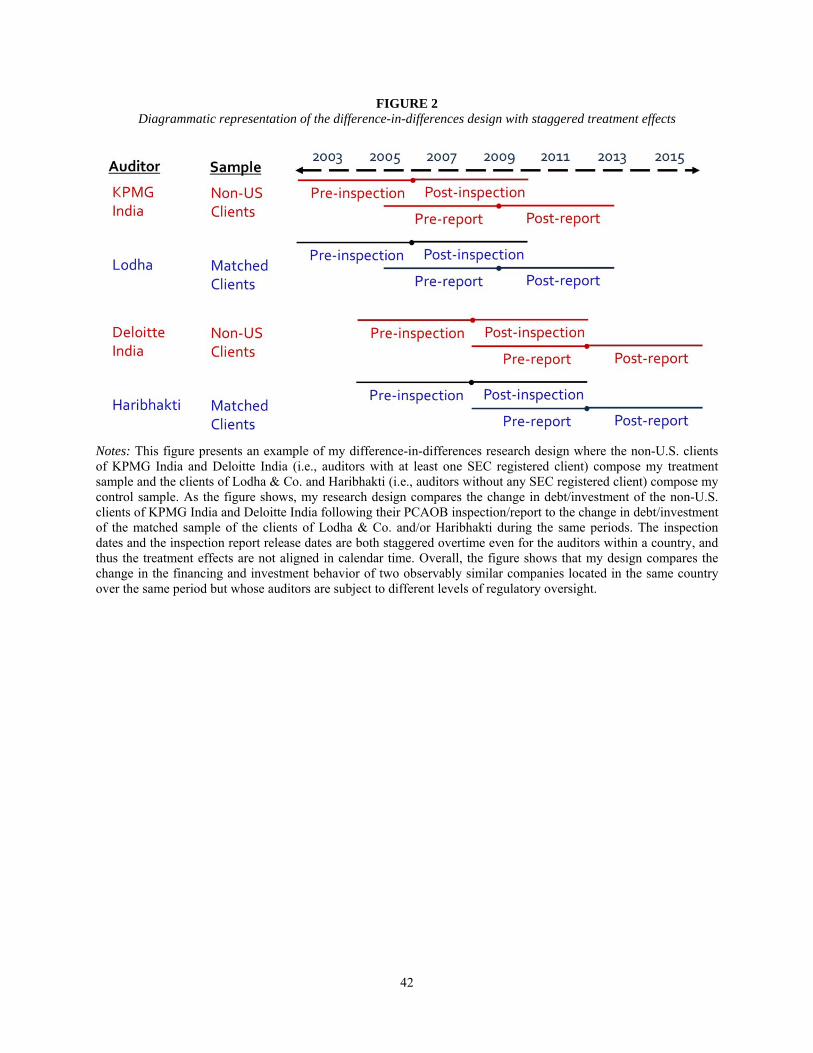
42
FIGURE 2 Diagrammatic representation of the difference-in-differences design with staggered treatment effects
Notes: This figure presents an example of my difference-in-differences research design where the non-U.S. clients of KPMG India and Deloitte India (i.e., auditors with at least one SEC registered client) compose my treatment sample and the clients of Lodha & Co. and Haribhakti (i.e., auditors without any SEC registered client) compose my control sample. As the figure shows, my research design compares the change in debt/investment of the non-U.S. clients of KPMG India and Deloitte India following their PCAOB inspection/report to the change in debt/investment of the matched sample of the clients of Lodha & Co. and/or Haribhakti during the same periods. The inspection dates and the inspection report release dates are both staggered overtime even for the auditors within a country, and thus the treatment effects are not aligned in calendar time. Overall, the figure shows that my design compares the change in the financing and investment behavior of two observably similar companies located in the same country over the same period but whose auditors are subject to different levels of regulatory oversight.
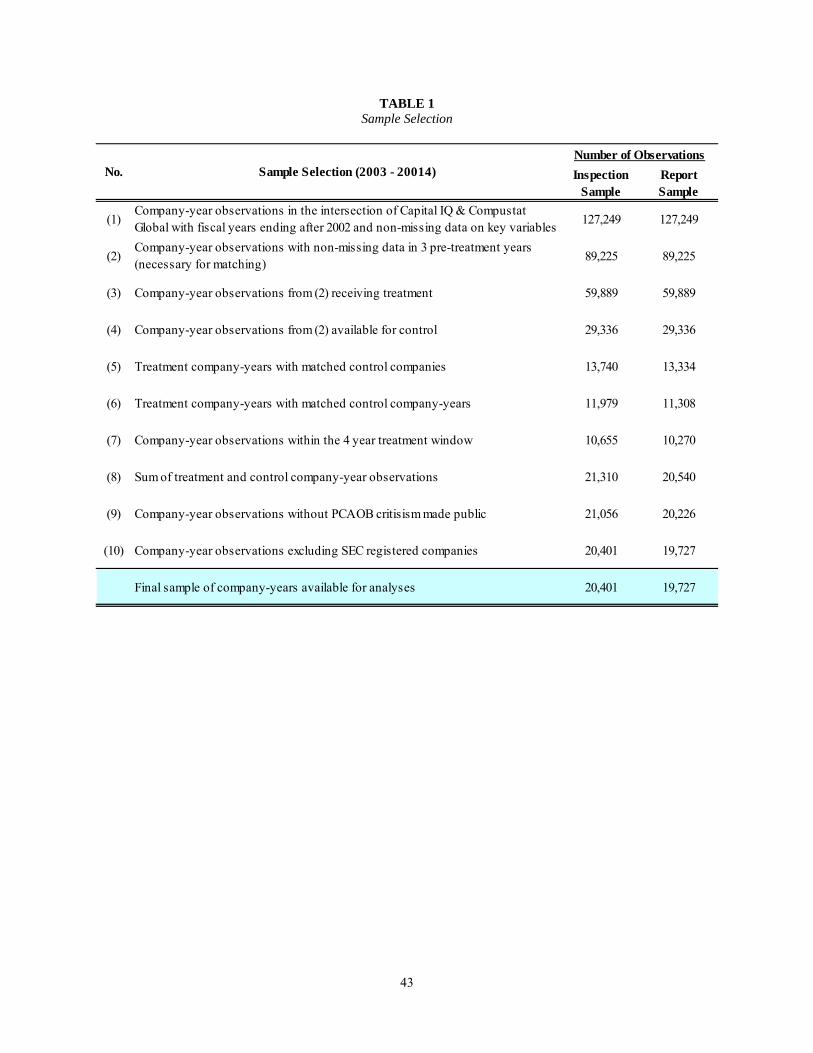
43
TABLE 1 Sample Selection
Inspection Sample
Report Sample
(1)Company-year observations in the intersection of Capital IQ & Compustat Global with fiscal years ending after 2002 and non-missing data on key variables
127,249 127,249
(2)Company-year observations with non-missing data in 3 pre-treatment years (necessary for matching)
89,225 89,225
(3) Company-year observations from (2) receiving treatment 59,889 59,889
(4) Company-year observations from (2) available for control 29,336 29,336
(5) Treatment company-years with matched control companies 13,740 13,334
(6) Treatment company-years with matched control company-years 11,979 11,308
(7) Company-year observations within the 4 year treatment window 10,655 10,270
(8) Sum of treatment and control company-year observations 21,310 20,540
(9) Company-year observations without PCAOB critisism made public 21,056 20,226
(10) Company-year observations excluding SEC registered companies 20,401 19,727
Final sample of company-years available for analyses 20,401 19,727
Sample Selection (2003 - 20014)Number of Observations
No.
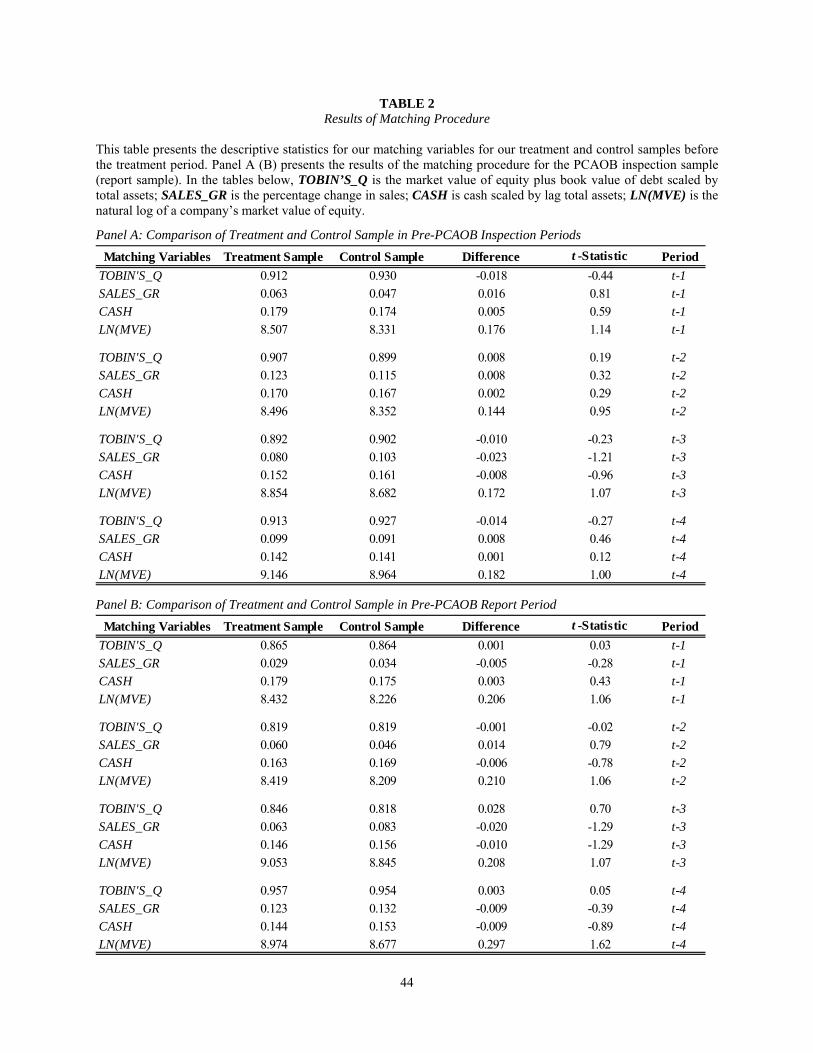
44
TABLE 2 Results of Matching Procedure
This table presents the descriptive statistics for our matching variables for our treatment and control samples before the treatment period. Panel A (B) presents the results of the matching procedure for the PCAOB inspection sample (report sample). In the tables below, TOBIN’S_Q is the market value of equity plus book value of debt scaled by total assets; SALES_GR is the percentage change in sales; CASH is cash scaled by lag total assets; LN(MVE) is the natural log of a company’s market value of equity.
Panel A: Comparison of Treatment and Control Sample in Pre-PCAOB Inspection Periods
Panel B: Comparison of Treatment and Control Sample in Pre-PCAOB Report Period
Matching Variables Treatment Sample Control Sample Difference t -Statistic Period
TOBIN'S_Q 0.912 0.930 -0.018 -0.44 t-1
SALES_GR 0.063 0.047 0.016 0.81 t-1
CASH 0.179 0.174 0.005 0.59 t-1
LN(MVE) 8.507 8.331 0.176 1.14 t-1
TOBIN'S_Q 0.907 0.899 0.008 0.19 t-2
SALES_GR 0.123 0.115 0.008 0.32 t-2
CASH 0.170 0.167 0.002 0.29 t-2
LN(MVE) 8.496 8.352 0.144 0.95 t-2
TOBIN'S_Q 0.892 0.902 -0.010 -0.23 t-3
SALES_GR 0.080 0.103 -0.023 -1.21 t-3
CASH 0.152 0.161 -0.008 -0.96 t-3
LN(MVE) 8.854 8.682 0.172 1.07 t-3
TOBIN'S_Q 0.913 0.927 -0.014 -0.27 t-4
SALES_GR 0.099 0.091 0.008 0.46 t-4
CASH 0.142 0.141 0.001 0.12 t-4
LN(MVE) 9.146 8.964 0.182 1.00 t-4
Matching Variables Treatment Sample Control Sample Difference t -Statistic Period
TOBIN'S_Q 0.865 0.864 0.001 0.03 t-1
SALES_GR 0.029 0.034 -0.005 -0.28 t-1
CASH 0.179 0.175 0.003 0.43 t-1
LN(MVE) 8.432 8.226 0.206 1.06 t-1
TOBIN'S_Q 0.819 0.819 -0.001 -0.02 t-2
SALES_GR 0.060 0.046 0.014 0.79 t-2
CASH 0.163 0.169 -0.006 -0.78 t-2
LN(MVE) 8.419 8.209 0.210 1.06 t-2
TOBIN'S_Q 0.846 0.818 0.028 0.70 t-3
SALES_GR 0.063 0.083 -0.020 -1.29 t-3
CASH 0.146 0.156 -0.010 -1.29 t-3
LN(MVE) 9.053 8.845 0.208 1.07 t-3
TOBIN'S_Q 0.957 0.954 0.003 0.05 t-4
SALES_GR 0.123 0.132 -0.009 -0.39 t-4
CASH 0.144 0.153 -0.009 -0.89 t-4
LN(MVE) 8.974 8.677 0.297 1.62 t-4
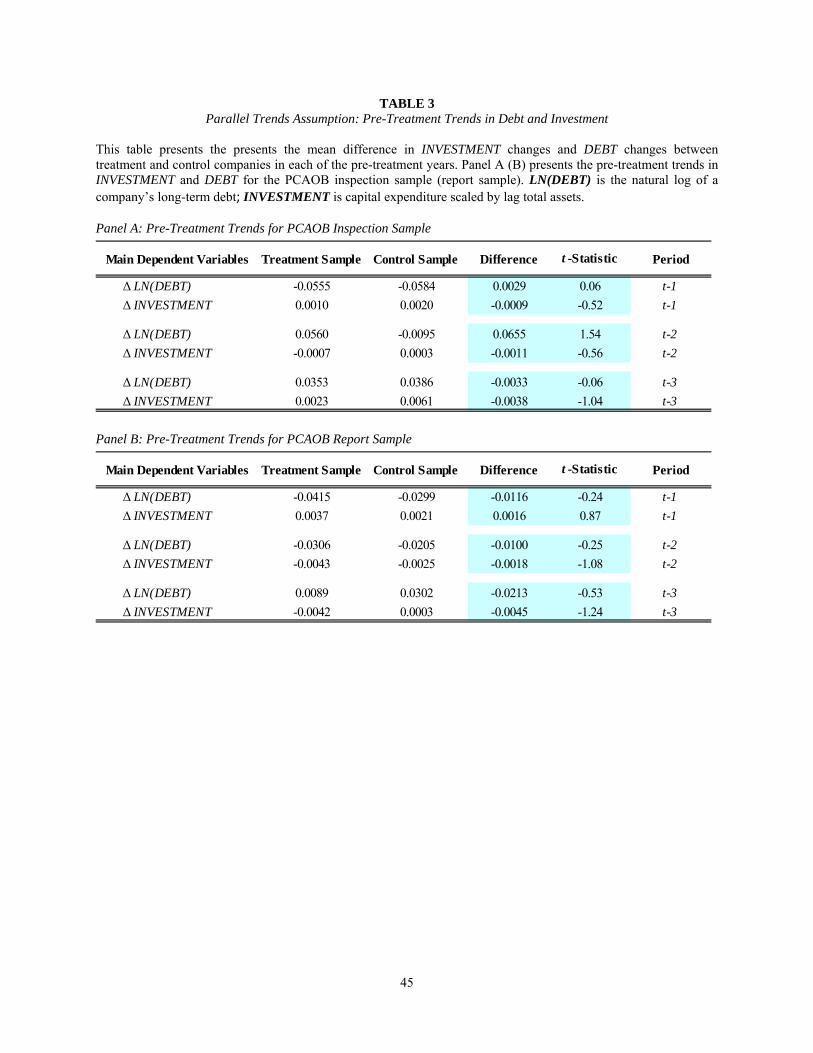
45
TABLE 3 Parallel Trends Assumption: Pre-Treatment Trends in Debt and Investment
This table presents the presents the mean difference in INVESTMENT changes and DEBT changes between treatment and control companies in each of the pre-treatment years. Panel A (B) presents the pre-treatment trends in INVESTMENT and DEBT for the PCAOB inspection sample (report sample). LN(DEBT) is the natural log of a company’s long-term debt; INVESTMENT is capital expenditure scaled by lag total assets. Panel A: Pre-Treatment Trends for PCAOB Inspection Sample
Panel B: Pre-Treatment Trends for PCAOB Report Sample
Main Dependent Variables Treatment Sample Control Sample Difference t -Statistic Period
Δ LN(DEBT) -0.0555 -0.0584 0.0029 0.06 t-1
Δ INVESTMENT 0.0010 0.0020 -0.0009 -0.52 t-1
Δ LN(DEBT) 0.0560 -0.0095 0.0655 1.54 t-2
Δ INVESTMENT -0.0007 0.0003 -0.0011 -0.56 t-2
Δ LN(DEBT) 0.0353 0.0386 -0.0033 -0.06 t-3
Δ INVESTMENT 0.0023 0.0061 -0.0038 -1.04 t-3
Main Dependent Variables Treatment Sample Control Sample Difference t -Statistic Period
Δ LN(DEBT) -0.0415 -0.0299 -0.0116 -0.24 t-1
Δ INVESTMENT 0.0037 0.0021 0.0016 0.87 t-1
Δ LN(DEBT) -0.0306 -0.0205 -0.0100 -0.25 t-2
Δ INVESTMENT -0.0043 -0.0025 -0.0018 -1.08 t-2
Δ LN(DEBT) 0.0089 0.0302 -0.0213 -0.53 t-3
Δ INVESTMENT -0.0042 0.0003 -0.0045 -1.24 t-3
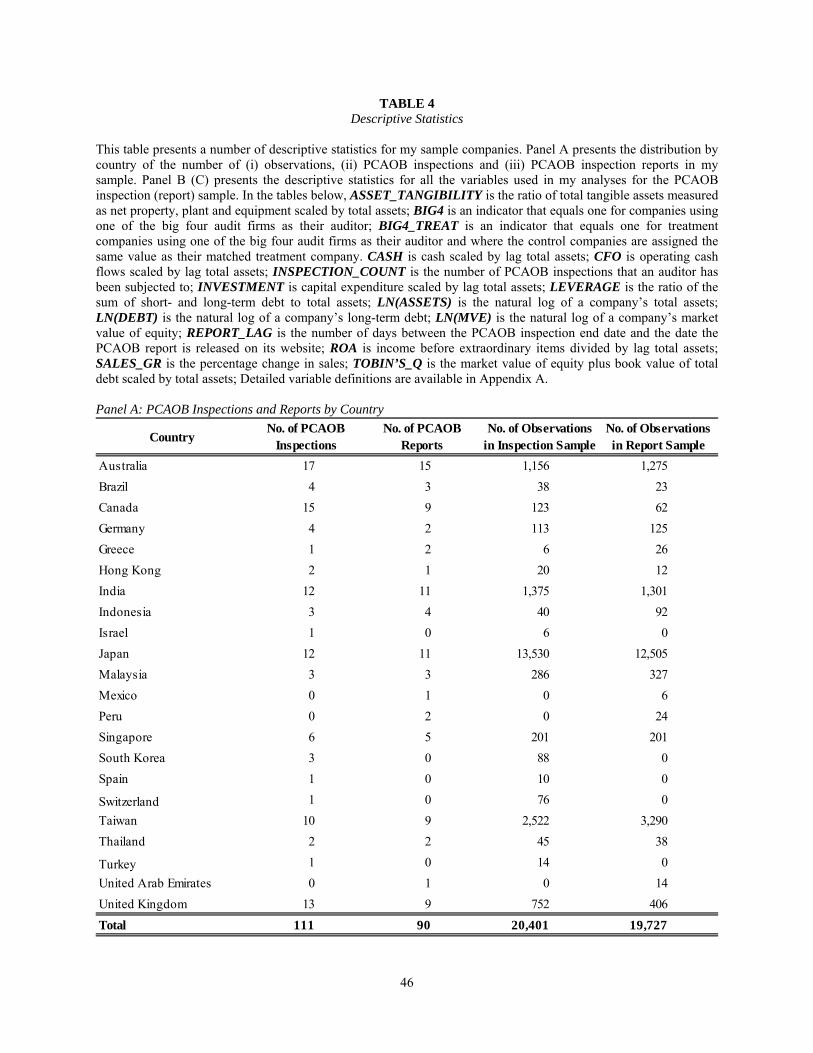
46
TABLE 4 Descriptive Statistics
This table presents a number of descriptive statistics for my sample companies. Panel A presents the distribution by country of the number of (i) observations, (ii) PCAOB inspections and (iii) PCAOB inspection reports in my sample. Panel B (C) presents the descriptive statistics for all the variables used in my analyses for the PCAOB inspection (report) sample. In the tables below, ASSET_TANGIBILITY is the ratio of total tangible assets measured as net property, plant and equipment scaled by total assets; BIG4 is an indicator that equals one for companies using one of the big four audit firms as their auditor; BIG4_TREAT is an indicator that equals one for treatment companies using one of the big four audit firms as their auditor and where the control companies are assigned the same value as their matched treatment company. CASH is cash scaled by lag total assets; CFO is operating cash flows scaled by lag total assets; INSPECTION_COUNT is the number of PCAOB inspections that an auditor has been subjected to; INVESTMENT is capital expenditure scaled by lag total assets; LEVERAGE is the ratio of the sum of short- and long-term debt to total assets; LN(ASSETS) is the natural log of a company’s total assets; LN(DEBT) is the natural log of a company’s long-term debt; LN(MVE) is the natural log of a company’s market value of equity; REPORT_LAG is the number of days between the PCAOB inspection end date and the date the PCAOB report is released on its website; ROA is income before extraordinary items divided by lag total assets; SALES_GR is the percentage change in sales; TOBIN’S_Q is the market value of equity plus book value of total debt scaled by total assets; Detailed variable definitions are available in Appendix A. Panel A: PCAOB Inspections and Reports by Country
CountryNo. of PCAOB
InspectionsNo. of PCAOB
ReportsNo. of Observations
in Inspection SampleNo. of Observations in Report Sample
Australia 17 15 1,156 1,275
Brazil 4 3 38 23
Canada 15 9 123 62
Germany 4 2 113 125
Greece 1 2 6 26
Hong Kong 2 1 20 12
India 12 11 1,375 1,301
Indonesia 3 4 40 92
Israel 1 0 6 0
Japan 12 11 13,530 12,505
Malaysia 3 3 286 327
Mexico 0 1 0 6
Peru 0 2 0 24
Singapore 6 5 201 201
South Korea 3 0 88 0
Spain 1 0 10 0
Switzerland 1 0 76 0
Taiwan 10 9 2,522 3,290
Thailand 2 2 45 38
Turkey 1 0 14 0
United Arab Emirates 0 1 0 14
United Kingdom 13 9 752 406
Total 111 90 20,401 19,727

47
TABLE 4 - continued Panel B: PCAOB Inspection Sample
Panel C: PCAOB Report Sample
Variables Mean SD P25 P50 P75 N
LN(DEBT) 7.029 3.100 5.509 7.448 9.028 16,053
INVESTMENT 0.047 0.066 0.011 0.027 0.056 20,401
LN(MVE) 8.651 2.700 7.573 8.969 10.382 20,401
LN(ASSETS) 9.461 2.912 8.454 10.133 11.306 20,401
TOBIN'S_Q 0.869 0.824 0.475 0.640 0.909 20,401
SALES_GR 0.075 0.493 -0.069 0.022 0.114 20,401
ROA 0.007 0.133 0.003 0.021 0.048 20,401
CFO 0.049 0.106 0.017 0.057 0.095 20,401
LEVERAGE 0.088 0.115 0.001 0.044 0.134 20,401
CASH 0.170 0.160 0.070 0.125 0.211 20,401
ASSET_TANGIBILITY 0.300 0.183 0.176 0.276 0.402 20,401
DIVIDEND 0.706 0.455 0.000 1.000 1.000 20,401
BIG4 0.465 0.499 0.000 0.000 1.000 20,401
BIG4_TREAT 0.918 0.275 1.000 1.000 1.000 20,401
INSPECTION_COUNT 1.813 0.611 1.000 2.000 2.000 20,401
REPORT_LAG 491.6 381.3 258.0 342.0 559.0 20,401
Variables Mean SD P25 P50 P75 N
LN(DEBT) 6.888 2.899 5.355 7.262 8.730 15,140
INVESTMENT 0.046 0.064 0.011 0.026 0.054 19,727
LN(MVE) 8.499 2.566 7.469 8.786 10.090 19,727
LN(ASSETS) 9.336 2.766 8.231 9.930 11.086 19,727
TOBIN'S_Q 0.835 0.817 0.462 0.624 0.872 19,727
SALES_GR 0.064 0.466 -0.079 0.016 0.110 19,727
ROA 0.008 0.126 0.002 0.021 0.047 19,727
CFO 0.048 0.107 0.015 0.056 0.096 19,727
LEVERAGE 0.080 0.106 0.000 0.040 0.123 19,727
CASH 0.172 0.155 0.076 0.129 0.214 19,727
ASSET_TANGIBILITY 0.300 0.183 0.173 0.277 0.400 19,727
DIVIDEND 0.674 0.469 0.000 1.000 1.000 19,727
BIG4 0.458 0.498 0.000 0.000 1.000 19,727
BIG4_TREAT 0.904 0.295 1.000 1.000 1.000 19,727
INSPECTION_COUNT 1.297 0.548 1.000 1.000 2.000 19,727
REPORT_LAG 862.9 467.7 353.0 839.0 1189.0 19,727
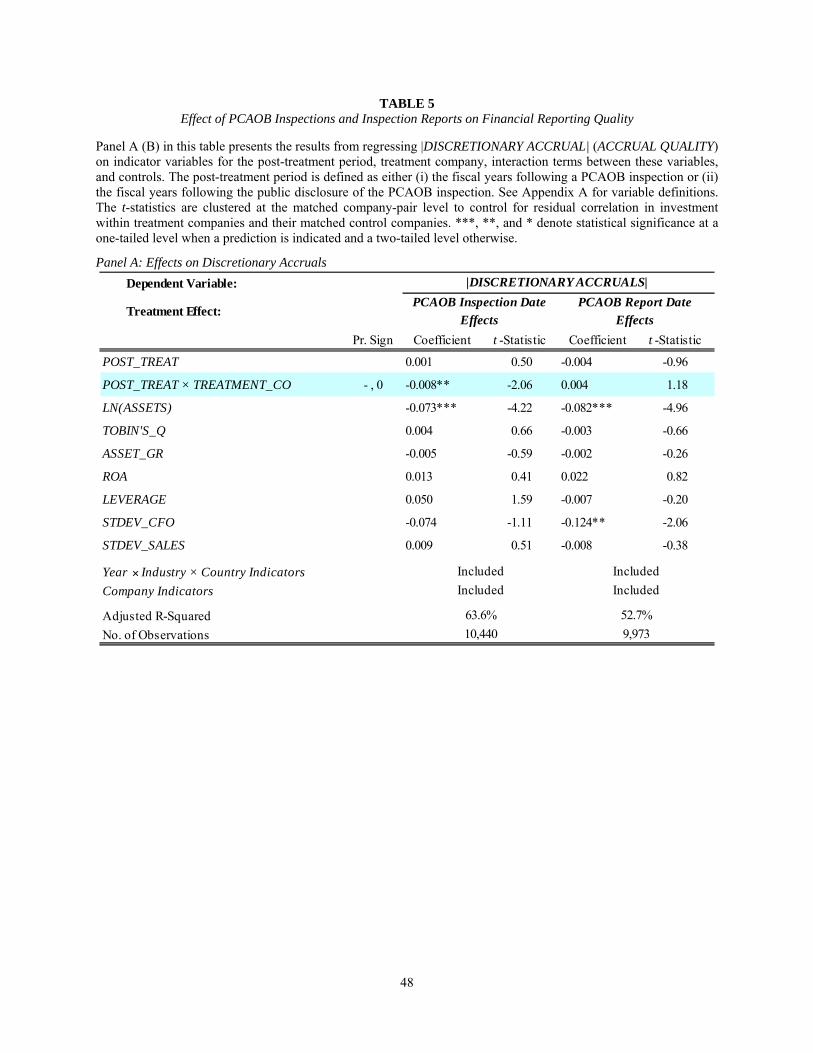
48
TABLE 5 Effect of PCAOB Inspections and Inspection Reports on Financial Reporting Quality
Panel A (B) in this table presents the results from regressing |DISCRETIONARY ACCRUAL| (ACCRUAL QUALITY) on indicator variables for the post-treatment period, treatment company, interaction terms between these variables, and controls. The post-treatment period is defined as either (i) the fiscal years following a PCAOB inspection or (ii) the fiscal years following the public disclosure of the PCAOB inspection. See Appendix A for variable definitions. The t-statistics are clustered at the matched company-pair level to control for residual correlation in investment within treatment companies and their matched control companies. ***, **, and * denote statistical significance at a one-tailed level when a prediction is indicated and a two-tailed level otherwise.
Panel A: Effects on Discretionary Accruals
Dependent Variable:
Treatment Effect:
Pr. Sign Coefficient t -Statistic Coefficient t -Statistic
POST_TREAT 0.001 0.50 -0.004 -0.96
POST_TREAT × TREATMENT_CO - , 0 -0.008** -2.06 0.004 1.18
LN(ASSETS) -0.073*** -4.22 -0.082*** -4.96
TOBIN'S_Q 0.004 0.66 -0.003 -0.66
ASSET_GR -0.005 -0.59 -0.002 -0.26
ROA 0.013 0.41 0.022 0.82
LEVERAGE 0.050 1.59 -0.007 -0.20
STDEV_CFO -0.074 -1.11 -0.124** -2.06
STDEV_SALES 0.009 0.51 -0.008 -0.38
Year × Industry × Country Indicators
Company Indicators
Adjusted R-Squared
No. of Observations
63.6% 52.7%
10,440 9,973
|DISCRETIONARY ACCRUALS|
PCAOB Inspection Date
Effects
PCAOB Report Date
Effects
Included Included
Included Included

49
TABLE 5 - continued Panel B: Effects on Accrual Quality
Dependent Variable:
Treatment Effect:
Pr. Sign Coefficient t -Statistic Coefficient t -Statistic
POST_TREAT 0.000 0.00 0.000 0.08
POST_TREAT × TREATMENT_CO + , 0 0.005** 2.07 0.001 0.27
LN(ASSETS) 0.031*** 3.20 0.007 0.64
TOBIN'S_Q -0.002 -0.85 -0.005 -1.41
ASSET_GR -0.010*** -3.28 -0.001 -0.33
ROA -0.002 -0.15 0.026 1.46
LEVERAGE 0.017 0.90 -0.008 -0.40
STDEV_CFO -0.169*** -3.43 -0.214*** -4.88
STDEV_SALES -0.062*** -3.83 -0.070*** -4.11
Year × Industry × Country Indicators
Company Indicators
Adjusted R-Squared
No. of Observations
72.5%
7,402 7,371
ACCRUAL QUALITY
PCAOB Inspection Date
Effects
PCAOB Report Date
Effects
Included Included
Included Included
79.2%

50
TABLE 6 Effect of PCAOB Inspections and Inspection Reports on Debt
This table presents the results from regressing long-term debt (LN(DEBT)) on indicator variables for the post-treatment period, treatment company, interaction terms between these variables, and controls. The post-treatment period is defined as either (i) the fiscal years following a PCAOB inspection or (ii) the fiscal years following the public disclosure of the PCAOB inspection. Panel A presents the results from a static regression where is just one indicator variable for the post-treatment period and Panel B presents the results from a dynamic regression where is the post-treatment indicator is replaced with four event indicators, one of the year before treatment and the remaining three for the years following treatment. See Appendix A for variable definitions. The t-statistics are clustered at the matched company-pair level to control for residual correlation in investment within treatment companies and their matched control companies. ***, **, and * denote statistical significance at a one-tailed level when a prediction is indicated and a two-tailed level otherwise. Panel A: Static Regression
Dependent Variable:
Treatment Effect:
Pr. Sign Coefficient t -Statistic Coefficient t -Statistic
POST_TREAT -0.042 -1.61 -0.068** -2.24
POST_TREAT × TREATMENT_CO + , + 0.049 1.06 0.109*** 2.55
TOBIN'S_Q -0.141** -2.35 -0.155** -2.27
CASH 0.132 0.53 -0.097 -0.41
LN(MVE) 0.106** 2.01 0.090* 1.84
ASSET_TANGIBILITY 1.932*** 5.09 2.078*** 5.84
ROA 0.261 0.79 0.489 1.50
CFO -0.031 -0.18 -0.345** -2.17
SALES_GR 0.021 0.77 0.048* 1.77
Year × Industry × Country Indicators
Company Indicators
Adjusted R-Squared
No. of Observations
LN(DEBT)
PCAOB Inspection Date
Effects
PCAOB Report Date
Effects
Included Included
16,053 15,140
Included Included
93.9% 93.5%
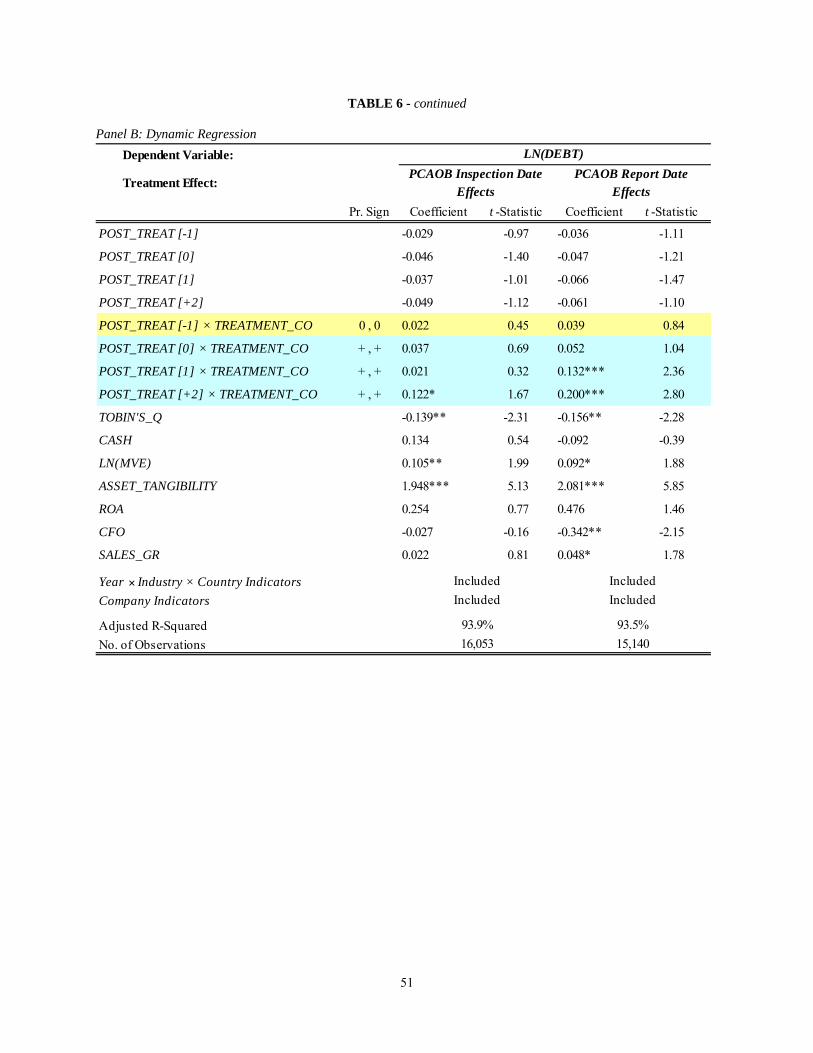
51
TABLE 6 - continued Panel B: Dynamic Regression
Dependent Variable:
Treatment Effect:
Pr. Sign Coefficient t -Statistic Coefficient t -Statistic
POST_TREAT [-1] -0.029 -0.97 -0.036 -1.11
POST_TREAT [0] -0.046 -1.40 -0.047 -1.21
POST_TREAT [1] -0.037 -1.01 -0.066 -1.47
POST_TREAT [+2] -0.049 -1.12 -0.061 -1.10
POST_TREAT [-1] × TREATMENT_CO 0 , 0 0.022 0.45 0.039 0.84
POST_TREAT [0] × TREATMENT_CO + , + 0.037 0.69 0.052 1.04
POST_TREAT [1] × TREATMENT_CO + , + 0.021 0.32 0.132*** 2.36
POST_TREAT [+2] × TREATMENT_CO + , + 0.122* 1.67 0.200*** 2.80
TOBIN'S_Q -0.139** -2.31 -0.156** -2.28
CASH 0.134 0.54 -0.092 -0.39
LN(MVE) 0.105** 1.99 0.092* 1.88
ASSET_TANGIBILITY 1.948*** 5.13 2.081*** 5.85
ROA 0.254 0.77 0.476 1.46
CFO -0.027 -0.16 -0.342** -2.15
SALES_GR 0.022 0.81 0.048* 1.78
Year × Industry × Country Indicators
Company Indicators
Adjusted R-Squared
No. of Observations
93.9% 93.5%
16,053 15,140
PCAOB Inspection Date
Effects
PCAOB Report Date
Effects
Included Included
Included Included
LN(DEBT)

52
TABLE 7 Effect of PCAOB Inspections and Inspection Reports on Investment
This table presents the results from regressing INVESTMENT on indicator variables for the post-treatment period, treatment company, interaction terms between these variables, and controls. The post-treatment period is defined as either (i) the fiscal years following a PCAOB inspection or (ii) the fiscal years following the public disclosure of the PCAOB inspection. Panel A presents the results from a static regression where is just one indicator variable for the post-treatment period and Panel B presents the results from a dynamic regression where is the post-treatment indicator is replaced with four event indicators, one of the year before treatment and the remaining three for the years following treatment. See Appendix A for variable definitions. The t-statistics are clustered at the matched company-pair level to control for residual correlation in investment within treatment companies and their matched control companies. ***, **, and * denote statistical significance at a one-tailed level when a prediction is indicated and a two-tailed level otherwise. Panel A: Static Regression
Dependent Variable:
Treatment Effect:
Pr. Sign Coefficient t -Statistic Coefficient t -Statistic
POST_TREAT 0.000 0.23 -0.002* -1.83
POST_TREAT × TREATMENT_CO + , + -0.000 -0.29 0.005*** 3.42
TOBIN'S_Q 0.017*** 6.83 0.012*** 4.79
CFO 0.010 0.98 0.017** 1.99
CASH 0.052*** 5.79 0.040*** 4.67
LN(MVE) -0.000 -0.02 0.004* 1.65
LEVERAGE -0.054*** -3.52 -0.085*** -7.90
Year × Industry × Country Indicators
Company Indicators
Adjusted R-Squared
No. of Observations
INVESTMENT
PCAOB Inspection Date Effects
PCAOB Report Date Effects
Included Included
Included Included
71.4% 71.1%
20,401 19,727
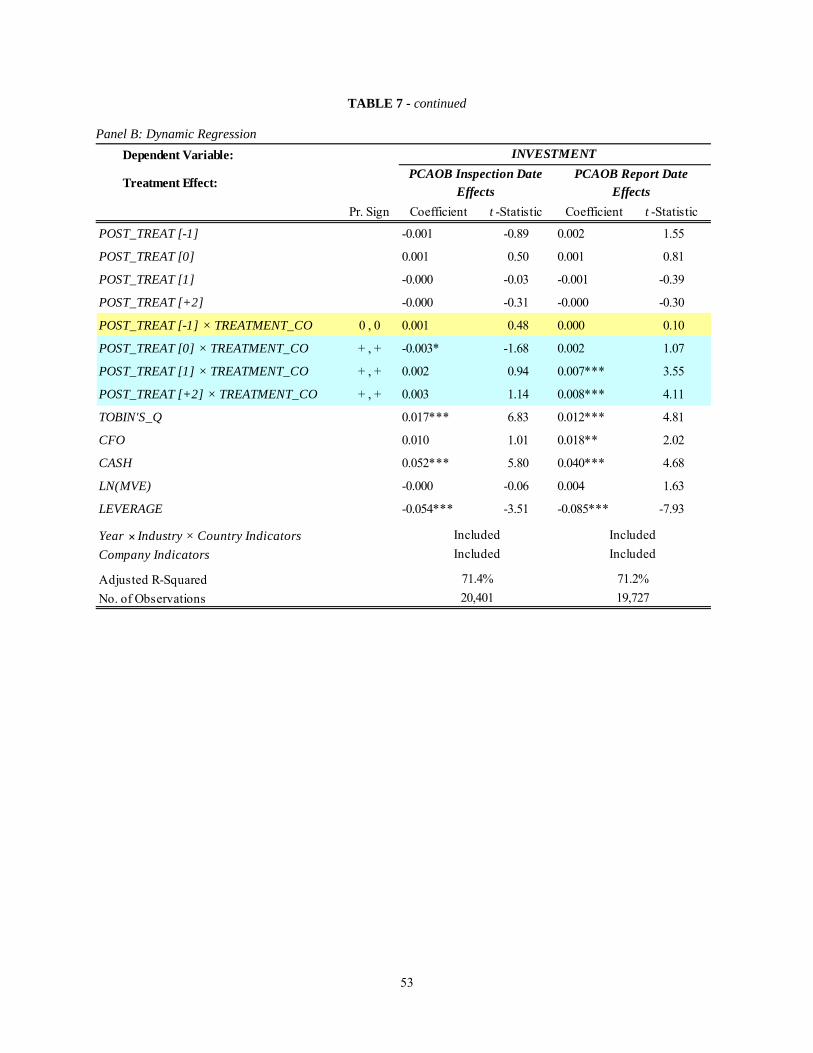
53
TABLE 7 - continued Panel B: Dynamic Regression
Dependent Variable:
Treatment Effect:
Pr. Sign Coefficient t -Statistic Coefficient t -Statistic
POST_TREAT [-1] -0.001 -0.89 0.002 1.55
POST_TREAT [0] 0.001 0.50 0.001 0.81
POST_TREAT [1] -0.000 -0.03 -0.001 -0.39
POST_TREAT [+2] -0.000 -0.31 -0.000 -0.30
POST_TREAT [-1] × TREATMENT_CO 0 , 0 0.001 0.48 0.000 0.10
POST_TREAT [0] × TREATMENT_CO + , + -0.003* -1.68 0.002 1.07
POST_TREAT [1] × TREATMENT_CO + , + 0.002 0.94 0.007*** 3.55
POST_TREAT [+2] × TREATMENT_CO + , + 0.003 1.14 0.008*** 4.11
TOBIN'S_Q 0.017*** 6.83 0.012*** 4.81
CFO 0.010 1.01 0.018** 2.02
CASH 0.052*** 5.80 0.040*** 4.68
LN(MVE) -0.000 -0.06 0.004 1.63
LEVERAGE -0.054*** -3.51 -0.085*** -7.93
Year × Industry × Country Indicators
Company Indicators
Adjusted R-Squared
No. of Observations 20,401 19,727
Included Included
Included Included
71.4% 71.2%
PCAOB Inspection Date
Effects
PCAOB Report Date
Effects
INVESTMENT

54
TABLE 8 Effect of PCAOB Inspections and Inspection Reports on Investment Sensitivity
This table presents the results from regressing INVESTMENT on indicator variables for the post-treatment period, treatment company, TOBIN’S_Q interaction terms between these three variables, and controls. The post-treatment period is defined as either (i) the fiscal years following a PCAOB inspection or (ii) the fiscal years following the public disclosure of the PCAOB inspection. Panel A presents the results from a static regression where is just one indicator variable for the post-treatment period and Panel B presents the results from a dynamic regression where is the post-treatment indicator is replaced with four event indicators, one of the year before treatment and the remaining three for the years following treatment. See Appendix A for variable definitions. The t-statistics are clustered at the matched company-pair level to control for residual correlation in investment within treatment companies and their matched control companies. ***, **, and * denote statistical significance at a one-tailed level when a prediction is indicated and a two-tailed level otherwise. Panel A: Static Regression
Dependent Variable:
Treatment Effect:
Pr. Sign Coefficient t -Statistic Coefficient t -Statistic
POST_TREAT 0.000 0.28 -0.002* -1.83
POST_TREAT × TREATMENT_CO + , + -0.000 -0.17 0.005*** 3.09
POST_TREAT × TOBIN'S_Q 0.002 0.71 -0.003 -1.30
TREATMENT_FIRM × TOBIN'S_Q -0.002 -0.67 -0.009** -2.57
POST_TREAT × TREATMENT_CO × TOBIN'S_Q + , + 0.003 0.70 0.005* 1.44
TOBIN'S_Q 0.017*** 5.13 0.017*** 5.37
CFO 0.010 1.02 0.018** 2.06
CASH 0.052*** 5.79 0.040*** 4.63
LN(MVE) -0.001 -0.25 0.004* 1.68
LEVERAGE -0.055*** -3.62 -0.085*** -7.91
Year × Industry × Country Indicators
Company Indicators
Adjusted R-Squared
No. of Observations
INVESTMENT
PCAOB Inspection
Date Effects
PCAOB Report
Date Effects
Included Included
Included Included
71.4% 71.2%
20,401 19,727

55
TABLE 8 - continued Panel B: Dynamic Regression
Dependent Variable:
Treatment Effect:
Pr. Sign Coefficient t -Statistic Coefficient t -Statistic
POST_TREAT [-1] -0.001 -0.86 0.002 1.51
POST_TREAT [0] 0.001 0.57 0.001 0.84
POST_TREAT [1] -0.000 -0.05 -0.001 -0.73
POST_TREAT [+2] 0.000 0.16 -0.001 -0.66
POST_TREAT [-1] × TREATMENT_CO 0 , 0 0.001 0.45 0.000 0.21
POST_TREAT [0] × TREATMENT_CO + , + -0.003 -1.54 0.002 1.04
POST_TREAT [1] × TREATMENT_CO + , + 0.003 1.11 0.008*** 3.55
POST_TREAT [+2] × TREATMENT_CO + , + 0.003 1.02 0.009*** 4.12
TREATMENT_CO × TOBIN'S_Q -0.002 -0.40 -0.008** -2.38
POST_TREAT [-1] × TOBIN'S_Q 0.004 1.16 0.007** 2.07
POST_TREAT [0] × TOBIN'S_Q 0.004 1.13 0.004 1.39
POST_TREAT [1] × TOBIN'S_Q 0.001 0.30 -0.003 -1.05
POST_TREAT [+2] × TOBIN'S_Q 0.007 1.11 -0.002 -0.56
POST_TREAT [-1] × TREATMENT_CO × TOBIN'S_Q 0 , 0 -0.002 -0.52 -0.003 -0.76
POST_TREAT [0] × TREATMENT_CO × TOBIN'S_Q + , + -0.000 -0.02 -0.001 -0.35
POST_TREAT [1] × TREATMENT_CO × TOBIN'S_Q + , + 0.007 1.20 0.012*** 2.62
POST_TREAT [+2] × TREATMENT_CO × TOBIN'S_Q + , + 0.003 0.49 0.009** 2.20
TOBIN'S_Q 0.016*** 4.50 0.014*** 4.45
CFO 0.010 1.04 0.019** 2.21
CASH 0.052*** 5.86 0.040*** 4.60
LN(MVE) -0.001 -0.48 0.003 1.56
LEVERAGE -0.055*** -3.60 -0.085*** -7.99
Year × Industry × Country Indicators
Company Indicators
Adjusted R-Squared
No. of Observations 20,401 19,727
Included Included
Included Included
71.5% 71.4%
PCAOB Inspection Date Effects
PCAOB Report Date Effects
INVESTMENT
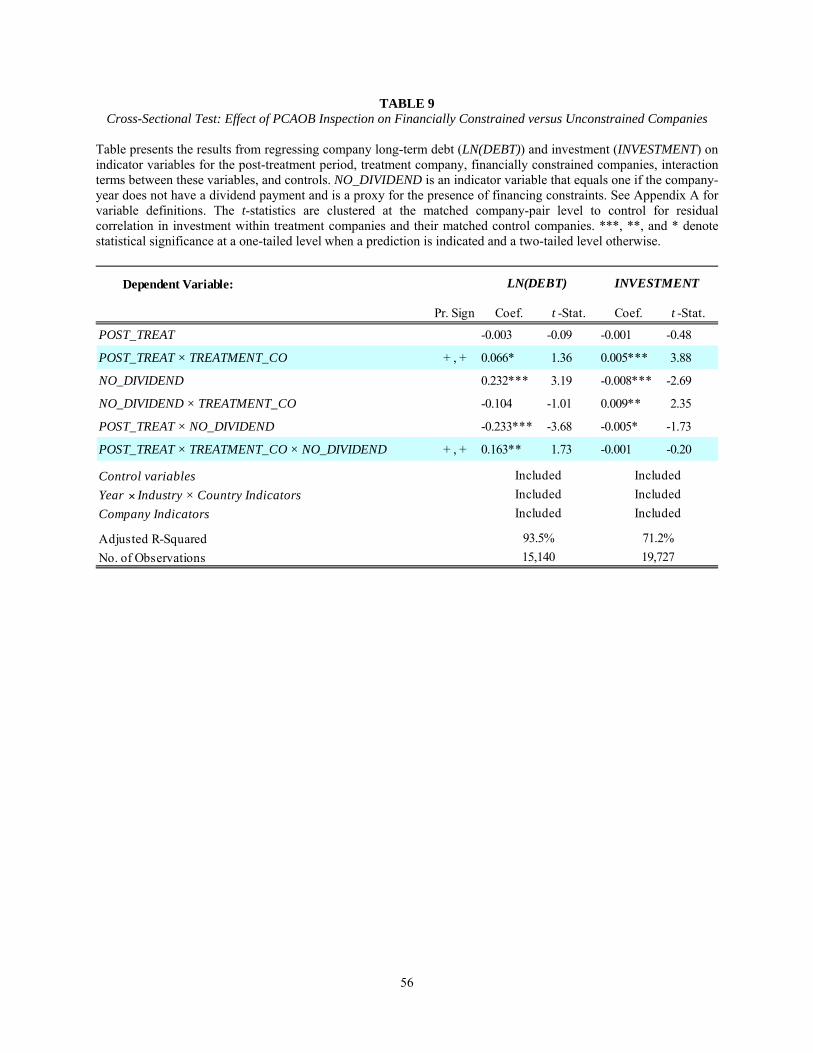
56
TABLE 9 Cross-Sectional Test: Effect of PCAOB Inspection on Financially Constrained versus Unconstrained Companies
Table presents the results from regressing company long-term debt (LN(DEBT)) and investment (INVESTMENT) on indicator variables for the post-treatment period, treatment company, financially constrained companies, interaction terms between these variables, and controls. NO_DIVIDEND is an indicator variable that equals one if the company-year does not have a dividend payment and is a proxy for the presence of financing constraints. See Appendix A for variable definitions. The t-statistics are clustered at the matched company-pair level to control for residual correlation in investment within treatment companies and their matched control companies. ***, **, and * denote statistical significance at a one-tailed level when a prediction is indicated and a two-tailed level otherwise.
Dependent Variable:
Pr. Sign Coef. t -Stat. Coef. t -Stat.
POST_TREAT -0.003 -0.09 -0.001 -0.48
POST_TREAT × TREATMENT_CO + , + 0.066* 1.36 0.005*** 3.88
NO_DIVIDEND 0.232*** 3.19 -0.008*** -2.69
NO_DIVIDEND × TREATMENT_CO -0.104 -1.01 0.009** 2.35
POST_TREAT × NO_DIVIDEND -0.233*** -3.68 -0.005* -1.73
POST_TREAT × TREATMENT_CO × NO_DIVIDEND + , + 0.163** 1.73 -0.001 -0.20
Control variables
Year × Industry × Country Indicators
Company Indicators
Adjusted R-Squared
No. of Observations
93.5% 71.2%
15,140 19,727
LN(DEBT) INVESTMENT
Included Included
Included Included
Included Included
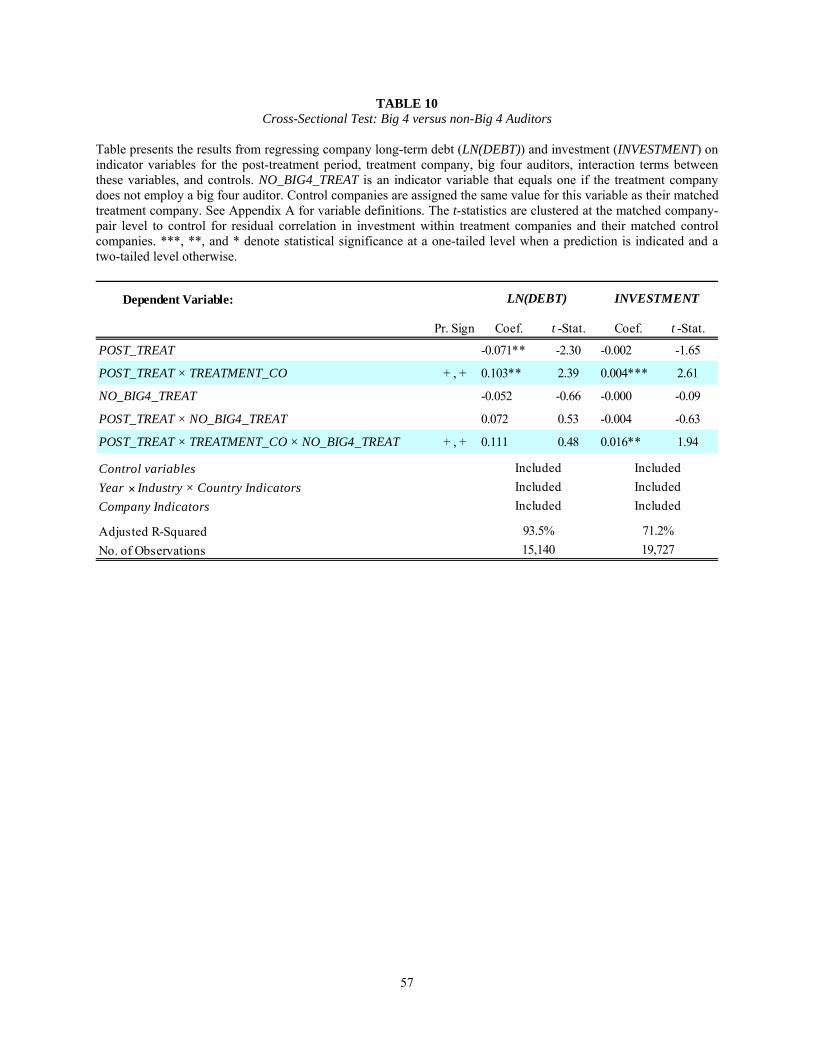
57
TABLE 10 Cross-Sectional Test: Big 4 versus non-Big 4 Auditors
Table presents the results from regressing company long-term debt (LN(DEBT)) and investment (INVESTMENT) on indicator variables for the post-treatment period, treatment company, big four auditors, interaction terms between these variables, and controls. NO_BIG4_TREAT is an indicator variable that equals one if the treatment company does not employ a big four auditor. Control companies are assigned the same value for this variable as their matched treatment company. See Appendix A for variable definitions. The t-statistics are clustered at the matched company-pair level to control for residual correlation in investment within treatment companies and their matched control companies. ***, **, and * denote statistical significance at a one-tailed level when a prediction is indicated and a two-tailed level otherwise.
Dependent Variable:
Pr. Sign Coef. t -Stat. Coef. t -Stat.
POST_TREAT -0.071** -2.30 -0.002 -1.65
POST_TREAT × TREATMENT_CO + , + 0.103** 2.39 0.004*** 2.61
NO_BIG4_TREAT -0.052 -0.66 -0.000 -0.09
POST_TREAT × NO_BIG4_TREAT 0.072 0.53 -0.004 -0.63
POST_TREAT × TREATMENT_CO × NO_BIG4_TREAT + , + 0.111 0.48 0.016** 1.94
Control variables
Year × Industry × Country Indicators
Company Indicators
Adjusted R-Squared
No. of Observations
LN(DEBT) INVESTMENT
Included Included
Included Included
Included Included
93.5% 71.2%
15,140 19,727