real driving emissions and urban air quality euro 6
TRANSCRIPT

Conflicting Environmental Priorities
2
CO2
PM10NOX

Outline
Trends in European Air Quality
Real Driving Emissions: CO2
Real Driving Emissions:Air Quality pollutants
Method – Remote Sensing
Recent results Leeds Autumn/ Winter 2014
Zurich Summer 2014
Outlook
3
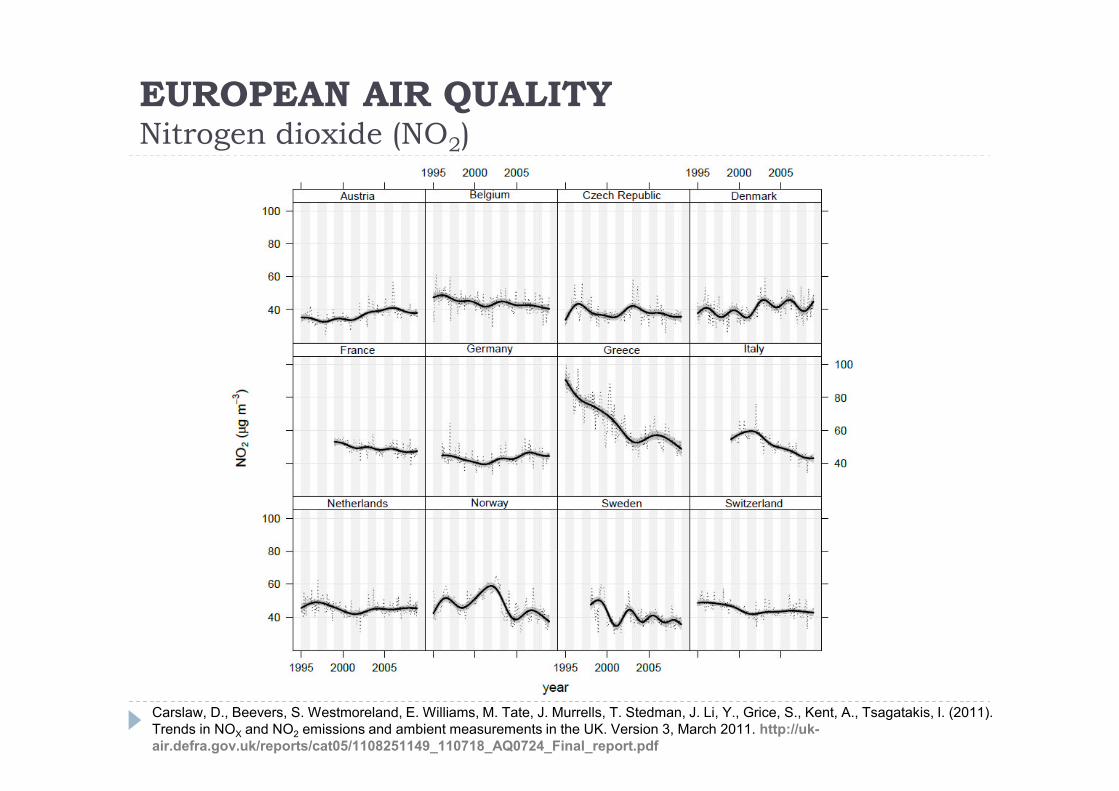
EUROPEAN AIR QUALITYNitrogen dioxide (NO2)
Carslaw, D., Beevers, S. Westmoreland, E. Williams, M. Tate, J. Murrells, T. Stedman, J. Li, Y., Grice, S., Kent, A., Tsagatakis, I. (2011).Trends in NOX and NO2 emissions and ambient measurements in the UK. Version 3, March 2011. http://uk-air.defra.gov.uk/reports/cat05/1108251149_110718_AQ0724_Final_report.pdf
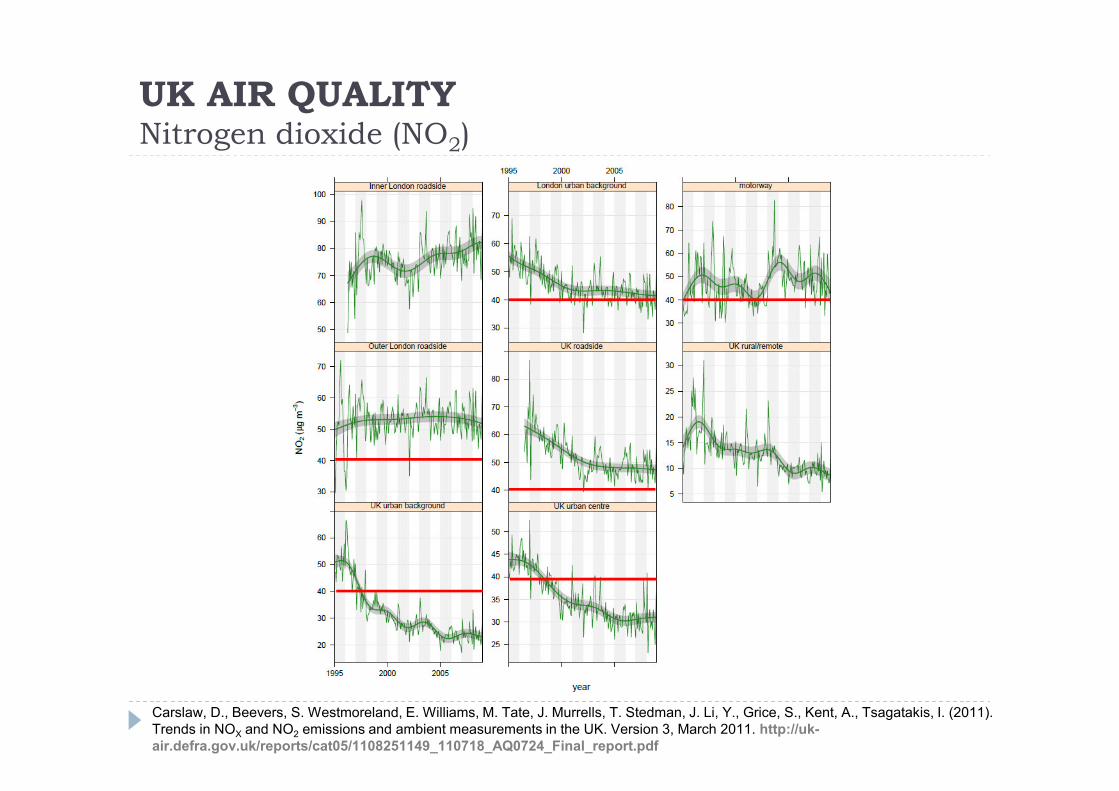
UK AIR QUALITYNitrogen dioxide (NO2)
Carslaw, D., Beevers, S. Westmoreland, E. Williams, M. Tate, J. Murrells, T. Stedman, J. Li, Y., Grice, S., Kent, A., Tsagatakis, I. (2011).Trends in NOX and NO2 emissions and ambient measurements in the UK. Version 3, March 2011. http://uk-air.defra.gov.uk/reports/cat05/1108251149_110718_AQ0724_Final_report.pdf

Environmental Priorities
CO2
6
CO2
PM10
NOX
0
5
10
15
20
25
30
35
40
0
76-9
4
100
110
120
130
140
150
160
170
180
190
200
210
Be
nef
itin
Kin
d(B
IK)
tax
[%o
flis
tp
rice
]
Type Approval CO2 (grams.km-1)
COMPANY CAR TAX £
60
80
100
120
140
160
180
200
1990 1995 2000 2005 2010 2015 2020 2025 2030
Typ
eA
pp
rova
lCO
2.Em
issi
on
s(g
ram
s.km
-1)
Vehicle Model Year
NEDC figures (SMMT New Car report)
Future Targets (ICCT & DfT)
AVERAGE CAR CO2 TARGETS

REAL DRIVING CO2 EMISSIONS vs. TYPE APPROVAL
Ligterink, N., Eijk,A. Update analysis of real-world fuel consumption of business passenger carsbased on Travelcard Nederland fuelpass data.TNO report 2014 R11063, July 2014
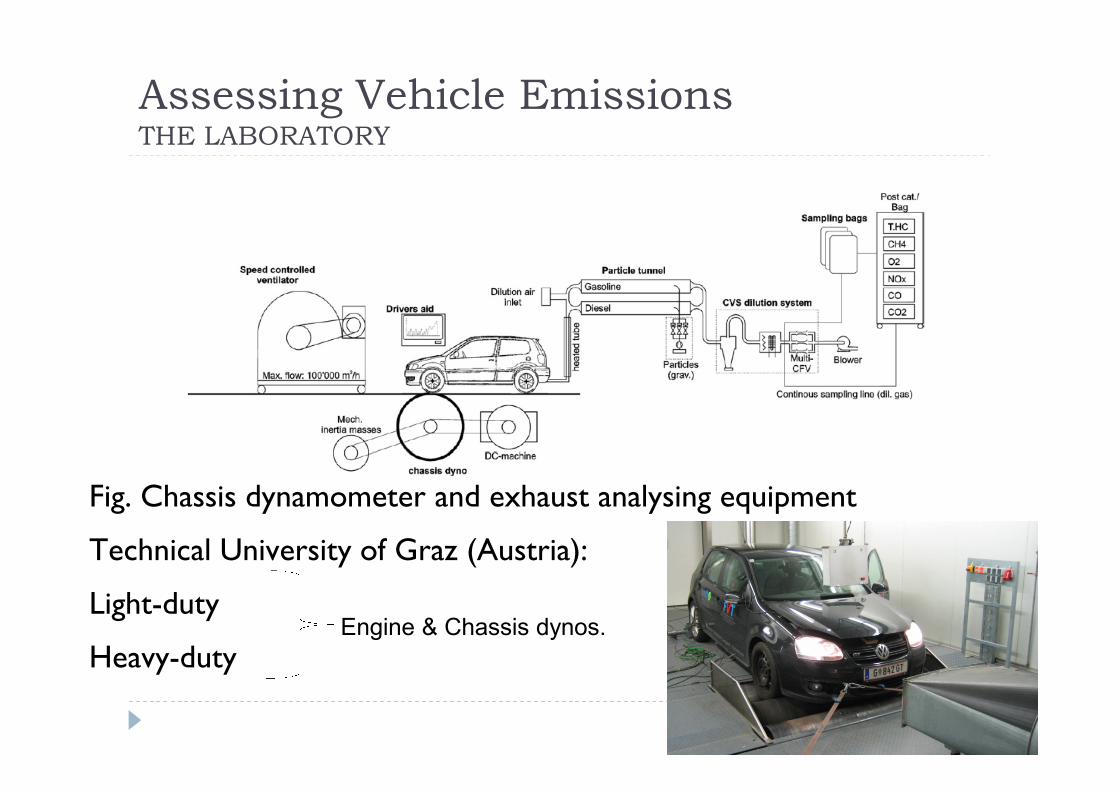
Assessing Vehicle EmissionsTHE LABORATORY
Fig. Chassis dynamometer and exhaust analysing equipment
Technical University of Graz (Austria):
Light-duty
Heavy-dutyEngine & Chassis dynos.

0 200 400 600 800 1000 1200 1400
020
40
60
80
12
0
NEDC - Speed Profile
Time (seconds)
Spe
ed
(km
h1)
Fig. Speed profile used for type approval purposes (New EU Drive-Cycle)
0 200 400 600 800 1000 1200 1400
01
02
03
04
05
06
0
ARTEMIS Urban - Speed Profile
Time (seconds)
Sp
ee
d(k
mh1)
Fig. Real-world driving: The Common ARTEMIS Drive Cycle (Andre, 2004).
ASSESSMENT OF VEHICLE EMISSIONSVehicle operation in the laboratory

10
2000 2005 2010 2015 2020
0.0
00
.01
0.0
20
.03
0.0
40
.05
0.0
6
Year of registrationP
M1
0(g
ram
s.k
m
1)
Euro III Euro IV Euro V Euro VI
CO2
PM10
NOX
Environmental Priorities
PM10

11
2000 2005 2010 2015 2020
0.0
0.1
0.2
0.3
0.4
0.5
0.6
Year of registration
NO
X(g
ram
s.k
m
1)
Euro III Euro IV Euro V Euro VICO2
PM10
NOX
Environmental Priorities
NOX

MethodRemote Sensing Real Driving Emissions (RDE)
12
Sheffield, May 2013
MethodRemote Sensing Real Driving Emissions (RDE)
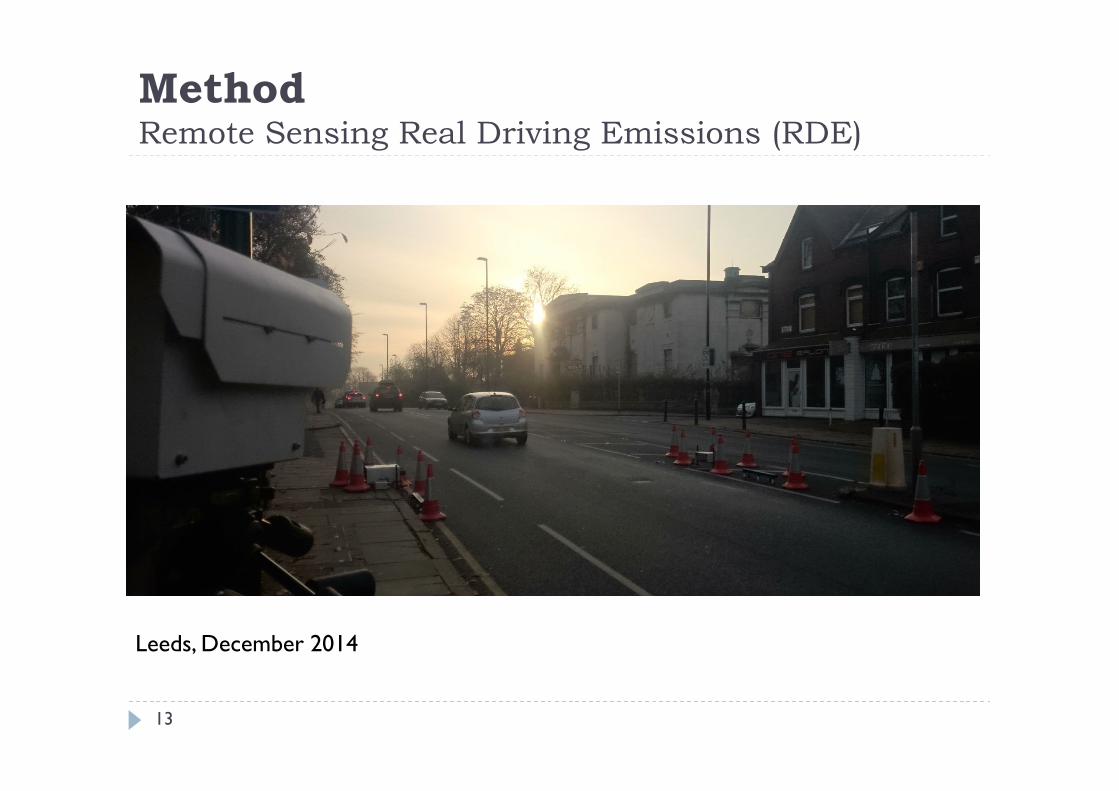
13
Leeds, December 2014

Camera(Number plate)
Vehicle Detector(Speed andAcceleration)
Source/Detector
Mirror Box
Source
Detector
Emissions Analyser(Common
Configurations)
Camera(Number plate)
Vehicle Detector(Speed andAcceleration)
Source/Detector
Mirror Box
Source
Detector
Emissions Analyser(Common
Configurations)
MethodRemote Sensing Real Driving Emissions (RDE)
ESP RSD-4600 instrument (www.esp-global.com)
UVIR

MethodRemote Sensing Real Driving Emissions (RDE)
PROS: “Real-world” or “on road” or “RDE”
BIG sample population
Understand the emissionperformance of the vehicle fleet
Trends
Degradation/ ageing technologies
High-emitters
Detailed knowledge of the vehiclefleet composition
Fast turn-round (one month)
Survey emerging technologies
e.g. EuroVI compliant vehicles
CONS: “Snap-shot” or “single-point”
measurement
Vehicle operating condition unknown
Loading
Cold-start or Hot-running
Elevated exhausts – NULL
Practical limitations
Dry weather conditions
Suitable survey locations limited
15
MethodRemote Sensing Real Driving Emissions (RDE)
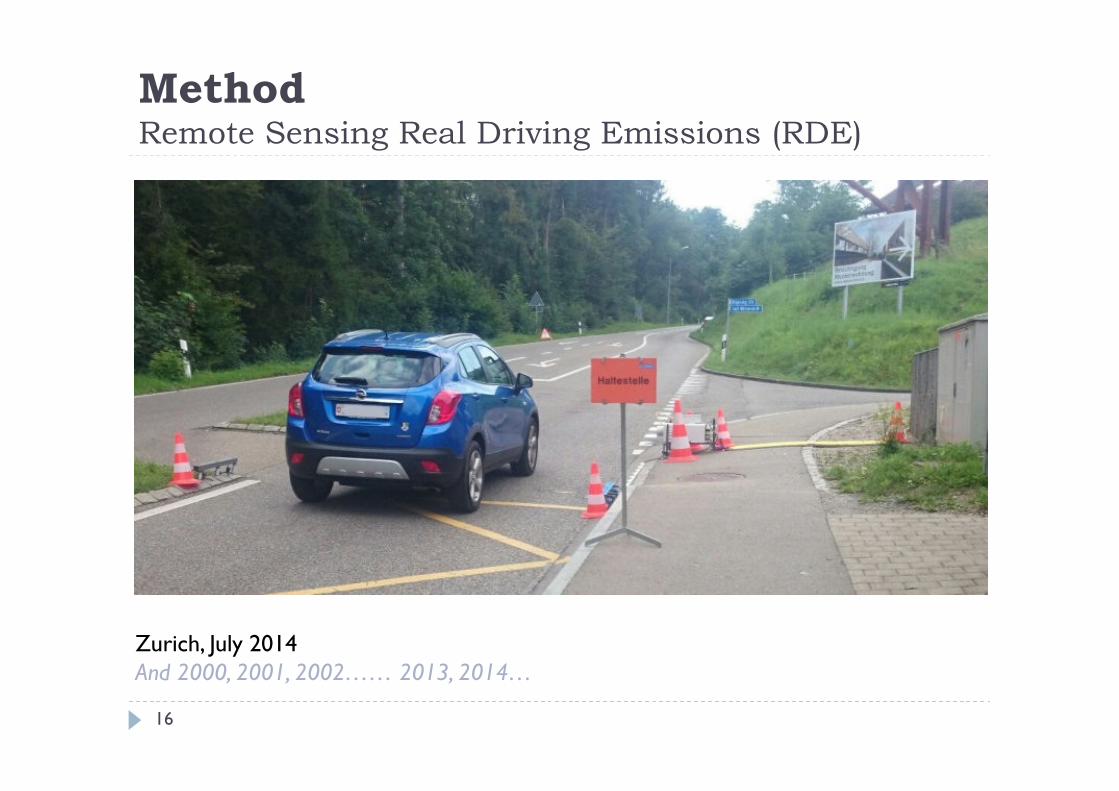
16
Zurich, July 2014And 2000, 2001, 2002…… 2013, 2014…

MethodZurich Remote Sensing Site
17
Zurich, July 201482m elevation gain1.2 kmAv. gradient 6.8 %

PM10 ResultsZurich, Summer 2014
18
Die
sel_
E0
Die
sel_
E1
Die
sel_
E2
Die
sel_
E3
Die
sel_
E4
Die
sel_
E5a
Die
sel_
E5b
Die
sel_
E6a
Die
sel_
E6b
Die
selH
ybrid_E
5
Petr
ol_
E0
Petr
ol_
E1
Petr
ol_
E2
Petr
ol_
E3
Petr
ol_
E4
Petr
ol_
E5a
Petr
ol_
E5b
Petr
ol_
E6b
Petr
olH
ybrid_E
4
Petr
olH
ybrid_E
5a
Petr
olH
ybrid_E
5b
Petr
olH
ybrid_E
6b
0.0
0.1
0.2
0.3
0.4P
MIn
dex
vol.ra
tio
[13]
[33]
[164]
[1220]
[4250]
[3315]
[3165]
[27]
[228]
[19]
[113]
[629]
[1805]
[2584]
[9141]
[3730]
[4360]
[520]
[233]
[85]
[307]
[3]
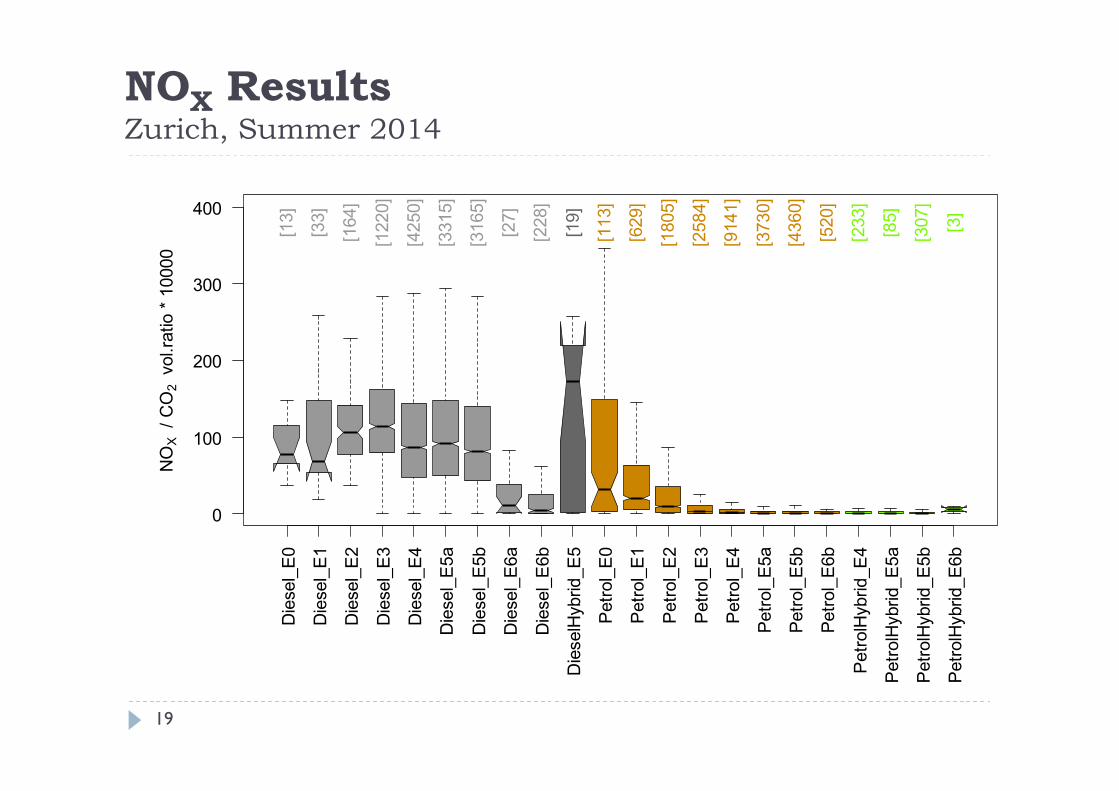
NOX ResultsZurich, Summer 2014
19
Die
sel_
E0
Die
sel_
E1
Die
sel_
E2
Die
sel_
E3
Die
sel_
E4
Die
sel_
E5a
Die
sel_
E5b
Die
sel_
E6a
Die
sel_
E6b
Die
selH
ybrid_E
5
Petr
ol_
E0
Petr
ol_
E1
Petr
ol_
E2
Petr
ol_
E3
Petr
ol_
E4
Petr
ol_
E5a
Petr
ol_
E5b
Petr
ol_
E6b
Petr
olH
ybrid_E
4
Petr
olH
ybrid_E
5a
Petr
olH
ybrid_E
5b
Petr
olH
ybrid_E
6b
0
100
200
300
400
NO
X/
CO
2vo
l.ratio
*10000
[13]
[33]
[164]
[1220]
[4250]
[3315]
[3165]
[27]
[228]
[19]
[113]
[629]
[1805]
[2584]
[9141]
[3730]
[4360]
[520]
[233]
[85]
[307]
[3]

OutlookDiesel Euro VI passenger cars
More information PEMS, Remote Sensing,‘BIG’ data
Initial assessment – good improvement over EuroV RDE in excess of emission standard limits
Large variation between vehicles e.g. ICCT 2014 PEMS report
Worst performance expected in congested driving conditions
Demands continuous review Not simply an evaluation of the first generation on of EuroVI vehicles
Deterioration of technology unknown SCR dosage strategies and maintenance a concern
Need to match powertrains to applications i.e. City cars => Petrol-hybrids
Motorway driving => Diesel cars
20

Conflicting Environmental Priorities
21
CO2
PM10NOX
