reading classroomthe fourth-grade - ets home · pdf filecombining reading and writing; and for...
TRANSCRIPT

Policy Information Report
The Fourth-Grade Reading Classroom
Policy Evaluationand ResearchCenter
Policy InformationCenter
Listening. Learning. Leading.
Visit us on the Web at www.ets.org/research
88503-37334 • U94E6
37334_4g_reading_cvr.indd 2-337334_4g_reading_cvr.indd 2-3 9/24/2004 11:23:38 AM9/24/2004 11:23:38 AM

This report was written by:
Richard J. ColeyPolicy Information CenterEducational Testing Service
Ashaki B. ColemanCherry Hill, New Jersey Public Schools
The views expressed in this report are those of the authors and do not necessarily refl ect the views of the offi cers and trustees of Educational Testing Service.
Additional copies of this report can be ordered for $15 (prepaid) from:
Policy Information CenterMail Stop 19-REducational Testing ServiceRosedale RoadPrinceton, NJ 08541-0001(609) [email protected]
Copies can be downloaded from:www.ets.org/research/pic
Copyright © 2004 by Educational Test ing Serv ice. Al l r ights reserved. Educational Testing Service is an Affi rmative Action/Equal Opportunity Employer. Educational Testing Service, ETS, and the ETS logo are registered trademarks of Educational Testing Service.
September 2004
Policy Evaluation and Research CenterPolicy Information CenterEducational Testing Service
Preface. . . . . . . . . . . . . . . . . . . . . . . . . . . . . . . . . . . . . . . . . . . . . . . . . . . . . . . . . . . . . . . 2
Acknowledgments. . . . . . . . . . . . . . . . . . . . . . . . . . . . . . . . . . . . . . . . . . . . . . . . . . . . . . 2
Executive Summary . . . . . . . . . . . . . . . . . . . . . . . . . . . . . . . . . . . . . . . . . . . . . . . . . . . . 3
Introduction . . . . . . . . . . . . . . . . . . . . . . . . . . . . . . . . . . . . . . . . . . . . . . . . . . . . . . . . . . . 5
Overview of Fourth-Grade Reading Achievement . . . . . . . . . . . . . . . . . . . . . . . . . . . . . 7
The Teachers . . . . . . . . . . . . . . . . . . . . . . . . . . . . . . . . . . . . . . . . . . . . . . . . . . . . . . . . . . 9
Highest Academic Degree . . . . . . . . . . . . . . . . . . . . . . . . . . . . . . . . . . . . . . . . . . . . 9
Majors and Minors . . . . . . . . . . . . . . . . . . . . . . . . . . . . . . . . . . . . . . . . . . . . . . . . . 10
Teacher Certifi cation . . . . . . . . . . . . . . . . . . . . . . . . . . . . . . . . . . . . . . . . . . . . . . . 11
Teaching Experience . . . . . . . . . . . . . . . . . . . . . . . . . . . . . . . . . . . . . . . . . . . . . . . 12
Teachers’ Attitudes About the Quality of Their Preparation. . . . . . . . . . . . . . . . . 13
The Schools . . . . . . . . . . . . . . . . . . . . . . . . . . . . . . . . . . . . . . . . . . . . . . . . . . . . . . . . . . 15
Teacher Attendance and Attrition . . . . . . . . . . . . . . . . . . . . . . . . . . . . . . . . . . . . . 15
Resources. . . . . . . . . . . . . . . . . . . . . . . . . . . . . . . . . . . . . . . . . . . . . . . . . . . . . . . . 16
Class Size . . . . . . . . . . . . . . . . . . . . . . . . . . . . . . . . . . . . . . . . . . . . . . . . . . . . . . . 16
Instructional Organization . . . . . . . . . . . . . . . . . . . . . . . . . . . . . . . . . . . . . . . . . . . 17
Time on Task . . . . . . . . . . . . . . . . . . . . . . . . . . . . . . . . . . . . . . . . . . . . . . . . . . . . . Time on Task . . . . . . . . . . . . . . . . . . . . . . . . . . . . . . . . . . . . . . . . . . . . . . . . . . . . . Time on Task 17
Grouping. . . . . . . . . . . . . . . . . . . . . . . . . . . . . . . . . . . . . . . . . . . . . . . . . . . . . . . . . 19
Remedial Instruction . . . . . . . . . . . . . . . . . . . . . . . . . . . . . . . . . . . . . . . . . . . . . . . 20
Reading Instruction . . . . . . . . . . . . . . . . . . . . . . . . . . . . . . . . . . . . . . . . . . . . . . . . . . . . 21
Classroom Assessment Practices . . . . . . . . . . . . . . . . . . . . . . . . . . . . . . . . . . . . . . . . 26
Summary and Conclusion . . . . . . . . . . . . . . . . . . . . . . . . . . . . . . . . . . . . . . . . . . . . . . 28

2
Preface
Acknowledgments
The data in this report are drawn from the National Assessment of Educational Progress, a Congressionally mandated project carried out by the U.S. Department of Education, Institute of Education Sciences, National Center for Education Statistics. The report was reviewed by Patricia Donahue,
Drew Gitomer, Margaret Goertz, Jacqueline Jones, Michael Nettles, and John Sabatini. Arlene Weiner was the editor, Loretta Casalaina provided desk-top publishing, and Joe Kolodey designed the cover. Errors of fact or interpretation are those of the authors.
Teachers and classrooms are in the forefront as the na-tion continues to implement the No Child Left Behind Act and pursues the critical goal of closing the achieve-ment gap among our children. Effective literacy and reading instruction are keys to achieving those objec-tives. The National Research Council has concluded that “quality classroom instruction in kindergarten and the primary grades is the single best weapon against reading failure.” This raises some critical ques-tions, including the following three: What does reading instruction look like in our nation’s classrooms? How is that instruction different for students of various groups? And what are the characteristics of the teach-ers who deliver that instruction?
To answer these questions, Richard Coley and Ashaki Coleman take advantage of the unique capabil-ity of the National Assessment of Educational Progress (NAEP) to peer into the nation’s schools and draw a picture of fourth-grade reading classrooms. Their picture includes teacher training, certifi cation, and ex-perience; the climate and characteristics of the school environment like class size and time on task; and the kinds of instructional and assessment practices that teachers use in their classrooms. In addition to the overall picture, Coley and Coleman examine the fourth graders and the schools they attend through a variety
of lenses, including distinctions by students’ race/eth-nicity and socioeconomic status, as well as by charac-teristics of the schools they attend.
The news that Coley and Coleman provide is mixed. On one hand, the overall health of fourth-grade reading instruction appears to be good. At least at the fourth-grade level, most teachers are fully certi-fi ed and well experienced. The majority of teachers feel that they are provided with suffi cient resources to teach their classes and are confi dent in their teach-ing abilities. And, most important, teachers appear to be matching their instruction to the needs of their students. On the other hand, not all students share equally in the resources. Some groups of students, for example, are more likely to attend schools with high teacher turnover or to be in large classes.
The view provided in this report gives us a sense of the status of reading instruction in the nation’s fourth-grade classrooms. If we are to succeed in reducing and eliminating the achievement gap among our students, we must ensure that all students are provided with the instructional resources that enable them to succeed in school. Databases like NAEP allow us to probe into the nation’s classrooms to see if all students share equally in the available resources and have equal chances for success. Our children, and our nation, deserve no less.
Michael T. NettlesVice PresidentPolicy Evaluation and
Research Center

3
Executive Summary
Effective reading and literacy instruction are keys to educational success and form a critical component in efforts to close the gaps in student achievement be-tween social classes and between racial/ethnic groups. The National Research Council has concluded that “quality classroom instruction in kindergarten and the primary grades is the single best weapon against read-ing failure.”1
This report draws on data from the National As-sessment of Educational Progress (NAEP) to provide a picture of the fourth-grade reading classroom.2 The picture includes views of teachers and their training, the climate and characteristics of the school environ-ment, and the kinds of instructional and assessment practices that teachers use in reading instruction. In addition to describing the national picture, the re-port focuses on differences among different types of schools and among racial/ethnic groups of students.
The fourth-grade reading classroom seen through the lens of the data examined for this report presents a mixed picture. First and foremost, there is much good news. In most U.S. fourth-grade reading classrooms, the teachers appear to meet typical state teacher certi-fi cation requirements. Nearly all hold a bachelor’s de-gree and many hold graduate degrees. Similarly, nearly all have standard or regular state certifi cation and many teachers have attained advanced certifi cation. Finally, this population of teachers is experienced: over half have taught for more than 10 years.
Most teachers feel that they are provided with ad-equate resources to teach, and class sizes, for the most part, are small. Most fourth graders have teachers who feel well prepared and confi dent to teach reading, and their teachers’ instructional practices seem to align fairly well with current notions of effective reading in-struction, such as those recommended by the National Reading Panel. In addition, there appears to be some matching of the needs of particular students with the instruction that is provided to them. For example, His-panic students are more likely than other students to have teachers who feel well prepared to teach limited-English-profi cient students. Similarly, students attend-
ing Title I schools appear to be getting more reading instruction than other students.
There is also bad news. Not all students share equally in educational resources. Black students, for example, are more likely than White and Asian stu-dents to attend schools with high teacher turnover. And Hispanic fourth graders are more likely than Black and White fourth graders to be in larger classes. More differences among racial/ethnic groups of stu-dents and among students attending different types of schools are described in the report.
An overall summary is provided below.
The Teachers
Fourth-grade reading teachers appear to have ap-propriate academic credentials: 58 percent have bachelor’s degrees and 36 percent have master’s degrees. Most undergraduate majors were in ele-mentary education (79 percent); the most common graduate major was also elementary education (49 percent).
Nearly all fourth graders are taught by teachers who have regular or standard certifi cation; 13 percent have advanced or professional certifi cation.
Fourth-grade reading teachers are well experi-enced as a group. More than half have more than 10 years of experience, and 19 percent have 25 years or more.
The majority of fourth graders had teachers who felt well prepared for classroom management and organization; for teaching spelling, grammar, and mechanics; for teaching content area reading; for literature-based instruction; for instruction combining reading and writing; and for teaching writing.
Few students had teachers who felt well prepared for teaching limited-English-profi cient students or for using software to teach reading or writing.
1 Catherine E. Snow, M. Susan Burns, and Peg Griffin (Eds.), Preventing Reading Difficulties in Young Children, National Research Council, Washington, DC: National Academy Press, 1998.
2 NAEP is a nationally representative and continuing assessment of what America’s students know and can do in various subjects.

4
The Schools
Teacher attendance and attrition do not seem to be general problems: 70 percent or more of fourth graders attend schools where 2 percent or fewer teachers are absent on an average day and no teachers leave before the end of the school year.
Most fourth graders’ teachers reported that they received all or most of the resources needed to teach their classes.
On average, fourth-grade students are in small classes. More than one-third of students were in classes with 20 or fewer students.
Although most fourth-grade reading instruction is delivered in self-contained classrooms (53 per-cent), 39 percent of students are “regrouped” for instruction, and 8 percent have “departmentalized” instruction.
More than half of the fourth graders receive be-tween 45 and 90 minutes of reading instruction per day; 39 percent receive between 60 and 90 minutes.
About one-third of fourth graders’ teachers re-ported that students were grouped for reading by ability; another third said that students were not grouped at all.
Ninety percent of fourth graders’ teachers reported that some part of their class received remedial reading instruction; only 41 percent reported some remedial writing instruction.
Instructional Practices
While 30 percent of fourth graders’ teachers teach reading to the whole class as a group, 41 percent indicated they taught the whole class with fl exible groups. About 20 percent break the class into more than two groups.
More than half of the fourth graders’ teachers use both basal and trade materials as the core of the reading program.
Seventy percent of the fourth-grade students’ teachers indicated that they used integrated read-ing and writing as a central part of their instruc-tion. The rest use that method as a supplement. Forty-three percent indicated that writing about literature was a central part of their instruction, 50 percent said it was a supplemental part of in-struction, and 7 percent did not use it at all.
Fourth graders were more likely to have teachers who focus instruction on reading to gain informa-tion than on reading to perform a task.
The most frequently used instructional practices were asking students to read silently and help-ing students to understand new words. About 80 percent of students’ teachers reported using these techniques almost every day. Teachers report in-frequently having students do projects about what they have read, giving quizzes or tests, or using children’s newspapers and magazines.
Classroom Assessment Practices
The most frequently used assessment practices were having students write paragraphs about what they had read, giving short-answer tests, and giv-ing oral reading assessments.
Few students had teachers who reported frequent use of reading portfolios, having students do ex-tended writing, or having students do individual or group projects or presentations.

5
Introduction
Effective reading and literacy instruction are keys to educational success and form a critical component in efforts to close the gaps in student achievement be-tween social classes and between racial/ethnic groups. The National Research Council has concluded that “quality classroom instruction in kindergarten and the primary grades is the single best weapon against read-ing failure.”3
In recognition of the importance of reading, there has been a renewed focus on trying to determine the best way or ways to teach it. For example, one of the most important efforts was undertaken in 1997 by the National Reading Panel (NRP). At the request of Congress, the panel spent two years examining re-search studies of various approaches to teaching read-ing. Following a series of regional hearings, the NRP settled on the following topics for study: alphabetics, including instruction in phonemic awareness and pho-nics; fl uency; comprehension, including instruction in vocabulary and text comprehension, and teacher preparation and comprehension strategies and instruc-tion; teacher education and reading instruction; and computer technology and reading instruction. Using an objective research review methodology, the NRP undertook a comprehensive, formal, evidence-based analysis of the experimental and quasi-experimen-tal research literature relevant to the selected topics. Overall, the panel concluded that
teaching children phonemic awareness signifi cant-ly improves their reading achievement more than instruction that lacks any attention to phonemic awareness;
systematic phonics instruction produces signifi -cant benefi ts for K-6 students having diffi culty learning to read;
guided oral reading has a signifi cant and positive impact on word recognition, fl uency, and compre-hension across a range of grade levels;
direct and indirect vocabulary instruction that is appropriate to the age and ability of the reader leads to gains in comprehension;
and teaching a combination of reading compre-hension techniques, such as question answering, question generation, and summarization is most effective.4
Against this backdrop, this report describes the features of fourth-grade reading classrooms in U.S. schools, based on data collected as part of the 2000 National Assessment of Educational Progress (NAEP).5
Since NAEP is a cross-sectional design, this report cannot make any causal link between these features and NAEP reading scores. Rather, the report capitaliz-es on NAEP’s unique capacity to peer into the nation’s classrooms to gather data about how reading is being taught. NAEP permits us to examine information about teachers’ qualifi cations and teachers’ experi-ence, including the types of degrees and certifi cation they hold and their perceptions of the adequacy of their preparation and training; information about the climate of the school, e.g., teacher attendance, class size, and the extent of remedial instruction that is provided; information about the assessment practices of classroom teachers; and a variety of data about how teachers teach reading, including how they organize their classrooms for instruction, the types of materials
3 Snow et al., 1998.4 National Reading Panel, Report of the National Reading Panel: Teaching Children to Read, An Evidence-Based Assessment of the Scientific
Research Literature on Reading and its Impact for Reading Instruction, Washington, DC: NIFL, NICHD, 2000.5 Patricia L. Donahue, Robert J. Finnegan, Anthony D. Lutkus, Nancy L. Allen and Jay R. Campbell, The Nation’s Report Card: Fourth-
Grade Reading 2000, Washington, DC: U.S. Department of Education, Office of Educational Research and Improvement, National Center for Education Statistics, NCES 2001– 499, April 2001. The findings in this report apply to the fourth grade only. It is possible or even likely that at other grade levels, results would differ. For example, it is less likely at the fourth-grade level to find teachers teaching out-of-field, since most elementary school teachers are certified in elementary education.

6
they use in class, and the extent to which they use a variety of instructional approaches and techniques in their classrooms.6
The report provides not only a national portrait of the fourth-grade reading classroom, but also an assessment of how the view differs by type of school and by the race/ethnicity of students. For example, do teachers’ qualifi cations or experience in public schools differ from those in private schools? Do teachers’ in-structional practices differ by the race/ethnicity of the student or by the location of the school?
The next section of this report provides a brief overview of fourth-grade reading achievement in the United States in 2002 and how it varies for groups defi ned by selected student demographic factors:
race/ethnicity
type of school attended (public, Catholic, or other private);
eligible for Title I funding or not; and
community type.7
6 As part of the 2000 NAEP Reading Assessment, information was collected from teachers and schools on instructional practices and other school factors. The choice of the factors studied reflects the perspectives of practitioners, educational researchers, and policy makers. There may be other school conditions and practices that foster instruction and learning, but these represent factors that have been widely discussed in the school effectiveness and improvement literature and that have been the subject of many research efforts. NAEP is based on a nationally representative sample of students, not teachers. Thus, the information and data provided in this report pertain to the characteristics and practices of teachers of a representative sample of fourth-grade students, not teachers. Consequently, the percentages reported throughout this report should be interpreted as the percentage of students whose teachers possess that characteristic or use that practice.
7 NAEP results are reported for students attending schools in three mutually exclusive location types: central city, urban fringe/large town, and rural/small town.
8 All differences discussed are statistically significant based on the False Discovery Rate (FDR) technique, a conservative approach for making comparisons across groups.
Because reading achievement is uneven across these groups, the major focus of this report is to investigate whether there are statistically signifi cant differences in the reading instruction provided to the different groups of students and what the differences may be.8
Following the summary of reading achievement, the next section focuses on teacher preparation and qualifi cations, including data on teachers’ attitudes about the adequacy and quality of their preparation in several instructional areas. The following section examines several factors that are related to the over-all climate of a school. Subsequent sections provide information on how reading instruction is delivered in fourth-grade classrooms and detail about assessment practices in the classroom. In each section the discus-sion moves from an overview of the national picture to a disaggregated view, focusing on how important subgroups of students fare.

7
Overview of Fourth-Grade Reading Achievement
This section of the report provides an overview of the reading achievement of fourth-grade students as measured and reported by the National Assessment of Educational Progress (NAEP).9 In 2002, the average NAEP score for fourth graders was 219 (on a scale of 0 to 500), with girls scoring higher than boys (222 versus 215). This score was an improvement over the average scores in 1994, 1998, and 2000, but was not signifi -cantly different from the average score in 1992. Figure 1 shows the average scores for selected sub-groups of fourth graders. fi g1
White and Asian/Pacifi c Islander10 students scored higher than students in the other racial/ethnic groups,
9 All differences discussed here are statistically significant. For more complete results for 2002, see W.S. Grigg, M.C. Daane, Y. Jin, and J.R. Campbell, The Nation’s Report Card: Reading 2002, Washington, DC: U.S. Department of Education, Institute of Education Sciences, National Center for Education Statistics, NCES 2003-521, June 2003.
10 For brevity, these students are referred to as “Asian” in this report.
and White students also scored higher than Asian/Pa-cifi c Islanders. American Indian/Alaska Native fourth graders had higher average scores than Black and Hispanic fourth graders.
There were also signifi cant differences among students attending different types of schools. Students who attended non-public schools had higher average reading scores than their public school peers. Also, students attending schools that were not eligible for Title I funding had higher scores, on average, than students in schools eligible for that funding. Finally, students attending schools in urban fringe/large town areas outperformed students in schools in central city and rural areas.
Figure 1:Average NAEP Reading Scores, Grade 4, 2002
All
BlackHispanic
White
PublicCatholic
Other Private
Title I Non-Title I
Central CityUrban Fringe/Large Town
Rural/Small Town
Average Reading Scale Score0 150 200 250 500
219
Asian/Pacific Islander 224American Indian/Alaska Native 207
199201
229
217234235
201227
212223220
Source: W.S. Grigg, M.C. Daane, Y. Jin, and J.R. Campbell, The Nation’s ReportCard: Reading 2002, Washington, DC: U.S. Dept. of Education, Institute ofEducation Sciences, National Center for Education Statistics, NCES 2003-521,June 2003.

8
NAEP also reports results in terms of the percent-ages of students who scored below, at, or above three levels of reading achievement: Basic, Profi cient, and Advanced. These data are shown in Table 1.11 As this table shows, more than half the Black and Hispanic fourth graders scored below the Basic level. The differ-ences viewed in this way generally mirror the differ-ences in average reading scale scores.
The achievement data discussed in this section of the report provide an important indicator of educa-tional outcomes in reading. Teachers and schools are increasingly being held accountable for reading out-comes. Thus, the next section of this report provides and discusses data about fourth-grade reading teachers, their schools, their preparation, and their teaching. tbl 1
Table 1: Percentage of Students Scoring at or Below Each NAEP Reading Achievement Level, Grade 4, 2002
Below Basic At Basic At Profi cient At Advanced
All 36 32 24 7
American Indian/Alaska Native 49 29 17 5
Asian/Pacifi c Islander 30 33 27 10
Black 60 28 11 2
Hispanic 56 29 13 2
White 25 35 31 10
Public 38 32 23 6
Catholic 20 33 34 13
Other Private 20 32 35 14
Title I 56 29 13 2
Non-Title I 26 34 30 10
Central City 45 30 20 6
Urban Fringe/Large Town 31 33 27 9
Rural/Small Town 34 35 25 6
Source: W.S. Grigg, M.C. Daane, Y. Jin, and J.R. Campbell, The Nation’s Report Card: Reading 2002, Washington, DC: U.S. Department of Education, Institute of Education Sciences, National Center for Education Statistics, NCES 2003-521, June 2003.
11 These student performance standards, or “achievement levels,” are defined by the National Assessment Governing Board. The Basic level denotes partial mastery of prerequisite knowledge and skills that are fundamental for proficient work at each grade. For fourth grad-ers, Basic is described as follows: “Fourth-grade students performing at this level should demonstrate an understanding of the overall meaning of what they read. When reading text appropriate for fourth graders, they should be able to make relatively obvious connections between the text and their own experiences, and extend the ideas in the text by making simple inferences.”

9
The Teachers
Overall, fourth-grade reading teachers appear to meet typical state teacher certifi cation requirements and have confi dence in their abilities to teach. Nearly all have at least a bachelor’s degree and many have earned a master’s degree. Nearly all have standard teacher certifi cation and many have attained advanced or professional certifi cation. As a group, they have much teaching experience; many have 25 or more years of experience in the classroom. The majority of teachers feel that their teacher education programs and professional development activities were effective in preparing them in classroom management and organization and in several important aspects of teaching reading.
12 International Reading Association, Prepared to Make a Difference, National Commission on Excellence in Elementary Teacher Preparation for Reading Instruction, 2003.
13 U.S. Department of Education, Office of Policy Planning and Innovation, Meeting the Highly Qualified Teachers Challenge: The Secretary’s Second Annual Report on Teacher Quality,Second Annual Report on Teacher Quality,Second Annual Report on Teacher Quality June 2003.
14 See “Rigor Disputed in Standard for Teachers,” Education Week, January 14, 2004. The Education Commission of the States (ECS) maintains a data base showing each state’s efforts in developing a “high objective uniform state standard of evaluation,” or HOUSEE, as required by NCLB.
It is well recognized that the quality of teaching is a key determinant of student reading achievement.12
One of the more signifi cant requirements of the No Child Left Behind Act (NCLB) is that by the end of the 2005–2006 school year, all teachers of core academic subjects must be “highly qualifi ed.” According to the law, to be highly qualifi ed, teachers must hold at least a bachelor’s degree from a four-year institution, must have full state certifi cation, and must demonstrate competence in their subject area. Newly hired elemen-tary school teachers working in core academic areas must pass a rigorous state test of subject knowledge and teaching skills in reading/language arts, writing, mathematics, and other areas of the basic elementary curriculum.13 Veteran elementary school teachers may show content knowledge by passing a test or by meet-ing special requirements set by each state within broad federal guidelines.14
NAEP asks teachers of assessed students a number of questions bearing on teacher qualifi cations. These data include the highest education degree attained, the subjects of their major and minor in undergradu-ate and graduate preparation, the type of certifi cation they held in the main fi eld of their assignment, and the number of years they had taught. The teachers were also asked to rate how well prepared they were, by their college or university courses or professional development workshops, in a number of aspects of instruction.
This section presents those data for the nation as a whole and also notes areas where differences in teachers’ preparation, experience, and confi dence exist based on students’ race/ethnicity; whether they attend public, Catholic, or other private schools; whether or not their schools provide Title I services; and the type of community (central city, urban fringe/large town, or rural/small town) in which they attend school.
Highest Academic Degree
Most of these fourth-grade students had teachers who are well prepared academically, and thus would meet the academic requirements of NCLB for teachers. Ninety-four percent of the students’ teachers held a bachelor’s or master’s degree; 58 percent of the teach-ers reported a bachelor’s degree as their highest degree and 36 percent reported holding a master’s degree. Five percent held a degree termed “education special-ist.”
Public school students were more likely than students attending Catholic schools and other private schools to have teachers with master’s degrees; 38 percent of public school students had teachers with a master’s degree, compared to 21 and 19 percent of stu-dents in Catholic and other private schools, respective-ly. Conversely, students attending Catholic schools (74 percent) and other private schools (76 percent) were more likely than public school students (56 percent) to have teachers whose highest degree was a bachelor’s.

10
Majors and Minors
Most of the fourth graders (79 percent) were taught by teachers who had an undergraduate major in elemen-tary education. An additional 6 percent of the students were taught by a teacher with an undergraduate minor in elementary education. Most of the other reading-related majors reported were in English and reading/
language arts (6 percent and 4 percent, respectively). These data are shown in Figure 2.15
Figure 2 also shows that at the graduate level, too, elementary education was the most common focus, with 49 percent of the students taught by a teacher with a graduate major in the subject. Ten percent of the students had reading teachers with a reading/lan-guage arts major in graduate school.
15 All of the data shown in Figures 2–16 are from the 2000 fourth-grade NAEP national reading assessment.
Figure 2:Percentage of Students Taught by Teachers with Various Undergraduate and Graduate Majors and Minors
Elementary Education
English
Reading/Language Arts
English
Reading/Language Arts
Elementary Education
Elementary Education
Reading/Language Arts
Reading/Language Arts
Elementary Education
79
6
4
15
9
6
49
10
6
4
Undergraduate Major
Undergraduate Minor
Graduate Major
Graduate Minor
Source: Data from the 2000 National Assessment of Educational Progress analyzed by the ETS Policy Information Center.
Percentage
1000 20 40 60 80

11
Teacher Certifi cation
Almost 90 percent of these fourth graders had teachers who held at least regular or standard certifi cation (75 percent reported regular/standard certifi cation and 13 percent reported advanced/professional certifi cation). Overall, only 3 percent of the nation’s fourth graders were taught by uncertifi ed teachers. These data are shown in Figure 3.
Students attending public school were more likely to have certifi ed teachers. One percent of fourth grad-ers attending public schools had uncertifi ed teachers,
compared to 19 percent of students in Catholic schools and 21 percent of students in other private schools. Public school students were also more likely than stu-dents attending Catholic schools to have teachers with advanced certifi cation (14 percent versus 5 percent) and more likely than students attending other private schools to have teachers with regular certifi cation (77 percent versus 59 percent). Finally, students attending schools in central cities were more likely than students in rural/small town areas to have uncertifi ed teachers (5 percent versus 1 percent).
Figure 3:Percentage of Students by Teachers’ Type of Certifi cation in Main Assignment Field
Regular/Standard
Advanced/Professional
Temporary/Provisional
Probationary State
Other than State
None
1000 20 40 60 80
75
13
5
4
1
3
Percentage
Source: Data from the 2000 National Assessment of Educational Progressanalyzed by the ETS Policy Information Center.

12
Teaching Experience
Figure 4 shows the percentages of fourth graders taught by teachers with different amounts of experi-ence in teaching reading. The teachers’ years of service are broken into fi ve categories.16 This population of teachers is well experienced: 19 percent reported
having 25 or more years of experience and another 32 percent reported between 11 and 24 years. Only 14 percent of fourth graders have teachers with two years experience or less. White students (21 percent) were more likely than Hispanic (13 percent) and Asian students (11 percent) to have teachers with 25 or more years of experience in teaching reading. fi g 4
Figure 4:Percentage of Students by Number of Years of Teacher Experience Teaching Reading
19
32
18
17
14
25 yearsor more
11 to 24 Years
6 to 10 years
3 to 5 years
2 years or less
Source: Data from the 2000 National Assessment of Educational Progressanalyzed by the ETS Policy Information Center.
Percentage
0 10 20 30 40
16 Years of experience include any permanent full-time or part-time assignments, but not substitute assignments.

13
Teachers’ Attitudes About the Quality of Their Preparation
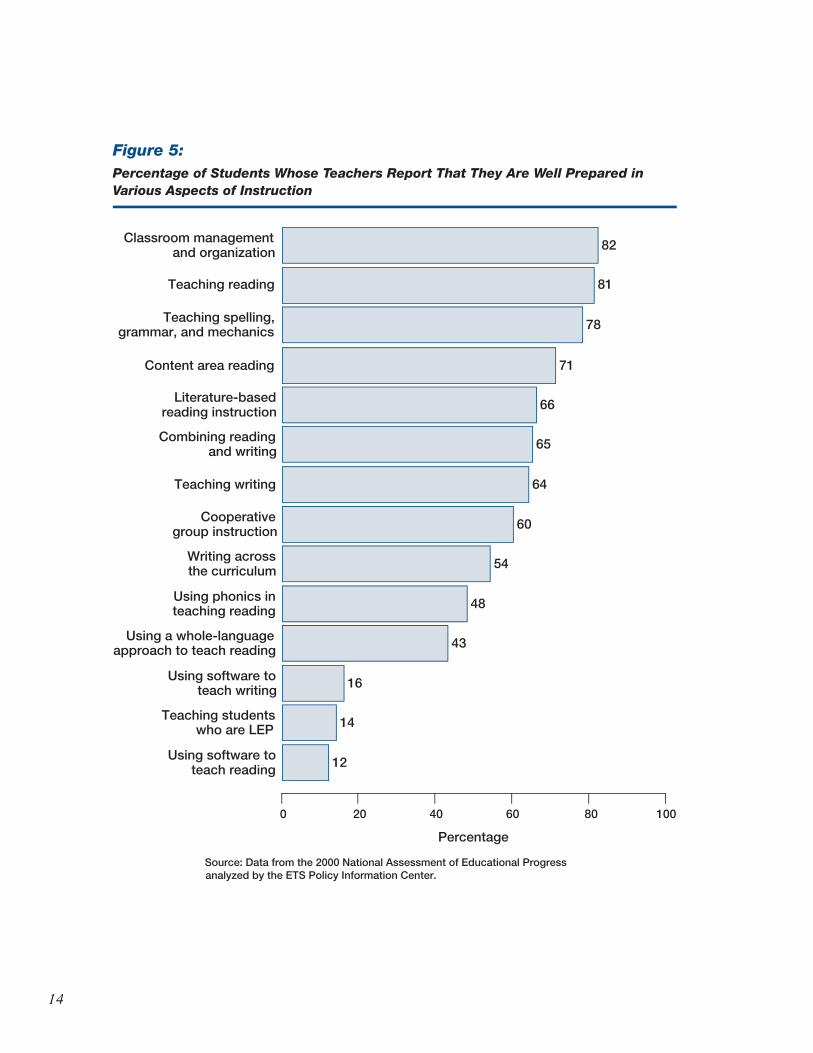
While the content of teacher education programs and the effectiveness of professional development pro-grams are subjects of debate, one important gauge of the effectiveness of training is whether teachers consider themselves adequately prepared for various aspects of their work. The reading teachers of fourth graders were asked to rate how well their college or university courses or professional development work-shops prepared them to provide a variety of aspects of instruction. Their responses are summarized in Figure 5, which shows for each of 14 of these aspects the per-centage of students whose teachers reported that they were well prepared.
As shown, the majority of students had teachers who felt that they were well prepared in classroom management and organization, and in several key as-pects of teaching reading, including teaching spelling, grammar, and mechanics; content area reading; litera-ture-based reading instruction; instruction combin-ing reading and writing; and teaching writing. Much smaller percentages of students had teachers who felt that they were well prepared to use software to teach reading and writing or to teach limited-English-profi -cient students (LEP). fi g 5
While there were not many differences in teachers’ self-reported preparation, some were found and are noted here.
Students in Title I schools were less likely than stu-dents in non-Title I schools to have teachers who felt well prepared in classroom management and organization (77 percent versus 85 percent).
Students in central cities (66 percent) and urban fringe/large town areas (71 percent) were more likely than students in rural areas (55 percent) to have teachers who felt well prepared to implement literature-based reading instruction.
Students in central cities (59 percent) and urban fringe/large town areas (67 percent) were more likely than students attending rural schools (48 percent) to have teachers who felt well prepared in cooperative group instruction.
Hispanic students (39 percent) were more likely than Asian (20 percent), Black (11 percent), and White students (10 percent) to have teachers who felt well prepared to teach LEP students. Students in central cities (19 percent) and urban fringe/large town areas (15 percent) were more likely to have teachers who felt well prepared in this area than students in rural schools (6 percent).
Teachers of students in central cities (16 percent) and urban fringe/large town schools (18 percent) were more likely to feel well prepared to use soft-ware for teaching writing than teachers of students in rural areas (9 percent).
Teachers of students in Title I schools (16 percent) were more likely to feel well prepared to use soft-ware to teach reading than teachers of students in non-Title I schools (10 percent).
14
Figure 5:Percentage of Students Whose Teachers Report That They Are Well Prepared in Various Aspects of Instruction
82
81
78
71
66
65
64
60
54
48
43
16
14
12Using software toteach reading
Teaching studentswho are LEP
Using software toteach writing
Using a whole-languageapproach to teach reading
Using phonics inteaching reading
Writing acrossthe curriculum
Cooperativegroup instruction
Teaching writing
Combining readingand writing
Literature-basedreading instruction
Content area reading
Teaching spelling,grammar, and mechanics
Teaching reading
Classroom managementand organization
Percentage
Source: Data from the 2000 National Assessment of Educational Progressanalyzed by the ETS Policy Information Center.
1000 20 40 60 80

15
The Schools
Generally, the climate of the schools attended by fourth graders appears to be healthy. Teacher attendance is high, teacher attrition is low, and most teachers report that they receive adequate resources to teach their classes. Class sizes are moderate for the most part. Most reading instruction is delivered in self-contained classrooms. Most teachers provide remedial reading instruction to some part of their class.
Figure 6:Percentage of Students by Teacher Attendance and Attrition
0 to 2 percent
3 to 5 percent
6 percent or more
None
1 to 5 percent
6 to 20 percent
More than 20 percent
70
26
4
77
21
1
1
Percentage of Teachers Absent on an Average Day
Source: Data from the 2000 National Assessment of Educational Progressanalyzed by the ETS Policy Information Center.
Percentage of Teachers Who Left Before the End of the School Year
Percentage
1000 20 40 60 80
This section of the report examines data from the NAEP reading assessment about school and classroom climate, including teacher attendance, class size, how classroom reading instruction is managed, and the amount of remediation that is provided in both read-ing and writing instruction.
Teacher Attendance and Attrition
Figure 6 shows data on teacher attendance and at-trition for the schools attended by these fourth grad-ers. Seventy percent of these students attend schools where 2 percent of teachers or fewer are absent on an
average day; 26 percent attend schools where 3 to 5 percent are absent; and 4 percent attend schools where 6 percent of the teachers or more are absent daily. Students attending Catholic schools (91 percent) were more likely than students attending public schools (67 percent) to have only 2 percent or fewer of their teach-ers absent daily. fi g 6
Figure 6 also shows data on teacher attrition during the school year. Seventy-seven percent of the fourth graders were in schools where none of the teachers left during the year and 21 percent were in

16
schools where between 1 and 5 percent of the teachers left. Few attended schools where teacher attrition was higher. White (83 percent) and Asian fourth graders (84 percent) were more likely than Black fourth grad-ers (65 percent) to be in schools where none of the teachers left during the year. Students attending Title I schools (68 percent) were less likely than non-Title I students (83 percent) to attend schools with no teacher attrition. Students attending central-city schools (67 percent) were less likely than students in urban fringe/large town schools (84 percent) to be in schools with no attrition.
Resources
Teachers were asked to provide their judgment about the adequacy of the instructional materials and other resources that they received to teach their class. Over-all, 17 percent of the students had teachers who indi-cated that they received all of the resources they need; 54 percent had teachers who said they got most of what they need; 28 percent had teachers who said that
they got some of the needed resources; and about 1 percent had teachers who said that they do not get the resources they need to teach their class. There were no statistically signifi cant differences among teachers of groups of students defi ned by race/ethnicity, type of school, and school location.
Class Size
While the debate over the effects of class size on achievement continues, there is some agreement that smaller classes (say, of 20 or fewer students) are ben-efi cial to student achievement, especially in the prima-ry grades.17 Teachers of fourth-grade students in this reading assessment were asked to indicate the average size of their reading class. Their responses are shown in Figure 7. Overall, 36 percent of students were in reading classes of 20 students or fewer, 37 percent were in classes of 21 to 25 students, 20 percent were in classes of 26 to 30 students, and 8 percent were in classes of more than 30 students. fi g 7
Figure 7:Percentage of Students by Class Size
20 or fewer
21 to 25
26 to 30
More than 30
36
37
20
8
Source: Data from the 2000 National Assessment of Educational Progressanalyzed by the ETS Policy Information Center.
Number of Students:
Percentage
500 10 20 30 40
17 For one review of the research on this topic, see Bruce J. Biddle and David C. Berliner, What Research Says About Small Classes and Their Effects, Policy Perspectives, WestEd, 2002.

17
There were many differences in class size patterns, some of which are statistically signifi cant. Hispanic students (19 percent) were more likely than White students (4 percent) and Black students (6 percent) to be in reading classes with more than 30 students. Asian students (20 percent) were less likely than White students (36 percent) and Black students (40 percent) to be in classes with 20 children or fewer. Also, White students (41 percent) were more likely than Hispanic students (24 percent) to be in reading classes with between 21 and 25 students.
Students attending urban fringe/large town schools (25 percent) were more likely than children at-tending schools in central cities (41 percent) and rural schools (49 percent) to be in classes smaller than 20 students. Children attending public schools and Catho-lic schools were more likely to have larger reading classes than children attending other private schools: 71 percent of children attending these other private schools were in classes of 20 students or fewer, com-pared to only about one-third of public and Catholic school students.
Instructional Organization
Teachers were asked how the fourth graders in their schools were organized for reading instruction. Teach-ers of 53 percent of the students reported that students were instructed in self-contained classrooms, teachers of 8 percent said that instruction was “departmental-ized,” and teachers of 39 percent said that students were “regrouped” for instruction. Catholic school
students (35 percent) were less likely than students attending other private schools (69 percent) to be in self-contained classrooms.
Time on Task
Teachers were asked to indicate how much time they spent on reading instruction in a typical day (see Figure 8). The largest group of students (39 percent) had teachers who responded that they spent 60 to 90 minutes per day on reading. Thirty-two percent of the students had teachers who said they spent 45 to 59 minutes per day. The next largest group (17 percent) had teachers who reported that they spent between 30 and 44 minutes per day on reading, and 11 percent had teachers who reported that they spent more than 90 minutes per day on reading instruction.
Hispanic fourth graders (20 percent) were more likely than White fourth graders (7 percent) to have teachers who reported more than 90 minutes of read-ing instruction on a typical day. Public school students (42 percent) were more likely than students attending Catholic schools (15 percent) and other private schools (19 percent) to receive 60 to 90 minutes of reading instruction on a typical day. Also, students attend-ing Title I schools (16 percent) were more likely than students attending non-Title I schools (8 percent) to have teachers who reported more than 90 minutes of instruction. Finally, teachers in central city schools (16 percent) were more likely than teachers in rural schools (5 percent) to report more than 90 minutes of reading instruction daily.
fi g 8

18
Figure 8:Percentage of Students by Minutes per Day of Reading Instruction
More than 90
60 to 90
45 to 59
30 to 44
Less than 30
11
39
32
17
1
Minutes per day:
Source: Data from the 2000 National Assessment of Educational Progressanalyzed by the ETS Policy Information Center.
Percentage
500 10 20 30 40

19
Grouping
Teachers were asked two questions about grouping students. First, they were asked whether students were assigned to their class by ability. Twenty-four percent of the fourth graders had teachers who responded in the affi rmative. Black and Hispanic fourth graders (33 percent) were more likely than White students (20 percent) to be assigned to the reading class based on ability. Students attending central city schools (37 percent) were more likely to be grouped by ability than students in rural and urban fringe/large town schools (18 percent).
On the second question, teachers were also asked to identify the basis on which they create instructional groups for reading in class. These data are shown in Figure 9. Thirty-fi ve percent of the students had teach-ers who said that they did not create instructional groups in class. Of the students whose teachers report-ed assigning students to reading groups, 37 percent had teachers who did so based on ability, 12 percent
based on diversity, 7 percent based on interest, and 10 percent on the basis of some other factor. The data revealed several differences among groups of students:
Hispanic students (46 percent) were more likely than White students (33 percent) to be grouped by ability.
Black students (19 percent) were more likely than White students (10 percent) and Hispanic students (9 percent) to be grouped for diversity.
Black students (75 percent) were more likely than White students (62 percent) to be grouped for reading.
Public school students (68 percent) were more likely than Catholic school students (41 percent) to be grouped for reading.
Students attending schools in central cities (46 percent) were more likely to be grouped by ability than students attending rural schools (25 percent).
fi g 9
Figure 9:Basis for Creating Instructional Groups in Reading
No Groups
Grouped by Ability
Grouped for Diversity
Grouped by Interest
35
37
12
7
Source: Data from the 2000 National Assessment of Educational Progressanalyzed by the ETS Policy Information Center.
Percentage
500 10 20 30 40

20
Remedial Instruction
Teachers were asked to indicate the percentage of stu-dents in their school who receive remedial reading and writing instruction. These data are detailed in Figure 10. Overall, 7 percent of the fourth graders had teach-ers who reported that more than half of the students received remedial reading instruction, 83 percent had teachers who said half or less received such instruc-tion, and 10 percent had teachers who responded that no students received such instruction. Catholic school students (22 percent) and students attending other pri-vate schools (34 percent) were more likely than public school students (8 percent) to attend schools where no remedial reading was provided. As might be expected, remedial reading instruction was more prevalent in Title I schools. Students attending Title I schools were more likely to have teachers reporting that more than
half of the students receive remediation (14 percent of Title I students, compared to 2 percent of non-Title I students). fi g 10
In writing, remedial instruction was less com-mon— 41 percent of fourth graders had teachers who reported that no remedial writing was provided. Fifty-three percent reported that half or less of their students receive remedial writing, and only 5 percent reported that more than half of the students receive remediation. Remedial writing was more prevalent in public and Catholic schools and, as might be expected, in Title I schools. Students in other private schools (63 percent) were more likely to attend schools where no remedial writing is provided than public school stu-dents (40 percent). Only 29 percent of students in Title I schools were in schools where no remedial writing was provided, compared to 49 percent of non-Title I students.
Figure 10:Percentage of Students Receiving Remedial Reading and Writing Instruction
None
1 to 5 Percent
6 to 10 Percent
11 to 25 Percent
26 to 50 Percent
51 to 75 Percent
76 to 90 Percent
Over 90 Percent
10
17
27
26
13
5
1
1
41
19
14
11
9
3
1
1
None
1 to 5 Percent
6 to 10 Percent
11 to 25 Percent
26 to 50 Percent
51 to 75 Percent
76 to 90 Percent
Over 90 Percent
Remedial Reading
Remedial Writing
Source: Data from the 2000 National Assessment of Educational Progressanalyzed by the ETS Policy Information Center.
Percentage
500 10 20 30 40

21
Reading Instruction
Fourth-grade reading is typically taught in groups within the classroom. Most teachers reported using integrated reading and writing as a central part of their instruction. Many teachers also use writing about literature as a central feature. The most frequently used instructional techniques were asking students to read silently and helping students to understand new words.
18 As noted earlier, the content of the NAEP background questionnaires reflects the perspectives of educators and policy makers on factors believed to be related to effective instructional practice.
This section provides a description of the way fourth-grade reading teachers organize their classrooms for instruction, the types of materials they use in class, and the extent to which these teachers use a variety of instructional approaches and techniques in their classrooms.
With the NRP conclusions described in the In-troduction to this report as background, we make no judgments here about “good” or “bad” practices; our purpose is simply to describe the reading classroom based on the information collected on the school and teacher questionnaires used in the NAEP assessment.18
Teachers were asked how they usually divided up the class when teaching reading. As shown in Figure 11, the majority of students had teachers who either teach to the whole class (30 percent) or to the whole class with fl exible groups (41 percent). About 20 percent of the students had teachers who divided the class into more than two groups. Hispanic students (14 percent) were more likely than White students (5 percent) to have teachers who divided the class into fi ve or more groups. In addition, students attending other private schools (55 percent) were more likely than public school students (27 percent) to have teach-ers who teach reading to the whole class. fi g 11
Figure 11:Percentage of Students Whose Teachers Report Dividing the Class into Various Groups When Teaching Reading
30
41
6
7
8
6
Whole class
Whole class withflexible groups
Two groups
Three groups
Four groups
Five groupsor more
Source: Data from the 2000 National Assessment of Educational Progressanalyzed by the ETS Policy Information Center.
Percentage
500 10 20 30 40

22
Teachers were also asked to identify the materials that form the core of their reading program. Fifty-eight percent of the students’ teachers said that they used both basal readers and trade materials (see Fig-ure 12). About a fi fth responded that they used basal materials primarily and a similar proportion respond-ed that they used trade materials primarily. White
Teachers were asked whether they integrated reading and writing and whether they used writing about literature as instructional approaches. Seventy percent of students’ teachers responded that they used integrating reading and writing as a central part of their instruction; the remaining 30 percent used it as a supplemental part. Teachers of Black (76 percent), Hispanic (77 percent), and Asian students (82 per-
students (23 percent) were more likely than Black students (8 percent) to have teachers who primarily used trade books in reading instruction. In addition, students attending public schools (20 percent) were more likely than Catholic school students (7 percent) to have teachers who said that trade books formed the core of their reading program. fi g 12
Figure 12:Type of Materials Forming the Core of the Reading Program
18
19
58
5
Primarily basal
Primarily trade
Both basal and trade
Other
Source: Data from the 2000 National Assessment of Educational Progressanalyzed by the ETS Policy Information Center.
Percentage
50 60 700 10 20 30 40
cent) were more likely than teachers of White students (66 percent) to say that they used this technique as a central part of instruction. Students attending central city schools (73 percent) and urban fringe/large town schools (75 percent) were more likely than students attending rural schools (54 percent) to have teachers who report this technique as a central part of instruction.

23
Forty-three percent of the students’ teachers reported that they used writing about literature as a central part of their instructional approach, 50 percent said it was a supplemental part, and 7 percent said they did not use it. Students attending public schools (45 percent) were more likely than Catholic school students (27 percent) to have teachers reporting this technique as a central part of instruction. In addition, 22 percent of Catholic school students had teach-ers who reported that they did not use writing about literature as an instructional approach, compared to only 6 percent of public school students.
Figure 13:Amount of Reading Instructional Time Focused on Having Students Read to Perform a Task and Read to Gain Information
18
24
15
23
44
48
23
5
Read to perform a task
Read to gain information
Read to perform a task
Read to gain information
Read to perform a task
Read to gain information
Read to perform a task
Read to gain information
Almost all the time
2/3 of the time
At least 1/3 of the time
Little or no time
Source: Data from the 2000 National Assessment of Educational Progressanalyzed by the ETS Policy Information Center.
Percentage
50 600 10 20 30 40
Teachers were asked to estimate the proportion of their reading instruction time that is focused on having students read to perform a task (e.g., reading documents, forms, directions), and what proportion is focused on having students read to gain information (e.g., reading science articles, historical sources, text-book chapters, essays). These data are shown in Figure 13. Students were more likely to have teachers who focus instruction on reading to gain information than on reading to perform a task. Black students (22 percent) were more likely than White students (13 percent) to have teachers who reported that they focus on having students read to perform a task two-thirds of the time.
fi g 13

24
Teachers were also asked a series of questions about how often they use a variety of instructional techniques as part of their reading instruction. Figure 14 shows the percentage of students whose teachers report that they use each technique frequently, i.e. almost every day. As shown, a large majority of stu-dents have teachers who frequently ask them to read silently and who frequently help them to understand new words. Teachers also frequently ask students to discuss what they have read, including asking them to make generalizations, inferences, and predictions; asking students questions about what they have read; and asking them to explain or support their under-standing of what they have read. On the other hand, few students had teachers who reported frequent use of reading quizzes or tests, or using children’s newspa-pers and magazines in class. fi g 14
Some statistically signifi cant differences among groups of fourth graders are highlighted below.
Black (33 percent) and Hispanic students (25 per-cent) were more likely than White (15 percent) and Asian students (9 percent) to have teachers who assign homework for them to do with their parents almost every day. This was also the case for stu-dents attending Title I schools (27 percent versus 15 percent), and for students attending central city schools (25 percent compared to 15 percent for urban fringe/large town students, and 19 percent for students attending rural schools).
Public school students (40 percent) were more likely than Catholic school students (24 percent) to have teachers who ask them to talk with each other about what they have read “almost daily.”
Black (29 percent) and Hispanic students (25 percent) were more likely than White students (13 percent) to use the library for school assign-ments “almost daily.” Public school students (18 percent) also were more likely than Catholic school students (12 percent) and other private school students (6 percent) to use the library for school assignments “almost daily.” This was also the case for students attending Title 1 schools (25 percent versus 13 percent).
Black students (22 percent) were more likely than White students (12 percent) to have teachers who ask them to describe the style or structure of what they have read “almost daily.” Public school students (16 percent) were also more likely than Catholic school students (5 percent) and other pri-vate school students (6 percent) to have teachers who did this.
Public school students (59 percent) were more likely than Catholic school (32 percent) and other private school students (29 percent) to have teach-ers who asked them to make predictions about what they read as they are reading “almost daily.”
Urban fringe/large town school students (9 per-cent) were more likely than rural school students (2 percent) to have teachers who asked them to do a group activity or project about what they had read “almost daily.”
Black students (53 percent) were more likely than White students (41 percent) to have teachers who ask them to answer questions about what they have read “almost daily.” Central city students (53 percent) were also more likely to have teachers who do this than students attending rural schools (39 percent).
Black (82 percent) and Hispanic students (83 per-cent) were more likely than Asian students (69 per-cent) to have teachers who help them understand new words “almost daily.” Public school students (82 percent) were more likely than Catholic school students (57 percent) to have teachers who help them understand new words “almost daily.” Title I students were also more likely to have teachers who do this (86 percent, versus 76 percent for non-Title I students).
Students attending central city schools (39 per-cent) were more likely than students attending rural schools (22 percent) to have teachers who asked them to write about something they have read “almost daily.”
Public school students (54 percent) were more likely than Catholic school students (28 percent) to have teachers who asked students to make general-izations and draw inferences on the basis of what they have read “almost daily.”

25
Figure 14:Percentage of Students Whose Teachers Report the Use of Various Instructional Practices Almost Every Day
81
80
56
52
48
45
38
35
25
19
17
17
15
8
5
2
Assign homework for studentsto do with parents
Give reading quizzes or tests
Ask students to discuss differentinterpretations of what they read
Ask students to talk witheach other about what they read
Use library to borrow booksfor school assignment
Use library to do researchfor school assignment
Use children’s newspapersor magazines
Ask students to write aboutsomething they have read
Ask students to read silently
Ask students to make generalizations andinferences about what they read
Ask students to describe style orstructure of what they read
Ask students to make predictionsabout what they read
Ask students to explain or supporttheir understanding of what they read
Ask students to do a group activityor project about what they read
Ask students to answer questions aboutwhat they read in writing
Help students understand new words
Source: Data from the 2000 National Assessment of Educational Progressanalyzed by the ETS Policy Information Center.
Percentage
1000 20 40 60 80

26
Classroom Assessment Practices
The most frequently used assessment practices included having students write paragraphs about what they have read, giving short-answer tests, and assessing oral reading. There was little use of portfolios, extended writing assignments, or projects and presentations.
Figure 15:Percentage of Students Whose Teachers Report the Use of Various Types of Assessment Once or Twice a Week
41
38
37
27
11
7
6
Written paragraphs aboutwhat students have read
Short-answer tests
Oral readingassessment
Multiple-choice tests
Reading portfolios
Extended writingon assigned topic
Individual or groupprojects or presentations
Source: Data from the 2000 National Assessment of Educational Progressanalyzed by the ETS Policy Information Center.
Percentage
500 10 20 30 40
19 Susan M. Brookhart, “Developing Measurement Theory for Classroom Assessment Purposes and Uses,” Educational Measurement: Issues and Practices, Vol. 22, No. 4, Winter 2003. This special issue focuses on changing the way measurement theorists think about classroom assessment.
20 Response options were: 1-2 times a week; 1-2 times a month; 1-2 times a year; and never or hardly ever.
While discussions of testing and assessment typi-cally focus on standardized tests, students get most of the feedback about their learning from classroom assessments. Classroom assessment has been recently recognized as an important topic, and the role of classroom teachers is increasingly acknowledged in the current context of large-scale testing. The informa-tion available in the classroom is one of the greatest resources for teaching and learning.19
In NAEP, teachers were asked to indicate the frequency with which they used different assessment practices in reading instruction.20 A range of assess-ment options was listed for teachers, from using multiple-choice and short-answer tests to assigning ex-tended writing or group projects. Figure 15 shows the percentage of students whose teachers reported using each assessment practice at least once or twice a week. The most used practices included having students write

27
paragraphs about what they have read, giving short-answer and multiple-choice tests, and giving oral read-ing assessments. Reading portfolios, extended writing, and group projects and presentations are much less likely to be used frequently. Forty-fi ve percent of stu-dents had teachers who responded that they never or hardly ever used portfolios to assess reading.
Different groups of students differed somewhat in the types of assessments their teachers used. For example,
Students attending Title I schools were more likely than non-Title I students to have teachers who as-sessed with extended essays and papers (10 per-cent versus 5 percent), used multiple-choice tests (37 percent versus 21 percent), assigned reading portfolios (16 percent versus 9 percent), and used short-answer tests at least once or twice a week (46 versus 33 percent);
Students attending central city schools (10 per-cent) were more likely than students attending rural schools (4 percent) to have teachers who as-sessed student progress with extended essays and papers at least once or twice a week;
Black students (50 percent) were more likely than White (35 percent), Hispanic (33 percent), and Asian students (29 percent) to have teachers who used short-answer tests at least once or twice a week.
28
Summary and Conclusion
Literacy is the currency of the information age and its importance is refl ected in current education policy initiatives. Literacy for all Americans is one of our national education goals—one that has yet to be achieved. Recently, the No Child Left Behind Act and its Reading First initiative have focused signifi cant attention on the literacy of America’s children. Our schools are experiencing signifi cant pressure to per-form. Even pre-kindergarten programs like Head Start are being held accountable for developing the literacy skills of their students.
Teachers and classrooms are the focus of atten-tion. The National Research Council has concluded that “quality classroom instruction in kindergarten and the primary grades is the single best weapon against reading failure.”21 Across the nation, atten-tion is turning to the qualifi cations of teachers and the use of scientifi cally-proven methods of teaching. The educational progress of states, school districts, and individual schools is being measured in unprec-edented ways, including disaggregating performance data to examine the progress of specifi c groups of students defi ned by gender, race/ethnicity, and other characteristics. Progress will be determined, in large part, by what goes on in individual classrooms. By the 2005–2006 school year, NCLB requires that all teach-ers be “highly qualifi ed.” States are now scrambling to develop and implement acceptable ways to determine what constitutes a highly qualifi ed teacher.
To obtain a baseline of information, this report capitalizes on NAEP’s unique capacity to peer into the nation’s classrooms and gather information on how reading is taught in the fourth grade. Since NCLB examines not only overall performance, but the per-formance of specifi c groups, it is important that the view of the reading classroom also be one that allows the picture to capture differences (and commonalities) among different groups of students.
In summary, the climate of the fourth-grade read-ing classrooms examined in this report appears overall to be a healthy one. At the fourth-grade level, most teachers are certifi ed, have bachelor’s degrees (many have graduate degrees), are well experienced, and are
confi dent in their ability to teach. Teacher attendance and attrition do not appear to be problems and most teachers report that they receive adequate resources to teach their classes. Teachers reported using a variety of instructional techniques and assessment practices. Most teachers use integrated reading and writing as a central part of their instruction. Common classroom assessment practices included having students write paragraphs about what they have read, giving short-answer tests, and giving oral reading assessments. Few teachers used reading portfolios, assigned extended writing, or assigned projects or presentations.
These results should not be generalized beyond the fourth-grade reading classroom. In other subjects and/or other grade levels, the fi ndings would probably differ. For example, while most fourth-grade read-ing teachers hold degrees in elementary education, in eighth-grade mathematics we might be likely to fi nd teachers without a degree in mathematics or math-ematics education. Also, we might fi nd that certain groups of students have differential access to teachers who may be considered to be well qualifi ed. Further analyses of NAEP data can test that possibility.
While differences among groups of students and schools are described fully in the report; a few are highlighted below and organized by group.
Public School Students
More likely than students attending other schools to have certifi ed teachers and teachers with mas-ter’s degrees
More likely than students in other schools to be in classrooms with higher levels of remedial reading and writing instruction.
Catholic School Students
More likely than public school students to attend schools with the lowest level of teacher absences
Less likely than public school students to be grouped for instruction and to have teachers who use writing about literature as a central part of instruction.
21 Snow et al., 1998.

29
Other Private School Students
More likely than students attending other schools to be in small reading classes
More likely than Catholic school students to get reading instruction in self-contained classrooms.
White Students
More likely than Hispanic and Asian students to have teachers with 25 years or more experience
Less likely than Asian, Black, and Hispanic stu-dents to have teachers who use integrated reading and writing as a central part of instruction.
Black Students
Less likely than White and Asian students to attend schools where no teacher left during the year
More likely than White students to be grouped by ability
More likely than White, Asian, and Hispanic stu-dents to have teachers who use short-answer tests at least once or twice a week
More likely than White students to have teachers who report that they frequently focus on having students read to perform a task
More likely than White and Asian students to have teachers who assign homework for them to do with their parents almost every day.
Hispanic Students
More likely than White and Black students to be in large classes
More likely than White students to have more than 90 minutes of reading instruction per day
More likely than White students to be grouped by ability
More likely than other students to have teachers who feel well prepared to teach limited-English-profi cient students
More likely than White and Asian students to have teachers who assign homework for them to do with their parents almost every day
More likely than White students to use the school library for school assignments almost daily.
Asian/Pacifi c Islander Students
Less likely than White and Black students to be in classes with 20 students or less.
Title I Students
Less likely than other students to attend schools where no teachers left during the year
More likely than other students to receive 90 min-utes or more of reading instruction per day
More likely to be in schools with higher levels of remedial reading and writing than other students
Less likely to have teachers who feel well prepared in classroom management and organization
More likely to have teachers who assign homework for them to do with their parents almost every day
More likely to have teachers who help them under-stand new words almost daily.
Students in Central City Schools
Less likely than other students to attend schools where no teachers left during the year
More likely than students in rural schools to attend schools that provide 90 minutes or more of read-ing per day
More likely than rural school students to be grouped by ability
More likely than other students to have teachers who assign homework for them to do with their parents almost every day.


Policy Information Report
The Fourth-Grade Reading Classroom
Policy Evaluationand ResearchCenter
Policy InformationCenter
Listening. Learning. Leading.
Visit us on the Web at www.ets.org/research
88503-37334 • U94E6
37334_4g_reading_cvr.indd 2-337334_4g_reading_cvr.indd 2-3 9/24/2004 11:23:38 AM9/24/2004 11:23:38 AM