rethinking policy diffusion: the interstate spread of “finance innovations”
TRANSCRIPT

Rethinking Policy Diffusion: The Interstate Spreadof ‘‘Finance Innovations’’
T. Austin Lacy • David A. Tandberg
Received: 1 April 2013� Springer Science+Business Media New York 2014
Abstract Recently a number of studies have focused on states’ adoptions of postsec-
ondary-specific policies. Cutting across much of this research is the presence and influence
of interstate diffusion of policy adoptions, a phenomenon for which support is scant. This
paper seeks to address this through broadening the categorization of policies beyond the
discrete form traditionally used to one that encompasses a larger conception of ‘‘finance
policy.’’ Our sample uses 131 finance innovations for 47 states over a 29 year period,
finding that upon broadening our definition, we can detect the process of diffusion.
However, the findings are striking, showing that while states do learn from one another, the
process is dynamic and shifts across time.
Keywords State policy adoption � Postsecondary finance � Diffusion � Event
history analysis
Introduction
Historically, state policymakers have attempted to keep tuition low through direct
appropriations to public colleges and universities. Since the nineteenth century, the states
were the predominant funders of public colleges and universities, a commitment accel-
erated by the federal land grant acts, the development of teachers colleges, community
colleges, the expansion of public research universities and further federal action such as the
GI Bill (Johnson 1987). However, as early as the 1940s, policymakers became concerned
An earlier version of this paper was presented at the annual meeting of the Association for the Study ofHigher Education, Charlotte, NC. We thank Jim Hearn and Michael McLendon for their comments on anearly draft and continued support. All errors contained are our own.
T. A. Lacy (&)The University of North Carolina System Office, Chapel Hill, NC, USAe-mail: [email protected]
D. A. TandbergFlorida State University, Tallahassee, FL, USA
123
Res High EducDOI 10.1007/s11162-014-9330-2

with higher education’s escalating costs to students.1 In 1965 the federal government
passed the Higher Education Act (HEA) which included the seeds of the federal, need-
based financial aid program that would later evolve into the Pell Grant Program. In the first
reauthorization in 1972, the Act also included the State Student Incentive Grant program
[later renamed the Leveraging Educational Assistance Partnership (LEAP) program],
which provided federal matching funds for state-run, need-based grants. The LEAP pro-
gram resulted in a flurry of state policymakers developing such grants, with all states
adopting a program by the end of the decade (Heller 2002).
During the 1980s, college costs and prices began to rise at an even accelerated rate,
exceeding annual increases in governmental appropriations, inflation, personal income, and
state and federal financial aid. In this environment, the burden of paying for college
increasingly moved from states to students while the discourse among policymakers shifted
to higher education as a private, rather than a public, good (Lyall and Sell 2006). It was
against this changing backdrop that state postsecondary officials began experimenting with
new ‘‘market-based’’ higher education policies as well as other, alternative means for
financing colleges and universities (Titus 2006; Paulsen and Smart 2001; Wellman 2006;
Hemsley-Brown 2011). Identifying the factors associated with states adopting one or more
of this class of policy innovations is the focus of this study.
To examine this line of inquiry, postsecondary education researchers have drawn from
the comparative state political science and public policy literatures to study states’
adoptions of postsecondary policies, often centering on questions of geographical policy
diffusion (e.g., McLendon et al. 2005, 2006, 2007; Doyle 2006; Hearn et al. 2008).
Geographical policy diffusion argues that the policies ultimately enacted in states tend to
mimic the policies of their neighbors and, as one state adopts a policy, it increases the
likelihood that officials in proximate states will follow suit. While support for geographical
diffusion has been found in other domains, studies testing hypotheses in the context of
postsecondary policies have found little support for this phenomenon (Sponsler 2010).
In studying the development of state postsecondary finance innovations, researchers
have chosen to be discrete in defining very specific policies (e.g., performance funding,
merit aid). While these distinctions have tangible differences in states’ policy landscapes
and their effects on colleges and universities, this deep parsing of larger policy categories
may obscure geographical policy diffusion’s influence.2 In this study, we wish to test the
influence of diffusion after taking a broader view of postsecondary policy types. Specifi-
cally, we look at the spread of finance innovations as a category, under the rationale that
they are frequently driven by similar motivations and goals. Though most of these policies
have been studied individually, we have yet to find a study which attempted to analyze the
diffusion of these finance innovations as a whole.3
Our argument for combining these policies under the term ‘‘finance innovations’’ stems
from two sources: First, as we detail later, these policies fall under the umbrella of what
some articulate as ‘‘market-based approaches’’ to financing higher education (Teixeira et al.
2006). Second, combining innovations in this manner may better mirror what individuals in
states respond to when they look across their borders; in the case of postsecondary
1 This is perhaps best described in the final report of the 1947 President’s Commission on Higher Education.2 As noted by Boehmke and Skinner (2012), the tendency to focus on discrete, single policies is also aphenomenon in the political science field.3 See McLendon et al. (2006) for Performance Funding; Doyle et al. (2010) for 529 Savings Plans andPrepaid tuition; Deaton (2006) and Warne (2008) for Tuition Decentralization; and Doyle (2006) for MeritAid.
Res High Educ
123

education, policy emulation might not follow the discrete technocratic policies, but rather
broad categories that seek similar outcomes. That is, while the distinctions are important in
their mechanics, we hypothesize that these differences may not be apparent, or even
meaningful, for public officials to whom problems and solutions do not always precede in a
linear fashion. From this perspective problems may be matched with any relevant options
from a broad category of solutions, or even multiple solutions at once (Kingdon 1984). In
the current national landscape, studying postsecondary policy diffusion may yield insights
as to policy creation in general and the influence of higher educations’ unique mix of actors.
As the federal government, large foundations, non-profit associations, and intermediary
organizations attempt to ‘‘scale best practices’’ across state lines, looking at the origins of
existing policies will point towards enabling conditions and barriers to adoption.
State Postsecondary Finance Innovations
Over the past thirty years state policy increasingly utilized market-based approaches to the
financing and governance of the public sector (Rabovsky 2012). In state higher education
finance policy, market-based approaches are those that: (1) attempt to incentivize personal or
institutional behavior towards certain larger outcomes deemed important by state policymakers
(as opposed to regulations and other top down directive policy approaches); and/or (2) shift the
burden of paying for college from the state to the individual. The specific innovations under this
umbrella are: tuition decentralization, voucher programs, 529 savings plans, pre-paid tuition
programs, performance funding, and broad-based merit aid programs (Titus 2006; Hauptman
2006; McLendon et al. 2009; Protopsaltis 2008; Wellman 2006; Hemsley-Brown 2011).
One of the primary arguments supporting the decentralization of tuition authority was
that markets should drive prices and, once freed from artificial price controls, institutions
would be able to compete on quality and students would ‘‘vote with their feet’’ (Wellman
2006). Spurred by new economic and political realities, in some states tuition authority has
become decentralized from central state offices, allowing institutions—as opposed to
postsecondary governing structures or legislatures—to set their own tuition rates which
predictably led to increased tuition (Lyall and Sell 2006). Realizing that enrollments
continued to grow even in the face of increasing costs, state legislatures have continued to
disinvest in higher education, support other public priorities, and allow institutions to
increase tuition (Breneman and Finney 1997; Hovey 1999). Between 1987 and 2006, 18
states decentralized tuition setting authority.
Perhaps one of the most innovative approaches to reorganizing the financial relationship
between the state, students, and institutions was the creation of the Colorado Opportunity
Fund, a program that functions as a voucher program for higher education. Using money
that otherwise would be appropriated directly to institutions, Colorado established a sti-
pend available to all lawfully present Colorado residents to use for offsetting their total
costs at the public (and eligible private) higher education institution of their choice. While
Colorado remains the only state to experiment with vouchers in the postsecondary sector,
they have a long history as a policy innovation in the K-12 education arena (Rouse and
Barrow 2009). In both cases, vouchers are an extreme case of enacting legislation which
pushes institutions to compete for students (Western Interstate Commission on Higher
Education 2009; Fox 2006; Protopsaltis 2008).
College savings and prepaid tuition plans are another means through which policies aim to
alter student and family behavior. Similar to Roth IRAs and other retirement plans, 529 plans
are college savings accounts where principal is invested and not subject to capital gains tax,
Res High Educ
123

with many states allowing citizens to deduct contributions from state income tax. Con-
versely, prepaid tuition plans allow purchasers to lock in a certain tuition rate by purchasing
future credits at today’s prices, theoretically providing a hedge against tuition inflation. Often
coupled together as options in policy discussions, both plans were designed to increase
college affordability and personal savings and financial planning. The approaches may be
seen as natural market-based approaches to college affordability as they do not regulate
college costs, use incentives as opposed to new laws, are voluntary and require individual
investment, and almost uniformly allow students to continue to chose the institution in which
they ultimately enroll.4 Between 1986 and 1999, thirty-one states adopted some form of a
529 plan and 21 states adopted prepaid tuition plans (Doyle et al. 2010; Hurley 2006; Olivas
2003).5 Importantly, adoption of 529 plans continued after 1999, though not all at once. In
2000 five states adopted a plan, followed by four in 2001, and six in 2002.
Also subsumed in this era of market-based financial policies, was a shift in the oversight
and accountability environment for public higher education. The movement was from a
concentration on regulatory compliance and rudimentary reporting of inputs and expen-
ditures to measuring performance and accounting for outcomes and results (Burke 2005;
McGuinness 2005; McLendon 2003; Volkwein 2007; Volkwein and Tandberg 2008), a
postsecondary change that mirrored a larger shift in public education policy referred to as
the ‘‘new accountability’’ movement (Gorbunov 2004; McLendon et al. 2006; Zumeta
1998; Toutkoushian and Danielson 2002). A primary manifestation of this movement was
state-level performance funding policies, which are programs that link institutions’ funding
levels to a set of outcomes (e.g., student retention, graduation rates, student scores on
licensure exams, job placement rates, faculty productivity, and campus diversity). As
opposed to other policies that attempt to alter individuals’ behaviors, these programs seek
to incentivize institutions to meet state educational priorities (Burke 2002).6
One of the most frequently studied state higher education policy adoptions is the
widespread initiation of merit-based student aid programs (Doyle 2006; Ness 2008; Cohen-
Vogel et al. 2008). Similar to several other higher education finance innovations (perfor-
mance funding, 529 college savings plans, and prepaid tuition programs), merit aid pro-
grams seek to encourage particular behaviors, in this case student academic performance
and enrollment in an in-state institution. At the same time they address affordability (for
those who qualify) and allow for (limited) college choice. In the early 1990s, the state of
Georgia initiated the first large-scale, statewide merit aid program with 12 other states
adopting similar programs (Heller and Marin 2004).7
Conceptual Framework
Our conceptualization of the factors influencing state postsecondary policy adoption draws
from the political science literature which argues that these innovations stem from both
4 In the case of prepaid tuition, this is limited to publics.5 Following 1999, the federal government hastened the adoption of 529 plans and by 2002 every state butWashington had adopted a plan.6 While the first performance funding policy was implemented in the late 1970s (Tennessee) it was not untilthe 1990s that widespread adoption occurred. Prior to 1990, only Tennessee and Connecticut had a per-formance funding policy in place, a number that would expand to 26 by 2003.7 Since the 1990s increases in the amount of money devoted to merit aid programs have far outpaced anyincreases in other state financial aid programs (National Association of State Student Grant and Aid Pro-grams 2010).
Res High Educ
123

within state characteristics and, in part, the behavior of other states. The first (intrastate
forces) comes from the ‘‘new institutionalism’’ perspective which, as March and Olsen
(1984) succinctly assert, ‘‘is simply an argument that the organization of political life
makes a difference’’ (p. 747). While this thinking acknowledges the importance of state
economic and demographic factors, politics is an important driver as well. Recently the
new institutionalism perspective migrated to the state higher education policy and finance
literature. It has been used, often in combination with other perspectives, to explain state
political actors’ higher education policy decisions (Doyle et al. 2010; Hearn and Griswold
1994; McLendon et al. 2007; Nicholson-Crotty and Meier 2003). This has helped scholars
move away from viewing postsecondary policy creation as solely influenced by economic
and education related factors. The second influence of this conceptual framework comes
from the policy diffusion literature, and involves interstate forces. This perspective argues
that state officials and policymakers emulate, learn and compete with each other, resulting
in policy innovations diffusing from one state to another (Berry and Berry 1990, 1992;
Walker 1969).
These adoption studies differ from research that describe policies (e.g., Burke 2002;
Breneman and Finney 1997; Hovey 1999; Hurley 2006; Olivas 2003) and those that focus
on their impacts (e.g., Richardson 2005; Volkwein and Tandberg 2008; Lehman 1990;
Dynarski 2004; Henry et al. 2004). Despite the recent turn to examining single policies,
this paper is directly influenced by two seminal works in the postsecondary policy adoption
literature.8 Hearn and Griswold (1994) examined states’ adoptions across the domains of
‘‘academic policies, policies relating to teacher education, and financing policies’’ all
which were broad categories that contained individual innovations. McLendon et al. (2005)
also explored several broad categories, including ‘‘Financing Innovation.’’ Using these
wider definitions, both studies found interesting patterns related to the adoption of these
policies. Most notably, McLendon et al. (2005) remains one of the few studies to find
evidence of interstate diffusion.
In this study we aim to build upon these pioneering works through examining policy
adoption in the ten years following McLendon et al.’s (2005) study and using techniques
that may aid us in understanding the mechanisms at work at interstate diffusion and why it
so rarely is found to influence adoption of postsecondary policies. Theoretically we differ
as we hypothesize that what is important are the multiple and continuous actions toward
the postsecondary financing, which places this study in literature conceptualizing the
policy process as continuous (e.g., Anderson 2011; McLaughlin 1987). From this per-
spective problems are never ‘‘solved’’ and are therefore continue to reemerge. In addition
to diffusion, we envision a variety of additional hypotheses regarding state adoption of
postsecondary finance innovations. In specifying the mechanisms at work, we outline
several broad categories and our rationale for including specific indicators.
Diffusion
Within the United States’ federated system of government, the 50 American states may
function ‘‘laboratories of democracy,’’ in which new policies are enacted, tested, and
possibly emulated. In the study of policy adoption, there are several theoretical arguments
for what may contribute to policies’ spread across states. The broad form of this is the idea
of policy ‘‘learning’’ and ‘‘emulation’’ in which effective policies are transmitted across
8 We also owe a debt to the work of Michael Mintrom who examined the broad category of ‘‘school choice’’in K-12 education. See Mintrom and Vergari (1998), Mintrom (2000).
Res High Educ
123

states and (theoretically) ineffective policies are not. In his early analysis, Walker (1969)
suggested that policymakers may simply seek ‘‘shortcuts’’ to aid them in their chaotic and
busy roles; diffusion thus results from policymakers’ attempts to address the confusion
inherent in their duties. In the second age of policy diffusion studies, much of the reasoning
focused on competition between states. This conception is perhaps best represented by
Berry and Berry’s 1990 study of lottery adoption, in which states suffer an economic
disadvantage if a neighbor has a lottery and they do not. While within the political science
and public policy literatures some support exists for the idea of interstate diffusion, the
results in regard to postsecondary policy diffusion are less certain and, at best, mixed (e.g.,
McLendon et al. 2005; Doyle 2006).
As mentioned previously, this study departs from the traditional approach of studies of
postsecondary policy adoption, moving from the study of individual policies towards a
larger category. The primary motivation for this approach is to question the mechanism
through which these policies diffuse while accounting for the density of activity in this
broadened definition. To borrow from another theory of the policymaking process, we
hypothesize that it may not be the ‘‘solutions’’ that diffuse, but rather attempts to address
the ‘‘problems.’’ In utilizing this Kingdonian rationale, we believe that state policymakers
are not responding to specific, codified policies but instead emulate their neighboring
states’ attempts to address the financing of postsecondary education. For this case, it may
not be that policymakers feel pressure to adopt a prepaid tuition policy because their
neighbor recently adopted it, rather neighbors’ activities compel them to enact any policy
that addresses college cost.
Postsecondary Environment
Principal among the factors one would believe to influence the adoption of postsecondary
finance reforms are those surrounding the cost of public higher education within states. To
address this, we include an indicator for tuition and another for need based aid. As the
rationale behind many finance innovations involves rising tuition, we specify this variable
as the 3-year moving average of the percent change in tuition at the state flagship insti-
tution.9 Thus, we suspect that states with rapidly increasing tuition will be more apt to
adopt finance innovations. In addition to tuition,we include a states’ need-based grant
coverage of Pell recipients. We argue that if the current state need-based grant program
sufficiently offsets the cost of attending college for low and middle income students, the
need and demand for new finance policies will be lower (Ness 2006). Activity in state
need-based aid may also proxy an orientation to more traditional forms of higher education
finance policy and make them less likely to engage in novel reforms.
In addition to tuition and aid, we also propose that policymakers use other indicators as
a barometer for the health of postsecondary education in their state. Though there are many
potential indicators explored in other research, the interrelated nature of many candidates
makes an exhaustive list less appropriate in this study. The indicator we selected is out-
migration, or the percentage of students from a state who pursue postsecondary education
beyond its borders. We believe that states with high patterns of out-migration will be more
likely to enact new finance policies in an effort to stem the movement of native post-
secondary students out of the state (Doyle 2006).
9 We include state flagship as they are typically the most visible of all state institutions and, practically,Wyoming’s only 4-year institution is its state flagship.
Res High Educ
123
Political Environment
States also vary on their political indicators, with the existing adoption literature finding
overwhelming support for the influence of states’ political environments in the formation
of higher education policies. First we consider unified party control of government. This
hypothesis suggests that states in which the same party controls both houses of the leg-
islature and the executive office are more likely to adopt a policy than those where control
is split and greater roadblocks exist to passage (Huber et al. 2001). Following the con-
ception of McLendon et al.’s (2007) study of non-directional governance reform, we
believe that when state government is unified they will usher in new finance reforms.
Beyond the political control of state government, we include other aspects that char-
acterize a state’s political landscape - notably those of analytic capacity and power. States
vary in their level of legislative professionalism, a measure that attempts to capture the
latent analytic capacity of a state’s legislative body. We propose that states with higher
levels of legislative professionalism will better understand the landscape of policy tools
available to address postsecondary finance and thus be more likely to adopt these policies
(Barrilleaux et al. 2002; Squire 1993, 2007).
We also seek to highlight differences in states’ executive offices, hypothesizing that
states where a greater degree of budgetary power is invested in the gubernatorial branch
will be at a decreased risk of adopting a finance innovation. Here we propose that higher
education finance innovations would codify into law a portion of state finances, thus
limiting the ability of the governor to use his or her discretion to divert resources away
from higher education and redistribute to other policy areas. Prior research has confirmed
that variation in the institutional powers of governors impacts the likelihood of policy
innovation in the states (Beyle 2004; Dometrius 1987). The majority of the innovations
either require additional state resources (e.g., broad based merit aid), lock the state into a
form of financial commitment (e.g., performance funding) or limit the state’s fiscal powers
over higher education (e.g., tuition decentralization). There is little reason why a governor
with significant budgetary powers would want to cede this power and thereby limit his or
her ability to alter budgetary priorities in the future.
The relative strength of a state’s higher education interest group lobby may also be
hypothesized to relate to the adoption of finance policies. Referred to as the higher edu-
cation interest group ratio, it indicates the strength of the higher education lobby relative
to the larger interest group universe in a given state. In large part, this measure is driven not
only by institutions, but the more visible and prestigious institutions. While on one hand,
one may suspect that the regulation of performance funding policies would oppose these
measures—these institutions are likely those that will benefit from these changes. Also
comprising this are public institutions and various advocacy groups that would stand to
benefit from policies that benefit individuals.
Some research finds that gubernatorial tenure can influence policy outcomes, as newer
governors seek to establish their own policy portfolio and expend whatever political capital
they earned through their elections (e.g., Dometrius 1987; McLendon et al. 2007; Schle-
singer 1965). Therefore we hypothesize that the longer a governor is in office in a given
state the less likely that state will be to adopt a finance innovation.
Lastly we include an indicator for whether or not a state has a consolidated governing
board. Traditionally the thinking around state governance agencies has fallen under the
category of postsecondary environment, yet we believe these structures in part define the
boundaries of a state’s ‘‘politics of postsecondary education.’’ Often referred to as a
‘‘fourth branch of government,’’ these consolidated governing boards wield a greater
Res High Educ
123
degree of power and influence when compared to less centralized governance structures.
On one hand, some suggest these boards may act like academic cartels (McLendon et al.
2006; Zumeta 1996) in which finance policies may empower individual students or create
incentives among its members to certain externally desirable outputs. On the other, these
structures may view the adoption of finance innovations as an attempt to circumvent their
power and authority over the state’s postsecondary system writ large. Under both of these
views, we believe that states with consolidated governing boards are less likely to adopt a
finance innovation (Doyle et al. 2010; McLendon et al. 2006; Deaton 2006).
Economic Factors
Prior research has found that economic conditions may increase the likelihood of policy
adoption with median family income positively associated with the adoption of a number
of postsecondary finance innovations (McLendon et al. 2005; Doyle 2006; Deaton 2006).
Therefore our study controls for median family income and hypothesizes that it will be
positively associated with the adoption of these policies. Middle class and wealthy families
clearly stand to benefit from these policies, as they are more likely to attend college, to
make use of the college savings and 529 plans and to benefit from the merit aid programs
(Hurley 2006; Cornwell et al. 2009).
Data and Methods
The data for the dependent variable come from the aforementioned studies and were
updated using reliable secondary sources and state legislative documents.10 Our definition
of ‘‘innovation’’ draws from Walker’s 1969 articulation that defines innovations as when a
state adopts something novel to itself and our model includes 47 states over the time period
1979–2008. Alaska and Hawaii were removed from the analysis because diffusion was
specified as the total number of finance innovation adoptions by neighboring states. As is
typical in comparative state studies, Nebraska was removed from the analysis due to its
unique quality of having a unicameral legislature. We do include the finance innovations it
adopted in the diffusion measure for its neighboring states. Our data begins in 1979 when
Tennessee adopted its long-standing performance funding policy. The final adopter in our
analysis is Florida’s 2006 tuition decentralization policy, though our time frame continues
till 2008, the final year for which we have data for the dependent variable. In the years of
the analysis, 131 policy innovations occurred with each state adopting at least two finance
innovations. A limitation of our conceptualization is that states can and do adopt multiple
finance innovations in a single year yet our model observes this phenomenon as single
events, which brings the observed number of events to 116.11 A list of these policies and
the years that states adopted them may be found in Appendix 2.
Figure 1 presents a ‘‘heat map’’ for the total number of adoptions in the U.S. states, circa 2008.
In this map, darker areas represent larger numbers of total adoptions and lighter areas fewer. As
indicated by the dark shades, three states (Kentucky, Florida, and South Carolina) adopted five
out of six finance innovations. Seven states Arizona, Delaware, Iowa, Montana, New Hampshire,
Rhode Island, and Vermont only adopted a 529 savings plan and appear lighter on the map.12
10 A cataloging of these sources can be found in Appendix 1.11 This and Nebraska’s two innovations do not affect our measure of total adoptions by neighboring states.12 Every state except Washington adopted a saving plan.
Res High Educ
123

Independent Variables
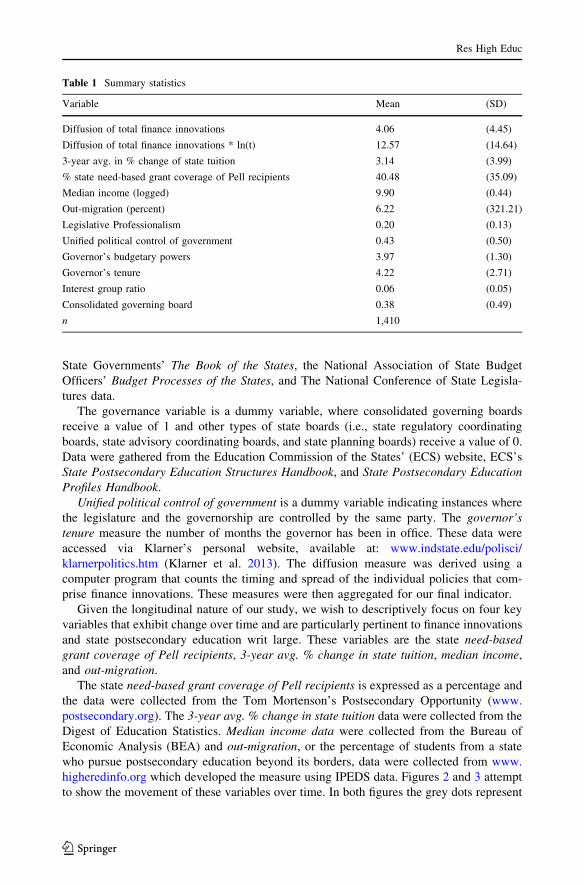
Table 1 provides the means and standard deviations for the independent variables in the
model. These data come from a variety of reliable secondary sources and are described
below.13
The higher education interest ratio variable is constructed by dividing the total number
of state public higher education institutions and registered non-college or -university public
higher education interest groups by the total number of interest groups in the state, minus
any registered colleges and universities or other registered higher education interests
groups that may lobby for more money for public higher education (Tandberg and Ness
2011). The interest group data has been retrieved from state websites and government
archives, from the Council on Governmental Ethics Laws (CGEL) Blue Book, and data
provided by David Lowery. Data on the number of public institutions were retrieved from
the National Center for Education Statistics’ Digest of Education Statistics.
Legislative professionalism is measured via the Squire Index (2007), which is a latent
variable that seeks to account for the robustness of legislative staff resources available for
policy development and deliberations. The measure is operationalized by accounting for
legislative salary, how long they remain in session, and the number of staff assigned to
individual legislators.
Budget powers of the governor is a scale of 0–7 and includes data from 1976 to 2004
across all 50 states. The items included are whether state agencies make requests directly to
the governor or to the legislature; whether the executive budget document is the working
copy for legislation or if the legislature can introduce budget bills of its own, or whether
the legislature or the executive introduces another document later in the process; whether
the governor can reorganize departments without legislative approval; whether revenue
estimates are made by the governor, the legislature, or another agency, or if the process is
shared; whether revenue revisions are made by the governor, the legislature, or another
agency, or if the process is shared; whether the governor has the line item veto; and
whether the legislature can override the line item veto by a simple majority. Each of these
has a value of 0 or 1 (Tandberg and Ness 2011). The sources for the data are Council of
Cummulative Adoptions
1 2 3 4 5
Fig. 1 State adoptions of total finance innovations, 2008 (darker areas indicate a greater number ofadoptions)
13 This information is presented in tabular form in Appendix 3.
Res High Educ
123
State Governments’ The Book of the States, the National Association of State Budget
Officers’ Budget Processes of the States, and The National Conference of State Legisla-
tures data.
The governance variable is a dummy variable, where consolidated governing boards
receive a value of 1 and other types of state boards (i.e., state regulatory coordinating
boards, state advisory coordinating boards, and state planning boards) receive a value of 0.
Data were gathered from the Education Commission of the States’ (ECS) website, ECS’s
State Postsecondary Education Structures Handbook, and State Postsecondary Education
Profiles Handbook.
Unified political control of government is a dummy variable indicating instances where
the legislature and the governorship are controlled by the same party. The governor’s
tenure measure the number of months the governor has been in office. These data were
accessed via Klarner’s personal website, available at: www.indstate.edu/polisci/
klarnerpolitics.htm (Klarner et al. 2013). The diffusion measure was derived using a
computer program that counts the timing and spread of the individual policies that com-
prise finance innovations. These measures were then aggregated for our final indicator.
Given the longitudinal nature of our study, we wish to descriptively focus on four key
variables that exhibit change over time and are particularly pertinent to finance innovations
and state postsecondary education writ large. These variables are the state need-based
grant coverage of Pell recipients, 3-year avg. % change in state tuition, median income,
and out-migration.
The state need-based grant coverage of Pell recipients is expressed as a percentage and
the data were collected from the Tom Mortenson’s Postsecondary Opportunity (www.
postsecondary.org). The 3-year avg. % change in state tuition data were collected from the
Digest of Education Statistics. Median income data were collected from the Bureau of
Economic Analysis (BEA) and out-migration, or the percentage of students from a state
who pursue postsecondary education beyond its borders, data were collected from www.
higheredinfo.org which developed the measure using IPEDS data. Figures 2 and 3 attempt
to show the movement of these variables over time. In both figures the grey dots represent
Table 1 Summary statistics
Variable Mean (SD)
Diffusion of total finance innovations 4.06 (4.45)
Diffusion of total finance innovations * ln(t) 12.57 (14.64)
3-year avg. in % change of state tuition 3.14 (3.99)
% state need-based grant coverage of Pell recipients 40.48 (35.09)
Median income (logged) 9.90 (0.44)
Out-migration (percent) 6.22 (321.21)
Legislative Professionalism 0.20 (0.13)
Unified political control of government 0.43 (0.50)
Governor’s budgetary powers 3.97 (1.30)
Governor’s tenure 4.22 (2.71)
Interest group ratio 0.06 (0.05)
Consolidated governing board 0.38 (0.49)
n 1,410
Res High Educ
123

our states at the beginning of the study, the black dots the constellation of states in 1995,
and the abbreviations the values in 2008.
In Figure 2, one notes that both the middle and end of our study were times of increasing
tuition—especially compared to the late 1970s.14 Over the same time periods, one notices a
contraction in the coverage of state need-based aid. These shifts, as we hypothesized in our
conceptual framework, capture the movement from the traditional positions of states at the
time of large-scale innovation. Figure 3, shows the increases in median income and student
mobility. It is worth noting that our measure of income correlates with many measures of
educational attainment found in other studies.15 Because the importance of income to our
conceptual framework, we elected to include it rather than this class of variables.
Methods
For over two decades the field of political science has used the broad category of ‘‘Event
History Analysis’’ to study state policy formation, an approach that was later adopted in the
by researchers focusing on postsecondary education issues (e.g., McLendon et al. 2005;
Doyle 2006; McLendon et al. 2006).16
Because we broadened the definition to ‘‘finance innovation,’’ it is possible all states
may experience multiple adoptions over the time period of our study. We acknowledge that
there are multiple estimators one could use to model this phenomenon, but due to the
nature of our data, our question, and theoretical framework we use a Cox Proportional
Hazards Model for repeating events.17 The Cox Proportional Hazards model is well suited
to social science problems as it enables researchers to examine the effect of various
covariates without specifying a parametric form for the baseline hazard rate. More
importantly, the ‘‘repeating nature’’ of finance innovations cannot be ignored as we argue
that interstate diffusion rests on both the mimicry of the broad category and the continual
and repetitive nature of these ‘‘reforms.’’
While studies focusing on adoptions of single policies remove a state from the analysis
after the year of adoption as they are assumed to no longer be at ‘‘risk,’’ we include all 47
states throughout the duration of our time frame.
To address the issue of previous events influencing the probability of ensuing adoptions
we use a conditional gap time Cox model that incorporates both ‘‘time from entry’’ and
‘‘time from the previous event’’ into estimation. That is, we believe that the act of adopting
a fifth finance innovation is likely to have important differences from adopting the first
innovation. To illustrate this process we turn to Tennessee which adopted its Performance
Funding policy in 1979. After this adoption, the count for duration for Tennessee was reset
to 1 in 1980, while other states’ duration continued to 2. This continued in Tennessee till its
14 Recall that these values are adjusted to the consumer price index, which partially explains these earlydeclines.15 For example, income and the frequently used variable measuring the percentage over adults over the ageof 25 with a Bachelor’s Degree have a correlation of 0.79.16 Other higher education researchers have used this broad family of estimators to study student outcomes,typically in the form of persistence/completion/departure. See, for example, Chen and DesJardins (2008);DesJardins et al. (2002); Ishitani (2006).17 For example, one could conceive of this process as a very slow poisson process or competing, alternativeevents. As we conceptually argue that these policies are from a broader family, we consider them similarevents. Further, we prefer the duration model as it enables us to gain leverage over the temporal nature ofthis process.
Res High Educ
123

adoption of a 529 Savings Plan in 2000, after which t is again set to 1.18 To help understand
this difference, the first equation presents the conventional Cox Proportional Hazards
Model and the second the conditional gap time variant:
ORWI
NE
KYCA
WAUTAL
TX
CTIA
NM
DE
NV
WV
MD
OK
MA
SD
SC
MO
NC
GA
CO
OH
TN IN
ME
KS
PA
LA
RIMS
IL
ND
NH
NJID
MI
FLVTAR
AZ
VA
MN
NY
MTWY
−5
05
1015
3−yr
avg
. in
% c
hang
e of
sta
te tu
ition
0 50 100 150 200
% state need−based grant coverage of Pell recipients
1979 1995 State Abbreviation=2008
Fig. 2 Tuition and need aid
ORWINE
KY
CA WA
UT
AL
TX
CT
IA
NM
DENV
WV
MD
OK
MA
SD
SC
MONC GA
CO
OHTNIN
ME
KSPA
LA
RI
MS
IL
ND
NH
NJ
ID
MI
FL VT
ARAZ
VA MN
NY
MT
WY
1010
.511
Med
ian
inco
me
(log
ged)
0 20 40 60
Out−migration (percent)
1979 1995 State Abbreviation=2008
Fig. 3 Income and out-migration
18 The Cox Proportional Hazards model has several important attributes that make it attractive for repeatingevents structures. For a detailed discussion for social scientists, see Jones and Branton (2005) and Box-Steffensmeier and Zorn (2002).
Res High Educ
123
hðtÞ ¼ h0ðtÞeb0xj ð1Þ
hkðtÞ ¼ h0kðtÞeb0xkj ð2Þ
In both, hðtÞ is the hazard of adopting a a policy at time t, h0 the baseline hazard, b0x is the
matrix of regression parameters and covariates and the subscript j the clustering of standard
errors (Box-Steffensmeier and Jones 2004; Hosmer and Lemeshow 1999). The notable
distinction between the two is the inclusion of the subscript k in the second equation which
indicates the kth failure, or the number in the sequence of events. That it indexes both x and
h0 is not a trivial matter. While there are a number of methods for estimating repeating
events, this varies the hazard rate by the events because we assume that experiencing the
fifth event is substantively different than experiencing the first.
To account for the occurrence of tied events the Efron method was used. We selected
the Efron method for its ability to allow us to cluster standard errors on states, a correction
we believed needed to be done a priori. We also tested for the proportional hazards
assumption, said plainly, the assumption that the effect of the covariates are constant
through time. To test this assumption we conducted diagnostic tests of the Schoenfield
residuals. Our indicator for interstate diffusion was found to violate this assumption and
was corrected through an interaction with the natural log of time t.19
Findings
Table 2 presents the results from the Cox Proportional Hazards model, nesting the vari-
ables into groups that reflect our broad categories outlines earlier. For the remainder of the
paper we focus on interpreting the full model that finds median income, outmigration,
legislative professionalism, a governor’s budgetary powers, and the adoption activity of
neighboring states to influence the risk of adopting a finance innovations. We caution
readers to not interpret the variable interacted with time from the coefficients listed in the
table, instead we direct you to the following graphical displays that provide the combined
effects of the interacted terms.20
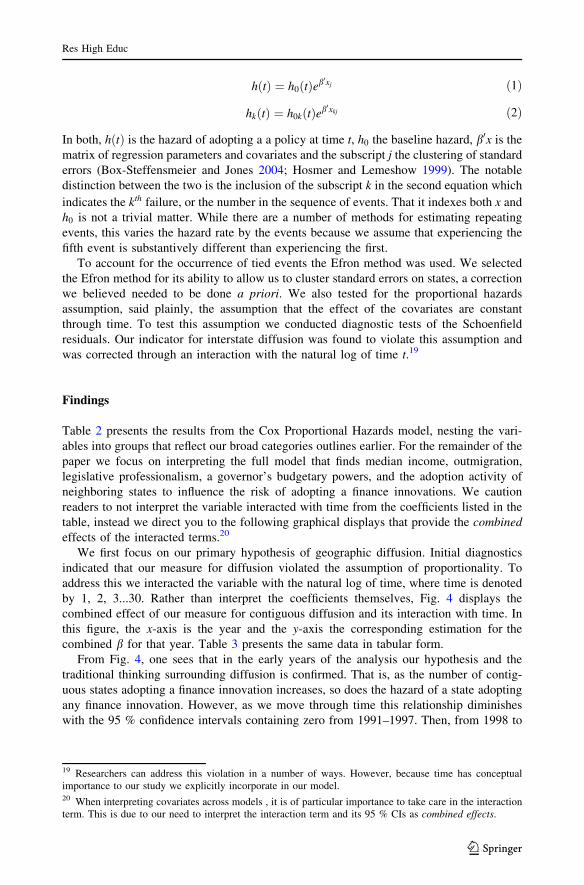
We first focus on our primary hypothesis of geographic diffusion. Initial diagnostics
indicated that our measure for diffusion violated the assumption of proportionality. To
address this we interacted the variable with the natural log of time, where time is denoted
by 1, 2, 3...30. Rather than interpret the coefficients themselves, Fig. 4 displays the
combined effect of our measure for contiguous diffusion and its interaction with time. In
this figure, the x-axis is the year and the y-axis the corresponding estimation for the
combined b for that year. Table 3 presents the same data in tabular form.
From Fig. 4, one sees that in the early years of the analysis our hypothesis and the
traditional thinking surrounding diffusion is confirmed. That is, as the number of contig-
uous states adopting a finance innovation increases, so does the hazard of a state adopting
any finance innovation. However, as we move through time this relationship diminishes
with the 95 % confidence intervals containing zero from 1991–1997. Then, from 1998 to
19 Researchers can address this violation in a number of ways. However, because time has conceptualimportance to our study we explicitly incorporate in our model.20 When interpreting covariates across models , it is of particular importance to take care in the interactionterm. This is due to our need to interpret the interaction term and its 95 % CIs as combined effects.
Res High Educ
123

Table 2 Results of the Cox Proportional Hazards Mode (standard errors in parentheses)
Model 1 Model 2 Model 3
Diffusion of total finance innovations 5.06** 3.65** 3.09**
(1.02) (1.07) (1.06)
Diffusion of total finance innovations * ln(t) -1.81** -1.30** -1.08**
(1.02) (1.07) (1.06)
3-year avg. in % change of state tuition 0.02 0.10
(0.12) (0.11)
State need-based grant coverage of pell recipients 0.00 -0.00
(0.01) (0.01)
Median income (logged) -6.63** -9.97**
(1.47) (1.94)
Out-migration 0.90 6.7*
(2.27) (2.89)
Legislative professionalism 7.97**
(2.00)
Unified political control of government -0.24
(0.47)
Governor’s budgetary powers -0.25y
(0.15)
Governor’s tenure -0.02
(0.07)
Interest group ratio 2.78
(3.91)
Consolidated governing board -0.15
(0.45)
n 1,440 1,440 1,440
Log-likelihood -112.84 -98.20 -89.22
v2 85.53 102.09 111.72
y p\0.1; * p\0.05; ** p\0.01
−2
0
2
4
6
xB
1979 1984 1989 1994 1999 2004 2008
YearCoefficient 95% C.I.
Fig. 4 Interaction of diffusionand time
Res High Educ
123

the end of the analysis the relationship reverses with the hazard of adopting a finance
innovation decreasing as the number of neighboring states’ innovations increases.
This finding underscores the complex relationship found in the diffusion of policies.
Why would the relationship be positive in the early years but negative in later years? With
this in mind we argue that this diffusion finding suggests competition in the early years and
learning in later times. The former represents competition through simply responding to
neighboring states’ actions in this policy environment. States may not be competing on
tangible outcomes per se, but the appearance of being active. The latter may speak to a
type of learning that stems from the long term implications of these policies. For many of
our policies, research suggests that changes in the financing of postsecondary education
can lead to less desirable behaviors at both the individual and institutional levels (e.g.,
Heller and Marin 2004; Burke 1998; Western Interstate Commission on Higher Education
2009; Cornwell et al. 2009; Dougherty and Reddy 2013). In light of this, we argue that as
Table 3 Diffusion and timeinteraction
Year Coefficient 95 % CI
1979 3.09 (1.00, 5.17)
1980 2.34 (0.73, 3.95)
1981 1.90 (0.57, 3.23)
1982 1.59 (0.45, 2.72)
1983 1.35 (0.36, 2.33)
1984 1.15 (0.29, 2.01)
1985 0.98 (0.23, 1.73)
1986 0.84 (0.18, 1.50)
1987 0.71 (0.13, 1.29)
1988 0.60 (0.09, 1.11)
1989 0.49 (0.05, 0.94)
1990 0.40 (0.01, 0.79)
1991 0.31 (-0.02, 0.65)
1992 0.23 (-0.06, 0.52)
1993 0.16 (-0.09, 0.40)
1994 0.09 (-0.12, 0.30)
1995 0.02 (-0.15, 0.20)
1996 -0.04 (-0.19, 0.11)
1997 -0.10 (-0.23, 0.03)
1998 -0.15 (-0.27, -0.04)
1999 -0.21 (-0.32, -0.09)
2000 -0.26 (-0.38, -0.13)
2001 -0.30 (-0.44, -0.17)
2002 -0.35 (-0.50, -0.20)
2003 -0.39 (-0.57, -0.22)
2004 -0.44 (-0.63, -0.24)
2005 -0.48 (-0.70, -0.26)
2006 -0.52 (-0.76, -0.28)
2007 -0.56 (-0.82, -0.29)
2008 -0.59 (-0.87, -0.31)
Res High Educ
123
the second order effects of finance innovations became known, policymakers were in turn
less likely to enact such changes because the consequences were understood.
Beyond our primary hypothesis of diffusion our model suggests several other findings
that merit discussion. We find a positive relationship for legislative professionalism,
supporting our thinking that more professionalized legislatures would have the necessary
staff to digest policy activity occurring elsewhere, prompting these states towards adoption.
Though not below the conventional p\:05 threshold, the results pertaining to governor’s
budgetary powers were consistent with our initial thinking where governors with strong
powers over the budget would be less likely to effectively cede power through codifying it
through law. There is little reason why a governor with significant budgetary powers would
want to limit the ability to change priorities in the near future.
Median income and outmigration were also found to influence the adoption of finance
innovations. Our hypothesis was that higher levels of median income would be associated
with adoption but our results point towards the opposite relationship. However, this notion
is at the individual level which is best examined within the policy context of individual
states. While research suggests that these policies benefit the middle to upper–middle
classes, in this study we are effectively comparing state’s middle classes to one another; in
light of this finding, future research may alter the question to ask ‘‘are states with less
wealthy middle classes more likely to adopt these policies?’’
We also find states with higher levels of out-migration are more likely to adopt finance
innovations. This is in contrast to previous studies (e.g., Doyle 2006) that found coun-
terintuitive, opposite effects; within our broadened definition we find support for the
hypothesis that policies are enacted to retain students. One possible explanation is that the
political will to enact a particular policy could differ among the states. That is, while a
particular policy may have an easy path to adoption in one state a different finance
innovation may better address out-migration elsewhere.
Conclusions
As indicated in the title, our motivation was to ‘‘rethink’’ the diffusion of postsecondary
policies through both returning to the broad conceptualizations used in pioneering studies
and using an estimator that more closely mirrors the theoretical conceptualization of a
continuous policymaking process. By broadening the category of innovation we, in part,
uncovered the frequently hypothesized effect of diffusion, though the variation of the effect
over time suggests an even more complicated relationship; our model found the conven-
tional, positive diffusion in the early years of the analysis, in the end years we found the
opposite, negative relationship for contiguous adoptions. For future studies of policy
adoption this ‘‘anti-diffusion’’ finding should compel researchers to redefine the exact
mechanisms of diffusion by stating the underlying process they believe to influence the
spread of policies. Is it interstate competition? If so, then there should be strong theoretical
arguments for how competition manifests itself. If it is learning, one must acknowledge
that decision-makers within states may learn from one another in multiple ways and seek to
refine a measure that can account for the timing of this learning and how it too might
spread. The question recalls Ness’ (2010) discussion of ‘‘research utilization’’ in the
postsecondary policy process, in which he speculates the avenues through which research
about postsecondary policies are disseminated to policymakers. How much of the
‘‘learning’’ might be attributable to Ness’ more technocratic conceptualization and to what
extent are policies’ effects transmitted through less formal means?
Res High Educ
123

Beyond contributing to an understanding of interstate policy diffusion, this paper
demonstrates the leverage researchers can gain over data in comparative state studies of
postsecondary policies. Through studying policies as interconnected, we may better
understand the process itself. Conceptually, this is a return to not only the early studies of
postsecondary policy adoption, but the work of Walker and Gray in the late 1960s and
early 1970s, an approach augmented through methodological advancements. Though we
believe this is an advancement, we also wish to acknowledge what we believe to be the
most flawed aspect of our modeling choice: the model does not differentiate between single
and multiple adoptions in a given year, a phenomenon occurring approximately 13% in the
period of our study. Logically it would follow that the outcome of adopting two finance
innovations in a given year is substantively different than a single adoption. This echoes a
perennial issue of studies of this nature that we, admittedly, do not resolve. While our
multi-event study touches on ‘‘intensity’’ of policymaking by means of frequency over
time, it does not differentiate between the strength of the policies or wholesale state
postsecondary reform. As within many categories there can be policies ‘‘with teeth,’’ and
we suggest that future researchers measure comprehensive policy reform. Future investi-
gations may wish to build on this by accounting for the repeating events and their intensity,
as well as using other models that account for unobserved heterogeneities.
Despite these shortcomings, broadening the categories of postsecondary policies will
help researchers and policymakers alike to better understand this critical arena that shapes
much of higher education. At a time when many state legislatures, governors, and post-
secondary policymakers have once again begun to address the iron triangle of affordability,
efficiency, and accountability, and adopted their own ‘‘completion agendas,’’ the spread of
these priorities will undoubtedly shape the environment in which institutions operate.
Directly related to policy adoption is the current, potentially shifting sands of policy dif-
fusion in the postsecondary arena. While the current higher education reform movement is
characterized by large foundations and intermediary organizations that attempt to provide
cross-state technical assistance to state decision-makers—effectively hastening the diffu-
sion of policy innovation. While this may represent a new facilitation for the spread of
policies, our study suggests that these efforts that could enable or inhibit these goals.
Appendix 1
See Table 4
Table 4 Policy sources table
Financeinnovation
Primarysources
Additional sources
Tuitiondecentralization
Deaton (2006) Breneman and Finney (1997), Hovey (1999), Warne (2008),Wellman (2006)
Vouchers WICHE (2009) Fox (2006), Protopsaltis (2008)
Prepaid tuition and529 plans
Doyle et al.(2010)
Hurley ( 2006), Olivas (2003)
Performancefunding
McLendonet al. (2006)
Burke (1998, 2002) , McGuinness (2005), Volkwein (2007),Volkwein and Tandberg (2008), Dougherty and Reddy (2013)
Res High Educ
123

Table 4 Appendix continued
Financeinnovation
Primarysources
Additional sources
Merit-basedstudent aid
Doyle (2006) Ness ( 2008), Cohen-Vogel et al. (2008), Heller and Marin (2004),Delaney and Ness (2014)
All policies were updated as needed via the Education Commission of the States, NationalCouncil of StateLegislatures, state websites and other reliable, secondary sources
Appendix 2
See Table 5.
Table 5 State policy adoptions
Year Performancefunding
Pre-paidtuition
College savings plan Tuitiondecent-ralization
Meritaid
Vouchers
1979 TN
1980
1981
1982
1983
1984
1985 CT
1986 MI
1987 FL, IN,ME, WY
UT
1988 MO, OK,WV
KY MD, OK
1989 AL, LA,OH
OH
1990
1991 MO CT
1992 KY PA
1993 GA
1994 AR, CO, FL, MN VA NJ
1995 OH MA, TX,WI
LA, TX, WI
1996 SC CO, MS IN, MS, UT MS
1997 IN, LA, OK, SD,WA
IL, MD,NV, SC,WA
AZ, CA, CT, MD, ME, MN,MT, NC, NJ, NV, NY, RI
WI FL,MO,NM
1998 CA, IL DE, IA, NH, OK, VT NC LA, SC
1999 KS, NC, NJ, NY,OR, TX, VA
NM AR, CO, KS, MA, MO, OR,VA
KY, WA KY
2000 ID, PA KY IL, MI, NM, TN, WY OH MI,NV
Res High Educ
123
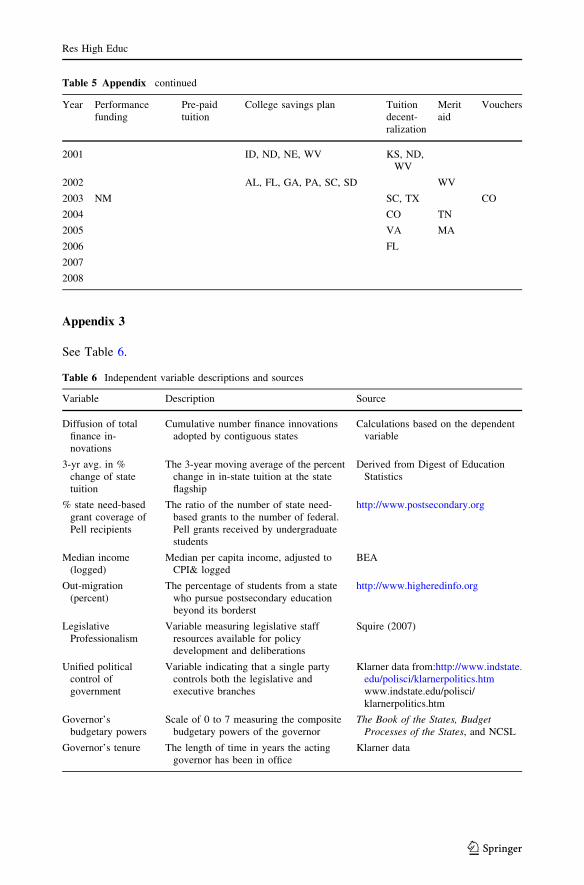
Table 5 Appendix continued
Year Performancefunding
Pre-paidtuition
College savings plan Tuitiondecent-ralization
Meritaid
Vouchers
2001 ID, ND, NE, WV KS, ND,WV
2002 AL, FL, GA, PA, SC, SD WV
2003 NM SC, TX CO
2004 CO TN
2005 VA MA
2006 FL
2007
2008
Appendix 3
See Table 6.
Table 6 Independent variable descriptions and sources
Variable Description Source
Diffusion of totalfinance in-novations
Cumulative number finance innovationsadopted by contiguous states
Calculations based on the dependentvariable
3-yr avg. in %change of statetuition
The 3-year moving average of the percentchange in in-state tuition at the stateflagship
Derived from Digest of EducationStatistics
% state need-basedgrant coverage ofPell recipients
The ratio of the number of state need-based grants to the number of federal.Pell grants received by undergraduatestudents
http://www.postsecondary.org
Median income(logged)
Median per capita income, adjusted toCPI& logged
BEA
Out-migration(percent)
The percentage of students from a statewho pursue postsecondary educationbeyond its borderst
http://www.higheredinfo.org
LegislativeProfessionalism
Variable measuring legislative staffresources available for policydevelopment and deliberations
Squire (2007)
Unified politicalcontrol ofgovernment
Variable indicating that a single partycontrols both the legislative andexecutive branches
Klarner data from:http://www.indstate.edu/polisci/klarnerpolitics.htmwww.indstate.edu/polisci/klarnerpolitics.htm
Governor’sbudgetary powers
Scale of 0 to 7 measuring the compositebudgetary powers of the governor
The Book of the States, BudgetProcesses of the States, and NCSL
Governor’s tenure The length of time in years the actinggovernor has been in office
Klarner data
Res High Educ
123

Table 6 Appendix continued
Variable Description Source
Interest Group ratio The total number of state public highereducation institutions and registerednon-college or -university public highereducation interest groups divided by thetotal number of interest groups in thestate
CGEL Blue Book, Lowery, state web-sites, & government archives, &NCES
ConsolidatedGoverning board
Variable indicating if a state has aconsolidated governing board for public4-year institutions
ECS
References
Anderson, J. (2011). Public policymaking, editia a 7-a. Boston: Wadsworth, Cenagage Learning.Barrilleaux, C., Holbrook, T., & Langer, L. (2002). Electoral competition, legislative balance, and american
state welfare policy. American Journal of Political Science, 46(2), 415–427.Berry, F. S., & Berry, W. D. (1990). State lottery adoptions as policy innovations: An event history analysis.
The American Political Science Review, 84(2), 395–415.Berry, F. S., & Berry, W. D. (1992). Tax innovation in the states: Capitalizing on political opportunity.
American Journal of Political Science, 36(3), 715–742.Beyle, T. L. (2004). The governors. In V. Gray & R. L. Hanson (Eds.), Politics in the American States.
Washington, DC: CQ.Boehmke, F. J., & Skinner, P. (2012). State policy innovativeness revisited. State Politics & Policy
Quarterly, 12(3), 303–329.Box-Steffensmeier, J. M., & Jones, B. S. (2004). Event history modeling: A guide for social scientists.
Cambridge, MA: Cambridge University Press.Box-Steffensmeier, J. M., & Zorn, C. (2002). Duration models for repeated events. The Journal of Politics,
64(4), 1069–1094.Breneman, D. W., & Finney, J. E. (1997). The changing landscape: Higher education finance in the 1990s.
In P. M. Callan & J. E. Finney (Eds.), Public and private financing of higher education (pp. 30–59).Phoenxiz, AZ: Oryx.
Burke, J. C. (1998). Performance funding indicators: Concerns, values, and models for state colleges anduniversities. New directions for institutional research, 97, 49–60.
Burke, J. C. (2002). Funding public colleges and universities for performance: Popularity, problems, andprospects. Albany, NY: Rockefeller Institute Press.
Burke, J. C. (2005). The many faces of accountability. In J. C. Burke (Ed.), Achieving accountability inhigher education: Balancing public, academic and market demands (pp. 1–24). Bolton, MA: Jossey-Bass.
Chen, R., & DesJardins, S. L. (2008). Exploring the effects of financial aid on the gap in student dropoutrisks by income level. Research in Higher Education, 49(1), 1–18.
Cohen-Vogel, L., Levine, W. K., & Spence, M. (2008). The ‘‘spread’’ of merit-based college aid. Educa-tional Policy, 22(3), 339–362.
Cornwell, C., Mustard, D. B., & Sridhar, D. J. (2009). The enrollment effects of merit-based financial aid:Evidence from georgia’s hope program. Journal of Labor Economics, 24(4), 761–786.
Deaton, R. (2006). Policy shifts in tuition setting authority in the American states: An event history analysisof state policy adoption. Unpublished manuscript, Department of Leadership, Policy, and Organiza-tions, Peabody College, Vanderbilt University.
Delaney, J. A. & Ness, E. C. (2014). Creating a merit aid typology. In B. Curs (Ed.), Merit Aid Recon-sidered, New Directions in Institutional Research. San Francisco: Jossey-Bass.
DesJardins, S. L., Ahlburg, D. A., & McCall, B. P. (2002). A temporal investigation of factors related totimely degree completion. Journal of Higher Education, 73(5), 555–581.
Dometrius, N. C. (1987). Changing gubernatorial power: The measure vs. reality. Political ResearchQuarterly, 40(2), 319–328.
Res High Educ
123

Dougherty, K. J., & Reddy, V. (2013). Performance funding for higher education: What are the mecha-nisms? what are the impacts? ASHE Higher Education Report, 39(2),
Doyle, W., McLendon, M., & Hearn, J. (2010). The adoption of prepaid tuition and savings plans in theamerican states: An event history analysis. Research in Higher Education, 51(7), 659–686.
Doyle, W. R. (2006). Adoption of merit-based student grant programs: An event history analysis. Educa-tional Evaluation and Policy Analysis, 28(3), 259–285.
Dynarski, S. M. (2004). Who benefits from the education saving incentives? Income, educational expec-tations, and the value of the 529 and coverdell. National Bureau of Economic Research, 43(2),359–383.
Fox, K. (2006). Vouchers in public higher education: The colorado approach to funding and access.Boulder, CO: Western Interstate Commission for Higher Education.
Gorbunov, A. (2004). Performance funding: Policy innovations in the era of accountability. Unpublishedmanuscript, Department of Leadership, Policy, and Organizations, Peabody College, VanderbiltUniversity.
Hauptman, A. M. (2006). Higher education finance: Trends and issues. In J. Forest & P. G. Altbach (Eds.),International handbook of higher education (pp. 83–106). Dordrecht, The Netherlands: Springer.
Hearn, J. C., & Griswold, C. P. (1994). State-level centralization and policy innovation in us postsecondaryeducation. Educational evaluation and policy analysis, 16(2), 161–190.
Hearn, J. C., McLendon, M. K., & Mokher, C. G. (2008). Accounting for student success: An empiricalanalysis of the origins and spread of state student unit-record systems. Research in Higher Education,49(8), 665–683.
Heller, D. E. (Ed.). (2002). Condition of access: Higher education for lower income students. AmericanCouncil on Education/Praeger.
Heller, D. E., & Marin, P. (2004). State merit scholarship programs and racial inequality. Cambridge, MA:The Civil Rights Project at Harvard University.
Hemsley-Brown, J. (2011). Market heal thyself: the challenges of a free market in higher education. Journalof Marketing for Higher Education, 21(2), 115–132.
Henry, G. T., Rubenstein, R., & Bugler, D. T. (2004). Is hope enough? Impacts of receiving and losingmerit-based financial aid. Educational Policy, 18(5), 686–709.
Hosmer, D. W., & Lemeshow, S. (1999). Applied survival analysis: Regression modeling of time to eventdata. New York: Wiley.
Hovey, H. A. (1999). State spending for higher education in the next decade: The battle to sustain currentsupport. Report prepared by State Policy Research, Inc. for the National Center for Public Policy andHigher Education.
Huber, J. D., Shipan, C. R., & Pfahler, M. (2001). Legislatures and statutory control of bureaucracy.American Journal of Political Science, 45(2), 330–345.
Hurley, J. F. (2006). The best way to save for college: A complete guide to 529 plans. Com Llc:Savingforcollege.
Ishitani, T. T. (2006). Studying attrition and degree completion behavior among first-generation collegestudents in the United States. The Journal of Higher Education, 77(5), 861.
Johnson, E. L. (1987). The ‘‘other jeffersons’’ and the state university idea. The Journal of Higher Edu-cation, 58(2), 127–150.
Jones, B. S., & Branton, R. P. (2005). Beyond logit and probit: Cox duration models of single, repeating, andcompeting events for state policy adoption. State Politics and Policy Quarterly, 5(4), 420–443.
Kingdon, J. W. (1984). Agendas, alternatives, and public policies. Boston: Little Brown.Klarner, C. E., Berry, W. D., Carsey, T. M., Jewell, M., Niemi, Richard G. and Powell, L. W., & Snyder, J.
(2013). State legislative election returns, 1967–2010.Lehman, J. S. (1990). Social irresponsibility, actuarial assumptions, and wealth redistribution: Lessons about
public policy from a prepaid tuition program. Michigan Law Review, 88(5), 1035–1141.Lyall, K. C., & Sell, K. R. (2006). The de facto privatization of american public higher education. Change,
38(1), 6–13.March, J. G., & Olsen, J. P. (1984). The new institutionalism: Organizational factors in political life.
American Political Science Review, 78(3), 734–749.McGuinness, A. C. (2005). The states in higher education. In P. G. Altbach, R. O. Berdahl, & P. J. Gumport
(Eds.), Higher education in the 21st century (2nd ed., pp. 198–225). Baltimore: Johns Hopkins.McLaughlin, M. W. (1987). Learning from experience: Lessons from policy implementation. Educational
evaluation and policy analysis, 9(2), 171–178.McLendon, M. K. (2003). State governance reform of higher education: Patterns, trends, and theories of the
public policy process. Higher Education: Handbook of Theory and Research (vol. XVIII, pp. 57–143).
Res High Educ
123

McLendon, M. K., Deaton, R., & Hearn, J. C. (2007). The enactment of reforms in state governance ofhigher education: Testing the political instability hypothesis. Journal of Higher Education, 78,645–675.
McLendon, M. K., Hearn, J. C., & Deaton, R. (2006). Called to account: Analyzing the origins and spread ofstate performance-accountability policies for higher education. Educational Evaluation and PolicyAnalysis, 28(1), 1–24.
McLendon, M. K., Hearn, J. C., & Mokher, C. G. (2009). Partisans, professionals, and power: The role ofpolitical factors in state higher education funding. The Journal of Higher Education, 80(6), 686–713.
McLendon, M. K., Heller, D. E., & Young, S. P. (2005). State postsecondary policy innovation: Politics,competition, and the interstate migration of policy ideas. The Journal of Higher Education, 76(4),363–400.
Mintrom, M. (2000). Policy entrepreneurs and school choice. Washington, DC: Georgetown UniversityPress.
Mintrom, M., & Vergari, S. (1998). Policy networks and innovation diffusion: The case of state educationreforms. The Journal of Politics, 60(1), 126–148.
National Association of State Student Grant and Aid Programs. (2010). Annual survey report on state-sponsored student financial aid.
Ness, E. C. (2006). Deciding who earns hope, promise, and success: Toward a comprehensive model of themerit aid eligibility policy process. Unpublished manuscript, Department of Leadership, Policy, andOrganizations, Peabody College, Vanderbilt University.
Ness, E. C. (2008). Merit aid and the politics of education. New York: Routledge.Ness, E. C. (2010). The role of information in the policy process: Implications for the examination of
research utilization in higher education policy (Vol. 25, p. 1)., Higher Education: Handbook of Theoryand Research The Netherlands: Springer.
Nicholson-Crotty, J., & Meier, K. J. (2003). Politics, structure, and public policy: The case of highereducation. Educational Policy, 17(1), 80–97.
Olivas, M. (2003). State college savings and prepaid tuition plans: A reappraisal and review. Journal of Lawand Education, 32(4), 475.
Paulsen, M., & Smart, J. (2001). The finance of higher education: Theory, research, policy, and practice.New York: Agathon.
Protopsaltis, S. (2008). Theories of the policy process and higher education reform in Colorado: Theshaping of the first state postsecondary education voucher system. Ann Arbor, MI: ProQuest.
Rabovsky, T. M. (2012). Accountability in higher education: Exploring impacts on state budgets andinstitutional spending patterns. Journal of Public Administration Research and Theory, 22(4),675–700.
Richardson, R. C. (2005). Accountability and governance. In J. C. Burke (Ed.), Achieving accountability inhigher education: Balancing public, academic and market demands (pp. 55–77). San Francisco: Jossey-Bass.
Rouse, C. E., & Barrow, L. (2009). School vouchers and student achievement: Recent evidence andremaining questions. Annual Review of Economics, 1(1), 17–42.
Schlesinger, J. M. (1965). The politics of the executive. In H. Jacob & K. Vines (Eds.), Politics in theAmerican states (pp. 207–237). Boston: Little, Brown.
Sponsler, B. (2010). Coveting more than thy neighbor: Beyond geographically proximate explanations ofpostsecondary policy diffusion. Higher Education in Review, 7, 81–100.
Squire, P. (1993). Professionalization and public opinion of state legislatures. The Journal of Politics,55(02), 479–491.
Squire, P. (2007). Measuring state legislative professionalism: The squire index revisited. State Politics &Policy Quarterly, 7(2), 211–227.
Tandberg, D. A., & Ness, E. C. (2011). State capital expenditures for higher education. Journal of EducationFinance, 36(4), 394–423.
Teixeira, P., Jongbloed, B. B., Dill, D. D., & Amaral, A. (2006). Markets in higher education: rhetoric orreality? (Vol. 6). The Netherlands: Springer.
Titus, M. A. (2006). No college student left behind: The influence of financial aspects of a state’s highereducation policy on college completion. The Review of Higher Education, 29(3), 293–317.
Toutkoushian, R., & Danielson, C. (2002). Using performance indicators to evaluate decentralized bud-geting systems and institutional performance. Incentive-based budgeting systems in public universities(pp. 205–226). Northhampton, MA: Edward Elgar.
Volkwein, J. F. (2007). Assessing institutional effectiveness and connecting the pieces of a fragmenteduniversity. Fixing the fragmented university (pp. 145–180). Bolton, MA: Jossey-Bass.
Res High Educ
123
Volkwein, J. F., & Tandberg, D. A. (2008). Measuring up: Examining the connections among state structuralcharacteristics, regulatory practices, and performance. Research in Higher Education, 49(2), 180–197.
Walker, J. L. (1969). The diffusion of innovations among the american states. The American PoliticalScience Review, 63(3), 880–899.
Warne, T. R. (2008). Comparing theories of the policy process and state tuition policy: Critical theory,institutional rational choice, and advocacy coalitions. Unpublished doctoral dissertation, The Uni-versity of Missouri.
Wellman, J. V. (2006). Costs, prices and affordability a background paper for the secretarys commission onthe future of higher education. Retrieved August 3, 2013 from http://www2.ed.gov/about/bdscomm/list/hiedfuture/reports/wellman.pdf.
Western Interstate Commission on Higher Education. (2009). An evaluation of colorado’s college oppor-tunity fund and related policies. Retrieved August 03, 2013 from http://www.wiche.edu/info/publications/policyCOF.pdf.
Zumeta, W. (1996). Meeting the demand for higher education without breaking the bank: A framework forthe design of state higher education policies for an era of increasing demand. The Journal of HigherEducation, 67(4), 367–425.
Zumeta, W. (1998). Public university accountability to the state in the late twentieth century: Time for arethinking? Review of Policy Research, 15(4), 5–22.
Res High Educ
123