merck & co., inc.d18rn0p25nwr6d.cloudfront.net/cik-0000064978/fe3cce1b-1029-4759-9f... · merck...
TRANSCRIPT

UNITED STATESSECURITIES AND EXCHANGE COMMISSION
Washington, D.C. 20549
FORM 10-Q
(Mark One)
☒☒ QUARTERLY REPORT PURSUANT TO SECTION 13 OR 15(d) OF THE SECURITIES EXCHANGE ACTOF 1934
For the quarterly period ended September 30, 2018
OR
☐☐TRANSITION REPORT PURSUANT TO SECTION 13 OR 15(d) OF THE SECURITIES EXCHANGE ACTOF 1934
For the transition period from ______ to ______
Commission File No. 1-6571
Merck & Co., Inc.2000 Galloping Hill Road
Kenilworth, N.J. 07033(908) 740-4000
Incorporated in New Jersey I.R.S. Employer Identification No. 22-1918501
The number of shares of common stock outstanding as of the close of business on October 31, 2018 : 2,600,376,500
Indicate by check mark whether the registrant: (1) has filed all reports required to be filed by Section 13 or 15(d) of the Securities Exchange Act of 1934 during thepreceding 12 months (or for such shorter period that the registrant was required to file such reports), and (2) has been subject to such filing requirements for thepast 90 days. Yes ☒☒ No ☐☐
Indicate by check mark whether the registrant has submitted electronically every Interactive Data File required to be submitted pursuant to Rule 405 of RegulationS-T (§232.405 of this chapter) during the preceding 12 months (or for such shorter period that the registrant was required to submit such files). Yes ☒☒ No ☐☐
Indicate by check mark whether the registrant is a large accelerated filer, an accelerated filer, a non-accelerated filer, smaller reporting company, or an emerginggrowth company. See the definitions of “large accelerated filer,” “accelerated filer,” “smaller reporting company,” and “emerging growth company” in Rule 12b-2of the Exchange Act. (Check one):
Large accelerated filer ☒☒ Accelerated filer ☐☐
Non-accelerated filer ☐☐ Smaller reporting company ☐☐
Emerging growth company ☐☐
If an emerging growth company, indicate by check mark if the registrant has elected not to use the extended transition period for complying with any new orrevised financial accounting standards provided pursuant to Section 13(a) of the Exchange Act. ☐
Indicate by check mark whether the registrant is a shell company (as defined in Rule 12b-2 of the Exchange Act). Yes ☐ No ☒☒

Part I - Financial InformationItem 1. Financial Statements
MERCK & CO., INC. AND SUBSIDIARIESCONDENSED CONSOLIDATED STATEMENT OF INCOME
(Unaudited, $ in millions except per share amounts)
Three Months Ended
September 30, Nine Months Ended
September 30,
2018 2017 2018 2017
Sales $ 10,794 $ 10,325 $ 31,296 $ 29,689Costs, Expenses and Other
Materials and production 3,619 3,307 10,220 9,472Marketing and administrative 2,443 2,459 7,459 7,432Research and development 2,068 4,413 7,538 8,024Restructuring costs 171 153 494 470Other (income) expense, net (172) (207) (512) (351)
8,129 10,125 25,199 25,047Income Before Taxes 2,665 200 6,097 4,642Taxes on Income 707 251 1,682 1,186Net Income (Loss) 1,958 (51) 4,415 3,456Less: Net Income Attributable to Noncontrolling Interests 8 5 22 16Net Income (Loss) Attributable to Merck & Co., Inc. $ 1,950 $ (56) $ 4,393 $ 3,440
Basic Earnings (Loss) per Common Share Attributable to Merck & Co., Inc.Common Shareholders $ 0.73 $ (0.02) $ 1.64 $ 1.26
Earnings (Loss) per Common Share Assuming Dilution Attributable to Merck & Co.,Inc. Common Shareholders $ 0.73 $ (0.02) $ 1.63 $ 1.25
MERCK & CO., INC. AND SUBSIDIARIESCONDENSED CONSOLIDATED STATEMENT OF COMPREHENSIVE INCOME
(Unaudited, $ in millions)
Three Months Ended
September 30, Nine Months Ended
September 30,
2018 2017 2018 2017
Net Income (Loss) Attributable to Merck & Co., Inc. $ 1,950 $ (56) $ 4,393 $ 3,440Other Comprehensive (Loss) Income Net of Taxes:
Net unrealized gain (loss) on derivatives, net of reclassifications 27 (66) 223 (441)Net unrealized gain (loss) on investments, net of reclassifications 40 135 (56) 213Benefit plan net gain and prior service credit, net of amortization 40 13 106 86Cumulative translation adjustment (136) 67 (240) 423
(29) 149 33 281Comprehensive Income Attributable to Merck & Co., Inc. $ 1,921 $ 93 $ 4,426 $ 3,721
The accompanying notes are an integral part of these condensed consolidated financial statements.
- 2 -
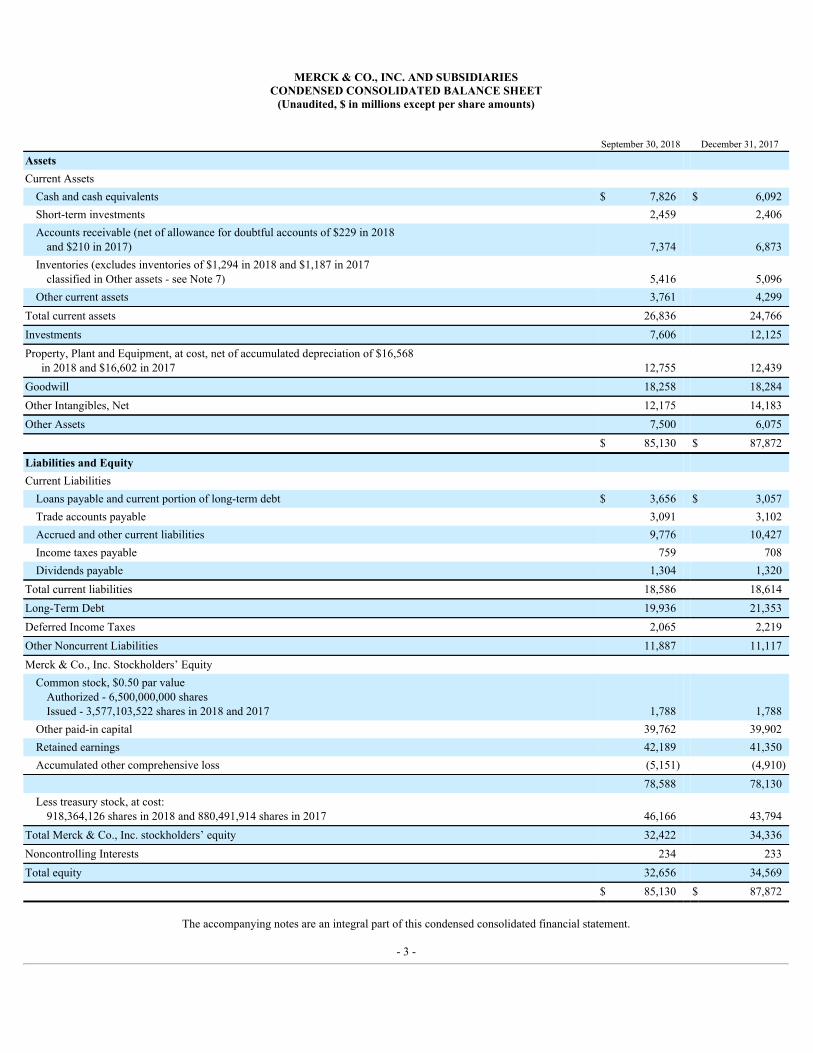
MERCK & CO., INC. AND SUBSIDIARIESCONDENSED CONSOLIDATED BALANCE SHEET
(Unaudited, $ in millions except per share amounts)
September 30, 2018 December 31, 2017
Assets Current Assets
Cash and cash equivalents $ 7,826 $ 6,092Short-term investments 2,459 2,406Accounts receivable (net of allowance for doubtful accounts of $229 in 2018
and $210 in 2017) 7,374 6,873Inventories (excludes inventories of $1,294 in 2018 and $1,187 in 2017
classified in Other assets - see Note 7) 5,416 5,096Other current assets 3,761 4,299
Total current assets 26,836 24,766Investments 7,606 12,125Property, Plant and Equipment, at cost, net of accumulated depreciation of $16,568
in 2018 and $16,602 in 2017 12,755 12,439Goodwill 18,258 18,284Other Intangibles, Net 12,175 14,183Other Assets 7,500 6,075 $ 85,130 $ 87,872
Liabilities and Equity Current Liabilities
Loans payable and current portion of long-term debt $ 3,656 $ 3,057Trade accounts payable 3,091 3,102Accrued and other current liabilities 9,776 10,427Income taxes payable 759 708Dividends payable 1,304 1,320
Total current liabilities 18,586 18,614Long-Term Debt 19,936 21,353Deferred Income Taxes 2,065 2,219Other Noncurrent Liabilities 11,887 11,117Merck & Co., Inc. Stockholders’ Equity
Common stock, $0.50 par valueAuthorized - 6,500,000,000 sharesIssued - 3,577,103,522 shares in 2018 and 2017 1,788 1,788
Other paid-in capital 39,762 39,902Retained earnings 42,189 41,350Accumulated other comprehensive loss (5,151) (4,910)
78,588 78,130Less treasury stock, at cost:
918,364,126 shares in 2018 and 880,491,914 shares in 2017 46,166 43,794Total Merck & Co., Inc. stockholders’ equity 32,422 34,336Noncontrolling Interests 234 233Total equity 32,656 34,569 $ 85,130 $ 87,872
The accompanying notes are an integral part of this condensed consolidated financial statement.
- 3 -
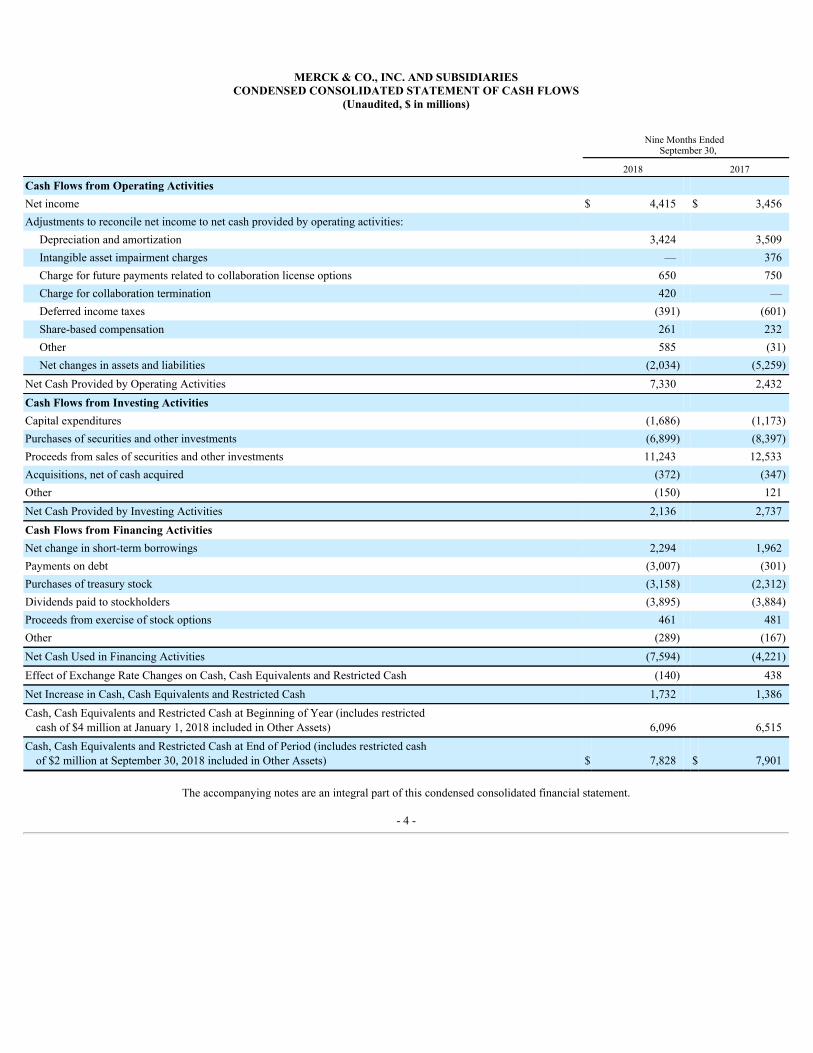
MERCK & CO., INC. AND SUBSIDIARIESCONDENSED CONSOLIDATED STATEMENT OF CASH FLOWS
(Unaudited, $ in millions)
Nine Months Ended
September 30,
2018 2017
Cash Flows from Operating Activities Net income $ 4,415 $ 3,456Adjustments to reconcile net income to net cash provided by operating activities:
Depreciation and amortization 3,424 3,509Intangible asset impairment charges — 376Charge for future payments related to collaboration license options 650 750Charge for collaboration termination 420 —Deferred income taxes (391) (601)Share-based compensation 261 232Other 585 (31)Net changes in assets and liabilities (2,034) (5,259)
Net Cash Provided by Operating Activities 7,330 2,432Cash Flows from Investing Activities Capital expenditures (1,686) (1,173)Purchases of securities and other investments (6,899) (8,397)Proceeds from sales of securities and other investments 11,243 12,533Acquisitions, net of cash acquired (372) (347)Other (150) 121Net Cash Provided by Investing Activities 2,136 2,737Cash Flows from Financing Activities Net change in short-term borrowings 2,294 1,962Payments on debt (3,007) (301)Purchases of treasury stock (3,158) (2,312)Dividends paid to stockholders (3,895) (3,884)Proceeds from exercise of stock options 461 481Other (289) (167)Net Cash Used in Financing Activities (7,594) (4,221)Effect of Exchange Rate Changes on Cash, Cash Equivalents and Restricted Cash (140) 438Net Increase in Cash, Cash Equivalents and Restricted Cash 1,732 1,386Cash, Cash Equivalents and Restricted Cash at Beginning of Year (includes restricted
cash of $4 million at January 1, 2018 included in Other Assets) 6,096 6,515Cash, Cash Equivalents and Restricted Cash at End of Period (includes restricted cash
of $2 million at September 30, 2018 included in Other Assets) $ 7,828 $ 7,901
The accompanying notes are an integral part of this condensed consolidated financial statement.
- 4 -

Notes to Condensed Consolidated Financial Statements (unaudited)
1. Basis of Presentation
The accompanying unaudited condensed consolidated financial statements of Merck & Co., Inc. (Merck or the Company) have been prepared pursuantto the rules and regulations for reporting on Form 10-Q. Accordingly, certain information and disclosures required by accounting principles generally accepted inthe United States for complete consolidated financial statements are not included herein. These interim statements should be read in conjunction with the auditedfinancial statements and notes thereto included in Merck’s Form 10-K filed on February 27, 2018.
The results of operations of any interim period are not necessarily indicative of the results of operations for the full year. In the Company’s opinion, alladjustments necessary for a fair statement of these interim statements have been included and are of a normal and recurring nature. Certain reclassifications havebeen made to prior year amounts to conform to the current presentation.
Recently Adopted Accounting StandardsIn May 2014, the Financial Accounting Standards Board (FASB) issued amended accounting guidance on revenue recognition (ASU 2014-09) that
applies to all contracts with customers. The objective of the new guidance is to improve comparability of revenue recognition practices across entities and toprovide more useful information to users of financial statements through improved disclosure requirements. The new standard permits two methods of adoption:retrospectively to each prior reporting period presented (full retrospective method), or retrospectively with the cumulative effect of adopting the guidance beingrecognized at the date of initial application (modified retrospective method). The new standard was effective as of January 1, 2018 and was adopted using themodified retrospective method. The Company recorded a cumulative-effect adjustment upon adoption increasing Retained earnings by $5 million . See Note 2 foradditional information related to the adoption of this standard.
In January 2016, the FASB issued revised guidance for the accounting and reporting of financial instruments (ASU 2016-01) and in 2018 issued relatedtechnical corrections (ASU 2018-03). The new guidance requires that equity investments with readily determinable fair values currently classified as available forsale be measured at fair value with changes in fair value recognized in net income. The Company has elected to measure equity investments without readilydeterminable fair values at cost, less impairment, adjusted for subsequent observable price changes, which will be recognized in net income. The new guidance alsochanged certain disclosure requirements. ASU 2016-01 was effective as of January 1, 2018 and was adopted using a modified retrospective approach. TheCompany recorded a cumulative-effect adjustment upon adoption increasing Retained earnings by $8 million . ASU 2018-03 was also adopted as of January 1,2018 on a prospective basis and did not result in any additional impacts upon adoption.
In October 2016, the FASB issued guidance on the accounting for the income tax consequences of intra-entity transfers of assets other than inventory(ASU 2016-16). The new guidance requires the recognition of the income tax consequences of an intra-entity transfer of an asset (with the exception of inventory)when the intra-entity transfer occurs, replacing the prohibition against doing so. The current exception to defer the recognition of any tax impact on the transfer ofinventory within the consolidated entity until it is sold to a third party remains unaffected. The new standard was effective as of January 1, 2018 and was adoptedusing a modified retrospective approach. The Company recorded a cumulative-effect adjustment upon adoption increasing Retained earnings by $54 million with acorresponding decrease to Deferred Income Taxes .
In August 2017, the FASB issued new guidance on hedge accounting (ASU 2017-12) that is intended to more closely align hedge accounting withcompanies’ risk management strategies, simplify the application of hedge accounting, and increase transparency as to the scope and results of hedging programs.The new guidance makes more financial and nonfinancial hedging strategies eligible for hedge accounting, amends the presentation and disclosure requirements,and changes how companies assess effectiveness. The Company elected to early adopt this guidance as of January 1, 2018 on a modified retrospective basis. Thenew guidance was applied to all existing hedges as of the adoption date. For fair value hedges of interest rate risk outstanding as of the date of adoption, theCompany recorded a cumulative-effect adjustment upon adoption to the basis adjustment on the hedged item resulting from applying the benchmark component ofthe coupon guidance. This adjustment decreased Retained earnings by $11 million . Also, in accordance with the transition provisions of ASU 2017-12, theCompany was required to eliminate the separate measurement of ineffectiveness for its cash flow hedging instruments existing as of the adoption date through acumulative-effect adjustment to retained earnings; however, all such amounts were de minimis .
In February 2018, the FASB issued new guidance to address a narrow-scope financial reporting issue that arose as a consequence of the Tax Cuts andJobs Act of 2017 (TCJA) (ASU 2018-02). Existing guidance requires that deferred tax liabilities and assets be adjusted for a change in tax laws or rates with theeffect included in income from continuing operations in the reporting period that includes the enactment date. That guidance is applicable even in situations inwhich the related income tax effects of items in accumulated other comprehensive income were originally recognized in other comprehensive income (rather thanin net income), such as amounts related to benefit plans and hedging activity. As a result, the tax effects of items within accumulated other comprehensive incomedo not reflect the appropriate tax rate (the difference is referred to as stranded tax effects). The new guidance allows for a reclassification of these amounts toretained earnings thereby eliminating these stranded tax effects. The Company elected to early adopt the new guidance in the first quarter of 2018 and reclassifiedthe stranded income
- 5 -
Notes to Condensed Consolidated Financial Statements (unaudited)
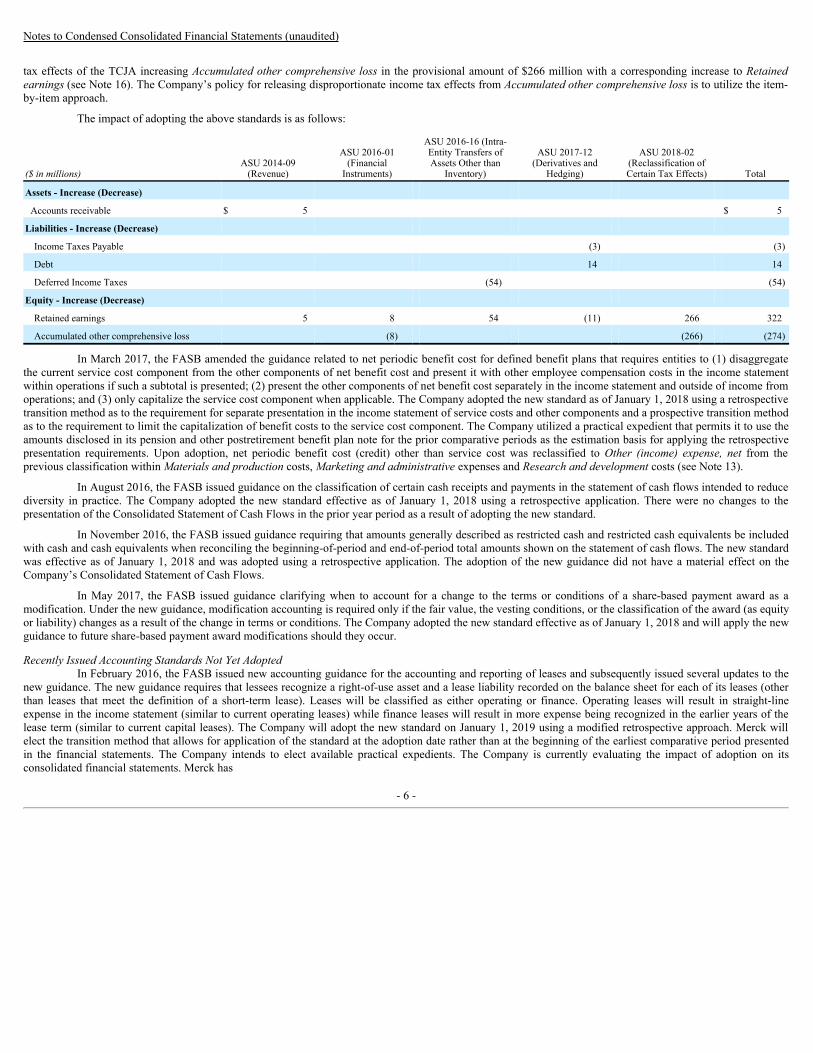
tax effects of the TCJA increasing Accumulated other comprehensive loss in the provisional amount of $266 million with a corresponding increase to Retainedearnings (see Note 16). The Company’s policy for releasing disproportionate income tax effects from Accumulated other comprehensive loss is to utilize the item-by-item approach.
The impact of adopting the above standards is as follows:
($ in millions)ASU 2014-09
(Revenue)
ASU 2016-01(Financial
Instruments)
ASU 2016-16 (Intra-Entity Transfers ofAssets Other than
Inventory)
ASU 2017-12(Derivatives and
Hedging)
ASU 2018-02(Reclassification ofCertain Tax Effects) Total
Assets - Increase (Decrease)
Accounts receivable $ 5 $ 5
Liabilities - Increase (Decrease)
Income Taxes Payable (3) (3)
Debt 14 14
Deferred Income Taxes (54) (54)
Equity - Increase (Decrease)
Retained earnings 5 8 54 (11) 266 322
Accumulated other comprehensive loss (8) (266) (274)
In March 2017, the FASB amended the guidance related to net periodic benefit cost for defined benefit plans that requires entities to (1) disaggregatethe current service cost component from the other components of net benefit cost and present it with other employee compensation costs in the income statementwithin operations if such a subtotal is presented; (2) present the other components of net benefit cost separately in the income statement and outside of income fromoperations; and (3) only capitalize the service cost component when applicable. The Company adopted the new standard as of January 1, 2018 using a retrospectivetransition method as to the requirement for separate presentation in the income statement of service costs and other components and a prospective transition methodas to the requirement to limit the capitalization of benefit costs to the service cost component. The Company utilized a practical expedient that permits it to use theamounts disclosed in its pension and other postretirement benefit plan note for the prior comparative periods as the estimation basis for applying the retrospectivepresentation requirements. Upon adoption, net periodic benefit cost (credit) other than service cost was reclassified to Other (income) expense, net from theprevious classification within Materials and production costs, Marketing and administrative expenses and Research and development costs (see Note 13).
In August 2016, the FASB issued guidance on the classification of certain cash receipts and payments in the statement of cash flows intended to reducediversity in practice. The Company adopted the new standard effective as of January 1, 2018 using a retrospective application. There were no changes to thepresentation of the Consolidated Statement of Cash Flows in the prior year period as a result of adopting the new standard.
In November 2016, the FASB issued guidance requiring that amounts generally described as restricted cash and restricted cash equivalents be includedwith cash and cash equivalents when reconciling the beginning-of-period and end-of-period total amounts shown on the statement of cash flows. The new standardwas effective as of January 1, 2018 and was adopted using a retrospective application. The adoption of the new guidance did not have a material effect on theCompany’s Consolidated Statement of Cash Flows.
In May 2017, the FASB issued guidance clarifying when to account for a change to the terms or conditions of a share-based payment award as amodification. Under the new guidance, modification accounting is required only if the fair value, the vesting conditions, or the classification of the award (as equityor liability) changes as a result of the change in terms or conditions. The Company adopted the new standard effective as of January 1, 2018 and will apply the newguidance to future share-based payment award modifications should they occur.
Recently Issued Accounting Standards Not Yet AdoptedIn February 2016, the FASB issued new accounting guidance for the accounting and reporting of leases and subsequently issued several updates to the
new guidance. The new guidance requires that lessees recognize a right-of-use asset and a lease liability recorded on the balance sheet for each of its leases (otherthan leases that meet the definition of a short-term lease). Leases will be classified as either operating or finance. Operating leases will result in straight-lineexpense in the income statement (similar to current operating leases) while finance leases will result in more expense being recognized in the earlier years of thelease term (similar to current capital leases). The Company will adopt the new standard on January 1, 2019 using a modified retrospective approach. Merck willelect the transition method that allows for application of the standard at the adoption date rather than at the beginning of the earliest comparative period presentedin the financial statements. The Company intends to elect available practical expedients. The Company is currently evaluating the impact of adoption on itsconsolidated financial statements. Merck has
- 6 -
Notes to Condensed Consolidated Financial Statements (unaudited)
selected a lease accounting tool and made significant progress regarding lease data validation for contracts that are in the Company’s current lease portfolio. Merckcontinues to assess the potential impact of embedded leases in certain agreements.
In June 2016, the FASB issued amended guidance on the accounting for credit losses on financial instruments. The guidance introduces an expectedloss model for estimating credit losses, replacing the incurred loss model. The new guidance also changes the impairment model for available-for-sale debtsecurities, requiring the use of an allowance to record estimated credit losses (and subsequent recoveries). The new guidance is effective for interim and annualperiods beginning in 2020, with earlier application permitted in 2019. The new guidance is to be applied on a modified retrospective basis through a cumulative-effect adjustment directly to retained earnings in the beginning of the period of adoption. The Company is currently evaluating the impact of adoption on itsconsolidated financial statements.
In January 2017, the FASB issued guidance that provides for the elimination of Step 2 from the goodwill impairment test. Under the new guidance,impairment charges are recognized to the extent the carrying amount of a reporting unit exceeds its fair value with certain limitations. The new guidance iseffective for interim and annual periods in 2020. Early adoption is permitted. The Company does not anticipate that the adoption of the new guidance will have amaterial effect on its consolidated financial statements.
In April 2018, the FASB issued new guidance on the accounting for costs incurred to implement a cloud computing arrangement that is considered aservice arrangement. The new guidance requires the capitalization of such costs, aligning it with the accounting for costs associated with developing or obtaininginternal-use software. The new guidance is effective for interim and annual periods in 2020. Early adoption is permitted, including adoption in any interim period.Prospective adoption for eligible costs incurred on or after the date of adoption or retrospective adoption is permitted. The Company is currently evaluating theimpact of adoption on its consolidated financial statements and may elect to early adopt this guidance.
2. Summary of Significant Accounting Policies
On January 1, 2018, the Company adopted ASU 2014-09, Revenue from Contracts with Customers , and subsequent amendments (ASC 606 or newguidance), using the modified retrospective method. Merck applied the new guidance to all contracts with customers within the scope of the standard that were ineffect on January 1, 2018 and recognized the cumulative effect of initially applying the new guidance as an adjustment to the opening balance of retained earnings(see Note 1). Comparative information for prior periods has not been restated and continues to be reported under the accounting standards in effect for thoseperiods.
The new guidance provides principles that an entity applies to report useful information about the amount, timing, and uncertainty of revenue and cashflows arising from its contracts to provide goods or services to customers. The core principle requires an entity to recognize revenue to depict the transfer of goodsor services to customers in an amount that reflects the consideration that it expects to be entitled to in exchange for those goods or services. The new guidanceintroduces a 5-step model to recognize revenue when or as control is transferred: identify the contract with a customer, identify the performance obligations in thecontract, determine the transaction price, allocate the transaction price to the performance obligations in the contract, and recognize revenue when or as theperformance obligations are satisfied. The Company’s significant accounting policies are detailed in Note 2 to the consolidated financial statements included inMerck’s Annual Report on Form 10-K for the year ended December 31, 2017. Changes to the Company’s revenue recognition policy as a result of adopting ASC606 are described below. See Note 17 for disaggregated revenue disclosures.
Revenue Recognition — Recognition of revenue requires evidence of a contract, probable collection of sales proceeds and completion of substantiallyall performance obligations. Merck acts as the principal in substantially all of its customer arrangements and therefore records revenue on a gross basis. Themajority of the Company’s contracts related to the Pharmaceutical and Animal Health segments have a single performance obligation - the promise to transfergoods. Shipping is considered immaterial in the context of the overall customer arrangement and damages or loss of goods in transit are rare. Therefore, shipping isnot deemed a separately recognized performance obligation.
The vast majority of revenues from sales of products are recognized at a point in time when control of the goods is transferred to the customer, whichthe Company has determined is when title and risks and rewards of ownership transfer to the customer and the Company is entitled to payment. Certain Merckentities, including U.S. entities, have contract terms under which control of the goods passes to the customer upon shipment; however, either pursuant to the termsof the contract or as a business practice, Merck retains responsibility for goods lost or damaged in transit. Prior to the adoption of the new standard, Merck wouldrecognize revenue for these entities upon delivery of the goods. Under the new guidance, the Company is now recognizing revenue at time of shipment for theseentities.
For businesses within the Company’s Healthcare Services segment and certain services in the Animal Health segment, revenue is recognized over time,generally ratably over the contract term as services are provided.
- 7 -
Notes to Condensed Consolidated Financial Statements (unaudited)
Merck’s payment terms for U.S. pharmaceutical customers are typically net 36 days from receipt of invoice and for U.S. animal health customers aretypically net 30 days from receipt of invoice; however, certain products, including Keytruda , have longer payment terms up to 90 days. Outside of the UnitedStates, payment terms are typically 30 days to 90 days although certain markets have longer payment terms.
The nature of the Company’s business gives rise to several types of variable consideration including discounts and returns, which are estimated at thetime of sale generally using the expected value method, although the most likely amount method is also used for certain types of variable consideration. In theUnited States, sales discounts are issued to customers at the point-of-sale, through an intermediary wholesaler (known as chargebacks), or in the form of rebates.Additionally, sales are generally made with a limited right of return under certain conditions. Revenues are recorded net of provisions for sales discounts andreturns, which are established at the time of sale. In addition, revenues are recorded net of time value of money discounts if collection of accounts receivable isexpected to be in excess of one year.
The provision for aggregate customer discounts covers chargebacks and rebates. Chargebacks are discounts that occur when a contracted customerpurchases through an intermediary wholesaler. The contracted customer generally purchases product from the wholesaler at its contracted price plus a mark-up.The wholesaler, in turn, charges the Company back for the difference between the price initially paid by the wholesaler and the contract price paid to thewholesaler by the customer. The provision for chargebacks is based on expected sell-through levels by the Company’s wholesale customers to contractedcustomers, as well as estimated wholesaler inventory levels. Rebates are amounts owed based upon definitive contractual agreements or legal requirements withprivate sector and public sector (Medicaid and Medicare Part D) benefit providers, after the final dispensing of the product by a pharmacy to a benefit planparticipant. The provision for rebates is based on expected patient usage, as well as inventory levels in the distribution channel to determine the contractualobligation to the benefit providers. The Company uses historical customer segment utilization mix, sales forecasts, changes to product mix and price, inventorylevels in the distribution channel, government pricing calculations and prior payment history in order to estimate the expected provision. Amounts accrued foraggregate customer discounts are evaluated on a quarterly basis through comparison of information provided by the wholesalers, health maintenance organizations,pharmacy benefit managers, federal and state agencies, and other customers to the amounts accrued. These discounts, in the aggregate, reduced U.S. sales by $2.6billion and $2.9 billion in the third quarter of 2018 and 2017 , respectively, and by $7.7 billion and $8.2 billion for the first nine months of 2018 and 2017 ,respectively.
Outside of the United States, variable consideration in the form of discounts and rebates are a combination of commercially-driven discounts in highlycompetitive product classes, discounts required to gain or maintain reimbursement, or legislatively mandated rebates. In certain European countries, legislativelymandated rebates are calculated based on an estimate of the government’s total unbudgeted spending and the Company’s specific payback obligation. Rebates mayalso be required based on specific product sales thresholds. The Company applies an estimated factor against its actual invoiced sales to represent the expectedlevel of future discount or rebate obligations associated with the sale.
The Company maintains a returns policy that allows its U.S. pharmaceutical customers to return product within a specified period prior to andsubsequent to the expiration date (generally, three to six months before and 12 months after product expiration). The estimate of the provision for returns is basedupon historical experience with actual returns. Additionally, the Company considers factors such as levels of inventory in the distribution channel, product datingand expiration period, whether products have been discontinued, entrance in the market of generic competition, changes in formularies or launch of over-the-counter products, among others. Outside of the United States, returns are only allowed on a limited basis in certain countries.
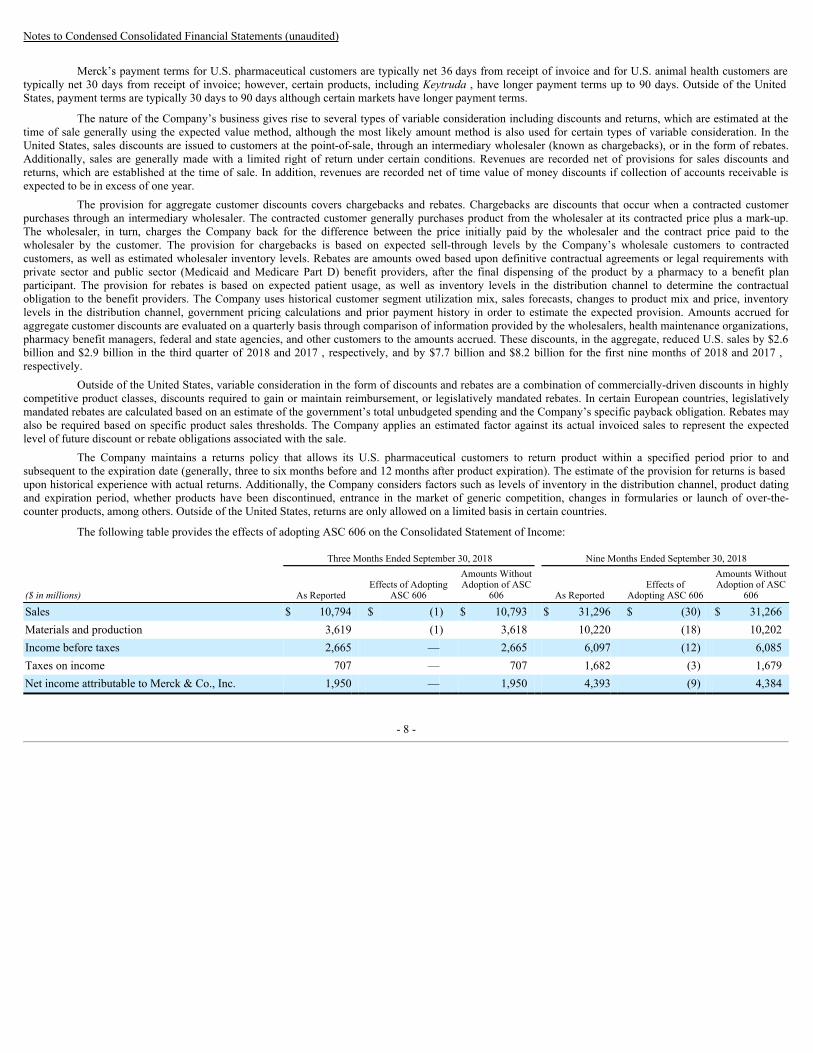
The following table provides the effects of adopting ASC 606 on the Consolidated Statement of Income:
Three Months Ended September 30, 2018 Nine Months Ended September 30, 2018
($ in millions) As Reported Effects of Adopting
ASC 606
Amounts WithoutAdoption of ASC
606 As Reported Effects of
Adopting ASC 606
Amounts WithoutAdoption of ASC
606
Sales $ 10,794 $ (1) $ 10,793 $ 31,296 $ (30) $ 31,266Materials and production 3,619 (1) 3,618 10,220 (18) 10,202Income before taxes 2,665 — 2,665 6,097 (12) 6,085Taxes on income 707 — 707 1,682 (3) 1,679Net income attributable to Merck & Co., Inc. 1,950 — 1,950 4,393 (9) 4,384
- 8 -
Notes to Condensed Consolidated Financial Statements (unaudited)
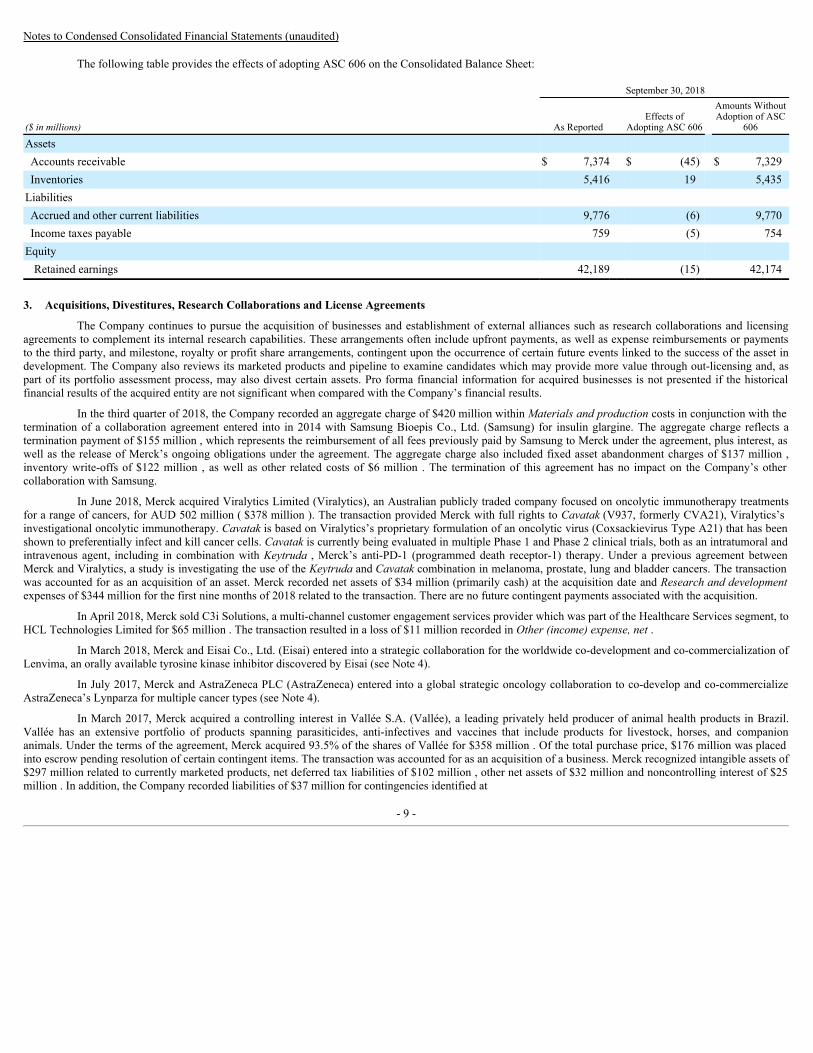
The following table provides the effects of adopting ASC 606 on the Consolidated Balance Sheet:
September 30, 2018
($ in millions) As Reported Effects of
Adopting ASC 606
Amounts WithoutAdoption of ASC
606
Assets Accounts receivable $ 7,374 $ (45) $ 7,329Inventories 5,416 19 5,435
Liabilities Accrued and other current liabilities 9,776 (6) 9,770Income taxes payable 759 (5) 754
Equity Retained earnings 42,189 (15) 42,174
3. Acquisitions, Divestitures, Research Collaborations and License Agreements
The Company continues to pursue the acquisition of businesses and establishment of external alliances such as research collaborations and licensingagreements to complement its internal research capabilities. These arrangements often include upfront payments, as well as expense reimbursements or paymentsto the third party, and milestone, royalty or profit share arrangements, contingent upon the occurrence of certain future events linked to the success of the asset indevelopment. The Company also reviews its marketed products and pipeline to examine candidates which may provide more value through out-licensing and, aspart of its portfolio assessment process, may also divest certain assets. Pro forma financial information for acquired businesses is not presented if the historicalfinancial results of the acquired entity are not significant when compared with the Company’s financial results.
In the third quarter of 2018, the Company recorded an aggregate charge of $420 million within Materials and production costs in conjunction with thetermination of a collaboration agreement entered into in 2014 with Samsung Bioepis Co., Ltd. (Samsung) for insulin glargine. The aggregate charge reflects atermination payment of $155 million , which represents the reimbursement of all fees previously paid by Samsung to Merck under the agreement, plus interest, aswell as the release of Merck’s ongoing obligations under the agreement. The aggregate charge also included fixed asset abandonment charges of $137 million ,inventory write-offs of $122 million , as well as other related costs of $6 million . The termination of this agreement has no impact on the Company’s othercollaboration with Samsung.
In June 2018, Merck acquired Viralytics Limited (Viralytics), an Australian publicly traded company focused on oncolytic immunotherapy treatmentsfor a range of cancers, for AUD 502 million ( $378 million ). The transaction provided Merck with full rights to Cavatak (V937, formerly CVA21), Viralytics’sinvestigational oncolytic immunotherapy. Cavatak is based on Viralytics’s proprietary formulation of an oncolytic virus (Coxsackievirus Type A21) that has beenshown to preferentially infect and kill cancer cells. Cavatak is currently being evaluated in multiple Phase 1 and Phase 2 clinical trials, both as an intratumoral andintravenous agent, including in combination with Keytruda , Merck’s anti-PD-1 (programmed death receptor-1) therapy. Under a previous agreement betweenMerck and Viralytics, a study is investigating the use of the Keytruda and Cavatak combination in melanoma, prostate, lung and bladder cancers. The transactionwas accounted for as an acquisition of an asset. Merck recorded net assets of $34 million (primarily cash) at the acquisition date and Research and developmentexpenses of $344 million for the first nine months of 2018 related to the transaction. There are no future contingent payments associated with the acquisition.
In April 2018, Merck sold C3i Solutions, a multi-channel customer engagement services provider which was part of the Healthcare Services segment, toHCL Technologies Limited for $65 million . The transaction resulted in a loss of $11 million recorded in Other (income) expense, net .
In March 2018, Merck and Eisai Co., Ltd. (Eisai) entered into a strategic collaboration for the worldwide co-development and co-commercialization ofLenvima, an orally available tyrosine kinase inhibitor discovered by Eisai (see Note 4).
In July 2017, Merck and AstraZeneca PLC (AstraZeneca) entered into a global strategic oncology collaboration to co-develop and co-commercializeAstraZeneca’s Lynparza for multiple cancer types (see Note 4).
In March 2017, Merck acquired a controlling interest in Vallée S.A. (Vallée), a leading privately held producer of animal health products in Brazil.Vallée has an extensive portfolio of products spanning parasiticides, anti-infectives and vaccines that include products for livestock, horses, and companionanimals. Under the terms of the agreement, Merck acquired 93.5% of the shares of Vallée for $358 million . Of the total purchase price, $176 million was placedinto escrow pending resolution of certain contingent items. The transaction was accounted for as an acquisition of a business. Merck recognized intangible assets of$297 million related to currently marketed products, net deferred tax liabilities of $102 million , other net assets of $32 million and noncontrolling interest of $25million . In addition, the Company recorded liabilities of $37 million for contingencies identified at
- 9 -
Notes to Condensed Consolidated Financial Statements (unaudited) (continued)
the acquisition date and corresponding indemnification assets of $37 million , representing the amounts to be reimbursed to Merck if and when the contingentliabilities are paid. The excess of the consideration transferred over the fair value of net assets acquired of $156 million was recorded as goodwill. The goodwillwas allocated to the Animal Health segment and is not deductible for tax purposes. The estimated fair values of identifiable intangible assets related to currentlymarketed products were determined using an income approach. The probability-adjusted future net cash flows of each product were discounted to present valueutilizing a discount rate of 15.5% . Actual cash flows are likely to be different than those assumed. The intangible assets related to currently marketed products arebeing amortized over their estimated useful lives of 15 years. In the fourth quarter of 2017, Merck acquired an additional 4.5% interest in Vallée for $18 million ,which reduced the noncontrolling interest related to Vallée.
4. Collaborative Arrangements
Merck has entered into collaborative arrangements that provide the Company with varying rights to develop, produce and market products together withits collaborative partners. Both parties in these arrangements are active participants and exposed to significant risks and rewards dependent on the commercialsuccess of the activities of the collaboration. Merck’s more significant collaborative arrangements are discussed below.
AstraZenecaIn July 2017, Merck and AstraZeneca entered into a global strategic oncology collaboration to co-develop and co-commercialize AstraZeneca’s
Lynparza for multiple cancer types. Lynparza is an oral poly (ADP-ribose) polymerase (PARP) inhibitor currently approved for certain types of ovarian and breastcancer. The companies are jointly developing and commercializing Lynparza, both as monotherapy and in combination trials with other potential medicines.Independently, Merck and AstraZeneca will develop and commercialize Lynparza in combinations with their respective PD-1 and PD-L1 medicines, Keytruda andImfinzi. The companies will also jointly develop and commercialize AstraZeneca’s selumetinib, an oral, potent, selective inhibitor of MEK, part of the mitogen-activated protein kinase (MAPK) pathway, currently being developed for multiple indications. Under the terms of the agreement, AstraZeneca and Merck willshare the development and commercialization costs for Lynparza and selumetinib monotherapy and non-PD-L1/PD-1 combination therapy opportunities.
Gross profits from Lynparza and selumetinib product sales generated through monotherapies or combination therapies are shared equally. Merck willfund all development and commercialization costs of Keytruda in combination with Lynparza or selumetinib. AstraZeneca will fund all development andcommercialization costs of Imfinzi in combination with Lynparza or selumetinib. AstraZeneca is currently the principal on Lynparza sales transactions. Merckrecords its share of Lynparza product sales, net of cost of sales and commercialization costs, as alliance revenue within the Pharmaceutical segment and its share ofdevelopment costs associated with the collaboration as part of Research and development expenses. Reimbursements received from AstraZeneca for research anddevelopment expenses are recognized as reductions to Research and development costs.
As part of the agreement, Merck made an upfront payment to AstraZeneca of $1.6 billion and is making payments totaling $750 million over a multi-year period for certain license options ( $250 million of which was paid in 2017). The Company recorded an aggregate charge of $2.35 billion in Research anddevelopment expenses in 2017 related to the upfront payment and future license options payments. In addition, the agreement provides for additional contingentpayments from Merck to AstraZeneca related to the successful achievement of regulatory and sales-based milestones.
In the second quarter of 2018, Merck determined it was probable that annual sales of Lynparza in the future would trigger a $200 million sales-basedmilestone payment from Merck to AstraZeneca. Accordingly, in the second quarter of 2018, Merck recorded a $200 million noncurrent liability and acorresponding intangible asset and also recognized $17 million of cumulative amortization expense within Materials and production costs. Merck previouslyaccrued a $150 million sales-based milestone in the first quarter of 2018 (along with $9 million of cumulative amortization expense) and a $100 million sales-based milestone in 2017 (which was paid in 2018). The remaining $3.65 billion of potential future sales-based milestone payments have not yet been accrued asthey are not deemed by the Company to be probable at this time.
In January 2018, Lynparza received approval in the United States for the treatment of certain patients with metastatic breast cancer, triggering a $70million capitalized milestone payment from Merck to AstraZeneca. Potential future regulatory milestone payments of $1.93 billion remain under the agreement.
The asset balance related to Lynparza (which includes capitalized sales-based and regulatory milestone payments) was $468 million at September 30,2018 and is included in Other Assets on the Consolidated Balance Sheet. The amount is being amortized over its estimated useful life through 2028 as supported byprojected future cash flows, subject to impairment testing.
- 10 -
Notes to Condensed Consolidated Financial Statements (unaudited) (continued)
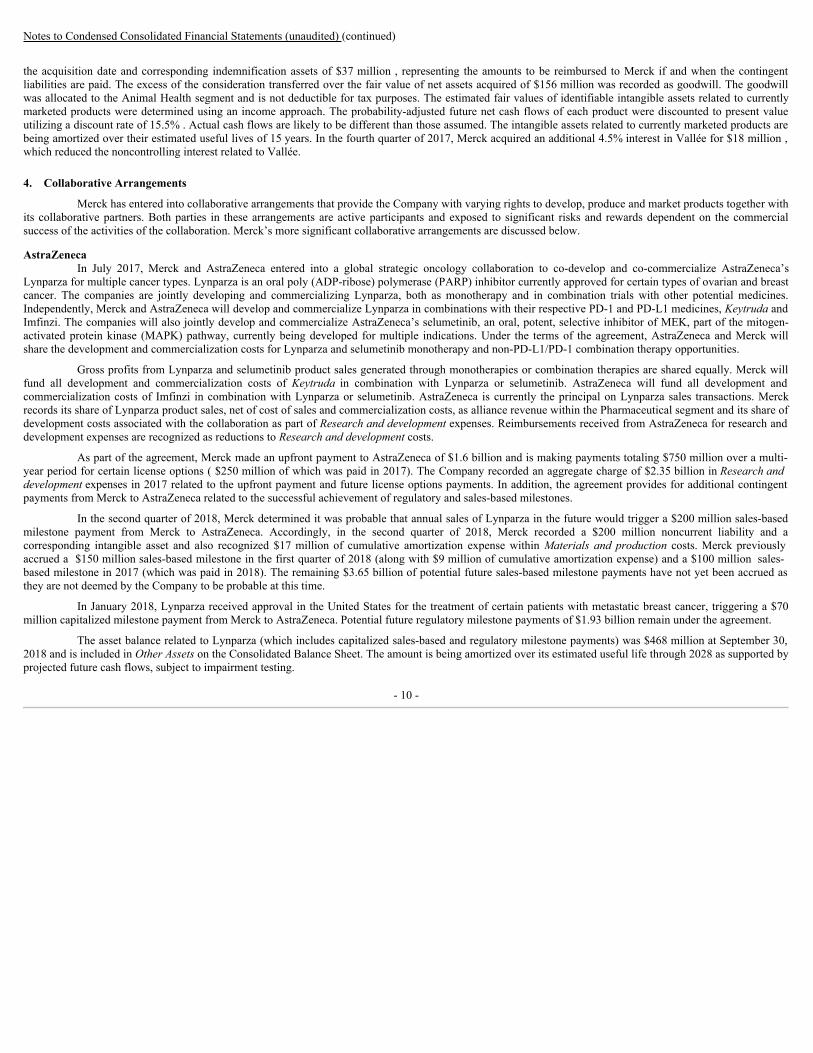
Summarized information related to this collaboration is as follows:
Three Months Ended
September 30, Nine Months Ended
September 30,
($ in millions) 2018 2017 2018 2017
Alliance revenues $ 49 $ 5 $ 125 $ 5 Materials and production (1) 12 — 48 —Marketing and administrative 12 — 28 —Research and development (2) 47 2,377 118 2,377
($ in millions) September 30,
2018 December 31,
2017
Receivables from AstraZeneca $ 46 $ 12Payables to AstraZeneca (3) 892 643
(1) Represents amortization of capitalized milestone payments.(2) Amounts for the third quarter and first nine months of 2017 include $2.35 billion related to the upfront payment and future license option payments.(3) Includes accrued milestone and license option payments.
EisaiIn March 2018, Merck and Eisai announced a strategic collaboration for the worldwide co-development and co-commercialization of Lenvima, an
orally available tyrosine kinase inhibitor discovered by Eisai. Under the agreement, Merck and Eisai will develop and commercialize Lenvima jointly, both asmonotherapy and in combination with Merck’s anti-PD-1 therapy, Keytruda . Eisai records Lenvima product sales globally (Eisai is the principal on Lenvima salestransactions), and Merck and Eisai share gross profits equally. Merck records its share of Lenvima product sales, net of cost of sales and commercialization costs,as alliance revenue. Expenses incurred during co-development, including for studies evaluating Lenvima as monotherapy, are shared equally by the two companiesand reflected in Research and development expenses. Under the agreement, Merck made upfront payments to Eisai of $750 million and will make payments of upto $650 million for certain option rights through 2021 ( $325 million in January 2019 or earlier in certain circumstances, $200 million in January 2020 and $125million in January 2021). The Company recorded an aggregate charge of $1.4 billion in Research and development expenses in the first nine months of 2018related to the upfront payments and future option payments. In addition, the agreement provides for Eisai to receive up to $385 million associated with theachievement of certain clinical and regulatory milestones and up to $3.97 billion for the achievement of milestones associated with sales of Lenvima.
In the third quarter of 2018, Merck determined it was probable that annual sales of Lenvima in the future would trigger a $50 million sales-basedmilestone payment from Merck to Eisai. Accordingly, in the third quarter of 2018, Merck recorded a $50 million noncurrent liability and a correspondingintangible asset. The remaining $3.92 billion of potential future sales-based milestone payments have not yet been accrued as they are not deemed by the Companyto be probable at this time.
Lenvima was approved for the treatment of patients with unresectable hepatocellular carcinoma in Japan in March 2018, in the United States andEuropean Union in August 2018, and in China in September 2018, triggering capitalized milestone payments of $25 million , $125 million , $50 million , and $25million , respectively, to Eisai. Potential future regulatory milestone payments of $160 million remain under the agreement.
The asset balance related to Lenvima (which includes capitalized sales-based and regulatory milestones payments) was $266 million at September 30,2018 and is included in Other Assets on the Consolidated Balance Sheet. The amount is being amortized over its estimated useful life through 2026 as supported byprojected future cash flows, subject to impairment testing.
- 11 -
Notes to Condensed Consolidated Financial Statements (unaudited) (continued)
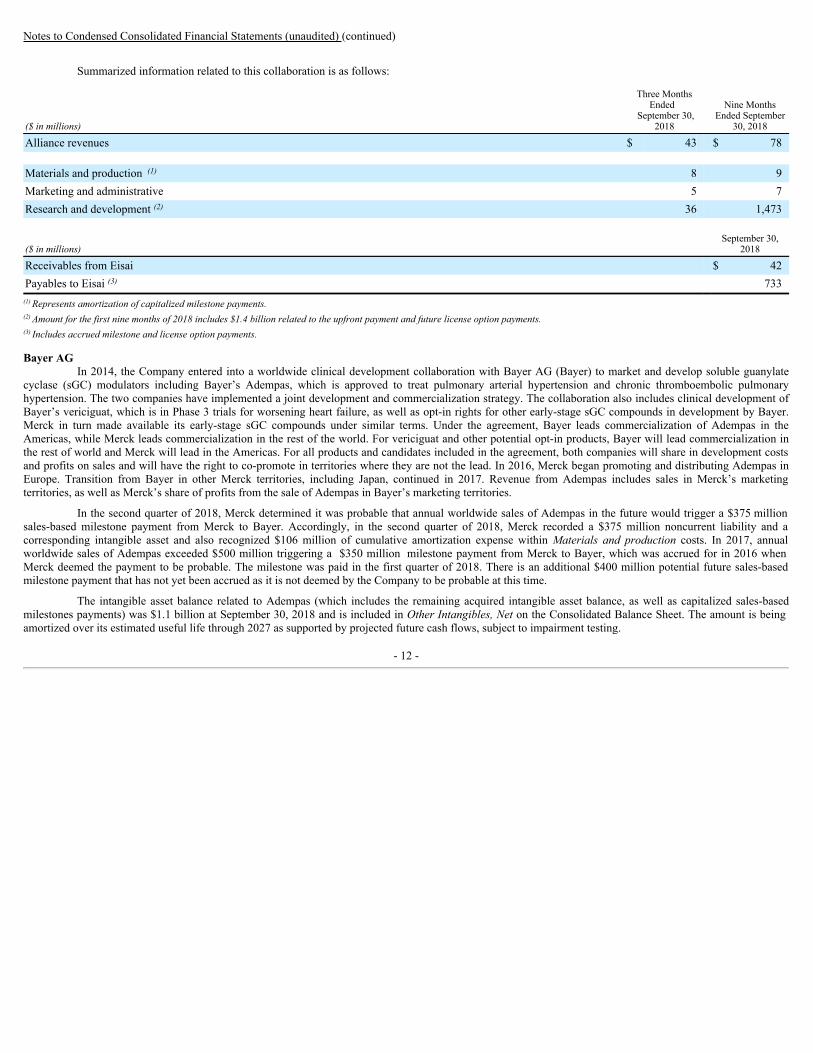
Summarized information related to this collaboration is as follows:
($ in millions)
Three MonthsEnded
September 30,2018
Nine MonthsEnded September
30, 2018
Alliance revenues $ 43 $ 78 Materials and production (1) 8 9Marketing and administrative 5 7Research and development (2) 36 1,473
($ in millions) September 30,
2018
Receivables from Eisai $ 42Payables to Eisai (3) 733
(1) Represents amortization of capitalized milestone payments.(2) Amount for the first nine months of 2018 includes $1.4 billion related to the upfront payment and future license option payments.(3) Includes accrued milestone and license option payments.
Bayer AGIn 2014, the Company entered into a worldwide clinical development collaboration with Bayer AG (Bayer) to market and develop soluble guanylate
cyclase (sGC) modulators including Bayer’s Adempas, which is approved to treat pulmonary arterial hypertension and chronic thromboembolic pulmonaryhypertension. The two companies have implemented a joint development and commercialization strategy. The collaboration also includes clinical development ofBayer’s vericiguat, which is in Phase 3 trials for worsening heart failure, as well as opt-in rights for other early-stage sGC compounds in development by Bayer.Merck in turn made available its early-stage sGC compounds under similar terms. Under the agreement, Bayer leads commercialization of Adempas in theAmericas, while Merck leads commercialization in the rest of the world. For vericiguat and other potential opt-in products, Bayer will lead commercialization inthe rest of world and Merck will lead in the Americas. For all products and candidates included in the agreement, both companies will share in development costsand profits on sales and will have the right to co-promote in territories where they are not the lead. In 2016, Merck began promoting and distributing Adempas inEurope. Transition from Bayer in other Merck territories, including Japan, continued in 2017. Revenue from Adempas includes sales in Merck’s marketingterritories, as well as Merck’s share of profits from the sale of Adempas in Bayer’s marketing territories.
In the second quarter of 2018, Merck determined it was probable that annual worldwide sales of Adempas in the future would trigger a $375 millionsales-based milestone payment from Merck to Bayer. Accordingly, in the second quarter of 2018, Merck recorded a $375 million noncurrent liability and acorresponding intangible asset and also recognized $106 million of cumulative amortization expense within Materials and production costs. In 2017, annualworldwide sales of Adempas exceeded $500 million triggering a $350 million milestone payment from Merck to Bayer, which was accrued for in 2016 whenMerck deemed the payment to be probable. The milestone was paid in the first quarter of 2018. There is an additional $400 million potential future sales-basedmilestone payment that has not yet been accrued as it is not deemed by the Company to be probable at this time.
The intangible asset balance related to Adempas (which includes the remaining acquired intangible asset balance, as well as capitalized sales-basedmilestones payments) was $1.1 billion at September 30, 2018 and is included in Other Intangibles, Net on the Consolidated Balance Sheet. The amount is beingamortized over its estimated useful life through 2027 as supported by projected future cash flows, subject to impairment testing.
- 12 -

Notes to Condensed Consolidated Financial Statements (unaudited) (continued)
Summarized information related to this collaboration is as follows:
Three Months Ended
September 30, Nine Months Ended
September 30,
($ in millions) 2018 2017 2018 2017
Net product sales recorded by Merck $ 47 $ 38 $ 138 $ 105Merck’s profit share from sales in Bayer’s marketing territories 47 32 100 116Total sales 94 70 238 221 Materials and production (1) 29 25 188 73Marketing and administrative 11 6 26 18Research and development 34 27 90 78
($ in millions) September 30,
2018 December 31,
2017
Receivables from Bayer $ 36 $ 33Payables to Bayer (2) 375 352
(1) Includes amortization of intangible assets.(2) Includes accrued milestone payments.
5. Restructuring
In 2010 and 2013, the Company commenced actions under global restructuring programs designed to streamline its cost structure. The actions underthese programs include the elimination of positions in sales, administrative and headquarters organizations, as well as the sale or closure of certain manufacturingand research and development sites and the consolidation of office facilities. The Company also continues to reduce its global real estate footprint and improve theefficiency of its manufacturing and supply network.
The Company recorded total pretax costs of $169 million and $180 million in the third quarter of 2018 and 2017 , respectively, and $508 million and$605 million for the first nine months of 2018 and 2017, respectively, related to restructuring program activities. Since inception of the programs throughSeptember 30, 2018 , Merck has recorded total pretax accumulated costs of approximately $14.0 billion and eliminated approximately 45,220 positions comprisedof employee separations, as well as the elimination of contractors and vacant positions. The Company estimates that approximately two-thirds of the cumulativepretax costs are cash outlays, primarily related to employee separation expense. Approximately one-third of the cumulative pretax costs are non-cash, relatingprimarily to the accelerated depreciation of facilities to be closed or divested. While the Company has substantially completed the actions under these programs,approximately $50 million of additional pretax costs are expected to be incurred in the fourth quarter of 2018 relating to anticipated employee separations andremaining asset-related costs.
For segment reporting, restructuring charges are unallocated expenses.
The following tables summarize the charges related to restructuring program activities by type of cost:
Three Months Ended September 30, 2018 Nine Months Ended September 30, 2018
($ in millions)Separation
Costs AcceleratedDepreciation Other Total
SeparationCosts
AcceleratedDepreciation Other Total
Materials and production $ — $ 1 $ 1 $ 2 $ — $ 1 $ 10 $ 11Marketing and administrative — — — — — 1 1 2Research and development — (9) 5 (4) — (12) 13 1Restructuring costs 137 — 34 171 392 — 102 494
$ 137 $ (8) $ 40 $ 169 $ 392 $ (10) $ 126 $ 508
Three Months Ended September 30, 2017 Nine Months Ended September 30, 2017
($ in millions)Separation
Costs AcceleratedDepreciation Other Total
SeparationCosts
AcceleratedDepreciation Other Total
Materials and production $ — $ 5 $ 20 $ 25 $ — $ 52 $ 69 $ 121Marketing and administrative — — — — — 2 1 3Research and development — 1 1 2 — 7 4 11Restructuring costs 100 — 53 153 302 — 168 470
$ 100 $ 6 $ 74 $ 180 $ 302 $ 61 $ 242 $ 605
- 13 -

Notes to Condensed Consolidated Financial Statements (unaudited) (continued)
Separation costs are associated with actual headcount reductions, as well as those headcount reductions which were probable and could be reasonablyestimated. In the third quarter of 2018 and 2017 , approximately 525 positions and 205 positions, respectively, and for the first nine months of 2018 and 2017,1,870 positions and 1,225 positions, respectively, were eliminated under restructuring program activities.
Accelerated depreciation costs primarily relate to manufacturing, research and administrative facilities and equipment to be sold or closed as part of theprograms. Accelerated depreciation costs represent the difference between the depreciation expense to be recognized over the revised useful life of the asset, basedupon the anticipated date the site will be closed or divested or the equipment disposed of, and depreciation expense as determined utilizing the useful life prior tothe restructuring actions. All of the sites have and will continue to operate up through the respective closure dates and, since future undiscounted cash flows weresufficient to recover the respective book values, Merck is recording accelerated depreciation over the revised useful life of the site assets. Anticipated site closuredates, particularly related to manufacturing locations, have been and may continue to be adjusted to reflect changes resulting from regulatory or other factors.
Other activity in 2018 and 2017 includes asset abandonment, shut-down and other related costs, as well as pretax gains and losses resulting from salesof facilities and related assets. Additionally, other activity includes certain employee-related costs associated with pension and other postretirement benefit plans(see Note 12) and share-based compensation.
The following table summarizes the charges and spending relating to restructuring program activities for the nine months ended September 30, 2018 :
($ in millions)Separation
Costs AcceleratedDepreciation Other Total
Restructuring reserves January 1, 2018 $ 619 $ — $ 128 $ 747Expense 392 (10) 126 508(Payments) receipts, net (535) — (170) (705)Non-cash activity — 10 13 23
Restructuring reserves September 30, 2018 (1) $ 476 $ — $ 97 $ 573(1) The remaining cash outlays are expected to be substantially completed by the end of 2020.
6. Financial InstrumentsDerivative Instruments and Hedging Activities
The Company manages the impact of foreign exchange rate movements and interest rate movements on its earnings, cash flows and fair values of assetsand liabilities through operational means and through the use of various financial instruments, including derivative instruments.
A significant portion of the Company’s revenues and earnings in foreign affiliates is exposed to changes in foreign exchange rates. The objectives andaccounting related to the Company’s foreign currency risk management program, as well as its interest rate risk management activities are discussed below.
Foreign Currency Risk ManagementThe Company has established revenue hedging, balance sheet risk management and net investment hedging programs to protect against volatility of
future foreign currency cash flows and changes in fair value caused by volatility in foreign exchange rates.
The objective of the revenue hedging program is to reduce the variability caused by changes in foreign exchange rates that would affect the U.S. dollarvalue of future cash flows derived from foreign currency denominated sales, primarily the euro and Japanese yen. To achieve this objective, the Company willhedge a portion of its forecasted foreign currency denominated third-party and intercompany distributor entity sales (forecasted sales) that are expected to occurover its planning cycle, typically no more than two years into the future. The Company will layer in hedges over time, increasing the portion of forecasted saleshedged as it gets closer to the expected date of the forecasted sales. The portion of forecasted sales hedged is based on assessments of cost-benefit profiles thatconsider natural offsetting exposures, revenue and exchange rate volatilities and correlations, and the cost of hedging instruments. The Company manages itsanticipated transaction exposure principally with purchased local currency put options, forward contracts and purchased collar options.
The fair values of these derivative contracts are recorded as either assets (gain positions) or liabilities (loss positions) in the Condensed ConsolidatedBalance Sheet. Changes in the fair value of derivative contracts are recorded each period in either current earnings or Other comprehensive income ( OCI ),depending on whether the derivative is designated as part of a hedge transaction and, if so, the type of hedge transaction. For derivatives that are designated as cashflow hedges, the unrealized gains or losses on these contracts is recorded in Accumulated other comprehensive income ( AOCI ) and reclassified into Sales whenthe hedged anticipated revenue is recognized. For those derivatives which are not designated as cash flow hedges, but serve as economic
- 14 -
Notes to Condensed Consolidated Financial Statements (unaudited) (continued)
hedges of forecasted sales, unrealized gains or losses are recorded in Sales each period. The cash flows from both designated and non-designated contracts arereported as operating activities in the Condensed Consolidated Statement of Cash Flows. The Company does not enter into derivatives for trading or speculativepurposes.
The Company manages operating activities and net asset positions at each local subsidiary in order to mitigate the effects of exchange on monetaryassets and liabilities. The Company also uses a balance sheet risk management program to mitigate the exposure of net monetary assets that are denominated in acurrency other than a subsidiary’s functional currency from the effects of volatility in foreign exchange. In these instances, Merck principally utilizes forwardexchange contracts to offset the effects of exchange on exposures denominated in developed country currencies, primarily the euro and Japanese yen. Forexposures in developing country currencies, the Company will enter into forward contracts to partially offset the effects of exchange on exposures when it isdeemed economical to do so based on a cost-benefit analysis that considers the magnitude of the exposure, the volatility of the exchange rate and the cost of thehedging instrument. The cash flows from these contracts are reported as operating activities in the Condensed Consolidated Statement of Cash Flows.
Monetary assets and liabilities denominated in a currency other than the functional currency of a given subsidiary are remeasured at spot rates in effecton the balance sheet date with the effects of changes in spot rates reported in Other (income) expense, net . The forward contracts are not designated as hedges andare marked to market through Other (income) expense, net . Accordingly, fair value changes in the forward contracts help mitigate the changes in the value of theremeasured assets and liabilities attributable to changes in foreign currency exchange rates, except to the extent of the spot-forward differences. These differencesare not significant due to the short-term nature of the contracts, which typically have average maturities at inception of less than one year .
The Company also uses forward exchange contracts to hedge its net investment in foreign operations against movements in exchange rates. The forwardcontracts are designated as hedges of the net investment in a foreign operation. The Company hedges a portion of the net investment in certain of its foreignoperations. The unrealized gains or losses on these contracts are recorded in foreign currency translation adjustment within OCI , and remain in AOCI until eitherthe sale or complete or substantially complete liquidation of the subsidiary. The Company excludes certain portions of the change in fair value of its derivativeinstruments from the assessment of hedge effectiveness (excluded component). Changes in fair value of the excluded components are recognized in OCI . Inaccordance with the new guidance adopted on January 1, 2018 (see Note 1), the Company has elected to recognize in earnings the initial value of the excludedcomponent on a straight-line basis over the life of the derivative instrument, rather than using the mark-to-market approach. The cash flows from these contractsare reported as investing activities in the Condensed Consolidated Statement of Cash Flows.
Foreign exchange risk is also managed through the use of foreign currency debt. The Company’s senior unsecured euro-denominated notes have beendesignated as, and are effective as, economic hedges of the net investment in a foreign operation. Accordingly, foreign currency transaction gains or losses due tospot rate fluctuations on the euro-denominated debt instruments are included in foreign currency translation adjustment within OCI .
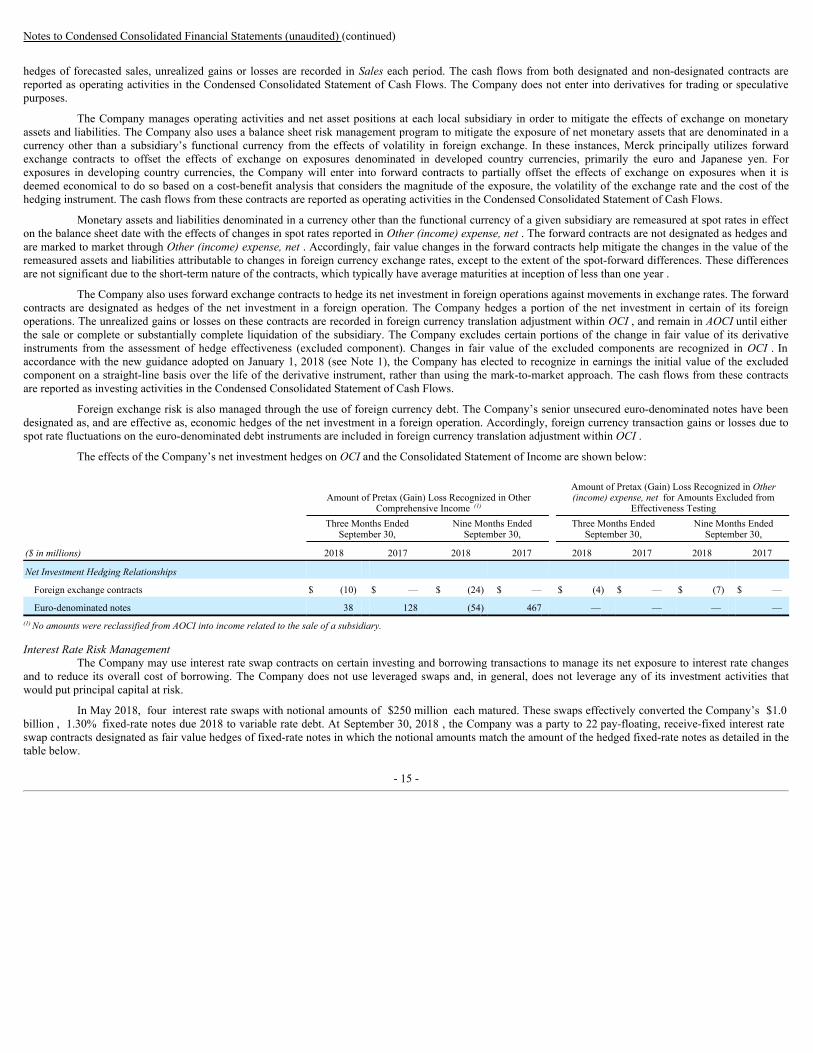
The effects of the Company’s net investment hedges on OCI and the Consolidated Statement of Income are shown below:
Amount of Pretax (Gain) Loss Recognized in Other
Comprehensive Income (1)
Amount of Pretax (Gain) Loss Recognized in Other(income) expense, net for Amounts Excluded from
Effectiveness Testing
Three Months Ended
September 30, Nine Months Ended
September 30, Three Months Ended
September 30, Nine Months Ended
September 30,
($ in millions) 2018 2017 2018 2017 2018 2017 2018 2017
Net Investment Hedging Relationships
Foreign exchange contracts $ (10) $ — $ (24) $ — $ (4) $ — $ (7) $ —
Euro-denominated notes 38 128 (54) 467 — — — —(1) No amounts were reclassified from AOCI into income related to the sale of a subsidiary.
Interest Rate Risk ManagementThe Company may use interest rate swap contracts on certain investing and borrowing transactions to manage its net exposure to interest rate changes
and to reduce its overall cost of borrowing. The Company does not use leveraged swaps and, in general, does not leverage any of its investment activities thatwould put principal capital at risk.
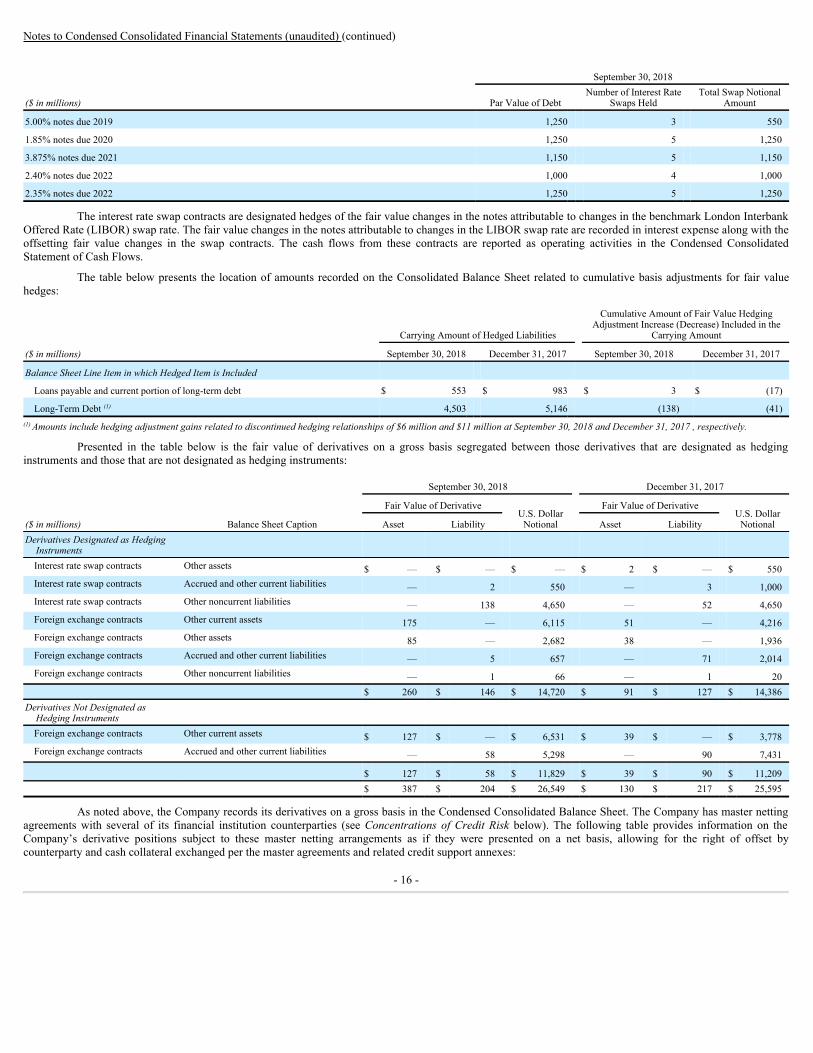
In May 2018, four interest rate swaps with notional amounts of $250 million each matured. These swaps effectively converted the Company’s $1.0billion , 1.30% fixed-rate notes due 2018 to variable rate debt. At September 30, 2018 , the Company was a party to 22 pay-floating, receive-fixed interest rateswap contracts designated as fair value hedges of fixed-rate notes in which the notional amounts match the amount of the hedged fixed-rate notes as detailed in thetable below.
- 15 -
Notes to Condensed Consolidated Financial Statements (unaudited) (continued)
September 30, 2018
($ in millions) Par Value of Debt Number of Interest Rate
Swaps Held Total Swap Notional
Amount
5.00% notes due 2019 1,250 3 550
1.85% notes due 2020 1,250 5 1,250
3.875% notes due 2021 1,150 5 1,150
2.40% notes due 2022 1,000 4 1,000
2.35% notes due 2022 1,250 5 1,250
The interest rate swap contracts are designated hedges of the fair value changes in the notes attributable to changes in the benchmark London InterbankOffered Rate (LIBOR) swap rate. The fair value changes in the notes attributable to changes in the LIBOR swap rate are recorded in interest expense along with theoffsetting fair value changes in the swap contracts. The cash flows from these contracts are reported as operating activities in the Condensed ConsolidatedStatement of Cash Flows.
The table below presents the location of amounts recorded on the Consolidated Balance Sheet related to cumulative basis adjustments for fair valuehedges:
Carrying Amount of Hedged Liabilities
Cumulative Amount of Fair Value HedgingAdjustment Increase (Decrease) Included in the
Carrying Amount
($ in millions) September 30, 2018 December 31, 2017 September 30, 2018 December 31, 2017
Balance Sheet Line Item in which Hedged Item is Included
Loans payable and current portion of long-term debt $ 553 $ 983 $ 3 $ (17)
Long-Term Debt (1) 4,503 5,146 (138) (41)(1) Amounts include hedging adjustment gains related to discontinued hedging relationships of $6 million and $11 million at September 30, 2018 and December 31, 2017 , respectively.
Presented in the table below is the fair value of derivatives on a gross basis segregated between those derivatives that are designated as hedginginstruments and those that are not designated as hedging instruments:
September 30, 2018 December 31, 2017
Fair Value of Derivative U.S. Dollar
Notional Fair Value of Derivative
U.S. DollarNotional($ in millions) Balance Sheet Caption Asset Liability Asset Liability
Derivatives Designated as HedgingInstruments Interest rate swap contracts Other assets $ — $ — $ — $ 2 $ — $ 550Interest rate swap contracts Accrued and other current liabilities — 2 550 — 3 1,000Interest rate swap contracts Other noncurrent liabilities — 138 4,650 — 52 4,650Foreign exchange contracts Other current assets 175 — 6,115 51 — 4,216Foreign exchange contracts Other assets 85 — 2,682 38 — 1,936Foreign exchange contracts Accrued and other current liabilities — 5 657 — 71 2,014Foreign exchange contracts Other noncurrent liabilities — 1 66 — 1 20
$ 260 $ 146 $ 14,720 $ 91 $ 127 $ 14,386Derivatives Not Designated as
Hedging Instruments
Foreign exchange contracts Other current assets $ 127 $ — $ 6,531 $ 39 $ — $ 3,778Foreign exchange contracts Accrued and other current liabilities — 58 5,298 — 90 7,431
$ 127 $ 58 $ 11,829 $ 39 $ 90 $ 11,209 $ 387 $ 204 $ 26,549 $ 130 $ 217 $ 25,595
As noted above, the Company records its derivatives on a gross basis in the Condensed Consolidated Balance Sheet. The Company has master nettingagreements with several of its financial institution counterparties (see Concentrations of Credit Risk below). The following table provides information on theCompany’s derivative positions subject to these master netting arrangements as if they were presented on a net basis, allowing for the right of offset bycounterparty and cash collateral exchanged per the master agreements and related credit support annexes:
- 16 -

Notes to Condensed Consolidated Financial Statements (unaudited) (continued)
September 30, 2018 December 31, 2017
($ in millions) Asset Liability Asset LiabilityGross amounts recognized in the consolidated balance sheet $ 387 $ 204 $ 130 $ 217Gross amount subject to offset in master netting arrangements not offset in the consolidated
balance sheet (135) (135) (94) (94)Cash collateral received (54) — (3) —Net amounts $ 198 $ 69 $ 33 $ 123
The table below provides information regarding the location and amount of pretax (gains) losses of derivatives designated in fair value or cash flowhedging relationships:
Sales Other (income) expense,
net (1) Other comprehensive
income (loss) Sales Other (income) expense,
net (1) Other comprehensive
income (loss)
Three Months Ended
September 30, Three Months Ended
September 30, Three Months Ended
September 30, Nine Months Ended
September 30, Nine Months Ended
September 30, Nine Months Ended
September 30,
($ in millions) 2018 2017 2018 2017 2018 2017 2018 2017 2018 2017 2018 2017Financial Statement Line Items inwhich Effects of Fair Value orCash Flow Hedges are Recorded $ 10,794 $ 10,325 $ (172) (207) $ (29) $ 149 31,296 $ 29,689 $ (512) $ (351) $ 33 $ 281(Gain) loss on fair value hedgingrelationships
Interest rate swap contracts
Hedged items — — (9) (9) — — — — (86) (5) — —Derivatives designated as
hedging instruments — — 15 2 — — — — 100 (25) — —Impact of cash flow hedgingrelationships
Foreign exchange contracts Amount of gain (loss)
recognized in OCI onderivatives — — — — 29 (88) — — — — 113 (520)
(Decrease) increase in Sales as a result of AOCI reclassifications (6) 13 — — 6 (13) (172) 157 — — 172 (157)
(1) Interest expense is a component of Other (income) expense, net.
The table below provides information regarding the income statement effects of derivatives not designated as hedging instruments:
Amount of Derivative Pretax (Gain) Loss Recognized in Income
Three Months Ended September 30, Nine Months Ended September 30,
($ in millions) Income Statement Caption 2018 2017 2018 2017
Derivatives Not Designated as Hedging Instruments
Foreign exchange contracts (1) Other (income) expense, net $ (57) $ 119 $ (224) $ 70
Foreign exchange contracts (2) Sales — — (5) —(1) These derivative contracts mitigate changes in the value of remeasured foreign currency denominated monetary assets and liabilities attributable to changes in foreign currency exchange
rates.(2) These derivative contracts serve as economic hedges of forecasted transactions.
At September 30, 2018 , the Company estimates $75 million of pretax net unrealized gains on derivatives maturing within the next 12 months thathedge foreign currency denominated sales over that same period will be reclassified from AOCI to Sales . The amount ultimately reclassified to Sales may differ asforeign exchange rates change. Realized gains and losses are ultimately determined by actual exchange rates at maturity.
- 17 -
Notes to Condensed Consolidated Financial Statements (unaudited) (continued)
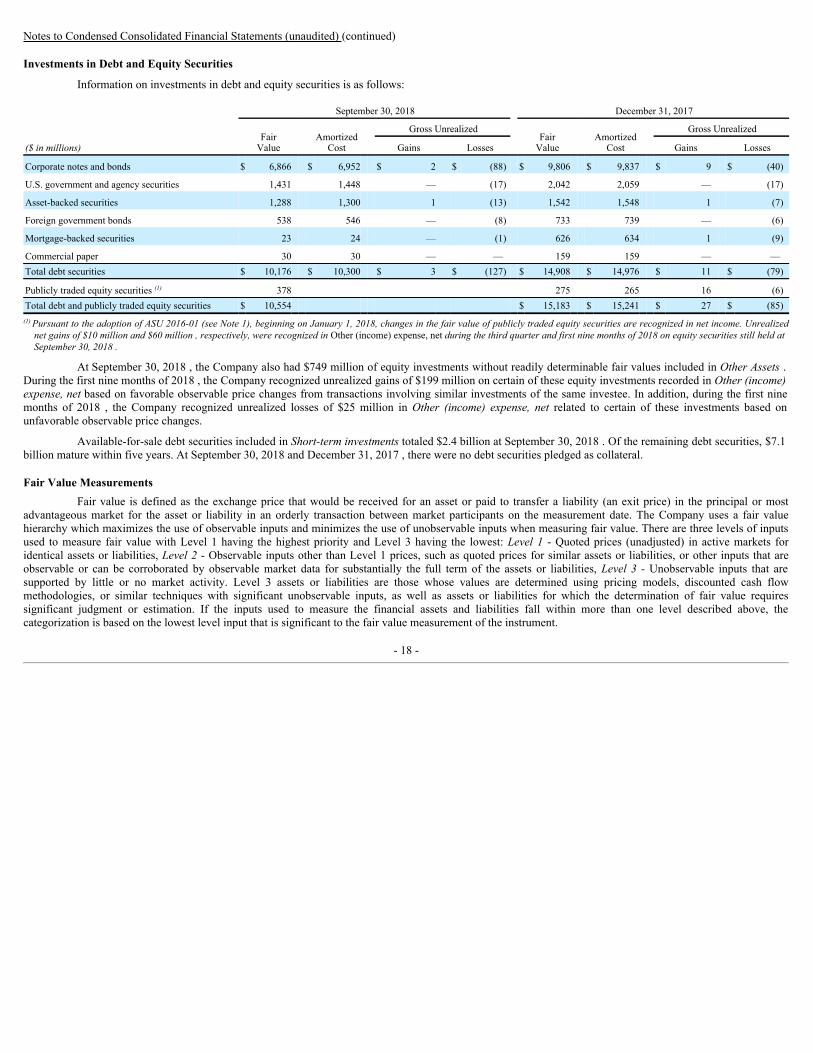
Investments in Debt and Equity Securities
Information on investments in debt and equity securities is as follows:
September 30, 2018 December 31, 2017
Fair
Value Amortized
Cost Gross Unrealized
FairValue
AmortizedCost
Gross Unrealized
($ in millions) Gains Losses Gains Losses
Corporate notes and bonds $ 6,866 $ 6,952 $ 2 $ (88) $ 9,806 $ 9,837 $ 9 $ (40)
U.S. government and agency securities 1,431 1,448 — (17) 2,042 2,059 — (17)
Asset-backed securities 1,288 1,300 1 (13) 1,542 1,548 1 (7)
Foreign government bonds 538 546 — (8) 733 739 — (6)
Mortgage-backed securities 23 24 — (1) 626 634 1 (9)
Commercial paper 30 30 — — 159 159 — —Total debt securities $ 10,176 $ 10,300 $ 3 $ (127) $ 14,908 $ 14,976 $ 11 $ (79)
Publicly traded equity securities (1) 378 275 265 16 (6)Total debt and publicly traded equity securities $ 10,554 $ 15,183 $ 15,241 $ 27 $ (85)
(1) Pursuant to the adoption of ASU 2016-01 (see Note 1), beginning on January 1, 2018, changes in the fair value of publicly traded equity securities are recognized in net income. Unrealizednet gains of $10 million and $60 million , respectively, were recognized in Other (income) expense, net during the third quarter and first nine months of 2018 on equity securities still held atSeptember 30, 2018 .
At September 30, 2018 , the Company also had $749 million of equity investments without readily determinable fair values included in Other Assets .During the first nine months of 2018 , the Company recognized unrealized gains of $199 million on certain of these equity investments recorded in Other (income)expense, net based on favorable observable price changes from transactions involving similar investments of the same investee. In addition, during the first ninemonths of 2018 , the Company recognized unrealized losses of $25 million in Other (income) expense, net related to certain of these investments based onunfavorable observable price changes.
Available-for-sale debt securities included in Short-term investments totaled $2.4 billion at September 30, 2018 . Of the remaining debt securities, $7.1billion mature within five years. At September 30, 2018 and December 31, 2017 , there were no debt securities pledged as collateral.
Fair Value MeasurementsFair value is defined as the exchange price that would be received for an asset or paid to transfer a liability (an exit price) in the principal or most
advantageous market for the asset or liability in an orderly transaction between market participants on the measurement date. The Company uses a fair valuehierarchy which maximizes the use of observable inputs and minimizes the use of unobservable inputs when measuring fair value. There are three levels of inputsused to measure fair value with Level 1 having the highest priority and Level 3 having the lowest: Level 1 - Quoted prices (unadjusted) in active markets foridentical assets or liabilities, Level 2 - Observable inputs other than Level 1 prices, such as quoted prices for similar assets or liabilities, or other inputs that areobservable or can be corroborated by observable market data for substantially the full term of the assets or liabilities, Level 3 - Unobservable inputs that aresupported by little or no market activity. Level 3 assets or liabilities are those whose values are determined using pricing models, discounted cash flowmethodologies, or similar techniques with significant unobservable inputs, as well as assets or liabilities for which the determination of fair value requiressignificant judgment or estimation. If the inputs used to measure the financial assets and liabilities fall within more than one level described above, thecategorization is based on the lowest level input that is significant to the fair value measurement of the instrument.
- 18 -
Notes to Condensed Consolidated Financial Statements (unaudited) (continued)
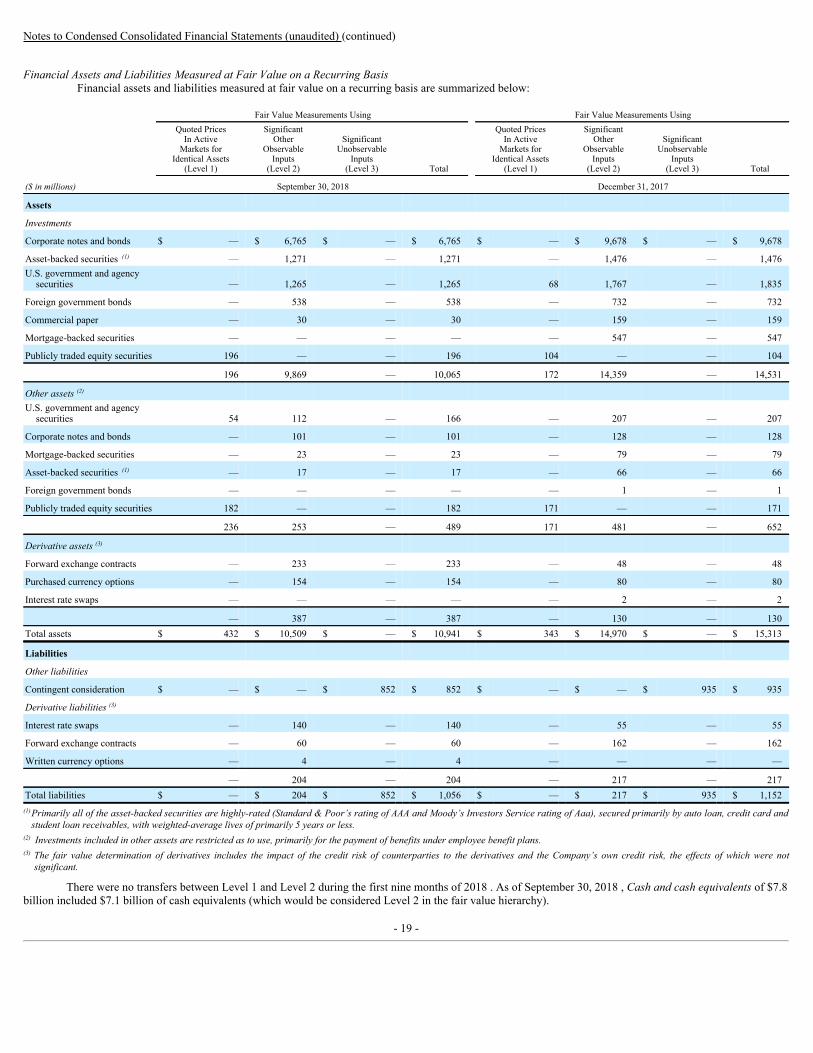
Financial Assets and Liabilities Measured at Fair Value on a Recurring BasisFinancial assets and liabilities measured at fair value on a recurring basis are summarized below:
Fair Value Measurements Using Fair Value Measurements Using
Quoted PricesIn Active
Markets forIdentical Assets
(Level 1)
SignificantOther
ObservableInputs
(Level 2)
SignificantUnobservable
Inputs(Level 3) Total
Quoted PricesIn Active
Markets forIdentical Assets
(Level 1)
SignificantOther
ObservableInputs
(Level 2)
SignificantUnobservable
Inputs(Level 3) Total
($ in millions) September 30, 2018 December 31, 2017
Assets
Investments
Corporate notes and bonds $ — $ 6,765 $ — $ 6,765 $ — $ 9,678 $ — $ 9,678
Asset-backed securities (1) — 1,271 — 1,271 — 1,476 — 1,476U.S. government and agency
securities — 1,265 — 1,265 68 1,767 — 1,835
Foreign government bonds — 538 — 538 — 732 — 732
Commercial paper — 30 — 30 — 159 — 159
Mortgage-backed securities — — — — — 547 — 547
Publicly traded equity securities 196 — — 196 104 — — 104
196 9,869 — 10,065 172 14,359 — 14,531
Other assets (2) U.S. government and agency
securities 54 112 — 166 — 207 — 207
Corporate notes and bonds — 101 — 101 — 128 — 128
Mortgage-backed securities — 23 — 23 — 79 — 79
Asset-backed securities (1) — 17 — 17 — 66 — 66
Foreign government bonds — — — — — 1 — 1
Publicly traded equity securities 182 — — 182 171 — — 171
236 253 — 489 171 481 — 652
Derivative assets (3)
Forward exchange contracts — 233 — 233 — 48 — 48
Purchased currency options — 154 — 154 — 80 — 80
Interest rate swaps — — — — — 2 — 2
— 387 — 387 — 130 — 130Total assets $ 432 $ 10,509 $ — $ 10,941 $ 343 $ 14,970 $ — $ 15,313
Liabilities
Other liabilities
Contingent consideration $ — $ — $ 852 $ 852 $ — $ — $ 935 $ 935
Derivative liabilities (3)
Interest rate swaps — 140 — 140 — 55 — 55
Forward exchange contracts — 60 — 60 — 162 — 162
Written currency options — 4 — 4 — — — —
— 204 — 204 — 217 — 217Total liabilities $ — $ 204 $ 852 $ 1,056 $ — $ 217 $ 935 $ 1,152
(1)
Primarily all of the asset-backed securities are highly-rated (Standard & Poor’s rating of AAA and Moody’s Investors Service rating of Aaa), secured primarily by auto loan, credit card andstudent loan receivables, with weighted-average lives of primarily 5 years or less.
(2) Investments included in other assets are restricted as to use, primarily for the payment of benefits under employee benefit plans.(3)
The fair value determination of derivatives includes the impact of the credit risk of counterparties to the derivatives and the Company’s own credit risk, the effects of which were notsignificant.
There were no transfers between Level 1 and Level 2 during the first nine months of 2018 . As of September 30, 2018 , Cash and cash equivalents of $7.8billion included $7.1 billion of cash equivalents (which would be considered Level 2 in the fair value hierarchy).
- 19 -
Notes to Condensed Consolidated Financial Statements (unaudited) (continued)
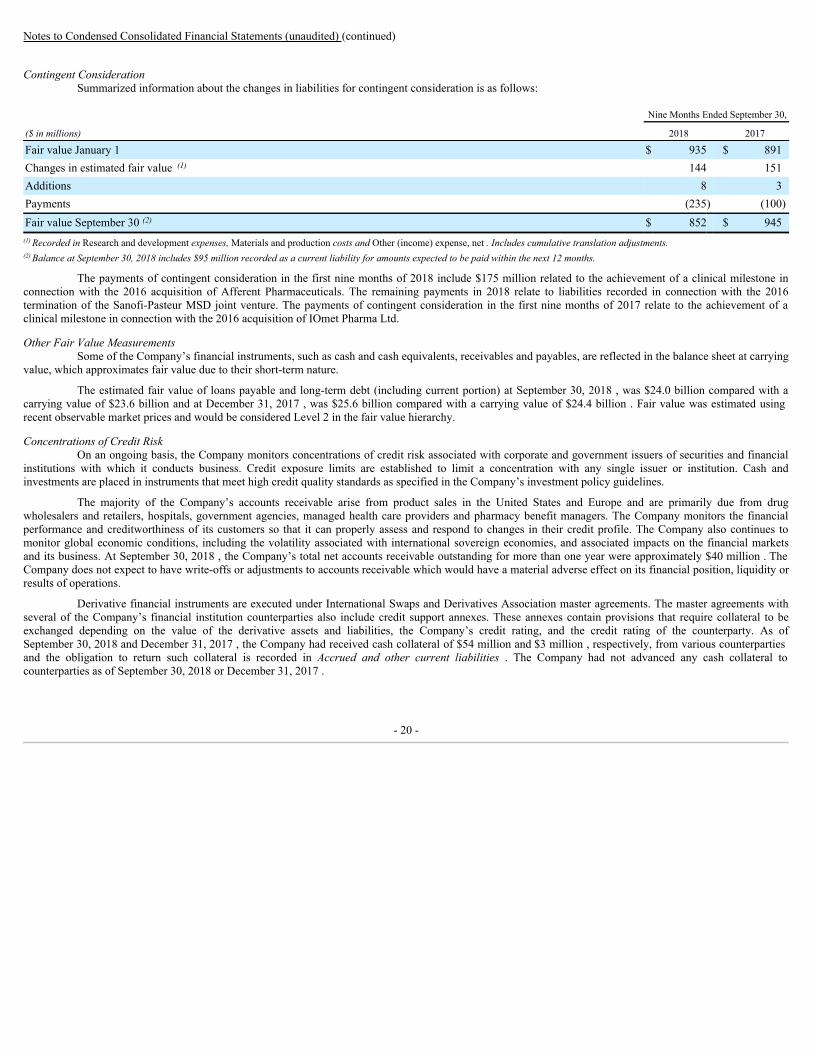
Contingent ConsiderationSummarized information about the changes in liabilities for contingent consideration is as follows:
Nine Months Ended September 30,
($ in millions) 2018 2017
Fair value January 1 $ 935 $ 891Changes in estimated fair value (1) 144 151Additions 8 3Payments (235) (100)Fair value September 30 (2) $ 852 $ 945
(1) Recorded in Research and development expenses, Materials and production costs and Other (income) expense, net . Includes cumulative translation adjustments.(2) Balance at September 30, 2018 includes $95 million recorded as a current liability for amounts expected to be paid within the next 12 months.
The payments of contingent consideration in the first nine months of 2018 include $175 million related to the achievement of a clinical milestone inconnection with the 2016 acquisition of Afferent Pharmaceuticals. The remaining payments in 2018 relate to liabilities recorded in connection with the 2016termination of the Sanofi-Pasteur MSD joint venture. The payments of contingent consideration in the first nine months of 2017 relate to the achievement of aclinical milestone in connection with the 2016 acquisition of IOmet Pharma Ltd.
Other Fair Value MeasurementsSome of the Company’s financial instruments, such as cash and cash equivalents, receivables and payables, are reflected in the balance sheet at carrying
value, which approximates fair value due to their short-term nature.
The estimated fair value of loans payable and long-term debt (including current portion) at September 30, 2018 , was $24.0 billion compared with acarrying value of $23.6 billion and at December 31, 2017 , was $25.6 billion compared with a carrying value of $24.4 billion . Fair value was estimated usingrecent observable market prices and would be considered Level 2 in the fair value hierarchy.
Concentrations of Credit RiskOn an ongoing basis, the Company monitors concentrations of credit risk associated with corporate and government issuers of securities and financial
institutions with which it conducts business. Credit exposure limits are established to limit a concentration with any single issuer or institution. Cash andinvestments are placed in instruments that meet high credit quality standards as specified in the Company’s investment policy guidelines.
The majority of the Company’s accounts receivable arise from product sales in the United States and Europe and are primarily due from drugwholesalers and retailers, hospitals, government agencies, managed health care providers and pharmacy benefit managers. The Company monitors the financialperformance and creditworthiness of its customers so that it can properly assess and respond to changes in their credit profile. The Company also continues tomonitor global economic conditions, including the volatility associated with international sovereign economies, and associated impacts on the financial marketsand its business. At September 30, 2018 , the Company’s total net accounts receivable outstanding for more than one year were approximately $40 million . TheCompany does not expect to have write-offs or adjustments to accounts receivable which would have a material adverse effect on its financial position, liquidity orresults of operations.
Derivative financial instruments are executed under International Swaps and Derivatives Association master agreements. The master agreements withseveral of the Company’s financial institution counterparties also include credit support annexes. These annexes contain provisions that require collateral to beexchanged depending on the value of the derivative assets and liabilities, the Company’s credit rating, and the credit rating of the counterparty. As ofSeptember 30, 2018 and December 31, 2017 , the Company had received cash collateral of $54 million and $3 million , respectively, from various counterpartiesand the obligation to return such collateral is recorded in Accrued and other current liabilities . The Company had not advanced any cash collateral tocounterparties as of September 30, 2018 or December 31, 2017 .
- 20 -
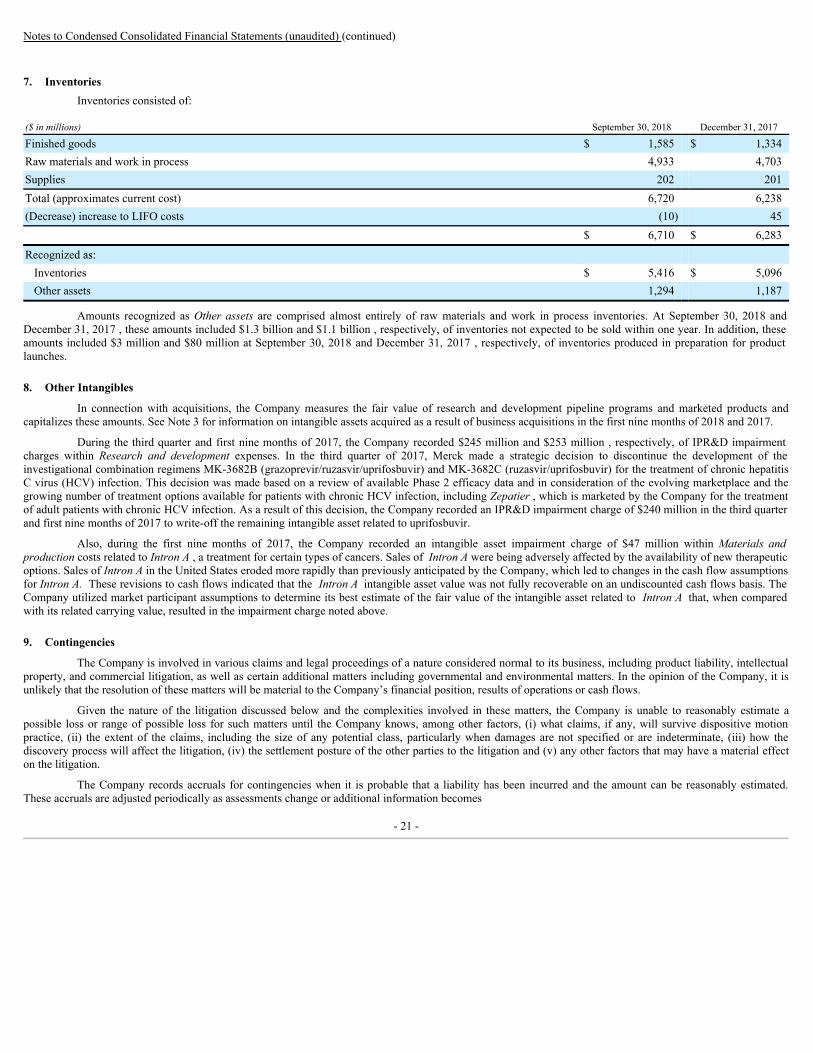
Notes to Condensed Consolidated Financial Statements (unaudited) (continued)
7. InventoriesInventories consisted of:
($ in millions) September 30, 2018 December 31, 2017
Finished goods $ 1,585 $ 1,334Raw materials and work in process 4,933 4,703Supplies 202 201Total (approximates current cost) 6,720 6,238(Decrease) increase to LIFO costs (10) 45 $ 6,710 $ 6,283
Recognized as: Inventories $ 5,416 $ 5,096Other assets 1,294 1,187
Amounts recognized as Other assets are comprised almost entirely of raw materials and work in process inventories. At September 30, 2018 andDecember 31, 2017 , these amounts included $1.3 billion and $1.1 billion , respectively, of inventories not expected to be sold within one year. In addition, theseamounts included $3 million and $80 million at September 30, 2018 and December 31, 2017 , respectively, of inventories produced in preparation for productlaunches.
8. Other Intangibles
In connection with acquisitions, the Company measures the fair value of research and development pipeline programs and marketed products andcapitalizes these amounts. See Note 3 for information on intangible assets acquired as a result of business acquisitions in the first nine months of 2018 and 2017.
During the third quarter and first nine months of 2017, the Company recorded $245 million and $253 million , respectively, of IPR&D impairmentcharges within Research and development expenses. In the third quarter of 2017, Merck made a strategic decision to discontinue the development of theinvestigational combination regimens MK-3682B (grazoprevir/ruzasvir/uprifosbuvir) and MK-3682C (ruzasvir/uprifosbuvir) for the treatment of chronic hepatitisC virus (HCV) infection. This decision was made based on a review of available Phase 2 efficacy data and in consideration of the evolving marketplace and thegrowing number of treatment options available for patients with chronic HCV infection, including Zepatier , which is marketed by the Company for the treatmentof adult patients with chronic HCV infection. As a result of this decision, the Company recorded an IPR&D impairment charge of $240 million in the third quarterand first nine months of 2017 to write-off the remaining intangible asset related to uprifosbuvir.
Also, during the first nine months of 2017, the Company recorded an intangible asset impairment charge of $47 million within Materials andproduction costs related to Intron A , a treatment for certain types of cancers. Sales of Intron A were being adversely affected by the availability of new therapeuticoptions. Sales of Intron A in the United States eroded more rapidly than previously anticipated by the Company, which led to changes in the cash flow assumptionsfor Intron A. These revisions to cash flows indicated that the Intron A intangible asset value was not fully recoverable on an undiscounted cash flows basis. TheCompany utilized market participant assumptions to determine its best estimate of the fair value of the intangible asset related to Intron A that, when comparedwith its related carrying value, resulted in the impairment charge noted above.
9. Contingencies
The Company is involved in various claims and legal proceedings of a nature considered normal to its business, including product liability, intellectualproperty, and commercial litigation, as well as certain additional matters including governmental and environmental matters. In the opinion of the Company, it isunlikely that the resolution of these matters will be material to the Company’s financial position, results of operations or cash flows.
Given the nature of the litigation discussed below and the complexities involved in these matters, the Company is unable to reasonably estimate apossible loss or range of possible loss for such matters until the Company knows, among other factors, (i) what claims, if any, will survive dispositive motionpractice, (ii) the extent of the claims, including the size of any potential class, particularly when damages are not specified or are indeterminate, (iii) how thediscovery process will affect the litigation, (iv) the settlement posture of the other parties to the litigation and (v) any other factors that may have a material effecton the litigation.
The Company records accruals for contingencies when it is probable that a liability has been incurred and the amount can be reasonably estimated.These accruals are adjusted periodically as assessments change or additional information becomes
- 21 -
Notes to Condensed Consolidated Financial Statements (unaudited) (continued)
available. For product liability claims, a portion of the overall accrual is actuarially determined and considers such factors as past experience, number of claimsreported and estimates of claims incurred but not yet reported. Individually significant contingent losses are accrued when probable and reasonably estimable.Legal defense costs expected to be incurred in connection with a loss contingency are accrued when probable and reasonably estimable.
The Company’s decision to obtain insurance coverage is dependent on market conditions, including cost and availability, existing at the time suchdecisions are made. The Company has evaluated its risks and has determined that the cost of obtaining product liability insurance outweighs the likely benefits ofthe coverage that is available and, as such, has no insurance for most product liabilities effective August 1, 2004.
Product Liability Litigation
FosamaxAs previously disclosed, Merck is a defendant in product liability lawsuits in the United States involving Fosamax ( Fosamax Litigation). As of
September 30, 2018 , approximately 3,955 cases are filed and pending against Merck in either federal or state court. In four of these actions, plaintiffs allege,among other things, that they have suffered osteonecrosis of the jaw (ONJ), generally subsequent to invasive dental procedures, such as tooth extraction or dentalimplants and/or delayed healing, in association with the use of Fosamax . In addition, plaintiffs in approximately 3,950 of these actions generally allege that theysustained femur fractures and/or other bone injuries (Femur Fractures) in association with the use of Fosamax .
Cases Alleging ONJ and/or Other Jaw Related Injuries
In August 2006, the Judicial Panel on Multidistrict Litigation (JPML) ordered that certain Fosamax product liability cases pending in federal courtsnationwide should be transferred and consolidated into one multidistrict litigation ( Fosamax ONJ MDL) for coordinated pre-trial proceedings. In 2014, Mercksettled approximately 95% of the ONJ cases pending in the Fosamax ONJ MDL and in state courts for a payment of $27.3 million . The escrow agent under theagreement has been making settlement payments to qualifying plaintiffs. The ONJ Master Settlement Agreement has no effect on the cases alleging FemurFractures discussed below. The Fosamax ONJ MDL was closed in June 2018.
Cases Alleging Femur Fractures
In March 2011, Merck submitted a Motion to Transfer to the JPML seeking to have all federal cases alleging Femur Fractures consolidated into onemultidistrict litigation for coordinated pre-trial proceedings. All federal cases involving allegations of Femur Fracture have been or will be transferred to amultidistrict litigation in the District of New Jersey (Femur Fracture MDL). In the only bellwether case tried to date in the Femur Fracture MDL, Glynn v. Merck ,the jury returned a verdict in Merck’s favor. In addition, in June 2013, the Femur Fracture MDL court granted Merck’s motion for judgment as a matter of law inthe Glynn case and held that the plaintiff’s failure to warn claim was preempted by federal law.
In August 2013, the Femur Fracture MDL court entered an order requiring plaintiffs in the Femur Fracture MDL to show cause why those casesasserting claims for a femur fracture injury that took place prior to September 14, 2010, should not be dismissed based on the court’s preemption decision in theGlynn case. Pursuant to the show cause order, in March 2014, the Femur Fracture MDL court dismissed with prejudice approximately 650 cases on preemptiongrounds. Plaintiffs in approximately 515 of those cases appealed that decision to the U.S. Court of Appeals for the Third Circuit (Third Circuit). In March 2017, theThird Circuit issued a decision reversing the Femur Fracture MDL court’s preemption ruling and remanding the appealed cases back to the Femur Fracture MDLcourt. Merck filed a petition for a writ of certiorari to the U.S. Supreme Court in August 2017 seeking review of the Third Circuit’s decision. In December 2017,the Supreme Court invited the Solicitor General to file a brief in the case expressing the views of the United States, and in May 2018, the Solicitor Generalsubmitted a brief stating that the Third Circuit’s decision was wrongly decided and recommended that the Supreme Court grant Merck’s cert petition. The SupremeCourt granted Merck’s petition in June 2018, and final decision on the Femur Fracture MDL court’s preemption ruling is now pending before the Supreme Court.
Accordingly, as of September 30, 2018 , three cases were actively pending in the Femur Fracture MDL, and approximately 1,055 cases have either beendismissed without prejudice or administratively closed pending final resolution by the Supreme Court of the appeal of the Femur Fracture MDL court’s preemptionorder.
As of September 30, 2018 , approximately 2,610 cases alleging Femur Fractures have been filed in New Jersey state court and are pending before JudgeJames Hyland in Middlesex County. The parties selected an initial group of 30 cases to be reviewed through fact discovery. Two additional groups of 50 cases eachto be reviewed through fact discovery were selected in November 2013 and March 2014, respectively. A further group of 25 cases to be reviewed through factdiscovery was selected by Merck in July 2015, and Merck has continued to select additional cases to be reviewed through fact discovery from 2016 to the present.
- 22 -
Notes to Condensed Consolidated Financial Statements (unaudited) (continued)
As of September 30, 2018 , approximately 275 cases alleging Femur Fractures have been filed and are pending in California state court. All of theFemur Fracture cases filed in California state court have been coordinated before a single judge in Orange County, California. In March 2014, the court directedthat a group of 10 discovery pool cases be reviewed through fact discovery and subsequently scheduled the Galper v. Merck case, which plaintiffs selected, as thefirst trial. The Galper trial began in February 2015 and the jury returned a verdict in Merck’s favor in April 2015, and plaintiff appealed that verdict to theCalifornia appellate court. In April 2017, the California appellate court issued a decision affirming the lower court’s judgment in favor of Merck. The next FemurFracture trial in California that was scheduled to begin in April 2016 was stayed at plaintiffs’ request and a new trial date has not been set.
Additionally, there are four Femur Fracture cases pending in other state courts.Discovery is ongoing in the Femur Fracture MDL and in state courts where Femur Fracture cases are pending and the Company intends to defend
against these lawsuits.
Januvia/JanumetAs previously disclosed, Merck is a defendant in product liability lawsuits in the United States involving Januvia and/or Janumet . As of September 30,
2018 , Merck is aware of approximately 1,285 product users alleging that Januvia and/or Janumet caused the development of pancreatic cancer and other injuries.Most claims have been filed in multidistrict litigation before the U.S. District Court for the Southern District of California (MDL). Outside of the MDL,
the majority of claims have been filed in coordinated proceedings before the Superior Court of California, County of Los Angeles (California State Court). InNovember 2015, the MDL and California State Court–in separate opinions–granted summary judgment to defendants on grounds of federal preemption. Plaintiffsappealed, and in November 2017, the U.S. Court of Appeals for the Ninth Circuit reversed and remanded for further discovery, which is ongoing. The appeal inCalifornia State Court was argued on October 4, 2018.
As of September 30, 2018 , eight product users have claims pending against Merck in state courts other than California, including Illinois. In June 2017,the Illinois trial court denied Merck’s motion for summary judgment based on federal preemption. Merck has appealed, and oral argument is scheduled forNovember 14, 2018.
In addition to the claims noted above, the Company has agreed to toll the statute of limitations for approximately 50 additional claims. The Companyintends to continue defending against these lawsuits.
Propecia/ProscarAs previously disclosed, Merck is a defendant in product liability lawsuits in the United States involving Propecia and/or Proscar . The lawsuits were
filed in various federal courts and in state court in New Jersey. The federal lawsuits were then consolidated for pretrial purposes in a federal multidistrict litigationbefore Judge Brian Cogan of the Eastern District of New York. The matters pending in state court in New Jersey were consolidated before Judge Hyland inMiddlesex County (NJ Coordinated Proceedings). There is one matter pending in state court in California and one matter pending in state court in Massachusetts.
As previously disclosed, on April 9, 2018, Merck and the Plaintiffs’ Executive Committee in the MDL and the Plaintiffs’ Liaison Counsel in the NJCoordinated Proceedings entered into an agreement to resolve the above mentioned Propecia/Proscar lawsuits for an aggregate amount of $4.3 million . Thesettlement was subject to certain contingencies, including 95% plaintiff participation and a per plaintiff clawback if the participation rate was less than 100% . Thecontingencies were satisfied and the settlement agreement has been finalized. After the settlement, fewer than 40 cases will remain pending in the United States.
The Company intends to defend against any remaining unsettled lawsuits.
Governmental Proceedings
As previously disclosed, the Company’s subsidiaries in China have received and may continue to receive inquiries regarding their operations fromvarious Chinese governmental agencies. Some of these inquiries may be related to matters involving other multinational pharmaceutical companies, as well asChinese entities doing business with such companies. The Company’s policy is to cooperate with these authorities and to provide responses as appropriate.
As previously disclosed, from time to time, the Company receives inquiries and is the subject of preliminary investigation activities from competitionand other governmental authorities in markets outside the United States. These authorities may include regulators, administrative authorities, and law enforcementand other similar officials, and these preliminary investigation activities may include site visits, formal or informal requests or demands for documents or materials,inquiries or interviews and similar matters. Certain of these preliminary inquiries or activities may lead to the commencement of formal proceedings. Should thoseproceedings be determined adversely to the Company, monetary fines and/or remedial undertakings may be required.
- 23 -
Notes to Condensed Consolidated Financial Statements (unaudited) (continued)
Patent Litigation
From time to time, generic manufacturers of pharmaceutical products file abbreviated New Drug Applications with the U.S. Food and DrugAdministration (FDA) seeking to market generic forms of the Company’s products prior to the expiration of relevant patents owned by the Company. To protect itspatent rights, the Company may file patent infringement lawsuits against such generic companies. Similar lawsuits defending the Company’s patent rights mayexist in other countries. The Company intends to vigorously defend its patents, which it believes are valid, against infringement by companies attempting to marketproducts prior to the expiration of such patents. As with any litigation, there can be no assurance of the outcomes, which, if adverse, could result in significantlyshortened periods of exclusivity for these products and, with respect to products acquired through acquisitions, potentially significant intangible asset impairmentcharges.
Inegy — The patents protecting Inegy in Europe have expired but supplemental protection certificates (SPCs) have been granted to the Company inmany European countries that will expire in April 2019. There are multiple challenges to the SPCs related to Inegy throughout Europe and generic products havebeen launched in France, Italy, Ireland, Spain, Portugal, and the Netherlands and may launch in Germany. The Company has filed for preliminary injunctions inmany countries that are still pending decision. Preliminary injunctions have been granted in Belgium, the Czech Republic, Germany, Greece, Portugal, Norway andSlovakia. Preliminary injunctions have been denied or revoked in France, Germany, Belgium, Ireland, the Netherlands and Spain. The Company is appealing thosedecisions. The Company has filed and will continue to file actions for patent infringement seeking damages against those companies that launch generic productsbefore April 2019.
Noxafil — In August 2015, the Company filed a lawsuit against Actavis Laboratories Fl, Inc. (Actavis) in the United States in respect of that company’sapplication to the FDA seeking pre-patent expiry approval to sell a generic version of Noxafil . In October 2017, the district court held the patent valid andinfringed. Actavis appealed this decision. While the appeal was pending, the parties reached a settlement, subject to certain terms of the agreement being met,whereby Actavis can launch its generic version prior to expiry of the patent and pediatric exclusivity under certain conditions. In March 2016, the Company filed alawsuit against Roxane Laboratories, Inc. (Roxane) in the United States in respect of that company’s application to the FDA seeking pre-patent expiry approval tosell a generic version of Noxafil . In November 2017, the parties reached a settlement whereby Roxane can launch its generic version prior to expiry of the patentunder certain conditions. In February 2016, the Company filed a lawsuit against Par Sterile Products LLC, Par Pharmaceutical, Inc., Par PharmaceuticalCompanies, Inc. and Par Pharmaceutical Holdings, Inc. (collectively, Par) in the United States in respect of that company’s application to the FDA seeking pre-patent expiry approval to sell a generic version of Noxafil injection. In October 2016, the parties reached a settlement whereby Par can launch its generic version inJanuary 2023, or earlier under certain conditions. In February 2018, the Company filed a lawsuit against Fresenius Kabi USA, LLC., in the United States in respectof that company’s application to the FDA seeking pre-patent expiry approval to sell a generic version of Noxafil. In March 2018, the Company filed a lawsuitagainst Mylan Laboratories Limited in the United States in respect of that company’s application to the FDA seeking pre-patent expiry approval to sell a genericversion of Noxafil .
Nasonex — Nasonex lost market exclusivity in the United States in 2016. Prior to that, in April 2015, the Company filed a patent infringement lawsuitagainst Apotex Inc. and Apotex Corp. (Apotex) in respect of Apotex’s marketed product that the Company believed was infringing. In January 2018, the Companyand Apotex settled this matter with Apotex agreeing to pay the Company $115 million plus certain other consideration.
Gilead Patent Litigation and Opposition
In August 2013, Gilead Sciences, Inc. (Gilead) filed a lawsuit in the U.S. District Court for the Northern District of California seeking a declaration thattwo Company patents were invalid and not infringed by the sale of their two sofosbuvir containing products, Sovaldi and Harvoni. The Company filed acounterclaim that the sale of these products did infringe these two patents and sought a reasonable royalty for the past, present and future sales of these products. InMarch 2016, at the conclusion of a jury trial, the patents were found to be not invalid and infringed. The jury awarded the Company $200 million as a royalty forsales of these products up to December 2015. After the conclusion of the jury trial, the court held a bench trial on the equitable defenses raised by Gilead. In June2016, the court found for Gilead and determined that Merck could not collect the jury award and that the patents were unenforceable with respect to Gilead. TheCompany appealed the court’s decision. Gilead also asked the court to overturn the jury’s decision on validity. The court held a hearing on Gilead’s motion inAugust 2016, and the court subsequently rejected Gilead’s request, which Gilead appealed. In April 2018, the appeals court affirmed the decisions that both patentswere unenforceable against Gilead. In September 2018, Merck filed a petition for a writ of certiorari to the U.S. Supreme Court seeking review of the appellatedecision.
The Company, through its Idenix Pharmaceuticals, Inc. subsidiary, has pending litigation against Gilead in the United States, Germany and France basedon different patent estates that would also be infringed by Gilead’s sales of these two products. Gilead opposed the European patent at the European Patent Office(EPO). Trial in the United States was held in December 2016 and the jury returned a verdict for the Company, awarding damages of $2.54 billion . The Companysubmitted post-trial motions, including on the issues of enhanced damages and future royalties. Gilead submitted post-trial motions for judgment as a matter of law.A hearing on the motions was held in September 2017. Also, in September 2017, the court denied the Company’s motion on
- 24 -
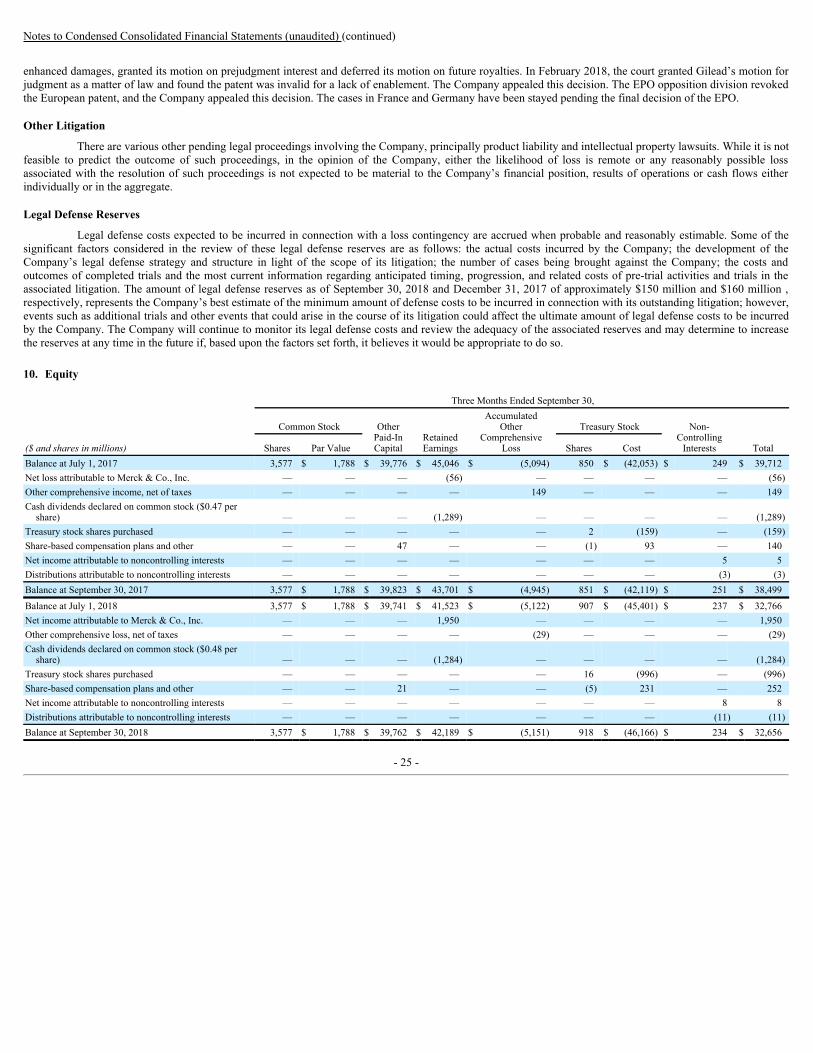
Notes to Condensed Consolidated Financial Statements (unaudited) (continued)
enhanced damages, granted its motion on prejudgment interest and deferred its motion on future royalties. In February 2018, the court granted Gilead’s motion forjudgment as a matter of law and found the patent was invalid for a lack of enablement. The Company appealed this decision. The EPO opposition division revokedthe European patent, and the Company appealed this decision. The cases in France and Germany have been stayed pending the final decision of the EPO.
Other Litigation
There are various other pending legal proceedings involving the Company, principally product liability and intellectual property lawsuits. While it is notfeasible to predict the outcome of such proceedings, in the opinion of the Company, either the likelihood of loss is remote or any reasonably possible lossassociated with the resolution of such proceedings is not expected to be material to the Company’s financial position, results of operations or cash flows eitherindividually or in the aggregate.
Legal Defense Reserves
Legal defense costs expected to be incurred in connection with a loss contingency are accrued when probable and reasonably estimable. Some of thesignificant factors considered in the review of these legal defense reserves are as follows: the actual costs incurred by the Company; the development of theCompany’s legal defense strategy and structure in light of the scope of its litigation; the number of cases being brought against the Company; the costs andoutcomes of completed trials and the most current information regarding anticipated timing, progression, and related costs of pre-trial activities and trials in theassociated litigation. The amount of legal defense reserves as of September 30, 2018 and December 31, 2017 of approximately $150 million and $160 million ,respectively, represents the Company’s best estimate of the minimum amount of defense costs to be incurred in connection with its outstanding litigation; however,events such as additional trials and other events that could arise in the course of its litigation could affect the ultimate amount of legal defense costs to be incurredby the Company. The Company will continue to monitor its legal defense costs and review the adequacy of the associated reserves and may determine to increasethe reserves at any time in the future if, based upon the factors set forth, it believes it would be appropriate to do so.
10. Equity
Three Months Ended September 30,
Common Stock OtherPaid-InCapital
RetainedEarnings
AccumulatedOther
ComprehensiveLoss
Treasury Stock Non-
ControllingInterests Total($ and shares in millions) Shares Par Value Shares Cost
Balance at July 1, 2017 3,577 $ 1,788 $ 39,776 $ 45,046 $ (5,094) 850 $ (42,053) $ 249 $ 39,712Net loss attributable to Merck & Co., Inc. — — — (56) — — — — (56)Other comprehensive income, net of taxes — — — — 149 — — — 149Cash dividends declared on common stock ($0.47 per
share) — — — (1,289) — — — — (1,289)Treasury stock shares purchased — — — — — 2 (159) — (159)Share-based compensation plans and other — — 47 — — (1) 93 — 140Net income attributable to noncontrolling interests — — — — — — — 5 5Distributions attributable to noncontrolling interests — — — — — — — (3) (3)Balance at September 30, 2017 3,577 $ 1,788 $ 39,823 $ 43,701 $ (4,945) 851 $ (42,119) $ 251 $ 38,499Balance at July 1, 2018 3,577 $ 1,788 $ 39,741 $ 41,523 $ (5,122) 907 $ (45,401) $ 237 $ 32,766Net income attributable to Merck & Co., Inc. — — — 1,950 — — — — 1,950Other comprehensive loss, net of taxes — — — — (29) — — — (29)Cash dividends declared on common stock ($0.48 per
share) — — — (1,284) — — — — (1,284)Treasury stock shares purchased — — — — — 16 (996) — (996)Share-based compensation plans and other — — 21 — — (5) 231 — 252Net income attributable to noncontrolling interests — — — — — — — 8 8Distributions attributable to noncontrolling interests — — — — — — — (11) (11)Balance at September 30, 2018 3,577 $ 1,788 $ 39,762 $ 42,189 $ (5,151) 918 $ (46,166) $ 234 $ 32,656
- 25 -

Notes to Condensed Consolidated Financial Statements (unaudited) (continued)
Nine Months Ended September 30,
Common Stock OtherPaid-InCapital
RetainedEarnings
AccumulatedOther
ComprehensiveLoss
Treasury Stock Non-
ControllingInterests Total($ and shares in millions) Shares Par Value Shares Cost
Balance at January 1, 2017 3,577 $ 1,788 $ 39,939 $ 44,133 $ (5,226) 828 $ (40,546) $ 220 $ 40,308Net income attributable to Merck & Co., Inc. — — — 3,440 — — — — 3,440Other comprehensive income, net of taxes — — — — 281 — — — 281Cash dividends declared on common stock ($1.41 per
share) — — — (3,872) — — — — (3,872)Treasury stock shares purchased — — — — — 36 (2,312) — (2,312)Share-based compensation plans and other — — (116) — — (13) 739 — 623Acquisition of Vallée — — — — — — — 25 25Net income attributable to noncontrolling interests — — — — — — — 16 16Distributions attributable to noncontrolling interests — — — — — — — (10) (10)Balance at September 30, 2017 3,577 $ 1,788 $ 39,823 $ 43,701 $ (4,945) 851 $ (42,119) $ 251 $ 38,499Balance at January 1, 2018 3,577 $ 1,788 $ 39,902 $ 41,350 $ (4,910) 880 $ (43,794) $ 233 $ 34,569Adoption of new accounting standards (see Note 1) — — — 322 (274) — — — 48Net income attributable to Merck & Co., Inc. — — — 4,393 — — — — 4,393Other comprehensive income, net of taxes — — — — 33 — — — 33Cash dividends declared on common stock ($1.44 per
share) — — — (3,876) — — — — (3,876)Treasury stock shares purchased — — — — — 53 (3,158) — (3,158)Share-based compensation plans and other — — (140) — — (15) 786 — 646Net income attributable to noncontrolling interests — — — — — — — 22 22Distributions attributable to noncontrolling interests — — — — — — — (21) (21)Balance at September 30, 2018 3,577 $ 1,788 $ 39,762 $ 42,189 $ (5,151) 918 $ (46,166) $ 234 $ 32,656
11. Share-Based Compensation PlansThe Company has share-based compensation plans under which the Company grants restricted stock units (RSUs) and performance share units (PSUs)
to certain management level employees. In addition, employees and non-employee directors may be granted options to purchase shares of Company common stockat the fair market value at the time of grant.
The following table provides the amounts of share-based compensation cost recorded in the Condensed Consolidated Statement of Income:
Three Months Ended
September 30, Nine Months Ended
September 30,
($ in millions) 2018 2017 2018 2017
Pretax share-based compensation expense $ 91 $ 76 $ 261 $ 232Income tax benefit (14) (23) (42) (70)Total share-based compensation expense, net of taxes $ 77 $ 53 $ 219 $ 162
During the first nine months of 2018 and 2017 , the Company granted 7 million RSUs with a weighted-average grant date fair value of $58.19 per RSUand 5 million RSUs with a weighted-average grant date fair value of $63.96 per RSU, respectively. During the first nine months of 2018 and 2017 , the Companygranted 855 thousand PSUs with a weighted-average grant date fair value of $56.70 per PSU and 1 million PSUs with a weighted-average grant date fair value of$63.62 per PSU, respectively.
During the first nine months of 2018 and 2017 , the Company granted 3 million stock options with a weighted-average exercise price of $57.72 peroption and 4 million stock options with a weighted-average exercise price of $63.96 per option, respectively. The weighted-average fair value of options grantedfor the first nine months of 2018 and 2017 was $8.19 and $7.04 per option, respectively, and was determined using the following assumptions:
- 26 -

Notes to Condensed Consolidated Financial Statements (unaudited) (continued)
Nine Months Ended
September 30,
2018 2017
Expected dividend yield 3.4% 3.6%Risk-free interest rate 2.8% 2.0%Expected volatility 19.1% 17.8%Expected life (years) 6.1 6.1
At September 30, 2018 , there was $654 million of total pretax unrecognized compensation expense related to nonvested stock options, RSU and PSUawards which will be recognized over a weighted-average period of 2.1 years . For segment reporting, share-based compensation costs are unallocated expenses.
12. Pension and Other Postretirement Benefit PlansThe Company has defined benefit pension plans covering eligible employees in the United States and in certain of its international subsidiaries. The net
periodic benefit cost of such plans consisted of the following components:
Three Months Ended
September 30, Nine Months Ended
September 30,
2018 2017 2018 2017
($ in millions) U.S. International U.S. International U.S. International U.S. International
Service cost $ 77 $ 56 $ 80 $ 66 $ 245 $ 181 $ 234 $ 189Interest cost 109 43 114 44 324 134 341 127Expected return on plan assets (209) (106) (210) (101) (634) (326) (646) (292)Amortization of unrecognized prior service
credit (12) (3) (13) (3) (37) (10) (40) (8)Net loss amortization 63 21 46 25 174 64 135 72Termination benefits 1 — 3 1 18 — 11 2Curtailments 3 — 4 (1) 7 (1) 8 (1)Settlements — — — — 1 3 — — $ 32 $ 11 $ 24 $ 31 $ 98 $ 45 $ 43 $ 89
The Company now anticipates contributing approximately $375 million to its U.S. pension plans in 2018, of which $325 million was contributed in thethird quarter.
The Company provides medical benefits, principally to its eligible U.S. retirees and similar benefits to their dependents, through its other postretirementbenefit plans. The net credit of such plans consisted of the following components:
Three Months Ended
September 30, Nine Months Ended
September 30,
($ in millions) 2018 2017 2018 2017
Service cost $ 15 $ 15 $ 43 $ 43Interest cost 17 20 52 61Expected return on plan assets (21) (20) (63) (59)Amortization of unrecognized prior service credit (21) (24) (63) (74)Net loss amortization — — 1 1Termination benefits — — 2 1Curtailments (1) (1) (7) (6) $ (11) $ (10) $ (35) $ (33)
In connection with restructuring actions (see Note 5), termination charges were recorded on pension and other postretirement benefit plans related toexpanded eligibility for certain employees exiting Merck. Also, in connection with these restructuring actions, curtailments and settlements were recorded onpension and other postretirement benefit plans as reflected in the tables above.
- 27 -
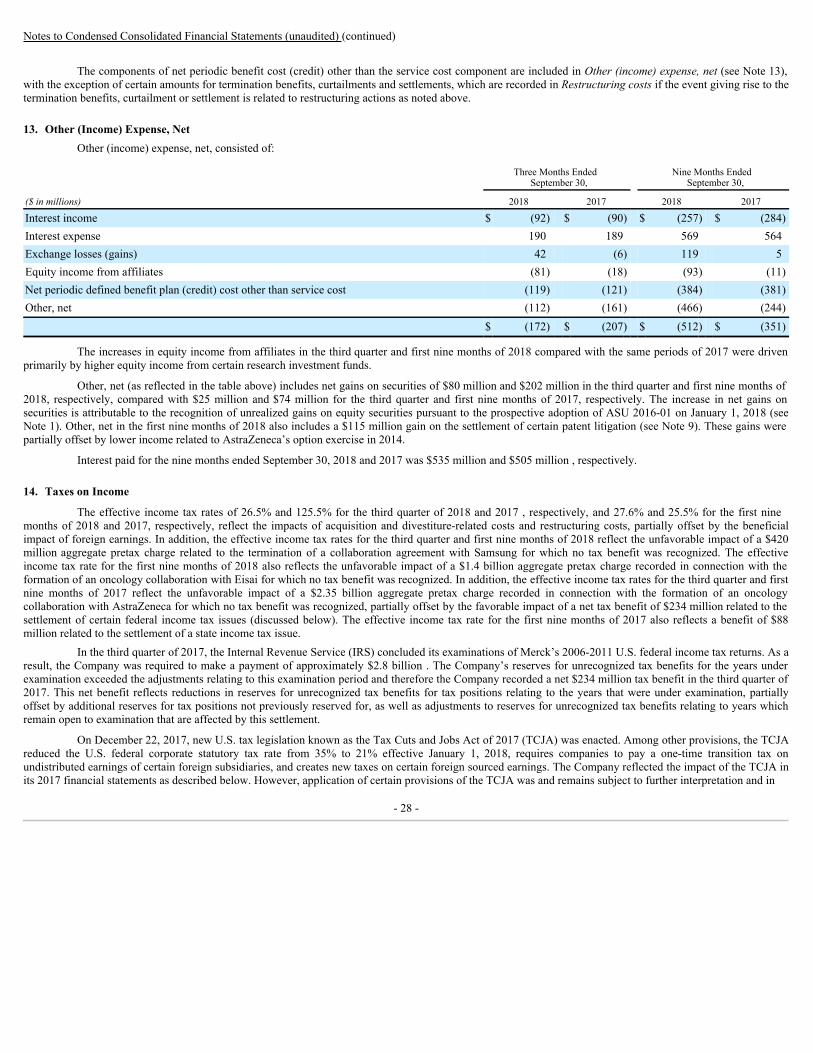
Notes to Condensed Consolidated Financial Statements (unaudited) (continued)
The components of net periodic benefit cost (credit) other than the service cost component are included in Other (income) expense, net (see Note 13),with the exception of certain amounts for termination benefits, curtailments and settlements, which are recorded in Restructuring costs if the event giving rise to thetermination benefits, curtailment or settlement is related to restructuring actions as noted above.
13. Other (Income) Expense, NetOther (income) expense, net, consisted of:
Three Months Ended
September 30, Nine Months Ended
September 30,
($ in millions) 2018 2017 2018 2017
Interest income $ (92) $ (90) $ (257) $ (284)Interest expense 190 189 569 564Exchange losses (gains) 42 (6) 119 5Equity income from affiliates (81) (18) (93) (11)Net periodic defined benefit plan (credit) cost other than service cost (119) (121) (384) (381)Other, net (112) (161) (466) (244) $ (172) $ (207) $ (512) $ (351)
The increases in equity income from affiliates in the third quarter and first nine months of 2018 compared with the same periods of 2017 were drivenprimarily by higher equity income from certain research investment funds.
Other, net (as reflected in the table above) includes net gains on securities of $80 million and $202 million in the third quarter and first nine months of2018, respectively, compared with $25 million and $74 million for the third quarter and first nine months of 2017, respectively. The increase in net gains onsecurities is attributable to the recognition of unrealized gains on equity securities pursuant to the prospective adoption of ASU 2016-01 on January 1, 2018 (seeNote 1). Other, net in the first nine months of 2018 also includes a $115 million gain on the settlement of certain patent litigation (see Note 9). These gains werepartially offset by lower income related to AstraZeneca’s option exercise in 2014.
Interest paid for the nine months ended September 30, 2018 and 2017 was $535 million and $505 million , respectively.
14. Taxes on Income
The effective income tax rates of 26.5% and 125.5% for the third quarter of 2018 and 2017 , respectively, and 27.6% and 25.5% for the first ninemonths of 2018 and 2017, respectively, reflect the impacts of acquisition and divestiture-related costs and restructuring costs, partially offset by the beneficialimpact of foreign earnings. In addition, the effective income tax rates for the third quarter and first nine months of 2018 reflect the unfavorable impact of a $420million aggregate pretax charge related to the termination of a collaboration agreement with Samsung for which no tax benefit was recognized. The effectiveincome tax rate for the first nine months of 2018 also reflects the unfavorable impact of a $1.4 billion aggregate pretax charge recorded in connection with theformation of an oncology collaboration with Eisai for which no tax benefit was recognized. In addition, the effective income tax rates for the third quarter and firstnine months of 2017 reflect the unfavorable impact of a $2.35 billion aggregate pretax charge recorded in connection with the formation of an oncologycollaboration with AstraZeneca for which no tax benefit was recognized, partially offset by the favorable impact of a net tax benefit of $234 million related to thesettlement of certain federal income tax issues (discussed below). The effective income tax rate for the first nine months of 2017 also reflects a benefit of $88million related to the settlement of a state income tax issue.
In the third quarter of 2017, the Internal Revenue Service (IRS) concluded its examinations of Merck’s 2006-2011 U.S. federal income tax returns. As aresult, the Company was required to make a payment of approximately $2.8 billion . The Company’s reserves for unrecognized tax benefits for the years underexamination exceeded the adjustments relating to this examination period and therefore the Company recorded a net $234 million tax benefit in the third quarter of2017. This net benefit reflects reductions in reserves for unrecognized tax benefits for tax positions relating to the years that were under examination, partiallyoffset by additional reserves for tax positions not previously reserved for, as well as adjustments to reserves for unrecognized tax benefits relating to years whichremain open to examination that are affected by this settlement.
On December 22, 2017, new U.S. tax legislation known as the Tax Cuts and Jobs Act of 2017 (TCJA) was enacted. Among other provisions, the TCJAreduced the U.S. federal corporate statutory tax rate from 35% to 21% effective January 1, 2018, requires companies to pay a one-time transition tax onundistributed earnings of certain foreign subsidiaries, and creates new taxes on certain foreign sourced earnings. The Company reflected the impact of the TCJA inits 2017 financial statements as described below. However, application of certain provisions of the TCJA was and remains subject to further interpretation and in
- 28 -
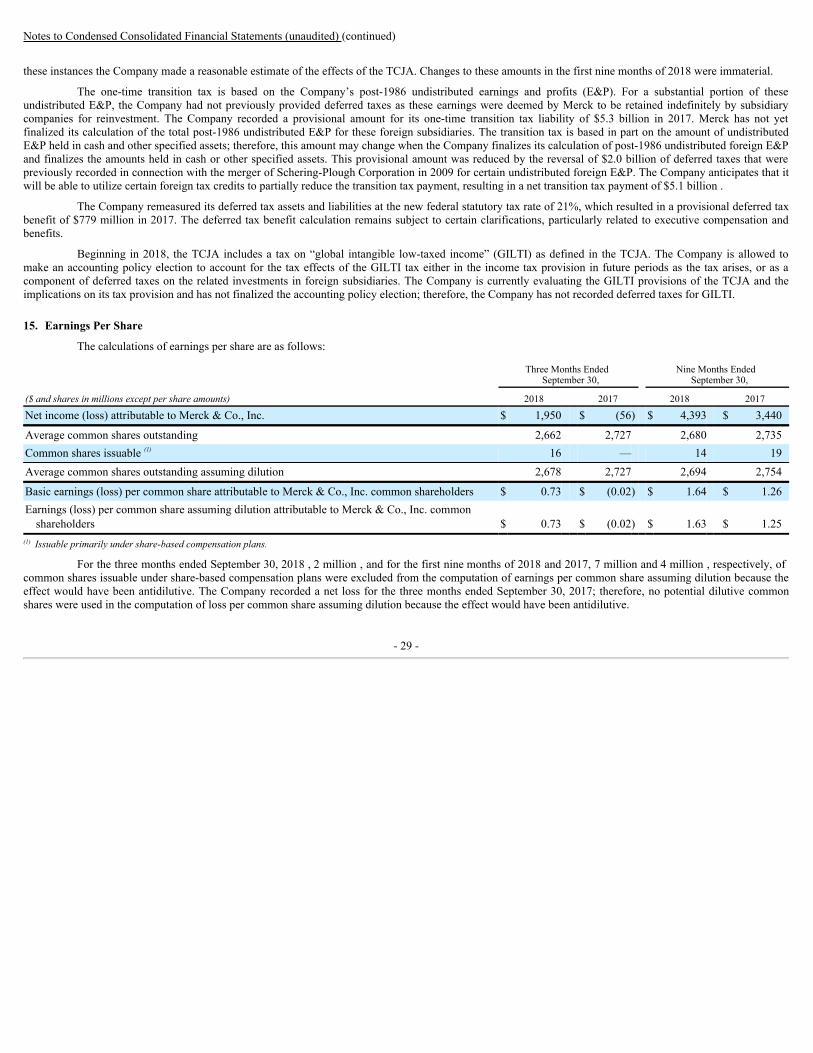
Notes to Condensed Consolidated Financial Statements (unaudited) (continued)
these instances the Company made a reasonable estimate of the effects of the TCJA. Changes to these amounts in the first nine months of 2018 were immaterial.
The one-time transition tax is based on the Company’s post-1986 undistributed earnings and profits (E&P). For a substantial portion of theseundistributed E&P, the Company had not previously provided deferred taxes as these earnings were deemed by Merck to be retained indefinitely by subsidiarycompanies for reinvestment. The Company recorded a provisional amount for its one-time transition tax liability of $5.3 billion in 2017. Merck has not yetfinalized its calculation of the total post-1986 undistributed E&P for these foreign subsidiaries. The transition tax is based in part on the amount of undistributedE&P held in cash and other specified assets; therefore, this amount may change when the Company finalizes its calculation of post-1986 undistributed foreign E&Pand finalizes the amounts held in cash or other specified assets. This provisional amount was reduced by the reversal of $2.0 billion of deferred taxes that werepreviously recorded in connection with the merger of Schering-Plough Corporation in 2009 for certain undistributed foreign E&P. The Company anticipates that itwill be able to utilize certain foreign tax credits to partially reduce the transition tax payment, resulting in a net transition tax payment of $5.1 billion .
The Company remeasured its deferred tax assets and liabilities at the new federal statutory tax rate of 21%, which resulted in a provisional deferred taxbenefit of $779 million in 2017. The deferred tax benefit calculation remains subject to certain clarifications, particularly related to executive compensation andbenefits.
Beginning in 2018, the TCJA includes a tax on “global intangible low-taxed income” (GILTI) as defined in the TCJA. The Company is allowed tomake an accounting policy election to account for the tax effects of the GILTI tax either in the income tax provision in future periods as the tax arises, or as acomponent of deferred taxes on the related investments in foreign subsidiaries. The Company is currently evaluating the GILTI provisions of the TCJA and theimplications on its tax provision and has not finalized the accounting policy election; therefore, the Company has not recorded deferred taxes for GILTI.
15. Earnings Per Share
The calculations of earnings per share are as follows:
Three Months Ended
September 30, Nine Months Ended
September 30,
($ and shares in millions except per share amounts) 2018 2017 2018 2017
Net income (loss) attributable to Merck & Co., Inc. $ 1,950 $ (56) $ 4,393 $ 3,440
Average common shares outstanding 2,662 2,727 2,680 2,735Common shares issuable (1) 16 — 14 19Average common shares outstanding assuming dilution 2,678 2,727 2,694 2,754
Basic earnings (loss) per common share attributable to Merck & Co., Inc. common shareholders $ 0.73 $ (0.02) $ 1.64 $ 1.26Earnings (loss) per common share assuming dilution attributable to Merck & Co., Inc. common
shareholders $ 0.73 $ (0.02) $ 1.63 $ 1.25(1) Issuable primarily under share-based compensation plans.
For the three months ended September 30, 2018 , 2 million , and for the first nine months of 2018 and 2017, 7 million and 4 million , respectively, ofcommon shares issuable under share-based compensation plans were excluded from the computation of earnings per common share assuming dilution because theeffect would have been antidilutive. The Company recorded a net loss for the three months ended September 30, 2017; therefore, no potential dilutive commonshares were used in the computation of loss per common share assuming dilution because the effect would have been antidilutive.
- 29 -
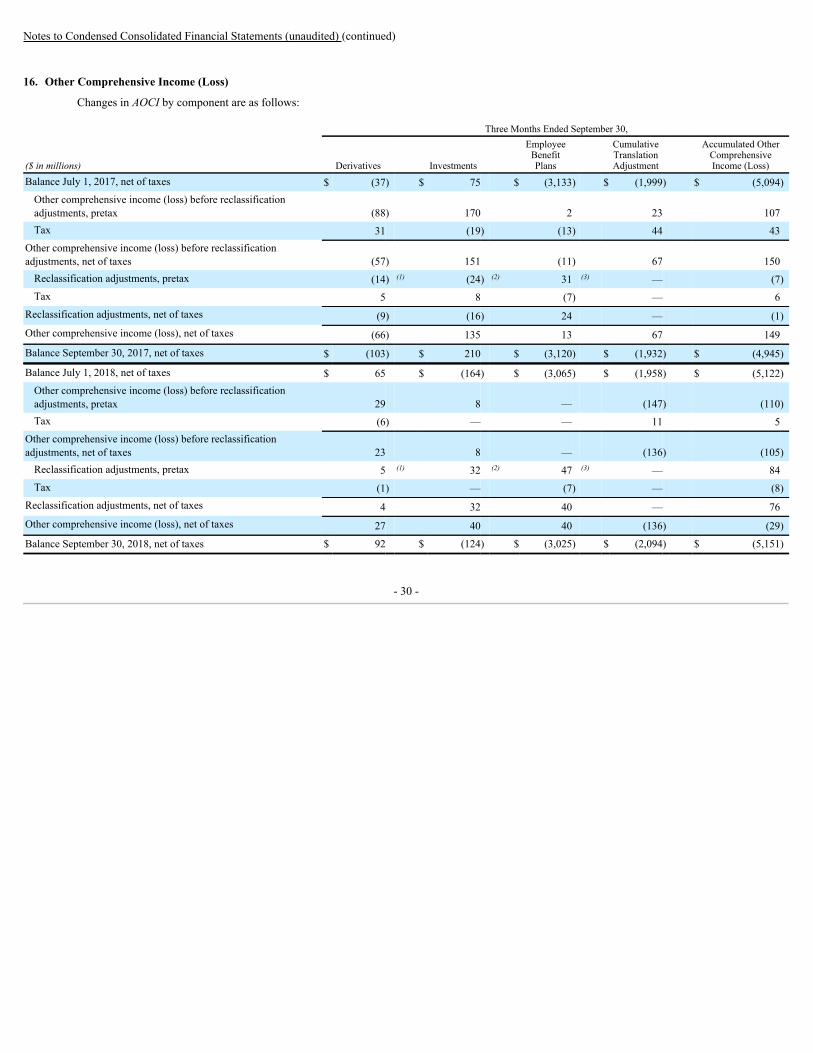
Notes to Condensed Consolidated Financial Statements (unaudited) (continued)
16. Other Comprehensive Income (Loss)
Changes in AOCI by component are as follows:
Three Months Ended September 30,
($ in millions) Derivatives Investments
EmployeeBenefitPlans
CumulativeTranslationAdjustment
Accumulated OtherComprehensiveIncome (Loss)
Balance July 1, 2017, net of taxes $ (37) $ 75 $ (3,133) $ (1,999) $ (5,094)Other comprehensive income (loss) before reclassificationadjustments, pretax (88) 170 2 23 107Tax 31 (19) (13) 44 43
Other comprehensive income (loss) before reclassificationadjustments, net of taxes (57) 151 (11) 67 150
Reclassification adjustments, pretax (14) (1) (24) (2) 31 (3) — (7)Tax 5 8 (7) — 6
Reclassification adjustments, net of taxes (9) (16) 24 — (1)Other comprehensive income (loss), net of taxes (66) 135 13 67 149
Balance September 30, 2017, net of taxes $ (103) $ 210 $ (3,120) $ (1,932) $ (4,945)
Balance July 1, 2018, net of taxes $ 65 $ (164) $ (3,065) $ (1,958) $ (5,122)Other comprehensive income (loss) before reclassificationadjustments, pretax 29 8 — (147) (110)Tax (6) — — 11 5
Other comprehensive income (loss) before reclassificationadjustments, net of taxes 23 8 — (136) (105)
Reclassification adjustments, pretax 5 (1) 32 (2) 47 (3) — 84Tax (1) — (7) — (8)
Reclassification adjustments, net of taxes 4 32 40 — 76Other comprehensive income (loss), net of taxes 27 40 40 (136) (29)
Balance September 30, 2018, net of taxes $ 92 $ (124) $ (3,025) $ (2,094) $ (5,151)
- 30 -
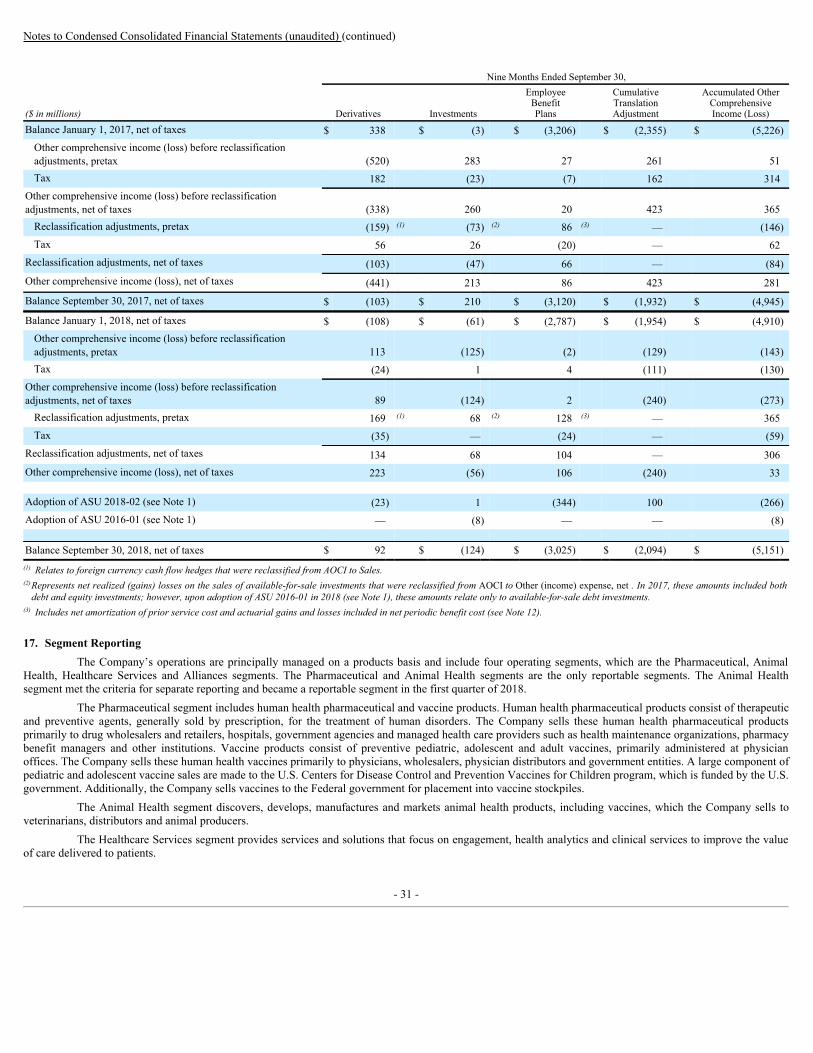
Notes to Condensed Consolidated Financial Statements (unaudited) (continued)
Nine Months Ended September 30,
($ in millions) Derivatives Investments
EmployeeBenefitPlans
CumulativeTranslationAdjustment
Accumulated OtherComprehensiveIncome (Loss)
Balance January 1, 2017, net of taxes $ 338 $ (3) $ (3,206) $ (2,355) $ (5,226)Other comprehensive income (loss) before reclassificationadjustments, pretax (520) 283 27 261 51Tax 182 (23) (7) 162 314
Other comprehensive income (loss) before reclassificationadjustments, net of taxes (338) 260 20 423 365
Reclassification adjustments, pretax (159) (1) (73) (2) 86 (3) — (146)Tax 56 26 (20) — 62
Reclassification adjustments, net of taxes (103) (47) 66 — (84)Other comprehensive income (loss), net of taxes (441) 213 86 423 281
Balance September 30, 2017, net of taxes $ (103) $ 210 $ (3,120) $ (1,932) $ (4,945)
Balance January 1, 2018, net of taxes $ (108) $ (61) $ (2,787) $ (1,954) $ (4,910)Other comprehensive income (loss) before reclassificationadjustments, pretax 113 (125) (2) (129) (143)Tax (24) 1 4 (111) (130)
Other comprehensive income (loss) before reclassificationadjustments, net of taxes 89 (124) 2 (240) (273)
Reclassification adjustments, pretax 169 (1) 68 (2) 128 (3) — 365Tax (35) — (24) — (59)
Reclassification adjustments, net of taxes 134 68 104 — 306Other comprehensive income (loss), net of taxes 223 (56) 106 (240) 33
Adoption of ASU 2018-02 (see Note 1) (23) 1 (344) 100 (266)Adoption of ASU 2016-01 (see Note 1) — (8) — — (8)
Balance September 30, 2018, net of taxes $ 92 $ (124) $ (3,025) $ (2,094) $ (5,151)
(1) Relates to foreign currency cash flow hedges that were reclassified from AOCI to Sales.(2)
Represents net realized (gains) losses on the sales of available-for-sale investments that were reclassified from AOCI to Other (income) expense, net . In 2017, these amounts included bothdebt and equity investments; however, upon adoption of ASU 2016-01 in 2018 (see Note 1), these amounts relate only to available-for-sale debt investments.
(3) Includes net amortization of prior service cost and actuarial gains and losses included in net periodic benefit cost (see Note 12).
17. Segment ReportingThe Company’s operations are principally managed on a products basis and include four operating segments, which are the Pharmaceutical, Animal
Health, Healthcare Services and Alliances segments. The Pharmaceutical and Animal Health segments are the only reportable segments. The Animal Healthsegment met the criteria for separate reporting and became a reportable segment in the first quarter of 2018.
The Pharmaceutical segment includes human health pharmaceutical and vaccine products. Human health pharmaceutical products consist of therapeuticand preventive agents, generally sold by prescription, for the treatment of human disorders. The Company sells these human health pharmaceutical productsprimarily to drug wholesalers and retailers, hospitals, government agencies and managed health care providers such as health maintenance organizations, pharmacybenefit managers and other institutions. Vaccine products consist of preventive pediatric, adolescent and adult vaccines, primarily administered at physicianoffices. The Company sells these human health vaccines primarily to physicians, wholesalers, physician distributors and government entities. A large component ofpediatric and adolescent vaccine sales are made to the U.S. Centers for Disease Control and Prevention Vaccines for Children program, which is funded by the U.S.government. Additionally, the Company sells vaccines to the Federal government for placement into vaccine stockpiles.
The Animal Health segment discovers, develops, manufactures and markets animal health products, including vaccines, which the Company sells toveterinarians, distributors and animal producers.
The Healthcare Services segment provides services and solutions that focus on engagement, health analytics and clinical services to improve the valueof care delivered to patients.
- 31 -
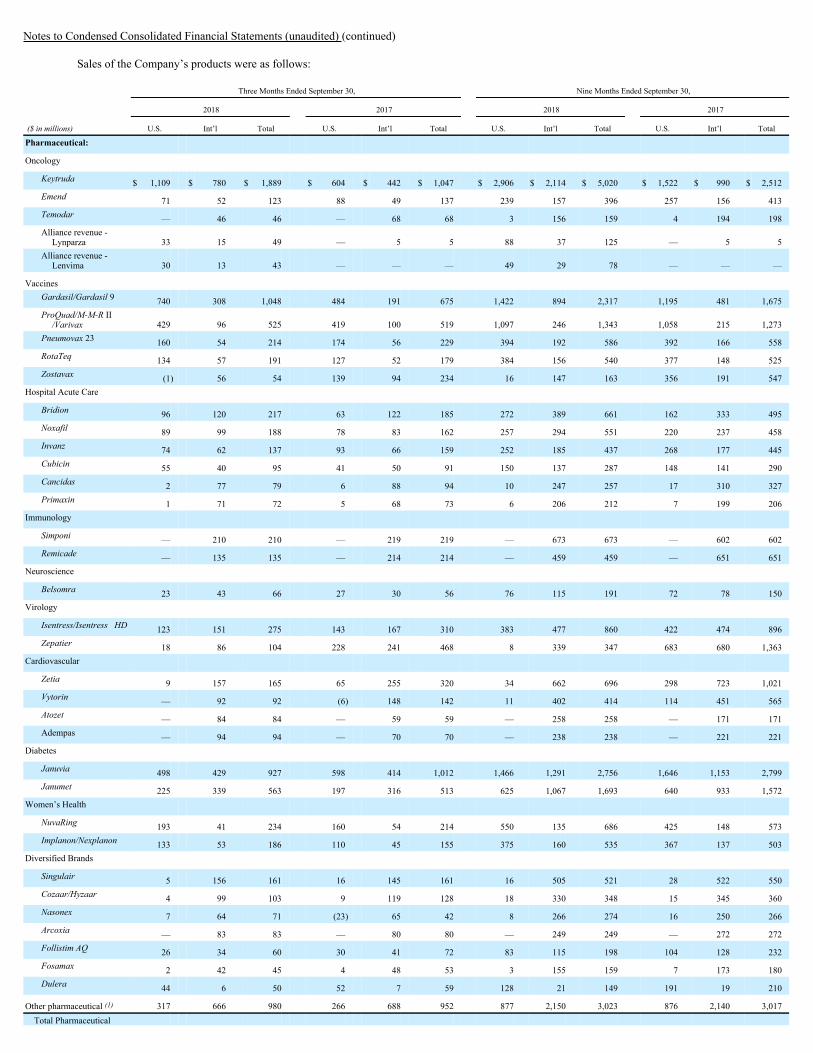
Notes to Condensed Consolidated Financial Statements (unaudited) (continued)
Sales of the Company’s products were as follows:
Three Months Ended September 30, Nine Months Ended September 30,
2018 2017 2018 2017
($ in millions) U.S. Int’l Total U.S. Int’l Total U.S. Int’l Total U.S. Int’l Total
Pharmaceutical: Oncology
Keytruda $ 1,109 $ 780 $ 1,889 $ 604 $ 442 $ 1,047 $ 2,906 $ 2,114 $ 5,020 $ 1,522 $ 990 $ 2,512Emend 71 52 123 88 49 137 239 157 396 257 156 413Temodar — 46 46 — 68 68 3 156 159 4 194 198Alliance revenue -
Lynparza 33 15 49 — 5 5 88 37 125 — 5 5Alliance revenue -
Lenvima 30 13 43 — — — 49 29 78 — — —
Vaccines Gardasil/Gardasil 9 740 308 1,048 484 191 675 1,422 894 2,317 1,195 481 1,675ProQuad/M-M-R II
/Varivax 429 96 525 419 100 519 1,097 246 1,343 1,058 215 1,273Pneumovax 23 160 54 214 174 56 229 394 192 586 392 166 558RotaTeq 134 57 191 127 52 179 384 156 540 377 148 525Zostavax (1) 56 54 139 94 234 16 147 163 356 191 547
Hospital Acute Care Bridion 96 120 217 63 122 185 272 389 661 162 333 495Noxafil 89 99 188 78 83 162 257 294 551 220 237 458Invanz 74 62 137 93 66 159 252 185 437 268 177 445Cubicin 55 40 95 41 50 91 150 137 287 148 141 290Cancidas 2 77 79 6 88 94 10 247 257 17 310 327Primaxin 1 71 72 5 68 73 6 206 212 7 199 206
Immunology Simponi — 210 210 — 219 219 — 673 673 — 602 602Remicade — 135 135 — 214 214 — 459 459 — 651 651
Neuroscience Belsomra 23 43 66 27 30 56 76 115 191 72 78 150
Virology Isentress/Isentress HD 123 151 275 143 167 310 383 477 860 422 474 896Zepatier 18 86 104 228 241 468 8 339 347 683 680 1,363
Cardiovascular Zetia 9 157 165 65 255 320 34 662 696 298 723 1,021Vytorin — 92 92 (6) 148 142 11 402 414 114 451 565Atozet — 84 84 — 59 59 — 258 258 — 171 171Adempas — 94 94 — 70 70 — 238 238 — 221 221
Diabetes Januvia 498 429 927 598 414 1,012 1,466 1,291 2,756 1,646 1,153 2,799Janumet 225 339 563 197 316 513 625 1,067 1,693 640 933 1,572
Women’s Health NuvaRing 193 41 234 160 54 214 550 135 686 425 148 573Implanon/Nexplanon 133 53 186 110 45 155 375 160 535 367 137 503
Diversified Brands Singulair 5 156 161 16 145 161 16 505 521 28 522 550Cozaar/Hyzaar 4 99 103 9 119 128 18 330 348 15 345 360Nasonex 7 64 71 (23) 65 42 8 266 274 16 250 266Arcoxia — 83 83 — 80 80 — 249 249 — 272 272Follistim AQ 26 34 60 30 41 72 83 115 198 104 128 232Fosamax 2 42 45 4 48 53 3 155 159 7 173 180Dulera 44 6 50 52 7 59 128 21 149 191 19 210
Other pharmaceutical (1) 317 666 980 266 688 952 877 2,150 3,023 876 2,140 3,017Total Pharmaceutical
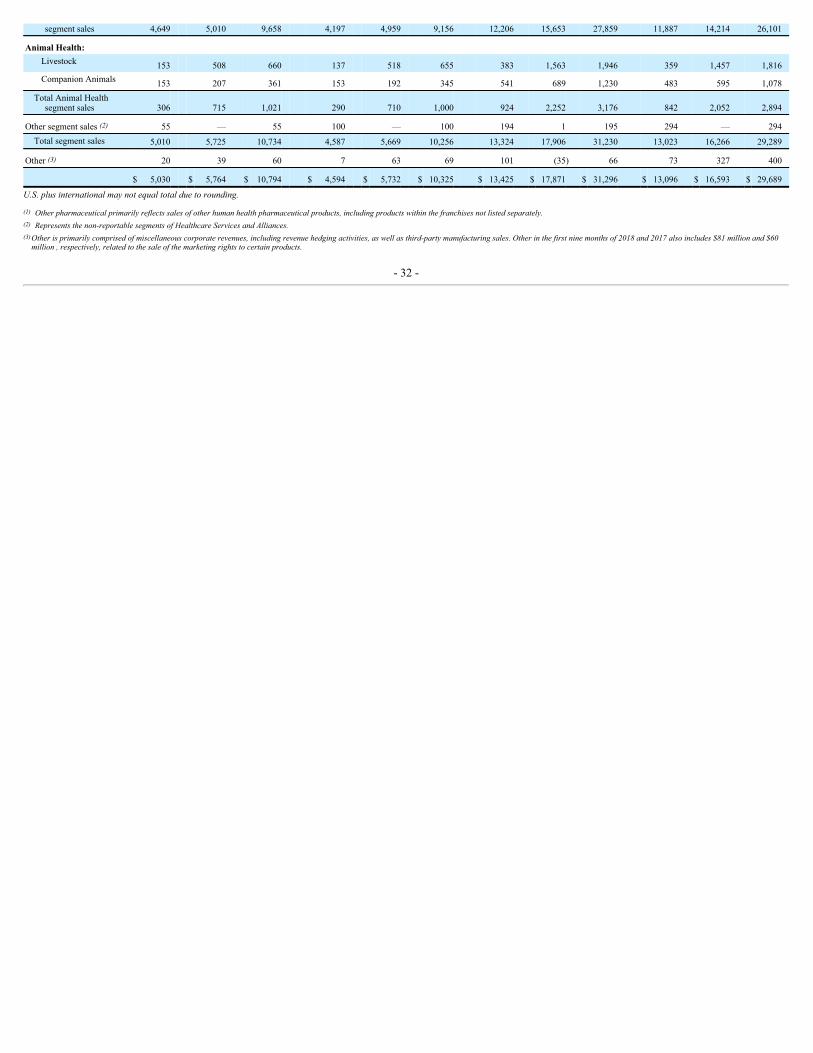
segment sales 4,649 5,010 9,658 4,197 4,959 9,156 12,206 15,653 27,859 11,887 14,214 26,101
Animal Health: Livestock 153 508 660 137 518 655 383 1,563 1,946 359 1,457 1,816Companion Animals 153 207 361 153 192 345 541 689 1,230 483 595 1,078
Total Animal Healthsegment sales 306 715 1,021 290 710 1,000 924 2,252 3,176 842 2,052 2,894
Other segment sales (2) 55 — 55 100 — 100 194 1 195 294 — 294Total segment sales 5,010 5,725 10,734 4,587 5,669 10,256 13,324 17,906 31,230 13,023 16,266 29,289
Other (3) 20 39 60 7 63 69 101 (35) 66 73 327 400 $ 5,030 $ 5,764 $ 10,794 $ 4,594 $ 5,732 $ 10,325 $ 13,425 $ 17,871 $ 31,296 $ 13,096 $ 16,593 $ 29,689
U.S. plus international may not equal total due to rounding.
(1) Other pharmaceutical primarily reflects sales of other human health pharmaceutical products, including products within the franchises not listed separately.(2) Represents the non-reportable segments of Healthcare Services and Alliances.(3)
Other is primarily comprised of miscellaneous corporate revenues, including revenue hedging activities, as well as third-party manufacturing sales. Other in the first nine months of 2018 and 2017 also includes $81 million and $60million , respectively, related to the sale of the marketing rights to certain products.
- 32 -

Notes to Condensed Consolidated Financial Statements (unaudited) (continued)
Consolidated revenues by geographic area where derived are as follows:
Three Months Ended
September 30, Nine Months Ended
September 30,
($ in millions) 2018 2017 2018 2017
United States $ 5,030 $ 4,594 $ 13,425 $ 13,096Europe, Middle East and Africa 2,884 2,941 9,218 8,374Asia Pacific 1,178 1,112 3,766 3,164Japan 761 775 2,353 2,320Latin America 622 585 1,748 1,654Other 319 318 786 1,081 $ 10,794 $ 10,325 $ 31,296 $ 29,689
A reconciliation of segment profits to Income before taxes is as follows:
Three Months Ended
September 30, Nine Months Ended
September 30,
($ in millions) 2018 2017 2018 2017
Segment profits: Pharmaceutical segment $ 6,479 $ 5,906 $ 18,109 $ 16,657Animal Health segment 409 389 1,273 1,202Other segments 5 93 94 234
Total segment profits 6,893 6,388 19,476 18,093Other profits (losses) 55 (78) (35) 107Unallocated:
Interest income 92 90 257 284Interest expense (190) (189) (569) (564)Equity income from affiliates 85 23 101 16Depreciation and amortization (324) (334) (1,006) (1,036)Research and development (1,855) (4,208) (6,878) (7,399)Amortization of purchase accounting adjustments (679) (765) (2,144) (2,322)Restructuring costs (171) (153) (494) (470)Aggregate charge related to termination of collaboration agreement with Samsung (420) — (420) —Other unallocated, net (821) (574) (2,191) (2,067)
$ 2,665 $ 200 $ 6,097 $ 4,642
Pharmaceutical segment profits are comprised of segment sales less standard costs, as well as marketing and administrative expenses and research anddevelopment costs directly incurred by the segment. Animal Health segment profits are comprised of segment sales, less all materials and production costs, as wellas marketing and administrative expenses and research and development costs directly incurred by the segment. For internal management reporting presented to thechief operating decision maker, Merck does not allocate the remaining materials and production costs not included in segment profits as described above, researchand development expenses incurred in Merck Research Laboratories, the Company’s research and development division that focuses on human health-relatedactivities, or general and administrative expenses, nor the cost of financing these activities. Separate divisions maintain responsibility for monitoring and managingthese costs, including depreciation related to fixed assets utilized by these divisions and, therefore, they are not included in segment profits. In addition, costsrelated to restructuring activities, as well as the amortization of purchase accounting adjustments are not allocated to segments.
Other profits are primarily comprised of miscellaneous corporate profits, as well as operating profits related to third-party manufacturing sales.
Other unallocated, net includes expenses from corporate and manufacturing cost centers, goodwill and other intangible asset impairment charges, gainsor losses on sales of businesses, expense or income related to changes in the estimated fair value of contingent consideration, and other miscellaneous income orexpense items.
In the first quarter of 2018, the Company adopted a new accounting standard related to the classification of certain defined benefit plan costs (see Note1), which resulted in a change to the measurement of segment profits. Net periodic benefit cost (credit) other than service cost is no longer included as a componentof segment profits. Prior period amounts have been recast to conform to the new presentation.
- 33 -

Item 2. Management’s Discussion and Analysis of Financial Condition and Results of Operations
Recent Developments
Dividend Increase and Share Repurchase ProgramIn October 2018, Merck announced that its Board of Directors approved a 15% increase to the Company’s quarterly dividend, raising it to $0.55 per
share from $0.48 per share of the Company’s outstanding common stock. The Board also authorized an additional $10 billion of treasury stock purchases with notime limit for completion. The Company has entered into a $5 billion accelerated share repurchase program under its expanded authorization (see “Liquidity andCapital Resources” below).
Business DevelopmentsIn June 2018, Merck acquired Viralytics Limited (Viralytics), an Australian publicly traded company focused on oncolytic immunotherapy treatments
for a range of cancers, for AUD 502 million ( $378 million ). The transaction provided Merck with full rights to Cavatak (V937, formerly CVA21), Viralytics’sinvestigational oncolytic immunotherapy. Cavatak is based on Viralytics’s proprietary formulation of an oncolytic virus (Coxsackievirus Type A21) that has beenshown to preferentially infect and kill cancer cells. Cavatak is currently being evaluated in multiple Phase 1 and Phase 2 clinical trials, both as an intratumoral andintravenous agent, including in combination with Keytruda (pembrolizumab), Merck’s anti-PD-1 (programmed death receptor-1) therapy. Under a previousagreement between Merck and Viralytics, a study is investigating the use of the Keytruda and Cavatak combination in melanoma, prostate, lung and bladdercancers.
In March 2018, Merck and Eisai Co., Ltd. (Eisai) announced a strategic collaboration for the worldwide co-development and co-commercialization ofLenvima (lenvatinib mesylate), an orally available tyrosine kinase inhibitor discovered by Eisai. Under the agreement, Merck and Eisai will develop andcommercialize Lenvima jointly, both as monotherapy and in combination with Keytruda . Eisai records Lenvima product sales globally and Merck and Eisai sharegross profits equally. Merck records its share of Lenvima product sales, net of cost of sales and commercialization costs, as alliance revenue. Expenses incurredduring co-development, including for studies evaluating Lenvima as monotherapy, are shared equally by the two companies. Under the agreement, Merck madeupfront payments to Eisai of $750 million and will make payments of up to $650 million for certain option rights through 2021 ( $325 million in January 2019 orearlier in certain circumstances, $200 million in January 2020 and $125 million in January 2021). The Company recorded an aggregate charge of $1.4 billion inResearch and development expenses in the first nine months of 2018 related to the upfront payments and future option payments. In addition, the agreementprovides for Eisai to receive up to $385 million associated with the achievement of certain clinical and regulatory milestones and up to $3.97 billion for theachievement of milestones associated with sales of Lenvima. Lenvima has since been approved for the treatment of patients with unresectable hepatocellularcarcinoma in the United States, Europe, China and Japan.
PricingGlobal efforts toward health care cost containment continue to exert pressure on product pricing and market access worldwide. In the United States,
pricing pressures continue on many of the Company’s products. Changes to the U.S. health care system as part of health care reform, as well as increasedpurchasing power of entities that negotiate on behalf of Medicare, Medicaid, and private sector beneficiaries, could result in further pricing pressures. In July 2018,the Company announced its commitment not to increase the average net price in the United States across its human health portfolio of products by more thaninflation annually.
In several international markets, government-mandated pricing actions have reduced prices of generic and patented drugs. In addition, other austeritymeasures negatively affected the Company’s revenue performance in the first nine months of 2018 . The Company anticipates these pricing actions and otherausterity measures will continue to negatively affect revenue performance for the remainder of 2018 .
Cyber-attackOn June 27, 2017, the Company experienced a network cyber-attack that led to a disruption of its worldwide operations, including manufacturing,
research and sales operations. Due to a residual backlog of orders for certain products as a result of the cyber-attack, the Company was unable to fulfill orders forcertain products in certain markets, which had an unfavorable effect on sales for the first nine months of 2018 of approximately $150 million, including animmaterial impact to sales in the third quarter of 2018. The Company expects an immaterial impact to sales for the remainder of 2018. Sales in the third quarter andfirst nine months of 2017 were unfavorably affected by $135 million due to the cyber-attack. In addition, the Company recorded manufacturing-related expenses,primarily unfavorable manufacturing variances, in Materials and production costs, as well as expenses related to remediation efforts in Marketing andadministrative expenses and Research and development expenses, which aggregated approximately $175 million for the third quarter and first nine months of 2017.Costs in the first nine months of 2018 were immaterial.
- 34 -
The Company has insurance coverage insuring against costs resulting from cyber-attacks and has received insurance proceeds. However, there may bedisputes with the insurers about the availability of the insurance coverage for claims related to this incident.
Operating ResultsSales
Worldwide sales were $10.8 billion for the third quarter of 2018 , an increase of 5% compared with the third quarter of 2017 including a 1%unfavorable effect from foreign exchange. Global sales were $31.3 billion for the first nine months of 2018, an increase of 5% compared with the same period of2017. Sales growth in both periods was driven primarily by higher sales in the oncology franchise reflecting strong growth of Keytruda , as well as alliance revenuerelated to Lynparza (olaparib) and Lenvima. Also contributing to revenue growth were higher sales in the hospital acute care franchise, largely attributable toBridion (sugammadex) Injection and Noxafil (posaconazole). The sales increases in the third quarter and first nine months of 2018 also reflect higher sales ofhuman papillomavirus (HPV) vaccine Gardasil (Human Papillomavirus Quadrivalent [Types 6, 11, 16 and 18] Vaccine, Recombinant) /Gardasil 9 (HumanPapillomavirus 9-valent Vaccine, Recombinant), which were attributable in part to a reduction of Gardasil 9 sales due to a borrowing the Company made from theU.S. Centers for Disease Control and Prevention (CDC) Pediatric Vaccine Stockpile in the third quarter of 2017 as discussed below. Higher sales of animal healthproducts also drove revenue growth in the third quarter and first nine months of 2018. Additionally, a lower impact from the June 2017 cyber-attack as discussedabove also contributed to the sales increase in the third quarter and first months of 2018.
Revenue growth in the third quarter and first nine months of 2018 was partially offset by declines in the virology franchise driven primarily by lowersales of hepatitis C virus (HCV) treatment Zepatier (elbasvir and grazoprevir), as well as lower sales of shingles (herpes zoster) vaccine Zostavax (Zoster VaccineLive). The ongoing effects of generic and biosimilar competition for cardiovascular products Zetia (ezetimibe), Vytorin (ezetimibe and simvastatin), andimmunology product Remicade (infliximab), as well as lower sales of products within the diversified brands franchise also partially offset revenue growth in thequarter and year-to-date period. The diversified brands franchise includes certain products that are approaching the expiration of their marketing exclusivity or thatare no longer protected by patents in developed markets.
- 35 -
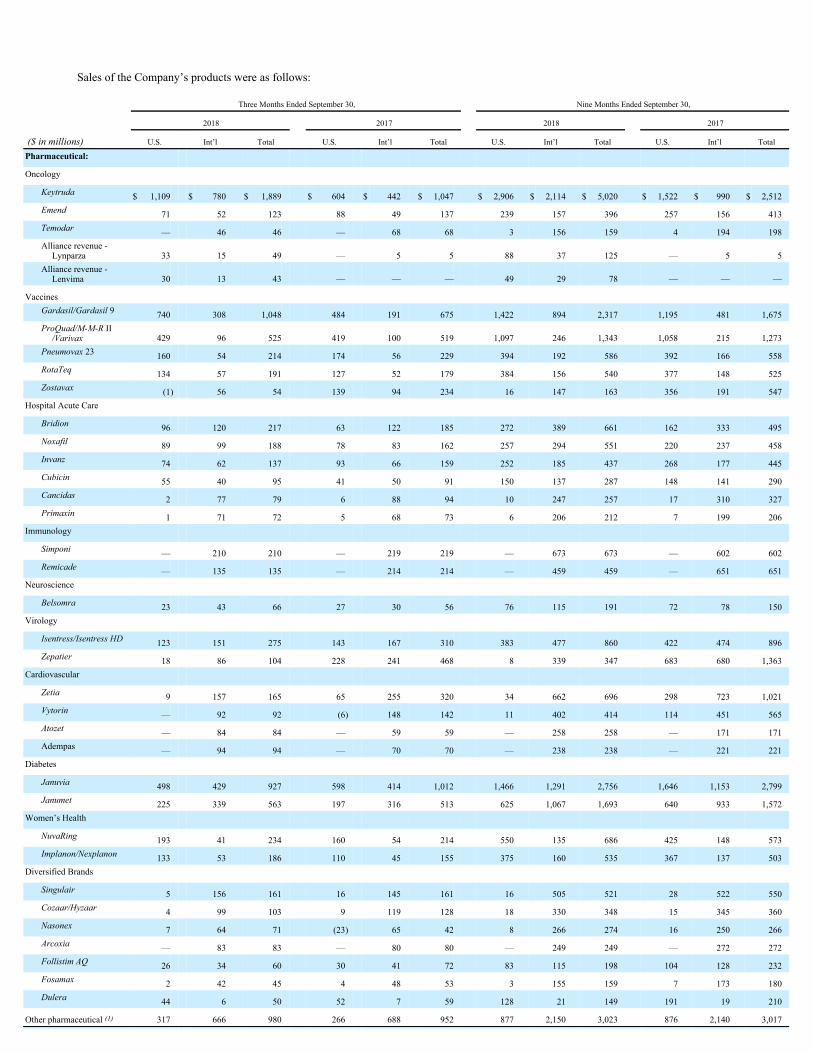
Sales of the Company’s products were as follows:
Three Months Ended September 30, Nine Months Ended September 30,
2018 2017 2018 2017
($ in millions) U.S. Int’l Total U.S. Int’l Total U.S. Int’l Total U.S. Int’l Total
Pharmaceutical: Oncology
Keytruda $ 1,109 $ 780 $ 1,889 $ 604 $ 442 $ 1,047 $ 2,906 $ 2,114 $ 5,020 $ 1,522 $ 990 $ 2,512Emend 71 52 123 88 49 137 239 157 396 257 156 413Temodar — 46 46 — 68 68 3 156 159 4 194 198Alliance revenue -
Lynparza 33 15 49 — 5 5 88 37 125 — 5 5Alliance revenue -
Lenvima 30 13 43 — — — 49 29 78 — — —
Vaccines Gardasil/Gardasil 9 740 308 1,048 484 191 675 1,422 894 2,317 1,195 481 1,675ProQuad/M-M-R II
/Varivax 429 96 525 419 100 519 1,097 246 1,343 1,058 215 1,273Pneumovax 23 160 54 214 174 56 229 394 192 586 392 166 558RotaTeq 134 57 191 127 52 179 384 156 540 377 148 525Zostavax (1) 56 54 139 94 234 16 147 163 356 191 547
Hospital Acute Care Bridion 96 120 217 63 122 185 272 389 661 162 333 495Noxafil 89 99 188 78 83 162 257 294 551 220 237 458Invanz 74 62 137 93 66 159 252 185 437 268 177 445Cubicin 55 40 95 41 50 91 150 137 287 148 141 290Cancidas 2 77 79 6 88 94 10 247 257 17 310 327Primaxin 1 71 72 5 68 73 6 206 212 7 199 206
Immunology Simponi — 210 210 — 219 219 — 673 673 — 602 602Remicade — 135 135 — 214 214 — 459 459 — 651 651
Neuroscience Belsomra 23 43 66 27 30 56 76 115 191 72 78 150
Virology Isentress/Isentress HD 123 151 275 143 167 310 383 477 860 422 474 896Zepatier 18 86 104 228 241 468 8 339 347 683 680 1,363
Cardiovascular Zetia 9 157 165 65 255 320 34 662 696 298 723 1,021Vytorin — 92 92 (6) 148 142 11 402 414 114 451 565Atozet — 84 84 — 59 59 — 258 258 — 171 171Adempas — 94 94 — 70 70 — 238 238 — 221 221
Diabetes Januvia 498 429 927 598 414 1,012 1,466 1,291 2,756 1,646 1,153 2,799Janumet 225 339 563 197 316 513 625 1,067 1,693 640 933 1,572
Women’s Health NuvaRing 193 41 234 160 54 214 550 135 686 425 148 573Implanon/Nexplanon 133 53 186 110 45 155 375 160 535 367 137 503
Diversified Brands Singulair 5 156 161 16 145 161 16 505 521 28 522 550Cozaar/Hyzaar 4 99 103 9 119 128 18 330 348 15 345 360Nasonex 7 64 71 (23) 65 42 8 266 274 16 250 266Arcoxia — 83 83 — 80 80 — 249 249 — 272 272Follistim AQ 26 34 60 30 41 72 83 115 198 104 128 232Fosamax 2 42 45 4 48 53 3 155 159 7 173 180Dulera 44 6 50 52 7 59 128 21 149 191 19 210
Other pharmaceutical (1) 317 666 980 266 688 952 877 2,150 3,023 876 2,140 3,017
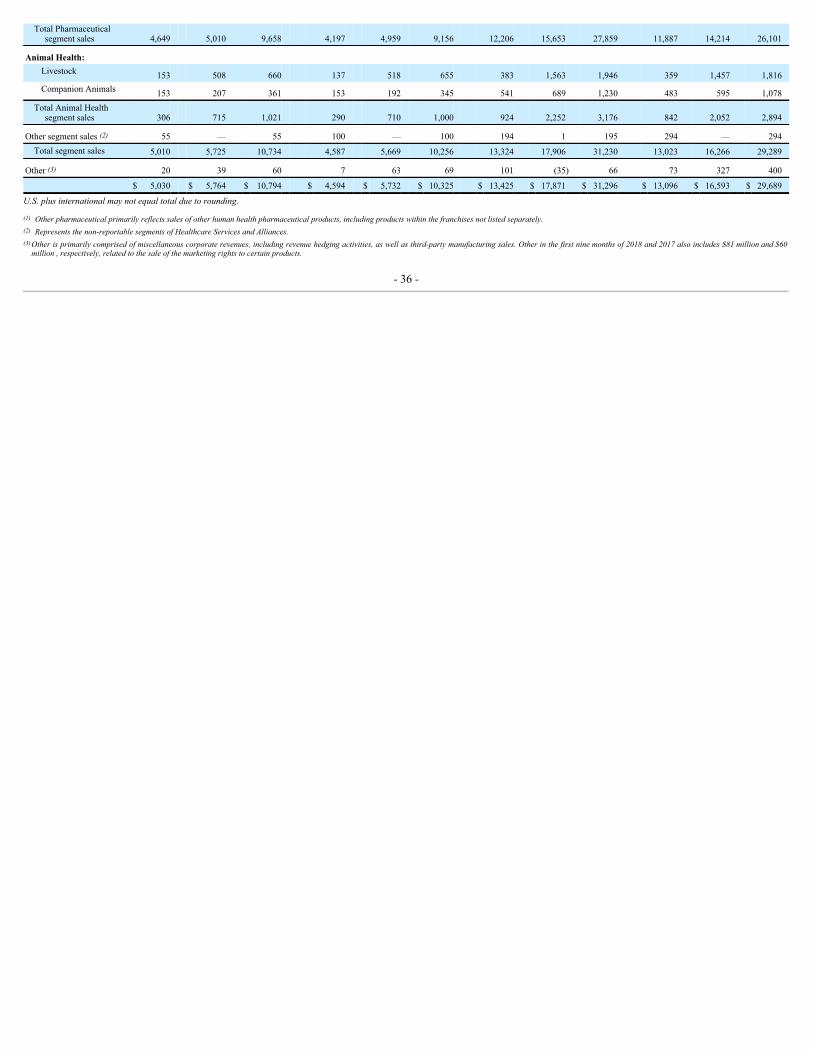
Total Pharmaceuticalsegment sales 4,649 5,010 9,658 4,197 4,959 9,156 12,206 15,653 27,859 11,887 14,214 26,101
Animal Health: Livestock 153 508 660 137 518 655 383 1,563 1,946 359 1,457 1,816Companion Animals 153 207 361 153 192 345 541 689 1,230 483 595 1,078
Total Animal Healthsegment sales 306 715 1,021 290 710 1,000 924 2,252 3,176 842 2,052 2,894
Other segment sales (2) 55 — 55 100 — 100 194 1 195 294 — 294Total segment sales 5,010 5,725 10,734 4,587 5,669 10,256 13,324 17,906 31,230 13,023 16,266 29,289
Other (3) 20 39 60 7 63 69 101 (35) 66 73 327 400 $ 5,030 $ 5,764 $ 10,794 $ 4,594 $ 5,732 $ 10,325 $ 13,425 $ 17,871 $ 31,296 $ 13,096 $ 16,593 $ 29,689
U.S. plus international may not equal total due to rounding.
(1) Other pharmaceutical primarily reflects sales of other human health pharmaceutical products, including products within the franchises not listed separately.(2) Represents the non-reportable segments of Healthcare Services and Alliances.(3)
Other is primarily comprised of miscellaneous corporate revenues, including revenue hedging activities, as well as third-party manufacturing sales. Other in the first nine months of 2018 and 2017 also includes $81 million and $60million , respectively, related to the sale of the marketing rights to certain products.
- 36 -
Product sales are recorded net of the provision for discounts, including chargebacks, which are customer discounts that occur when a contractedcustomer purchases through an intermediary wholesale purchaser, and rebates that are owed based upon definitive contractual agreements or legal requirementswith private sector and public sector (Medicaid and Medicare Part D) benefit providers, after the final dispensing of the product by a pharmacy to a benefit planparticipant. These discounts, in the aggregate, reduced U.S. sales by $2.6 billion and $2.9 billion for the three months ended September 30, 2018 and 2017 ,respectively, and by $7.7 billion and $8.2 billion for the nine months ended September 30, 2018 and 2017 , respectively. Inventory levels at key U.S. wholesalersfor each of the Company’s major pharmaceutical products are generally less than one month.
Pharmaceutical Segment
OncologyKeytruda , an anti-PD-1 therapy, is approved in the United States and in the European Union (EU) as monotherapy for the treatment of certain patients
with non-small-cell lung cancer (NSCLC), melanoma, classical Hodgkin lymphoma (cHL), head and neck squamous cell carcinoma (HNSCC) and urothelialcarcinoma, a type of bladder cancer, and in combination with pemetrexed and carboplatin for certain patients with nonsquamous NSCLC. Keytruda is alsoapproved in the United States as monotherapy for the treatment of certain patients with gastric or gastroesophageal junction adenocarcinoma and microsatelliteinstability-high or mismatch repair deficient cancer. In addition, the U.S. Food and Drug Administration (FDA) recently approved Keytruda for the treatment ofcertain patients with cervical cancer, primary mediastinal large B-cell lymphoma (PMBCL), a type of non-Hodgkin lymphoma, and in combination withcarboplatin and either paclitaxel or nab-paclitaxel for patients with squamous NSCLC (see below). Keytruda is approved in Japan for the treatment of certainpatients with melanoma, NSCLC, cHL, and urothelial carcinoma. Additionally, in July 2018, Keytruda was approved in China for the treatment of adult patientswith unresectable or metastatic melanoma following failure of one prior line of therapy. Keytruda is also approved in many other international markets. TheKeytruda clinical development program includes studies across a broad range of cancer types (see “Research and Development” below).
In August 2018, the FDA approved an expanded label for Keytruda in combination with pemetrexed and platinum chemotherapy for the first-linetreatment of patients with metastatic nonsquamous NSCLC, with no EGFR or ALK genomic tumor aberrations, based on results of the KEYNOTE-189 trial.Keytruda in combination with pemetrexed and carboplatin was first approved in 2017 under the FDA’s accelerated approval process for the first-line treatment ofpatients with metastatic nonsquamous NSCLC, based on tumor response rates and PFS data from a Phase 2 study (KEYNOTE-021, Cohort G1). In accordancewith the accelerated approval process, continued approval was contingent upon verification and description of clinical benefit, which has now been demonstrated inKEYNOTE-189 and has resulted in the FDA converting the accelerated approval to full (regular) approval. Also, in September 2018, the EU approved Keytruda incombination with pemetrexed and platinum chemotherapy for the first-line treatment of metastatic nonsquamous NSCLC in adults whose tumors have no EGFR orALK positive mutations. This is the first approval in Europe for an anti-PD-1 therapy in combination with chemotherapy.
In June 2018, the FDA approved Keytruda for the treatment of patients with recurrent or metastatic cervical cancer with disease progression on or afterchemotherapy whose tumors express PD-L1 as determined by an FDA-approved test. Also in June 2018, the FDA approved Keytruda for the treatment of adult andpediatric patients with refractory PMBCL, or who have relapsed after two or more prior lines of therapy. With this indication, Keytruda becomes the first anti-PD-1therapy to be approved for the treatment of PMBCL. Both of these indications were approved under the FDA’s accelerated approval regulations based on tumorresponse rate and durability of response.
Additionally, in September 2018, the EC approved Keytruda as monotherapy for the treatment of recurrent or metastatic HNSCC in adults whosetumors express PD-L1 with a tumor proportion score (TPS) of ≥50%, and who progressed on or after platinum-containing chemotherapy, based on data from thePhase 3 KEYNOTE-040 trial.
In October 2018, the FDA approved Keytruda , in combination with carboplatin and either paclitaxel or nab-paclitaxel, for the first-line treatment ofpatients with metastatic squamous NSCLC based on results from the KEYNOTE-407 trial. This approval marks the first time an anti-PD-1 regimen has beenapproved for the first-line treatment of squamous NSCLC regardless of tumor PD-L1 expression status. Keytruda is the first anti-PD-1 approved in the first-linesetting as both combination and monotherapy in certain patients with metastatic NSCLC.
Global sales of Keytruda were $1.9 billion in the third quarter of 2018 compared with $1.0 billion in the third quarter of 2017 and were $5.0 billion inthe first nine months of 2018 compared with $2.5 billion for the same period of 2017. Sales growth in both periods was driven by volume growth in all markets asthe Company continues to launch Keytruda with multiple new indications globally. Sales in the United States continue to build across the multiple approvedindications, in particular for the treatment of NSCLC reflecting both the continued adoption of Keytruda in the first-line setting as monotherapy for patients withmetastatic NSCLC whose tumors have high PD-L1 expression, as well as the uptake of Keytruda in combination with pemetrexed and carboplatin, a commonlyused chemotherapy regimen, for the first-line treatment of metastatic nonsquamous NSCLC with or without PD-L1 expression. Other indications, includingHNSCC, bladder, and microsatellite instability-high cancer, also contributed to Keytruda sales growth in the third quarter and first nine months of 2018 . Salesgrowth in international
- 37 -
markets reflects continued uptake for the treatment of NSCLC, as the Company has secured reimbursement in most major markets, along with growth in themelanoma, HNSCC, and bladder cancer indications.
Lynparza, an oral poly (ADP-ribose) polymerase (PARP) inhibitor being developed as part of a collaboration with AstraZeneca PLC (AstraZeneca) (seeNote 4 to the condensed consolidated financial statements), is currently approved for certain types of ovarian and breast cancer. Merck recorded alliance revenue of$49 million and $125 million in the third quarter and first nine months of 2018 , respectively, related to Lynparza. In January 2018, the FDA approved Lynparzafor use in patients with BRCA -mutated, human epidermal growth factor receptor 2 (HER2)-negative metastatic breast cancer who have been previously treatedwith chemotherapy, triggering a $70 million milestone payment from Merck to AstraZeneca. Lynparza was also approved in Japan in July 2018 for use in patientswith unresectable or recurrent BRCA -mutated, HER2-negative breast cancer who have received prior chemotherapy. Lynparza was approved for use as amaintenance therapy in patients with platinum-sensitive relapsed ovarian cancer, regardless of BRCA mutation status in the EU in May 2018 and in Japan inJanuary 2018.
Lenvima, an orally available tyrosine kinase inhibitor being developed as part of a collaboration with Eisai (see Note 4 to the condensed consolidatedfinancial statements), is currently approved for certain types of thyroid cancer, hepatocellular carcinoma, and in combination for certain patients with renal cellcancer. Merck recorded alliance revenue of $43 million and $78 million in the third quarter and first nine months of 2018 , respectively, related to Lenvima.Lenvima was approved for the treatment of certain patients with unresectable hepatocellular carcinoma in Japan in March 2018, in the United States and EU inAugust 2018, and in China in September 2018, triggering capitalized milestone payments of $25 million , $125 million , $50 million , and $25 million ,respectively, to Eisai.
VaccinesWorldwide sales of Gardasil/Gardasil 9, vaccines to help prevent certain cancers and diseases caused by certain types of HPV, were $1.0 billion in the
third quarter of 2018 , an increase of 55% compared with the third quarter of 2017 including a 1% unfavorable effect from foreign exchange. The increase wasdriven primarily by higher sales in the United States attributable to a borrowing from the CDC Pediatric Vaccine Stockpile in the third quarter of 2017 as discussedbelow. The increase in sales of Gardasil/Gardasil 9 during the third quarter of 2018 was also driven by higher demand in most international markets, particularly inChina due to the ongoing launch and in Europe. Global sales of Gardasil/Gardasil 9 were $2.3 billion in the first nine months of 2018, an increase of 38%compared with the same period of 2017 including a 2% favorable effect from foreign exchange. The increase was driven in part by the 2017 CDC stockpileborrowing, as well as by higher demand in the Asia Pacific region, particularly in China, and in Europe. In April 2018, China’s Food and Drug Administrationapproved Gardasil 9 for use in girls and women ages 16 to 26. In October 2018, the FDA approved an expanded age indication for use in women and men ages 27to 45 for the prevention of certain cancers and diseases caused by the nine HPV types covered by the vaccine.
During the third quarter of 2017, the Company made a request to borrow doses of Gardasil 9 from the CDC Pediatric Vaccine Stockpile, which theCDC granted. The Company’s decision to borrow the doses from the CDC was driven in part by the temporary shutdown resulting from the cyber-attack thatoccurred in June 2017, as well as by overall higher demand than expected. As a result of the borrowing, the Company reversed the sales related to the borroweddoses, which reduced revenues by approximately $240 million in the third quarter of 2017, and recognized a corresponding liability. The Company subsequentlyreplenished a portion of the borrowed doses in the fourth quarter of 2017. The net effect of the borrowing and subsequent partial replenishment was a reduction insales of $125 million for the full year of 2017. The Company anticipates it will replenish the remaining borrowed doses in the fourth quarter of 2018.
Global sales of ProQuad (Measles, Mumps, Rubella and Varicella Virus Vaccine Live), a pediatric combination vaccine to help protect againstmeasles, mumps, rubella and varicella, were $186 million in the third quarter of 2018 , an increase of 10% compared with $169 million in the third quarter of 2017. Worldwide sales of ProQuad were $455 million in the first nine months of 2018, an increase of 13% compared with $402 million in the first nine months of 2017.Foreign exchange unfavorably affected global sales performance by 1% in the third quarter of 2018. Sales growth in both periods was driven primarily by highervolumes and pricing in the United States and volume growth in certain European markets.
Worldwide sales of M‑M‑R II (Measles, Mumps and Rubella Virus Vaccine Live), a vaccine to help protect against measles, mumps and rubella, were$121 million for the third quarter of 2018 , a decline of 2% compared with $124 million for the third quarter of 2017 . Global sales of M‑M‑R II were $310 millionin the first nine months of 2018, an increase of 2% compared with $303 million in the first nine months of 2017. Foreign exchange favorably affected global salesperformance by 1% in the third quarter of 2018.
Global sales of Varivax (Varicella Virus Vaccine Live), a vaccine to help prevent chickenpox (varicella), were $217 million for the third quarter of2018 , a decline of 4% compared with $226 million for the third quarter of 2017 . The sales decrease primarily reflects volume declines in Turkey due to the loss ofa government tender, partially offset by volume growth in Latin America. Worldwide sales of Varivax were $578 million in the first nine months of 2018, anincrease of 2% compared with $568 million in the first nine months of 2017. Foreign exchange favorably affected global sales performance by 1% in the first nine
- 38 -
months of 2018. Sales growth in the year-to-date period was largely attributable to volume growth in most international markets, along with higher pricing in theUnited States, partially offset by volume declines in Turkey due to the loss of a government tender.
Global sales of Pneumovax 23 (pneumococcal vaccine polyvalent), a vaccine to help prevent pneumococcal disease, were $214 million in the thirdquarter of 2018 , a decline of 7% compared with the third quarter of 2017 , driven primarily by lower sales in the United States reflecting lower demand, partiallyoffset by higher pricing. Worldwide sales of Pneumovax 23 were $586 million in the first nine months of 2018, an increase of 5% compared with the same periodof 2017, driven primarily by volume growth in Europe. Sales in the United States were relatively flat in the first nine months of 2018 as higher pricing offset lowervolumes. Foreign exchange unfavorably affected global sales performance by 1% in the third quarter of 2018 and favorably affected global sales performance by1% in the first nine months of 2018.
Worldwide sales of RotaTeq (Rotavirus Vaccine, Live Oral, Pentavalent), a vaccine to help protect against rotavirus gastroenteritis in infants andchildren, were $191 million in the third quarter of 2018 , an increase of 7% compared with the third quarter of 2017 including a 1% unfavorable effect from foreignexchange. Sales growth was driven primarily by the launch in China and higher volumes and pricing in the United States. Global sales of RotaTeq were $540million in the first nine months of 2018, up 3% compared with the same period of 2017 including a 1% favorable effect from foreign exchange. Sales growth wasdriven primarily by the launch in China and higher pricing in the United States.
Worldwide sales of Zostavax , a vaccine to help prevent shingles (herpes zoster) in adults 50 years of age and older, were $54 million in the thirdquarter of 2018 and $163 million in the first nine months of 2018, declines of 77% and 70%, respectively, compared with the same periods of 2017 . Foreignexchange favorably affected global sales performance by 1% in the first nine months of 2018. The sales declines were driven by lower volumes in most markets,particularly in the United States. Lower demand in the United States reflects the approval of a competitor’s vaccine that received a preferential recommendationfrom the CDC’s Advisory Committee on Immunization Practices in October 2017 for the prevention of shingles over Zostavax . The Company anticipatescompetition will continue to have a material adverse effect on sales of Zostavax in future periods.
Hospital Acute CareWorldwide sales of Bridion , for the reversal of two types of neuromuscular blocking agents used during surgery, were $217 million in the third quarter
of 2018 , an increase of 17% compared with the third quarter of 2017 including a 3% unfavorable effect from foreign exchange. Global sales of Bridion were $661million in the first nine months of 2018, an increase of 33% compared with the same period of 2017 including a 2% favorable effect from foreign exchange. Salesgrowth in both periods primarily reflects volume growth in the United States and certain European markets.
Worldwide sales of Noxafil , for the prevention of invasive fungal infections, were $188 million in the third quarter of 2018 , an increase of 16%compared with the third quarter of 2017 including a 2% unfavorable effect from foreign exchange. Global sales of Noxafil were $551 million in the first ninemonths of 2018, an increase of 21% compared with the same period of 2017 including a 3% favorable effect from foreign exchange. Sales growth in both periodsprimarily reflects higher demand in the United States, as well as volume growth in certain European markets and in China.
Global sales of Invanz (ertapenem sodium), for the treatment of certain infections, were $137 million in the third quarter of 2018 , a decline of 14%compared with the third quarter of 2017 including a 2% unfavorable effect from foreign exchange. Worldwide sales of Invanz were $437 million for the first ninemonths of 2018, a decrease of 2% compared with the same period of 2017 . The sales declines were driven primarily by lower volumes in the United States. Thepatent that provided U.S. market exclusivity for Invanz expired in November 2017 and the Company is experiencing a decline in U.S. Invanz sales as a result ofgeneric competition and expects the decline to continue.
Global sales of Cancidas (caspofungin acetate), an anti-fungal product sold primarily outside of the United States, were $79 million in the third quarterof 2018 and $257 million in the first nine months of 2018, declines of 16% and 22%, respectively, compared with the same periods of 2017. Foreign exchangeunfavorably affected global sales performance by 2% in the third quarter of 2018 and favorably affected global sales performance by 3% in the first nine months of2018. The sales declines were driven by generic competition in certain European markets. The EU compound patent for Cancidas expired in April 2017.Accordingly, the Company is experiencing a significant decline in Cancidas sales in these European markets and expects the decline to continue.
In September 2018, Merck announced that the pivotal Phase 3 clinical study evaluating the Company’s antibiotic Zerbaxa (ceftolozane andtazobactam) at an investigational dose for the treatment of adult patients with either ventilated hospital-acquired bacterial pneumonia or ventilator-associatedbacterial pneumonia met the pre-specified primary endpoints, demonstrating non-inferiority to meropenem, the active comparator, in day 28 all-cause mortality andin clinical cure rate at the test-of-cure visit. Based on these results, Merck plans to submit supplemental new drug applications to the FDA and European MedicinesAgency (EMA) seeking regulatory approval of Zerbaxa for these potential new indications. Zerbaxa is currently approved in the United States for the treatment ofadult patients with complicated urinary tract infections caused by certain Gram-negative microorganisms
- 39 -
and in combination with metronidazole for the treatment of complicated intra-abdominal infections caused by certain Gram-negative and Gram-positivemicroorganisms.
ImmunologySales of Simponi (golimumab), a once-monthly subcutaneous treatment for certain inflammatory diseases (marketed by the Company in Europe, Russia
and Turkey), were $210 million in the third quarter of 2018 , a decline of 4% compared with the third quarter of 2017 including a 1% unfavorable effect fromforeign exchange. The sales decline reflects lower pricing, partially offset by higher volumes in Europe. Sales of Simponi were $673 million in the first ninemonths of 2018 , growth of 12% compared with the same period of 2017 including a 7% favorable effect from foreign exchange. Sales growth was driven byvolume growth in Europe.
Sales of Remicade, a treatment for inflammatory diseases (marketed by the Company in Europe, Russia and Turkey), were $135 million in the thirdquarter of 2018 and $459 million in the first nine months of 2018, declines of 37% and 29%, respectively, compared with the same periods of 2017 . Foreignexchange unfavorably affected global sales performance by 2% in the third quarter of 2018 and favorably affected global sales performance by 4% in the first ninemonths of 2018. The Company lost market exclusivity for Remicade in major European markets in 2015 and no longer has market exclusivity in any of itsmarketing territories. The Company is experiencing pricing and volume declines in these markets as a result of biosimilar competition and expects the declines tocontinue.
VirologyGlobal sales of Isentress/Isentress HD (raltegravir), an HIV integrase inhibitor for use in combination with other antiretroviral agents for the treatment
of HIV-1 infection, were $275 million in the third quarter of 2018 , a decline of 11% compared with the third quarter of 2017 including a 2% unfavorable effectfrom foreign exchange. Worldwide sales of Isentress/Isentress HD were $860 million in the first nine months of 2018 , a decline of 4% compared with the sameperiod of 2017 including a 1% favorable effect from foreign exchange. The sales declines were driven primarily by lower demand in the United States andcompetitive pricing pressure and lower volumes in Europe.
In August 2018, the FDA approved two new HIV-1 medicines: Delstrigo , a once-daily fixed-dose combination tablet of doravirine, lamivudine andtenofovir disoproxil fumarate; and Pifeltro (doravirine), a new non-nucleoside reverse transcriptase inhibitor to be administered in combination with otherantiretroviral medicines. Both Delstrigo and Pifeltro are indicated for the treatment of HIV-1 infection in adult patients with no prior antiretroviral treatmentexperience. In September 2018, the Committee for Medicinal Products for Human Use (CHMP) of the EMA adopted a positive opinion recommending granting ofmarketing authorization for Delstrigo and Pifeltro . These two recommendations will now be reviewed by the European Commission (EC) for marketingauthorization in the EU.
Global sales of Zepatier , a treatment for adult patients with certain types of chronic HCV infection, were $104 million in the third quarter of 2018 and$347 million in the first nine months of 2018, declines of 78% and 75%, respectively, compared with the same periods of 2017 . Foreign exchange unfavorablyaffected global sales performance by 1% in the third quarter of 2018 and favorably affected global sales performance by 1% in the first nine months of 2018. Thesales declines were driven primarily by the unfavorable effects of increasing competition and declining patient volumes, particularly in the United States, Europeand Japan. The Company anticipates that sales of Zepatier in the future will continue to be materially adversely affected by competition and lower patient volumes.
CardiovascularCombined global sales of Zetia (marketed in most countries outside the United States as Ezetrol ), Vytorin (marketed outside the United States as Inegy
), as well as Atozet (ezetimibe and atorvastatin) and Rosuzet (ezetimibe and rosuvastatin) (both marketed in certain countries outside of the United States),medicines for lowering LDL cholesterol, were $353 million in the third quarter of 2018 , a decline of 34% compared with the third quarter of 2017 including a 1%unfavorable effect from foreign exchange. The sales decline in the third quarter was driven primarily by lower sales in Europe, as well as in the United States. TheCompany lost market exclusivity in major European markets for Ezetrol in April 2018 and has also lost market exclusivity in certain European markets for Inegy(see Note 9 to the condensed consolidated financial statements). Accordingly, the Company is experiencing sales declines in these markets as a result of genericcompetition and expects the declines to continue. In addition, Zetia and Vytorin lost market exclusivity in the United States in December 2016 and April 2017,respectively. Accordingly, the Company experienced a rapid and substantial decline in U.S. Zetia and Vytorin sales as a result of generic competition and has lostnearly all U.S. sales of these products. Combined global sales of the ezetimibe family were $1.4 billion in the first nine months of 2018, a decline of 21% comparedwith the same period of 2017 including a 4% favorable effect from foreign exchange. The sales decline primarily reflects lower volumes and pricing of Zetia andVytorin in the United States, as well as in certain European markets as a result of generic competition. These declines were partially offset by higher sales in Japandue in part to the launch of Atozet .
- 40 -
Pursuant to a collaboration with Bayer AG (Bayer) (see Note 4 to the condensed consolidated financial statements), Merck has lead commercial rightsfor Adempas (riociguat), a cardiovascular drug for the treatment of pulmonary arterial hypertension, in countries outside the Americas while Bayer has lead rightsin the Americas, including the United States. The companies share profits equally under the collaboration. In 2016, Merck began promoting and distributingAdempas in Europe. Transition from Bayer in other Merck territories, including Japan, continued in 2017. Revenue from Adempas includes sales in Merck’smarketing territories, as well as Merck’s share of profits from the sale of Adempas in Bayer’s marketing territories. Merck recorded sales related to Adempas of$94 million in the third quarter of 2018, an increase of 35% compared with the third quarter of 2017. Sales growth in the third quarter reflects higher sales inMerck’s marketing territories and higher profit sharing from Bayer. Merck recorded sales related to Adempas of $238 million in the first nine months of 2018,growth of 7% compared with the same period of 2017 including a 3% favorable effect from foreign exchange. Sales growth in the first nine months of 2018 reflectshigher sales in Merck’s marketing territories, partially offset by lower profit sharing from Bayer, due in part to lower pricing in the United States.
DiabetesWorldwide combined sales of Januvia (sitagliptin) and Janumet (sitagliptin/metformin HCl), medicines that help lower blood sugar levels in adults with
type 2 diabetes, were $1.5 billion in the third quarter of 2018 , a decline of 2% compared with the third quarter of 2017 including a 1% unfavorable effect fromforeign exchange. Global combined sales of Januvia and Janumet were $4.4 billion in the first nine months of 2018, essentially flat compared with the same periodof 2017 excluding a 2% favorable effect from foreign exchange. Sales performance in both periods reflects continued pricing pressure, particularly in the UnitedStates, partially offset by higher demand globally. The Company expects pricing pressure to continue.
Women’s Health Worldwide sales of NuvaRing (etonogestrel/ethinyl estradiol vaginal ring), a vaginal contraceptive product, were $234 million in the third quarter of
2018 and $686 million in the first nine months of 2018 , increases of 9% and 20%, respectively, compared with the same periods of 2017 . Foreign exchangeunfavorably affected global sales performance by 1% in the third quarter of 2018 and favorably affected global sales performance by 1% in first nine months of2018. Sales growth in both periods was driven primarily by higher pricing in the United States. The patent that provided U.S. market exclusivity for NuvaRingexpired in April 2018 and the Company anticipates a significant decline in U.S. NuvaRing sales in future periods as a result of generic competition.
Animal Health Segment
Animal Health includes pharmaceutical and vaccine products for the prevention, treatment and control of disease in all major farm and companionanimal species. The Animal Health segment met the criteria for separate reporting and became a reportable segment in the first quarter of 2018. Animal Healthsales are affected by competition and the frequent introduction of generic products. Global sales of Animal Health products totaled $1.0 billion for the third quarterof 2018 , an increase of 2% compared with the third quarter of 2017 including a 4% unfavorable effect from foreign exchange. Worldwide sales of Animal Healthproducts totaled $3.2 billion for the first nine months of 2018 , an increase of 10% compared with the same period of 2017 including a 2% favorable effect fromforeign exchange. Sales growth in both periods was driven by higher sales of companion animal products, primarily the Bravecto (fluralaner) line of products thatkill fleas and ticks in dogs and cats for up to 12 weeks, due in part to the timing of customer purchases and a delayed flea and tick season, as well as higher sales oflivestock products, including ruminant and poultry products.
Costs, Expenses and Other
Materials and ProductionMaterials and production costs were $3.6 billion for the third quarter of 2018 , an increase of 9% compared with the third quarter of 2017 and were
$10.2 billion for the first nine months of 2018, an increase of 8% compared with the same period of 2017. Costs in the third quarter and first nine months of 2018include a $420 million aggregate charge related to the termination of a collaboration agreement with Samsung Bioepis Co., Ltd. (Samsung) (see Note 3 to thecondensed consolidated financial statements). Additionally, costs in the third quarter of 2018 and 2017 include $679 million and $765 million, respectively, and forthe first nine months of 2018 and 2017 include $2.1 billion and $2.3 billion, respectively, of expenses for the amortization of intangible assets recorded inconnection with business acquisitions. Also, in the first nine months of 2018, the Company recorded $135 million of cumulative amortization expense for amountscapitalized in connection with the recognition of liabilities for potential future milestone payments related to collaborations (see Note 4 to the condensedconsolidated financial statements). In addition, costs in the first nine months of 2017 include $123 million of intangible asset impairment charges, including $47million related to a marketed product (see Note 8 to the condensed consolidated financial statements) and $76 million related to a licensing agreement. TheCompany may recognize additional non-cash impairment charges in the future related to intangible assets that were measured at fair value and capitalized inconnection with business acquisitions and such charges could be material. Also included in materials and production costs are expenses associated withrestructuring activities which amounted to $2 million and
- 41 -
$25 million in the third quarter of 2018 and 2017 , respectively, and $11 million and $121 million for the first nine months of 2018 and 2017, respectively,including accelerated depreciation and asset write-offs related to the planned sale or closure of manufacturing facilities. Separation costs associated withmanufacturing-related headcount reductions have been incurred and are reflected in Restructuring costs as discussed below.
Gross margin was 66.5% in the third quarter of 2018 compared with 68.0% in the third quarter of 2017 and was 67.3% for the first nine months of 2018compared with 68.1% in the first nine months of 2017. The declines in gross margin primarily reflect an aggregate charge recorded in conjunction with thetermination of a collaboration agreement with Samsung as noted above. The gross margin decline in the year-to-date period also reflects cumulative amortizationexpense for potential future milestone payments related to collaborations also as noted above. The gross margin declines were partially offset by the favorableeffects of foreign exchange and the amortization of unfavorable manufacturing variances recorded in the third quarter of 2017, resulting in part from the June 2017cyber-attack. The gross margin declines in both periods were also partially offset by lower net impacts from the amortization of intangible assets related to businessacquisitions, intangible asset impairment charges and restructuring costs as noted above, which unfavorably affected gross margin by 6.3 percentage points in thethird quarter of 2018 compared with 7.7 percentage points in the third quarter of 2017 and by 6.9 percentage points in the first nine months of 2018 compared with8.7 percentage points in the first nine months of 2017.
Marketing and AdministrativeMarketing and administrative (M&A) expenses were $2.4 billion in the third quarter of 2018 , a decline of 1% compared with the third quarter of 2017 ,
reflecting lower selling and promotional costs and the favorable effects of foreign exchange, partially offset by higher administrative costs. M&A expenses were$7.5 billion for the first nine months of 2018, up slightly compared with the same period of 2017 . The increase primarily reflects higher administrative costs andthe unfavorable effects of foreign exchange, offset by lower promotional and selling expenses.
Research and DevelopmentResearch and development (R&D) expenses were $2.1 billion for the third quarter of 2018 , a decline of 53% compared with the third quarter of 2017 .
The decline primarily reflects an aggregate charge recorded in third quarter of 2017 related to the formation of an oncology collaboration with AstraZeneca andlower in-process research and development (IPR&D) impairment charges, partially offset by increased clinical development spending, in particular for oncology,higher licensing costs and investment in discovery and early drug development. R&D expenses were $7.5 billion for the first nine months of 2018, a decline of 6%compared with the same period of 2017. The decline primarily reflects an aggregate charge recorded in the first nine months of 2017 related to the formation of anoncology collaboration with AstraZeneca and lower IPR&D impairment charges, partially offset by an aggregate charge in the first nine months of 2018 related tothe formation of an oncology collaboration with Eisai, a charge for the acquisition of Viralytics, as well as higher clinical development spending and investment indiscovery and early drug development.
R&D expenses are comprised of the costs directly incurred by Merck Research Laboratories (MRL), the Company’s research and development divisionthat focuses on human health-related activities, which were $1.3 billion and $1.1 billion in the third quarter of 2018 and 2017 , respectively, and were $3.7 billionand $3.4 billion for the first nine months of 2018 and 2017, respectively. Also included in R&D expenses are costs incurred by other divisions in support of R&Dactivities, including depreciation, production and general and administrative, as well as licensing activity, and certain costs from operating segments, including thePharmaceutical and Animal Health segments, which in the aggregate were approximately $775 million and $670 million for the third quarter of 2018 and 2017 ,respectively, and were $2.1 billion and $2.0 billion for the first nine months of 2018 and 2017, respectively. Additionally, R&D expenses in the first nine months of2018 include a $1.4 billion aggregate charge related to the formation of an oncology collaboration with Eisai (see Note 4 to the condensed consolidated financialstatements), as well as a $344 million charge for the acquisition of Viralytics (see Note 3 to the condensed consolidated financial statements). R&D expenses in thethird quarter and first nine months of 2017 include a $2.35 billion aggregate charge related to the formation of an oncology collaboration with AstraZeneca (seeNote 4 to the condensed consolidated financial statements). R&D expenses also include IPR&D impairment charges of $245 million and $253 million for the thirdquarter and first nine months of 2017, respectively (see Note 8 to the condensed consolidated financial statements). The Company may recognize additional non-cash impairment charges in the future related to the cancellation or delay of other pipeline programs that were measured at fair value and capitalized in connectionwith business acquisitions and such charges could be material.
Restructuring CostsIn 2010 and 2013, the Company commenced actions under global restructuring programs designed to streamline its cost structure. The actions under
these programs include the elimination of positions in sales, administrative and headquarters organizations, as well as the sale or closure of certain manufacturingand research and development sites and the consolidation of office facilities. The Company also continues to reduce its global real estate footprint and improve theefficiency of its manufacturing and supply network.
- 42 -
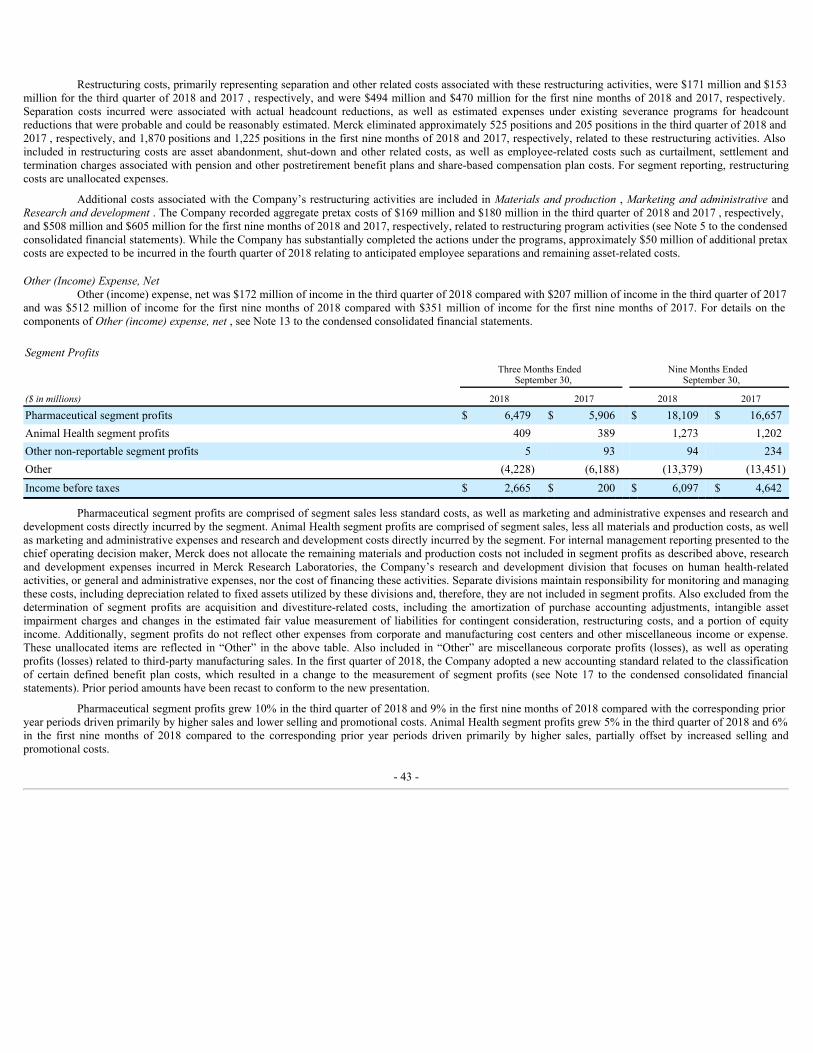
Restructuring costs, primarily representing separation and other related costs associated with these restructuring activities, were $171 million and $153million for the third quarter of 2018 and 2017 , respectively, and were $494 million and $470 million for the first nine months of 2018 and 2017, respectively.Separation costs incurred were associated with actual headcount reductions, as well as estimated expenses under existing severance programs for headcountreductions that were probable and could be reasonably estimated. Merck eliminated approximately 525 positions and 205 positions in the third quarter of 2018 and2017 , respectively, and 1,870 positions and 1,225 positions in the first nine months of 2018 and 2017, respectively, related to these restructuring activities. Alsoincluded in restructuring costs are asset abandonment, shut-down and other related costs, as well as employee-related costs such as curtailment, settlement andtermination charges associated with pension and other postretirement benefit plans and share-based compensation plan costs. For segment reporting, restructuringcosts are unallocated expenses.
Additional costs associated with the Company’s restructuring activities are included in Materials and production , Marketing and administrative andResearch and development . The Company recorded aggregate pretax costs of $169 million and $180 million in the third quarter of 2018 and 2017 , respectively,and $508 million and $605 million for the first nine months of 2018 and 2017, respectively, related to restructuring program activities (see Note 5 to the condensedconsolidated financial statements). While the Company has substantially completed the actions under the programs, approximately $50 million of additional pretaxcosts are expected to be incurred in the fourth quarter of 2018 relating to anticipated employee separations and remaining asset-related costs.
Other (Income) Expense, NetOther (income) expense, net was $172 million of income in the third quarter of 2018 compared with $207 million of income in the third quarter of 2017
and was $512 million of income for the first nine months of 2018 compared with $351 million of income for the first nine months of 2017. For details on thecomponents of Other (income) expense, net , see Note 13 to the condensed consolidated financial statements.
Segment Profits
Three Months Ended
September 30, Nine Months Ended
September 30,
($ in millions) 2018 2017 2018 2017
Pharmaceutical segment profits $ 6,479 $ 5,906 $ 18,109 $ 16,657Animal Health segment profits 409 389 1,273 1,202Other non-reportable segment profits 5 93 94 234Other (4,228) (6,188) (13,379) (13,451)Income before taxes $ 2,665 $ 200 $ 6,097 $ 4,642
Pharmaceutical segment profits are comprised of segment sales less standard costs, as well as marketing and administrative expenses and research anddevelopment costs directly incurred by the segment. Animal Health segment profits are comprised of segment sales, less all materials and production costs, as wellas marketing and administrative expenses and research and development costs directly incurred by the segment. For internal management reporting presented to thechief operating decision maker, Merck does not allocate the remaining materials and production costs not included in segment profits as described above, researchand development expenses incurred in Merck Research Laboratories, the Company’s research and development division that focuses on human health-relatedactivities, or general and administrative expenses, nor the cost of financing these activities. Separate divisions maintain responsibility for monitoring and managingthese costs, including depreciation related to fixed assets utilized by these divisions and, therefore, they are not included in segment profits. Also excluded from thedetermination of segment profits are acquisition and divestiture-related costs, including the amortization of purchase accounting adjustments, intangible assetimpairment charges and changes in the estimated fair value measurement of liabilities for contingent consideration, restructuring costs, and a portion of equityincome. Additionally, segment profits do not reflect other expenses from corporate and manufacturing cost centers and other miscellaneous income or expense.These unallocated items are reflected in “Other” in the above table. Also included in “Other” are miscellaneous corporate profits (losses), as well as operatingprofits (losses) related to third-party manufacturing sales. In the first quarter of 2018, the Company adopted a new accounting standard related to the classificationof certain defined benefit plan costs, which resulted in a change to the measurement of segment profits (see Note 17 to the condensed consolidated financialstatements). Prior period amounts have been recast to conform to the new presentation.
Pharmaceutical segment profits grew 10% in the third quarter of 2018 and 9% in the first nine months of 2018 compared with the corresponding prioryear periods driven primarily by higher sales and lower selling and promotional costs. Animal Health segment profits grew 5% in the third quarter of 2018 and 6%in the first nine months of 2018 compared to the corresponding prior year periods driven primarily by higher sales, partially offset by increased selling andpromotional costs.
- 43 -

Taxes on IncomeThe effective income tax rates of 26.5% and 125.5% for the third quarter of 2018 and 2017 , respectively, and 27.6% and 25.5% for the first nine
months of 2018 and 2017, respectively, reflect the impacts of acquisition and divestiture-related costs and restructuring costs, partially offset by the beneficialimpact of foreign earnings. In addition, the effective income tax rates for the third quarter and first nine months of 2018 reflect the unfavorable impact of a $420million aggregate pretax charge related to the termination of a collaboration agreement with Samsung for which no tax benefit was recognized. The effectiveincome tax rate for the first nine months of 2018 also reflects the unfavorable impact of a $1.4 billion aggregate pretax charge recorded in connection with theformation of an oncology collaboration with Eisai for which no tax benefit was recognized. In addition, the effective income tax rates for the third quarter and firstnine months of 2017 reflect the unfavorable impact of a $2.35 billion aggregate pretax charge recorded in connection with the formation of an oncologycollaboration with AstraZeneca for which no tax benefit was recognized, partially offset by the favorable impact of a net tax benefit of $234 million related to thesettlement of certain federal income tax issues (discussed below). The effective income tax rate for the first nine months of 2017 also reflects a benefit of $88million related to the settlement of a state income tax issue.
In the third quarter of 2017, the Internal Revenue Service (IRS) concluded its examinations of Merck’s 2006-2011 U.S. federal income tax returns. As aresult, the Company was required to make a payment of approximately $2.8 billion . The Company’s reserves for unrecognized tax benefits for the years underexamination exceeded the adjustments relating to this examination period and therefore the Company recorded a net $234 million tax benefit in the third quarter of2017. This net benefit reflects reductions in reserves for unrecognized tax benefits for tax positions relating to the years that were under examination, partiallyoffset by additional reserves for tax positions not previously reserved for, as well as adjustments to reserves for unrecognized tax benefits relating to years whichremain open to examination that are affected by this settlement.
Net Income (Loss) and Earnings (Loss) per Common ShareNet income (loss) attributable to Merck & Co., Inc. was $2.0 billion for the third quarter of 2018 compared with $(56) million for the third quarter of
2017 and was $4.4 billion for the first nine months of 2018 compared with $3.4 billion for the first nine months of 2017. Earnings (loss) per common shareassuming dilution attributable to Merck & Co., Inc. common shareholders (EPS) for the third quarter of 2018 were $0.73 compared with $(0.02) in the third quarterof 2017 and were $1.63 for the first nine months of 2018 compared with $1.25 for the first nine months of 2017.
Non-GAAP Income and Non-GAAP EPSNon-GAAP income and non-GAAP EPS are alternative views of the Company’s performance that Merck is providing because management believes
this information enhances investors’ understanding of the Company’s results as it permits investors to understand how management assesses performance. Non-GAAP income and non-GAAP EPS exclude certain items because of the nature of these items and the impact that they have on the analysis of underlying businessperformance and trends. The excluded items (which should not be considered non-recurring) consist of acquisition and divestiture-related costs, restructuring costsand certain other items. These excluded items are significant components in understanding and assessing financial performance. Non-GAAP income and non-GAAP EPS are important internal measures for the Company. Senior management receives a monthly analysis of operating results that includes non-GAAP EPS.Management uses these measures internally for planning and forecasting purposes and to measure the performance of the Company along with other metrics.Senior management’s annual compensation is derived in part using non-GAAP income and non-GAAP EPS. Since non-GAAP income and non-GAAP EPS are notmeasures determined in accordance with GAAP, they have no standardized meaning prescribed by GAAP and, therefore, may not be comparable to the calculationof similar measures of other companies. The information on non-GAAP income and non-GAAP EPS should be considered in addition to, but not as a substitute foror superior to, net income and EPS prepared in accordance with generally accepted accounting principles in the United States (GAAP).
- 44 -
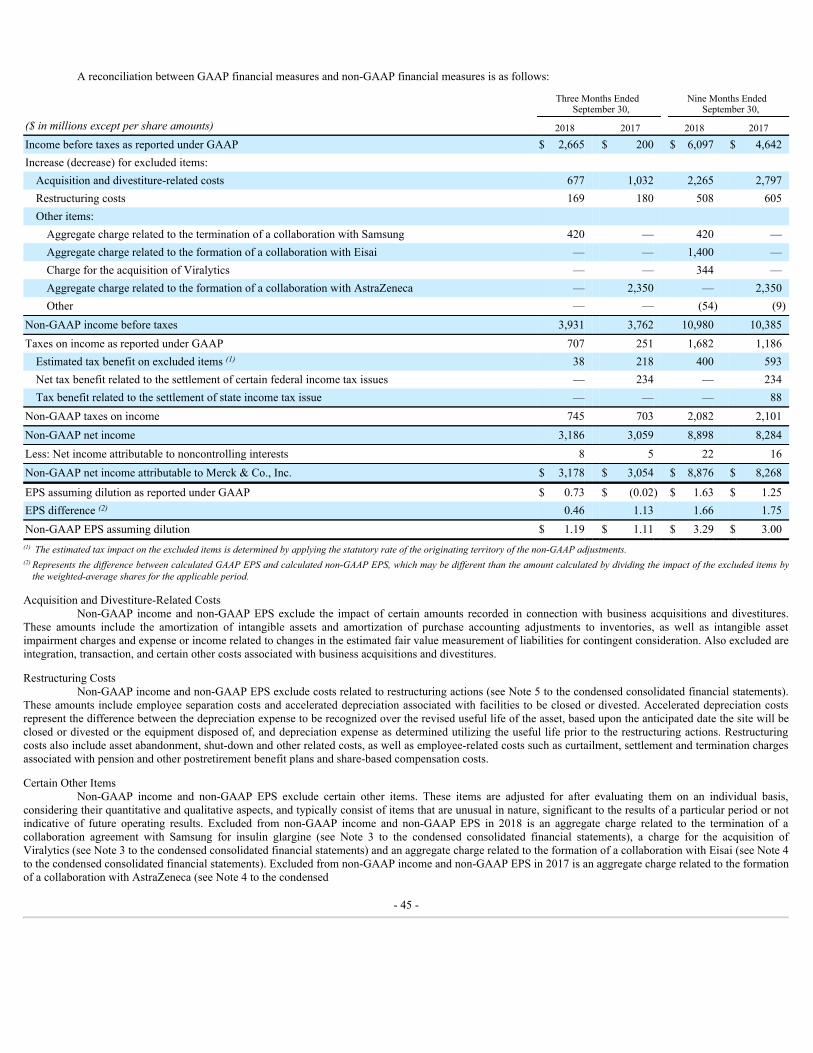
A reconciliation between GAAP financial measures and non-GAAP financial measures is as follows:
Three Months Ended
September 30, Nine Months Ended
September 30,
($ in millions except per share amounts) 2018 2017 2018 2017
Income before taxes as reported under GAAP $ 2,665 $ 200 $ 6,097 $ 4,642Increase (decrease) for excluded items:
Acquisition and divestiture-related costs 677 1,032 2,265 2,797Restructuring costs 169 180 508 605Other items:
Aggregate charge related to the termination of a collaboration with Samsung 420 — 420 —Aggregate charge related to the formation of a collaboration with Eisai — — 1,400 —Charge for the acquisition of Viralytics — — 344 —Aggregate charge related to the formation of a collaboration with AstraZeneca — 2,350 — 2,350Other — — (54) (9)
Non-GAAP income before taxes 3,931 3,762 10,980 10,385Taxes on income as reported under GAAP 707 251 1,682 1,186
Estimated tax benefit on excluded items (1) 38 218 400 593Net tax benefit related to the settlement of certain federal income tax issues — 234 — 234Tax benefit related to the settlement of state income tax issue — — — 88
Non-GAAP taxes on income 745 703 2,082 2,101Non-GAAP net income 3,186 3,059 8,898 8,284Less: Net income attributable to noncontrolling interests 8 5 22 16Non-GAAP net income attributable to Merck & Co., Inc. $ 3,178 $ 3,054 $ 8,876 $ 8,268
EPS assuming dilution as reported under GAAP $ 0.73 $ (0.02) $ 1.63 $ 1.25EPS difference (2) 0.46 1.13 1.66 1.75Non-GAAP EPS assuming dilution $ 1.19 $ 1.11 $ 3.29 $ 3.00
(1) The estimated tax impact on the excluded items is determined by applying the statutory rate of the originating territory of the non-GAAP adjustments.(2)
Represents the difference between calculated GAAP EPS and calculated non-GAAP EPS, which may be different than the amount calculated by dividing the impact of the excluded items bythe weighted-average shares for the applicable period.
Acquisition and Divestiture-Related CostsNon-GAAP income and non-GAAP EPS exclude the impact of certain amounts recorded in connection with business acquisitions and divestitures.
These amounts include the amortization of intangible assets and amortization of purchase accounting adjustments to inventories, as well as intangible assetimpairment charges and expense or income related to changes in the estimated fair value measurement of liabilities for contingent consideration. Also excluded areintegration, transaction, and certain other costs associated with business acquisitions and divestitures.
Restructuring CostsNon-GAAP income and non-GAAP EPS exclude costs related to restructuring actions (see Note 5 to the condensed consolidated financial statements).
These amounts include employee separation costs and accelerated depreciation associated with facilities to be closed or divested. Accelerated depreciation costsrepresent the difference between the depreciation expense to be recognized over the revised useful life of the asset, based upon the anticipated date the site will beclosed or divested or the equipment disposed of, and depreciation expense as determined utilizing the useful life prior to the restructuring actions. Restructuringcosts also include asset abandonment, shut-down and other related costs, as well as employee-related costs such as curtailment, settlement and termination chargesassociated with pension and other postretirement benefit plans and share-based compensation costs.
Certain Other ItemsNon-GAAP income and non-GAAP EPS exclude certain other items. These items are adjusted for after evaluating them on an individual basis,
considering their quantitative and qualitative aspects, and typically consist of items that are unusual in nature, significant to the results of a particular period or notindicative of future operating results. Excluded from non-GAAP income and non-GAAP EPS in 2018 is an aggregate charge related to the termination of acollaboration agreement with Samsung for insulin glargine (see Note 3 to the condensed consolidated financial statements), a charge for the acquisition ofViralytics (see Note 3 to the condensed consolidated financial statements) and an aggregate charge related to the formation of a collaboration with Eisai (see Note 4to the condensed consolidated financial statements). Excluded from non-GAAP income and non-GAAP EPS in 2017 is an aggregate charge related to the formationof a collaboration with AstraZeneca (see Note 4 to the condensed
- 45 -
consolidated financial statements), as well as a net tax benefit related to the settlement of certain federal income tax issues and a tax benefit related to the settlementof a state income tax issue (see Note 14 to the condensed consolidated financial statements).
Research and Development Update
Keytruda is an FDA-approved anti-PD-1 therapy in clinical development for expanded indications in different cancer types.
In October 2018, the FDA approved Keytruda in combination with carboplatin-paclitaxel or nab-paclitaxel as a first-line treatment for metastaticsquamous NSCLC, regardless of PD-L1 expression. This approval was based on data from the Phase 3 KEYNOTE-407 trial, which were presented at the AmericanSociety of Clinical Oncology (ASCO) 2018 Annual Meeting. Keytruda is under review for this indication in the EU.
In September 2018, the FDA accepted and granted Priority Review for a supplemental Biologics License Application (sBLA) seeking approval forKeytruda as monotherapy for first-line treatment of locally advanced or metastatic nonsquamous or squamous NSCLC in patients whose tumors express PD-L1(TPS ≥1%) without EGFR or ALK genomic tumor aberrations. The application is based on data from the pivotal Phase 3 KEYNOTE-042 trial. Data from thetrial were presented at the ASCO 2018 Annual Meeting. The FDA set a Prescription Drug User Fee Act (PDUFA) date of January 11, 2019.
Also in July 2018, the FDA accepted and granted Priority Review for an sBLA seeking approval for Keytruda for previously treated patients withadvanced hepatocellular carcinoma. This sBLA, which is seeking accelerated approval for this new indication, is based on data from the Phase 2 KEYNOTE-224trial, which were presented at the ASCO 2018 Annual Meeting and published simultaneously in The Lancet Oncology. The FDA set a PDUFA date of November 9,2018.
Also, in September 2018, the FDA accepted and granted Priority Review for an sBLA seeking accelerated approval for Keytruda for the treatment ofadult and pediatric patients with recurrent locally advanced or metastatic Merkel cell carcinoma, a rare form of skin cancer. This sBLA is based on data from thePhase 2 KEYNOTE-017 trial including overall response rate and duration of response; these data were presented at the ASCO 2018 Annual Meeting. The FDA seta PDUFA date of December 28, 2018.
In June 2018, the FDA accepted for standard review an sBLA for Keytruda as adjuvant therapy in the treatment of patients with resected, high-riskstage III melanoma and granted a PDUFA date of February 16, 2019. This sBLA is based on a significant benefit in recurrence-free survival demonstrated byKeytruda in the pivotal Phase 3 EORTC1325/KEYNOTE-054 trial, which was conducted in collaboration with the European Organisation for Research andTreatment of Cancer (EORTC). These data were presented at the American Association of Cancer Research 2018 Annual Meeting and published in The NewEngland Journal of Medicine . In October 2018, the CHMP of the EMA adopted a positive opinion recommending approval of Keytruda as adjuvant therapy in thetreatment of patients with melanoma with lymph node involvement who have undergone complete surgical resection based on data from theEORTC1325/KEYNOTE-054 trial. The CHMP’s recommendation will now be reviewed by the EC for marketing authorization in EU. A final decision is expectedin the fourth quarter of 2018.
In addition, Keytruda has received Breakthrough Therapy designation from the FDA in combination with axitnib as a first-line treatment for patientswith advanced or metastatic renal cell carcinoma; and for the treatment of high-risk early-stage triple-negative breast cancer in combination with neoadjuvantchemotherapy. Also, the FDA granted Breakthrough Therapy designation for Keytruda in combination with Lenvima for the potential treatment of patients withadvanced and/or metastatic renal cell carcinoma and for the potential treatment of certain patients with advanced and/or metastatic non-microsatellite instabilityhigh/proficient mismatch repair endometrial carcinoma. The Lenvima and Keytruda combination therapy is being jointly developed by Merck and Eisai. TheFDA’s Breakthrough Therapy designation is intended to expedite the development and review of a candidate that is planned for use, alone or in combination, totreat a serious or life-threatening disease or condition when preliminary clinical evidence indicates that the drug may demonstrate substantial improvement overexisting therapies on one or more clinically significant endpoints.
In October 2018, Merck announced the first presentation of interim data from the pivotal Phase 3 KEYNOTE-048 trial investigating Keytruda , as bothmonotherapy and in combination with chemotherapy, for the first-line treatment of recurrent or metastatic HNSCC. These interim results were presented at theESMO 2018 Congress. Interim data from KEYNOTE-048 showed Keytruda monotherapy improved overall survival (OS), a primary endpoint of the study, by 39%in patients whose tumors expressed PD-L1 with Combined Positive Score (CPS) ≥20, and by 22% in patients with CPS≥1, compared to the EXTREME regimen(cetuximab with carboplatin or cisplatin plus 5-fluorouracil (5-FU), the current standard of care. In addition , Keytruda in combination with chemotherapy(carboplatin or cisplatin plus 5-FU) ( Keytruda combination) demonstrated improved OS compared to the EXTREME regimen by 23%, regardless of PD-L1expression. At the final analysis, superiority for OS will be evaluated for Keytruda monotherapy in the total population and Keytruda combination in patientswhose tumors express PD-L1 at CPS≥20 and CPS≥1; at this interim analysis, based upon the prespecified testing algorithm, non-inferiority for Keytrudamonotherapy in the total population was demonstrated and statistical significance was not achieved for the Keytruda combination in the subset of patients whosetumors expressed PD-L1 at CPS ≥20 or ≥1. Additionally, at this time point there was no difference in progression-
- 46 -
free survival (PFS), a dual primary endpoint of the study, in any of the groups studied. Merck plans to file an sBLA with the FDA for a first-line indication basedon KEYNOTE-048 data and will include data from the Phase 3 KEYNOTE-040 trial as supportive data. Based on these results, Merck has withdrawn the sBLA forKEYNOTE-040 for Keytruda as a second-line treatment in patients with recurrent or metastatic HNSCC. The results from KEYNOTE-048 will also be submittedto regulatory authorities worldwide.
In October 2018, Merck announced that the pivotal Phase 3 KEYNOTE-426 trial investigating Keytruda in combination with Inlyta (axitinib), Pfizer’styrosine kinase inhibitor, met both primary endpoints of OS and PFS in the first-line treatment of advanced or metastatic renal cell carcinoma (RCC), the mostcommon type of kidney cancer. Based on the first interim analysis by the independent Data Monitoring Committee, the Keytruda plus Inlyta combination resultedin statistically significant and clinically meaningful improvements in OS and PFS, compared to sunitinib monotherapy. These results will be presented at anupcoming medical meeting and submitted to regulatory authorities worldwide.
In October 2018, Merck announced the first presentation of results from an interim analysis of KEYNOTE-057, a Phase 2 trial evaluating Keytruda forpreviously treated patients with high-risk non-muscle invasive bladder cancer. An interim analysis of the study’s primary endpoint showed a complete responserate of nearly 40% at three months with Keytruda in patients whose disease was unresponsive to Bacillus Calmette-Guérin therapy, the current standard of care forthis disease, and who were ineligible for or who refused to undergo radical cystectomy. These results, as well as other study findings, were presented at the ESMO2018 Congress.
The Keytruda clinical development program consists of more than 850 clinical trials, including more than 500 trials that combine Keytruda with othercancer treatments. These studies encompass more than 30 cancer types including: bladder, colorectal, esophageal, gastric, HNSCC, hepatocellular, Hodgkinlymphoma, non-Hodgkin lymphoma, melanoma, mesothelioma, nasopharyngeal, NSCLC, ovarian, PMBCL, prostate, renal, small-cell lung cancer and triple-negative breast, many of which are currently in Phase 3 clinical development. Further trials are being planned for other cancers.
In April 2018, Merck and AstraZeneca announced that the EMA validated for review the Marketing Authorization Application for Lynparza for use inpatients with deleterious or suspected deleterious BRCA -mutated, HER2-negative metastatic breast cancer who have been previously treated with chemotherapy inthe neoadjuvant, adjuvant or metastatic setting. This is the first regulatory submission for a PARP inhibitor in breast cancer in Europe.
In October 2018, Merck and AstraZeneca announced results from the Phase 3 SOLO-1 trial testing Lynparza as a maintenance treatment for patientswith newly-diagnosed advanced BRCA -mutated ovarian cancer who were in complete or partial response following first-line standard platinum-basedchemotherapy. Results of the trial confirm the statistically-significant and clinically-meaningful improvement in PFS for Lynparza as compared to placebo,reducing the risk of disease progression or death by 70%. The data were presented at the ESMO 2018 Congress and published simultaneously online in The NewEngland Journal of Medicine .
As noted above, in March 2018, Merck and Eisai announced a strategic collaboration for the worldwide co-development and co-commercialization ofLenvima (see Note 4 to the condensed consolidated financial statements). Under the agreement, Merck and Eisai will develop and commercialize Lenvima jointly,both as monotherapy and in combination with Keytruda . Per the agreement, the companies will jointly initiate clinical studies evaluating the Lenvima/ Keytrudacombination to support 11 potential indications in six types of cancer (endometrial cancer, NSCLC, hepatocellular carcinoma, head and neck cancer, bladder cancerand melanoma), as well as a basket trial targeting multiple cancer types.
In September 2018, the CHMP of the EMA adopted a positive opinion recommending granting of marketing authorization for MK-1439A, Delstrigo , aonce-daily fixed-dose combination tablet of doravirine, lamivudine and tenofovir disoproxil fumarate; and MK-1439, Pifeltro (doravirine), a new non-nucleosidereverse transcriptase inhibitor to be administered in combination with other antiretroviral medicines. These two recommendations will now be reviewed by the ECfor marketing authorization in the EU. Delstrigo and Pifeltro were approved by the FDA in August 2018.
In April 2018, Merck announced that a pivotal Phase 3 study of relebactam, the Company’s investigational beta-lactamase inhibitor, in combinationwith imipenem/cilastatin (MK-7655A), demonstrated a favorable overall response in the treatment of certain imipenem-non-susceptible bacterial infections, theprimary endpoint, with lower treatment-emergent nephrotoxicity (kidney toxicity), a secondary endpoint, compared to a Colistin (colistimethate sodium) plusimipenem regimen. Based on these results, the Company plans to submit a New Drug Application to the FDA seeking regulatory approval of a fixed-dosecombination of imipenem/cilastatin and relebactam.
In June 2018, Merck began the first Phase 3 study of V114, its investigational polyvalent conjugate vaccine for the prevention of pneumococcal disease,which will evaluate the safety, tolerability and immunogenicity of V114 followed by Pneumococcal Vaccine Polyvalent one year later in healthy adult subjects 50years of age or older. Two additional Phase 3 studies started in July 2018. One will evaluate the safety, tolerability and immunogenicity of V114 followed byPneumococcal Vaccine Polyvalent administered eight weeks later in adults infected with HIV, and the other will evaluate the safety, tolerability, and
- 47 -

immunogenicity of V114 in adults ages 18 to 49 at increased risk for pneumococcal disease. In September 2018, two additional adult Phase 3 studies started. Onewill evaluate the safety, tolerability, and immunogenicity of V114 when administered concomitantly with influenza vaccine in healthy adults 50 years of age orolder, and the other will evaluate the safety, tolerability, and immunogenicity of V114 in recipients of allogeneic hematopoietic stem cell transplant. In October2018, Merck began the first Phase 3 study of V114 in healthy infants to evaluate the safety and tolerability of V114 and Prevnar 13.
V920 is an investigational rVSV-ZEBOV (Ebola) vaccine candidate being studied in large scale Phase 2/3 clinical trials. In November 2014, Merck andNewLink Genetics announced an exclusive licensing and collaboration agreement for the investigational Ebola vaccine. In December 2015, Merck announced thatthe application for Emergency Use Assessment and Listing (EUAL) for V920 was accepted for review by the World Health Organization (WHO). According to theWHO, the EUAL process is designed to expedite the availability of vaccines needed for public health emergencies such as another outbreak of Ebola. The WHOdecision to grant V920 EUAL status will be based on data regarding quality, safety, and efficacy/effectiveness; as well as a risk/benefit analysis for emergency use.While EUAL designation allows for emergency use, the vaccine remains investigational and has not yet been licensed for commercial distribution. In July 2016,Merck announced that the FDA granted V920 Breakthrough Therapy designation, and that the EMA granted the vaccine candidate PRIME (PRIority MEdicines)status. The Company intends to file the V920 Ebola vaccine with the FDA and EMA in 2019.
The chart below reflects the Company’s research pipeline as of November 1, 2018. Candidates shown in Phase 3 include specific products and the datesuch candidate entered into Phase 3 development. Candidates shown in Phase 2 include the most advanced compound with a specific mechanism or, if listedcompounds have the same mechanism, they are each currently intended for commercialization in a given therapeutic area. Small molecules and biologics are givenMK-number designations and vaccine candidates are given V-number designations. Except as otherwise noted, candidates in Phase 1, additional indications in thesame therapeutic area (other than with respect to oncology) and additional claims, line extensions or formulations for in-line products are not shown.
Phase 2 Phase 3 (Phase 3 entry date) Under ReviewCancer
MK-3475 KeytrudaAdvanced Solid TumorsCutaneous Squamous Cell CarcinomaOvarianProstate
MK-7902 Lenvima (1)Biliary TractNon-Small-Cell Lung
V937 CavatakMelanoma
MK-7690 (2)Colorectal
CytomegalovirusV160
Diabetes MellitusMK-8521 (3)
HIV-1 InfectionMK-8591
Pediatric Neurofibromatosis Type 1MK-5618 (selumetinib) (1)(4)
SchizophreniaMK-8189
Respiratory Syncytial VirusMK-1654
Bacterial InfectionMK-7655A (relebactam+imipenem/cilastatin)
(October 2015)Cancer
MK-3475 Keytruda Breast (October 2015)Colorectal (November 2015)Esophageal (December 2015)Gastric (May 2015) (EU)Hepatocellular (May 2016) (EU)Mesothelioma (May 2018)Nasopharyngeal (April 2016)Renal (October 2016)Small-Cell Lung (May 2017)
MK-7339 Lynparza (1)Pancreatic (December 2014)Prostate (April 2017)
MK-7902 Lenvima (1)Endometrial (June 2018) (2)
CoughMK-7264 (gefapixant) (March 2018)
Ebola VaccineV920 (March 2015)
Heart FailureMK-1242 (vericiguat) (September 2016) (1)
Herpes ZosterV212 (inactivated VZV vaccine)
(December 2010) (3)Pneumoconjugate Vaccine
V114 (June 2018)
New Molecular Entities/VaccinesHIV-1 Infection
MK-1439 (doravirine) (EU)MK-1439A (doravirine/lamivudine/tenofovir disoproxil fumarate) (EU)
Pediatric Hexavalent Combination VaccineV419 (U.S.) (1)(5)
Certain Supplemental FilingsCancer
MK-3475 Keytruda• First-Line Metastatic Squamous Non-Small-Cell Lung
Cancer KEYNOTE-407 (EU)• First-Line Metastatic Nonsquamous or Squamous Non-
Small-Cell Lung Cancer KEYNOTE-042 (U.S.) (EU)• Second-Line Hepatocellular Carcinoma
KEYNOTE-224 (U.S.)• First-Line Merkel Cell Carcinoma KEYNOTE-017 (U.S.)• Adjuvant Therapy in Advanced Melanoma
KEYNOTE-054 (U.S.) (EU)
MK-7339 Lynparza (1)• Second-Line Metastatic Breast Cancer (EU)
Footnotes:(1) Being developed in a collaboration.(2) Being developed in combination with Keytruda .(3) Development is currently on hold.(4) This is a registrational study.(5) V419 is an investigational pediatric hexavalent combination vaccine, DTaP5-
IPV-Hib-HepB, that is being developed and, if approved, will becommercialized through a partnership of Merck and Sanofi. In November 2015,the FDA issued a CRL with respect to V419. Merck and Sanofi provided aresponse to the CRL, which was deemed complete and acceptable for review.
- 48 -
Liquidity and Capital Resources
($ in millions) September 30, 2018 December 31, 2017
Cash and investments $ 17,891 $ 20,623Working capital 8,250 6,152Total debt to total liabilities and equity 27.7% 27.8%
Cash provided by operating activities was $7.3 billion in the first nine months of 2018 compared with $2.4 billion in the first nine months of 2017 .Cash provided by operating activities in the first nine months of 2018 reflects $750 million of upfront payments made by the Company related to the formation of acollaboration with Eisai (see Note 4 to the condensed consolidated financial statements). Cash provided by operating activities in the first nine months of 2017reflects a $2.8 billion payment related to the settlement of certain federal income tax issues (see Note 14 to the condensed consolidated financial statements), a $1.6billion upfront payment made by the Company related to the formation of a collaboration with AstraZeneca (see Note 4 to the condensed consolidated financialstatements), and a $625 million payment made by the Company related to the previously disclosed settlement of worldwide Keytruda patent litigation. Cashprovided by operating activities continues to be the Company’s primary source of funds to finance operating needs, capital expenditures, treasury stock purchasesand dividends paid to shareholders.
Cash provided by investing activities was $2.1 billion in the first nine months of 2018 compared with $2.7 billion in the first nine months of 2017 . Thedecline in cash provided by investing activities was driven primarily by lower proceeds from the sales of securities and other investments and higher capitalexpenditures, as well as a $350 million milestone payment in 2018 related to a collaboration with Bayer (see Note 4 to the condensed consolidated financialstatements), partially offset by lower purchases of securities and other investments.
Cash used in financing activities was $7.6 billion in the first nine months of 2018 compared with $4.2 billion in the first nine months of 2017 . Thehigher use of cash in financing activities was driven primarily by higher payments on debt, higher purchases of treasury stock and payment of contingentconsideration related to a prior year business acquisition, partially offset by higher short-term borrowings.
Capital expenditures totaled $1.7 billion and $1.2 billion for the first nine months of 2018 and 2017 , respectively. In October 2018, the Companyannounced it now plans to invest approximately $16 billion on new capital projects, up $4 billion from its prior five-year plan of $12 billion announced in February2018. The focus of this investment will be to increase manufacturing capacity across Merck’s key businesses.
Dividends paid to stockholders were $3.9 billion for both the first nine months of 2018 and 2017 . In May 2018, the Board of Directors declared aquarterly dividend of $0.48 per share on the Company’s common stock for the third quarter that was paid in July 2018. In July 2018, the Board of Directorsdeclared a quarterly dividend of $0.48 per share on the Company’s common stock for the fourth quarter that was paid in October 2018. In October 2018, Merckannounced that its Board of Directors approved a 15% increase to the Company’s quarterly dividend, raising it to $0.55 per share from $0.48 per share on theCompany’s outstanding common stock. Payment will be made in January 2019.
In November 2017, Merck’s Board of Directors authorized purchases of up to $10 billion of Merck’s common stock for its treasury. The treasury stockpurchase has no time limit and will be made over time in open-market transactions, block transactions on or off an exchange, or in privately negotiatedtransactions. During the first nine months of 2018 , the Company purchased $3.2 billion ( 53 million shares) for its treasury under this and a previously authorizedshare repurchase program. As of September 30, 2018 , the Company’s remaining share repurchase authorization was $7.9 billion . In October 2018, Merck’s Boardof Directors authorized an additional $10 billion of treasury stock purchases with no time limit for completion. The Company entered into a $5 billion acceleratedshare repurchase (ASR) program under its expanded authorization as discussed below.
On October 25, 2018, the Company entered into an ASR agreement with Goldman Sachs & Co. and JP Morgan Chase (Dealers). Under the ASR,Merck agreed to purchase $5 billion of Merck’s common stock, in total, with an initial delivery of 56.7 million shares of Merck’s common stock, based on currentmarket price, made by the Dealers to Merck, and payment of $5 billion made by Merck to the Dealers on October 29, 2018, which was funded with existing cashand investments, as well as short-term borrowings. The payment to the Dealers will be recorded as a reduction to shareholders’ equity, consisting of a $4billion increase in treasury stock, which reflects the value of the initial 56.7 million shares received upon execution, and a $1 billion decrease in other-paid-incapital, which reflects the value of the stock held back by the Dealers pending final settlement. The final number of shares of Merck’s common stock that Merckmay receive, or may be required to remit, upon settlement under the ASR will be based upon the average daily volume weighted-average price of Merck’s commonstock during the term of the ASR program. Final settlement of the transaction under the ASR agreement is expected to occur in the first half of 2019, and mayoccur earlier at the option of the Dealers, or later under certain circumstances. The terms of the transaction under the ASR agreement are subject to adjustment ifMerck were to enter into or announce certain types of transactions. If Merck is obligated to make an
- 49 -

adjustment payment to the Dealers under the ASR, Merck may elect to satisfy such obligation in cash or in shares of Merck’s common stock.In January 2018, $1.0 billion of 1.10% notes matured in accordance with their terms and were repaid. In May 2018, $1.0 billion of 1.30% notes and
$1.0 billion of floating-rate notes matured in accordance with their terms and were repaid.
The Company has a $6.0 billion credit facility that matures in June 2023. The facility provides backup liquidity for the Company’s commercial paperborrowing facility and is to be used for general corporate purposes. The Company has not drawn funding from this facility.
In March 2018, the Company filed a securities registration statement with the U.S. Securities and Exchange Commission (SEC) under the automaticshelf registration process available to “well-known seasoned issuers” which is effective for three years.
The economy of Argentina was recently determined to be hyperinflationary; consequently, in accordance with U.S. GAAP, the Company beganremeasuring its monetary assets and liabilities for those operations in earnings beginning in the third quarter of 2018. The impact to the Company’s results wasimmaterial.
Critical Accounting PoliciesThe Company’s significant accounting policies, which include management’s best estimates and judgments, are included in Note 2 to the consolidated
financial statements for the year ended December 31, 2017 included in Merck’s Form 10‑K filed on February 27, 2018. Certain of these accounting policies areconsidered critical as disclosed in the Critical Accounting Policies section of Management’s Discussion and Analysis of Financial Condition and Results ofOperations included in Merck’s Form 10-K because of the potential for a significant impact on the financial statements due to the inherent uncertainty in suchestimates. There have been no significant changes in the Company’s critical accounting policies since December 31, 2017 . See Note 1 to the condensedconsolidated financial statements for information on the adoption of new accounting standards during 2018.
Recently Issued Accounting Standards
For a discussion of recently issued accounting standards, see Note 1 to the condensed consolidated financial statements.
Item 4. Controls and ProceduresManagement of the Company, with the participation of its Chief Executive Officer and Chief Financial Officer, has evaluated the effectiveness of the
Company’s disclosure controls and procedures over financial reporting for the period covered by this Form 10–Q. Based on this assessment, the Company’s ChiefExecutive Officer and Chief Financial Officer have concluded that as of September 30, 2018 , the Company’s disclosure controls and procedures are effective. Forthe period covered by this report, there have been no changes in internal control over financial reporting that have materially affected, or are reasonably likely tomaterially affect, the Company’s internal control over financial reporting.
CAUTIONARY FACTORS THAT MAY AFFECT FUTURE RESULTS
This report and other written reports and oral statements made from time to time by the Company may contain so-called “forward-looking statements,”all of which are based on management’s current expectations and are subject to risks and uncertainties which may cause results to differ materially from those setforth in the statements. One can identify these forward-looking statements by their use of words such as “anticipates,” “expects,” “plans,” “will,” “estimates,”“forecasts,” “projects” and other words of similar meaning, or negative variations of any of the foregoing. One can also identify them by the fact that they do notrelate strictly to historical or current facts. These statements are likely to address the Company’s growth strategy, financial results, product development, productapprovals, product potential and development programs. One must carefully consider any such statement and should understand that many factors could causeactual results to differ materially from the Company’s forward-looking statements. These factors include inaccurate assumptions and a broad variety of other risksand uncertainties, including some that are known and some that are not. No forward-looking statement can be guaranteed and actual future results may varymaterially.
The Company does not assume the obligation to update any forward-looking statement. One should carefully evaluate such statements in light offactors, including risk factors, described in the Company’s filings with the Securities and Exchange Commission, especially on Forms 10-K, 10-Q and 8-K. InItem 1A. “Risk Factors” of the Company’s Annual Report on Form 10‑K for the year ended December 31, 2017 , as filed on February 27, 2018, the Companydiscusses in more detail various important risk factors that could cause actual results to differ from expected or historic results. The Company notes these factorsfor investors as permitted by the Private Securities Litigation Reform Act of 1995. One should understand that it is not possible to predict or identify all suchfactors. Consequently, the reader should not consider any such list to be a complete statement of all potential risks or uncertainties.
- 50 -
PART II - Other Information
Item 1. Legal Proceedings
The information called for by this Item is incorporated herein by reference to Note 9 included in Part I, Item 1, Financial Statements (unaudited) —Notes to Condensed Consolidated Financial Statements.
Item 2. Unregistered Sales of Equity Securities and Use of Proceeds
Issuer purchases of equity securities for the three months ended September 30, 2018 were as follows:
ISSUER PURCHASES OF EQUITY SECURITIES
($ in millions)
Period
Total Numberof Shares
Purchased (1)
Average PricePaid Per
Share
Approximate Dollar Value of SharesThat May Yet Be Purchased
Under the Plans or Programs (1)
July 1 - July 31 11,274,234 $62.31 $8,176August 1 - August 31 2,386,135 $67.30 $8,016September 1 - September 30 1,901,599 $69.79 $7,883Total 15,561,968 $63.99 $7,883
(1)
Shares purchased during the period were made as part of a plan approved by the Board of Directors in March 2015 to purchase up to $10 billion of Merck’s common stock for its treasury. InOctober 2018, the Board of Directors authorized an additional $10 billion of treasury stock purchases with no time limit for completion. The Company entered into a $5 billion acceleratedshare repurchase program under its expanded authorization.
Item 6. Exhibits
Number Description
3.1 — Restated Certificate of Incorporation of Merck & Co., Inc. (November 3, 2009) – Incorporated by reference to Current Report on Form 8-K filed on November 4, 2009 (No. 1-6571)
3.2 — By-Laws of Merck & Co., Inc. (effective July 22, 2015) – Incorporated by reference to Current Report on Form 8-K filed on July 28,
2015 (No. 1-6571)
31.1 — Rule 13a – 14(a)/15d – 14(a) Certification of Chief Executive Officer
31.2 — Rule 13a – 14(a)/15d – 14(a) Certification of Chief Financial Officer
32.1 — Section 1350 Certification of Chief Executive Officer
32.2 — Section 1350 Certification of Chief Financial Officer
101 — The following materials from Merck & Co., Inc.’s Quarterly Report on Form 10-Q for the quarter ended September 30, 2018, formattedin XBRL (Extensible Business Reporting Language): (i) the Condensed Consolidated Statement of Income, (ii) the CondensedConsolidated Statement of Comprehensive Income, (iii) the Condensed Consolidated Balance Sheet, (iv) the Condensed ConsolidatedStatement of Cash Flows, and (v) Notes to the Condensed Consolidated Financial Statements.
- 51 -

Signatures
Pursuant to the requirements of the Securities Exchange Act of 1934, the registrant has duly caused this report to be signed on its behalf by the undersignedthereunto duly authorized.
MERCK & CO., INC.
Date: November 6, 2018 /s/ Jennifer Zachary JENNIFER ZACHARY Executive Vice President and General Counsel
Date: November 6, 2018 /s/ Rita A. Karachun RITA A. KARACHUN Senior Vice President Finance - Global Controller
- 52 -

EXHIBIT INDEX
Number Description
3.1 — Restated Certificate of Incorporation of Merck & Co., Inc. (November 3, 2009) – Incorporated by reference to Current Report on Form 8-K filed on November 4, 2009 (No. 1-6571)
3.2 — By-Laws of Merck & Co., Inc. (effective July 22, 2015) – Incorporated by reference to Current Report on Form 8-K filed on July 28,
2015 (No. 1-6571)
31.1 — Rule 13a – 14(a)/15d – 14(a) Certification of Chief Executive Officer
31.2 — Rule 13a – 14(a)/15d – 14(a) Certification of Chief Financial Officer
32.1 — Section 1350 Certification of Chief Executive Officer
32.2 — Section 1350 Certification of Chief Financial Officer
101 — The following materials from Merck & Co., Inc.’s Quarterly Report on Form 10-Q for the quarter ended September 30, 2018, formattedin XBRL (Extensible Business Reporting Language): (i) the Condensed Consolidated Statement of Income, (ii) the CondensedConsolidated Statement of Comprehensive Income, (iii) the Condensed Consolidated Balance Sheet, (iv) the Condensed ConsolidatedStatement of Cash Flows, and (v) Notes to the Condensed Consolidated Financial Statements.
- 53 -
Exhibit 31.1
CERTIFICATION
I, Kenneth C. Frazier, certify that:
1. I have reviewed this quarterly report on Form 10-Q of Merck & Co., Inc.;
2. Based on my knowledge, this report does not contain any untrue statement of a material fact or omit to state a material fact necessary to make thestatements made, in light of the circumstances under which such statements were made, not misleading with respect to the period covered by this report;
3. Based on my knowledge, the financial statements, and other financial information included in this report, fairly present in all material respects thefinancial condition, results of operations and cash flows of the registrant as of, and for, the periods presented in this report;
4. The registrant’s other certifying officer(s) and I are responsible for establishing and maintaining disclosure controls and procedures (as defined inExchange Act Rules 13a-15(e) and 15d-15(e)) and internal control over financial reporting (as defined in Exchange Act Rules 13a-15(f) and 15d-15(f)) for theregistrant and have:
a) Designed such disclosure controls and procedures, or caused such disclosure controls and procedures to be designed under our supervision, to ensurethat material information relating to the registrant, including its consolidated subsidiaries, is made known to us by others within those entities, particularlyduring the period in which this report is being prepared;
b) Designed such internal control over financial reporting, or caused such internal control over financial reporting to be designed under our supervision,to provide reasonable assurance regarding the reliability of financial reporting and the preparation of financial statements for external purposes in accordancewith generally accepted accounting principles;
c) Evaluated the effectiveness of the registrant’s disclosure controls and procedures and presented in this report our conclusions about the effectivenessof the disclosure controls and procedures, as of the end of the period covered by this report based on such evaluation; and
d) Disclosed in this report any change in the registrant’s internal control over financial reporting that occurred during the registrant’s most recent fiscalquarter (the registrant’s fourth fiscal quarter in the case of an annual report) that has materially affected, or is reasonably likely to materially affect, theregistrant’s internal control over financial reporting; and
5. The registrant’s other certifying officer(s) and I have disclosed, based on our most recent evaluation of internal control over financial reporting, to theregistrant’s auditors and the audit committee of the registrant’s board of directors (or persons performing the equivalent functions):
a) All significant deficiencies and material weaknesses in the design or operation of internal control over financial reporting which are reasonably likelyto adversely affect the registrant’s ability to record, process, summarize and report financial information; and
b) Any fraud, whether or not material, that involves management or other employees who have a significant role in the registrant’s internal control overfinancial reporting.
Date: November 6, 2018
By: /s/ Kenneth C. Frazier
KENNETH C. FRAZIERChairman, President and Chief Executive Officer

Exhibit 31.2
CERTIFICATION
I, Robert M. Davis, certify that:
1. I have reviewed this quarterly report on Form 10-Q of Merck & Co., Inc.;
2. Based on my knowledge, this report does not contain any untrue statement of a material fact or omit to state a material fact necessary to make thestatements made, in light of the circumstances under which such statements were made, not misleading with respect to the period covered by this report;
3. Based on my knowledge, the financial statements, and other financial information included in this report, fairly present in all material respects thefinancial condition, results of operations and cash flows of the registrant as of, and for, the periods presented in this report;
4. The registrant’s other certifying officer(s) and I are responsible for establishing and maintaining disclosure controls and procedures (as defined inExchange Act Rules 13a-15(e) and 15d-15(e)) and internal control over financial reporting (as defined in Exchange Act Rules 13a-15(f) and 15d-15(f)) for theregistrant and have:
a) Designed such disclosure controls and procedures, or caused such disclosure controls and procedures to be designed under our supervision, to ensurethat material information relating to the registrant, including its consolidated subsidiaries, is made known to us by others within those entities, particularlyduring the period in which this report is being prepared;
b) Designed such internal control over financial reporting, or caused such internal control over financial reporting to be designed under our supervision,to provide reasonable assurance regarding the reliability of financial reporting and the preparation of financial statements for external purposes in accordancewith generally accepted accounting principles;
c) Evaluated the effectiveness of the registrant’s disclosure controls and procedures and presented in this report our conclusions about the effectivenessof the disclosure controls and procedures, as of the end of the period covered by this report based on such evaluation; and
d) Disclosed in this report any change in the registrant’s internal control over financial reporting that occurred during the registrant’s most recent fiscalquarter (the registrant’s fourth fiscal quarter in the case of an annual report) that has materially affected, or is reasonably likely to materially affect, theregistrant’s internal control over financial reporting; and
5. The registrant’s other certifying officer(s) and I have disclosed, based on our most recent evaluation of internal control over financial reporting, to theregistrant’s auditors and the audit committee of the registrant’s board of directors (or persons performing the equivalent functions):
a) All significant deficiencies and material weaknesses in the design or operation of internal control over financial reporting which are reasonably likelyto adversely affect the registrant’s ability to record, process, summarize and report financial information; and
b) Any fraud, whether or not material, that involves management or other employees who have a significant role in the registrant’s internal control overfinancial reporting.
Date: November 6, 2018
By: /s/ Robert M. Davis
ROBERT M. DAVISExecutive Vice President, Global Servicesand Chief Financial Officer
Exhibit 32.1
Section 1350Certification of Chief Executive Officer
Pursuant to 18 U.S.C. Section 1350, the undersigned officer of Merck & Co., Inc. (the “Company”), hereby certifies that the Company's Quarterly Reporton Form 10-Q for the quarter ended September 30, 2018 (the “Report”) fully complies with the requirements of Section 13(a) or 15(d) of the Securities ExchangeAct of 1934 and that the information contained in the Report fairly presents, in all material respects, the financial condition and results of operations of theCompany.
Dated: November 6, 2018 /s/ Kenneth C. Frazier
Name:Title:
KENNETH C. FRAZIERChairman, President and Chief Executive Officer
Exhibit 32.2
Section 1350Certification of Chief Financial Officer
Pursuant to 18 U.S.C. Section 1350, the undersigned officer of Merck & Co., Inc. (the “Company”), hereby certifies that the Company's Quarterly Reporton Form 10-Q for the quarter ended September 30, 2018 (the “Report”) fully complies with the requirements of Section 13(a) or 15(d) of the Securities ExchangeAct of 1934 and that the information contained in the Report fairly presents, in all material respects, the financial condition and results of operations of theCompany.
Dated: November 6, 2018 /s/ Robert M. Davis
Name:Title:
ROBERT M. DAVISExecutive Vice President, Global Servicesand Chief Financial Officer