accounting for the distribution of income in the u.s ... johnson bea adv presentation.pdf ·...
TRANSCRIPT

www.bea.gov
Accounting for the Distribution of Income in the U.S. National Accounts
Dennis Fixler Bureau of Economic Analysis
David S Johnson
US Census Bureau
Prepared for BEA Advisory Committee Meeting 16 November 2012
1
www.bea.gov
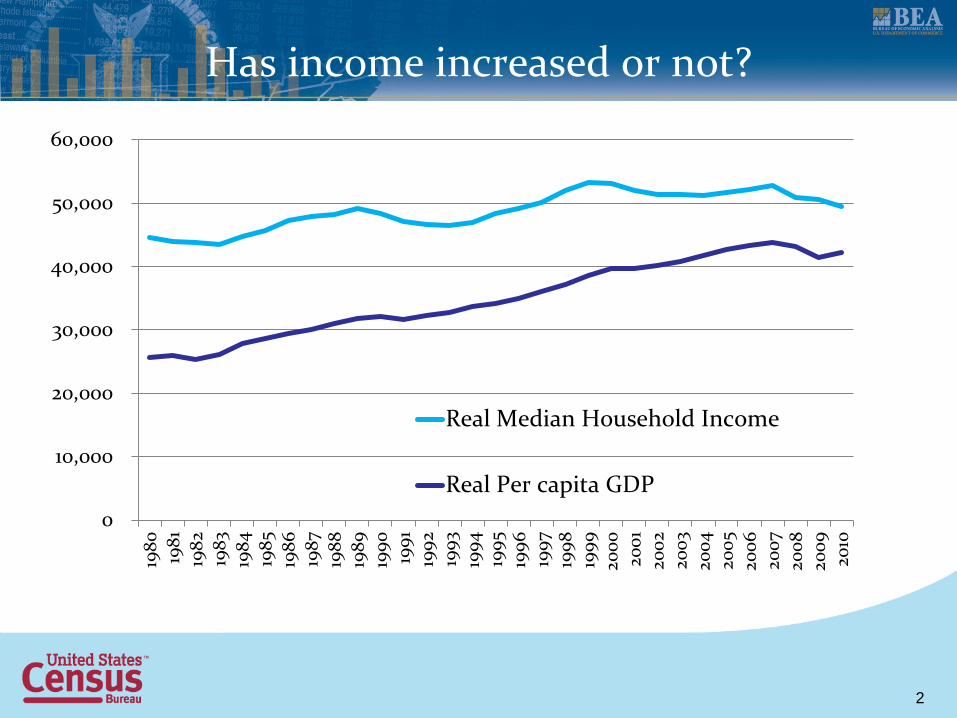
Has income increased or not?
0
10,000
20,000
30,000
40,000
50,000
60,00019
80 1981
1982
1983
1984
1985
1986
1987
1988
1989
1990 1991
1992
1993
1994
1995
1996
1997
1998
1999
2000
2001
2002
2003
2004
2005
2006
2007
2008
2009
2010
Real Median Household Income
Real Per capita GDP
2
www.bea.gov
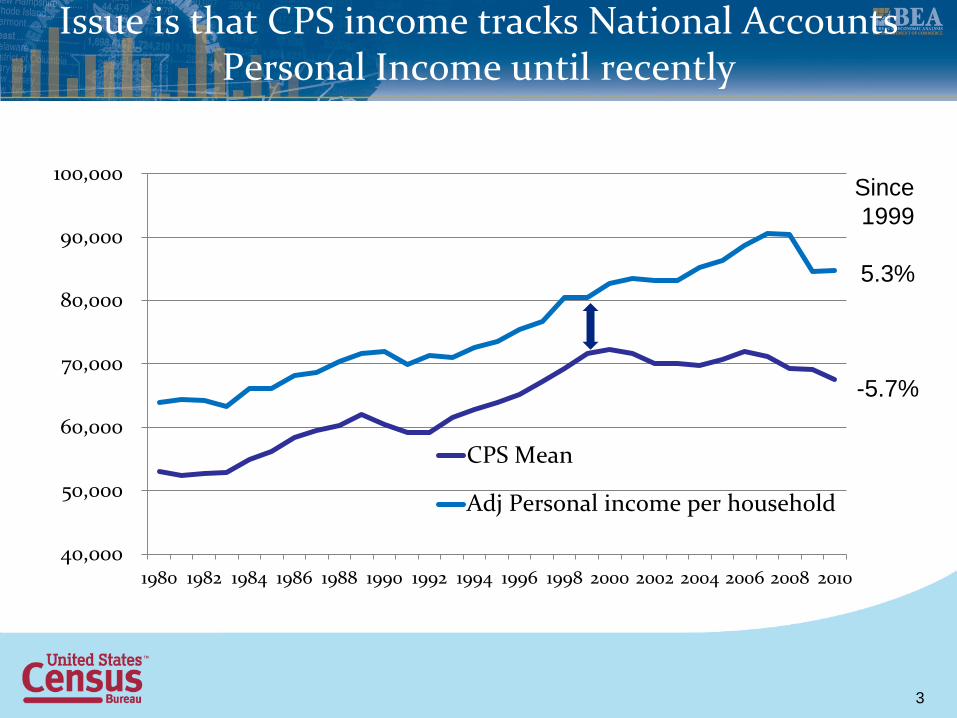
Issue is that CPS income tracks National Accounts Personal Income until recently
40,000
50,000
60,000
70,000
80,000
90,000
100,000
1980 1982 1984 1986 1988 1990 1992 1994 1996 1998 2000 2002 2004 2006 2008 2010
CPS Mean
Adj Personal income per household
Since 1999
5.3%
-5.7%
3
www.bea.gov
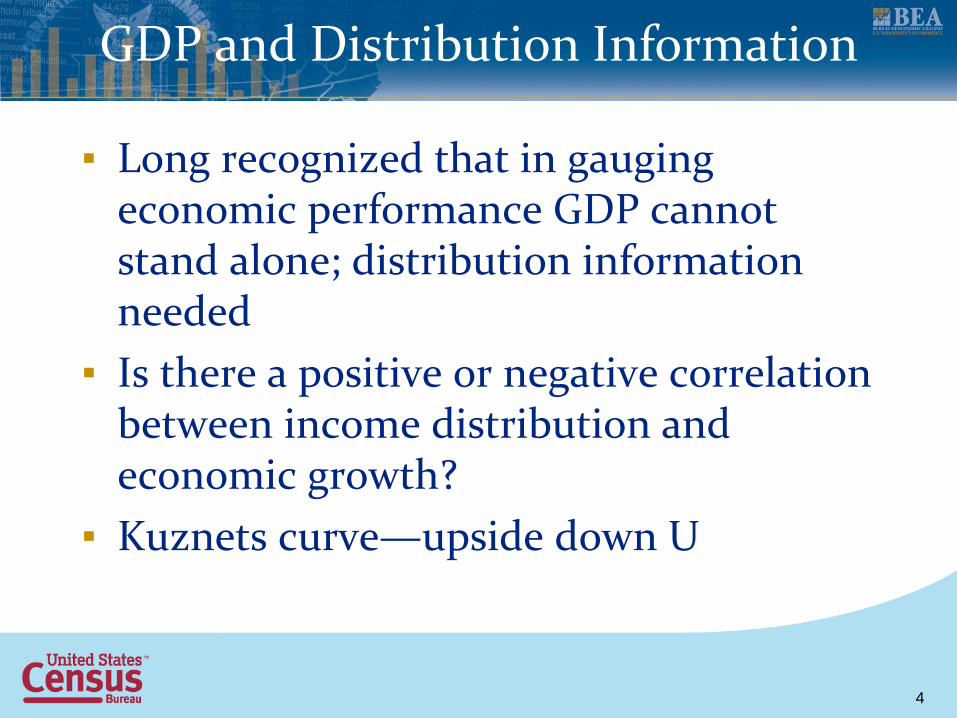
GDP and Distribution Information
▪ Long recognized that in gauging economic performance GDP cannot stand alone; distribution information needed
▪ Is there a positive or negative correlation between income distribution and economic growth?
▪ Kuznets curve—upside down U
4
www.bea.gov
Evaluating the income distribution and its relationship to National accounts is not new
▪ 1st NBER volume - Mitchell, et al. 1921. Income in the United States: Its Amount and Distribution, 1909-1919
▪ CRIW volume 1943 - Income Size Distributions in the United States, Part I.
▪ CRIW Volume, 1975 - The Personal Distribution of Income and Wealth, James D. Smith, ed., 1975.
▪ Office of Business Economics (the predecessor to BEA) early reports - Goldsmith (1955) “Income Distribution in the United States, 1950-53,” Survey of Current Business.
5
www.bea.gov
Recent Emphasis on Distribution
▪ Stigliz et al: information on distribution serves as an important complement to GDP
▪ 2012 Economic Report of the President: distributional aspects of fiscal policy
▪ IMF Working Paper: “Innocent Bystanders? Monetary Policy and Inequality in U.S.” WP/12/199 August 2012
▪ Gordon “Misperceptions About the Magnitude and Timing of Changes in American Income Inequality” NBER Working Paper 15351
6
www.bea.gov
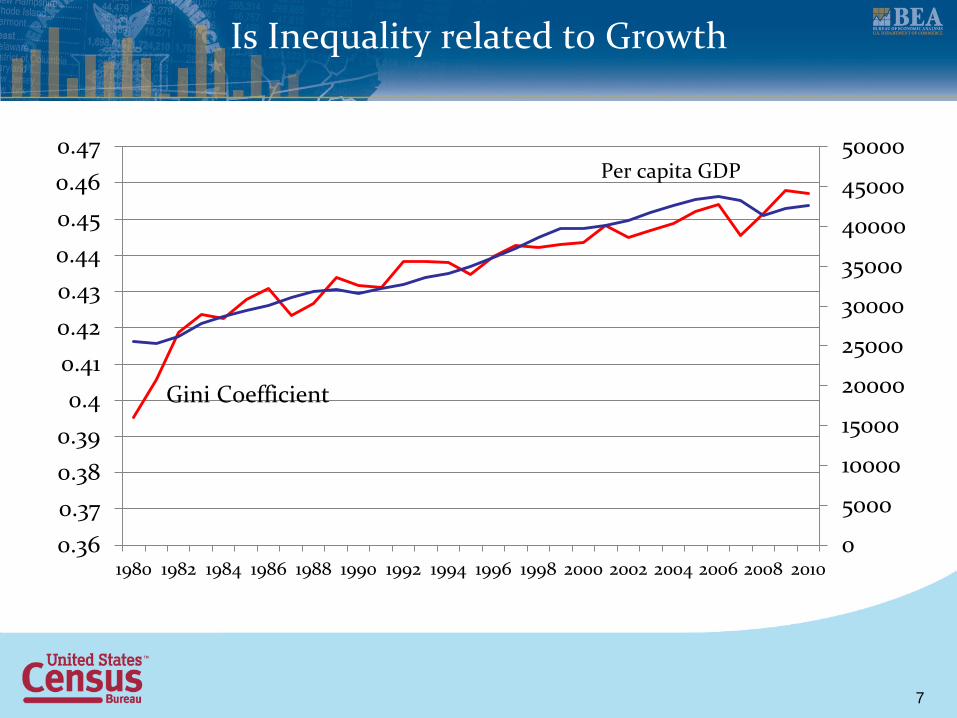
Is Inequality related to Growth
0
5000
10000
15000
20000
25000
30000
35000
40000
45000
50000
0.360.370.380.390.4
0.410.420.430.440.450.460.47
1980 1982 1984 1986 1988 1990 1992 1994 1996 1998 2000 2002 2004 2006 2008 2010
Gini Coefficient
Per capita GDP
7
www.bea.gov
Purpose of Research
• BEA FY11 budget proposal, which included producing “a decomposition of personal income that presents median as well as mean income…”
• Because survey data suffer from under-reporting, determine how to deal with measurement error in income
• Demonstrate that one can use NIPA data to adjust survey data to obtain alternative distributions and measures of inequality.
▪ Provide examples of the usefulness of the distribution measures on expenditure multipliers and social welfare measures
8
www.bea.gov
The Measurement of Income
▪ Use the Haig-Simons definition of income, Income (Y) = Consumption (C) plus change in wealth (∆W). Most studies do not implement this definition
▪ Census Money income is different (conceptually and empirically) than BEA Personal Income
▪ Issue is that there is underreporting of income in household surveys
▪ Key is that a common, consistent and accurate measure of income is important for understanding the distribution.
9
www.bea.gov
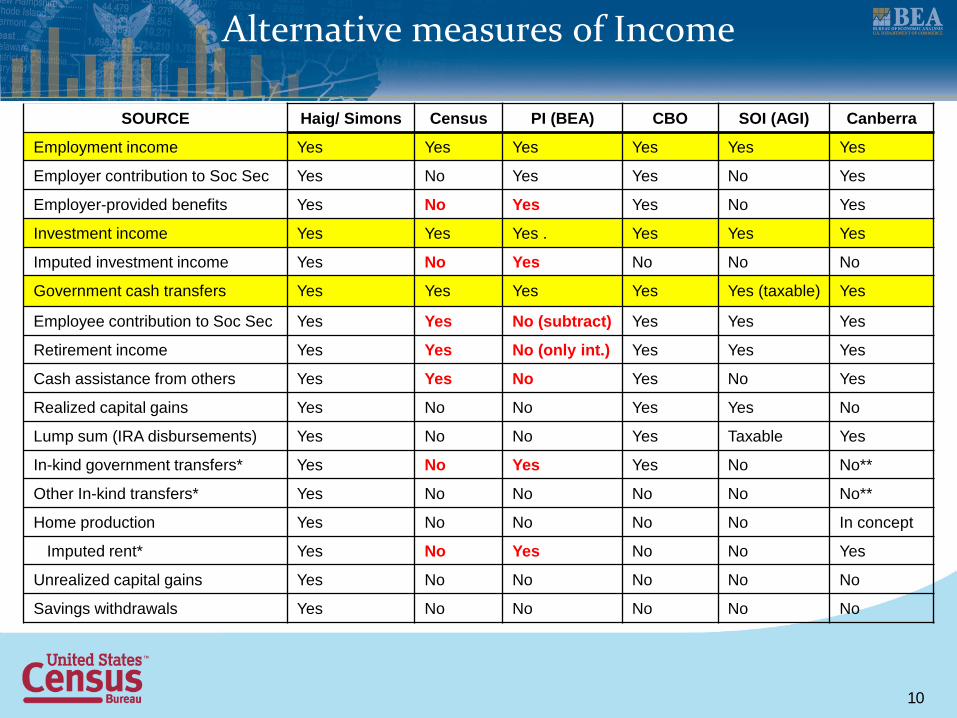
Alternative measures of Income
SOURCE Haig/ Simons Census PI (BEA) CBO SOI (AGI) Canberra
Employment income Yes Yes Yes Yes Yes Yes
Employer contribution to Soc Sec Yes No Yes Yes No Yes
Employer-provided benefits Yes No Yes Yes No Yes
Investment income Yes Yes Yes . Yes Yes Yes
Imputed investment income Yes No Yes No No No
Government cash transfers Yes Yes Yes Yes Yes (taxable) Yes
Employee contribution to Soc Sec Yes Yes No (subtract) Yes Yes Yes
Retirement income Yes Yes No (only int.) Yes Yes Yes
Cash assistance from others Yes Yes No Yes No Yes
Realized capital gains Yes No No Yes Yes No
Lump sum (IRA disbursements) Yes No No Yes Taxable Yes
In-kind government transfers* Yes No Yes Yes No No**
Other In-kind transfers* Yes No No No No No**
Home production Yes No No No No In concept
Imputed rent* Yes No Yes No No Yes
Unrealized capital gains Yes No No No No No
Savings withdrawals Yes No No No No No
10
www.bea.gov
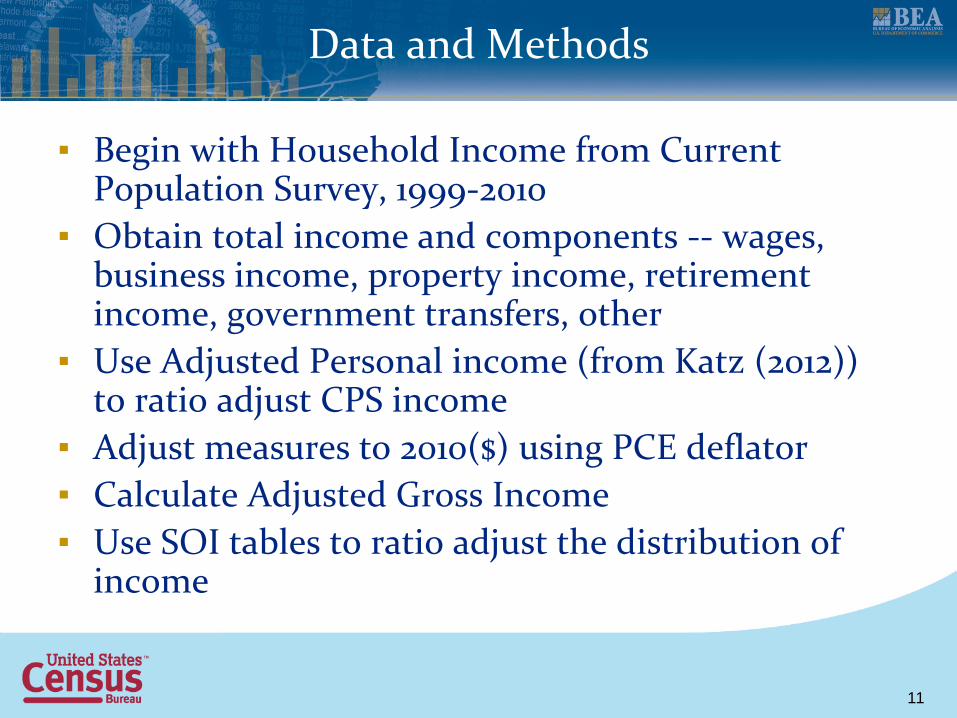
Data and Methods
▪ Begin with Household Income from Current Population Survey, 1999-2010
▪ Obtain total income and components -- wages, business income, property income, retirement income, government transfers, other
▪ Use Adjusted Personal income (from Katz (2012)) to ratio adjust CPS income
▪ Adjust measures to 2010($) using PCE deflator ▪ Calculate Adjusted Gross Income ▪ Use SOI tables to ratio adjust the distribution of
income
11
www.bea.gov
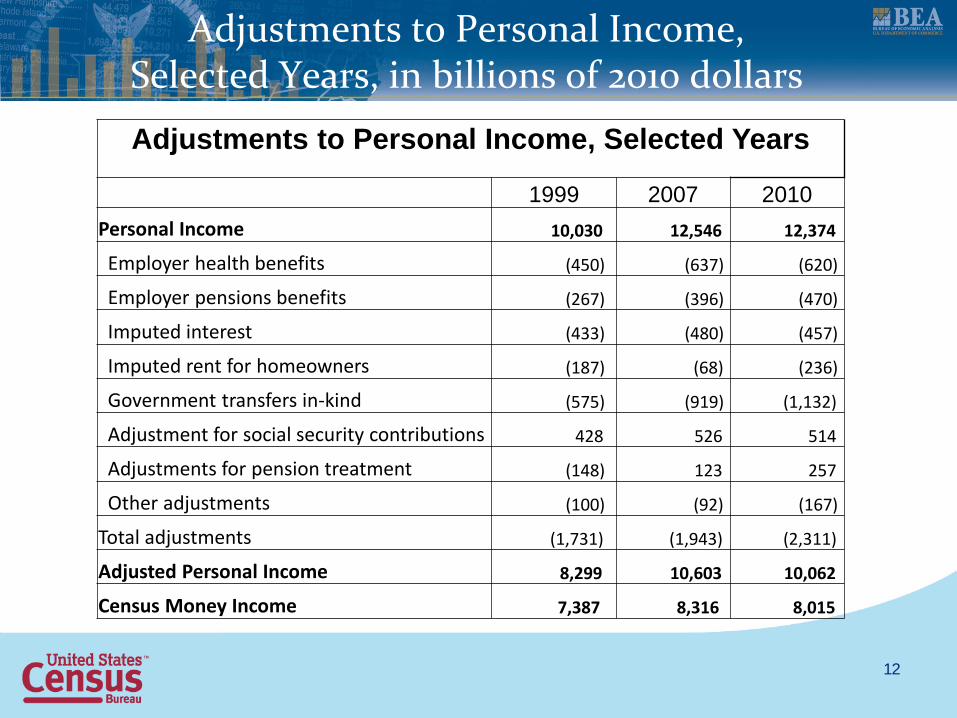
Adjustments to Personal Income, Selected Years, in billions of 2010 dollars Adjustments to Personal Income, Selected Years
1999 2007 2010 Personal Income 10,030 12,546 12,374
Employer health benefits (450) (637) (620)
Employer pensions benefits (267) (396) (470)
Imputed interest (433) (480) (457)
Imputed rent for homeowners (187) (68) (236)
Government transfers in-kind (575) (919) (1,132)
Adjustment for social security contributions 428 526 514
Adjustments for pension treatment (148) 123 257
Other adjustments (100) (92) (167)
Total adjustments (1,731) (1,943) (2,311)
Adjusted Personal Income 8,299 10,603 10,062
Census Money Income 7,387 8,316 8,015
12
www.bea.gov
Ratio adjusting CPS income
▪ Ratio adjust CPS to NIPA totals by source ▪ This procedure increases each household’s
income by source, and then the new data is used to obtain distribution measures (the procedure yields a mean for each source that matches the NIPA totals).
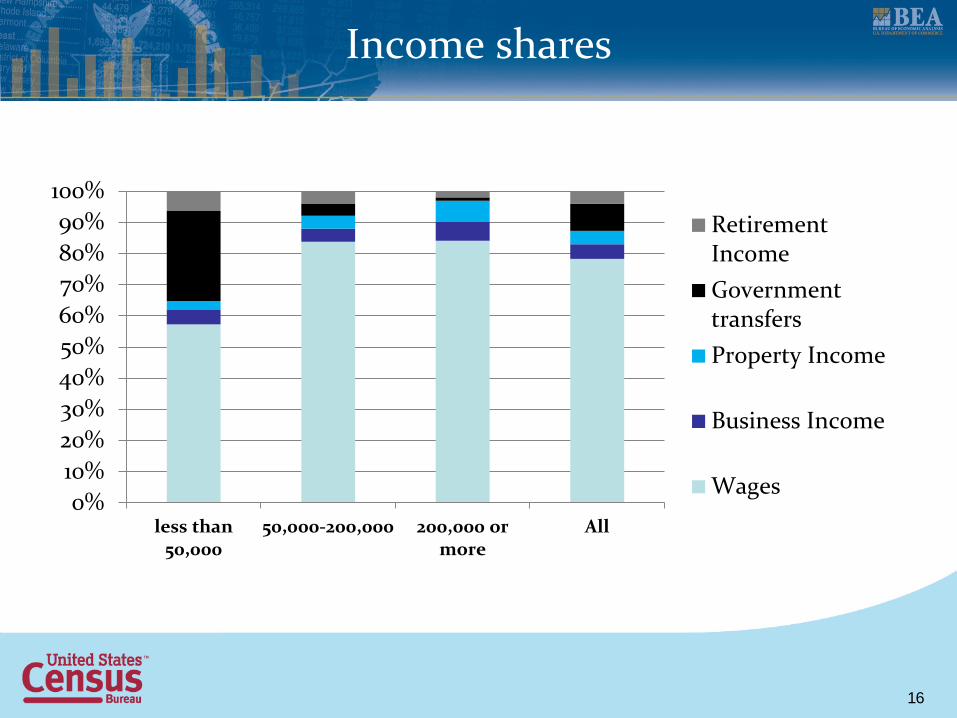
▪ Because higher income households have more property income and business income, their income is adjusted higher.
13
www.bea.gov
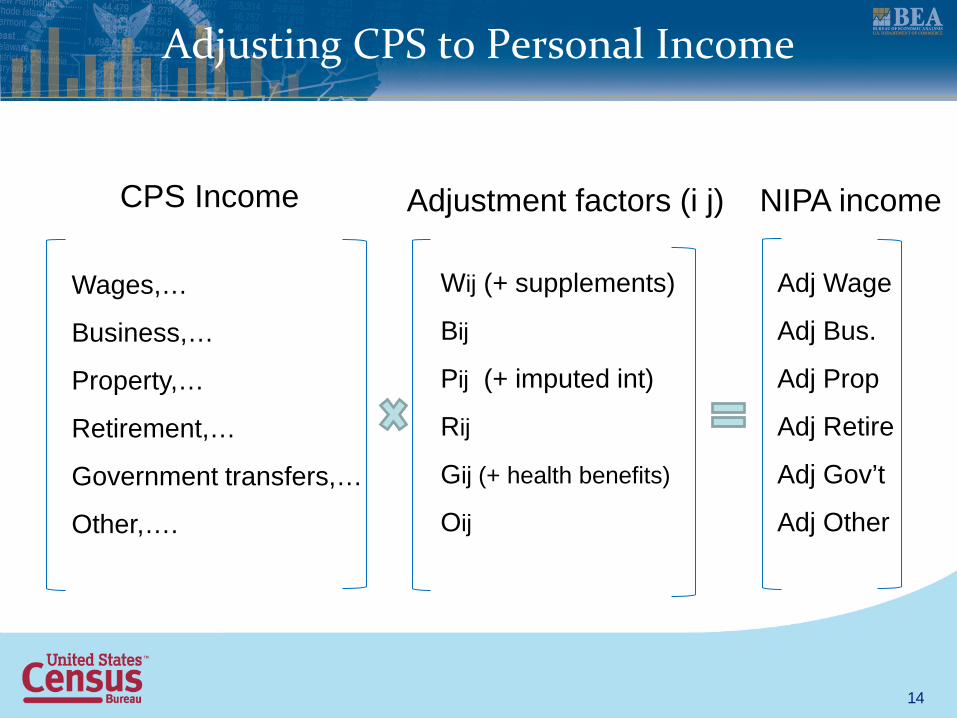
Adjusting CPS to Personal Income
CPS Income Adjustment factors (i j) NIPA income
Wages,…
Business,…
Property,…
Retirement,…
Government transfers,…
Other,….
Wij (+ supplements)
Bij
Pij (+ imputed int)
Rij
Gij (+ health benefits)
Oij
Adj Wage
Adj Bus.
Adj Prop
Adj Retire
Adj Gov’t
Adj Other
14
www.bea.gov
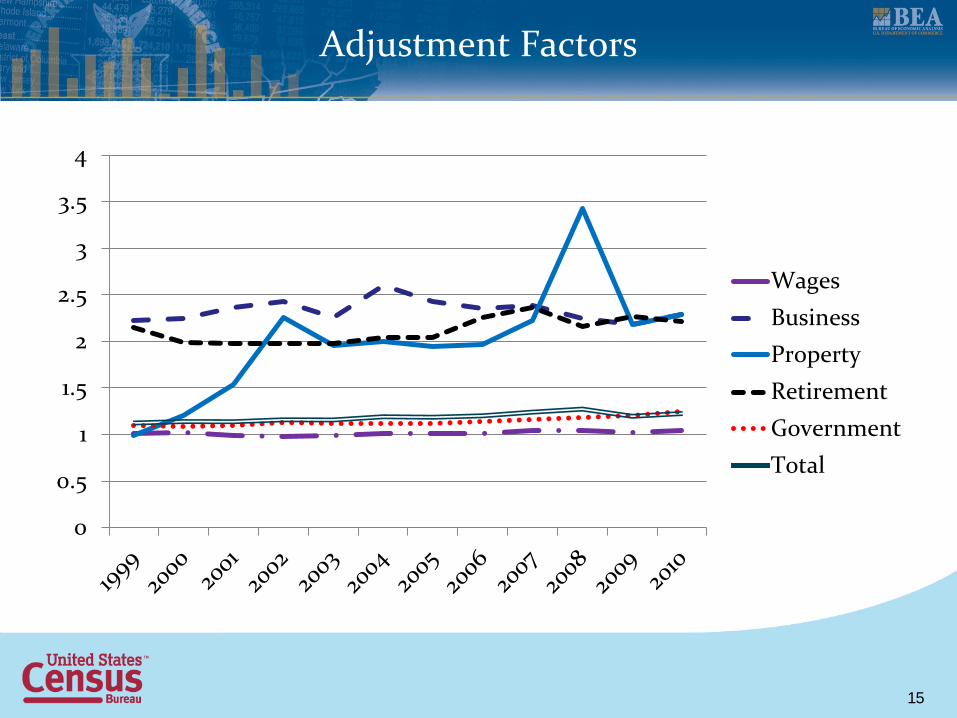
Adjustment Factors
0
0.5
1
1.5
2
2.5
3
3.5
4
WagesBusinessPropertyRetirementGovernmentTotal
15
www.bea.gov
Income shares
0%10%20%30%40%50%60%70%80%90%
100%
less than50,000
50,000-200,000 200,000 ormore
All
RetirementIncomeGovernmenttransfersProperty Income
Business Income
Wages
16
www.bea.gov
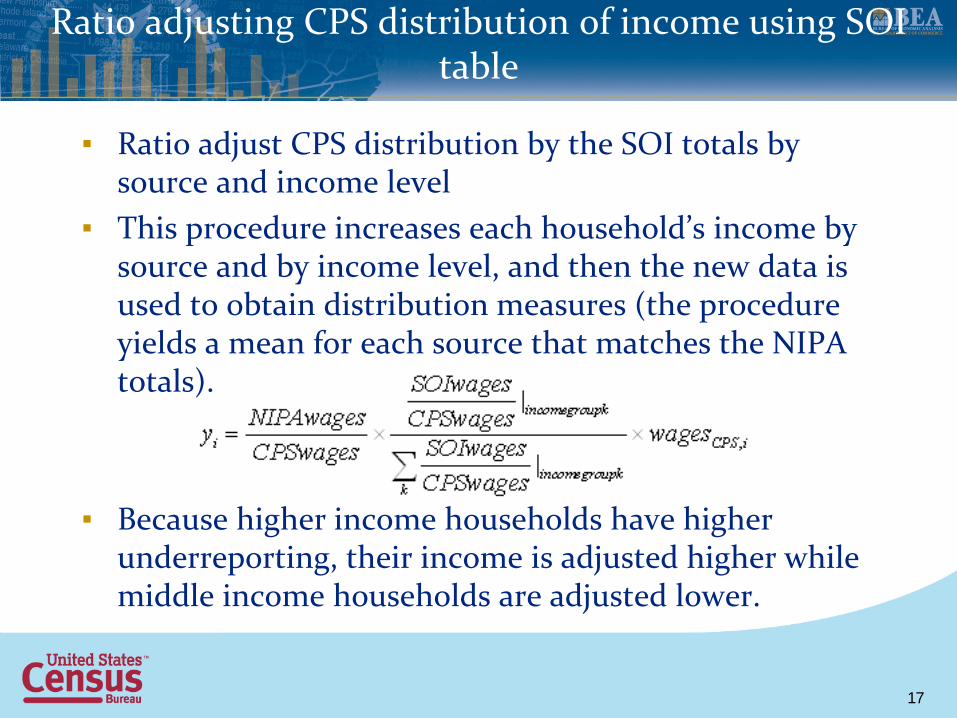
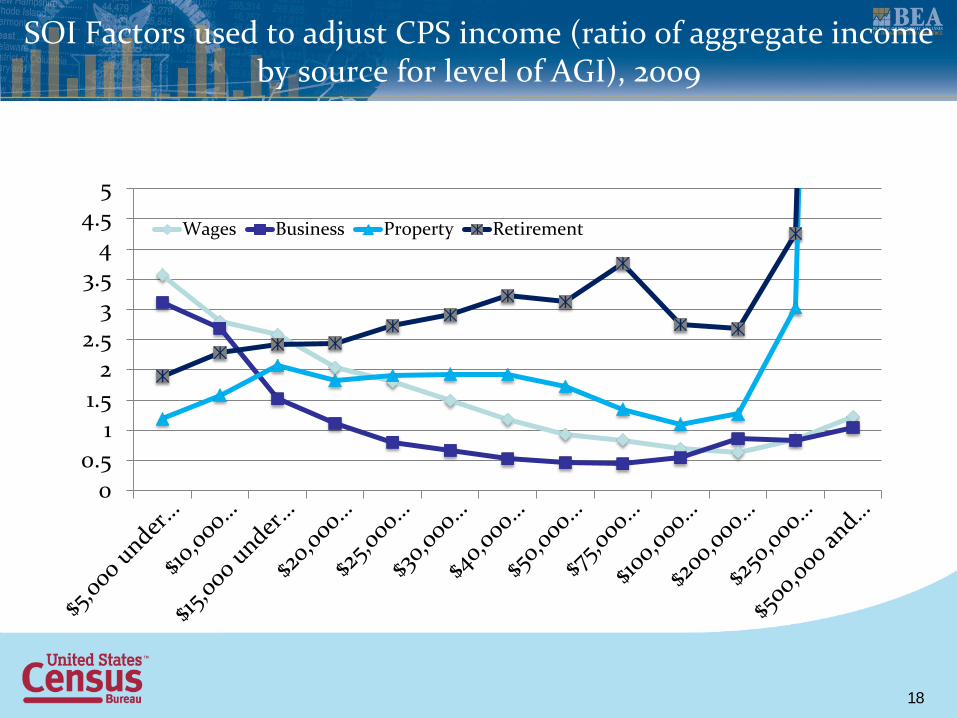
Ratio adjusting CPS distribution of income using SOI table
▪ Ratio adjust CPS distribution by the SOI totals by source and income level
▪ This procedure increases each household’s income by source and by income level, and then the new data is used to obtain distribution measures (the procedure yields a mean for each source that matches the NIPA totals).
▪ Because higher income households have higher underreporting, their income is adjusted higher while middle income households are adjusted lower.
17
www.bea.gov
SOI Factors used to adjust CPS income (ratio of aggregate income by source for level of AGI), 2009
00.5
11.5
22.5
33.5
44.5
5
Wages Business Property Retirement
18
www.bea.gov
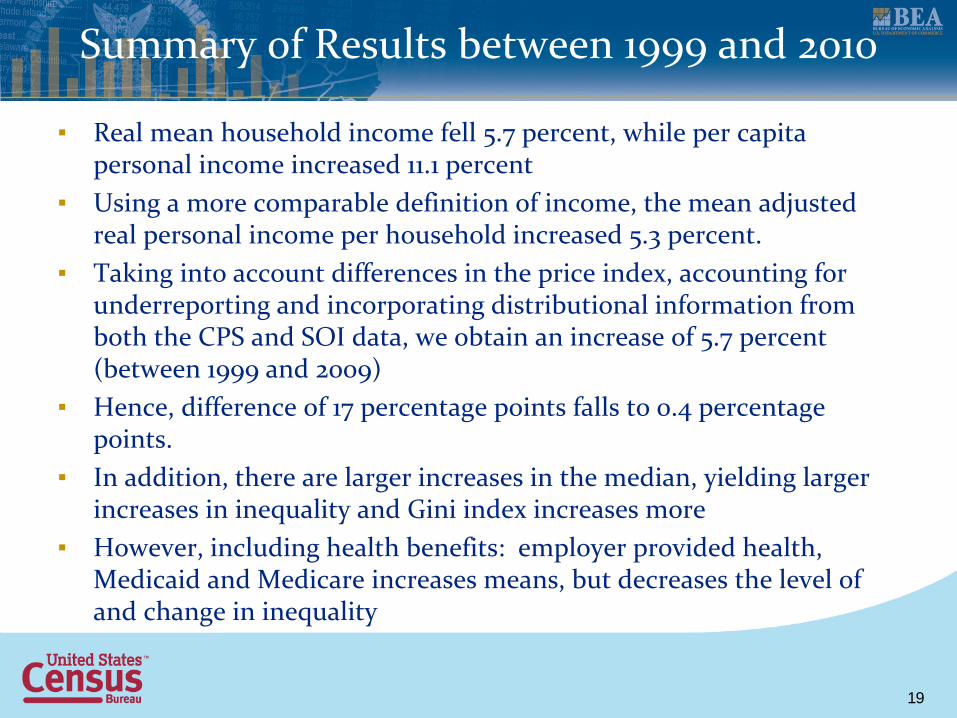
Summary of Results between 1999 and 2010
▪ Real mean household income fell 5.7 percent, while per capita personal income increased 11.1 percent
▪ Using a more comparable definition of income, the mean adjusted real personal income per household increased 5.3 percent.
▪ Taking into account differences in the price index, accounting for underreporting and incorporating distributional information from both the CPS and SOI data, we obtain an increase of 5.7 percent (between 1999 and 2009)
▪ Hence, difference of 17 percentage points falls to 0.4 percentage points.
▪ In addition, there are larger increases in the median, yielding larger increases in inequality and Gini index increases more
▪ However, including health benefits: employer provided health, Medicaid and Medicare increases means, but decreases the level of and change in inequality
19
www.bea.gov
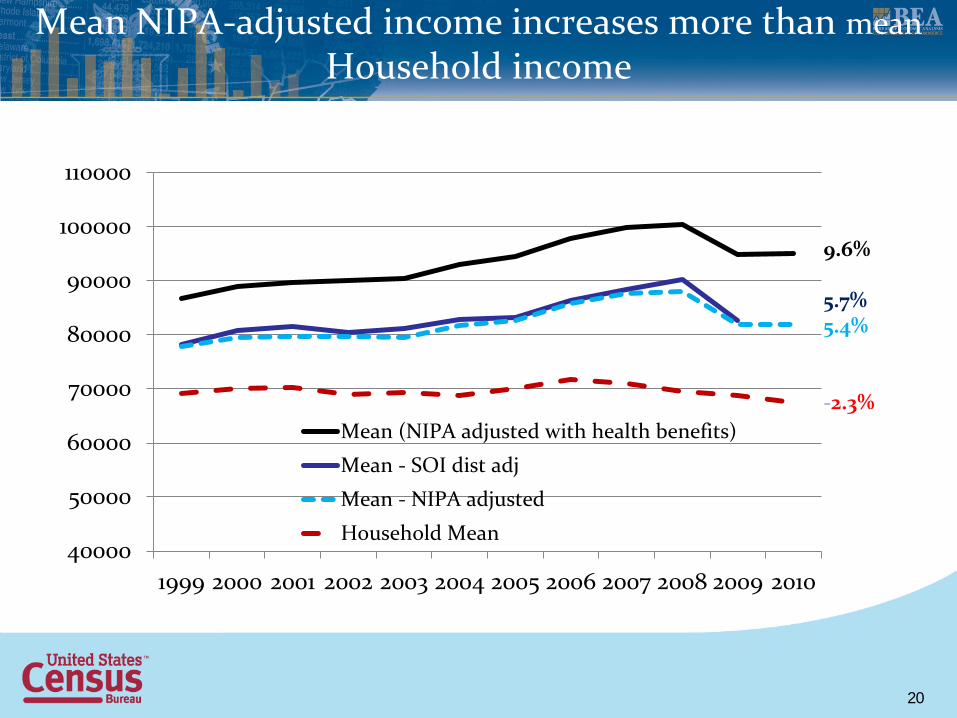
Mean NIPA-adjusted income increases more than mean Household income
40000
50000
60000
70000
80000
90000
100000
110000
1999 2000 2001 2002 2003 2004 2005 2006 2007 2008 2009 2010
Mean (NIPA adjusted with health benefits)
Mean - SOI dist adj
Mean - NIPA adjusted
Household Mean
9.6% 5.7% 5.4% -2.3%
20
www.bea.gov
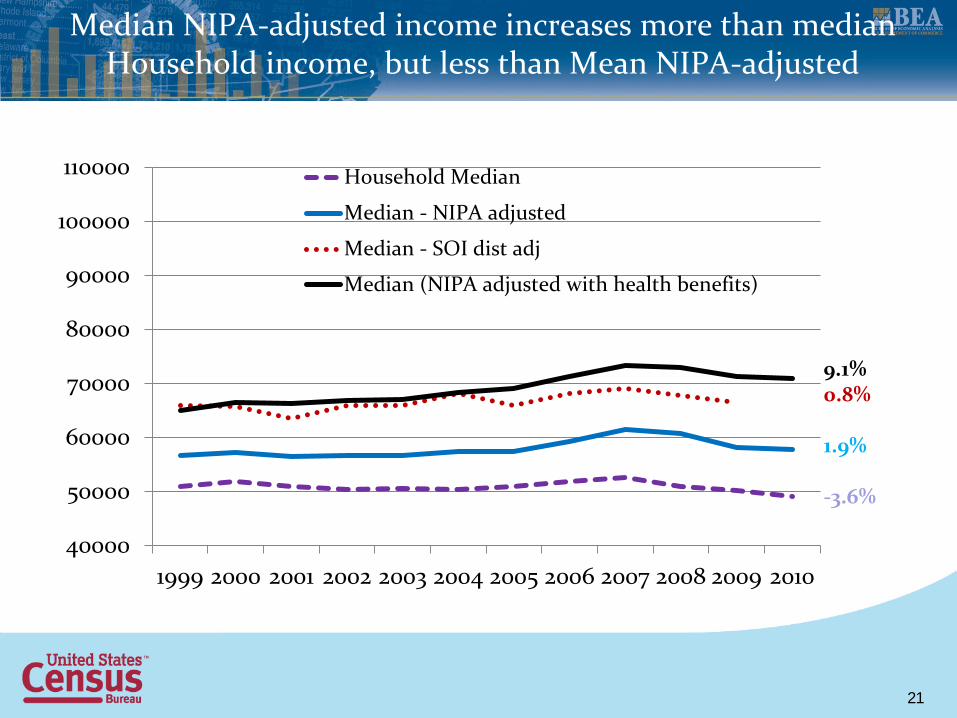
Median NIPA-adjusted income increases more than median Household income, but less than Mean NIPA-adjusted
40000
50000
60000
70000
80000
90000
100000
110000
1999 2000 2001 2002 2003 2004 2005 2006 2007 2008 2009 2010
Household Median
Median - NIPA adjusted
Median - SOI dist adj
Median (NIPA adjusted with health benefits)
9.1% 0.8% 1.9% -3.6%
21
www.bea.gov
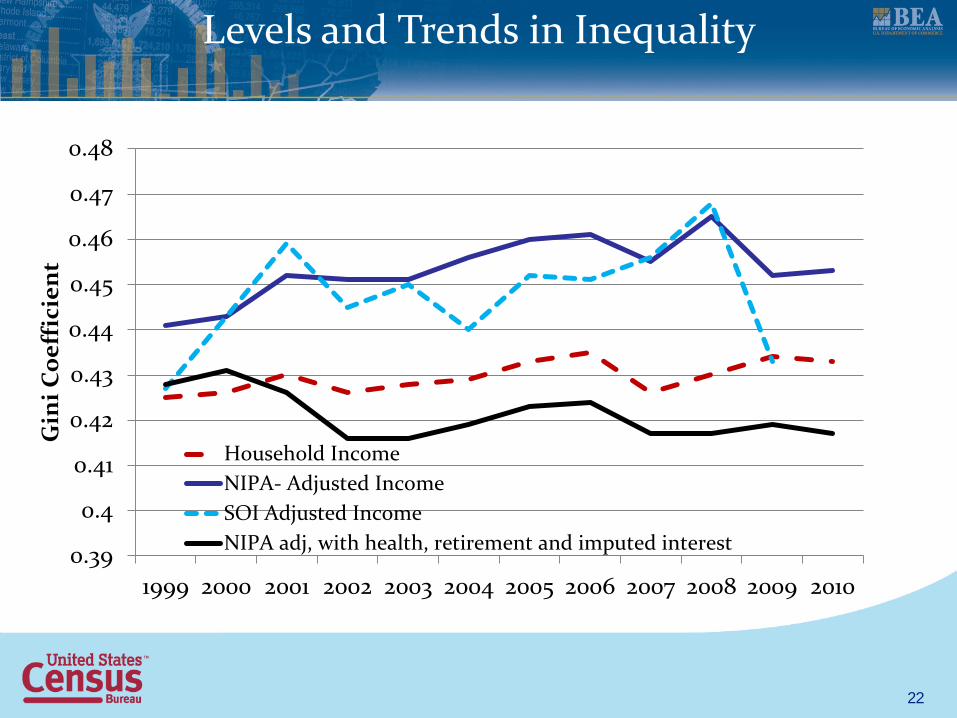
0.39
0.4
0.41
0.42
0.43
0.44
0.45
0.46
0.47
0.48
1999 2000 2001 2002 2003 2004 2005 2006 2007 2008 2009 2010
Gin
i Coe
ffic
ient
Household IncomeNIPA- Adjusted IncomeSOI Adjusted IncomeNIPA adj, with health, retirement and imputed interest
Levels and Trends in Inequality
22
www.bea.gov
Distribution of income and consumption and multipliers: an application
▪ How does the income distribution affect the Keynesian expenditure multiplier?
▪ Economic Report of the President, among others, suggests that because lower income categories have higher MPC, then a redistribution can increase the size of the multiplier.
▪ This is an old concern: Stone and Stone (1938), Goodwin (1949), Chipman (1950) and Conrad (1955)
▪ Consider a simple closed economy in which the autonomous expenditures include all expenditures except consumption
23
www.bea.gov
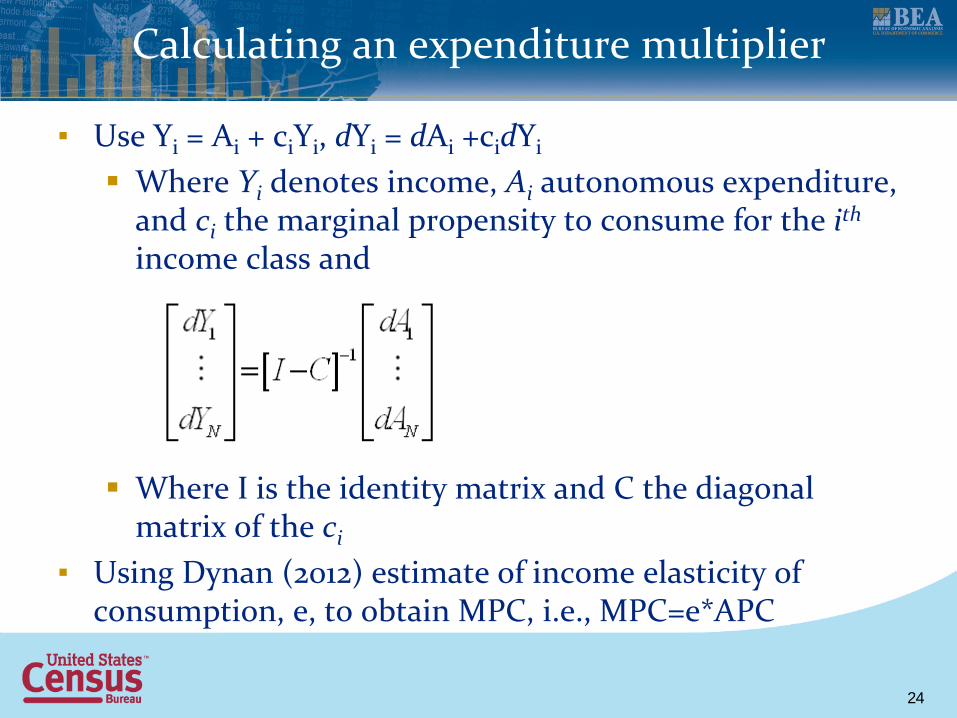
Calculating an expenditure multiplier
▪ Use Yi = Ai + ciYi, dYi = dAi +cidYi Where Yi denotes income, Ai autonomous expenditure,
and ci the marginal propensity to consume for the ith income class and
Where I is the identity matrix and C the diagonal matrix of the ci
▪ Using Dynan (2012) estimate of income elasticity of consumption, e, to obtain MPC, i.e., MPC=e*APC 24
www.bea.gov
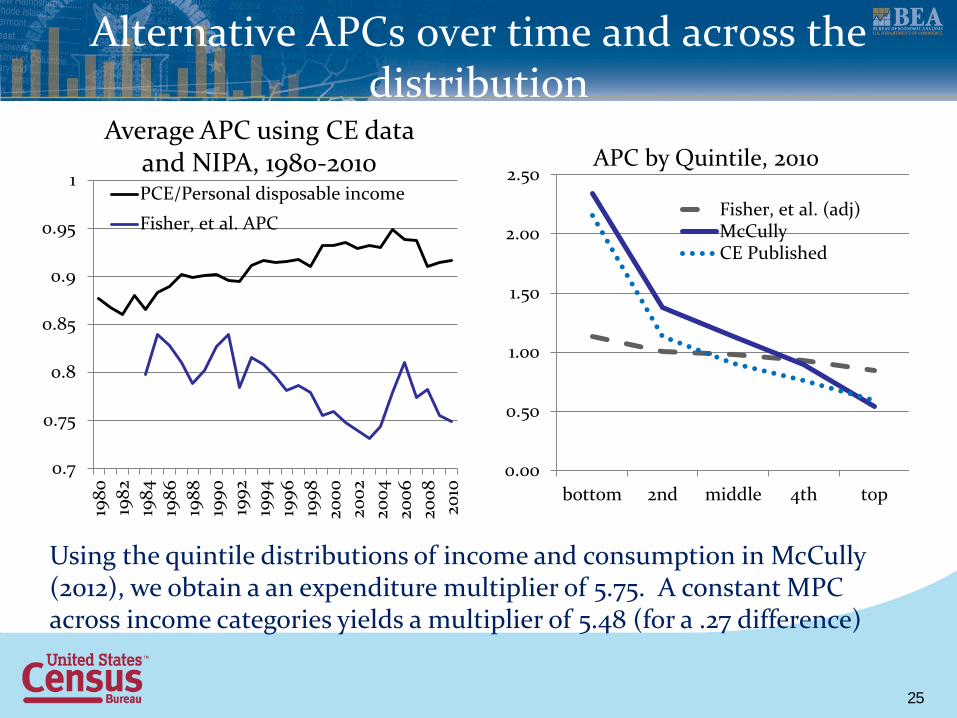
Alternative APCs over time and across the distribution
0.7
0.75
0.8
0.85
0.9
0.95
1
1980
1982
1984
1986
1988
1990
1992
1994
1996
1998
2000
2002
2004
2006
2008
2010
Average APC using CE data and NIPA, 1980-2010 PCE/Personal disposable income
Fisher, et al. APC
Using the quintile distributions of income and consumption in McCully (2012), we obtain a an expenditure multiplier of 5.75. A constant MPC across income categories yields a multiplier of 5.48 (for a .27 difference)
0.00
0.50
1.00
1.50
2.00
2.50
bottom 2nd middle 4th top
APC by Quintile, 2010
Fisher, et al. (adj)McCullyCE Published
25
www.bea.gov
Social Welfare Function: An application
▪ Consider µ(1-G) as the SWF (as in Sen (1973)); µ is the mean income and G in the respective Gini coefficient
▪ Similar to Jorgenson (1990), Jorgenson and Slesnick (2012) and Jones and Klenow (2011)
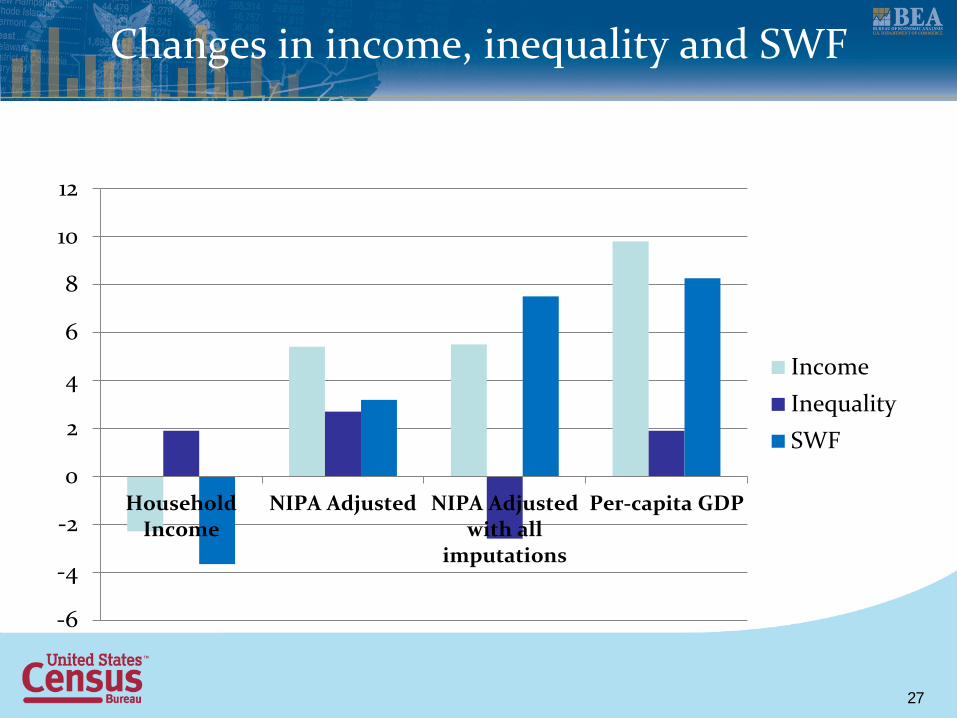
▪ Larger increases in income yield larger increases in SWF, while larger increases in inequality diminish increases in SWF.
26
www.bea.gov
Changes in income, inequality and SWF
-6
-4
-2
0
2
4
6
8
10
12
HouseholdIncome
NIPA Adjusted NIPA Adjustedwith all
imputations
Per-capita GDP
IncomeInequalitySWF
27
www.bea.gov
Conclusion and Future Work
▪ Almost 60 years ago, Kuznets (1955) stated: “Today, there is increased concern about the skewed income distribution, and the increase in skewness over time.”
▪ We constructed two straightforward ways to provide a distribution to NIPA Personal Income
▪ We show that many subjective decisions are part of the transformation ▪ Future work involves analysis of the matched household data with the
tax records to more completely measure income underreporting. ▪ Multiplier analysis will be improved by incorporating similar
decompositions of PCE and personal income that rely on the distribution of the household survey data (as in McCully (2012))
▪ The results in this paper may provide a framework for developing measures of median personal income and their distribution that could be produced on a regular basis.
28