accelerated electrification accelerated electrification · accelerated electrification executive...
TRANSCRIPT

Accelerated electrificationEvidence, analysis and recommendations30 APRIL 2019
30 APRIL 2019
Ac
celera
ted elec
trifica
tion

Published on 30 April 2019 by the Interim Climate Change Committee, New Zealand.
© Crown Copyright
This work is licensed under the Creative Commons Attribution 4.0 International licence. In essence, you are free to copy, distribute and adapt the work, as long as you attribute the work to the New Zealand Government and abide by the other licence terms. To view a copy of this licence, visit https://creativecommons.org/licenses/by/4.0/.
DisclaimerWhile all care and diligence has been used in processing, analysing, and extracting data and information for this publication, the Interim Climate Change Committee gives no warranty in relation to the report or data used in the report – including its accuracy, reliability, and suitability – and accepts no liability whatsoever in relation to any loss, damage, or other costs relating to the use of any part of the report (including any data) or any compilations, derivative works, or modifications of the report (including any data).
CitationInterim Climate Change Committee (2019). Accelerated Electrification. Available from www.iccc.mfe.govt.nz.
978-0-473-47992-3 (print) 978-0-473-47993-0 (online)
All photos sourced from www.istockphoto.com or www.wikimedia.org unless otherwise specified.
Accelerated electrificationEvidence, analysis and recommendations30 APRIL 2019

2
CONTENTS 2
FOREWORD 4
EXECUTIVE SUMMARY 6
Contents
1 OUR TASK
1.1 New Zealand’s climate change commitment 9
1.2 The Interim Climate Change Committee 11
1.3 Electricity and emissions 12
1.4 What have we heard? 14
1.5 Modelling 17
1.6 This report 19
2 THE NEW ZEALAND
ELECTRICITY SYSTEM
2.1 Electricity demand 22
2.2 Electricity generation 24
2.3 Electricity capacity 26
2.4 Electricity emissions 29
2.5 Regulatory and institutional framework 31
2.6 How does the electricity system work? 33
3 THE MODELLING
3.1 The modelling questions 36
3.2 What are the models? 37
3.3 How each question was modelled 38
3.4 Inputs 39
3.5 Outputs 43
3.6 Modelling the impact of the weather 44
3.7 Summary 45
4 RESULTS OF
THE MODELLING
4.1 Generation mix 47
4.2 Capacity 51
4.3 Cost 55
4.4 Emissions 58
4.5 Summary 61

3
5 SOLVING THE
DRY YEAR PROBLEM
5.1 Can the dry year problem be solved? 63
5.2 Analysis of dry year options 65
5.3 Comparison of dry year options 69
5.4 Summary 71
NEW ZEALAND’S RESOURCE MANAGEMENT
6 SYSTEM
6.1 Hydropower 73
6.2 Wind 77
6.3 Geothermal 80
6.4 A more strategic approach to emissions reductions 82
6.5 Summary 83
AIMING FOR ACCELERATED
7 ELECTRIFICATION
7.1 The New Zealand Emissions Trading Scheme 86
7.2 Transport 87
7.3 Process heat 90
7.4 The electricity market 92
7.5 Summary 95
8 CONCLUSIONS AND
RECOMMENDATIONS
8.1 100% renewable electricity 97
8.2 Accelerated electrification 99
8.3 Valuing hydropower 101
8.4 Providing for the development of wind generation at scale 102
8.5 A responsive regulatory system 104
LIST OF ABBREVIATIONS 106
REFERENCES 107
ENDNOTES 110
ACKNOWLEDGEMENTS 117

ACCELERATED ELECTRIFICATIONFOREWORD
4
Foreword
Nei rā ka tau mai rā te ao hurihuri nei! He hau mai tawhiti tiaki taiao e hora nei!
He tohu raukura. He tohu tipuna rangatira. He toki kuruponamu ra!
Tihei mauri ora, kōkiritia te kaupapa nei!
E rau rangatira mā – Nāu! Nāku! Na tātou mo nga uri! Tēnā koutou. Tēnā tātou! Kia ora tātou katoa!
See now the changing world swirls about us, an alighted breeze, beckoning our heritage – wisdoms that bind and re-forge our resolve for and guardianship of this our natural world!
As with the raukura plumes of our forebears, bearing sacred greenstone we make headway.
Advance and overcome!
Our greetings, and our acknowledgments to all. Kia ora tātou katoa!
Dr David Prentice Chair
Dr Jan Wright
Ms Lisa Tumahai Deputy Chair
Dr Keith Turner
Dr Harry Clark
Dr Suzi Kerr
ACCELERATED ELECTRIFICATIONFOREWORD
5
The Interim Climate Change Committee began work on 1 May 2018. Although our Terms of Reference were set by the Government, we are an independent committee and have been vigilant in guarding that independence. That said, we have not worked in isolation, but engaged with a wide variety of individuals, organisations, and businesses.
Within the Terms of Reference, we were asked to answer two questions, and to do so using evidence and analysis. One of the questions is concerned with agricultural greenhouse gases, and is the subject of a separate report. The other is concerned with electricity, and is the subject of this report.
New Zealand has long benefitted from a high percentage of renewable electricity generated from hydro power and, increasingly, from wind. As a result, electricity generation is responsible for only 5% of New Zealand’s emissions, whereas transport and process heat account for nearly 30%.
Reducing emissions from transport and industry will largely rely on switching from fossil fuels to electricity. Electricity will become an even more important pillar of our economy. It is vital then that it is affordable – to encourage substitution and to be accessible for the less well-off.
New Zealand has a long way to go if we are to contribute to the goals of the Paris Agreement. In this report we have explored
a future of ‘accelerated electrification’– electrifying up to half our vehicle fleet by 2035 and increasing the amount of process heat provided by electricity instead of coal or gas. This electrification using renewable electricity will be a crucial step and will need significant policy action to make it happen. It will also be crucial that the proposed reforms of the Emissions Trading Scheme go ahead.
A future of accelerated electrification for New Zealand will require building considerably more wind farms, more geothermal and solar generation, more transmission lines, and possibly more hydro storage. All these will have impacts on the environment – some challenging decisions lie ahead for our resource management system.
We expect that the Climate Change Commission, when formed, will extend this work as part of building the evidence needed to underpin New Zealand’s future emissions budgets.
Almost daily, we are presented with reports that underscore the reality of a changing climate. We owe it to our children and grandchildren to act. This report is a step in a long journey toward eliminating greenhouse gas emissions. We are clear that what is recommended in this report is, on its own, not enough. Other parts of the economy must also play their part.
We are grateful for the efforts of the many people who have contributed in various ways to this report. We hope that the engagement process started during this investigation is only the beginning.

ACCELERATED ELECTRIFICATIONEXECUTIVE SUMMARY
6
New Zealand has set a target for reducing the country’s greenhouse gas emissions under the Paris Agreement. However, without considerable change from the status quo, that target will not be met. New Zealand’s commitment to addressing climate change also seeks to align with the ideals of kaitiakitanga – the need to care for and be active stewards and custodians of our taonga, our environment and our planet for future generations.
As part of its efforts to reduce emissions, the Government asked the Interim Climate Change Committee to provide advice on planning for the transition to 100% renewable electricity by 2035. The Terms of Reference for this work state that the Committee must take into account the objective of minimising emissions from electricity generation, together with security of supply and affordability for consumers.
At present New Zealand’s electricity system is about 82% renewable. Electricity represents about 5% of New Zealand’s total greenhouse gas emissions – about 4 million tonnes carbon dioxide equivalent (Mt CO2e) out of a total of around 80 Mt CO2e. New Zealand is fortunate to already have such a high proportion of renewable electricity. But due to the heavy reliance of the electricity system on hydropower, its key challenge is coping with a ‘dry year’ when hydro inflows are low.
To investigate future possibilities for the electricity system out to 2035, the Committee
commissioned a modelling exercise, the results of which form the backbone of this report.
The modelling shows that, under a business as usual future, New Zealand is likely to reach an average of 93% renewable electricity by 2035. More wind, solar and geothermal will be built, and more batteries will be deployed.
The modelling also shows that it is technically feasible to achieve 100% renewable electricity by ‘overbuilding’. This means building additional renewable generation like wind and solar to cover dry years, and substantially increasing battery storage and demand response.
However, such a solution is very costly, particularly in terms of achieving the last few percent of renewable electricity. Going from 99% to 100% renewable electricity by overbuilding would avoid only 0.3 Mt CO2e of emissions at a cost of over $1,200 per tonne of CO2e avoided. It is also likely to result in much higher electricity prices than in the business as usual future.
The Committee investigated an alternative future, aiming to understand whether accelerated electrification of transport and process heat could achieve larger emissions reductions while keeping electricity affordable.
The modelling showed that, in this accelerated electrification future, generating the required electricity would result in about 3.6 Mt CO2e of greenhouse gas emissions in 2035. However, this would be more than offset by 6.4 Mt CO2e of avoided emissions from transport and 2.6 Mt CO2e of avoided
Executive summary

ACCELERATED ELECTRIFICATIONEXECUTIVE SUMMARY
7
emissions from process heat. Added together, the net emissions reductions would be 5.4 Mt CO2e in 2035.
Under the accelerated electrification future, electricity prices remain affordable. This is vital because consumers will not switch to electricity if it is too expensive compared to fossil fuels, and so potential emissions savings would be less.
The Committee therefore recommends that the Government prioritises the accelerated electrification of transport and process heat over pursuing 100% renewable electricity by 2035 in a normal hydrological year.
Policy changes will be needed to achieve this level of accelerated electrification. These policies must fulfil the Tiriti o Waitangi principle of partnership and good faith with iwi and hapū.
The Committee recommends that the Government sets a target for reducing annual transport emissions by at least 6 Mt CO2e in the year 2035 relative to current levels. Policies to achieve this target will be needed without delay. Such policies should also proactively enable low-emissions mobility for low-income and rural households.
The Committee recommends that the Government strongly encourages the phase out of fossil fuels for process heat by deterring the development of any new fossil fuel process heat, and setting a clearly defined timetable to phase out fossil fuels in existing process heat (with a priority phase out of coal). Government should also reduce regulatory barriers relating to electrification.
To support accelerated electrification, the Committee has identified changes needed in the resource management system and in the electricity regulatory system.
The Committee recommends that the Government ensures that the value of
existing hydro to New Zealand’s climate change objectives is given sufficient weight when decisions about freshwater are made. The Government should work collaboratively with iwi/Māori to co-design solutions so that rights and interests in freshwater (including geothermal fluids) are resolved within the context of the Māori-Crown partnership. The Government should also provide for the large scale development of wind generation and its associated transmission and distribution infrastructure.
A responsive regulatory system must facilitate changes in the market, while ensuring that appropriate consumer protections are in place. The Committee recommends that regulators be required to take emissions reductions objectives into account, as well as facilitating and enabling new generation and both market and distribution innovation.
Finally, while a future with accelerated electrification of transport and process heat should be pursued, eliminating fossil fuels from the electricity system must occur at some point.
Emissions from geothermal must also be reduced. A well-functioning New Zealand Emissions Trading Scheme will be a critical tool in encouraging the adoption of geothermal emissions capture technology.
The Committee examined ways, other than overbuilding, to achieve 100% renewable electricity and eliminate the use of fossil fuels in the electricity system. These included biomass, hydrogen and pumped hydro (with storage).
A pumped hydro scheme at a scale that could solve New Zealand’s dry year problem shows promise. Such a scheme could also help manage demand peaks and increased levels of intermittency. The Committee recommends that the Government investigates the potential for pumped hydro storage to eliminate the use of fossil fuels in the electricity system.

1.
Our task

SECTION 1.OUR TASK
ACCELERATED ELECTRIFICATION
9
1.1 New Zealand’s climate change commitmentIn 2015 New Zealand committed as part of the Paris Agreement, alongside other nations, to holding the increase in the global average temperature to well below 2°C, and pursuing efforts to limit the temperature increase to 1.5°C above pre-industrial levels. The Paris Agreement represented a major turning point in the international climate change fight.
New Zealand has made a commitment for its 2030 target under the Paris Agreement. However, without considerable change from the status quo, this target will not be met. New Zealand’s commitment to address climate change also seeks to align with the ideals of kaitiakitanga, the need to care for and be active stewards and custodians of our taonga, our environment, and our planet for future generations.
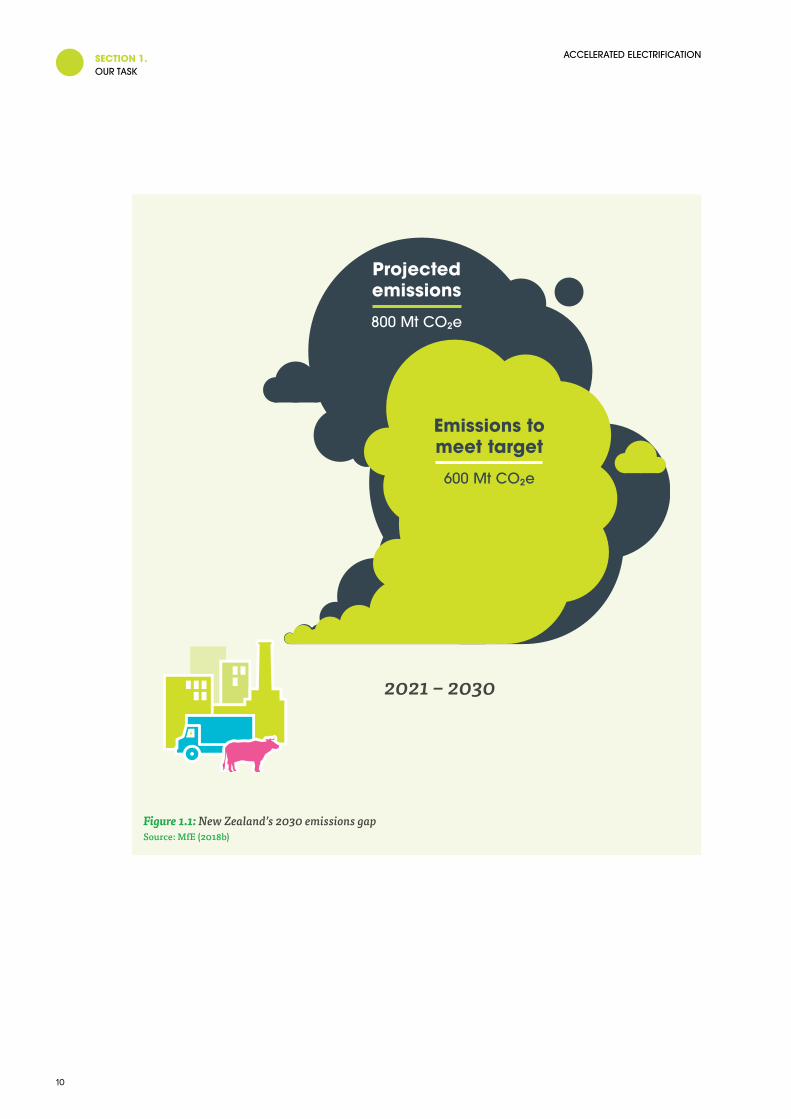
Time is of the essence. New Zealand’s 2030 target is a cumulative target – it is made up of all emissions between 2021 and 2030 (not just emissions in the year 2030). In other words, emissions every year from 2021 to 2030 matter, and so progress must begin immediately to bring emissions down. To meet its target, New Zealand can only emit about 600 million tonnes of carbon dioxide equivalent (Mt CO2e)1 over this period, but government projections show New Zealand is on track to overshoot this target by about 200 Mt CO2e (Figure 1.1).
SECTION 1.OUR TASK
ACCELERATED ELECTRIFICATION
10
2021 – 2030
Projected emissions
800 Mt CO₂e
Emissions to meet target
600 Mt CO₂e
Figure 1.1: New Zealand’s 2030 emissions gapSource: MfE (2018b)

SECTION 1.OUR TASK
ACCELERATED ELECTRIFICATION
11
1.2 The Interim Climate Change CommitteeThe Interim Climate Change Committee (the Committee) is an independent committee established as a precursor body to a proposed permanent Climate Change Commission.
To make progress before the Commission is in place, the Committee was asked to provide advice to the Government on:
• Planning for the transition to 100% renewable electricity by 2035
• How surrender obligations could best be arranged if agricultural methane and nitrous oxide emissions enter into the New Zealand Emissions Trading Scheme (NZ ETS).
This report is about electricity. The Committee’s recommendations on agriculture are contained in a separate companion report.2
SECTION 1.OUR TASK
ACCELERATED ELECTRIFICATION
12
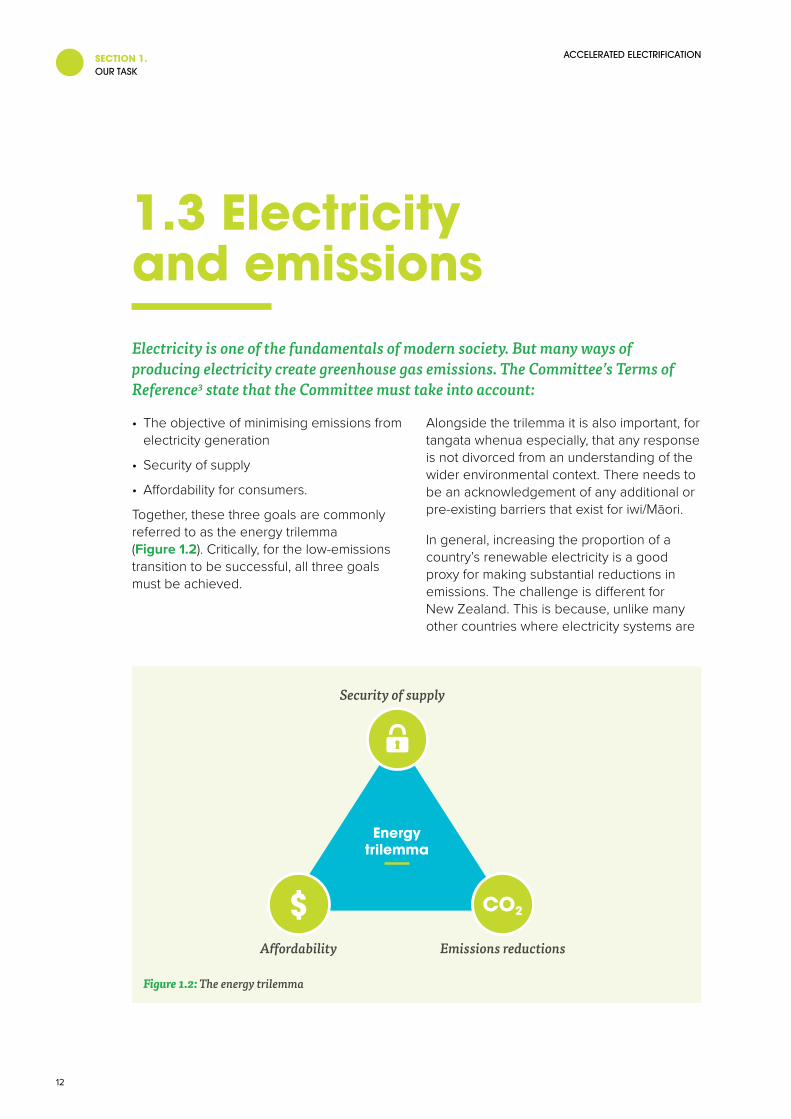
1.3 Electricity and emissionsElectricity is one of the fundamentals of modern society. But many ways of producing electricity create greenhouse gas emissions. The Committee’s Terms of Reference3 state that the Committee must take into account:
• The objective of minimising emissions from electricity generation
• Security of supply
• Affordability for consumers.
Together, these three goals are commonly referred to as the energy trilemma (Figure 1.2). Critically, for the low-emissions transition to be successful, all three goals must be achieved.
Alongside the trilemma it is also important, for tangata whenua especially, that any response is not divorced from an understanding of the wider environmental context. There needs to be an acknowledgement of any additional or pre-existing barriers that exist for iwi/Māori.
In general, increasing the proportion of a country’s renewable electricity is a good proxy for making substantial reductions in emissions. The challenge is different for New Zealand. This is because, unlike many other countries where electricity systems are
CO2$A�ordability Emissions reductions
Security of supply
Energytrilemma
Figure 1.2: The energy trilemma

SECTION 1.OUR TASK
ACCELERATED ELECTRIFICATION
13
heavily reliant on fossil fuels like coal and natural gas, most of New Zealand’s electricity generation is already renewable.
In New Zealand, total annual greenhouse gas emissions are about 80 Mt CO2e, of which electricity generation is about 4 Mt CO2e – around 5% (Figure 1.3). Other sources of emissions are larger, like transport (20% of emissions) and process heat (8% of emissions). Just over half of transport emissions are from light vehicles.
Process heat is heat energy (often in the form of steam, hot water or hot gases) which is used by the industrial, commercial and public sectors for industrial processes, manufacturing and space heating. For example, coal is burnt in large industrial boilers to create heat that dries liquid milk into milk powder and schools use fossil fuels in boilers for space heating.
Around 60% of process heat in New Zealand is created using fossil fuels: coal, natural gas and diesel. The remainder is met by electricity, geothermal energy and biomass.4
Replacing fossil fuels in transport and process heat with electricity has the potential to substantially reduce New Zealand’s emissions. The challenge is clear – it is not so much about reducing emissions from the generation of electricity in a narrow sense, but it is about using low or zero-emissions energy to fuel the economy.
Consequently, while this report does look at how a transition to 100% renewable electricity by 2035 could be achieved, it also goes beyond this to the potential of electricity to reduce emissions in transport and process heat.
0 20 40 60 80 Mt CO₂e
Agriculture48%
Other19%
Transport20% 8%
Pro
cess
hea
t
5%
Elec
tric
ity g
ener
atio
n
Figure 1.3: New Zealand’s emissions profileSource: MfE (2019a)
Note: ‘Other’ refers to sources of emissions outside the focus of the Committee’s work on electricity and agriculture. It includes emissions from waste, industrial processes and product use, and other individually smaller sources of emissions like fuel combusted in off-road vehicles and other machinery.

SECTION 1.OUR TASK
ACCELERATED ELECTRIFICATION
14
1.4 What have we heard?People hold a wide range of different expectations about the future. The possibilities for New Zealand’s electricity system are no different – there are a wide range of views about how electricity will be generated and supplied to end users, how new technologies will develop and what the associated policies should be.
The Committee conducted an extensive series of engagements over the course of its work. These ranged from small meetings, large hui, workshops and forums; to site visits and engagements with individuals, iwi/Māori, businesses, government and other organisations.
A technical review group assisted with the modelling that is the analytical core of this report5 and the Committee also liaised with the Expert Advisory Panel leading the Electricity Price Review (see section 7.4).
In April 2019, the Committee had preliminary engagements with a Youth Forum comprising members from Generation Zero, Te Ara Whatu, Pacific Climate Warriors, School Strike 4 Climate, SustainedAbility, OraTaiao, and with member organisations of the NZ Climate Action Network. A key outcome from those engagements was a recognition that a future Climate Change Commission needs to engage widely, early and meaningfully with environmental non-governmental organisations.
Much of what the Committee heard during these engagements appeared to be commonly held views – they were themes that were frequently repeated (Figure 1.4). However, there were still some diverging opinions about things like what the future electricity system could look like in New Zealand (Figure 1.5).

SECTION 1.OUR TASK
ACCELERATED ELECTRIFICATION
15
Iwi/Māori values and interests
in freshwater are fundamental
The transitionmust be inclusive and support the most vulnerable
Solar and batteries have an
important role to play
Electric vehicles
are an opportunity, but battery waste is
an issue
Achieving 100% renewable electricity will be
costly
Political consensus to provide investment certainty
is critical
The resource management system needs
changing to enable a low-emissions future
An eff ectiveNZ ETS is key
Treaty partnerships
(co-governance and co-management)
are a high priority to Māori
Urgent action to reduce emissions
is needed
If electricity prices are too high, fuel switching could
be discouraged
Well-functioning transmission and
distribution networks will be crucial, even with
more off -grid generation
Figure 1.4: Commonly expressed views heard during the Committee’s engagement process

SECTION 1.OUR TASK
ACCELERATED ELECTRIFICATION
16
A gradual change will occur in the transport
fleet. There will be supply constraints and a slow
turnover to EVs.
More people will choose to become energy independent,
facilitated by new technology. Off-grid solutions will become more popular and fewer people will
support required network infrastructure
investment.
Achieving big reductions will require a signifi cant
intervention and change of market design, such as a capacity market, to make sure there is dry year
storage.
Technology costs are uncertain,
no silver bullet exists and the technology mix and
market structure in 2035 will look mostly like it
does today.
The transmission and distribution networks are
critical infrastructure that will be required to 2035 and beyond. Investment will be needed to ensure they continue to provide
secure, reliable electricity.
The market will deliver the changes needed in
the electricity system to get emissions reductions and
ensure security of supply.
Technology costs will fall fast,
particularly for X or Y technology (for example, wave,
off shore wind). This will lead to a diff erent uptake than predicted
for New Zealand and will radically change the
market.
The transport sector will look
radically di� erent by 2035. Transport as a service will be
widespread, autonomous vehicles will be available, electric will be
the norm and personal car ownership will have
fallen dramatically.
Figure 1.5: Key places where opinions diverged during the Committee’s engagement process

SECTION 1.OUR TASK
ACCELERATED ELECTRIFICATION
17
1.5 ModellingIn order to investigate future possibilities for the electricity system out to 2035, the Committee commissioned a modelling exercise which forms the backbone of this report. Figure 1.6 shows the three main modelling questions.
What happens in a business as usual
future?
1 2 3What happens if
New Zealand targets 100% renewable
electricity?
What happens if New Zealand targets
accelerated electrification of transport and
process heat?
Figure 1.6: Modelling questions
In the business as usual future, current market conditions and policies continue relatively unchanged along their current path. This provides a reference point for testing the effect of more targeted policy interventions.
In the 100% renewable electricity future, all fossil fuels are deliberately removed from the New Zealand electricity system.
In the accelerated electrification future, the electricity system is used to deliver emissions reductions via fuel switching in transport and process heat. The intent of this future is to test whether a much larger amount of low-emissions electricity can be delivered to achieve accelerated transport and process heat electrification, while keeping electricity prices affordable.
A supplementary technical annex is also available which delves further into the detail of the modelling.6

SECTION 1.OUR TASK
ACCELERATED ELECTRIFICATION
18
Solar in schools
Over 100 schools in New Zealand have rooftop solar. The largest opened in February 2019 at Kaitaia College and is about 25 times larger than an average household system.
The potential for financial savings is a key motivator for schools to install solar panels. For example, Kaitaia College’s system is expected to save the school hundreds of thousands of dollars over its 25-year life. However, funding is an issue. While financing for Kaitaia College’s system was arranged through a solar provider, many schools are unable to prioritise funding from tight budgets for a non-core investment that has a longer-term payoff.
There are also some challenges regarding the fundamentals of solar generation. The profile of electricity generated from solar does not match the typical profile of a school’s energy needs. Like a household, energy use at schools peaks in the cooler months when heating and more lighting is needed. On the other hand, solar output peaks in summer during school holidays.
This results in a high proportion of solar output being exported to the grid, meaning it is ‘sold’ to a retailer for a price that is related to the wholesale generation price, about a third of the retail price of electricity. This exported electricity may also be sold to other parties, such as homes in the local community or other schools, through ‘peer-to-peer’ trading. This would require financial contracts, and most likely a service provider to manage it, similar to retailer functions.
More cost-effective emissions savings could be made by replacing fossil fuel boilers used for heating schools. This is a form of process heat that could either be replaced with heat pumps or converted to biomass (for example, wood pellets).
Other opportunities for emissions savings in schools include energy management and monitoring, solar water heating for pools, and the installation of LED lights.

SECTION 1.OUR TASK
ACCELERATED ELECTRIFICATION
19
1.6 This reportThe rest of this report is structured as follows:
• Chapter 2 explains the current structure of the New Zealand electricity system
• Chapter 3 outlines the approach to the modelling
• Chapter 4 presents the key results of the modelling, based on the questions in Figure 1.6
• Chapter 5 explores options to solve New Zealand’s ‘dry year’ problem
• Chapter 6 examines the resource management system in the context of electricity generation, including issues of specific relevance to iwi/Māori
• Chapter 7 discusses policies in relation to the electricity market, transport and process heat
• Chapter 8 presents the main conclusion and recommendations of this report.

2.
The New Zealand electricity system

SECTION 2.THE NEW ZEALAND ELECTRICITY SYSTEM
ACCELERATED ELECTRIFICATION
21
The electricity system encompasses the entire process of generating, transmitting (through the system of high voltage lines that make up the national grid), distributing (through the lines that carry electricity around our streets) and consuming electricity.
This chapter provides a brief outline of the basics of the New Zealand electricity system, and introduces core technical concepts relevant for the modelling work.
SECTION 2.THE NEW ZEALAND ELECTRICITY SYSTEM
ACCELERATED ELECTRIFICATION
22
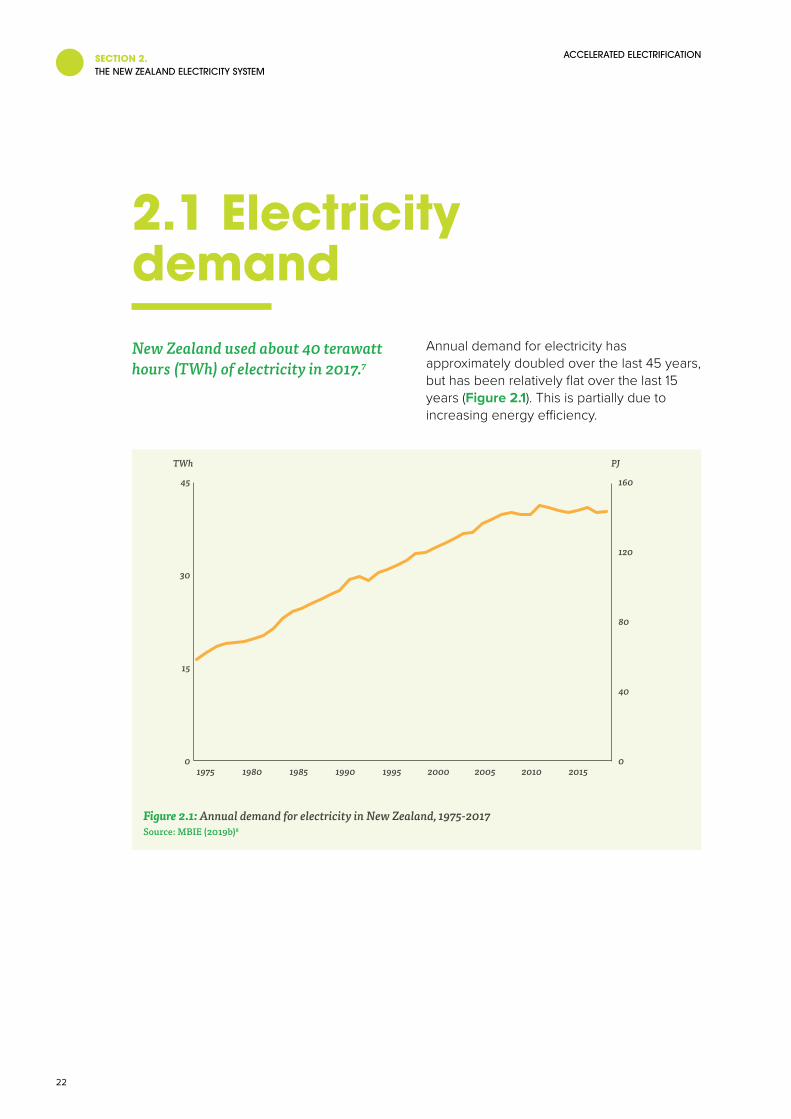
2.1 Electricity demandNew Zealand used about 40 terawatt hours (TWh) of electricity in 2017.7
Annual demand for electricity has approximately doubled over the last 45 years, but has been relatively flat over the last 15 years (Figure 2.1). This is partially due to increasing energy efficiency.
0
30
45
15
TWh PJ
0
40
80
120
160
201520102005200019951990198519801975
Figure 2.1: Annual demand for electricity in New Zealand, 1975-2017Source: MBIE (2019b)8
SECTION 2.THE NEW ZEALAND ELECTRICITY SYSTEM
ACCELERATED ELECTRIFICATION
23
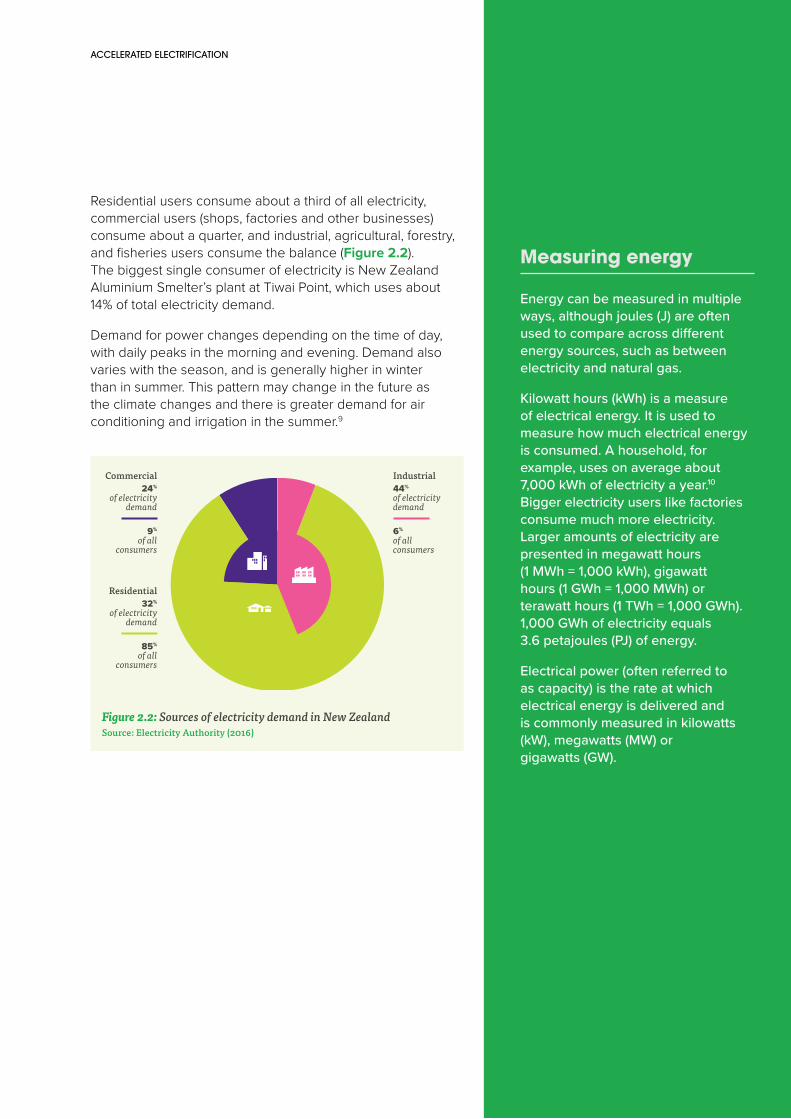
Residential users consume about a third of all electricity, commercial users (shops, factories and other businesses) consume about a quarter, and industrial, agricultural, forestry, and fisheries users consume the balance (Figure 2.2). The biggest single consumer of electricity is New Zealand Aluminium Smelter’s plant at Tiwai Point, which uses about 14% of total electricity demand.
Demand for power changes depending on the time of day, with daily peaks in the morning and evening. Demand also varies with the season, and is generally higher in winter than in summer. This pattern may change in the future as the climate changes and there is greater demand for air conditioning and irrigation in the summer.9
6%
of all consumers
44%
of electricity demand
Industrial
9%
of all consumers
24%
of electricity demand
Commercial
85%
of all consumers
32%
of electricity demand
Residential
Figure 2.2: Sources of electricity demand in New ZealandSource: Electricity Authority (2016)
Measuring energy
Energy can be measured in multiple ways, although joules (J) are often used to compare across different energy sources, such as between electricity and natural gas.
Kilowatt hours (kWh) is a measure of electrical energy. It is used to measure how much electrical energy is consumed. A household, for example, uses on average about 7,000 kWh of electricity a year.10 Bigger electricity users like factories consume much more electricity. Larger amounts of electricity are presented in megawatt hours (1 MWh = 1,000 kWh), gigawatt hours (1 GWh = 1,000 MWh) or terawatt hours (1 TWh = 1,000 GWh). 1,000 GWh of electricity equals 3.6 petajoules (PJ) of energy.
Electrical power (often referred to as capacity) is the rate at which electrical energy is delivered and is commonly measured in kilowatts (kW), megawatts (MW) or gigawatts (GW).

SECTION 2.THE NEW ZEALAND ELECTRICITY SYSTEM
ACCELERATED ELECTRIFICATION
24
2.2 Electricity generationIn 2017, 82% of New Zealand’s electricity was generated from renewable resources, mostly hydropower (about 60% of total supply), geothermal and wind.11 Non-renewable electricity is generated from fossil fuels (oil, coal, natural gas and diesel).12 Total generation in 2017 was about 43 TWh. About 7% of electricity generated is ‘lost’ on the way to where it is consumed, so more electricity has to be generated than is consumed.13
The mix of generation in the electricity system is an outcome of decisions made by investors (and, in the case of rooftop solar, by consumers). Investor decisions are driven by numerous factors, including financial cost, expectations about how the electricity system will grow or be regulated, and wider climate change policy (including the NZ ETS).
The proportion of renewable electricity generated in any given year depends a lot on the weather – the water flowing into the hydro system, and how windy it is. Over the last 40 years, New Zealand has swung from an annual high of 91% renewable electricity (in 1980) to an annual low of 66% (in 2005) (Figure 2.3).
0
10
20
30
40
50
TWh % Renewable
0
20%
40%
60%
80%
100%% RenewableOther renewableWindGeothermalHydroFossil fuel
2017201520102005200019951990198519801975
Figure 2.3: Electricity generation in New Zealand, 1975-2017Source: MBIE (2019b, 2018)

SECTION 2.THE NEW ZEALAND ELECTRICITY SYSTEM
ACCELERATED ELECTRIFICATION
25
Over the last 15 years, the amount of geothermal and wind generation has grown significantly. Other renewables like solar and biomass currently make up only a tiny fraction of supply (included as part of the ‘other renewable’ category in Figure 2.3).
Different electricity generation technologies have different capabilities:
• While wind and solar do not produce emissions14, they are intermittent. In other words, when there’s no wind or sun, they have no output
• Fossil fuel plant, hydro lakes and geothermal can all supply what is known as ‘baseload’ generation, that is, they can produce electricity at a constant rate at any time
• Hydropower is, however, dependent on inflows – if these are low, not as much energy can be generated from hydropower
• Some types of generation can provide electricity in a more flexible and dynamic manner by quickly ramping up or down to meet demand. In New Zealand, some hydropower can provide this type of ‘peaking’ generation, as can natural gas.

SECTION 2.THE NEW ZEALAND ELECTRICITY SYSTEM
ACCELERATED ELECTRIFICATION
26
2.3 Electricity capacityInstalled capacity is another important way to understand the electricity system. This is the maximum amount of electricity that could be produced by a particular power plant at any one point in time and is measured in megawatts (MW).
There is about 10,200 MW of installed capacity in New Zealand, 91% of which is directly connected to the grid. Non-grid connected capacity (just under 1,000 MW) is mostly cogeneration or distributed generation15 connected to the local distribution network, and it produces about 14% of New Zealand’s electricity.
About 95% of distributed generation is from renewable sources such as wind, geothermal and hydro, and ‘behind the meter’ generation such as rooftop solar. These forms of decentralised generation play a role in reducing the amount of electricity that would
otherwise have to be transmitted by the grid. This is particularly valuable when it can offset periods of peak demand when the grid is limited in some way (for example if a line fails during a storm).
Most (57%) of grid-connected capacity is in the North Island. Of the remaining grid-connected capacity, most is South Island hydro (Figure 2.4). Electricity is transmitted from the South Island to the North Island by the high-voltage direct current (HVDC) inter-island link. New Zealand is heavily reliant on South Island electricity generation and the HVDC link.
0
1,000
2,000
3,000
4,000
5,000
6,000Grid-connected
Sout
h Is
land
Nor
th Is
land
HydroWindGeothermalFossil fuelCogenerationNon-grid connected
MW
Figure 2.4: Capacity by generation type and locationSource: Electricity Authority (2019c)

SECTION 2.THE NEW ZEALAND ELECTRICITY SYSTEM
ACCELERATED ELECTRIFICATION
27
What is cogeneration and is it renewable?
Cogeneration is when both heat and electricity are produced for industrial use. Excess electricity is often exported into the local distribution network or national grid. About 390 MW of capacity (both grid connected and non-grid connected) is from cogeneration.
In New Zealand’s national statistics, cogeneration from bioenergy and geothermal is treated as renewable, such as biomass at the Kinleith pulp and paper mill. Cogeneration from fossil fuel sources is treated as non-renewable, such as at the Glenbrook steel mill.
The emissions from cogeneration plants that produce electricity as their primary purpose are attributed to the electricity sector in New Zealand’s emissions inventory.16 Emissions from other cogeneration plants are attributed to other sectors, for example manufacturing or industrial processes and product use (IPPU).17
Two other technologies can provide additional capacity in the electricity system: demand response and batteries.
DEMAND RESPONSEIn order to take pressure off the electricity system and reduce peaks in demand, users can either change when they use electricity, or reduce the amount of electricity they use. This is known as demand response.
Demand response has the potential to reduce emissions. For example, shifting demand from morning and evening peaks to other times is important because it helps to reduce the need for fossil-fuelled peaking generation.
Industrial consumers have for a long time been deploying ever increasing smart technology to optimise plant performance and minimise electricity costs (by taking advantage of off-peak electricity prices). Residential and commercial consumers are now increasingly able to access similar types of technologies. For example, if enabled by retailers, apps connected to smart meter data can allow consumers to monitor and manage their power use to show where savings can be made. This increased consumer engagement with electricity is a recognised future trend in the electricity system.
The other demand response strategy – reducing the total amount of electricity used – can also occur at a residential level, but also by commercial and industrial sites. For example, households can change to more energy efficient technologies, or commercial premises may turn off non-vital appliances for short periods when demand is high.
The largest single demand response potential in the New Zealand electricity system is the contract between the New Zealand Aluminium Smelter at Tiwai Point and Meridian Energy Limited. This contract effectively allows Meridian to reduce electricity supply to the smelter and divert it to other users in cases when there would otherwise be an electricity shortage (usually due to low hydro inflows).18

SECTION 2.THE NEW ZEALAND ELECTRICITY SYSTEM
ACCELERATED ELECTRIFICATION
28
Other types of demand response capability exist in the New Zealand system. Official conservation campaigns are when consumers are asked to voluntarily reduce electricity consumption and have in the past been triggered when hydro lakes are deemed to be below a pre-determined level.19 Transpower also has demand response arrangements to help manage the grid with a number of consumers via their Demand Response programme, such as supermarkets, wastewater treatment plants and hospitals.
BATTERIESBatteries help to smooth peaks and troughs in demand – storing electricity when prices are low (typically off-peak) and then discharging it when the electricity price is high (typically at peak times). Figure 2.5 illustrates how a grid-connected battery can help on a typical winter’s day – storing up electricity during the night, and releasing it to help meet demand during the two daily peaks (morning and evening).
Batteries installed ‘behind the meter’20 can be used in the same way. For instance, a battery may be installed as part of a roof-top solar system, where it can store excess electricity for use in the evening, or when clouds block the sun. This can help manage the impact of increased solar on a distribution network.
DischargeStorage
1:30a
m
3:30
am
5:30
am
7:30
am
9:30
am
11:3
0am
3:30
pm
5:30
pm
7:30
pm
9:30
pm
11:3
0pm
1:30p
m
0
250
-250
500
-500
MW
Figure 2.5: Possible daily battery storage and discharge profile

SECTION 2.THE NEW ZEALAND ELECTRICITY SYSTEM
ACCELERATED ELECTRIFICATION
29
2.4 Electricity emissionsIn 2017 electricity generation produced about 5% of New Zealand’s total greenhouse gas emissions (4.4 Mt CO2e). The exact level fluctuates between years depending on the weather – the average over the five years to 2017 was about 4.8 Mt CO2e a year.21
Most greenhouse gas emissions from electricity generation are carbon dioxide from the combustion of coal and natural gas. The remainder are from geothermal. While geothermal is classed as a renewable resource, it does produce emissions. Gases (mostly carbon dioxide but also some methane) are released when the geothermal fluid is extracted.22
Geothermal emissions
In New Zealand, average greenhouse gas emissions from geothermal fields are about a quarter that of natural gas. However, emissions vary substantially from one field to the next and decline over time as the field ages. New Zealand’s most intensely emitting geothermal plant has a higher emissions intensity (0.60 Mt CO2e per TWh) than that of natural gas (0.55 Mt CO2e per TWh). However, New Zealand’s other geothermal plants have considerably lower emissions than natural gas (for example between 0.03 to 0.25 Mt CO2e per TWh).23
Greenhouse gas emissions also depend on the technology used. In a closed-loop system, any non-condensable gases coming from the well are injected back into the ground with the geothermal fluids once the fluid’s heat has been used to create electricity. Open-loop geothermal systems do not re-inject fluids and gases, and so result in emissions. All geothermal plants in New Zealand are currently open-loop but a rising emissions price may encourage a shift towards closed-loop systems in New Zealand.24

SECTION 2.THE NEW ZEALAND ELECTRICITY SYSTEM
ACCELERATED ELECTRIFICATION
30
Coal Natural gas Geothermal
1990
1991
1992
1993
1994
1995
1996
1997
1998
1999
2000
2001
2002
2003
2004
2005
2006
2007
2008
2009
2010
2011
2012
2013
2014
2015
2016
2017
0
2
4
6
8
10
1
3
5
7
9
Mt CO₂e
Figure 2.6: Electricity emissions, 1990-2017Source: MfE (2019a)
Over the last two decades, electricity emissions reached a peak in 2005, and have been (mostly) declining ever since (Figure 2.6). Emissions tend to be higher when hydro storage is low and fossil fuel generation is used to meet the gap in demand. For example, 2005 saw particularly low rainfall in the South Island25, meaning that the coal and natural gas units at Huntly power station were run to meet the shortfall.
In absolute terms, most of New Zealand’s electricity emissions come from natural gas. On average, natural gas accounted for 60%
of electricity emissions over the 10 year period 2008 to 2017. However, coal results in about double the emissions per TWh of electricity produced (Table 2.1).
Emissions from electricity generated from diesel are included with natural gas in the above graph. As there is only a very small amount of diesel generation (0.4% on average26), from here on in this report, diesel generation and the associated emissions are included with natural gas.
Table 2.1: Emissions intensity of electricity production in New Zealand
Electricity emissions factor (Mt CO2e per TWh)
Coal 1.00
Natural gas 0.55
Geothermal 0.13Source: MBIE (2019b, 2016)

SECTION 2.THE NEW ZEALAND ELECTRICITY SYSTEM
ACCELERATED ELECTRIFICATION
31
2.5 Regulatory and institutional frameworkThe electricity system is made up of a number of key parties that work to supply the more than two million electricity connections in New Zealand:
• Transpower, which owns and operates the national transmission network (‘the grid’)
• Five large companies that own and operate 179 power stations that produce about 90% of New Zealand’s electricity (Contact Energy, Genesis Energy, Mercury Energy, Meridian Energy and Trustpower)
• Around 40 companies that own and operate about 90 small power stations, these are typically distributed generation
• 29 electricity distribution businesses (also known as lines companies) that transport electricity from the grid, or from distributed generation, to homes and businesses
• About 30 electricity retailers that sell electricity to consumers (some generators also run retail businesses, including the five large generators)
• The Ministry of Business, Innovation and Employment (MBIE) which acts as the regulatory steward of the resource and energy markets
• The Electricity Authority which governs and monitors the electricity market
• The Energy Efficiency and Conservation Authority that is responsible for promoting energy efficiency, energy conservation, and renewable energy
• The Commerce Commission that regulates Transpower and lines companies because they operate with little or no competition
• The Gas Industry Company that co-regulates the gas market.
The electricity system is covered by a series of regulations. These include regulations designed to ensure security of supply, encourage renewable generation, and to keep electricity assets safe.
Relevant regulations are sometimes directly targeted towards the electricity industry (such as the Electricity Industry Participation Code 2010). Other regulations with a broader focus also influence how the electricity system operates. For example, the Resource Management Act 1991 plays a major role in determining the type of electricity generation that gets consented. Another is the NZ ETS.

SECTION 2.THE NEW ZEALAND ELECTRICITY SYSTEM
ACCELERATED ELECTRIFICATION
32
REVIEWS OF THE ELECTRICITY SYSTEMTwo current reviews of the electricity system are relevant to the work of the Committee. The first is the Electricity Authority’s ongoing Transmission Pricing Review. This work, which began in 2009, is considering options for how transmission costs are allocated.28
The second is the Electricity Price Review coordinated by MBIE. This review is investigating whether the current electricity market delivers a fair and equitable price to consumers. It is also considering possible improvements to ensure the market and its governance structures will continue to be appropriate into the future, as the sector benefits from rapidly changing technology and new innovations.
This review is running concurrently with the work of the Committee and so the Committee has met regularly with the Electricity Price Review to avoid unnecessary overlaps in its work. The Electricity Price Review’s final report is due to be delivered to the Minister of Energy and Resources by May 2019.
The New Zealand Emissions Trading Scheme
In the NZ ETS, participants calculate their greenhouse gas emissions then buy and surrender units (NZUs) equivalent to these emissions – 1 NZU corresponds to 1 tonne of CO2e. Electricity generation can result in greenhouse gas emissions from the burning of fossil fuels, or from gases escaping from geothermal plants. The responsibility for reporting and paying for these emissions via the NZ ETS may lie with the fuel importer or miner in the case of fossil fuels, or with the electricity generator.
Within the energy sector, NZ ETS costs are generally passed down through the supply chain to consumers, through petrol or electricity prices among other things. For example, at an NZU price of $25/t CO2e, the estimated NZ ETS cost per litre of petrol is $0.06. For an average New Zealand household, this adds up to about $58 a year.27
These ‘pass-through costs’ are dependent on several factors, including contracts between firms, how NZ ETS participants manage their obligations (for example via hedge markets), and choices the electricity producer makes about passing on costs.
SECTION 2.THE NEW ZEALAND ELECTRICITY SYSTEM
ACCELERATED ELECTRIFICATION
33
2.6 How does the electricity system work?Most electricity generated in New Zealand is scheduled and dispatched into the grid by the system operator (Transpower) to meet demand in real time. The price that generators receive for each unit of electricity varies every half hour, and at 250 locations around the country.29 Wholesale electricity prices (also called ‘spot prices’) are set through a competitive market for generation. The wholesale electricity price is just one component of retail electricity prices.30
Retailers buy electricity to supply their customers from this wholesale market, paying either the wholesale price, or a price set in a contract they have with a generator, for each unit of electricity. These contracts can be very complex in order to cover the risk of dry years and contingency events. Some large commercial and industrial consumers buy electricity directly from the wholesale market, or contract with a retailer to pay the wholesale price. A few retailers offer wholesale prices to residential consumers, but most households pay a flat rate for each unit of electricity they consume to protect them from spot price volatility.
The wholesale price can be volatile because it is a signal about supply and demand – it reflects the cost of generation needed to meet demand at the time, and any constraints
on supply. An example is that it is usually much lower overnight because demand is low. Conversely, the wholesale price will be higher when demand peaks on a cold winter evening or supply is constrained in some way.
There can also be sustained periods, weeks for example, where wholesale prices are higher than average – usually due to a dry year (see section 3.7) or plant outage that affects supply. An example was in 2018 when a combination of dry conditions and an outage of the offshore pipeline at the Pohokura gas field pushed spot prices to average about $300/MWh.
Retailers and large customers that buy directly from the wholesale market will enter into contracts for electricity to ‘hedge’ themselves against these fluctuations in the wholesale price. Contracts on this ‘hedge market’ come in a variety of forms, such as over-the counter products and derivative products.31 The hedge market is central to enabling retailers without their own generation to participate in the retail market, as they need effective instruments for managing wholesale price risk.
In April 2019, hedge market prices for 2019 contracts are around $100/MWh, which reflects current market conditions. However, prices for 2022 contracts are around $80/MWh, which reflects market expectations of future wholesale prices and the cost of new generation.32

3.
The modelling

SECTION 3.THE MODELLING
ACCELERATED ELECTRIFICATION
35
The key question the Government asked the Committee to investigate was how to plan for the transition to 100% renewable electricity by 2035 in a normal hydrological year. However, as stated in Chapter 1, the Committee also considered it important to investigate the potential of the electricity system to achieve emissions reductions through fuel switching in transport and process heat.
To investigate these different possibilities, the Committee commissioned a modelling exercise to look at a number of different possible futures for the electricity system to 2035.
Several other pieces of modelling, looking out to 2050, already exist. The Committee was focused on 2035 rather than 2050, and on investigating in detail specific different targets for the electricity system. This modelling is, therefore, based on a detailed approach to electricity system operation and hydro reservoir modelling. This is considered important to capture the full effects of intermittent generation, the impact of an extreme hydrological year and the role of technology.
The modelling explicitly includes grid-connected generation (including cogeneration) as this is scheduled and dispatched into the electricity market. Non-grid connected generation is implicitly included in the modelling.33
An annex to this report is available that provides a more detailed explanation of the technical aspects of the modelling. The modelling spreadsheets are also available.34

SECTION 3.THE MODELLING
ACCELERATED ELECTRIFICATION
36
3.1 The modelling questionsThree core questions provided the framework for the modelling. They represent three different futures for the electricity system in 2035:
What happens in a business as usual
future?
1 2 3What happens if
New Zealand targets 100% renewable
electricity?
What happens if New Zealand targets
accelerated electrification of transport and
process heat?
Figure 3.1: Modelling questions
In the business as usual future, current market conditions, technologies and policies continue relatively unchanged along their current path. This provides a reference point for comparing against the other futures.
In the 100% renewable electricity future, all fossil fuels are deliberately removed from the electricity system.
In the accelerated electrification future, the electricity system is leveraged to deliver emissions reductions via fuel switching in transport and process heat.
The latter two futures would require targeted policy interventions to achieve. All futures assume that the electricity sector faces a steadily increasing emissions price.35

SECTION 3.THE MODELLING
ACCELERATED ELECTRIFICATION
37
3.2 What are the models?In order to answer these three questions, two models were used: I-Gen and EMarket.36
The I-Gen model calculates what electricity generation capacity will be required in the future. It builds power plants progressively in order of those which are the cheapest to construct and operate, and which can also, collectively, deliver the required amount of electricity.37
The EMarket model then takes the power plants built by the first model and calculates how these different power plants are used throughout the year. It does this by simulating market behaviour on a three hourly basis, ensuring supply meets demand.38
EMarket also simulates demand response, triggered by high electricity prices. It does this by specifying load that can be shed in response to price. Large grid-scale batteries are also included in the model to help meet peak demand. Both demand response, and batteries, are needed to keep non-supply39 to very low levels.

SECTION 3.THE MODELLING
ACCELERATED ELECTRIFICATION
38
3.3 How each question was modelled
BUSINESS AS USUALFor the business as usual future, I-Gen calculated the trajectory of the electricity system between now and 2035, with no constraints on the type of generation that could be built (but including an emissions price). EMarket then simulated how the generation is used during each year.
In general, the model inputs under business as usual reflect a ‘middle of the road’ view of the electricity system. The modelling also assumed that Huntly Power Station (except Unit 5) and the Taranaki Combined Cycle plant close before 2035. This is based on public announcements and industry expectations.
100% RENEWABLE ELECTRICITYTo understand the path from business as usual to 100% renewable electricity, I-Gen was run to target different levels of renewable generation in 2035 as follows40:
• 96% renewable electricity was achieved by retiring the only baseload natural gas plant – Huntly Unit 5
• 98% renewable electricity was achieved by either retiring non-renewable cogeneration or converting it to biomass
• 99% renewable electricity was achieved by retiring one more natural gas peaking plant
• 100% renewable electricity was achieved by retiring all remaining natural gas peaking plants.
This approach to the modelling achieves 100% renewable electricity by ‘overbuilding’ renewable generation, adding batteries and deploying more demand response. Essentially this means having enough spare capacity and storage to cover daily and seasonal peaks, especially when the hydro lakes are low. EMarket then simulated how the generation is used during each year.
ACCELERATED ELECTRIFICATIONThe approach to this future was to test what would need to happen within the electricity system to ensure it could supply enough electricity to meet accelerated demand from process heat and transport. For this future, I-Gen was not constrained to get to any particular percent of renewable electricity generation. EMarket then simulated how the generation is used during each year.
The primary focus is to understand what would happen to electricity emissions and electricity prices under a high level of demand. If high demand leads to higher overall emissions from the electricity system, this could erode any gains from electrification. If high demand leads to higher electricity prices, then accelerated electrification would be unlikely to happen, particularly for process heat.
To achieve either 100% renewable electricity or accelerated electrification, policy intervention would be required. These interventions have not been explicitly modelled.

SECTION 3.THE MODELLING
ACCELERATED ELECTRIFICATION
39
3.4 InputsThe models require data to run. Key data that goes into the model are:
• Electricity demand: this determines how much electricity will be needed in the future. The inputs are based on today’s demand adjusted for: underlying demand growth (based on GDP and population growth and energy efficiency trends) and demand resulting from the electrification of transport and process heat.
• Technology, fuel and emissions costs: these determine which generation is the cheapest to build and run. The inputs are the current costs of different technologies used to generate electricity, ranging from gas peakers to large scale solar, and projections of what those costs might be by 2035. Fuel costs are included for fossil fuel generation, as are emissions costs (which also apply to geothermal).
• Weather data: to capture the impact of weather on the amount of generation that could be expected from wind, solar and hydro. Data from historical records for 87 years of hydro inflows and 17 years of wind and solar data around the country were matched together to produce 87 different ‘weather years’.
• Rooftop solar and battery deployment: the level of rooftop solar41 expected to be installed on homes and other buildings (for example supermarkets) based on cost trends and batteries needed to provide support for intermittency.
HOW THE INPUTS WERE CHOSENFor this work, the range of projections of electricity demand and technology and fuel costs were developed based on information from a number of sources:
• Recent trends in energy efficiency and technology costs
• Government forecasts of GDP and population growth
• Technology cost forecasts by international organisations42
• New Zealand and international expert advice on technology trends and potential
• Information from other New Zealand-specific models43
• Advice from the Committee’s challenge and review group for electricity (see section 1.4).
In addition, the modelling drew on publicly available information about consented and possible wind farms, potential expansions of geothermal stations, and expectations about future plant retirements.

SECTION 3.THE MODELLING
ACCELERATED ELECTRIFICATION
40
KEY INPUTS There are many inputs that go into the model. Table 3.1 shows three of the key inputs that are used to calculate overall demand in 2035.44
Table 3.2 shows five of the inputs that influence the supply side of the model.
The amount of rooftop solar and batteries are inputs into the model, whereas the amount of large scale solar and wind is calculated by the model itself, based on the costs of the different technologies that are put into the model.
Table 3.1: Demand inputs
Underlying demand growth Electric vehicle demand increase
by 2035
Process heat demand increase
by 2035
Overall demand in
2035
Business as usual 0.5% per year (1% demand growth, less 0.5% energy efficiency improvement)
2.7 TWh 0.6 TWh 49 TWh
100% renewable electricity
As above As above As above 49 TWh
Accelerated electrification
As above 5.7 TWh 5.5 TWh 57 TWh
Table 3.2: Supply side inputs
Battery deployment
MW
Rooftop solar TWh
Large scale solar cost
$/MWh
Wind cost $/MWh
Natural gas price45 $/GJ
Emissions price46
$/t CO2e
Business as usual in 2018
0 0.2 $121 $70 $6.40 $24
Business as usual by 2035
200 1.2 $81 $66 $9.50 $50
100% renewable electricity by 2035
850 As above
Accelerated electrification by 2035
500 As above

SECTION 3.THE MODELLING
ACCELERATED ELECTRIFICATION
41
ACCELERATED ELECTRIFICATION INPUTS As set out in Table 3.1, the accelerated electrification future has the greatest ambition for transport and process heat. This represents a combined additional 11.2 TWh of demand by 2035 compared with now.
The transport demand for electricity reaches 5.7 TWh under this future which is within the very wide range of what has been assumed in other studies about electricity demand from electric vehicles (EVs) in New Zealand by 2050.47 This is equivalent to approximately 2.2 million light and heavy EVs in 2035, making up 50% of the fleet. Another way to understand this is that EVs make up 80% of new and used imports into New Zealand by the late 2020s, reaching 85% of new and used imports by 2035.
This rate of EV uptake is similar to target levels of other ambitious countries. For example, Norway has set a target of 100% of new cars being ‘zero emission’ by 2025 and the UK, a major right-hand drive economy, has a 2030 target of 50%-70% of new cars being ‘ultra-low emission’.48
EVs may reach upfront price parity much sooner or later than currently anticipated, which would significantly influence uptake rates (and therefore total electricity demand). Other technology like autonomous vehicles and shared ride services are also predicted to disrupt the transport sector as a whole. However, the point of these input assumptions is to offer an idea of the scale of the emissions reductions opportunity, and to inform policy priorities, as opposed to being fixed on a particular number of EVs by 2035.
Process heat demand increases to 5.5 TWh in 2035. Again, this is well within the range of what has been assumed in other studies about electricity demand from the electrification of process heat by 2050.49
This amount of process heat demand represents switching about one third of fossil fuel used for food manufacturing to electricity (about 4 TWh in total), including accounting for efficiency gains. It also represents replacing fossil fuel heating with heat pumps for activities like water and space heating in schools, hospitals and businesses (for example in hot houses for indoor cropping). Because heat pumps are far more efficient, only 1.5 TWh of electricity is needed to replace about 5 TWh of fossil fuel heat energy.
Some types of process heat are more challenging to electrify than other types. Users of high-temperature process heat have more limited fuel switching opportunities.50 The process heat electrified in this modelling is all low and medium-temperature heat.
Decisions about investments in energy infrastructure in the industrial sector such as boilers are long term, involve high capital costs, and the economics of the investment are highly dependent on the cost of energy (electricity is currently about 2.5 times the cost of coal). Decision makers will also take into account the cost of retiring plant early.
However, as mentioned above, the point of these input assumptions is to offer an idea of what the scale of the emissions reductions opportunity is, and what impact this level of demand would have on electricity prices. Steeply rising electricity prices could make electrification of process heat less attractive or vice versa.

SECTION 3.THE MODELLING
ACCELERATED ELECTRIFICATION
42
SENSITIVITY TESTINGThe Committee tested some specific sensitivities to see what could happen if things were different. For example, in all futures the same daily demand profile that occurs now was assumed to continue, but it is possible that peak demand could increase if smart charging for EVs does not occur.
For each sensitivity all of the input assumptions for the scenario were kept the same, apart from the one being tested. They focused on the variables that could have a major impact on the results and applied to the futures that were considered most likely to be of interest (Table 3.3).
The modelling also took account of uncertainty regarding the period between now and 2035. This uncertainty was represented in two additional future paths for the electricity system, to represent an envelope of possibilities relating to the:
• Effect of faster or slower electricity demand growth
• Speed at which technology costs fall.
These two paths were called ‘fast tech/high demand’ and ‘slow tech/low demand’. For example, in the fast tech/high demand path, battery deployment was ramped up to a maximum of 1,100 MW by 2035, and rooftop solar was increased to 3 TWh by 2035 (representing solar on approximately 370,000 buildings). More detail on these paths is included in the technical annex to this report, with key results provided in Chapter 4.
Table 3.3: Sensitivity inputs
Model input Base metric What if it changed to…? Question(s) applied to
Results presented in
NZ ETS emissions price
$50/t CO2e by 2035
$150/t CO2e by 2035 Business as usual
Accelerated electrification
Chapter 7
Natural gas price
$9.50/GJ at 2035
$19/GJ at 2035 Business as usual
Chapter 4
Constrained hydro
Existing consented arrangements
Small restriction on major hydro systems in terms of the minimum flows in their respective resource consents, and in terms of extraction for irrigation in the South Island.51
Business as usual
Technical annex
Peakier demand
Existing demand profile
A less well managed charging profile for EVs, leading to higher peaks in demand for electricity.52
Accelerated electrification
Chapter 7
Technical annex
SECTION 3.THE MODELLING
ACCELERATED ELECTRIFICATION
43
3.5 OutputsOnce the model runs have been completed, a wealth of information is generated across a number of metrics. All dollar values in the results are presented in 2018 real dollars (unless otherwise stated). The key outputs of the modelling and subsequent analysis presented in this report are:
• Electricity supply (in GWh)
• Installed capacity (in MW)
• Greenhouse gas emissions (in Mt CO2e)
• Cost
– Modelled wholesale electricity price (in $/MWh)53
– Retail electricity prices (in cents/kWh)
– Marginal emissions abatement cost (in $/t CO2e)54
• Demand response and battery use (in both GWh and MW available).
In the modelling, batteries are assumed to operate on full charge-discharge cycles of between 6 to 12 hours, rather than acting as longer term storage.
The models also provide useful information on a number of other factors, such as transmission upgrades required, flows across the HVDC, or use of storage in the hydro lakes. Finally, the modelling has some limitations, including challenges in capturing market learning. These are discussed in more detail in the technical annex.
Demand response in the modelling
Two different types of demand response are explicitly modelled. These are:
• Spot price demand response is when consumers exposed to very high spot prices (mainly commercial and industrial users) reduce demand to minimise their total costs of production. This is ‘last resort’ demand response over and above demand response that is implicitly modelled.55
• Sustained high price demand response is when demand is reduced in response to a longer period of higher than normal wholesale prices, for example lasting over a week and/or in response to a dry year. It includes the New Zealand Aluminium Smelter’s contract with Meridian as well as reduced demand from the public (including but not limited to official conservation campaigns).56
SECTION 3.THE MODELLING
ACCELERATED ELECTRIFICATION
44
3.6 Modelling the impact of the weatherNew Zealand’s hydro lakes contribute around 60% of total electricity supply. However, hydro lakes only hold enough water for a few weeks of winter energy demand if inflows (rain and snow melt) are very low.57 When inflows are low for long periods of time, hydro generation is reduced and the system relies on other forms of generation such as natural gas and coal. These periods of time are often colloquially referred to as ‘dry years’.
Wind and solar generation also depend on the weather. Wind generation is location and time specific – it fluctuates with wind patterns, between different locations and will vary in
total generation from year to year. On rare occasions there are periods where the entire country is calm. Solar only generates during daylight hours and has a seasonal pattern, producing more in summer than in winter.
As part of the modelling, the Committee undertook some data matching to understand the relationship between wind, solar and hydro resource availability. In other words, it shows the likelihood and impact of dry and calm periods happening at the same time. These relationships are important, particularly when the future system is likely to include more (and be more reliant upon) intermittent generation.
How could hydro inflows change in New Zealand because of climate change?
A change in the hydro inflows because of climate change could impact on the amount of hydro generation. New Zealand’s climate is forecast to become warmer as a result of climate change. Patterns of precipitation will change, with increased winter rainfall and less snow formation in many parts of the South Island expected.58
Recent work shows that total yearly inflows to hydro lakes are not expected to change significantly by 2050. But, there is expected to be a more pronounced seasonal pattern for South Island hydro inflows, with summer inflows significantly reducing and winter inflows significantly increasing.59 This change has already been observed in the 20-year rolling average of inflow data for the South Island.60 North Island inflows are not expected to change by 2050.61

SECTION 3.THE MODELLING
ACCELERATED ELECTRIFICATION
45
WHAT ABOUT A ‘NORMAL HYDROLOGICAL YEAR’?The Terms of Reference for this work, as well as the current 2025 renewable electricity target62, include the caveat of a ‘normal hydrological year’. The intent of this caveat is to recognise the need to achieve reliable supply in a system that is heavily dependent on inherently variable hydro inflows. However, there is no definition of a normal hydrological year – hydro inflows vary widely.63
The mix of generation produced in 2035 for each future was tested against 87 weather years (see ‘weather data’ in section 3.4) to see what mix of plant could ensure sufficient supply to meet demand. This aims, as far as is possible, to give a complete picture of what the future might hold and what could happen to the electricity system, all the way from the wettest year on record, to the driest. The results presented in subsequent chapters are, unless otherwise specified, the average of these 87 years.
3.7 SummaryThe modelling focused on three futures:
• What happens in a business as usual future?
• What happens if New Zealand targets 100% renewable electricity?
• What happens if New Zealand targets accelerated electrification of transport and process heat?
Two electricity system models, I-Gen and EMarket, were used to calculate what electricity generation capacity is likely to be available in each future, as well as how generation is used throughout the year.
Key inputs for the model include electricity demand; technology, fuel and emissions costs; weather data; and rooftop solar and battery deployment. Inputs were chosen based on information from a number of sources, including recent trends, official forecasts and expert advice. The modelling
also aimed to take account of uncertainty, by modelling sensitivities such as increases in the NZ ETS or natural gas prices.
Key outputs include expected electricity generation mix, cost and emissions. Other information is also produced, such as demand response and battery use.
As weather patterns are particularly important for renewable electricity generation, results were produced for 87 weather years. This ensured that the modelling addressed the wide range of hydrological years New Zealand can experience. Matching wind and solar data to the hydro inflow data means that the results can also take into account the impact of the weather on wind and solar.

4.
Results of the modelling

SECTION 4.RESULTS OF THE MODELLING
ACCELERATED ELECTRIFICATION
47
The modelling builds on the current system and looks at three possible futures for the New Zealand electricity system by 2035:
• Business as usual: This provides a reference point against which other possible futures can be compared.
• 100% renewable electricity: This explores the consequences of eliminating fossil fuel use from the electricity system.
• Accelerated electrification: This aims to test whether a much larger amount of low-emissions electricity can be delivered to achieve accelerated transport and process heat electrification, while keeping electricity prices affordable.
This chapter explores key modelling results across these three different futures, focusing on generation mix, capacity, cost and emissions.64 Additional modelling insights are available in the technical annex to this report.
4.1 Generation mixTable 4.1 shows that between 2019 and 2035 the proportion of electricity generated from renewable sources increased across all three modelled futures.
A key reason for the percentage of renewable generation increasing, even under business as usual, is because of falling technology costs, particularly for wind and solar. Geothermal also plays more of a role as a renewable source of baseload generation.
Table 4.2 and Figure 4.1 show that under business as usual, there is a lot more generation from wind and roof top solar compared with today. Generation from geothermal increases by about 50% and fossil fuel generation decreases by about 60%. In all futures, generation from coal is assumed to end before 2035 based on public announcements (rather than ending as a result of the NZ ETS price).
Table 4.1: Average percentage renewable electricity
2035
2019 Business as usual
100% renewable electricity
Accelerated electrification
Average % renewable electricity
82 93 100 92

SECTION 4.RESULTS OF THE MODELLING
ACCELERATED ELECTRIFICATION
48
Table 4.2: Electricity generation by type
2035
Generation (GWh) 2019 Business as usual
100% renewable electricity
Accelerated electrification
Coal 790 - - -
Gas 5,630 2,620 - 3,760
Cogeneration 1,250 1,230 560 1,230
Geothermal 7,950 11,920 13,560 13,360
Hydro 24,540 24,790 23,820 25,810
Wind 2,090 7,530 9,160 11,150
Rooftop solar 150 1,180 1,180 1,180
Large scale solar - - 1,000 780
Total 44,420 49,270 49,280 57,270
CoalNatural gasCogenerationGeothermalHydroWindRooftop solarLarge scale solar0
10,000
2019
100%
re
new
able
elec
tric
ity
Acc
eler
ated
elec
tri�
catio
n
Busi
ness
as u
sual
20,000
30,000
40,000
50,000
60,000GWh
Figure 4.1: Electricity generation by type
Under 100% renewable electricity, natural gas65 generation is replaced by more geothermal, wind, and large scale solar.66 Together, wind and solar supply about 23% of total generation in 2035, with four times more generation from wind and 15 times
more generation from rooftop and large scale solar compared with today.
Under accelerated electrification, fossil fuel generation decreases about 40% between 2019 and 2035. Fossil fuel generation remains in the mix because the model

SECTION 4.RESULTS OF THE MODELLING
ACCELERATED ELECTRIFICATION
49
shows what is economically viable to build and maintain, rather than forcing fossil fuel plants to close (as under 100% renewable electricity). For example, Unit 5 at Huntly Power Station continues to operates although it runs as a peaking plant, rather than for baseload generation.
WHAT ABOUT THE NORMAL HYDROLOGICAL YEAR?Figure 4.2 shows that, even at 99% renewable electricity and regardless of the weather year67, natural gas peakers will be used at some point during the year. This is because natural gas provides backup
generation when demand is very high and/or the supply from intermittent renewables is low. Therefore, it would only be at absolute 100% renewable electricity that gas would not appear in the electricity system in every weather year.
More natural gas is used in the driest and calmest weather years (the left hand side years in Figure 4.2). But, a small amount of natural gas is also used even in the wettest and windiest weather years (the right hand side years in Figure 4.2). This is to supply generation at periods of particularly high daily demand.
1 870
5
10
15
20
25
Weather years Wetter, windier years
Dryer, calmer years
PJ
Figure 4.2: Natural gas used for generation by weather year at 99% renewable electricity

SECTION 4.RESULTS OF THE MODELLING
ACCELERATED ELECTRIFICATION
50
A key implication of this result is that 100% renewable electricity would not be achieved in any of the ‘hydrological years’ unless natural gas were restricted to be used only in dry/calm years (and forbidden during times of peak demand). However, defining under what weather conditions this dry/calm year restriction would kick in would be extremely challenging (and potentially operationally infeasible).
What happens if the gas price doubles?
The modelling asked what would happen if the gas price doubled from $9.50/GJ in 2035 to $19/GJ. The result of this sensitivity test showed that it would likely result in the amount of renewable electricity achieved under business as usual jumping from 93% to 97%. This result is driven by the closure of Unit 5 at Huntly Power Station, a baseload gas power station, because it becomes uneconomic to run.
Under this sensitivity 0.5 Mt CO2e of emissions per year are removed, taking total emissions from 2.8 Mt CO2e under business as usual to 2.3 Mt CO2e. Geothermal emissions become proportionately larger, representing 75% of the remaining emissions. Wind partially replaces the generation required, but geothermal has value in its ability to provide baseload generation. There is a total additional deployment of 675 MW of wind, geothermal, hydro and batteries and about 500 MW less of gas peaker capacity.
The increased renewable percentage under this sensitivity is an outcome of more renewable generation being built to replace natural gas capacity and generation. This results in an increase in the retail electricity price residential consumers would pay of around 5% over business as usual.68
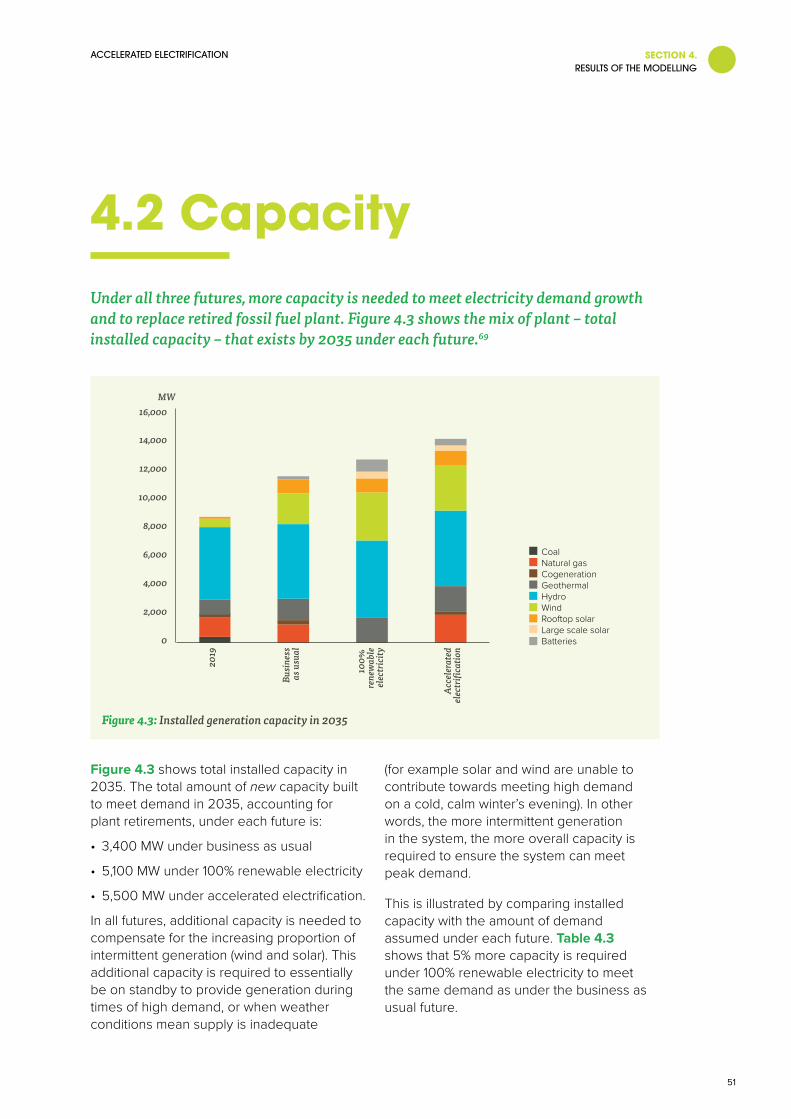
SECTION 4.RESULTS OF THE MODELLING
ACCELERATED ELECTRIFICATION
51
4.2 CapacityUnder all three futures, more capacity is needed to meet electricity demand growth and to replace retired fossil fuel plant. Figure 4.3 shows the mix of plant – total installed capacity – that exists by 2035 under each future.69
CoalNatural gasCogenerationGeothermalHydroWindRooftop solarLarge scale solarBatteries0
4,000
2,000
2019
100%
re
new
able
elec
tric
ity
Acc
eler
ated
elec
tri
catio
n
Busi
ness
as u
sual
6,000
8,000
10,000
12,000
14,000
16,000MW
Figure 4.3: Installed generation capacity in 2035
Figure 4.3 shows total installed capacity in 2035. The total amount of new capacity built to meet demand in 2035, accounting for plant retirements, under each future is:
• 3,400 MW under business as usual
• 5,100 MW under 100% renewable electricity
• 5,500 MW under accelerated electrification.
In all futures, additional capacity is needed to compensate for the increasing proportion of intermittent generation (wind and solar). This additional capacity is required to essentially be on standby to provide generation during times of high demand, or when weather conditions mean supply is inadequate
(for example solar and wind are unable to contribute towards meeting high demand on a cold, calm winter’s evening). In other words, the more intermittent generation in the system, the more overall capacity is required to ensure the system can meet peak demand.
This is illustrated by comparing installed capacity with the amount of demand assumed under each future. Table 4.3 shows that 5% more capacity is required under 100% renewable electricity to meet the same demand as under the business as usual future.

SECTION 4.RESULTS OF THE MODELLING
ACCELERATED ELECTRIFICATION
52
Table 4.3: Installed capacity and total electricity demand in 2035
Business as usual
100% renewable electricity
Accelerated electrification
Demand (TWh) 49 49 57
Installed capacity (MW) 11,600 12,770 14,230
The increased capacity in all futures comes from two sources.
First, mostly from more renewable generation itself, such as more wind farms. These wind farms are scattered across different parts of the country to provide generation when the wind stops blowing in one particular region.
Not all new capacity is renewable in the business as usual or accelerated electrification futures. For example, the model shows up to 760 MW of natural gas peaking plant is built under accelerated electrification (which more than replaces retired natural gas plant).70
Second, it comes from more demand response and more batteries.
What happens if the New Zealand Aluminium Smelter closes?
The New Zealand Aluminium Smelter at Tiwai Point is the single largest consumer of electricity in New Zealand (about 14% of total electricity demand). Owned by Rio Tinto and Sumitomo, 90% of the aluminium produced is exported.71
As part of sensitivity testing, the modelling applied ‘slow tech/low demand’ paths to the three futures. Closure of the New Zealand Aluminium Smelter was used as a proxy in the modelling to represent a significant drop in electricity demand. Total demand drops from 49,000 GWh to 38,500 GWh under a business as usual future.
The modelling showed about 3,300 MW less capacity on average across all three futures needs to be built (because of the reduced demand). The percentage of renewable generation under a business as usual future falls from 93% to 91%, because less wind and solar generation is built. The slow tech/low demand path applied to the accelerated electrification future shows no significant difference in the percentage of renewable generation.
Under all futures, emissions decrease by about 0.5 Mt CO2e on average (excluding those from the smelter closure itself), also due to reduced demand.
By 2035, electricity prices are approximately the same compared to the case where the New Zealand Aluminium Smelter does not close. A reason for this is that additional transmission infrastructure is built or upgraded to move the electricity from the South Island to the North Island.

SECTION 4.RESULTS OF THE MODELLING
ACCELERATED ELECTRIFICATION
53
DEMAND RESPONSE AND BATTERIESFigure 4.4 shows the amount of demand response modelled in each of the futures. As explained in section 3.6, two types of demand response are identified in the modelling: ‘spot price demand response’ which is a last resort response to high prices, and ‘sustained high price demand response’ where demand is reduced in response to a longer period of higher than normal prices (for example in response to low hydro inflows). Both represent demand that is foregone due to high prices during times of shortage.
The results of the modelling show that 100% renewable electricity requires a much larger
amount of sustained high price demand response (69 GWh) compared to the other futures (17 GWh under business as usual and 33 GWh under accelerated electrification). This is because it contributes when there is no longer fossil fuel generation to rely on to meet demand in both dry years and at peak times.
While not needed at the same scale, spot price demand response is also greater in 100% renewable electricity (8 GWh compared to 2 GWh under business as usual and 3 GWh under accelerated electrification). It provides up to 400 MW of short-term load shedding72 when wholesale prices are extremely high.
Sustained high price demand responseSpot price demandresponse
-50
-40
-30
-80
-70
-60
-20
-10
0GWh Accelerated
electrication
100% renewableelectricity
Businessas usual
Figure 4.4: Demand response, 2035
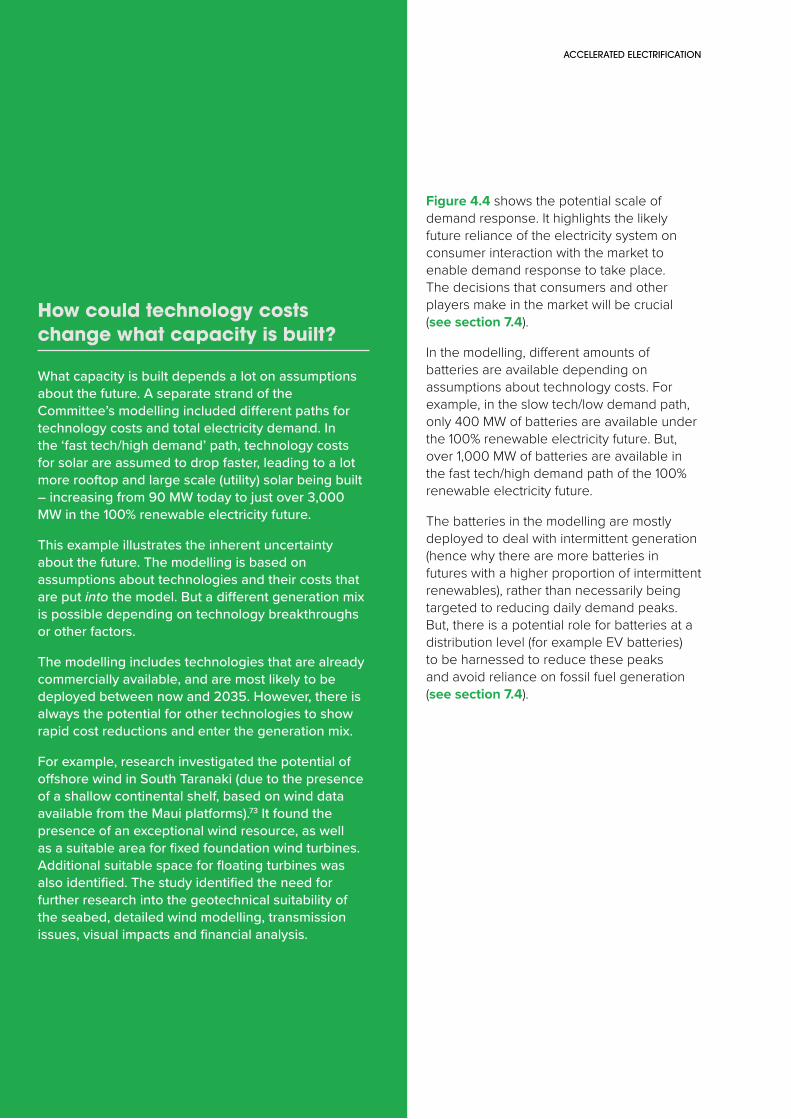
SECTION 4.RESULTS OF THE MODELLING
ACCELERATED ELECTRIFICATION
54
Figure 4.4 shows the potential scale of demand response. It highlights the likely future reliance of the electricity system on consumer interaction with the market to enable demand response to take place. The decisions that consumers and other players make in the market will be crucial (see section 7.4).
In the modelling, different amounts of batteries are available depending on assumptions about technology costs. For example, in the slow tech/low demand path, only 400 MW of batteries are available under the 100% renewable electricity future. But, over 1,000 MW of batteries are available in the fast tech/high demand path of the 100% renewable electricity future.
The batteries in the modelling are mostly deployed to deal with intermittent generation (hence why there are more batteries in futures with a higher proportion of intermittent renewables), rather than necessarily being targeted to reducing daily demand peaks. But, there is a potential role for batteries at a distribution level (for example EV batteries) to be harnessed to reduce these peaks and avoid reliance on fossil fuel generation (see section 7.4).
How could technology costs change what capacity is built?
What capacity is built depends a lot on assumptions about the future. A separate strand of the Committee’s modelling included different paths for technology costs and total electricity demand. In the ‘fast tech/high demand’ path, technology costs for solar are assumed to drop faster, leading to a lot more rooftop and large scale (utility) solar being built – increasing from 90 MW today to just over 3,000 MW in the 100% renewable electricity future.
This example illustrates the inherent uncertainty about the future. The modelling is based on assumptions about technologies and their costs that are put into the model. But a different generation mix is possible depending on technology breakthroughs or other factors.
The modelling includes technologies that are already commercially available, and are most likely to be deployed between now and 2035. However, there is always the potential for other technologies to show rapid cost reductions and enter the generation mix.
For example, research investigated the potential of offshore wind in South Taranaki (due to the presence of a shallow continental shelf, based on wind data available from the Maui platforms).73 It found the presence of an exceptional wind resource, as well as a suitable area for fixed foundation wind turbines. Additional suitable space for floating turbines was also identified. The study identified the need for further research into the geotechnical suitability of the seabed, detailed wind modelling, transmission issues, visual impacts and financial analysis.

SECTION 4.RESULTS OF THE MODELLING
ACCELERATED ELECTRIFICATION
55
4.3 Cost
MODELLED WHOLESALE ELECTRICITY PRICESThe current average wholesale price of electricity is about $80/MWh.74 Figure 4.5 shows that under the business as usual future, the modelled wholesale price falls slightly because of the falling costs of renewable generation and batteries.
Under accelerated electrification the modelled wholesale price is $85/MWh – this higher price is the result of an increased intermittency cost arising from the larger proportion of (mainly) wind in the system. Intermittency costs are the costs of backing up the variable output of renewables like wind and solar, rather than the cost of generating electricity in the first place.
However, it is the 100% renewable electricity future that shows the highest increase in modelled wholesale electricity prices. This is a significant result because high electricity prices could dramatically reduce the attractiveness of electricity as a fuel source for transport and process heat compared with fossil fuels.
Figure 4.6 shows the steps up to 100% renewable electricity (as explained in section 3.5). There is a relatively small incremental increase in price between business as usual (93% renewable electricity) and getting to 99% renewable electricity.
0
20
40
60
80
100
120$/MWh
Acceleratedelectri�cation
100% renewableelectricity
Businessas usual
Figure 4.5: Modelled wholesale price of electricity by 2035

SECTION 4.RESULTS OF THE MODELLING
ACCELERATED ELECTRIFICATION
56
It is only at the last step, that the large increase in price is apparent, jumping from $89/MWh at 99% renewable electricity to $113/MWh at 100% renewable electricity. This is due to the significant investment in capacity (the ‘overbuild’ of wind and solar) that is required to cover periods of high demand.
At certain points, the model showed some periods of non-supply – these are periods when electricity would need to be further curtailed (over and above the demand response included in the model).75 Under the 100% renewable future there was an average of 4 GWh a year of non-supply. This equates to about 2.5 million homes having no supply for an average of two hours each year. In comparison, the business as usual future had 0.04 GWh a year of non-supply, and accelerated electrification had 0.6 GWh a year.76
The relatively large amount of non-supply in the 100% renewable electricity future implies an underestimation of its modelled cost.77 Additional analysis therefore attempted to
identify the cost of resolving this non-supply. The analysis showed that deploying an additional 300 to 400 MW of wind generation and a more conservative operation of batteries already existing in the system by 2035 was a possible solution. While this solution saves costs, such as avoiding the need to call on demand response, it does incur capital costs. The analysis suggests the modelled wholesale cost of electricity required to reduce the non-supply to a similar amount as identified in other futures would be more than $125/MWh.
A final point to note on prices is the likelihood of increased price volatility due to more intermittent generation in the system across all three futures. For example, when there is a lot of wind in the system, prices drop because wind has a low marginal operating cost, once built. But when the wind stops blowing (particularly if this coincides with a period of high demand), prices can rapidly and substantially rise because other, more expensive, generation has to come online to meet demand.
0
80
60
120
100
40
20
$/MWh
100% renewableelectricity
93% renewableelectricity
Step 3 (99%)Step 2 (98%)Step 1 (96%)
Figure 4.6: Modelled wholesale price of electricity by 2035 – steps to 100% renewable electricity

SECTION 4.RESULTS OF THE MODELLING
ACCELERATED ELECTRIFICATION
57
RETAIL ELECTRICITY PRICESThe Committee commissioned work to analyse what the results of the modelling would mean for retail electricity prices.78 It showed that large increases in retail electricity prices from today’s levels are likely under 100% renewable electricity, but are not expected under business as usual or accelerated electrification (Table 4.4). The analysis further showed that it was the cost of removing the last 1–2% of fossil fuel generation that had the largest impact on increases in retail electricity prices.
Importantly, the Committee’s modelling shows that accelerated electrification can be achieved without a significant impact on the electricity price. For accelerated electrification to occur, it will be essential
that electricity prices are affordable and electricity supply is reliable. Industry and manufacturers will not convert their boilers if electricity is too expensive, and consumers will not switch to electric transport if they perceive a risk of insecure supply.
The retail price analysis showed that increased retail electricity prices will disproportionately impact low-income households, including Māori and Pasifika households. For example, Māori households spend more each week on electricity on average than other households (about $41.20 compared to $36.80).79 Māori households also spend more, as a percentage of total expenditure, on electricity compared to other households. If retail electricity prices increase in the future, this would impact Māori whānau and papakāinga more than other households.
Table 4.4: Retail electricity price change under each future compared to 2018 actuals
Business as usual
100% renewable electricity
Accelerated electrification
Residential -2% 14% 1%
Commercial 4% 29% 9%
Industrial 6% 39% 13%

SECTION 4.RESULTS OF THE MODELLING
ACCELERATED ELECTRIFICATION
58
4.4 EmissionsIn 2017, emissions from electricity generation were 4.4 Mt CO2e, or 5% of total greenhouse gas emissions. All three futures result in a reduction in electricity emissions compared to 2017.
The black bars in Figure 4.7 shows that under business as usual, electricity emissions decrease to an average of 2.8 Mt CO2e in 2035, and under accelerated electrification, they decrease to an average of 3.6 Mt CO2e in 2035. The lowest amount is under 100% renewable electricity, where electricity sector emissions average 1.7 Mt CO2e in 2035 (solely from geothermal).
But, the accelerated electrification future aimed to look beyond electricity generation.
The blue bars in Figure 4.7 illustrate the transport and process heat emissions that could be avoided by replacing fossil fuels with electricity relative to current levels, based on the input assumptions set out in section 3.4.
Finally, the green bars show the net impact. On average, under accelerated electrification in 2035 up to 5.4 Mt CO2e of net emissions could be avoided via fuel switching to electricity in transport and process heat. While generating electricity under accelerated electrification still results in average greenhouse gas emissions of 3.6 Mt CO2e in 2035, this would be more than offset by 6.4 Mt CO2e of avoided emissions from transport and 2.6 Mt CO2e of avoided emissions in process heat.
(b) Avoided heat & vehicle emissions
Net impact (a) + (b)(a) Electricity system emissions
Business as usual 100% renewable electricity Accelerated electri�cation
0
-2.0
2.0
-4.0
-6.0
4.0
-8.0
6.0
-10.0
Mt CO2e
Figure 4.7: Net emissions savings per year
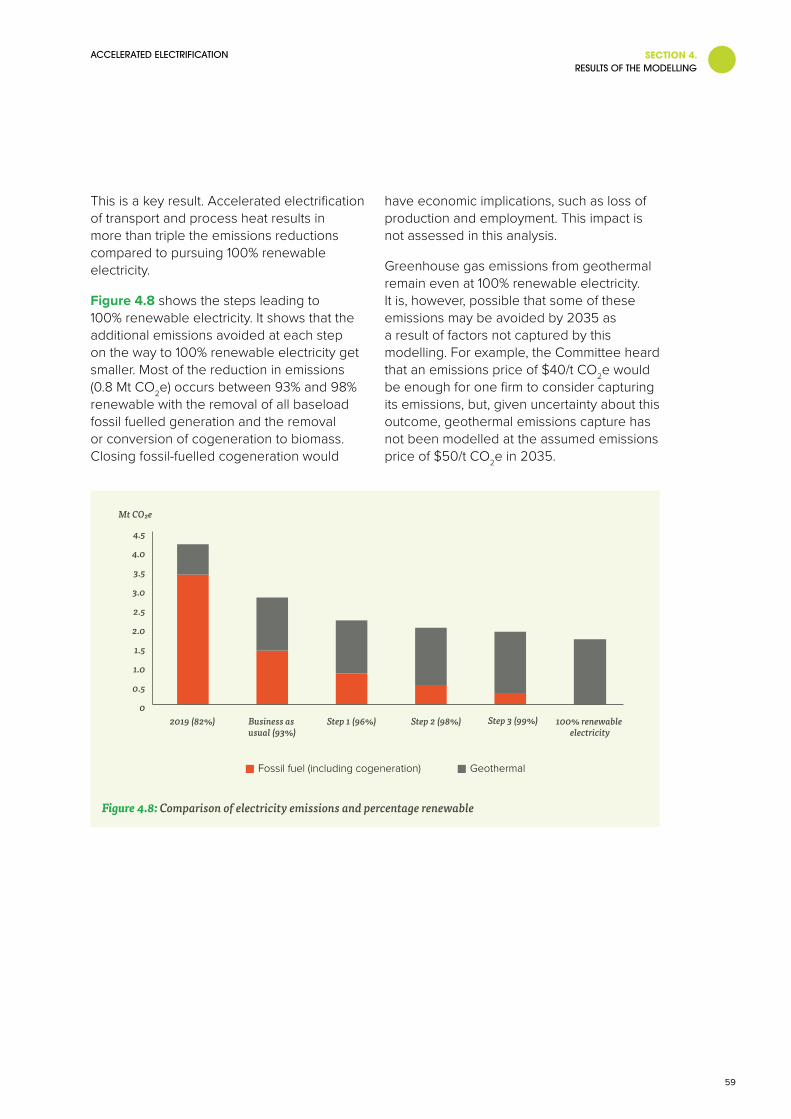
SECTION 4.RESULTS OF THE MODELLING
ACCELERATED ELECTRIFICATION
59
This is a key result. Accelerated electrification of transport and process heat results in more than triple the emissions reductions compared to pursuing 100% renewable electricity.
Figure 4.8 shows the steps leading to 100% renewable electricity. It shows that the additional emissions avoided at each step on the way to 100% renewable electricity get smaller. Most of the reduction in emissions (0.8 Mt CO2e) occurs between 93% and 98% renewable with the removal of all baseload fossil fuelled generation and the removal or conversion of cogeneration to biomass. Closing fossil-fuelled cogeneration would
have economic implications, such as loss of production and employment. This impact is not assessed in this analysis.
Greenhouse gas emissions from geothermal remain even at 100% renewable electricity. It is, however, possible that some of these emissions may be avoided by 2035 as a result of factors not captured by this modelling. For example, the Committee heard that an emissions price of $40/t CO2e would be enough for one firm to consider capturing its emissions, but, given uncertainty about this outcome, geothermal emissions capture has not been modelled at the assumed emissions price of $50/t CO2e in 2035.
Fossil fuel (including cogeneration) Geothermal
2019 (82%) Business as usual (93%)
Step 1 (96%) Step 2 (98%) Step 3 (99%) 100% renewable electricity
0
0.5
1.0
1.5
4.0
4.5
3.0
3.5
2.0
2.5
Mt CO₂e
Figure 4.8: Comparison of electricity emissions and percentage renewable

SECTION 4.RESULTS OF THE MODELLING
ACCELERATED ELECTRIFICATION
60
Figure 4.9 shows that the step up to 100% renewable electricity is the most expensive – pushing the marginal emissions abatement cost to approximately $1,280/t CO2e. This result aligns with the much higher electricity prices for 100% renewable electricity as shown in section 4.3.
It also illustrates that having both 100% renewable electricity by overbuilding and accelerated electrification in the period to 2035 is not possible. The high prices under the 100% renewable electricity future would act as a disincentive to fuel switching (and therefore emissions savings) that underpins the accelerated electrification future.
0
1200
1000
800
600
1400
400
200
$/t CO2e
98% to 100%93% to 98%Up to 93%
Figure 4.9: Marginal emissions abatement cost by 2035 – trajectory to 100% renewable electricity

SECTION 4.RESULTS OF THE MODELLING
ACCELERATED ELECTRIFICATION
61
4.5 SummaryThe key insights arising from the modelling are that:
• The electricity system is on track to achieve about 93% renewable electricity by 2035 without further intervention
• Even at 99% renewable electricity, some natural gas is used regardless of what happens with the weather. This means that the goal of 100% renewable electricity ‘in a normal hydrological year’ is challenging from both a definitional and an operational perspective
• While 100% renewable electricity by overbuilding is technically achievable, it is extremely expensive. This is significant because high electricity prices could dramatically reduce the attractiveness of electricity as a fuel source compared to fossil fuels. This also means that having both 100% renewable electricity and accelerated electrification in the period to 2035 is not possible – the high prices under the 100% renewable electricity future would not incentivise the fuel switching required (and therefore emissions savings) that underpins the accelerated electrification future
• The amount of emissions avoided in the last few steps to 100% renewable electricity are very small
• Both the wholesale price of electricity and the marginal emissions abatement cost jump significantly between 99% and 100% renewable electricity. The wholesale price of electricity rises from $89/MWh to $113/MWh, and the marginal emissions abatement cost rises to $1,280/t CO2e at 100% renewable electricity
• Retail electricity prices are significantly higher for all consumers under the 100% renewable electricity future (14-39% higher than 2018) compared to either the business as usual and accelerated electrification futures. Accelerated electrification does not substantially increase retail electricity prices
• Using electricity to reduce emissions in transport and process heat results in substantially greater net emissions gains of 5.4 Mt CO2e in 2035 on average, compared with focusing on achieving 100% renewable electricity.
These modelling results rely upon multiple factors, such as new generation (and distribution and transmission networks) being able to be built in a timely way. For accelerated electrification, substantial policy intervention would be required to achieve a large amount of EV uptake and for process heat conversion. The implications of these assumptions are drawn out in Chapters 6 and 7.

5.
Solving the dry year problem

SECTION 5.SOLVING THE DRY YEAR PROBLEM
ACCELERATED ELECTRIFICATION
63
The results of the modelling show that, instead of pursuing a 100% renewable electricity future by 2035, more emissions savings could be achieved through accelerated electrification.
However, while using natural gas in the electricity system may be an effective mechanism to minimise emissions and achieve security of supply until 2035, such a situation cannot continue forever. In order to limit warming to well below 2 degrees below
pre-industrial levels, all fossil fuel use must eventually be eliminated.80
This chapter assesses options for eliminating fossil fuel used for New Zealand’s dry year problem (including the ‘overbuilding’ solution as discussed in Chapter 4). Much of the analysis is necessarily illustrative and based on previous studies. Most of these options would require further extensive commercial investigation to achieve more concrete numbers. But the intent is to provide some sense of their scale and feasibility.
5.1 Can the dry year problem be solved? A ‘dry year’ occurs when hydro inflows are lower than usual, meaning that less energy is stored in the form of water. This is a particular challenge for the New Zealand electricity system due to its reliance on hydropower, which supplies 60% of New Zealand’s electricity on average.
Specifically, dry years are made up of weeks to months of constrained hydro availability that fall within any given period of time, and are most challenging when combined with winter peaks in demand. New Zealand has experienced some dry years recently – the public was asked to conserve electricity in 1992, 2001, 2003 and 2008 as part of official conservation campaigns.
At present, a combination of natural gas and coal provides the energy storage to meet dry year needs. New Zealand must move away from these fuels. But, when the system is so reliant on hydro, it is a challenge to build a cost-effective renewable electricity system that is able to deal with this loss. Solutions focus on either building capacity that is infrequently used, or storing energy that is infrequently accessed. Both of these solutions will come at a significant cost.
OPTIONSThe question the Committee posed was: what technically feasible options could displace fossil fuel use with emissions-free solutions and still meet security of supply during a dry year by 2035?

SECTION 5.SOLVING THE DRY YEAR PROBLEM
ACCELERATED ELECTRIFICATION
64
Estimated costs are based on evidence gathered from the work of relevant experts and updated as necessary. More information is available in the technical annex.
The chapter examines the following options:
• ‘Overbuilding’ renewables
• Long-term battery storage
• Biomass
• Hydrogen
• Pumped hydro storage
• Indicative large scale demand interruption.
All of the costs provided are for the marginal cost of emissions abatement (i.e. the cost over and above that of natural gas as a solution to the dry year).
APPROACH TO DRY YEAR SOLUTION ANALYSISAll modelled futures anticipate that coal is no longer used for electricity generation by 2035. The remaining fossil fuel generation used to provide security of supply in a dry year is natural gas. The Committee examined options to replace this natural gas using the 99% renewable future81 to ‘size’ the problem.
Figure 5.1 illustrates the volume of gas used each month in the driest/calmest year of the 87 weather years, as modelled in the 99% renewable electricity future. The total gas used over the year is about 25 PJ. This represents the maximum ‘size’ of the dry year problem that must be met.
The options outlined above were sized to meet the equivalent generation82, that is replacing 25 PJ of natural gas. Accounting for efficiency losses, this is about 3,000 GWh of electricity.
0
5.0
4.0
3.0
2.0
1.0
PJ
DecAugJulJun NovOctSepMayAprMarFebJan
Figure 5.1: Gas use by month at 99% renewable electricity in the driest/calmest weather year

SECTION 5.SOLVING THE DRY YEAR PROBLEM
ACCELERATED ELECTRIFICATION
65
5.2 Analysis of dry year options
OVERBUILDING RENEWABLESThe 100% renewable electricity future discussed in Chapter 4 was based on ‘overbuilding’ renewable generation, and increasing the use of demand response and short-term batteries. Chapter 4 showed that this approach significantly increases electricity prices for relatively low-emissions savings,83 and potentially left some non-supply in dry years. The marginal emissions abatement cost is estimated as $1,270/t CO2e.
LONG-TERM BATTERY STORAGEIt is technically possible to provide long-term back up from batteries. It would require at least 2,700 GWh of battery storage, and around 1,000 MW of charge/discharge capacity.84 In the analysis, the cost of batteries was assumed to fall to $100/kWh. This capacity could be operated in peaker mode; charged when electricity prices were low and discharged in a 1-in-5 year dry/calm event when lake storage was low in winter. However, no set of batteries this size has ever been built and operated in this way.
Operating batteries in this way is estimated to incur a marginal emissions abatement cost of $89,000/t CO2e. This cost is extremely high when compared with all other options considered. This is not considered an economically viable solution and no further commentary is provided here.
BIOMASS Options for generating electricity from biomass include building new dedicated biomass plant or converting existing plant to biomass. Flexible backup might be provided by a series of wood pellet biomass plants with associated covered storage located near wood supply sources. This would require around 16 new 50 MW biomass plants to be build. This solution has an estimated marginal emissions abatement cost of around $790/t CO2e.
Included in this figure are significant costs associated with storing biomass fuel for the very long periods of time necessary to provide dry-year fuel. The moisture content of biomass makes rotting a major problem. Opinions differ around the feasibility and methods for long-term storage. It may be feasible to store for long periods at some additional cost, through significant drying or other treatment (for example torrefying wood – turning it into a type of charcoal).
Obtaining biomass for electricity generation is not simple. There is likely to be competition for access to biomass in future, despite an increase in supply through more planting. The economics of biomass for industrial process heat are much better than for occasional dry-year power generation. There could be competition for biomass as an emissions-free material from other sectors too, such as construction and transport.

ACCELERATED ELECTRIFICATION
66
Looking beyond the 2035 timeframe, it is possible that bioenergy coupled with carbon capture and storage (BECCS) could have potential for offering a negative emissions solution.85
HYDROGEN The economics of hydrogen for electricity generation differs dramatically depending on the scale of the solution, the storage options, and whether it is also being produced for other end uses, for example, transport or export.
The analysis considered a solution which involved:
• Construction of a hydrogen electrolysis plant
• Conversion of the existing Ahuroa natural gas storage facility to hydrogen storage
• Construction of an ammonia production and storage facility (36 bulk tanks, capacity of 20 PJ)
• Construction of a hydrogen peaking facility.
In this analysis, hydrogen is converted to ammonia via the Haber-Bosch process for storage. It is then converted back to hydrogen when needed and used in a hydrogen-capable open cycle gas turbine plant. There are efficiency losses due to this conversion and reconversion process, these have been factored into the calculations. These losses mean that the system is around 14% efficient. The conversion losses in the production of hydrogen are associated with fundamental physical processes, and are a major element of the high cost. This means it may be challenging for hydrogen to become cost-competitive as a dry year solution.
The marginal emissions abatement cost for the hydrogen solution analysed is around $1,500/t CO2e. This cost should be interpreted with caution – hydrogen is subject to a vast amount of international research attention and therefore carries a large amount of uncertainty. There are technical uncertainties with conversion of Ahuroa to hydrogen storage, and large uncertainties in costs and efficiencies of hydrogen and ammonia production and storage.
How is hydrogen produced from electricity?
The process of using electricity to produce hydrogen from water is called electrolysis. This involves passing an electric current through the water. The electricity enters the water through a negatively charged terminal called a cathode and exits through a positively charged terminal called an anode. This process splits the water into the elements it is made of, hydrogen and oxygen.
The hydrogen can be stored and later converted back to electricity. However, this conversion and reconversion process reduces the total fuel efficiency of hydrogen compared with direct use of electricity.
Hydrogen can also be produced via a number of alternative methods from various feedstocks, including natural gas.86 In order for these options to be emissions-free the greenhouse gases associated with the use of fossil fuels must be captured and stored. The Committee’s analysis focused on electrolysis because it does not require an assumption of carbon capture and storage in New Zealand by 2035.

SECTION 5.SOLVING THE DRY YEAR PROBLEM
ACCELERATED ELECTRIFICATION
67
Key factors that influence the cost of this solution are capital equipment costs, the electricity price, storage costs, and the ability to directly burn ammonia as a fuel. Changes in these factors would make the biggest difference to the ability for hydrogen to become a viable, cost-competitive option for a dry year solution as an alternative to natural gas.
PUMPED HYDRO STORAGEPumped hydro schemes are a way of storing and using water independent of inflows. They offer flexible capacity as they are able to meet daily demand peaks, as well as storing a large amount of energy for a long period to meet dry year requirements.
They operate by having two different water reservoirs, one at a higher elevation than the other. Then, during:
“…periods of high electricity demand, power is generated by releasing the stored water through turbines in the same manner as a conventional hydropower station. During periods of low demand (usually nights or weekends when electricity is also lower cost), the upper reservoir is recharged by using lower-cost electricity from the grid to pump the water back to the upper reservoir”.87
The most well-known proposal in New Zealand for a pumped hydro storage facility, and one that would meet the size of the dry year need, is to build a dam in Lake Onslow and a tunnel down to the Clutha River. This would provide for a pumped hydro station of about 1,000 MW to be built, and storage capacity of around 5,000 GWh.
The Committee’s analysis updated available 2006 engineering calculations of the cost of the Lake Onslow proposal. The analysis used the latest information available on a comparable scheme about to be built; Snowy Hydro 2.0 in Australia. This analysis showed that the marginal emissions abatement cost for a pumped hydro storage solution at Lake Onslow was around $250/t CO2e.
Snowy 2.0
All pumped hydro schemes differ based on their geography. However, a useful comparison scheme to consider is one currently under construction in Australia: Snowy 2.0. The project is an expansion of an existing hydro scheme, located in Kosciuszko National Park.
Snowy 2.0 is a Commonwealth Government owned commercial entity.88 It has consents for initial works and will apply for full consents in 2019. Total costs are expected to be in the region of NZ$4.8 billion (2018 prices).
Snowy 2.0 is expected to provide 175 hours of storage (350 GWh) and is 2,000 MW. The generation will play a role in providing for peak and system stability requirements.89 It is expected to provide storage capacity as a counter-balance and complementary resource to increasing intermittent generation.

SECTION 5.SOLVING THE DRY YEAR PROBLEM
ACCELERATED ELECTRIFICATION
68
Pumped hydro schemes, however, carry large local environmental consequences and have substantial impacts on the landscape. These consequences may make this solution to the dry year challenge controversial and very difficult to consent under New Zealand’s current resource management framework. The estimated costs are uncertain. Given that it carries freshwater implications, attention would also need to be paid to the commitments within Te Tiriti o Waitangi settlement legislation and other forms of statutory obligations or non-statutory agreements with iwi/Māori relating to freshwater management.
This dry year analysis is not linked into the main modelling carried out for this report using I-Gen and EMarket, so does not capture interactions between hydro systems in either a physical or market sense. For example, releasing water from the tunnel may have an impact on other generation on the Clutha system, on storage and water usage at other lakes elsewhere in the South Island, and on the overall electricity market. Note also that the modelling does not fully scope the potential of such a project for its combined ability to manage intermittency from wind and solar generation, meet daily peak capacity, and provide the dry year storage.
INDICATIVE LARGE SCALE DEMAND INTERRUPTION It may be technically possible for a major load (such as the New Zealand Aluminium Smelter at Tiwai Point) to be fully interrupted for up to eight months on a frequency of around 1 in 5 years. This is a substantially longer period compared to the current demand response arrangement between the New Zealand Aluminium Smelter and Meridian.
This would not involve a significant capital expenditure but would involve substantial costs when called. The marginal emissions abatement cost for the demand interruption solution analysed was around $680/t CO2e.
It is very unlikely that such a service would be commercially viable. For the New Zealand Aluminium Smelter, or an aggregate of smaller commercial loads, ceasing production for a full eight months every five years would be highly disruptive to contractual arrangements for their respective markets, regardless of the demand interruption payment received.

SECTION 5.SOLVING THE DRY YEAR PROBLEM
ACCELERATED ELECTRIFICATION
69
5.3 Comparison of dry year optionsFigure 5.2 compares the emissions abatement cost of the analysed options against the alternative of continuing to use natural gas to solve the dry year problem.
$0
$2,000
$1,500
$1,000
$500
$/t CO2e
Indi
cativ
e lar
gesc
ale d
eman
din
terr
uptio
n
Ove
rbui
ldin
g
Hyd
roge
n
Biom
ass
Pum
ped
stor
age
Figure 5.2: Marginal emissions abatement cost for the dry year solutions above the cost of natural gas
An estimate has been given for each option, as specified in previous paragraphs. However, the ranges in Figure 5.2 indicate the level of uncertainty attached and reflect combined optimistic or pessimistic estimates.
Not included in Figure 5.2 is the long-term battery storage solution – at over $80,000/t CO2e it is by far the most expensive option. Hydrogen is also a relatively expensive option mainly due to the efficiency losses in its production.
Indicative large scale demand interruption has essentially zero capital costs, but its commercial feasibility is questionable. Biomass is more encouraging, although it still has complexities around obtaining, and then properly storing, adequate biomass fuel for electricity generation.
The option with the lowest estimated marginal emissions abatement cost is pumped storage, at approximately $250/t CO2e. This option offers the potential to

SECTION 5.SOLVING THE DRY YEAR PROBLEM
ACCELERATED ELECTRIFICATION
70
address New Zealand’s dry year problem, but would very likely need to be established with some degree of Government support, as it is likely to be commercially challenging for a private company to independently pursue. It would also likely need some form of national priority in terms of consenting under the Resource Management Act 1991.
A key finding therefore of this analysis is that, in the years to 2035, no single solution stands out as a clear candidate to replace the relatively low-cost, flexible and low-emissions service that natural gas can provide to the electricity system.90
Although a number of options are technically feasible, most are very expensive given what is currently known about likely technology cost trajectories. Several could also have significant social, cultural and environmental impacts.
The Committee recognises the need for a long-term shift away from fossil fuels in all parts of the New Zealand economy. This includes natural gas for electricity supply. What this analysis shows is that timing is a major factor.
Work can and must be done over the next decade and a half. Further investigation of a pumped hydro storage solution should be conducted as a priority. Low-emissions solutions such as biomass and hydrogen produced from renewable electricity are likely to be suitable candidates for research and development. There may be clear crossovers to other policy goals that could be taken into account, such as partnerships with iwi/Māori entities and regional economic development objectives.
Finally, diversifying options to provide dry year backup is also likely to be important. This is because diversification generally increases security of supply by adding resilience to the system. The above analysis costed each individual option as separately solving the dry year problem. But, depending on the solution, what may be more cost-effective, and environmentally and socially acceptable, is to deploy a range of smaller options to provide a coordinated response across different technologies.

SECTION 5.SOLVING THE DRY YEAR PROBLEM
ACCELERATED ELECTRIFICATION
71
5.4 Summary New Zealand must move away from fossil fuels. The biggest challenge facing the New Zealand electricity system in terms of its fossil fuel use is what is known as a ‘dry year’. This chapter looked at a variety of options to eliminate fossil fuel use from the electricity system during such periods.
The Committee’s analysis provides estimates of the technical feasibility and commercial viability by 2035 of long-term battery storage, biomass, hydrogen, pumped hydro storage and indicative large scale demand response. By 2035, to solve for a dry year, no solution met this criteria.
However, with a rising emissions price and a desire to use less natural gas, this picture could change. The pumped storage solution shows promise. It has the advantage of being able to meet dry year, intermittency and peak capacity requirements.
Substantially more work would be required before this, or any other solution, could be advanced. Other suitable candidates for ongoing research and development include biomass and hydrogen produced from renewable electricity, where there are clear crossovers to other policy goals such as regional economic development and iwi partnerships.

6.
New Zealand’s resource management system

SECTION 6.NEW ZEALAND’S RESOURCE MANAGEMENT SYSTEM
ACCELERATED ELECTRIFICATION
73
The modelling shows that New Zealand has the potential to generate various forms of abundant, affordable and reliable electricity and to use this to reduce emissions.
By building a substantial amount of new renewable electricity capacity over the next 15 years – and retaining existing renewable generation – New Zealand could avoid around 5.4 Mt CO2e of emissions in 2035.
However, many forms of renewable generation, especially hydropower, wind and geothermal, have the potential to come into conflict with New Zealand’s resource management system, the heart of which is the Resource Management Act 1991 (RMA). This is because these types of generation can impact on other environmental goals and values, such as freshwater and biodiversity, or on people’s social and cultural values such as enjoyment of the natural environment.
6.1 HydropowerHydropower is vital to the New Zealand electricity system. However, pressures are mounting to improve water quality, allocate water across competing users, and restore ‘over-allocated’ water bodies.91
There is acknowledgement by Government that some of New Zealand’s key freshwater bodies used for hydro generation are in poor and degraded states.92 Iwi/Māori and others consider that existing consents and planning regimes give preference to hydro at the expense of ecological or cultural values.93 Instead, these parties seek to restore and/or re-balance water resources, such as seeking cultural flows that reflect both scientific evidence and mātauranga, or by reinstating minimum flows.
These pressures could see more water being required to flow down rivers in efforts to balance the competing demands for water use, as well as to improve the health of waterways. This could however
adversely affect storage and system flexibility, as well as reduce the total capacity of hydro generation.94
A modelling exercise, commissioned by the Ministry for the Environment and Ministry for Primary Industries in 2015, looked at the impact of reduced flows on hydro generation.95 It examined seven separate reduced flow scenarios in different catchments, as well as a further scenario which combined the effects of the seven separate scenarios. The impact was most visible in the combined scenario which significantly increased minimum flows across several catchments, and resulted in an average annual increase in short-run marginal cost of $15 to $31 per MWh.
The average total deficit in generation for the six years studied (2020-2025) was about 110 GWh. Greenhouse gas emissions also increased compared to the model’s base case, on average by about 0.5 Mt CO2 per year (an 11% increase).

SECTION 6.NEW ZEALAND’S RESOURCE MANAGEMENT SYSTEM
ACCELERATED ELECTRIFICATION
74
Changes to the water available for hydro generation could come about via:
• Unresolved conflict between National Policy Statements
• Iwi/Māori proprietary rights and interests in freshwater (including geothermal).
UNRESOLVED CONFLICT BETWEEN NATIONAL POLICY STATEMENTSUnder the RMA, National Policy Statements are a mechanism for the Government to give direction to local government about matters of national significance when making local planning decisions. There are currently five National Policy Statements including one on renewable electricity generation (the National Policy Statement for Renewable Electricity Generation, NPS-REG96) and one on freshwater management (the National Policy Statement for Freshwater Management, NPS-FM).97
Importantly for hydro generation, there is an unresolved conflict between the NPS-REG and the NPS-FM.
The NPS-REG seeks to promote the benefits of renewable generation, and contains a policy (6(a)) that recognises that: “maintenance of the generation output of existing renewable electricity generation activities can require protection of the assets, operational capacity and continued availability of the renewable energy resource”. But, in its preamble, it weakens this policy in relation to hydro when it states that: “This national policy statement does not apply to the allocation and prioritisation of freshwater as these are matters for regional councils to address in a catchment or regional context and may be subject to the development of national guidance in the future.”

SECTION 6.NEW ZEALAND’S RESOURCE MANAGEMENT SYSTEM
ACCELERATED ELECTRIFICATION
75
This national guidance is now in place, in the form of the NPS-FM.
The NPS-FM identifies hydro generation as one of a number of national values to be considered when setting limits on water use. It recognises that the continued viability of some hydro-schemes (and other infrastructure) may conflict with achieving the main objectives of the NPS-FM.
It also includes the concept of Te Mana o Te Wai, described as the integrated and holistic wellbeing of the water. Councils are required to consider and recognise Te Mana o Te Wai in freshwater management, “noting the connection between freshwater and the broader environment; and the role of community values when setting freshwater objectives and limits”.98
The NPS-FM contains an appendix where existing nationally-important infrastructure can be listed, allowing decision-makers to trade-off national values. It could provide flexibility to set less constrictive limits on minimum flows than otherwise would be allowable under the national bottom lines set by the NPS-FM. However, this list is currently empty, so bottom lines will need to be met everywhere, even where this could have a major impact on a nationally-significant hydro scheme.
This particular policy uncertainty is untenable. It must be resolved so that the major trade-off between maintaining existing hydro schemes (and the benefit of reducing emissions), and national and local objectives to restore the health of rivers, is able to be weighed explicitly and strategically.
There is some urgency to resolving this lack of national direction. Local authorities are required to set objectives and limits for all catchments by 2025 in planning documents. These will then guide consenting decisions such as renewing water permits.
New Zealand’s two largest hydro schemes will require renewal of water permits within the next 15 years, and are likely to have to compete for water use, but the incomplete regulatory framework means the outcomes for the electricity system are uncertain. In some cases, elevating decisions to a national level may assist strategic decision-making (see section 6.4).
IWI/MĀORI RIGHTS AND INTERESTS IN FRESHWATER (INCLUDING GEOTHERMAL)Iwi/Māori have long asserted tino rangatiratanga, or the unqualified exercise of chieftainship over lands and all their property/treasures, which includes the ability to control the use and management of resources. This has implications for geothermal generation as well as hydro, as geothermal fluids are treated in the same manner as freshwater from a legal perspective.
While the resource management framework for freshwater has provided for elements of Te Tiriti o Waitangi, this wider resolution of rights and interests has yet to be resolved.
In the Waitangi Tribunal claims Wai 2357 and Wai 2358 (heard together), the claimants sought an urgent decision on protecting and providing for the rights in freshwater and geothermal resources in response to the Government privatisation programme of four state-owned enterprises and the resource management reforms. In 2012, the Waitangi Tribunal found that iwi/Māori do have rights in place relating to water, but that these rights were modified by the signing of Te Tiriti o Waitangi, to the extent that the Treaty provided for the sharing of the water resource with all New Zealanders.99
The form of these residual rights over water in this particular claim is uncertain as the decision was a response to the claimants’ concerns with the policy reforms undertaken

SECTION 6.NEW ZEALAND’S RESOURCE MANAGEMENT SYSTEM
ACCELERATED ELECTRIFICATION
76
by the Government at the time. The Crown accepts that iwi/Māori have legitimate rights and interests in water, but maintains a position that no one (including iwi/Māori) owns or can own water. However, in a statement to the Waitangi Tribunal in 2018, the Crown has stated it is “open to discussing (among other things) the possibility of Māori proprietary rights in water, short of full ownership, as a means of better recognising Māori rights and interests in freshwater”.100
The Waitangi Tribunal is currently finalising a second report relating to iwi/Māori rights over freshwater, due to be released in mid-2020. It has already signalled that it will reject the concept that no-one owns water. Its report appears likely to focus on how well iwi/Māori rights and interests are recognised in statutory and institutional arrangements such as the NPS-FM.
In the interim, the Government is taking steps to address freshwater in general and which have implications for iwi (relating to use, access and cultural impacts) and broader Māori rights and interests (relating to the Treaty of Waitangi). For example, on the topic of freshwater takes (allocations), the Government recently stated its preference to grant iwi/Māori a share of use rights.101
Nonetheless, at present, the eventual implications of iwi/Māori proprietary claims for freshwater remain highly uncertain. However, the analysis of the Wai 2357 and Wai 2358 claims does indicate that there is certainty that iwi/Māori will lodge a claim with the Waitangi Tribunal should any new policy be developed without addressing iwi/Māori rights and interests in freshwater and geothermal fluids.
It is not within the remit or expertise of the Committee to comment on precisely how this issue should be resolved. However, the Committee does consider it important that the Government work collaboratively with iwi/Māori to co-design solutions so that freshwater objectives can be agreed within the context of the Māori-Crown partnership, alongside providing some greater certainty around hydro electricity generation into the future.

SECTION 6.NEW ZEALAND’S RESOURCE MANAGEMENT SYSTEM
ACCELERATED ELECTRIFICATION
77
6.2 Wind The modelling suggests wind will be the dominant form of new renewable generation out to 2035. This is because New Zealand has an abundance of quality wind-farm sites, and wind is the lowest-cost form of new generation. It also has a number of major advantages from a resource management point of view, namely that it is relatively low impact on the biophysical environment as it can avoid New Zealand’s most outstanding natural landscapes and is easily reversible.
There is currently 700 MW of wind in the New Zealand electricity system, and a further 2,500 MW could be built under the accelerated electrification future. About 2,000 MW of wind is currently consented but as yet unbuilt (due to flat electricity demand over recent years).
A key assumption of the modelling was that new wind generation (including consented but as yet unbuilt wind) could be built easily and as needed. However, there are a number of major barriers to consenting and building the amount of wind that New Zealand is likely to need as the market ramps up and demands additional supply.
One important issue is to do with recent legal judgments that have influenced the interpretation of the RMA, and the use of the term ‘avoid’ in planning documents (for example, where plans state that visual or other effects should be ‘avoided’). These
judgements have now made it substantially more challenging to consent renewable electricity generation because they effectively mean that if an adverse effect cannot be entirely avoided, it should not be consented.102 Specifically, as a result of these judgements, the Supreme Court considers that section 6(b) of the RMA has now been interpreted “in a clear-cut way, so that adverse effects are not to be avoided, remedied or mitigated, but simply avoided”.103
This is of particular relevance to wind (and transmission infrastructure) because their visual effects are impossible to avoid by nature – turbines must stand tall and visible to catch the wind. If greater changes to landscape and visual amenity are unable to be tolerated, New Zealand will struggle to reduce its emissions given the core role of wind generation as a major supplier of affordable and abundant electricity.
Other barriers to wind generation exist. These include the challenges of extending or varying consent conditions. For example, most consents contain specific conditions (such as rotor size) or wind farm site design (such as specific turbine placement) that go quickly out of date due to rapid advances in technology. Obtaining consent extensions or variations can be time-consuming (up to two years or more). They are also potentially costly if completely new resource consent processes are required, especially if they re-open contentious aspects such as landscape and visual effects.

SECTION 6.NEW ZEALAND’S RESOURCE MANAGEMENT SYSTEM
ACCELERATED ELECTRIFICATION
78
Another issue to consider is that for Māori (as iwi, tangata whenua/mana whenua, and kaitiaki) the location and positioning of wind farms and turbines, as well as the associated infrastructure and services, is often problematic. This is because suitable areas for wind are often on, near, or traverse through, sites of significance to iwi/Māori.
Whether these consent extensions or variations should be granted is debated. Sometimes these changes may make a substantial difference to key consent parameters (like visual amenity). Others are also concerned about the cumulative effects of more and larger wind farms in one area.
Compared to building a new site, upgrading a wind farm can be a substantially more cost-effective mechanism to achieve more generation. This often means refitting existing wind farms with new (usually bigger) turbines. But, such upgrading can be almost as difficult to consent as a new wind farm.104
Consenting (and re-consenting) processes should be streamlined so that they focus on safeguarding nationally important values. But, given the national imperative of emissions reductions, the ability to decline applications for wind generation due to landscape or visual considerations should be significantly constrained. Further, there is a strong case for resource management processes proactively enabling wind farms and their connecting network, rather than identifying where they are not allowed (see also section 6.4).
These changes could be achieved, in part, by a revision of the NPS-REG, as well as the addition of national environmental standards for wind.105 At present, the NPS-REG requires local authorities to promote renewable electricity generation. Revision of the NPS-REG would need to resolve the issues related to lapsing and varying consents, and re-powering existing wind-farms.

SECTION 6.NEW ZEALAND’S RESOURCE MANAGEMENT SYSTEM
ACCELERATED ELECTRIFICATION
79
But, it also needs to go further. It should include specific policies and rules that give more clarity and certainty to enabling the environmental benefits of new renewable electricity generation. It should also reign in the consideration of effects to those that matter most – there should be a higher bar, which factors like visual effects, should be measured against.
National Environmental Standards (NES) offer a more prescriptive approach. They set specific rules and methods and can take effect immediately.
A wind-focused NES could remove or lower barriers to wind generation by, for example:
• Stipulating limited circumstances when activities would be prohibited or non-complying
• Clearly ensuring that wind would otherwise be regarded as a discretionary activity. This would allow consideration on merit, rather than legal interpretation, for any application
• Permitting activities with minimal effects, such as small and community-scale wind (or solar), within a set of general conditions.
Essentially, an NES targeted to wind would effectively mean that only significant environmental effects could be used as a mechanism to block wind developments, rather than minor visual or landscape effects. NES can also be incorporated with national objectives and policies in what are known as combined direction statements, so could work jointly with a revision of the NPS-REG.
Designed well, such a national rule set could increase clarity and consistency and therefore more certainty to investors, councils and communities. They could also work to focus local debate and regulatory decision-making on safeguarding the most significant environmental effects.

SECTION 6.NEW ZEALAND’S RESOURCE MANAGEMENT SYSTEM
ACCELERATED ELECTRIFICATION
80
6.3 GeothermalThere are substantially fewer resource management barriers in New Zealand for geothermal (notwithstanding the iwi/Māori freshwater considerations for geothermal as noted above in section 6.1).
Existing planning frameworks, such as in the Waikato and Bay of Plenty regions, are considered by a range of stakeholders to provide investment certainty and regulatory requirements proportionate to the values and effects being managed. The price faced under the NZ ETS is the key mechanism to encourage operators to adopt technologies to reduce emissions (such as the reinjection of greenhouse gases).
RMA processes for geothermal developments are complex and costly, but these processes are generally seen as necessary and appropriate given the complexity and importance of the resources being safeguarded. A key focus of regulators is the sustainability of the geothermal system, but consideration is also given to potential impacts on rare or valuable surface features, freshwater or biodiversity.
The one identified concern is that the proposed National Policy Statement for Indigenous Biodiversity could constrain further geothermal development. Flora and fauna associated with geothermal fields is often rare. Developing geothermal assets may inevitably result in some degree of impact on biodiversity. Therefore the same issues around the legal interpretation of the need to ‘avoid’ adverse effects as explained above, exist.
The Government will need to carefully consider the wording of the National Policy Statement for Indigenous Biodiversity. In particular, how to guide decision-making where a major trade-off between nationally-significant values (biodiversity and renewable energy development) is required. This wider issue of trade-offs between environmental goods, especially those considered to be of national importance, needs addressing. The next section discusses a potential way forward.

SECTION 6.NEW ZEALAND’S RESOURCE MANAGEMENT SYSTEM
ACCELERATED ELECTRIFICATION
81
SECTION 6.NEW ZEALAND’S RESOURCE MANAGEMENT SYSTEM
ACCELERATED ELECTRIFICATION
82
6.4 A more strategic approach to emissions reductions Stakeholders from all quarters are critical of fundamental weaknesses with the RMA and its ability to manage resources in response to climate change.106 In particular, it is questionable whether its identification of emissions reductions as just one consideration among many remains appropriate.
Other issues include the lack of proactive support of actions to reduce emissions, and its effects-based nature as it lacks the flexibility and agility required to take account of what is now known about the effects of certain activities on the climate. The RMA and its current suite of national policy statements do little to assist decision-makers to reconcile or trade-off competing national objectives. Such ambiguities or gaps do not simply affect existing hydropower (see section 6.1), but increase legal uncertainty for many potential renewable electricity generation opportunities.107
The Committee understands that wider reforms of the RMA are currently being scoped. It also understands that these reforms may take a first principles approach towards what type of resource management framework is most suitable to contemporary and future challenges, including climate change.
Such a reform process is a major opportunity to not just remove barriers to emissions-reducing activities, but to fully enable resource management legislation to actively support needed mitigation efforts. Alignment of policy efforts is a fundamental mechanism to address climate change.108 Resource management legislation and associated regulations should complement, rather than dampen the effect of, core climate change policies (for example emissions pricing).
In the longer-term, adopting a more strategic, spatially-informed approach could help to improve resource management decision-making. Planning across the entire range of land uses and values in a given space is likely to result in more enduring decisions. It is also likely to enable a better assessment of how to make trade-offs, both between nationally significant goals like climate change mitigation and freshwater protection, as well as between national goals and local priorities.
The proactive assessment of long-term future electricity system needs would be a key output of such an approach. However, the most valuable aspect is the ability to identify how these needs could be met in relation to other values and land uses, the resolution of trade-offs, and enabling provisions in statutory policies and plans.

SECTION 6.NEW ZEALAND’S RESOURCE MANAGEMENT SYSTEM
ACCELERATED ELECTRIFICATION
83
However, while valuable, such a process would inevitably take years to implement. Change is needed now to ensure adequate renewable generation can be built, and can be delivered to where it is needed, so emissions reductions can be achieved across the economy.
This is particularly the case for wind in the context of the legal interpretation of ‘avoid’ in the RMA (see section 6.2). The Government should, as part of the development of wind-focused national environmental standards, proactively identify which landscapes are
likely to be particularly suitable for wind infrastructure. This should ensure consenting (for new generation, including consented but as yet unbuilt wind farms, the re-powering of existing wind farms, and for transmission and distribution infrastructure) is more streamlined in these areas.
A more strategic approach to using renewable electricity to reduce emissions could also enable other outcomes, such as encouraging the implementation of Mana Whakahono ā Rohe109 by local authorities.
6.5 SummaryMultiple issues around the RMA have the potential to be an undue constraint on the required expansion of renewable electricity generation to meet New Zealand’s climate change objectives. These include:
• Ongoing policy uncertainty regarding the relative priority of nationally important objectives, especially between freshwater and renewable electricity generation
• Unresolved issues around iwi/Māori rights and interests in freshwater
• Inadequate national policy direction, meaning that relatively minor landscape or visual amenity effects could unnecessarily trump the development of wind generation
• The potential for new regulations to unduly constrain further geothermal development.
Together, these issues could significantly limit the ability of renewable electricity to provide for greenhouse gas emissions reductions. In addition to specific actions to address these individual concerns, there is also the potential to adopt a more strategic, spatially-informed approach to plan for land use across regions or New Zealand as a whole. This could enable better guidance about how to make trade-offs between nationally significant goals like climate change mitigation and freshwater protection, as well as between national goals and local priorities.
In the intervening period before such an approach is developed, specific priority should be given to enabling wind generation via the proactive identification of areas particularly suitable for wind.

7.
Aiming for accelerated electrification

SECTION 7.AIMING FOR ACCELERATED ELECTRIFICATION
ACCELERATED ELECTRIFICATION
85
In Chapter 4, the modelling of the accelerated electrification future showed that annual greenhouse gas emissions reductions of 6.4 Mt CO2e in transport and 2.6 Mt CO2e in process heat are feasible in 2035. Total net savings (taking into account emissions from electricity generation of 3.6 Mt CO2e) are 5.4 Mt CO2e in 2035.
But, in order to realise these emissions savings, significant policy changes will be needed.
The NZ ETS must be reformed so it can play its intended role as a fundamental driver of emissions reductions across the economy. Targeted policy interventions in transport and process heat will also be required. Good regulation must facilitate an electricity market that delivers on the objective of minimising emissions from electricity generation, while also maintaining security of supply and affordability for consumers.

SECTION 7.AIMING FOR ACCELERATED ELECTRIFICATION
ACCELERATED ELECTRIFICATION
86
7.1 The New Zealand Emissions Trading SchemeEmissions pricing is essential to delivering emissions reductions efficiently across the economy, and a comprehensive NZ ETS that caps total allowable emissions is vital.110 This is because the key role of the NZ ETS price is to increase the price of fossil fuels relative to low-emissions alternatives, like renewable electricity.
The NZ ETS is currently in the process of being reformed. The Committee’s analysis assumes that these reforms occur, represented in the modelling by an assumption that the emissions price rises to $50/t CO2e.
In the modelling, a $50/t CO2e emissions price by 2035 does not materially affect the build of natural gas peakers or geothermal generation. However, as noted in section 4.4, the Committee heard that an emissions price of $40/t CO2e could be sufficient for geothermal operators to consider capturing their emissions. A well-functioning NZ ETS will be a critical tool in encouraging the adoption of geothermal emissions capture technology.
The Committee also modelled the effect of a higher price of $150/t CO2e. At this price, natural gas peakers are less likely to be built.111 In terms of the effect on retail electricity prices, the results showed a relatively minor impact. It could add about 1 c/kWh to retail electricity prices (in 2035, relative to business as usual), which is a 4% increase for residential consumers, a 6% increase for commercial consumers, and an 8% increase for industrial customers.112
There are a number of reasons why the NZ ETS price alone may not be able to drive emissions reductions at the pace and scale necessary for New Zealand to meet its 2030 target, particularly in sectors beyond electricity generation. These are expanded on in the following sections.

SECTION 7.AIMING FOR ACCELERATED ELECTRIFICATION
ACCELERATED ELECTRIFICATION
87
7.2 TransportTransport currently contributes about 20% (16 Mt CO2e) of New Zealand’s total greenhouse gas emissions, and is also the most rapidly increasing source of emissions. The modelling shows that accelerated electrification of transport could reduce transport emissions by about 6.4 Mt CO2e in the year 2035, relative to current levels.
As well as reducing emissions, electrification of transport will also bring about valuable co-benefits, such as improved air quality, which leads to subsequent health benefits.113
The electricity needed to achieve a 6.4 Mt CO2e reduction in transport emissions in 2035 is equivalent to replacing 2.2 million fossil-fuelled vehicles with EVs by 2035. However, a one-to-one replacement is unlikely to be what occurs in reality and these emissions reductions could come from a mix of solutions. The modelling illustrates the scale of electrification needed to achieve a similar amount of electric mobility as compared to that provided by internal combustion engines today. ‘Green’ hydrogen produced from renewable electricity is another low-emissions option for fuelling heavy transport.
A base case scenario from the Ministry of Transport (building in cost reductions and estimating what EV uptake might look like without any major surprises) shows around 1.2 million EVs in the fleet by 2034/35.114 This rate of uptake is well off meeting the equivalent replacement of 2.2 million fossil fuelled vehicles by 2035.
Both whole of life and upfront cost parity of fossil fuelled vehicles are considered to be
major factors in achieving higher levels of EV uptake. The date at which whole of life cost parity is expected to occur is uncertain, but is predicted to be somewhere between 2022 and 2025.115 Total cost of ownership is still currently higher for EVs compared with fossil fuelled vehicles (although EVs are cheaper with travel distances over 25,000km per year).116
Other factors stymying rapid EV uptake include New Zealand’s very slow fleet turnover. Every new fossil fuelled car brought into the country remains in the New Zealand fleet for 17 years on average.117 This is partly due to the fact that vehicles remain roadworthy longer in New Zealand than in many countries due to the lack of salt used as roading grit (as salt corrodes vehicles).118 So-called EV ‘range anxiety’ and a limited range of models to choose from are also identified as reasons for a slower than desired uptake.
More ambitious policies are urgently needed to speed up the transition to electric mobility. Some policies are in place to encourage EV uptake, such as the exemption from road user charges for EVs and the Low Emission Vehicle Contestable Fund.119 However, these are unlikely to be sufficient to achieve the rapid fleet turnover required. These policies are also unlikely to be adequate protection against New Zealand becoming a future dumping ground for low cost fossil-fuelled vehicles (both new and used) as increasing numbers of other countries ban their importation or ongoing use.120
A higher emissions price will only play a limited role in decisions about travel choices. The pass-through cost is only a small component of the petrol price even at higher emissions prices (as seen in Chapter 2), and

ACCELERATED ELECTRIFICATION
88
Will there be enough EVs to meet demand?
Imports from Japan dominate the EV market in New Zealand, along with lesser numbers from countries such as South Korea, China, Germany, the USA and the UK. Uptake in New Zealand of imported second-hand vehicles is influenced by the rate at which buyers in some of these countries are replacing their own EVs.
Global demand for EVs is rising. For example, around 1.3 million EVs were sold in China in 2018. And in South Korea, the government aims to have increased the number of EVs exported from South Korea from 36,000 at present to 250,000 by 2022.
A range of government interventions are also promoting uptake in Japan, South Korea, China, and the UK, which New Zealand buyers are indirectly benefitting from. These include a target in Japan of having 1 million EVs (battery and plug-in hybrid) in their fleet by 2030, future bans on the sale of new fossil fuel vehicles (by 2040 in China and the UK), and China’s New Energy Vehicle mandate with tradable EV quotas.123
the high upfront cost of a vehicle coupled with slow turnover rate of the vehicle fleet mean that response could be slow.
The Productivity Commission’s Low-emissions economy inquiry recommended a number of specific policy interventions to more rapidly encourage EV uptake in New Zealand. These included:
• A price feebate scheme for new and used vehicles entering the fleet
• Financial support for charging infrastructure projects
• Government procurement policy
• CO2 standards for light vehicles
• Investigating incentivising the early scrapping of fossil fuel vehicles
• The removal of tariffs for low-emissions vehicles and their parts
• Standards, grants and other technologies relating to the decarbonisation of the heavy vehicle fleet.121
Numerous other policy options are also available and have been implemented in other jurisdictions internationally, including:
• Banning the importation of fossil-fuelled vehicles
• Financial assistance including tax exemptions (such as fringe-benefit tax exemptions) or leasing
• Direct subsidies, such as for low-income households for vehicle ownership or car-sharing schemes
• Ensuring transport infrastructure encourages ride-sharing, such as more widespread use of carpool lanes
• Supporting the transition of public transit vehicles to electricity.122
A number of policies have obvious merit. For example, standards (for example fuel efficiency or CO2 emissions standards) would help to avoid New Zealand becoming a dumping ground for higher-emitting vehicles. Supporting non-commercially viable charging infrastructure helps to make electric mobility accessible to rural communities.
The Committee recommends the Government implement a mix of ambitious policies to rapidly encourage the growth of electric mobility in New Zealand.

SECTION 7.AIMING FOR ACCELERATED ELECTRIFICATION
ACCELERATED ELECTRIFICATION
89
MAKING ELECTRIC MOBILITY ACCESSIBLE TO ALLMany low and middle income households, or households in rural areas, may find it much harder to access electric transport compared to wealthier households or those in urban areas. This challenge is particularly relevant for iwi/Māori households who are disproportionately represented in low-income and rural neighbourhoods.
The Committee heard that owning an EV today is unlikely for many Māori as it would be a struggle to prioritise such a purchase. There would also need to be good availability of EVs in the second-hand market.
Policies that support the transition to a low-emissions future should aim to operate on the principle of reducing existing social inequalities, rather than exacerbating them. Low-income households in particular can gain the most from the additional benefits of improved air quality and ongoing savings from lower fuel costs that EVs provide.
Many examples exist internationally of schemes that provide substantial (up to 100%) support for electric mobility. For example, California’s ‘Enhanced Fleet Modernization Program Plus-Up’ provides support to scrap old fossil fuelled vehicles and supplying vouchers for either:
• Replacement vehicles (worth between about NZ$7,000 and $14,000 depending on income level and type of vehicle to be purchased), or
• Public transport and car-sharing services (between about NZ$4,000 and $7,000 depending on income level).124
Other types of financial support include targeted tax credits or exemptions, or direct financial assistance. Examples of direct financial assistance include loan loss guarantees (that reduce risk for financial institutions) or price buy-down vouchers (that reduce upfront purchase costs) coupled with low-interest loan programmes.
Support can also extend beyond financial assistance. For example, targeted EV-sharing schemes can directly address transport gaps (both in terms of spatial coverage and time of day) for low-income workers to get to their jobs. Increased support for charging infrastructure for rural communities will also be needed.
The Productivity Commission recommended that “the Government should continue to monitor the uptake of low-emission vehicles by different household types and any impacts on the mobility of lower-income households”.125 It also highlighted two specific targeted measures as meriting further investigation: incentives for scrapping older high-emitting vehicles and higher EV rebates for low-income households.
However, a ‘wait and see’ approach is likely to be too slow given the scale and speed needed to reach New Zealand’s climate targets. Pilot projects to test mobility solutions in New Zealand should be initiated with urgency, based on research of the actual transportation needs faced by low-income and rural households.126
Proactive, targeted support to low-income and rural households in relation to electric mobility will be needed to ensure they are able to participate in the low-emissions transition.

SECTION 7.AIMING FOR ACCELERATED ELECTRIFICATION
ACCELERATED ELECTRIFICATION
90
7.3 Process heatProcess heat currently contributes about 8% (7 Mt CO2e) of New Zealand’s total greenhouse gas emissions. The modelling shows that accelerated electrification could result in process heat emissions savings of about 2.6 Mt CO2e by 2035.
Emissions pricing via the NZ ETS will be central to incentivising emissions reductions in process heat.127 This is because it creates a relative price differential between fossil fuels and other low-emissions fuel sources such as electricity and biomass.
Some firms are switching away from fossil fuels, in part due to anticipation of higher emissions prices. For example, Synlait has recently installed a 6 MW electric boiler at its Dunsandel plant and Fonterra has announced a plan to replace coal with electricity to power its Stirling site in South Otago.
However, it is not clear the extent to which the NZ ETS will incentivise the electrification of existing process heat prior to 2035. It is estimated that switching away from coal to electricity or biomass will become economic in the range of $60-$120/t CO2e. Switching away from natural gas starts to become economic only above $120/t CO2e.128
There are a number of reasons why the NZ ETS price could be insufficient:
• Investments in new process heat technologies may be deterred by uncertainty about future emissions price trajectories, and private sector investors may also have different expectations to government about prices
• Response to a price signal may be very slow because these types of assets can be capital-intensive and long-lived, lasting for longer than 40 years
• Investments in energy or emissions intensity improvements (or fuel conversions including to biomass) compete for capital with other investments
• A future emissions price may not be factored into the full life-time of the asset – or it may be factored in at too low a price to affect the choice of technology
• For larger process heat users, the Committee also heard that regulatory hurdles relating to the connection of boilers to transmission and distribution networks can play a significant role in fuel switching decisions.
If uncertainty and regulatory hurdles result in new investments in fossil fuel technologies instead, this would lock New Zealand into high-emissions technology for decades to come and would make it much more challenging to meet New Zealand’s emissions reductions targets. Policy change is needed.

SECTION 7.AIMING FOR ACCELERATED ELECTRIFICATION
ACCELERATED ELECTRIFICATION
91
MBIE, in conjunction with EECA, is currently developing an action plan to reduce process heat emissions through improving the energy efficiency of process heat production and increasing the input from renewable energy.129 It will be important that this action plan includes policies to address barriers to using electricity (such as regulatory hurdles relating to connecting to transmission or distribution lines), energy efficiency, and biomass to reduce emissions from process heat use.
There is also a special case to more rapidly phase out the use of coal in process heat noting that New Zealand has already committed to phasing out coal use in electricity generation.130 In terms of emissions
per TWh of fossil fuel combusted (that is per unit of input energy), coal has a substantially higher emissions factor compared with natural gas (Table 7.1). Other jurisdictions are phasing out coal for process heat. For example, Finland is discontinuing the use of coal for energy production as well as for heating by 2029.131
Without delay, policies need to be identified that will strongly deter the development of any new fossil fuel process heat, and particularly coal. These policies should also phase out the use of coal in process heat according to a well-defined timeline. This timeline should be clearly communicated so that investment certainty can be given to businesses.
Table 7.1: Fossil fuel emissions factors
Combustion emissions factor (Mt CO2e per TWh)132
Coal (sub-bituminous) 0.334
Diesel 0.252
Natural gas 0.194

SECTION 7.AIMING FOR ACCELERATED ELECTRIFICATION
ACCELERATED ELECTRIFICATION
92
7.4 The electricity marketAccelerated electrification of transport and process heat, supplied with more renewable generation, is likely to have consequences for the electricity market. At the same time, the electricity system is evolving, with changing technology and more consumer participation in the market.
Regulation will need to keep pace with, and respond to, the consequences of all of these changes and innovations in the electricity market. It will require regulators to be nimble and to think proactively about a future system that is in the best interests of New Zealand both as a whole and for its constituent parts.
GETTING ELECTRICITY TO WHERE IT IS NEEDEDA substantial increase in new, renewable electricity generation to meet increased demand will mean investment will be required in transmission and distribution assets and services. This includes building and upgrading transmission and distribution lines.
However, the electricity market does not optimise the development of new lines together with the building of new generation. This is also an emerging issue globally.
Available capacity in the transmission network varies across the national grid and will continue to do so in the future. Whether or not distribution networks need upgrades or new connections differs across the country. The location of the generation or process heat, therefore, matters because
it impacts both the size of the investment required, as well as the time it takes to obtain resource consents.
Multiple new connections will be required for both renewable generation as well as to meet process heat requirements.133 Electrification of transport will also place additional requirements on the transmission and distribution networks:
• Process heat relies on parties having timely access to reliable and competitively priced electricity. For large process heat users, switching from fossil fuels to electricity involves using substantially more electricity and may require an upgraded or even a new line to supply the electricity needed
• Electrifying transport relies on people and businesses having access to reliable and affordable charging infrastructure – ranging from a plug at home to high capacity rapid chargers. Upgrades or new lines may also be needed, especially for high capacity rapid chargers.
Differing investment timeframes pose a challenge – a new or upgraded transmission line can take up to 11 years134 from conception to completion, whereas a new boiler can be up and running in less than a year.135
Timeliness, process barriers and costs are all a consideration for delivery of the necessary network infrastructure for process heat and EVs. It will be necessary for the Government to ensure that regulatory systems are able to respond in a timely manner to the needs of both new generation and new demand connecting either to the distribution or transmission network.

SECTION 7.AIMING FOR ACCELERATED ELECTRIFICATION
ACCELERATED ELECTRIFICATION
93
MANAGING IMPACTS OF INCREASING WIND AND SOLAR GENERATIONThe modelling shows that wholesale prices become increasingly volatile as the percentage of wind and solar generation increases under all futures. In other words, there are likely to be very high prices and very low prices. Dispersing wind farms around the country and deploying batteries mitigates some of this volatility.
At the same time, some volatility in the wholesale price is desirable as it plays an important role in signalling constraints on supply and providing an incentive to shift or reduce demand. Market innovations (discussed below) offer a way to turn price volatility risk into an opportunity.
Retailers already manage price volatility risk, but as this increases, a liquid hedge market that has longer term contracts will become even more important.136 Consumers will need to be able to continue to both access and see electricity as an affordable and secure resource. This will underpin the transition to EVs and the electrification of process heat.
Market changes and innovation, for example, in relation to specific types of consumer participation models, are likely to emerge in response. Related issues have also recently been discussed by the Electricity Price Review.137
Other trends in the electricity system, expected to continue out to 2035, include more distributed generation, increased consumer participation in the market via demand response, peer-to-peer trading and more storage capability. All of these will be underpinned by new market and service offerings.
DIFFERENT TYPES OF GENERATION AND STORAGENot all new generation will be connected to the grid. There are likely to be increasing opportunities for investment in new distributed generation, including with more local community involvement. Community involvement has social benefits, such as enhanced cohesion, acceptance (when there is control over where the generation is located), and self-sufficiency through self-supply.138
For example, iwi/Māori through local marae schemes and rural communities are actively transitioning to distributed generation for a variety of reasons, including cost and resilience (particularly if they are located in remote areas). Distributed generation is typically renewable.
It can be challenging for owners or would-be investors in distributed generation to access the electricity market. Owners of distributed generation can either sell any generation not used on site to a retailer through a contract, or sell it into the market and ‘take’ the wholesale price. It can be difficult to secure the longer term contracts – again, a liquid hedge market will be important.
Renewable generation for communities completely off the grid can be expensive compared with diesel generators, and there can be maintenance challenges. For example, Te Roroa iwi in Northland had mini hydro and rooftop solar systems installed in 2005 at its off-grid community, but they fell into disrepair. Rooftop solar (with batteries) that was later installed on individual households in the community has been more successful. The iwi has ambition for a greater level of small-scale generation in the future.
Ensuring community participation will increase acceptance of the scale of new renewable generation that needs to be built.

SECTION 7.AIMING FOR ACCELERATED ELECTRIFICATION
ACCELERATED ELECTRIFICATION
94
Social license is critical. The United Kingdom faced large opposition to onshore wind at a time when ambitious action on climate change was a policy priority.
New technologies also allow for new opportunities relating to ‘behind the meter’ generation and storage. Consumers with EVs could potentially offer electricity stored in their EV to distribution networks at peak times, most likely through a service provider, giving the consumer an opportunity to earn revenue and distributors the potential to avoid investment in peak capacity upgrades. Similarly, cheaper batteries will enable consumers with rooftop solar to store electricity that would otherwise be exported, better balancing their energy needs, reducing their demand and therefore their impact on the network.139
Consumers and new service providers will require ‘access’ to the network for these opportunities to be realised. That is, they will need access to data, and the ability to contract and provide services to distributors to support reliability and efficient investment. The Electricity Authority’s equal access project aims to address this.140
DEMAND RESPONSEAs noted earlier, demand response is likely to become a more important and more valuable feature of the electricity system as the proportion of more intermittent renewable generation increases. Consumers’ participation in demand response should be encouraged, but those who choose to participate in demand response need to receive an adequate price signal and, where relevant, compensation.
Essentially, the price must provide a big enough incentive for consumers to turn off or delay their electricity use (most likely through some kind of smart technology). Products with price signals are currently widely available for larger commercial and industrial consumers, but take-up is limited
for residential consumers. This will need to change to enable the increased levels of demand response that the modelling results indicates could be needed.
A sensitivity was modelled to look at the effect of ‘peakier’ demand in the electricity system in the accelerated electrification future. This represents a scenario where EV charging is not well-managed as there are no incentives to discourage people from all coming home and plugging their EVs in after work leading to a greater evening peak. The results show a very slight (0.5%) increase in emissions and very small (1-2%) increase in retail electricity prices (compared with the normal accelerated electrification future).141
However, these results are likely to be misleading because they do not reflect the substantial uncertainty regarding the future direction of transmission and distribution pricing. In essence, if “electricity demand becomes peakier, network investments for transmission and distribution are likely and this will push up network costs, which will be recovered from the network users”.142 Improved price signals will enable consumers to respond to and avoid increasing the peak. Reforms of transmission and distribution pricing are under consideration by the Electricity Price Review (see Chapter 2) and the Electricity Authority.143
Demand response will not be suitable for all consumers. It is important that consumers have choices, that they understand risks of different products, and that they can make informed decisions.
Greater participation by consumers should be facilitated. Examples include ensuring that electricity distributors can integrate and utilise ‘behind the meter’ generation and storage in their networks, and that consumers get appropriately rewarded. The Electricity Authority144 and the Commerce Commission145 are looking at these issues, which are becoming increasingly important to address.

SECTION 7.AIMING FOR ACCELERATED ELECTRIFICATION
ACCELERATED ELECTRIFICATION
95
In general, innovation will be key to managing the changes to the market over the coming years. It will be important that electricity market design remains fit for purpose and
can evolve to enable wide spread innovation, particularly with higher levels of renewable electricity in the system.
7.5 SummaryAn effective NZ ETS will play a vital role in encouraging emissions reductions across the economy. But it is unclear the extent to which the emissions price alone will be sufficient to achieve necessary emissions reductions prior to 2035.
Achieving the emissions savings that the Committee’s analysis has shown is feasible (a net saving of 5.4 Mt CO2e in transport and process heat) will require the Government to enact ambitious policies to encourage fuel-switching away from fossil fuels in these sectors.
In transport, a mix of policies will be needed. Any policy package must clearly demonstrate its ambition by quantifying the likely cumulative amount of transport decarbonisation. These policies must also ensure targeted support where required in relation to electric mobility. Pilot projects to test mobility solutions should be based on research about the actual transportation needs of low-income and iwi/Māori households.
In process heat, it will be important that barriers to using electricity, energy efficiency, and biomass are reduced.
In the short term, the development of any new coal-fired process heat should face extremely high hurdles. The use of coal
in existing process heat should also be phased out, with such a commitment clearly communicated so that investment certainty can be given to businesses.
The large potential increase in new renewable electricity generation will require substantial changes in how the electricity market operates. Upgrades to the transmission and distribution networks are likely to be required, and regulatory systems will need to change to accommodate the needs of new generation and process heat users.
The increase in wholesale price volatility as a result of an increasing proportion of intermittent renewables will create greater risks for market participants that they will need to manage. New players and forms of storage or generation in the market will also need to be better recognised, especially in terms of regulators allowing for and incentivising innovation in the system, for example in relation to distributed generation and demand response.
Widespread access to price signals and the ability for consumers to offer services and be rewarded for them will be required. Consumers will need to have choices, understand risks of different products, and be able to make informed decisions.

8.
Conclusions and recommendations

SECTION 8.CONCLUSIONS AND RECOMMENDATIONS
ACCELERATED ELECTRIFICATION
97
8.1 100% renewable electricityAbout 82% of electricity generated in New Zealand is from renewable sources. Electricity generation is responsible for about 5% of New Zealand’s greenhouse gas emissions.
To investigate future possibilities for the electricity system out to 2035, the Committee commissioned a modelling exercise, the results of which form the backbone of this report.
Under a business as usual future, New Zealand is on track to reach 93% renewable electricity on average by 2035. 97% renewable electricity could be reached under business as usual if Unit 5 at Huntly Power Station retires. However, this remains a significant uncertainty and is sensitive to both the natural gas and emissions prices.
Between 2019 and 2035, a business as usual trajectory results in generation from fossil fuels more than halving; generation from wind, geothermal, and rooftop solar increasing by about a third; and 200 MW of batteries being deployed. This is primarily due to the fact that the cheapest forms of new generation are currently wind and geothermal, and that batteries and solar are likely to also reduce in cost.
The modelling shows that it is technically feasible to achieve 100% renewable electricity by ‘overbuilding’. This means building additional renewable generation like wind and solar to cover dry years, and
substantially increasing battery storage and demand response.
However, going from 99% to 100% renewable electricity only reduces emissions by a small amount (less than 0.3 Mt CO2e) at an emissions abatement cost of over $1,200 per tonne of CO2e. It is also very likely to result in much higher retail electricity prices than in the business as usual future. The modelling indicates retail electricity prices would increase by about 14% for residential consumers, 29% for commercial consumers, and 39% for industrial consumers compared with today’s prices.
The Committee investigated an alternative future, aiming to understand whether accelerated electrification of transport and process heat could achieve larger emissions reductions while keeping electricity affordable. Currently, transport emissions are about three times larger (16 Mt CO2e) than electricity emissions, and process heat emissions are nearly twice as large (7 Mt CO2e).
The modelling showed that accelerated electrification of transport and process heat can deliver significant emissions reductions while keeping electricity prices affordable.
Electrifying about 50% of the vehicle fleet and accelerating conversion of low and medium-temperature process heat to electricity would significantly reduce emissions. Generating the required electricity from renewable sources would still result in about 3.6 Mt CO2e of greenhouse gas emissions per
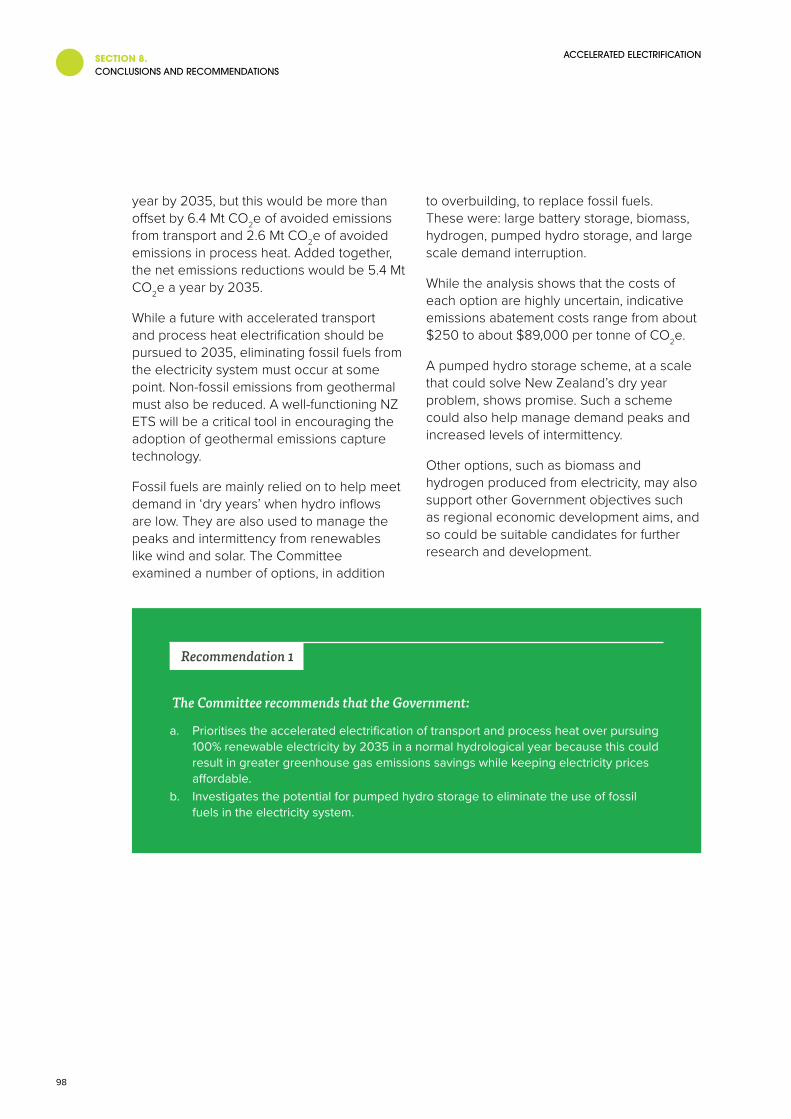
SECTION 8.CONCLUSIONS AND RECOMMENDATIONS
ACCELERATED ELECTRIFICATION
98
year by 2035, but this would be more than offset by 6.4 Mt CO2e of avoided emissions from transport and 2.6 Mt CO2e of avoided emissions in process heat. Added together, the net emissions reductions would be 5.4 Mt CO2e a year by 2035.
While a future with accelerated transport and process heat electrification should be pursued to 2035, eliminating fossil fuels from the electricity system must occur at some point. Non-fossil emissions from geothermal must also be reduced. A well-functioning NZ ETS will be a critical tool in encouraging the adoption of geothermal emissions capture technology.
Fossil fuels are mainly relied on to help meet demand in ‘dry years’ when hydro inflows are low. They are also used to manage the peaks and intermittency from renewables like wind and solar. The Committee examined a number of options, in addition
to overbuilding, to replace fossil fuels. These were: large battery storage, biomass, hydrogen, pumped hydro storage, and large scale demand interruption.
While the analysis shows that the costs of each option are highly uncertain, indicative emissions abatement costs range from about $250 to about $89,000 per tonne of CO2e.
A pumped hydro storage scheme, at a scale that could solve New Zealand’s dry year problem, shows promise. Such a scheme could also help manage demand peaks and increased levels of intermittency.
Other options, such as biomass and hydrogen produced from electricity, may also support other Government objectives such as regional economic development aims, and so could be suitable candidates for further research and development.
Recommendation 1
The Committee recommends that the Government:
a. Prioritises the accelerated electrification of transport and process heat over pursuing 100% renewable electricity by 2035 in a normal hydrological year because this could result in greater greenhouse gas emissions savings while keeping electricity prices affordable.
b. Investigates the potential for pumped hydro storage to eliminate the use of fossil fuels in the electricity system.

SECTION 8.CONCLUSIONS AND RECOMMENDATIONS
ACCELERATED ELECTRIFICATION
99
8.2 Accelerated electrification
TRANSPORTA 6.4 Mt CO2e reduction in transport emissions in 2035, relative to current levels, is equivalent to replacing 2.2 million fossil-fuelled vehicles with EVs by 2035. However, a one-to-one replacement is unlikely to be what occurs in reality and these emissions reductions could come from a mix of solutions (including other modes of travel and fuels).
New Zealanders tend to hold onto their cars for a long time compared to other countries. This means every additional fossil-fuelled vehicle imported into the country will be around for the next 10 to 20 years, locking in emissions over that time. New Zealand needs to keep pace with the shift towards EVs happening globally and ensure it does not become a dumping ground for fossil-fuelled vehicles.
Without additional targeted policies, many low and middle income households, or households in rural areas, may find it difficult to access electric transport. This challenge is particularly relevant for iwi/Māori households who are disproportionately represented in both these demographics.
The Committee’s view is that an ambitious target and policies are urgently needed. Policies could include:
• Standards on imported new and second-hand cars (such as fuel economy or emissions standards)
• Financial assistance (such as tax exemptions, financing, leasing or feebates)
• Accelerated provision of charging infrastructure
• An eventual ban on the importation of fossil-fuelled vehicles.
Recommendation 2
The Committee recommends that the Government:
a. Sets a target to reduce emissions from transport by at least 6 Mt CO2e in the year 2035 relative to current levels and, without delay, introduces policies to achieve this target.
b. Ensures that New Zealand does not become a dumping ground for fossil-fuelled vehicles.
c. Proactively enables low-emissions mobility for low-income and rural households.

SECTION 8.CONCLUSIONS AND RECOMMENDATIONS
ACCELERATED ELECTRIFICATION
100
PROCESS HEATThe Committee’s analysis shows that it is technically feasible to reduce emissions by 2.6 Mt CO2e per year by 2035 through electrification of low and medium-temperature process heat. However, it is not clear the extent to which the NZ ETS will incentivise the electrification of existing process heat prior to 2035.
Process heat infrastructure is capital intensive. Retirement and new investment decisions are infrequent, because the lifespan of plant can be more than 40 years.
Perceived or real uncertainty in the emissions price trajectory of the NZ ETS, and regulatory hurdles around connecting to the electricity network, could cause firms to continue to invest in fossil fuel plants over the next ten years. Investment in coal-fired process heat is particularly important to discourage due to its high emissions intensity.
Reducing regulatory hurdles relating to using electricity, such as those regarding connecting to transmission or distribution lines, should also be minimised.
Recommendation 3
The Committee recommends that the Government strongly encourages the phase out of fossil fuels in process heat by:
a. Deterring the development of any new fossil fuel process heat. b. Setting a clearly defined timetable to phase out fossil fuels in existing process heat,
with the phase out of coal as a priority.c. Reducing regulatory barriers relating to electrification.

SECTION 8.CONCLUSIONS AND RECOMMENDATIONS
ACCELERATED ELECTRIFICATION
101
8.3 Valuing hydropowerHydropower plays a vital role in the New Zealand electricity system. However, other pressures on freshwater are increasing, including deteriorating water quality, competing uses, and over-allocation of water bodies.
Iwi/Māori and others consider that existing consents and planning regimes give preference to hydro at the expense of ecological or cultural values. There is also acknowledgement by Government that some of New Zealand’s key freshwater bodies used for hydro generation are in poor and degraded states.
As a consequence, pressure is mounting on hydro-generation to ‘give back’ some water by, for example, increasing minimum flows.
Current national direction, such as within National Policy Statements, around competing uses for freshwater is incomplete, creating uncertainty for all interests, and is likely to lead to poor trade-offs being made. The current ambiguities and gaps in national policy direction must be resolved so that trade-offs are able to be weighed
more explicitly and strategically, and ensure sufficient weight is given to climate change in decision-making.
Iwi/Māori rights and interests in freshwater (including geothermal fluids) raise a distinctly different set of questions, with uncertain implications for existing hydro. Despite acknowledgement by the Crown that iwi/Māori have legitimate rights and interests in water, the Crown asserts that no one (including iwi/Māori) owns or can own water. However, the Waitangi Tribunal has already signalled that it will reject the concept that no-one owns water in a future report due next year.
It is not within the remit or expertise of the Committee to comment on how precisely this issue should be resolved. However, the Committee does consider it important that the Government work collaboratively with iwi/Māori to co-design solutions so that freshwater objectives can be agreed within the context of the Māori-Crown partnership, alongside providing some greater certainty around hydro electricity generation into the future.
Recommendation 4
The Committee recommends that the Government ensures the value of existing hydro generation to New Zealand’s climate change objectives is given sufficient weight when decisions about freshwater are made, including by:
a. Strengthening and clarifying national direction on making trade-offs between hydro generation and freshwater objectives across National Policy Statements.
b. Working collaboratively with iwi/Māori to co-design solutions so that rights and interests in freshwater are resolved within the context of the Māori-Crown partnership.
SECTION 8.CONCLUSIONS AND RECOMMENDATIONS
ACCELERATED ELECTRIFICATION
102
8.4 Providing for the development of wind generation at scaleNew wind generation (and its associated transmission and distribution infrastructure) will play a vital role in achieving emissions reductions. The modelling indicates that around 2,600 MW would be built in an accelerated electrification future – four times more than is currently in the system.
A key assumption of the modelling was that new wind generation (including consented but as yet unbuilt wind generation) could be built without constraint and as needed. Yet several barriers stand in the way.
Many sites have been consented but are yet unbuilt due to historically flat electricity demand growth. Obtaining necessary consent extensions or variations to accommodate rapid advances in technology (such as in turbine rotor size) can be time-consuming and challenging.
Upgrading (‘re-powering’) an existing wind farm can be substantially more cost-effective than building a new wind farm. This often means refitting existing wind farms with new (usually bigger) turbines. But, upgrading can be almost as difficult to consent as a new wind farm.
Wind generation also faces problems with legal interpretations of the RMA. Specifically, while wind generation has been successfully consented in the past, the legal interpretation of ‘avoid’ in the RMA has changed in recent years and this may now pose a significant barrier to future consenting. Under this new interpretation, effectively, where plans require visual or other inevitable adverse effects on the landscape be avoided, a wind farm cannot be consented. This is of particular relevance to wind and transmission infrastructure because their visual effects are impossible to avoid by nature.
Change is needed urgently to ensure renewable generation, and its associated transmission and distribution infrastructure, can be built in a timely manner, and deliver electricity to where it is needed. These include revisions to the National Policy Statement for Renewable Electricity Generation as well as the development of new National Environmental Standards relating to wind. The latter should include proactively identifying which types of landscapes are likely to be particularly suitable for wind infrastructure.
Making these changes could enable other outcomes, such as encouraging the implementation of Mana Whakahono ā Rohe by local authorities.

SECTION 8.CONCLUSIONS AND RECOMMENDATIONS
ACCELERATED ELECTRIFICATION
103
Recommendation 5
The Committee recommends that the Government provides for the development of wind generation and its associated transmission and distribution infrastructure at scale by:
a. Revising the National Policy Statement for Renewable Electricity Generation to resolve issues relating to lapsing and varying consents, and re-powering existing wind farms.
b. Developing National Environmental Standards to enable timely consenting of wind generation, both large and small, and transmission and distribution infrastructure. This should include proactively identifying which types of landscapes are likely to be particularly suitable for wind infrastructure.

SECTION 8.CONCLUSIONS AND RECOMMENDATIONS
ACCELERATED ELECTRIFICATION
104
8.5 A responsive regulatory systemA substantial increase in renewable electricity generation to meet the demand for accelerated electrification will have implications for the electricity system. There are likely to be increasing opportunities for investment in new distributed generation, including more local community involvement.
Building a large amount of renewable generation will place additional demands on the transmission and distribution networks. New lines and upgrades will be needed.
However, the electricity market does not optimise the development of new lines together with the building of new generation. Decisions about new transmission lines and upgrades will likely need to be more integrated with generation decisions in the future.
For large process heat users, switching from fossil fuels to electricity involves using substantially more electricity and may require an upgraded or a new line to supply the electricity needed.
However, differing investment horizons pose a barrier. A new or upgraded transmission or distribution line can take many years to go from conception to completion, whereas firms can install a new electric boiler on a significantly shorter timeframe. It will be necessary for the Government to ensure that the regulatory system meets the needs of parties wanting to connect new generation or process heat loads to the distribution or transmission network.
A better understanding of the barriers to the potential for further renewable distributed or off-grid generation is also needed, including to support the needs of rural communities, such as marae and settlements in remote locations.
Community support for renewable generation is crucial given the scale of generation that needs to be built. Ways to ensure community participation should be investigated to realise social benefits.
The distribution system will need to operate differently in response to growing amounts of generation ‘behind the meter’ (for example roof-top solar), battery storage (including in EVs), and demand response. Internationally, distribution systems are adapting, some rapidly, and the same needs to happen in New Zealand.
With this increasing consumer participation in the electricity system, sending the right price signals will be vital, and needs to be enabled by any future pricing reform. Retailers and distributors will need to innovate to provide price signals to consumers who want to more actively engage in demand response. Ensuring that consumers have access to data and can offer services to the network, such as battery storage, will also be important.
Regulators must facilitate the market change and enable the innovation that is needed, while ensuring that appropriate consumer protections are in place. The Government should also ensure that regulators give more weight to the objective of reducing emissions.

SECTION 8.CONCLUSIONS AND RECOMMENDATIONS
ACCELERATED ELECTRIFICATION
105
Recommendation 6
The Committee recommends that the Government ensures that:
a. Regulators be required to take the objective of reducing emissions into account through mechanisms such as Government Policy Statements.
b. The regulatory system:• Facilitates timely investment in the transmission network that optimises the
development of new lines with the building of new power generation• Contains clear processes for approving, consenting and constructing new or
upgraded electricity lines for process heat and electric vehicle infrastructure• Enables distributors and retailers to innovate and adapt to increasing levels of
consumer-based technology• Enables consumers to get the right pricing signals to engage in demand response
and make best use of new technologies. c. Barriers to distributed and off-grid renewable generation are identified and
addressed, and ways to ensure communities can participate are considered.

ACCELERATED ELECTRIFICATIONLIST OF ABBREVIATIONS
106
CO2e Carbon dioxide equivalent
EV Electric vehicle
GJ Gigajoule
GW Gigawatt
GWh Gigawatt hour
HVDC High-voltage direct current
kW Kilowatt
kWh Kilowatt hour
MBIE Ministry of Business, Innovation and Employment
MfE Ministry for the Environment
Mt Million tonnes
MW Megawatt
MWh Megawatt hour
NPS-FM National Policy Statement for Freshwater Management
NPS-REG National Policy Statement for Renewable Electricity Generation
NZ ETS New Zealand Emissions Trading Scheme
PJ Petajoule
RMA Resource Management Act 1991
t tonne
TW Terawatt
TWh Terawatt hour
W Watt
List of abbreviations

ACCELERATED ELECTRIFICATIONREFERENCES
107
Australian Government. (2019). Guaranteeing essential services. Retrieved from https://www.budget.gov.au/2019-20/content/services.htm
Berka, A., MacArthur, J., Matthewman, S., Poletti, S., & Bargh, M. (2018). Policy strategies for inclusive renewable energy in Aotearoa (New Zealand). Retrieved from https://www.policycommons.ac.nz/2018/12/06/policy-strategies-for-inclusive-renewable-energy-in-aotearoa-new-zealand/
Beverley, P., & Allen, D. (2014). Implications of the New Zealand King Salmon Supreme Court decision. Retrieved from https://www.buddlefindlay.com/insights/implications-of-the-new-zealand-king-salmon-supreme-court-decision/
Bioenergy Association. (2018). Wood energy. Retrieved from https://www.bioenergy.org.nz/wood-energy-uses
Commerce Commission. (2019). Commission and Electricity Authority launch project to shine spotlight on emerging contestable services [Press release]. Retrieved from https://comcom.govt.nz/news-and-media/media-releases/2019/commission-and-electricity-authority-launch-project-to-shine-spotlight-on-emerging-contestable-services
Concept Consulting. (2018). ‘Driving change’ – Issues and options to maximise the opportunities from large-scale electric vehicle uptake in New Zealand. Wellington: Concept Consulting Group Ltd.
Deloitte. (2019). New market. New entrants. New challenges. Battery electric vehicles. London: Deloitte LLP.
Durette, M., Nesus, C., Nesus, G., & Barcham, M. (2009). Māori perspectives on water allocation. Prepared for the Ministry for the Environment. Wellington: Nesus and Associates Ltd and Synexe.
Electricity Authority. (2016). Electricity in New Zealand. Wellington: Electricity Authority.
Electricity Authority. (2018). Innovation and Participation Advisory Group Meeting Papers: 6 December 2018. Retrieved from https://www.ea.govt.nz/development/advisory-technical-groups/ipag/meeting-papers/2018/6-december-2018/
Electricity Authority. (2019a). Distributed generation. Retrieved from https://www.ea.govt.nz/operations/distribution/distributed-generation/
Electricity Authority. (2019b). Evolving technologies and business models. Retrieved from https://www.ea.govt.nz/development/work-programme/evolving-tech-business/
Electricity Authority. (2019c). Existing generation plant. Retrieved from: https://emi.ea.govt.nz/Wholesale/Datasets/Generation/Generation_fleet/Existing/
Electricity Authority. (2019d). Pricing and cost allocation. Retrieved from https://www.ea.govt.nz/development/work-programme/pricing-cost-allocation/
Energy Storage Association. (2019). Pumped hydroelectric storage. Retrieved from http://energystorage.org/energy-storage/technologies/pumped-hydroelectric-storage
EV Norway. (2019). Norwegian EV policy. Retrieved from https://elbil.no/english/norwegian-ev-policy/
Fajardy, M., Koberle, A., MacDowell, N., & Fantuzzi, A. (2019). BECCS deployment: A reality check. Grantham Institute Briefing paper No 28. London: Imperial College London.
Halliburton, T. (2015). Assessment of the impact of flow alterations on electricity generation. Wellington: Ministry for the Environment and Ministry for Primary Industries.
Hearnshaw, E., & Girvan, M. (2018). Reducing barriers to electric vehicle (EV) uptake: A behavioural insights analysis and review. Retrieved from https://dpmc.govt.nz/sites/default/files/2018-06/EV%20presentation%20FINAL.pdf
ICCT. (2017). Expanding access to electric mobility in the United States. Washington: The International Council on Clean Transportation.
IPCC. (2014). Summary for policymakers. In C. B. Field, V. R. Barros, D. J. Dokken, K. J. Mach, M. D. Mastrandrea, T. E. Bilir, M. Chatterjee, K. L. Ebi, Y. O. Estrada, R. C. Genova, B. Girma, E. S. Kissel, A. N. Levy, S. MacCracken, P. R. Mastrandrea, & L. L. White
References

ACCELERATED ELECTRIFICATIONREFERENCES
108
(Eds.), Climate change 2014: Impacts, adaptation, and vulnerability. Part A: Global and sectoral aspects. Contribution of Working Group II to the Fifth Assessment Report of the Intergovernmental Panel on Climate Change (pp. 1-32). Cambridge: Cambridge University Press.
Japan Ministry of Economy Trade and Industry. (2016). Compilation of the Road Map for EVs and PHVs toward the Dissemination of Electric Vehicles and Plug-in Hybrid Vehicles. Retrieved from https://www.meti.go.jp/english/press/2016/0323_01.html
Kerr, S., Leining, C., Silver, J., Brown, P., Brunel, N., Cortes-Acosta, S., . . . Young, P. (2017). An effective NZ ETS: Clear price signals to guide low-emission investment. Motu Note #27. Wellington: Motu Economic and Public Policy Research.
Kodransky, M., & Lewenstein, G. (2014). Connecting low-income people to opportunity with shared mobility. New York: Institute for Transportation and Development Policy and Living Cities.
Leining, C. (2017). Improving emission pricing in New Zealand. Wellington: Motu Economic and Public Policy Research.
MartinJenkins. (2019). Modelling retail electricity prices under high renewables, and low-emissions scenarios. Wellington: Martin Jenkins.
Mason, I. G., Page, S. C., & Williamson, A. G. (2010). Transitioning to a 100% renewable electricity generation system: Balancing the roles of wind generation, base-load generation and hydro storage. Paper presented at the The NZ Society for Sustainability Science and Engineering Conference ‘Transitions to Sustainability’, Auckland. http://www.thesustainabilitysociety.org.nz/conference/2010/papers/Mason-Page-Williamson.pdf
MBIE. (2011). New Zealand Energy Strategy 2011–2021. Wellington: New Zealand Government.
MBIE. (2016). Energy sector greenhouse gas emissions. Retrieved from https://www.mbie.govt.nz/building-and-energy/energy-and-natural-resources/energy-statistics-and-modelling/energy-statistics/new-zealand-energy-sector-greenhouse-gas-emissions/
MBIE. (2017). New Zealand energy sector greenhouse gas emissions. Wellington: Ministry of Business, Innovation & Employment.
MBIE. (2018). Energy in New Zealand 2018. Wellington: Ministry of Business, Innovation & Employment.
MBIE. (2019a). Electricity Price Review 2018-2019. Retrieved from https://www.mbie.govt.nz/building-and-energy/energy-and-natural-resources/energy-consultations-and-reviews/electricity-price/
MBIE. (2019b). Electricity statistics. Retrieved from https://www.mbie.govt.nz/building-and-energy/energy-and-natural-resources/energy-statistics-and-modelling/energy-statistics/electricity-statistics/
MBIE. (2019c). Process heat in New Zealand. Retrieved from https://www.mbie.govt.nz/building-and-energy/energy-and-natural-resources/low-emissions-economy/process-heat-in-new-zealand/
McDonald, T. (2019). China powers up electric car market. BBC. Retrieved from https://www.bbc.com/news/business-46745472
Meridian Energy Limited, & New Zealand Aluminium Smelters Limited. (2016). Electricity agreement conformed as at March 2016. Retrieved from https://www.meridianenergy.co.nz/assets/Investors/Reports-and-presentations/NZAS-contract/ca5a09f07b/NZAS-contract-consolidated-and-redacted.pdf
MfE. (2017). Te Mana o te Wai. Retrieved from https://www.mfe.govt.nz/sites/default/files/media/Te%20Mana%20o%20te%20Wai.pdf
MfE. (2018a). Mana Whakahono ā Rohe guidance. Wellington: Ministry for the Environment.
MfE. (2018b). Understanding our emissions reduction targets. Retrieved from http://www.mfe.govt.nz/climate-change/climate-change-and-government/emissions-reduction-targets/about-our-emissions
MfE. (2019a). New Zealand’s greenhouse gas inventory 1990-2017. Wellington: New Zealand Government.
MfE. (2019b). Overview of likely climate change impacts in New Zealand. Retrieved from http://www.mfe.govt.nz/climate-change/likely-impacts-of-climate-change/overview-of-likely-climate-change-impacts
MfE, & Māori Crown Relations Unit. (2018). Shared interests in freshwater: A new approach to the Crown/Māori relationship for freshwater. Wellington: New Zealand Government.
MfE, & MBIE. (2016). Report of the outcome evaluation of the National Policy Statement for Renewable Electricity Generation. Wellington: New Zealand Government.
MfE, & MPI. (2018). Essential freshwater: Healthy water, fairly allocated. Wellington: New Zealand Government.

ACCELERATED ELECTRIFICATIONREFERENCES
109
MfE, & Stats NZ. (2017). Our fresh water 2017: Data to 2016. Wellington: New Zealand Government.
Ministry of Economic Affairs and Employment of Finland. (2018). Legislative proposals: Coal ban in 2029, more transport biofuels and more biofuel oil for heating and machinery. Retrieved from https://tem.fi/en/article/-/asset_publisher/lakiehdotukset-kivihiilikielto-2029-lisaa-biopolttoaineita-liikenteeseen-seka-biopolttooljya-lammitykseen-ja-tyokoneisiin
MoT. (2017). Annual fleet statistics 2017. Retrieved from https://www.transport.govt.nz/assets/Uploads/Research/Documents/Fleet-reports/1b33252a3d/The-NZ-Vehicle-Fleet-2017-Web.pdf
MoT. (2018). Transport Outlook: Future State Model Results. Retrieved from https://www.transport.govt.nz/mot-resources/transport-outlook/transport-outlook-future-state-model-results/
Nightingale, D. (2018). Achieving new zero carbon: How the RMA can help. Resource Management Journal (November), 3-8.
NIWA. (2007). 2005: Summary. Retrieved from https://www.niwa.co.nz/climate/summaries/annual/2005
Norwegian Ministry of Petroleum and Energy. (2019). Electricity production. Retrieved from https://energifaktanorge.no/en/norsk-energiforsyning/kraftproduksjon/
NZAS. (2019). New Zealand’s Aluminium Smelter. Retrieved from http://www.nzas.co.nz/
NZGA. (2018). Geothermal emissions. Retrieved from http://nzgeothermal.org.nz/emissions/
NZPC. (2018). Low-emissions economy: Final report. Wellington: New Zealand Productivity Commission.
OECD. (2015). Aligning policies for a low-carbon economy. Paris: OECD.
Office of the Minister for Climate Change. (2018). Interim Climate Change Committee terms of reference and appointment. Wellington: Office of the Minister of Climate Change.
Palmer, G. (2015). New Zealand’s defective law on climate change. Public lecture delivered at Victoria University of Wellington, 16 February 2015. Wellington: Faculty of Law and Centre for Public Law, Victoria University of Wellington.
Scion. (2018). Increasing the use of bioenergy & biofuels. Retrieved from https://www.scionresearch.com/science/bioenergy/bioenergy-and-biofuels
Shaw, J. (2017). NZ to become a leader in the fight against climate change [Press release]. Retrieved from https://www.beehive.govt.nz/release/nz-become-leader-fight-against-climate-change
Sierra Club, & Plug In America. (2018). AchiEVe: Model state & local policies to accelerate electric vehicle adoption. California: Sierra Club and Plug In America.
SnowyHydro. (2019). Looking forward – Snowy 2.0. Retrieved from https://www.snowyhydro.com.au/our-scheme/snowy20/
The Greenlining Institute. (nd). Electric vehicles for all: An equity toolkit. Retrieved from http://greenlining.org/publications-resources/electric-vehicles-for-all/
Transpower. (2018a). Hydro storage information. Retrieved from https://www.transpower.co.nz/system-operator/security-supply/hydro-storage-information
Transpower. (2018b). Te Mauri Hiko: Energy futures. Wellington: Transpower.
UK Government. (2018). The Road to zero: Next steps towards cleaner road transport and delivering our iIndustrial Strategy. London: UK Government Department for Transport.
US Department of Energy. (2019a). Hydrogen production. Retrieved from https://www.hydrogen.energy.gov/production.html
US Department of Energy. (2019b). Reducing pollution with electric vehicles. Retrieved from https://www.energy.gov/eere/electricvehicles/reducing-pollution-electric-vehicles
Vickers, J., Fisher, B., & Hon, Q. (2018). Creating a positive drive: Decarbonisation of New Zealand’s transport sector by 2050. Wellington: thinkstep Ltd.
Waitangi Tribunal. (2012). The Stage 1 report on the National Freshwater and Geothermal Resources Claim: WAI 2358. Wellington: Waitangi Tribunal.
Waitangi Tribunal. (2018). National Fresh Water and Geothermal Resources Inquiry. Retrieved from https://www.waitangitribunal.govt.nz/inquiries/urgent-inquiries/national-fresh-water-and-geothermal-resources-inquiry/
Welvaert, M. (2018). What’s in store for EV sales between now and 2040? Retrieved from http://www.infometrics.co.nz/whats-store-ev-sales-now-2040-2/

ACCELERATED ELECTRIFICATIONENDNOTES
110
1 Carbon dioxide equivalent (CO2e) is a measure that equivalises the warming potential of different types of greenhouse gases, using carbon dioxide as the base for comparisons. In this report, greenhouse gas emissions are all in CO2e unless otherwise specified.
2 See www.iccc.mfe.govt.nz for the Committee’s report on agriculture.
3 Office of the Minister for Climate Change (2018).
4 Woody biomass comes in a number of forms, including firewood, bark, sawdust, shavings, wood chips, forestry residues and agricultural crops (Bioenergy Association, 2018; Scion, 2018). Solid biomass can be used in boilers and burners in residential, commercial and industrial situations. Types of solid biomass include wood chips, wood pellets and briquettes (Bioenergy Association, 2018).
5 The Committee was assisted in its modelling work by an E-Charge group, created to provide technical expertise and sector knowledge in relation to the Committee’s quantitative analysis. It did not have any decision-making power, but reviewed and provided input on proposals put forward by the Committee. E-Charge’s eight members were chosen based on their skills in one or more of the following areas: knowledge of the energy, transport, or process heat sectors; energy technologies and trends; policy or economics; or experience in energy modelling. The members were: Andy Philpott (University of Auckland), Garth Dibley (WEL Networks), Gillian Blythe (Meridian Energy), John Carnegie (BusinessNZ), John Culy (modelling consultant), Martin McMullan (New Zealand Transport Agency), Steve O’Connor (Flick Electric), and Victoria Coad (Concept Consulting). Other individuals from
government agencies were, from time to time, also invited to attend E-Charge meetings to provide specific insights or commentary.
6 See www.iccc.mfe.govt.nz for the technical annex.
7 MBIE (2018).
8 Figure 2.1 excludes cogeneration.
9 MfE (2019b). For example, WEL Networks (the lines company that supplies 89,000 customers in the Waikato region) told the Committee that it sees an average demand of about 4.6 GWh on cold winter’s day. During the heatwave that occurred during late January 2019, demand reached 3.7 GWh.
10 Electricity Authority (2016).
11 The terms electricity supply and electricity generation in essence mean the same thing and so are used interchangeably in this report (although it is noted that electricity can be supplied from things like batteries which are not themselves sources of generation).
12 Non-renewable electricity also includes electricity generated from waste heat (when it is not created using biomass or geothermal energy). Waste heat is heat produced as a by-product of another process or machine.
13 As electricity travels through power lines, energy is lost as heat due to the resistance in the lines.
14 They are zero emissions at the point of generation. All sources of generation contain what are known as embedded emissions – that is, emissions that were produced during equipment manufacturing (like the wind turbine, or the concrete for the hydro dam).
Endnotes

ACCELERATED ELECTRIFICATIONENDNOTES
111
15 The Electricity Authority defines distributed generation as being “connected directly to local networks rather than the national grid… [it] encompasses a range of technologies and scales, including small-scale systems such as photovoltaic modules, small wind turbines and micro-hydro schemes. This generation may be used, for example, as electricity sources for businesses, homes or farms” (Electricity Authority, 2019a).
16 These are Auckland City Hospital (natural gas), Auckland City Hospital 2 (diesel), BOP Edgecumbe Fonterra, Kapuna, Te Rapa, and Whareroa (also known as Kiwi Cogen Hawera).
17 This includes Glenbrook and Kinleith. Estimated emissions from natural gas use at Kinleith are included in this analysis, but Glenbrook’s emissions are not. Glenbrook generates electricity using waste gases from steel production.
18 Meridian Energy Limited and New Zealand Aluminium Smelters Limited (2016).
19 This is based on the calculation of what is known as a hydro risk curve. These indicate the current state of hydro storage and level of risk around that, and official conservation campaigns are called when the 10% hydro risk curve is breached.
20 This refers to generation on the consumer side (such as rooftop solar or home battery packs), and not on the network.
21 MfE (2019a).
22 These emissions are known as ‘fugitive emissions’. Fugitive emissions are different to the emissions caused as a result of fuel combustion. Instead, they refer to emissions that leak during fuel extraction and delivery.
23 NZGA (2018).
24 NZPC (2018).
25 NIWA (2007).
26 From 2007 to 2017 (MBIE, 2018).
27 The petrol cost is excluding GST and assumes a medium car (2,000 to 3,500 cc) using Regular 91 petrol with a fuel mileage of 8.95 litres per 100 kilometres (km) travelled, and travelling 14,000 km per year (MfE, pers. comm. 2 April 2019).
28 Other work by the Electricity Authority is also relevant, particularly on distribution pricing reform and network access arrangements.
29 At the point where electricity is supplied from the national grid into the local distribution network.
30 Other elements of the retail electricity price include distribution charges (27%), transmission charges (10.5%), retail charges (13%) and GST (13%) (Electricity Authority, 2016).
31 Over the counter products are agreed directly between generators and electricity purchasers (typically retailers), and different types of over the counter products are used to manage different types of spot price volatility risk. Derivative products are purchased on the Australian stock exchange (ASX) electricity futures market. These are longer term (up to one year) contracts that form the basis of ‘market-making’ by the four biggest generator-retailers (Contact, Genesis, Mercury and Meridian), who voluntarily quote buy and sell prices with spreads of no more than 5% for certain benchmark contracts.
32 Specifically it reflects the level of wholesale prices necessary to cover the costs of the

ACCELERATED ELECTRIFICATIONENDNOTES
112
marginal new generation required to meet demand. Prices in this paragraph refer to real 2018 terms.
33 Cogeneration specifically included (including fuel type) is: Glenbrook (waste gases), Kapuni (natural gas), Kiwi Cogen Hawera (natural gas), Te Rapa (natural gas) and Kinleith (wood and natural gas). Generation from non-grid connected plants are accounted for in demand profiles – that is, the generation is netted off demand.
34 The modelling was undertaken by Energy Link, a specialist electricity consultancy, with additional analysis undertaken by John Culy. Further modelling was also undertaken by Concept Consulting. See www.iccc.mfe.govt.nz for the technical modelling annex, as well as all other modelling resources including the modelling spreadsheets.
35 The modelling assumes that the current NZ ETS reforms proceed.
36 These are a combination of electricity system models, owned and run by Energy Link, which are frequently used by organisations in the electricity sector to guide investment decisions.
37 Model inputs that affect what gets built include assumptions about the retirement of old power plants (for example at the end of their useful life, or based on public announcements). All of the models assume a form of perfect foresight, that is, participants in the electricity system have full information about the future.
38 The Committee also undertook a one hourly model run of the business as usual question. For more information see the technical annex.
39 Non-supply occurs when there is a lack of generating capacity available, so there is not enough supply to meet demand.
40 In step 1 (to 96%) Unit 5, the 395 MW combined cycle gas turbine plant, is removed and replaced with new renewables from a ranked set of options available in 2035. This adds 150 MW of batteries, 421 MW of wind and 80MW of geothermal. In step 2 (to 98%)
220 MW of cogeneration is removed (i.e. the model assumes it closes) except for 40 MW which is assumed to convert to full biomass. 177 MW of wind and 25 MW of geothermal is added. In step 3 (to 99%) wind and solar are overbuilt and some natural gas peaking plant (100 MW) is retired. An additional 28 MW of wind, 50 MW of solar, 42 MW of hydro and 25 MW of geothermal is added. Finally, in step 4 (to 100%), all remaining fossil fuel plant (including the diesel generator at Whirinaki) is removed (820 MW) and is replaced with 400 MW of solar, 578 MW of wind, 75 MW of geothermal and 121 MW of hydro, plus 500 MW of six and 12 hour batteries were added.
41 In all of the scenarios the analysis assumes solar photovoltaics (rooftop solar) is installed at 7% of premises. This is split between 10% of new installations being commercial (which could include schools, for example,) at around 22 kW and 90% being residential (at around 4 kW). 19,500 households had solar as of October 2018.
42 Examples of international organisations referenced include the World Bank, the International Energy Agency, and Bloomberg New Energy Finance.
43 Example of other modelling efforts referenced include MBIE’s Electricity demand and generation scenarios and modelling conducted for the Productivity Commission’s Low-emissions economy inquiry.
44 See the technical annex for more detail on all the model inputs.
45 Energy Link long term forecast of natural gas price – medium natural gas price pathway.
46 Linear path estimate following the Productivity Commission’s Low-emissions economy model.
47 Other assumptions about electricity demand arising from EV uptake in New Zealand by 2050 have been between 1.3 TWh and 27 TWh (NZPC, 2018; Transpower, 2018b). The modelling assumed a higher scrappage rate, and that some of these EVs are heavy vehicles such as trucks and buses.

ACCELERATED ELECTRIFICATIONENDNOTES
113
48 EV Norway (2019); UK Government (2018).
49 Other assumptions about electricity demand arising from process heat electrification in New Zealand by 2050 have been between 0 TWh and 31 TWh (NZPC, 2018; Transpower, 2018b).
50 NZPC (2018).
51 The modelled sensitivity is a 5% increase in minimum flows on the South Island major river systems with hydro-electric generation, excluding Manapouri and Te Anau; a 2% increase in extraction of water from the South Island hydro lakes from October to March inclusive but again excluding Manapouri and Te Anau; and a 10% increase in the minimum flows below Karapiro on the Waikato River.
52 Concept Consulting (2018) was referenced to allow the Committee to change the daily demand profile assumed in this sensitivity, adding about 180 MW in total to the daily peak when measured on a half hourly basis.
53 Modelled wholesale electricity prices are set based on competition in the contracts market to reflect prices required to support the cost of the lowest cost new generation required in the target year. In 2035 this is wind. Note that cost of wind includes a portion of the cost of batteries to reflect what could be installed to manage intermittent supply. This is discussed further in the technical annex.
54 The marginal emissions abatement cost is calculated based on annual system cost of operating the electricity system.
55 As it is netted off demand in the daily demand profile that is used in the model.
56 In addition there are other types of demand response, such as ripple control, which are implicitly modelled.
57 The lack of generous storage capability in the New Zealand hydro lakes is a contributing factor to the dry year problem. While other countries are also heavily reliant on hydro, such as Norway, New Zealand’s hydro lakes are relatively shallow and do not offer as large
a storage potential. For example, Norway’s storage capacity corresponds to 70% of annual Norwegian electricity consumption (total storage is about 84,000 GWh) whereas New Zealand only has about 34 days reserve at peak winter demand (total storage is about 4,400 GWh) (Mason et al., 2010; Norwegian Ministry of Petroleum and Energy, 2019; Transpower, 2018a). Unlike New Zealand, Norway has inter-connections with electricity markets in other countries.
58 MfE (2019b).
59 Meridian Energy, pers. comm. 8 April 2019.
60 Energy Link, pers. comm. 11 April 2019.
61 Meridian Energy, pers. comm. 8 April 2019.
62 MBIE (2011, p. 6) states that the “Government retains the target that 90 percent of electricity generation be from renewable sources by 2025 (in an average hydrological year) providing this does not affect security of supply”.
63 There are however some indicators relevant to the idea of a ‘dry year’. Transpower tracks information on what is known as controlled and contingent storage in New Zealand’s hydro lakes (expressed in GWh). Controlled storage can be used at any time to generate electricity, but “contingent storage may only be used during defined periods of shortage or risk of shortage” (Transpower, 2018a). Transpower uses what it calls hydro risk curves to show a 1%, 4%, 8% and 10% risk of future shortages (excluding contingent storage).
64 All data in this chapter is drawn from the analysis provided by Energy Link or John Culy unless otherwise specified.
65 Note that the data referring to natural gas includes a very small amount of diesel (from Whirinaki) for both generation and emissions. This is not separated out in this report due to the very small amount of diesel used.
66 While rooftop solar is put into the model as an assumption, the amount of large scale solar is an output of the model.

ACCELERATED ELECTRIFICATIONENDNOTES
114
67 See section 3.4 for the discussion of ‘weather year’.
68 MartinJenkins (2019).
69 Excludes non-grid connected generation, such as distributed generation.
70 It is an open question whether these will be built in reality – natural gas peaking plants can last for up to 35 years, so decisions to build such plants in the early 2030s would require assessment of the economics out beyond 2035. The capacity factor for the modelled gas peakers under accelerated electrification is around 13%. The modelling also showed that it is possible under a 100% renewable electricity future that there could be natural gas peaking plants built on the way to 2035 (with the implication being that they would be forced to close by 2035). Whether such plant would be built is uncertain and would depend on the type and date of the regulatory intervention pursued if a 100% renewable electricity future was targeted.
71 NZAS (2019).
72 Load shedding is when demand for electricity is reduced.
73 ‘Offshore Wind for New Zealand’, C.A. Ishwar; I.G. Mason, Department of Civil and Natural Resources Engineering, University of Canterbury, Christchurch, New Zealand. Publication pending.
74 All cost figures in this report are expressed in real 2018 dollar terms unless otherwise specified.
75 A small amount of non-supply is tolerated in all modelling runs as an inherent feature of the model. New Zealand rarely experiences black-outs or outages and they are usually the result of an unexpected loss of load due to a weather event or similar. These unexpected loss of load events are not captured by the model.
76 These results are all on average over the 87 weather years.
77 The modelled 100% renewable electricity future stretches the limits of the model’s capability.
78 MartinJenkins (2019). Note also that the retail electricity price that consumers pay includes a component to cover the cost of building new generation, and the cost of running generation (for example the fuel cost and emissions price).
79 $41.20 plus or minus 9%; $36.80 plus or minus 4% (MartinJenkins, 2019).
80 IPCC (2014).
81 The 99% renewable future includes some overbuild of renewable generation.
82 Except pumped hydro storage. The nature of this solution means the sizing is, to an extent, determined by the geography of the scheme.
83 In addition, in the 100% future the model produced non-supply costs, implying the modelled solution underestimates the costs of meeting the dry year challenge. This means more generation would need to be built to meet dry years. Under the 100% renewable future there is an average of 4 GWh a year of non-supply. This is approximately equivalent to 2.5 million homes having no supply for an average of two hours each year. More generation could be built. However, the additional generation would not be revenue adequate within the model.
84 Only part of the full rating for a battery can be used in order to avoid shortening the life of a battery – more batteries may be required.
85 Fajardy et al. (2019).
86 US Department of Energy (2019a).
87 Energy Storage Association (2019).
88 The Australian Government committed NZ$1.5 billion in equity in April 2019 (Australian Government, 2019).
89 Snowy Hydro (2019).
90 The analysis assumes no constraint on the availability of natural gas.

ACCELERATED ELECTRIFICATIONENDNOTES
115
91 This is in addition to increasing recognition of their past impacts, namely how they were often built at great cost to river environments and iwi/Māori values.
92 MfE and MPI (2018); MfE and Stats NZ (2017).
93 Durette et al. (2009).
94 Electricity generators consider that the biggest foreseeable risk for future supply of renewable electricity generation is re-consenting of hydro projects (MfE & MBIE, 2016).
95 Halliburton (2015).
96 The NPS-REG came into effect in 2011 and sets out the objective and policies for renewable electricity generation under the RMA. Its objective is “to recognise the national significance of renewable electricity generation activities by providing for the development, operation, maintenance and upgrading of new and existing renewable electricity generation activities, such that the proportion of New Zealand’s electricity generated from renewable energy sources increases to a level that meets or exceeds the New Zealand Government’s national target for renewable electricity generation.”
97 The NPS-FM came into effect in 2014 and sets out the objectives and policies for freshwater management under the RMA. It has no single objective, rather 15 separate objectives under eight different topics.
98 MfE (2017).
99 Waitangi Tribunal (2018, 2012).
100 Closing submissions for the Crown in the matter of the Treaty of Waitangi Act 1975 and in the matter of the National Fresh Water and Geothermal Resources Inquiry WAI 2358, 20 November 2018, p.38.
101 This in preference to a distribution mechanism using funds from allocation or levying of allocation, or waiting and seeing what the Waitangi Tribunal and courts decide. See MfE and Māori Crown Relations Unit (2018).
102 In particular, the ‘King Salmon’ decision (NZSC 38 [2014]) and the ‘Davidson’ decision (NZCA 316 [2018]) have been influential as regards how to interpret national direction and plans in relation to Part 2 of the RMA. Electricity industry stakeholders in particular are concerned that future planning and consenting decisions will give greater weight to more directive policies on environmental protection matters such as outstanding landscapes or freshwater values than the more general promotion policies of the NPS-REG.
103 Beverley and Allen (2014).
104 While wind-farms do not require periodic renewal of consent like hydropower water permits, changes in technology mean wind farms, in effect, require re-consenting when their turbines need replacing.
105 National Environmental Standards are regulations issued under section 43 of the RMA and can apply regionally or nationally (although all current National Environmental Standards apply nationally).
106 This report focuses on emissions reductions, but the limited ability of the RMA to adequately deal with climate change adaptation has also been highlighted (Palmer, 2015).
107 Another example is conflict between the ‘avoid’ policies 11, 13 and 15 in the New Zealand Coastal Policy Statement, and a ‘seek to avoid’ policy in the National Policy Statement on Electricity Transmission (Nightingale, 2018). This conflict makes it very difficult, in the coastal environment, to realise the benefits of renewable electricity generation that are intended to be recognised and provided for under the NPS-REG.
108 OECD (2015).
109 Mana Whakahono ā Rohe provisions were introduced in the 2017 amendments to the RMA. The provisions are a tool that tangata whenua and local authorities can use to discuss and agree on how they will work together under the RMA, in a way best suiting their local circumstances (MfE, 2018a).

ACCELERATED ELECTRIFICATIONENDNOTES
116
110 Kerr et al. (2017); Leining (2017); NZPC (2018).
111 Under all three futures, coal is removed from the system because of reasons separate to the NZ ETS price.
112 MartinJenkins (2019).
113 US Department of Energy (2019b).
114 MoT (2018); Welvaert (2018).
115 Upfront cost parity is widely regarded as the tipping point at which EV uptake will snowball and no longer require large scale government assistance (Deloitte, 2019; Hearnshaw & Girvan, 2018; NZPC, 2018).
116 NZPC (2018).
117 MoT (2017).
118 Alistair Davis (CEO Toyota New Zealand Ltd, Chair Sustainable Business Council), pers. comm. 14 March 2019.
119 The current official target is to reach approximately 64,000 EVs by the end of 2021.
120 NZPC (2018).
121 NZPC (2018).
122 ICCT (2017); Sierra Club and Plug In America (2018); Vickers et al. (2018).
123 Japan Ministry of Economy Trade and Industry (2016); McDonald (2019).
124 The Greenlining Institute (nd).
125 NZPC (2018, p. 298).
126 Kodransky and Lewenstein (2014).
127 NZPC (2018).
128 NZPC (2018).
129 MBIE (2019c).
130 Shaw (2017).
131 Ministry of Economic Affairs and Employment of Finland (2018).
132 These emission factors use 2016 factors and include a small amount of non-CO2 emissions (MBIE, 2017).
133 Transpower (2018b).
134 Transpower, pers. comm. 11 April 2019.
135 Synlait, pers. comm. 11 April 2019.
136 The Electricity Price Review options paper includes a number of proposals aimed at improving the hedge market.
137 For example in their first report for discussion and their options paper, see MBIE (2019a).
138 Berka et al. (2018).
139 Which can cause voltage and stability issues if there is too much at one time in a particular area.
140 Electricity Authority (2019b).
141 MartinJenkins (2019).
142 MartinJenkins (2019, p. 3).
143 Electricity Authority (2019d).
144 Electricity Authority (2018).
145 Commerce Commission (2019).

The Interim Climate Change Committee is grateful to a number of New Zealand and international experts and advisers who provided valuable knowledge, skills and data to this work.
This includes our E-Charge group, experts from universities, research organisations, industry associations and other bodies who provided expert peer review on inputs into this report.
The Committee would also like to thank all those who came to workshops, met with Committee and Secretariat members (including hosting site visits), and shared their views and insights. This generous participation in our work is very much appreciated.
The Committee would especially like to thank each individual member of the Secretariat for their dedication and sheer hard work in bringing the reports to life – Laurie Boyce, Antonia Burbidge, Sara Clarke, Natalie Crane, Kelly Forster, Jo Hendy, Anne Jonathan, Karen Lavin, Pauline Marshall, Eva Murray, Andy Reisinger, Jarrod Rendle, Catriona Robertson, Tony Schischka and Amelia Sharman.
Acknowledgements

ICCC Secretariat
Courier Address:Interim Climate Change CommitteeLevel 1, Environment House23 Kate Sheppard PlaceWellington, 6011
Postal Address:Interim Climate Change CommitteePO Box 10362Wellington 6143
Email Address:[email protected]
ICCC ChairDavid PrenticeC/o Interim Climate Change CommitteePO Box 10362Wellington 6143
30 APRIL 2019
Ac
celera
ted elec
trifica
tion