read it this way: scaffolding comprehension for
TRANSCRIPT
Read It This Way: Scaffolding Comprehensionfor Unconventional Statistical Graphs
Amy Rae Fox(&) and James Hollan
University of California – San Diego, San Diego, CA, [email protected]
Abstract. How do you make sense of a graph that you have never seen before?In this work, we outline the types of prior knowledge relevant when makingsense of an unconventional statistical graph. After observing students reading adeceptively simple graph for time intervals, we designed four instructionalscaffolds for evaluation. In a laboratory study, we found that only one scaffold(an interactive image) supported accurate interpretation for most students.Subsequent analysis of differences between two sets of materials revealed thattask structure–specifically the extent to which a problem poses a mentalimpasse–may function as a powerful aid for comprehension. We find that priorknowledge of conventional graph types is extraordinarily difficult to overcome.
Keywords: Graph comprehension � Scaffold � Unconventional graph
1 Introduction
Imagine when reading a paper you encounter a graph, teeming with information—surely important by virtue of the precious column inches it spans. But as you scan forpatterns, willing the author’s insight to leap off the page, you find there is somethingunattainable. Like the writing of a foreign language, you see familiar symbols andstructure, yet the rules for assembling these pieces into a meaningful whole are justoutside your grasp. How do you make sense of the graphic?
As Larkin and Simon note, “a representation is useful only if one has the pro-ductions that can use it,” [1, p. 71]. If we lack the ability to draw inferences from arepresentation, then we may find it largely useless. How is it that we develop suchproductions for new graphical forms, when even familiar systems (like scatter plots andline graphs) can prove challenging to interpret [2]? In this work, we build uponresearch on reading and graph comprehension to explore how readers make sense of anunconventional statistical graph. After generating hypotheses for instructional scaf-folding techniques through observation (Study One), we evaluate their efficacy in thelaboratory (Study Two). We find that even with explicit (text or image-based)instructions, the influence of prior knowledge from conventional graph forms is diffi-cult to overcome. Our results suggest that when presenting unconventional graphicalforms, effective techniques will direct readers’ attention to the salient differencesbetween their expectations and reality, and that designers mustn’t take for granted thatreaders will notice they are dealing with an unconventional form.
© Springer International Publishing AG, part of Springer Nature 2018P. Chapman et al. (Eds.): Diagrams 2018, LNAI 10871, pp. 441–457, 2018.https://doi.org/10.1007/978-3-319-91376-6_40

1.1 Cognitive Aids for Graph Comprehension
Owing largely to their importance in STEM education, techniques for supporting graphcomprehension have been a focus of research in the learning, cognitive and computersciences. The most minimal interventions involve graphical cues—visual elements thatguide attention, akin to gesture and pointing in conversation. Acartürk [3, 4] investi-gated the influence of point markers, lines and arrows on bar charts and line graphs,finding that different cues can lead readers to interpret a graph as depicting either anevent or process. Similarly, Kong and Agrawala [5] proposed the term “graphicaloverlays” to refer to elements layered onto content to facilitate specific graph-readingtasks. Reviewing a corpus of statistical graphs in popular media they identified fivecommon types of overlays: (1) reference structures (such as gridlines) (2) highlights,(3) redundant encodings (such as data value labels), (4) summary statistics and (5) an-notations, each aimed at reducing cognitive load for particular graph-reading tasks.
Turning to more elaborate interventions, Mautone and Mayer [6] investigatedtechniques from reading comprehension to support meaningful processing of graphs inthe college classroom. In a series of experiments, they presented learners with scat-terplot and line graphs augmented by signaling (animations to reveal components of agraph, adding cues to highlight the relationship of depicted variables), concrete graphicorganizers (diagrams & photographs of the real-world referents of variables in a graph)and structural graphic organizers (diagrams depicting a relationship analogous to theone represented in a graph). They found that the type of cognitive aids provided tolearners affected subsequent structural interpretation of the graphs (measured by rela-tional or causal statements).
Importantly however, these studies did not differentiate between prior knowledge ofthe domain and knowledge of the graphs [3, 4, 6]. The cognitive aids explored in thisliterature do not instruct users on how to read the graphs – the “rules” for theirrepresentational systems. Rather, it is assumed that the reader has familiarity with thetype of graph being read. Scatterplots, time series and line graphs all rely on theCartesian coordinate system, serving as a common graphical framework [7]. We areinterested in what happens when presented with a graph that doesn’t rely on thisframework. Might we need a different type of scaffolding to learn a novel represen-tational system?
1.2 Prior Knowledge and Graphical Sensemaking
Modern theories of graph comprehension posit a combination of bottom-up andtop-down processing [8]. While the design of a graph is clearly important, so too is thenature of prior knowledge we bring to the task. When making sense of a graph, wedraw on at least two sources of prior knowledge: our knowledge of the domain, and ofthe graphical form [2]. Scarcity from either source will impede comprehension indifferent ways.
Limited Prior Knowledge. If presented with an unfamiliar graph, depicting infor-mation in an unfamiliar domain, I will be unable use knowledge of one to bootstrapinferences for the other. Consider a novice physics student reading a Feynman diagram:without the requisite understanding of particle physics, they cannot reverse-engineer
442 A. R. Fox and J. Hollan

the formalisms of the diagram. Without these formalisms, they cannot draw inferencesabout particle physics.
Limited Domain Knowledge. Alternatively, if presented with a familiar graphdepicting data in an unfamiliar domain, I might draw on my knowledge of the graphsystem to learn something new about the content. If I know a straight line represents alinear relationship, I can infer that such a relationship exists between the (unfamiliar)variables in a line graph connected by a straight line [8]. It is this situation we aim tooptimize in STEM education. Mautone and Mayer [6] demonstrated that animations,arrows, diagrams and photographs can all help students connect their prior knowledgeof graphs to depicted variables, improving their ability to draw inferences about therelated scientific processes. Of course, our expectations about how a graph works, ifinappropriate, can also lead to systematic errors in interpretation [2].
Limited Graphical Knowledge. We are interested in the reciprocal case: an unfa-miliar representation depicting information in a familiar domain. Importantly, bygraphical knowledge we are not referring to knowledge of graphs in general–graphicalcompetency–but rather knowledge of the rules governing a particular graph form. Wereason that existing techniques for scaffolding are insufficient for this case, as theinformation added to the graphs serve only to strengthen the relationship between thegraph-signs and (real-world) referents. This fails to address the learner’s scarcity ofknowledge for the representational system. If we cannot perform first order readings–such as extracting a data value–we cannot hope to perform second order readings–likeinferring relationships between variables.
With sufficient domain knowledge, we expect that learners may be able toreverse-engineer the formalisms governing an unconventional graph. We wish toscaffold this process to support self-directed graph reading. As a first step, we select anobscure graphical form using an unconventional coordinate system so that we mightshed light on the graphical framework: the foundation of the graph schema [7].
1.3 The Triangular Model of Interval Relations
Several representational systems for reasoning about time intervals have been exploredin the literature [9], due largely to their importance in data analysis across the sciencesand humanities. We have selected two informationally equivalent [1] types of timeinterval graphs, each representing the start and end time, duration, and relationsbetween intervals.
In Fig. 1-left—the Linear Model of Temporal Relations (hereafter LM)—inter-vals are depicted as line segments along a one-dimensional timeline running fromleft-to-right. The left and right boundary points of a line segment indicate the start andend time, respectively, while the length of the segment indicates its duration. In theLM, the y-axis is solely exploited to differentiate between intervals, for example, by useof a label. In this way, the second dimension contains no metric information. As aresult, intervals can be sorted along the y-axis in numerous ways (e.g. by start time,duration, alphabetically by label, etc.). As noted by Qiang et al. [10] this polymorphismprohibits the existence of a standard approach to visual pattern recognition with theLM, making it ill-suited for applications in exploratory data analysis and inspection ofextremely large data sets.
Scaffolding Comprehension for Unconventional Graphs 443

Based on work by Kulpa [9] extended by Qiang et al. [10, 11] the TriangularModel of Temporal Relations (hereafter TM) overcomes this shortcoming by rep-resenting intervals as points in 2D metric space (Fig. 1-right). Each point represents aninterval. In the vertical dimension, the height of the point indicates its duration. Theintersection of the point’s triangular projections (using diagonally oriented grid lines)onto the x-axis indicate the start and end time. In this way, every interval is representedas a unique point in the 2D graph space, and each of its elementary properties areexplicitly encoded by the location of the point.
A brief inspection of the TM by even the most experienced graph readersdemonstrates its relative obscurity. However, while the non-Cartesian coordinate sys-tem is unconventional, the graph depicts information about a domain in which we allshare substantial prior knowledge: events in time.
1.4 The Present Studies
We are interested in what happens when experienced graph readers (undergraduateSTEM majors) attempt to interpret the TM graph. Further, we wish to develop andevaluate a series of instructional scaffolds to support comprehension of the graph byself-directed readers. We start by observing students using the TM graph to solvesimple questions about the properties and relations between events, and then elicitsuggestions for how to make the graph easier to read (Study One). In Study Two, weevaluate four scaffolds inspired by these observations.
2 Study 1: Observing Learning of an Unconventional Graph
What strategies do we employ to make sense of an unconventional graph? In thisexploratory study, we observed students solving problems with the Triangular Model(TM) graph (Part A). After a short interview, we challenged students to designinstructional aids making the graph easier to read (Part B). From these data we generatehypotheses for how we might scaffold comprehension for novel statistical graphs.
A Linear Model (LM) Graph A Triangular Model (TM) Graph
Fig. 1. Informationally-equivalent graphs for intervals of time
444 A. R. Fox and J. Hollan

2.1 Methods
Participants. Twenty-three (70% female) English speakers from the experimental-subject pool at a large American university (M(age) = 20, SD(age) = 1) participated inexchange for course-credit. All students were majors in STEM subjects. Participantswere recruited in dyad pairs (9 pairs, n = 18) to encourage a naturalistic think-aloudprotocol. In cases where one recruit was absent we conducted the session with theindividual (n = 5), altering the procedure only by encouraging them to think-aloud asthough explaining their reasoning to a partner. In total, we conducted 14 observationsessions (9 dyads, 5 individuals).
Materials and Procedure. The entire procedure ranged from 45–60 min. In Part A:The Graph Reading Task, sixteen multiple choice questions were used to probe thereader’s ability to use the graph to reason about the properties of and relations betweenintervals. For example, a question testing the “duration” property might read: For howmany hours does event [x] last? Participants were given one sheet of paper containingthe questions and a second sheet containing a large TM graph with 15 data points1.After delivering instructions, we started the video recording and left the room.
Upon task completion, we conducted a short interview, prompting participants toexplain how they would plot a new data point on the graph. If participants misinter-preted the graph, we began a didactic interview, prompting students to ask questionsthey thought might help them discover the rules of the graph system. We responded byonly revealing the information explicitly requested, minimizing the effect our teachingmight have on the designs produced in the next task. Once students could plot a newdata point, we proceeded to Part B: The Scaffold Design Task. We asked participants tothink about what they could do to make the graph easier to read for the next participantand invited them to make marks on the graph.
2.2 Study One: Results
Part A. Graph Reading Task. Participants in only 3 of the 14 sessions correctlyinterpreted the TM graph (M(score) = 12/16 points, (SD = 1.7), (M(time) = 19 min,SD = 30 s). These participants correctly described the graph’s rules in the post-taskinterview. In the remaining 11 sessions, participants correctly answered only 2.2questions on average (SD = 2.1), and were unable to correctly plot a point in theinterview. Yet in these sessions, participants did persist in answering all questions,spending about the same amount of time on the task (M(time) = 21 min, SD = 2 min).Reviewing the artifacts participants generated gives us a window into their interpre-tations. Looking first at the lowest scoring sessions, we noticed many cases whereparticipants appeared to superimpose the conventional representation for time inter-vals–the linear model (see Fig. 1-left) – atop the triangular graph (Fig. 2-left). Wedubbed this the “linear interpretation” of the TM, which relies on participants assuming
1 Note. All materials, data and computational notebooks for data analysis are available at https://madebyafox.github.io/Scaffolding_Graph_Comprehension
Scaffolding Comprehension for Unconventional Graphs 445

the data points are situated in a Cartesian coordinate system with a single x and y in-tercept. They must also infer that a point represents a moment in time, rather than aninterval, and that the interval is represented by a line segment which they must mentallyproject (or physically draw) atop the graph. They must also decide which momentalong an interval the point represents. In this sense, the “linear interpretation” relies ontwo kinds of prior knowledge: first of Cartesian coordinates in which a point has asingle x-intercept, and secondly of conventions for representing intervals as linearextents, rather than points. This interpretation also requires students to ignore—orassign no meaningful referent to—the graph’s diagonal gridlines. Once constructed,participants could extract information from the “linear interpretation” following thesame procedure one would follow for the conventional linear (LM) graph.
Alternatively, In Fig. 2-right we see the artifact from the highest scoring session.Participants have reinforced the triangular intersections for several points with the x-axis. Noticeably, we do not see reinforcement of the intersections with the y-axis,presumably because this is a convention of the coordinate system participants did notneed assistance to interpret.
Testing the Linear Interpretation Hypothesis. From our review of participants’graph markings, as well as the procedure they (initially) described for plotting a newdata point, we hypothesized that the 11 low-scoring sessions had formed a “linearinterpretation” of the graph. To test this hypothesis, we constructed an alternativeanswer key. First, we constructed a “linear interpretation” graph by drawing a verticalintersect for each data point to the x-axis and construing this as the start time. We thendrew horizontal line segments from each point, with a length determined by the du-ration given on the y-axis. Using this “linear interpretation” graph, we determined thecorrect answer for every problem and re-scored each session. Under this alternativeanswer key, the mean score for the 11 lowest-scoring sessions improved from 2.2 to 8.3(SD = 2.7 points), while the mean score for the 3 highest-scoring sessions decreased12.3 to 3.0 (SD = 2.0 points), supporting the hypothesis that low-scoring participantsinterpreted the graph in accordance with the conventional linear model.
The lowest-scoring session shows an (incorrect) Cartesian interpretation.
The highest-scoring session shows a (correct) triangular interpretation.
Fig. 2. Graph artifacts from lowest (left) and highest (right) scoring sessions.
446 A. R. Fox and J. Hollan

Part B. Scaffold Design Task. We evaluated the artifacts produced in response to ourprompt to make the graph easier to read, and found evidence of three instructionalapproaches: adding pictorial intersections (Fig. 3a), providing annotations/examples(Fig. 3b, c) and text instructions (Fig. 3d).
In Fig. 3a (at right) participants have drawnattention to the diagonal gridlines and their dual-intersections with the x-axis by darkening and col-oring them. These participants explained the mostchallenging part of the graph was realizing they hadto look for two intersections with the x-axis.
In Fig. 3b (at left) participants have annotated theirhighlighted intersections. We see a partial workedexample, via the annotation “7 h” to the span for thered interval.
In Fig. 3c (at right) we see a worked examplewhere participants both highlighted the intersectionand gave explicit values for a sample point on theplot. Under the graph they added a production rulefor finding the start-time of a hypothetical point “S”,indicating that some learners may prefer text instruc-tions. (triangular grid faded in digital scanning)
Finally in Fig. 3d (at right) we see explanatorytext with an explicit definition of several graphelements.
Fig. 3a. Pictorial intersections(Color figure online)
Fig. 3b. Annotations & exam-ples (Color figure online)
Fig. 3c. Worked example (Colorfigure online)
Fig. 3d. Text instruction
Scaffolding Comprehension for Unconventional Graphs 447

2.3 Discussion of Study One
The results of Study One suggest the Triangular Model (TM) graph is challenging forSTEM undergraduates. While the graph is elegant in its simplicity—as one participantnoted, “once you see [the triangles], you can’t (sic) unsee them”—most re-imagined themarks on the page as components of the more conventional representation for intervals.In interpreting this graph students invoked prior knowledge of conventions for thedomain (intervals as line segments) and graphs in general (Cartesian coordinates).When prompted for instructional aids, students believed they could easily improveperformance of future participants by adding instructions highlighting the multipleintersections of a point with the x-axis. Importantly, these scaffolds are substantivelydifferent than those explored in previous literature [2–6]. These instructions are mostsimilar to graphical cues [3, 4], but rather than reinforcing the main argument of thegraph (e.g. local maxima/minima, salient trend, etc.) they draw attention to the structureof the coordinate system. Both text and image instructions focus on the graphicalframework and how to perform a first-order reading, rather than reinforcing the con-nection between the graph’s signifiers and referents.
Owing to the limited sample size and observational methods, we fall short ofexplaining why some students (3 sessions) were able to interpret the graph while mostwere not. In one case, an individual interpreted the graph in the very first question, butfailed to think-aloud, leaving their strategy a mystery. In the second case, the dyad pairalso developed a correct model in the first question. In the third case, the dyad read thegraph incorrectly for about half the questions before realizing their mistake andre-solving the problem set. These outcomes could be driven by individual differences ingraphical competency, or different problem-solving strategies. Addressing this questionwill require further observation with directed post-task interviews.
3 Study Two: Testing Scaffolds for an Unconventional Graph
Inspired by the instructional aids produced by participants in Study One, we designedfour scaffolds for self-directed learning: two text instructions (adjacent to the graphs)and two illustrations (highlighting x/y intersections). The “what-text” design (Fig. 4a)specifies the components of the graph and describes their meaning. The “how-text”design (4b) provides a set of production rules for extracting data from the graph. In the“static-image” (Fig. 4c), intersections are displayed for a single data point persistentthroughout the task. In the “interactive-image” (Fig. 4d), the appropriate intersectionsappear & disappear when a participant hovers their mouse over any data point.
Prior work [11] has demonstrated that the computational efficiency of the TM graphcan be achieved by students after 20 min of interactive video instruction. In Study Twowe test the effectiveness of our designs by seeking to replicate these results withscaffolding alone. Assigning each participant to a scaffold condition, we compare theirperformance on both the LM and TM graphs, and subsequent ability to draw a TMgraph for a small data set. We hypothesize that: (1) scaffolding will not affect per-formance on the LM graph, because it is conventional and relatively easy to read;(2) learners without scaffolding (control) will perform better with the LM than TM;
448 A. R. Fox and J. Hollan

(3) learners with (any form of) scaffolding will perform better with the TM than LM(replication of [11]). Finally, based on observations in Study One we expect thatgraph-order will act as a scaffold. (4) Learners who solve problems with the LM graphfirst will perform better on the TM (relative to TM-first learners) as their attention willbe drawn to the salient differences between the graph types.
3.1 Methods
Design. We employed a 5 (scaffold: none-control, what-text, how-text, static image,interactive image) � 2 (graph: LM, TM) mixed design, with scaffold as abetween-subjects variable and graph as a within-subject variable. To test our hypothesisthat exposure to the conventional LM acts as a scaffold for the TM, we counterbalancedthe order of graph-reading tasks (order: LM-first, TM-first). For each task, we measuredresponse accuracy and time. For the follow-up graph-drawing task, we coded the typeof graph produced by each participant.
Fig. 4c. “static-image” displays x/y intersec-tions for one data point
Fig. 4d. “interactive-image” displays x/y inter-sections on mouseover
A point is an interval of timeThe left intersection with the x-axis along the diagonal gridline is the start timeThe right intersection with the x-axis along the diagonal gridline is the end timeThe intersection with the y-axis is the duration.
Fig. 4a. “what-text” specifies graph com-ponents and their meaning
Start-time: follow the left-most diagonal gridline to the intersection with the x-axisEnd-time: follow the right-most diagonal gridline to the intersection with the x-axis Duration: follow the horizontal gridline to the intersection with the y-axisLabel: the letter directly above the point
Fig. 4b. “how-text” specifies how to extractdata from the graph
Scaffolding Comprehension for Unconventional Graphs 449

Participants. 316 (69% female) STEM undergraduates aged 17 to 33 were recruitedfrom the experimental-subject pool at a large American university (M(age) = 21, SD(age) = 2), yielding approximately 30 participants per cell in the 5 x 2 design.Materials
Scaffolds. For the first five questions of each graph-reading task, participants saw theirassigned scaffold along with the designated graph. On the following ten questions, thescaffold was not present. Examples of each scaffold-condition for the TM graph areshown in Fig. 4. Equivalent scaffolds were displayed for the LM graph (seefootnote 1).
The Graph Reading Task. Each graph reading task consisted of a graph (LM or TM)and 15 multiple choice questions (used in Study One). Questions were presented one ata time, and participants did not receive feedback as to the accuracy of their responsebefore proceeding. The order of the first five (scaffolded) questions was the same foreach participant, while the order of the remaining 10 were randomized. For eachquestion, the participant’s response accuracy (correct, incorrect) and latency (time frompage-load to “submit” button press) was recorded. Because each participant completedthe reading task once with each graph, we developed two matched scenarios: a projectmanager scheduling tasks (scenario A), and an events manager scheduling reservations(scenario B). In each scenario, an equivalent question can be identified in the otherpertaining to the same interval property/relation. For example, in scenario A thequestion mapping to the “starts” property reads: “Which tasks are scheduled to start at1 pm?”, and the correct answer consists of 2 tasks (Fig. 5 – left – tasks O & H). Inscenario B, the equivalent question reads: “Which reservations start at 8:00 AM?”, thecorrect answer referencing 3 events (Fig. 5 – right – events D, C & L). For the LMgraphs, intervals were sorted in order of duration, with the longest appearing at the topof the graph. A pilot study on Amazon Mechanical Turk using the LM graph revealedno significant differences in response accuracy or latency between the scenarios. Thefour graphs constructed for the study are shown in Fig. 6.
The Graph Drawing Task. Participants were given a sheet of isometric dot paper witha table of 10 time intervals, and directed to draw a triangular graph of the data (“like thetriangle graph you saw in the previous task”), using the pencil, eraser and ruler pro-vided. Isometric dot paper equally supports the construction of lines at 0, 45 and 90degrees, minimizing any biases introduced by the paper on the features of the graphdrawn by participants.
Procedure. Participants completed the study individually in a computer lab. Theycompleted the two graph-reading tasks in sequence, one with a TM graph and the otherwith an LM graph (order counterbalanced). Afterward, participants completed thegraph drawing task. The entire procedure ranged from 22 to 66 min.
3.2 Results: The Graph Reading Task
Performance on graph-reading tasks is a combination of response accuracy (score) andtime. Table 1 displays the mean values for score (as % correct) and time (in minutes)for each graph across the scaffold conditions. As we found little variance in response
450 A. R. Fox and J. Hollan

time we focus our discussion on performance as judged by response accuracy. Toexplore the potential influence of graph, scaffold, and graph-order on scores, we per-formed a mixed effects ANOVA on score with graph as the within-subjects factor, andscaffold, graph-order and scenario as between-subjects factors (Fig. 6).
Effect of Graph. We found a significant main effect of graph type on score, F(1,297) = 97.67, p < .001. In Fig. 6 we see that across all factors, LM scores [green
Task Scheduling (Scenario A) Event Scheduling (Scenario B)L
M G
raph
sT
M G
raph
s
Fig. 5. LM and TM graphs for each scenario of graph reading task
Table 1. Mean score and response time for graph reading tasks
Mean score (% correct) Mean time (mins)
LM graph TM graph LM graph TM graph
Scaffold M SD M SD M SD M SD
none-control 73 16 46 30 8.6 2.1 11.2 3.6what-text 74 15 59 29 9.8 2.9 11.6 3.6how-text 73 14 58 31 9.1 2.3 10.9 3.0static-image 73 15 57 30 9.1 2.6 10.6 3.5interactive-img 73 13 71 23 9.4 2.6 9.9 2.6Total 73 14 59 30 9.2 2.5 10.9 3.3
Scaffolding Comprehension for Unconventional Graphs 451

squares] (M = 10.96, SD = 2.13) are significantly higher than TM scores [red trian-gles] (M = 8.78 SD = 4.44), t(316) = −9.45, p < 0.001, r = 0.47, consistent with ourmotivating assumption that the TM graph is more challenging to interpret.
Effect of Scaffold. We found asignificant main effect of scaf-fold on score, F(4,297) = 4.24,p < .05. A post-hoc t-test sup-ports our second hypothesis,that across all other factors,participants in the no-scaffoldcontrol group performed sig-nificantly better with the LMgraph (M = 10.98, SD = 2.33)than the TM graph (M = 6.9,SD = 4.51), t(60) = 7.07, p <0.001, r = 0.67. Regarding ourthird hypothesis, we found asignificant interaction betweengraph and scaffold, F(4,297)= 10.03, p < .001. As pre-dicted, scaffolds did not influence the score when solving problems with the LM (hy-pothesis 1), but made significant improvements in score for the TM. However, none ofour scaffolds resulted in significantly higher scores for the TM relative to the LM. Infact, post-hoc pairwise comparisons (with Bonferroni correction) on TM scores showed
Fig. 6. Mean response score by graph, Scaffold and task order LM scores (squares) remainsteady across scaffold (x-axis) and graph-order (right/left plot), while TM scores (triangles) differby scaffold, highest in the interactive image condition. (Color figure online)
Fig. 7. Only the interactive image scaffold was signifi-cantly better than no-scaffold control condition.
452 A. R. Fox and J. Hollan
that only the interactive image scaffold yielded scores significantly higher than theno-scaffold control (Fig. 7).
Effect of Graph-Order. Counter to hypothesis 4 that graph-order would act as ascaffold for comprehension, we found no main or interaction effects for graph-order onresponse accuracy. Perhaps in order to glean salient differences between the TM andLM graphs, they need to presented simultaneously (as in Fig. 1).
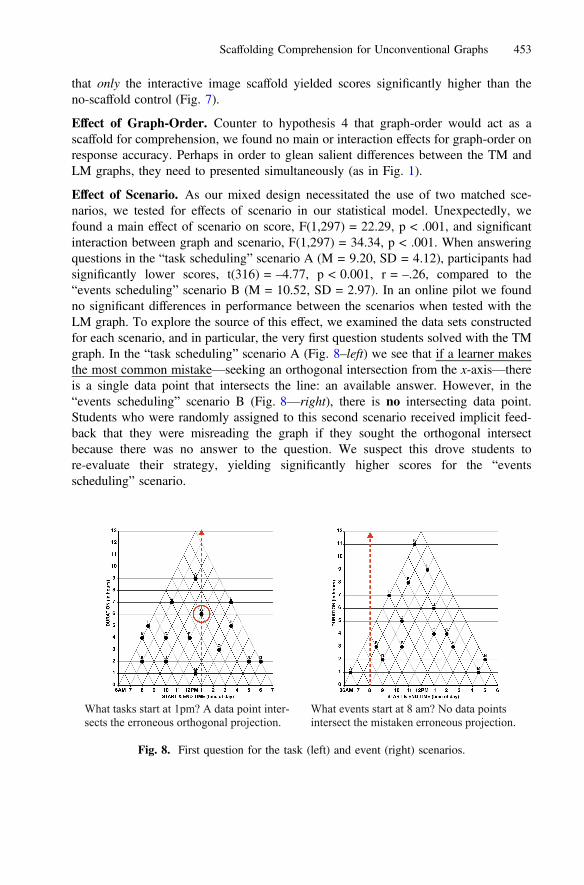
Effect of Scenario. As our mixed design necessitated the use of two matched sce-narios, we tested for effects of scenario in our statistical model. Unexpectedly, wefound a main effect of scenario on score, F(1,297) = 22.29, p < .001, and significantinteraction between graph and scenario, F(1,297) = 34.34, p < .001. When answeringquestions in the “task scheduling” scenario A (M = 9.20, SD = 4.12), participants hadsignificantly lower scores, t(316) = –4.77, p < 0.001, r = –.26, compared to the“events scheduling” scenario B (M = 10.52, SD = 2.97). In an online pilot we foundno significant differences in performance between the scenarios when tested with theLM graph. To explore the source of this effect, we examined the data sets constructedfor each scenario, and in particular, the very first question students solved with the TMgraph. In the “task scheduling” scenario A (Fig. 8–left) we see that if a learner makesthe most common mistake—seeking an orthogonal intersection from the x-axis—thereis a single data point that intersects the line: an available answer. However, in the“events scheduling” scenario B (Fig. 8—right), there is no intersecting data point.Students who were randomly assigned to this second scenario received implicit feed-back that they were misreading the graph if they sought the orthogonal intersectbecause there was no answer to the question. We suspect this drove students tore-evaluate their strategy, yielding significantly higher scores for the “eventsscheduling” scenario.
What tasks start at 1pm? A data point inter-sects the erroneous orthogonal projection.
What events start at 8 am? No data pointsintersect the mistaken erroneous projection.
Fig. 8. First question for the task (left) and event (right) scenarios.
Scaffolding Comprehension for Unconventional Graphs 453

3.3 Results: The Graph Drawing Task
The graph drawing tasks allows us how to explore how each scaffold supports studentslearning the graphical framework of the TM. We expect that accurately drawingrequires deeper understanding of how the graph works, and analysis of any systematicmistakes students make in drawing may reveal sources of difficulty in comprehension.Following the directed approach to qualitative content analysis [12], a team of 3 ratersclassified all 316 drawings first into a priori categories [triangular, linear, other] andfinally into 5 categories based on the data present in the sample: (correct) triangular,linear, scatterplot, “asymmetric triangular” and “right-angled”. Interrater reliability washigh (a = 0.96) and disagreements were resolved through negotiation. The majority(73%) of participants drew correct TM graphs. 17 individuals (5%) constructed LMgraphs, while 3 participants drew scatterplots with start & end time on the x/y axesrespectively. Most interesting were the two alternative triangular forms constructed by66 (21%) individuals: right-angle triangle, and asymmetric triangles (described inFig. 9).
While the overall distribution of graph drawing-types was too heterogeneous toreliable correlate with TM task performance, we did examine the performance of thesubset of participants who produced the two alternative triangular forms. TM scores forparticipants who drew “right-angle” graphs were significantly lower (M = 2.3, SD =1.98) than for participants who drew “asymmetric triangle” graphs (M = 8.55, SD =3.73), t(27.11) = –7.36, p < 0.001, r = 0.82.
Fig. 9a. 230 students drew correct TMgraphs
Fig. 9b. 17 students drew LM graphs
Fig. 9c. 44 students drew “right-angle” graphs.They plot duration on the Y axis and the interval asa point, but mistakenly use an orthogonalx-intersect for start time
Fig. 9d. 22 students plotted the vertical inter-section as the midpoint of the interval, but thetriangles were not geometrically similar becauseduration was not on the y-axis.
454 A. R. Fox and J. Hollan

3.4 Discussion of Study Two
The results of Study Two leave us with a conundrum: why were the scaffolds designedby learners in Study One largely ineffective?
None of our designs replicated the results of Qiang et al. [11] which yielded betterperformance with the TM than LM graph, though there were notable differences in ourtasks, including their use of an interactive graph interface with hundreds of data points,and feedback in the video instruction. Setting aside the differences in performancebetween the LM and TM graphs, we assessed the efficacy of scaffold designs bylooking at TM scores alone. The widely-held assertion of Study One participants thatsimple text and image instructions would dramatically improve readability of the graphwere not borne out, as on average, participants who received the static scaffolds per-formed no better than those who received (as participants in Study One) no graphinstructions at all (Fig. 7).
We suspect the source of this discrepancy lies in a hindsight bias. Once studentsunderstand how the graph works, they cannot “unsee” it, and therefore underestimatethe strength of their prior expectations. The unexpected effect of scenario on TM scoressupports this interpretation, as students who received implicit feedback they werereading the graph incorrectly (because there was no available answer) performed betterthan those who did not (Fig. 8 right vs. left). In this way, the structure of the taskpresented the reader with a mental impasse [13] where their expectations (based onprior knowledge of Cartesian graph forms) left them with no solution, and theirattention was actively redirected to reconsidering these expectations. The role ofattention can also address why the interactive image was superior to the static text andimage scaffolds. If it is the case that a reader does not realize they are misreading thegraph (as we observed in Study One), it is easy to ignore the static scaffolds. However,it is much more difficult to ignore a stimulus that appears every time the mouse ismoved over a data point. To critically evaluate the role of attention in our ongoingstudies we are employing both mouse and gaze-tracking to quantify the extent andtime-course of attention paid to both scaffolds and graph features.
As in Study One, the most substantial open question in this work remains thesource of individual differences. Across all conditions, we see a high standard deviation(30% or 5 points) in score, again with some participants in the no-scaffold control ableto correctly interpret the graph. In our ongoing work we seek to address this questionwith post-task interviews that prompt participants to explain their interpretation strat-egy while viewing a screencast replay of the their problem-solving session.
4 General Discussion
While the Triangular Model (TM) graph is elegant in its simplicity, the results of ourstudies demonstrate this simplicity is deceptive. Without assistance, most readersmisinterpret the graph as the conventional representation for time intervals: the linearmodel. Even with cognitive aids, many students persisted in this erroneous interpre-tation, and only an interactive image scaffold significantly improved comprehension.
Scaffolding Comprehension for Unconventional Graphs 455

These results have implications for both the design of scaffolds and of uncon-ventional graphs. First, when designing scaffolds one should consider the reader’sexpectations based on the conventional representation for variables in the domain. It isfrom that prior knowledge that readers begin their interpretation, not from a blank-slate(i.e. general graph schema) we might expect based on a graph’s surface features. Toovercome this, our results suggest that techniques actively directing attention to salientdifferences may prove most effective. The interactive-image scaffold achieves thisthrough repeated, user-driven exposure to the multiple intersections of a TM data pointwith the x-axis. Similarly, the mental impasse provided by the questions in ourevent-scheduling scenario actively directed readers’ attention to their mistaken inter-pretation. We are presently conducting a follow-up study testing the relative efficacy ofattention-directing explicit (e.g. interactive image) and implicit (e.g. mental impasse)scaffolds.
When constructing unconventional graphs, a designer’s priority is the computa-tional affordances making the new graph-form suitable to the data and task. But as welearn from these studies, a designer should also ask, “What expectations will beinvoked by the marks on the page?” For the TM graph, we suspect it is the orthogonalaxes that drive readers to expect a single orthogonal intersection for each data point.But there is—strictly speaking—no reason that the axes need to be orthogonal. In fact,one clever participant in our graph drawing task produced what we believe to be asubstantial improvement upon the TM graph, where the y axis was positioned diago-nally on the left side of the graph’s “bounding triangle”. We are presently conducting afollow-up study to investigate alternative axis and grid designs, hypothesizing that suchdiagonally positioned axes will yield significantly better performance.
In this work, we have explored only a small subsection of the total design space ofscaffolding techniques for a particular kind of unconventional graph. We expect ourconclusions generalize to unconventional coordinate systems, but that other techniquesneed to be explored when employing unconventional markings. Our choice of scaffoldswas inspired by direct observation and participatory design, however, we suspect awider range of techniques might be effective in more instructional settings, includingexplication of worked examples, or seeing the graph being drawn. While we chose toseparate our text and image scaffolds to test their differential efficacy, a combinedtext/image annotation could prove effective even in static media, and is a part of ourongoing work.
We started by reasoning that existing scaffolding techniques would be insufficientfor unconventional graphs because learners would lack the prior knowledge of the newgraph system required to make use of them. As Pinker [7] suggests, when confrontedwith an unfamiliar graph form, the reader instantiates a generic “general graphschema”. However, it seems that despite differences in surface structure, a learner’sprior knowledge of other graph forms can actively interfere with interpretation of a newgraph. The novelty of the diagonal gridlines in the TM graph was not enough for mostlearners to suspend their Cartesian expectations. To overcome this prior knowledge, wethink that successful scaffolds for unconventional graphs must not only show or tell ushow to read them, but to rather alert us that that we need to pay attention, andreconsider our expectations in the first place.
456 A. R. Fox and J. Hollan

Acknowledgements. Sincerest thanks are offered to research assistants Evan Barosay, Kai-YuChang and Hazel Leung, as well as Drs. Seana Coulson, David Kirsh, Rafael Núñez and CarenWalker.
References
1. Larkin, J., Simon, H.: Why a diagram is (sometimes) worth ten thousand words. Cognit. Sci.99, 65–99 (1987)
2. Shah, P., Hoeffner, J.: Review of graph comprehension research: implications for instruction.Educ. Psychol. Rev. 14(1), 47–69 (2002)
3. Acartürk, C.: Points, lines and arrows in statistical graphs. In: Cox, P., Plimmer, B., Rodgers,P. (eds.) Diagrams 2012. LNCS (LNAI), vol. 7352, pp. 95–101. Springer, Heidelberg(2012). https://doi.org/10.1007/978-3-642-31223-6_13
4. Acartürk, C.: Towards a systematic understanding of graphical cues in communicationthrough statistical graphs. J. Vis. Lang. Comput. 25(2), 76–88 (2014)
5. Kong, N., Agrawala, M.: Graphical overlays: using layered elements to aid chart reading.IEEE Trans. Vis. Comput. Graph. 18(12), 2631–2638 (2012)
6. Mautone, P.D., Mayer, R.E.: Cognitive aids for guiding graph comprehension. J. Educ.Psychol. 99(3), 640–652 (2007)
7. Pinker, S.: Theory of graph comprehension. In: Freedle, R. (ed.) Artificial Intelligence andthe Future of Testing, pp. 73–126. Erlbaum, Hillsdale (1990)
8. Shah, P., Freedman, E.G., Vekiri, I.: The comprehension of quantitative information ingraphical displays. In: Shah, P., Miyake, A. (eds.) Cambridge Handbook of VisuospatialThinking (2005)
9. Kulpa, Z.: A diagrammatic approach to investigate interval relations. J. Vis. Lang. Comput.17(5), 466–502 (2006)
10. Qiang, Y., Delafontaine, M., Versichele, M., De Maeyer, P., Van de Weghe, N.: Interactiveanalysis of time intervals in a two-dimensional space. Inf. Vis. 11(4), 255–272 (2012)
11. Qiang, Y., Valcke, M., De Maeyer, P., Van de Weghe, N.: Representing time intervals in atwo-dimensional space: an empirical study. J. Vis. Lang. Comput. 25(4), 466–480 (2014)
12. Hsieh, H.-F., Shannon, S.E.: Three approaches to qualitative content analysis. Qual. HealthRes. 15(9), 1277–1288 (2005)
13. Ohlsson, S.: Information-processing explanations of insight and related phenomena. In:Advances in the Psychology of Thinking, pp. 1–44 (1992)
Scaffolding Comprehension for Unconventional Graphs 457