read a pdf sample of 4 keys to profitable forex - harriman house
TRANSCRIPT


• • • • Sample • • • •

The 4 Keys to Profitable Forex Trend Trading
Unlocking the Profit Potential of Trending Currency Pairs
By Christopher Weaver
Hh

HARRIMAN HOUSE LTD3A Penns RoadPetersfieldHampshireGU32 2EWGREAT BRITAIN
Tel: +44 (0)1730 233870Fax: +44 (0)1730 233880Email: [email protected]: www.harriman-house.com
First published in Great Britain in 2012
Copyright © Harriman House
The right of Christopher Weaver to be identified as the Author has been asserted in accordance with theCopyright, Designs and Patents Act 1988.
ISBN: 978-0-857190895
British Library Cataloguing in Publication DataA CIP catalogue record for this book can be obtained from the British Library.
All rights reserved; no part of this publication may be reproduced, stored in a retrieval system, ortransmitted in any form or by any means, electronic, mechanical, photocopying, recording, or otherwisewithout the prior written permission of the Publisher. This book may not be lent, resold, hired out orotherwise disposed of by way of trade in any form of binding or cover other than that in which it ispublished, without the prior written consent of the Publisher.
No responsibility for loss occasioned to any person or corporate body acting or refraining to act as a resultof reading material in this book can be accepted by the Publisher, by the Author, or by the employer(s) ofthe Author.
Figure data and information copyright © respective owners and sources.
Set in Minion, Bebas Neue and FrutigerMW Cond.
Printed and bound in the UK by CPI Antony Rowe.
Hh Harriman House
Contents
Preface vIntroduction vii
Key 1 – Trend Lines 1
The Theory 2Primary strength: tells you whether to buy or to sell 2Some practicalities 2Basic trend line characteristics 3Trend line types 4Trend line projection 17
Entry and Exit Strategies 241. Trend line bounce strategy 242. Trend line break strategy 34Key 1 Summary 39
Key 2 – Channels 41
The Theory 42Primary strength: creates a trending range 42Channel characteristics 42Channel types 46Channel zone projection 60
Entry and Exit Strategies 641. Channel bounce strategy 642. Channel break strategy 73Key 2 Summary 80
Key 3 – Fibonacci Retracement Levels 81
The Theory 82Primary strength: reveals hidden support/resistance levels 82Fibonacci retracement level characteristics 82Fibonacci types 85Overlapping Fibonacci levels 89
Entry and Exit Strategies 1021. Fibonacci bounce strategy 1022. Fibonacci break strategy 110Key 3 Summary 122
iii
Key 4 – Symmetrical Triangles 123
The Theory 124Primary strength: clear message – indecision 124Symmetrical triangle characteristics 124Symmetrical triangle types 127Symmetrical triangle zone projection 134
Entry and Exit Strategies 1381. Symmetrical triangle bounce strategy 1392. Symmetrical triangle break strategy 148Key 4 Summary 154
Using the Keys Effectively 155
Which currency pairs should we trade? 155The trend strength of the cross rates 163The locked chart 165Multiple key confirmations 166Examples of multiple key confirmations 167
Conclusion 175Index 177
iv
The 4 Keys to Profitable Forex Trend Trading
Preface
What this book coversThis book covers four different approaches to trend trade the foreign exchange market.These four keys are:
1. Trend lines2. Channels3. Fibonacci retracements4. Symmetrical triangles
We will explore the primary strength of each key, why it is useful, and the differentvariations of each key. We will then go through two practical strategies for each key andhow to use them to execute successful trades.
It is worth noting that all of the strategies in this book can be described as continuationstrategies. A continuation strategy is one that is traded in the direction of the trend onthe assumption that the trend will continue.
As these keys are general concepts in technical analysis they are not limited to specificcurrency pairs. For example, one can trade using a trend line for a minor cross currencypair such as the GBP/AUD, with the same confidence as when trading a major currencypair such as the EUR/USD.
These keys and their corresponding strategies are designed to be traded in the foreignexchange spot market. But they are equally applicable to trading CFDs or spread betting.
Who this book is forAs this book does not cover such basics as general trading terminology, the process ofplacing a trade or navigating through a trading software package, it is assumed the readeris comfortable with trading in general and is therefore looking to enhance their overalltrading experience by generating more profit. The application of the techniques in thisbook should be possible with any standard charting package.
Notes on chartsAll the charts in this book were produced using © eSignal.
v

Introduction
The currency pairs which make up the foreign exchange market provide us with some ofthe most reliable trading trends. This is due to the high daily liquidity, or volume, of themarket. The foreign exchange (forex) market as a whole trades around US$4 trillion everyday - far more than all of the major stock markets in the world combined. All of thistrading creates strong trends!
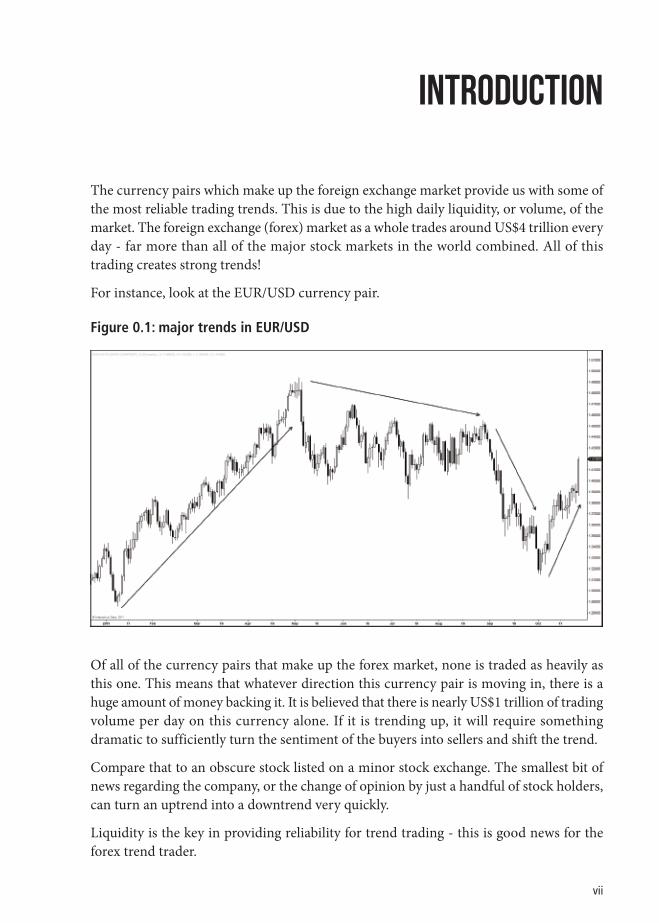
For instance, look at the EUR/USD currency pair.
Figure 0.1: major trends in EUR/USD
Of all of the currency pairs that make up the forex market, none is traded as heavily asthis one. This means that whatever direction this currency pair is moving in, there is ahuge amount of money backing it. It is believed that there is nearly US$1 trillion of tradingvolume per day on this currency alone. If it is trending up, it will require somethingdramatic to sufficiently turn the sentiment of the buyers into sellers and shift the trend.
Compare that to an obscure stock listed on a minor stock exchange. The smallest bit ofnews regarding the company, or the change of opinion by just a handful of stock holders,can turn an uptrend into a downtrend very quickly.
Liquidity is the key in providing reliability for trend trading - this is good news for theforex trend trader.
vii


1
Key 1 Trend Lines
A trend line is one of the most commonly used tools in technical analysis. However, whilemost traders know what this tool is, not so many know how to use it to implement aneffective trading strategy. More often than not, traders draw a single trend line, which isused to highlight historic price action rather than to project a probable future.
Because of this, the trend line has come to play a minor role for many traders in settingmarket entries and exits. People have overlooked the simplicity of the trend line in favourof more complex indicators and systems. This is a shame as they are missing out on apowerful tool.
In this chapter, I am going to explain trend lines by defining their characteristics, bydiscussing different types of trend lines, and showing how they can be used to projectfuture trading zones. We will also look at the power of using trend lines to pinpoint exactentry and exit prices.
The Theory
Primary strength: tells you whether to buy or to sellA trend line shows which way the currency pair is trending and reveals the current marketsentiment of the pair. The market sentiment is revealed by the direction of the trend line.If the trend line is moving up, then the market feels that the base currency (the firstcurrency in the pair) is stronger than the terms currency (the second currency in the pair).
If the pair is trending up then we are likely to buy, if it is trending down then we are likelyto sell. Knowing this up front, before considering the entry and exit points of the potentialtrade, puts you in a good position to effectively analyze a particular currency pair. Onceyour trend line is drawn and you are sure about your intention to either buy or to sell,you can move on with confidence and begin looking for possible places of entry into aposition.
Another important benefit of trend lines is that they allow us to spot key turning pointsin the price action. A key turning point is a moment where the price action changesdirection, forming either a peak or a trough. As we will see in this chapter, identifyingthese turning points creates effective entries in the market.
Some practicalitiesIn this book the price action, which is the plotted history of the exchange rate fluctuations,is shown by using candlesticks. The most basic of charting software will have a trend lineoption that can be used to highlight trend lines when they occur.
While it is true that each chart can present many different trend lines and can thereforebe highly subjective, the goal for the trader is to identify the most obvious one. This isbecause our trading decisions must be based on information that the larger market movingtraders, such as banks and large funds, are considering. The more eyes that see these trendlines, the more trading that takes place based on them and the more this happens themore likely they are to cause the desired reaction to the price action.
Trend lines can be drawn on any time frame. In this book, however, the shortest timeframe chart we consider is the 15 minute chart and the longest is the daily chart. This isbecause trend lines drawn on anything less than the 15 minute chart tend to breakdowntoo often and are therefore unreliable to trade with. While charts longer-term than dailydo not produce enough trading opportunities and can become outdated. The effect ofbeing able to draw trend lines on a number of different time frames is that the amount ofpotential trading opportunities is very large.
2
The 4 Keys to Profitable Forex Trend Trading
Basic trend line characteristicsA trend line has two major characteristics,
1. it has a minimum of three touches with the price action, and
2. it is angled and not horizontal.
The requirement for three touches is a generally accepted rule in technical analysis. Twotouches are more likely to be just a coincidence. With that in mind, the more touches thereare the stronger the trend line.
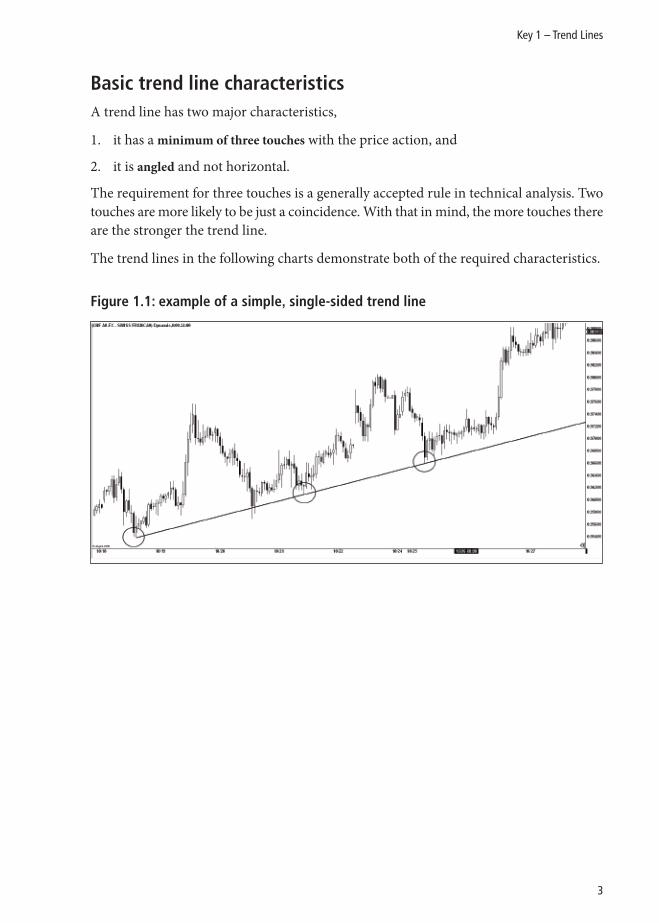
The trend lines in the following charts demonstrate both of the required characteristics.
Figure 1.1: example of a simple, single-sided trend line
3
Key 1 – Trend Lines
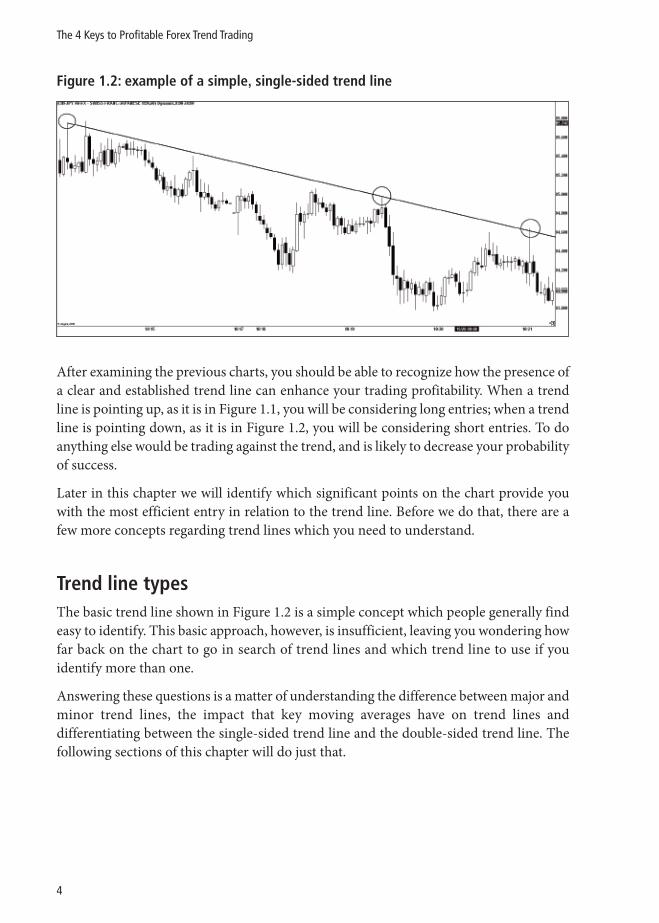
Figure 1.2: example of a simple, single-sided trend line
After examining the previous charts, you should be able to recognize how the presence ofa clear and established trend line can enhance your trading profitability. When a trendline is pointing up, as it is in Figure 1.1, you will be considering long entries; when a trendline is pointing down, as it is in Figure 1.2, you will be considering short entries. To doanything else would be trading against the trend, and is likely to decrease your probabilityof success.
Later in this chapter we will identify which significant points on the chart provide youwith the most efficient entry in relation to the trend line. Before we do that, there are afew more concepts regarding trend lines which you need to understand.
Trend line typesThe basic trend line shown in Figure 1.2 is a simple concept which people generally findeasy to identify. This basic approach, however, is insufficient, leaving you wondering howfar back on the chart to go in search of trend lines and which trend line to use if youidentify more than one.
Answering these questions is a matter of understanding the difference between major andminor trend lines, the impact that key moving averages have on trend lines anddifferentiating between the single-sided trend line and the double-sided trend line. Thefollowing sections of this chapter will do just that.
4
The 4 Keys to Profitable Forex Trend Trading
Single-sided trend lines
A single-sided trend line (like those in the previous figures) are called single-sided becausethe price action is only on one side of the trend line.
• If the price action is going up, the trend line is beneath it. One can think of the trendline as holding up the price action.
• If the price action is going down, the trend line is above it. One can think of the trendline as pushing down the price action.
Take a look at Figures 1.1 and 1.2 again, viewing them with this understanding of single-sided trend lines.
Double-sided trend lines
A double-sided trend line always runs through the price action, as opposed to runningon just one side of it. The result is that there will be price action on either side of the trendline. A single-sided trend line connects only troughs or peaks depending on its direction,but a double-sided trend line connects both peaks and troughs. As with single-sided trendlines, the double-sided trend line must have three touches with the price action.
One problem that can occur with introducing the double-sided trend line to our analysisis that suddenly we can identify many trend lines. To address this we must understandtwo points:
1. The more touches the price action has with the trend line the more relevant the trendline is.
2. The most obvious trend line is the one to use. This is for the same reason as previouslymentioned concerning single-sided trend lines – we want to use the trend lines thatthe majority of the market is also using.
5
Key 1 – Trend Lines
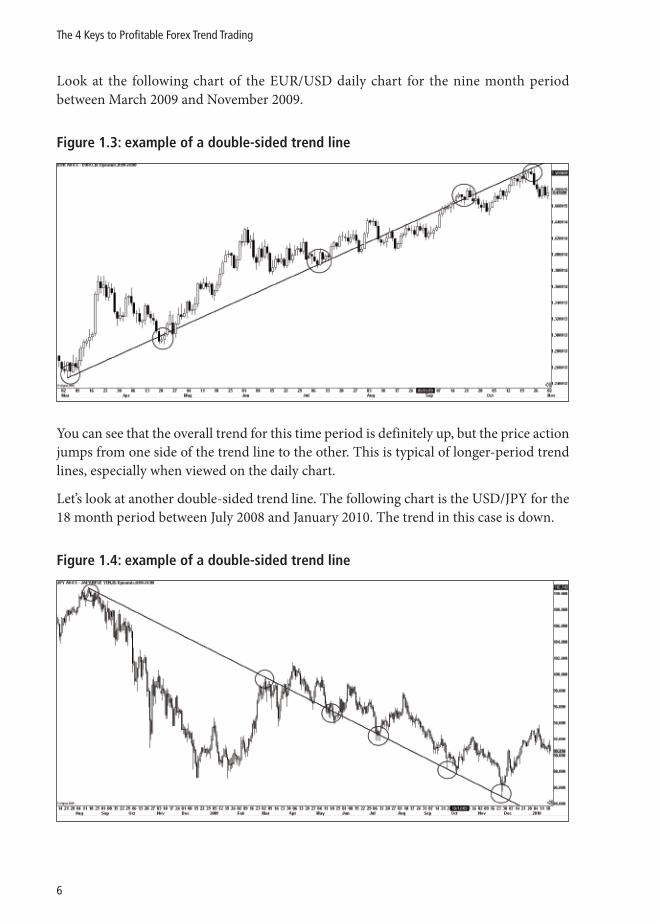
Look at the following chart of the EUR/USD daily chart for the nine month periodbetween March 2009 and November 2009.
Figure 1.3: example of a double-sided trend line
You can see that the overall trend for this time period is definitely up, but the price actionjumps from one side of the trend line to the other. This is typical of longer-period trendlines, especially when viewed on the daily chart.
Let’s look at another double-sided trend line. The following chart is the USD/JPY for the18 month period between July 2008 and January 2010. The trend in this case is down.
Figure 1.4: example of a double-sided trend line
6
The 4 Keys to Profitable Forex Trend Trading
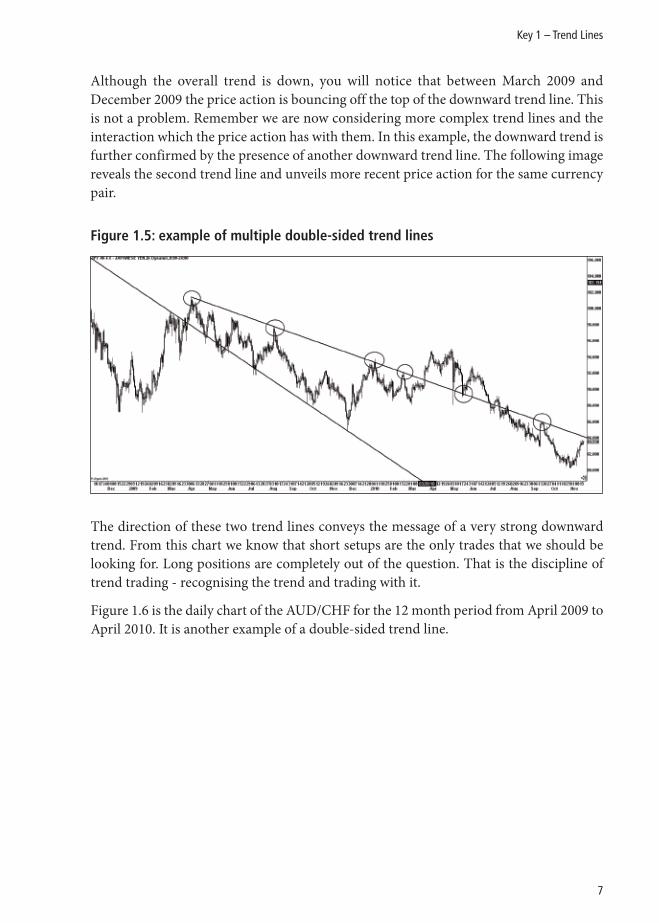
Although the overall trend is down, you will notice that between March 2009 andDecember 2009 the price action is bouncing off the top of the downward trend line. Thisis not a problem. Remember we are now considering more complex trend lines and theinteraction which the price action has with them. In this example, the downward trend isfurther confirmed by the presence of another downward trend line. The following imagereveals the second trend line and unveils more recent price action for the same currencypair.
Figure 1.5: example of multiple double-sided trend lines
The direction of these two trend lines conveys the message of a very strong downwardtrend. From this chart we know that short setups are the only trades that we should belooking for. Long positions are completely out of the question. That is the discipline oftrend trading - recognising the trend and trading with it.
Figure 1.6 is the daily chart of the AUD/CHF for the 12 month period from April 2009 toApril 2010. It is another example of a double-sided trend line.
7
Key 1 – Trend Lines
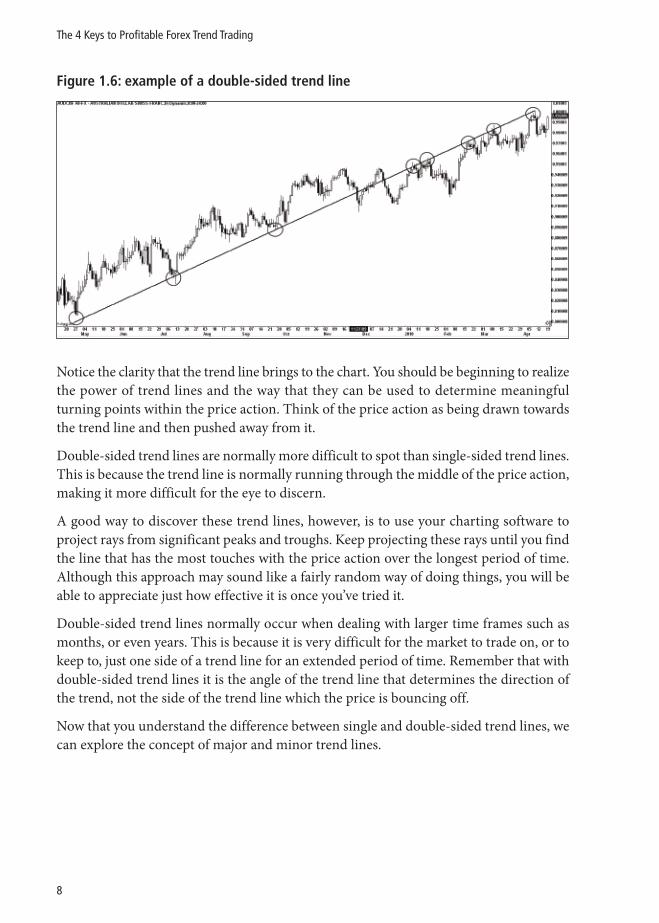
Figure 1.6: example of a double-sided trend line
Notice the clarity that the trend line brings to the chart. You should be beginning to realizethe power of trend lines and the way that they can be used to determine meaningfulturning points within the price action. Think of the price action as being drawn towardsthe trend line and then pushed away from it.
Double-sided trend lines are normally more difficult to spot than single-sided trend lines.This is because the trend line is normally running through the middle of the price action,making it more difficult for the eye to discern.
A good way to discover these trend lines, however, is to use your charting software toproject rays from significant peaks and troughs. Keep projecting these rays until you findthe line that has the most touches with the price action over the longest period of time.Although this approach may sound like a fairly random way of doing things, you will beable to appreciate just how effective it is once you’ve tried it.
Double-sided trend lines normally occur when dealing with larger time frames such asmonths, or even years. This is because it is very difficult for the market to trade on, or tokeep to, just one side of a trend line for an extended period of time. Remember that withdouble-sided trend lines it is the angle of the trend line that determines the direction ofthe trend, not the side of the trend line which the price is bouncing off.
Now that you understand the difference between single and double-sided trend lines, wecan explore the concept of major and minor trend lines.
8
The 4 Keys to Profitable Forex Trend Trading
Major trend lines
In order to trend trade effectively you must understand the difference between a majortrend line and a minor trend line. Note that both major and minor trend lines can beeither single or double-sided.
A major trend line is defined as the primary trend line that is consistent with the visualflow of the chart. It is used to determine whether to trade a long or a short position.
When looking to spot the major trend line on a chart, you need to know if the price actionis moving up or down. You can usually tell by a quick glance at the chart.
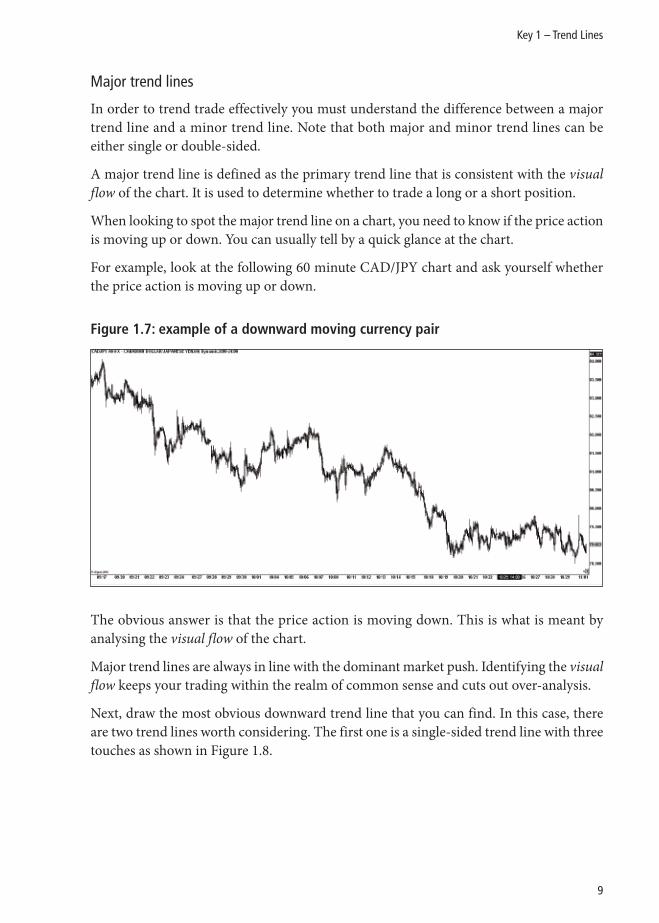
For example, look at the following 60 minute CAD/JPY chart and ask yourself whetherthe price action is moving up or down.
Figure 1.7: example of a downward moving currency pair
The obvious answer is that the price action is moving down. This is what is meant byanalysing the visual flow of the chart.
Major trend lines are always in line with the dominant market push. Identifying the visualflow keeps your trading within the realm of common sense and cuts out over-analysis.
Next, draw the most obvious downward trend line that you can find. In this case, thereare two trend lines worth considering. The first one is a single-sided trend line with threetouches as shown in Figure 1.8.
9
Key 1 – Trend Lines
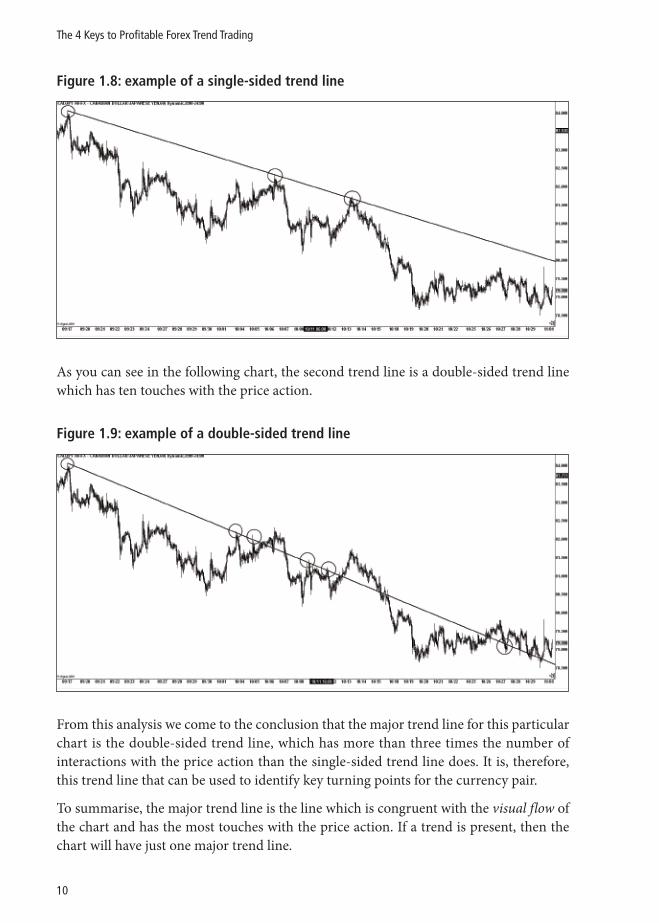
Figure 1.8: example of a single-sided trend line
As you can see in the following chart, the second trend line is a double-sided trend linewhich has ten touches with the price action.
Figure 1.9: example of a double-sided trend line
From this analysis we come to the conclusion that the major trend line for this particularchart is the double-sided trend line, which has more than three times the number ofinteractions with the price action than the single-sided trend line does. It is, therefore,this trend line that can be used to identify key turning points for the currency pair.
To summarise, the major trend line is the line which is congruent with the visual flow ofthe chart and has the most touches with the price action. If a trend is present, then thechart will have just one major trend line.
10
The 4 Keys to Profitable Forex Trend Trading
Minor trend lines
Minor trend lines are trend lines which either run counter to the visual flow of the chartor follow the visual flow but have fewer touches with the price action than the major trendline. While there can be only one major trend line, there can be several minor trend lines.
Using the example of the CAD/JPY 60 minute chart shown in Figure 1.7, you can see thatthe single-sided trend line which we considered first is a perfect example of a minor trendline. Although it is consistent with the visual flow of the chart, which is down, it has fewertouches with the price action than the major trend line. This does not mean that thissingle-sided trend line should be forgotten; it should simply be recognized as a minortrend line. It certainly holds value, as far as our trading opportunities are concerned,though not as much value as the major trend line.
If you refer back to the earlier images of the USD/JPY daily chart, you will find two trendlines there. One is a major trend line, while the other is a minor trend line. Both werevaluable.
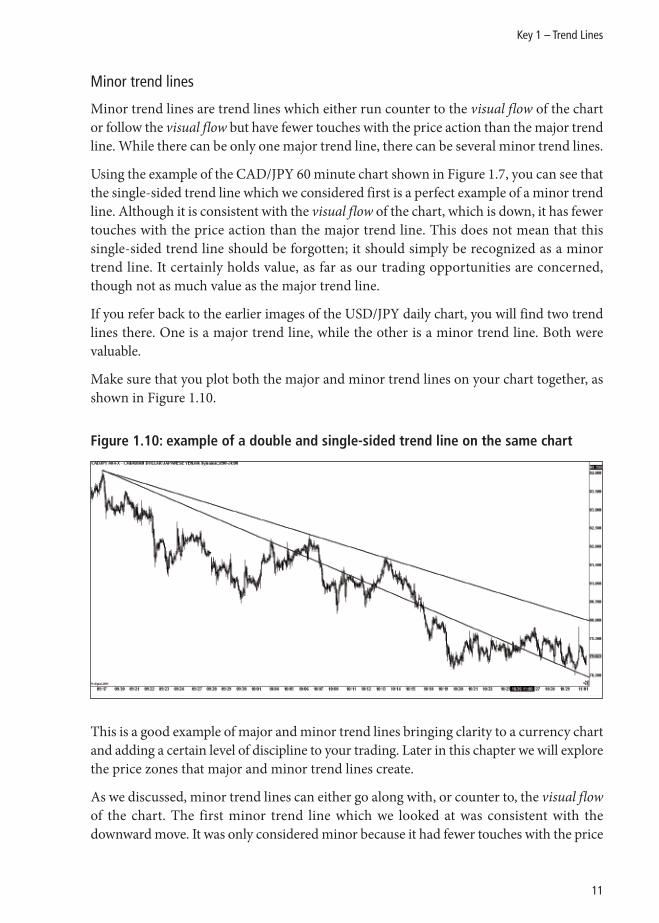
Make sure that you plot both the major and minor trend lines on your chart together, asshown in Figure 1.10.
Figure 1.10: example of a double and single-sided trend line on the same chart
This is a good example of major and minor trend lines bringing clarity to a currency chartand adding a certain level of discipline to your trading. Later in this chapter we will explorethe price zones that major and minor trend lines create.
As we discussed, minor trend lines can either go along with, or counter to, the visual flowof the chart. The first minor trend line which we looked at was consistent with thedownward move. It was only considered minor because it had fewer touches with the price
11
Key 1 – Trend Lines
action than the major trend line. Now we are going to look at a minor trend line which iscounter to the visual flow of a chart, known as a minor counter trend line.
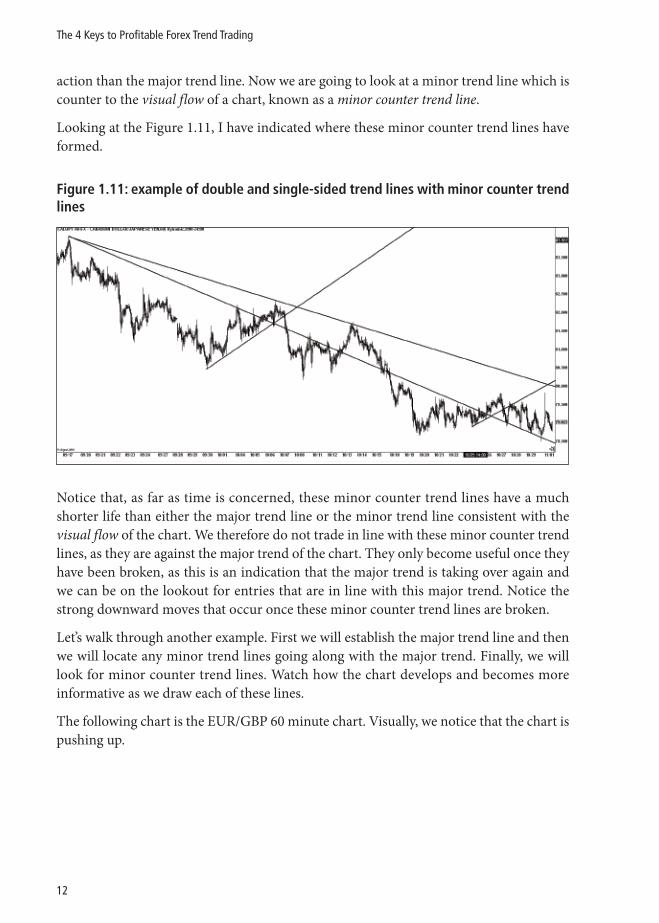
Looking at the Figure 1.11, I have indicated where these minor counter trend lines haveformed.
Figure 1.11: example of double and single-sided trend lines with minor counter trendlines
Notice that, as far as time is concerned, these minor counter trend lines have a muchshorter life than either the major trend line or the minor trend line consistent with thevisual flow of the chart. We therefore do not trade in line with these minor counter trendlines, as they are against the major trend of the chart. They only become useful once theyhave been broken, as this is an indication that the major trend is taking over again andwe can be on the lookout for entries that are in line with this major trend. Notice thestrong downward moves that occur once these minor counter trend lines are broken.
Let’s walk through another example. First we will establish the major trend line and thenwe will locate any minor trend lines going along with the major trend. Finally, we willlook for minor counter trend lines. Watch how the chart develops and becomes moreinformative as we draw each of these lines.
The following chart is the EUR/GBP 60 minute chart. Visually, we notice that the chart ispushing up.
12
The 4 Keys to Profitable Forex Trend Trading
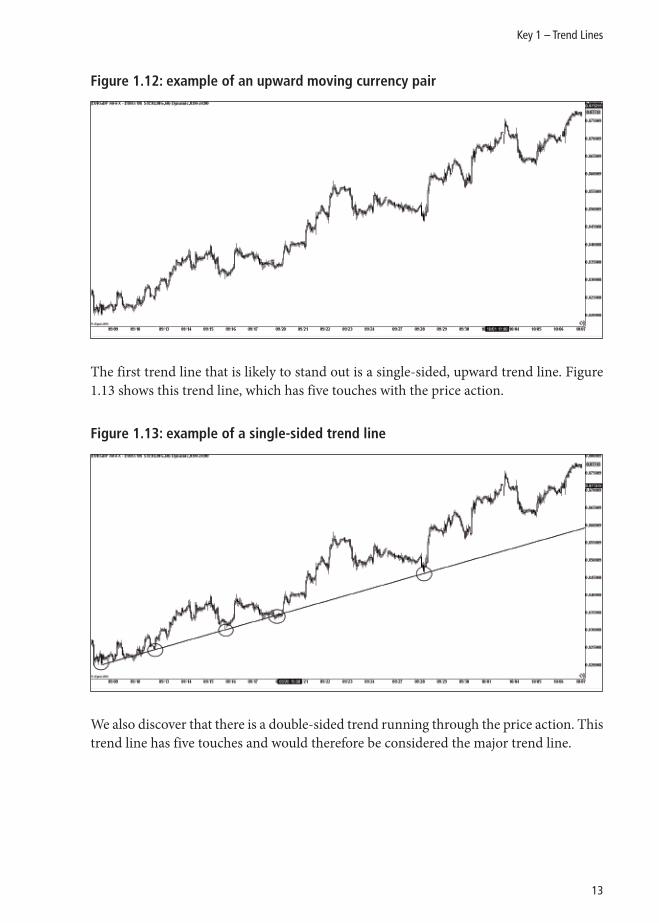
Figure 1.12: example of an upward moving currency pair
The first trend line that is likely to stand out is a single-sided, upward trend line. Figure1.13 shows this trend line, which has five touches with the price action.
Figure 1.13: example of a single-sided trend line
We also discover that there is a double-sided trend running through the price action. Thistrend line has five touches and would therefore be considered the major trend line.
13
Key 1 – Trend Lines

Figure 1.14: example of a major, double-sided trend line
Within this upward trend, there are also a few counter minor trend lines, as seen in Figure1.15.
Figure 1.15: example of double and single-sided trend lines with counter minor trendlines
Once you begin plotting your major trend lines, minor trend lines and minor countertrend lines, your chart may become too busy. A busy chart is one that is so filled withtrend lines that it becomes difficult to see which lines are important and which lines arenot. Remember, the only reason that we are plotting these trend lines is to bring clarityand make sense of what we are looking at. A busy chart causes confusion and ultimatelyfrustration. Frustrated traders are rarely profitable.
14
The 4 Keys to Profitable Forex Trend Trading
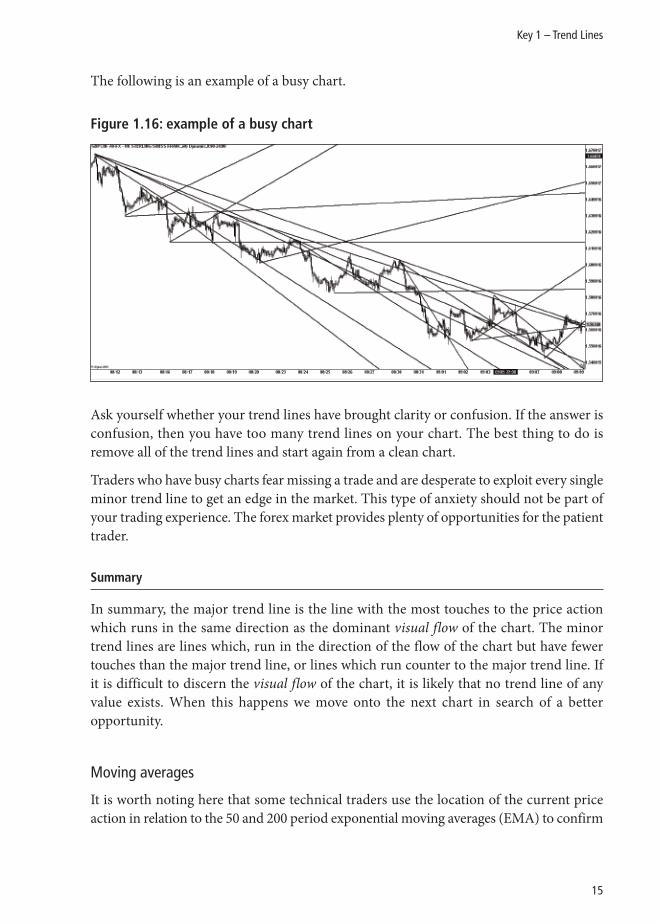
The following is an example of a busy chart.
Figure 1.16: example of a busy chart
Ask yourself whether your trend lines have brought clarity or confusion. If the answer isconfusion, then you have too many trend lines on your chart. The best thing to do isremove all of the trend lines and start again from a clean chart.
Traders who have busy charts fear missing a trade and are desperate to exploit every singleminor trend line to get an edge in the market. This type of anxiety should not be part ofyour trading experience. The forex market provides plenty of opportunities for the patienttrader.
Summary
In summary, the major trend line is the line with the most touches to the price actionwhich runs in the same direction as the dominant visual flow of the chart. The minortrend lines are lines which, run in the direction of the flow of the chart but have fewertouches than the major trend line, or lines which run counter to the major trend line. Ifit is difficult to discern the visual flow of the chart, it is likely that no trend line of anyvalue exists. When this happens we move onto the next chart in search of a betteropportunity.
Moving averages
It is worth noting here that some technical traders use the location of the current priceaction in relation to the 50 and 200 period exponential moving averages (EMA) to confirm
15
Key 1 – Trend Lines
the trend. In theory any pair of moving averages may be used, for example the 10 and 20period EMA, but in practice the most common pair used is the 50 and 200 period.
For price to be in an upward trend, for instance, the current price action has to be tradingabove both of these moving averages. For a downward trend, the price would need to betrading below both of these moving averages.
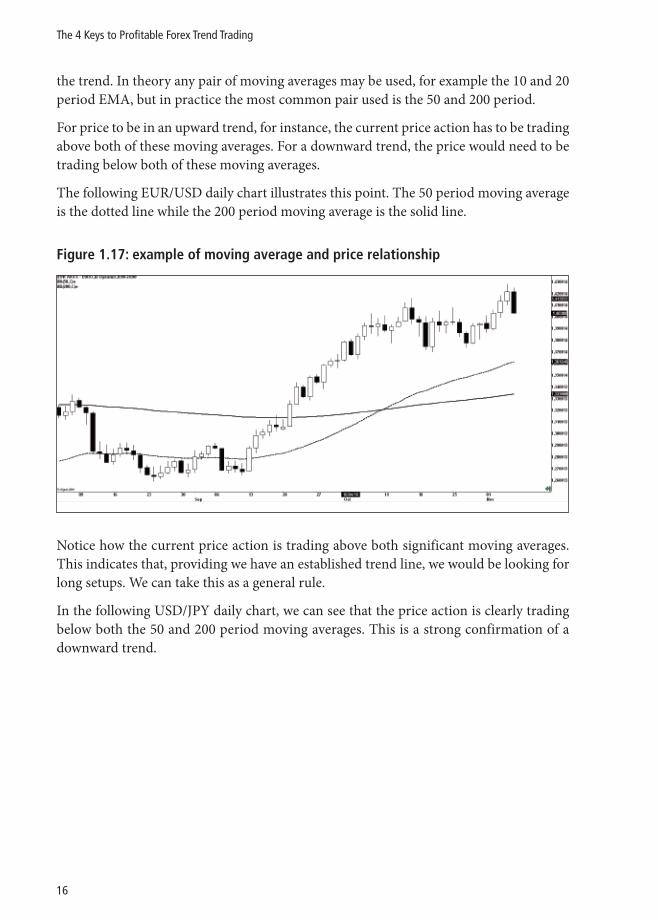
The following EUR/USD daily chart illustrates this point. The 50 period moving averageis the dotted line while the 200 period moving average is the solid line.
Figure 1.17: example of moving average and price relationship
Notice how the current price action is trading above both significant moving averages.This indicates that, providing we have an established trend line, we would be looking forlong setups. We can take this as a general rule.
In the following USD/JPY daily chart, we can see that the price action is clearly tradingbelow both the 50 and 200 period moving averages. This is a strong confirmation of adownward trend.
16
The 4 Keys to Profitable Forex Trend Trading
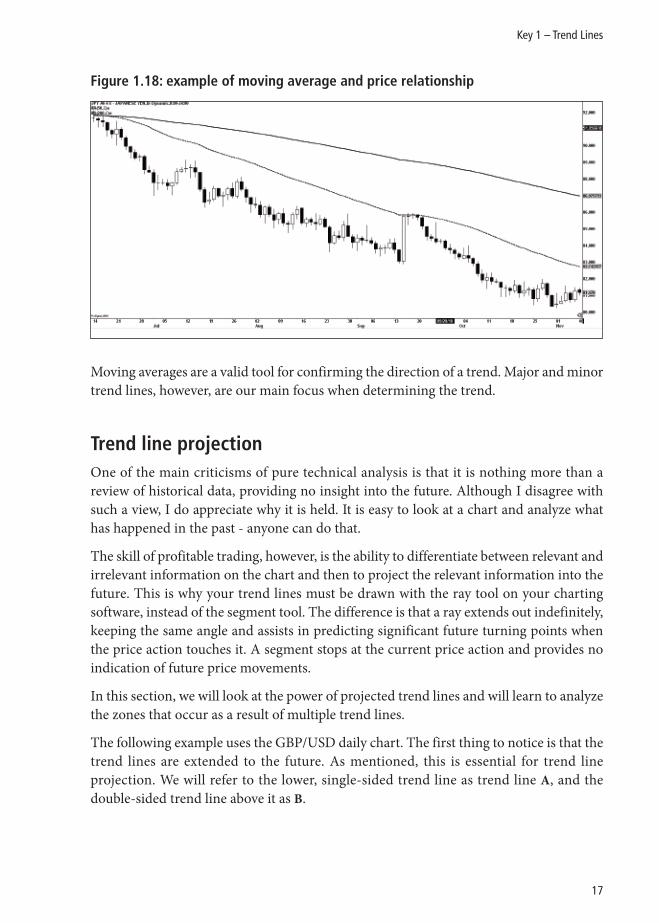
Figure 1.18: example of moving average and price relationship
Moving averages are a valid tool for confirming the direction of a trend. Major and minortrend lines, however, are our main focus when determining the trend.
Trend line projectionOne of the main criticisms of pure technical analysis is that it is nothing more than areview of historical data, providing no insight into the future. Although I disagree withsuch a view, I do appreciate why it is held. It is easy to look at a chart and analyze whathas happened in the past - anyone can do that.
The skill of profitable trading, however, is the ability to differentiate between relevant andirrelevant information on the chart and then to project the relevant information into thefuture. This is why your trend lines must be drawn with the ray tool on your chartingsoftware, instead of the segment tool. The difference is that a ray extends out indefinitely,keeping the same angle and assists in predicting significant future turning points whenthe price action touches it. A segment stops at the current price action and provides noindication of future price movements.
In this section, we will look at the power of projected trend lines and will learn to analyzethe zones that occur as a result of multiple trend lines.
The following example uses the GBP/USD daily chart. The first thing to notice is that thetrend lines are extended to the future. As mentioned, this is essential for trend lineprojection. We will refer to the lower, single-sided trend line as trend line A, and thedouble-sided trend line above it as B.
17
Key 1 – Trend Lines
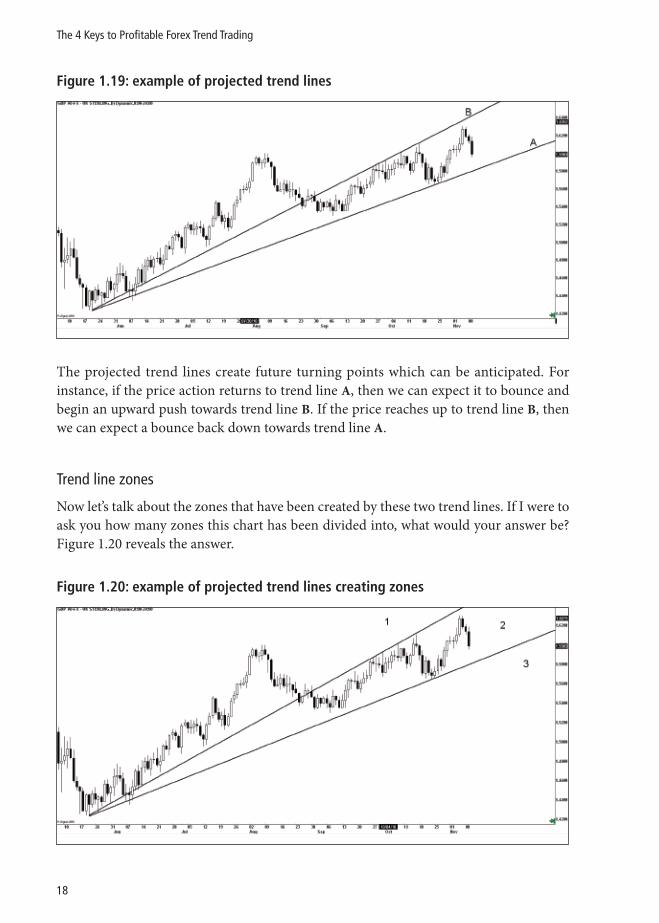
Figure 1.19: example of projected trend lines
The projected trend lines create future turning points which can be anticipated. Forinstance, if the price action returns to trend line A, then we can expect it to bounce andbegin an upward push towards trend line B. If the price reaches up to trend line B, thenwe can expect a bounce back down towards trend line A.
Trend line zones
Now let’s talk about the zones that have been created by these two trend lines. If I were toask you how many zones this chart has been divided into, what would your answer be?Figure 1.20 reveals the answer.
Figure 1.20: example of projected trend lines creating zones
18
The 4 Keys to Profitable Forex Trend Trading
As you can see, the trend lines have divided the chart into three separate zones. To progressfrom here we need to understand not only what each zone represents, but also how toutilize each one to generate trading profits.
There are two types of zones which we will be addressing: outer and inner zones.
Let’s look at the outer zones first.
In the above example, zones 1 and 3 are the outer zones, because they are located on theoutside of the current price action and are only bordered by one trend line. The outerzones represent the more extreme extensions, both in line with the trend as in zone 1, andoutside of the trend as in zone 3. For instance, if the price action were to cross up intozone 1, we would consider this move to be overextended and would expect a pullback inthe near future. With this in mind, we would be very wary about placing buy orders deepinto zone 1. The further the price action moves into zone 1, the more likely it is that ashort pullback will take place. Zone 3, on the other hand, would be an overextension ofprice to the short side. The deeper that the price action falls into zone 3, the more likelythat there will be a strong, long pullback, in line with the dominant trend.
Zone 2 is the inner zone, as it is located in between zones 1 and 3. This zone representsthe current normal trending behaviour of the currency pair. This is the zone that we canexpect the price action to continue trading within. The inner zone is where we will findthe highest probability setups and is therefore the ideal zone to trade in. It is in line withthe overall dominant trend and does not represent an overextension of the price actionon either the up or the down side.
Let’s look at another example of creating zones by drawing trend lines and labelling thesezones. Labelling always begins with 1 and moves in a clockwise direction. Watch how thestory of the chart develops as we add trend lines and create zones.
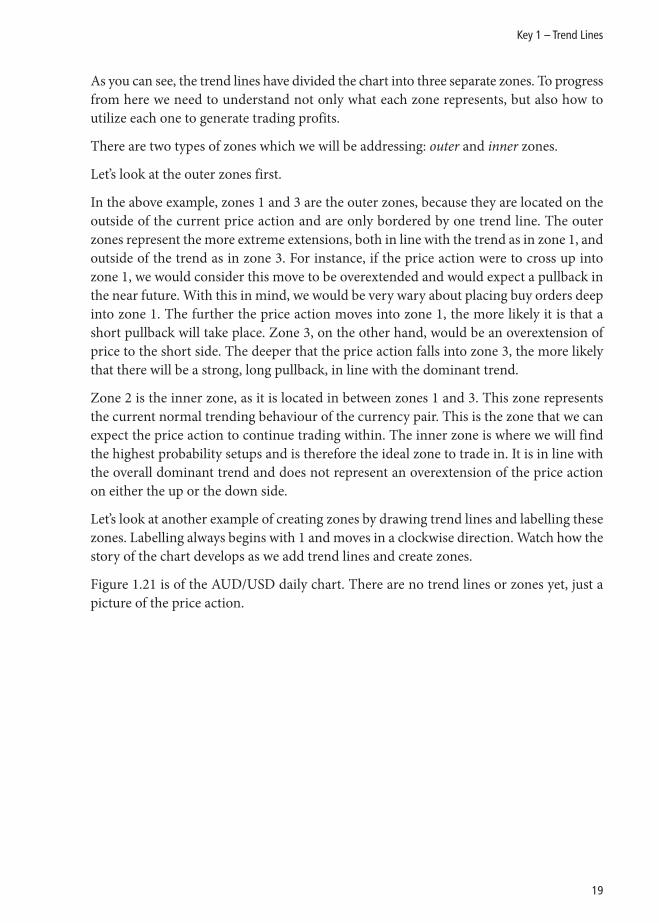
Figure 1.21 is of the AUD/USD daily chart. There are no trend lines or zones yet, just apicture of the price action.
19
Key 1 – Trend Lines
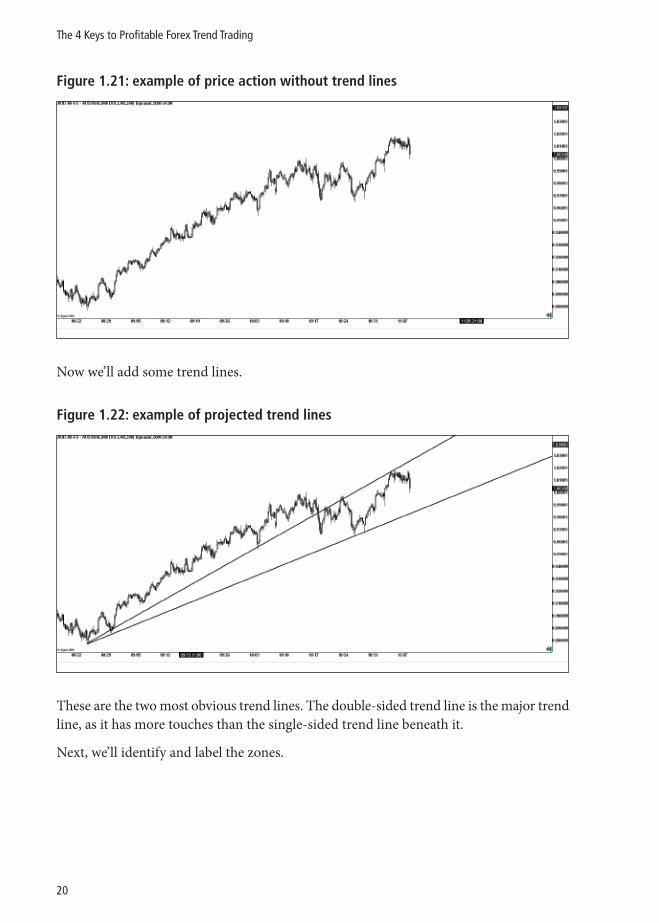
Figure 1.21: example of price action without trend lines
Now we’ll add some trend lines.
Figure 1.22: example of projected trend lines
These are the two most obvious trend lines. The double-sided trend line is the major trendline, as it has more touches than the single-sided trend line beneath it.
Next, we’ll identify and label the zones.
20
The 4 Keys to Profitable Forex Trend Trading
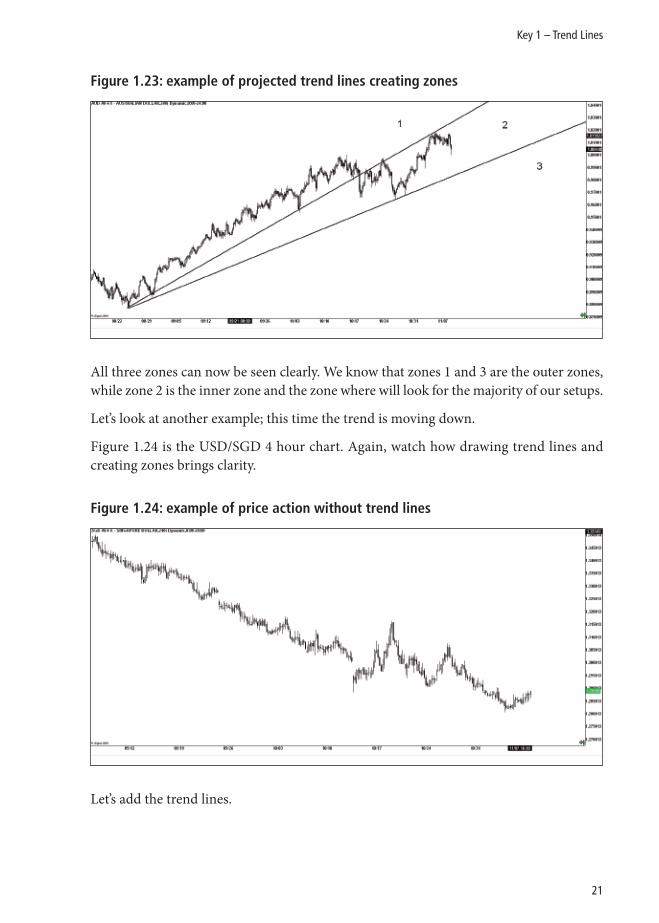
Figure 1.23: example of projected trend lines creating zones
All three zones can now be seen clearly. We know that zones 1 and 3 are the outer zones,while zone 2 is the inner zone and the zone where will look for the majority of our setups.
Let’s look at another example; this time the trend is moving down.
Figure 1.24 is the USD/SGD 4 hour chart. Again, watch how drawing trend lines andcreating zones brings clarity.
Figure 1.24: example of price action without trend lines
Let’s add the trend lines.
21
Key 1 – Trend Lines
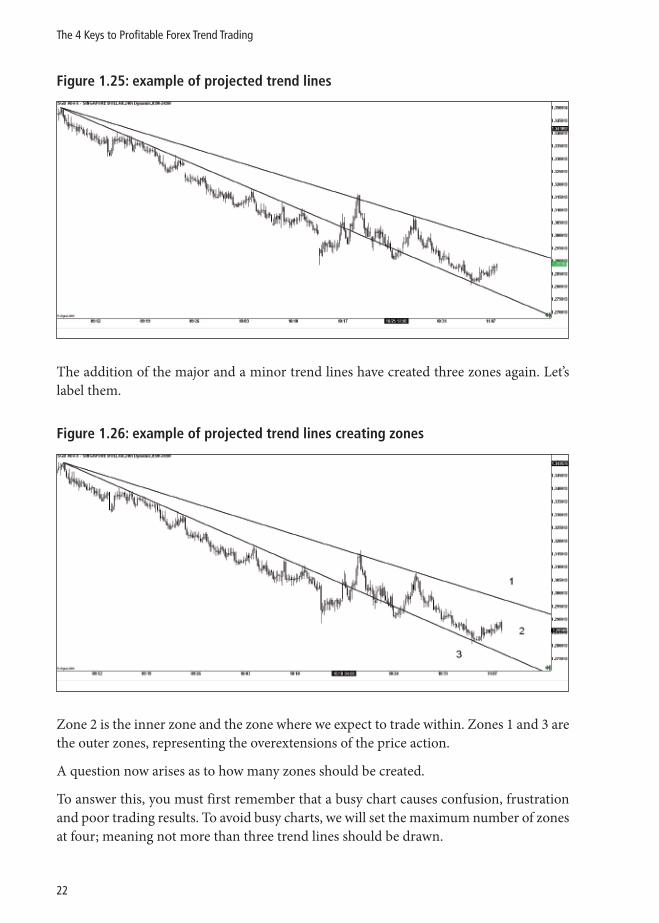
Figure 1.25: example of projected trend lines
The addition of the major and a minor trend lines have created three zones again. Let’slabel them.
Figure 1.26: example of projected trend lines creating zones
Zone 2 is the inner zone and the zone where we expect to trade within. Zones 1 and 3 arethe outer zones, representing the overextensions of the price action.
A question now arises as to how many zones should be created.
To answer this, you must first remember that a busy chart causes confusion, frustrationand poor trading results. To avoid busy charts, we will set the maximum number of zonesat four; meaning not more than three trend lines should be drawn.
22
The 4 Keys to Profitable Forex Trend Trading
Remember that we are now talking about zone creation trend lines, which will be acombination of the major trend line and the minor trend lines but will not include theminor counter trend lines, as they run counter to the visual flow of the chart. Later on, wewill explore the benefits of counter minor trend lines and the various patterns which theycreate on our charts.
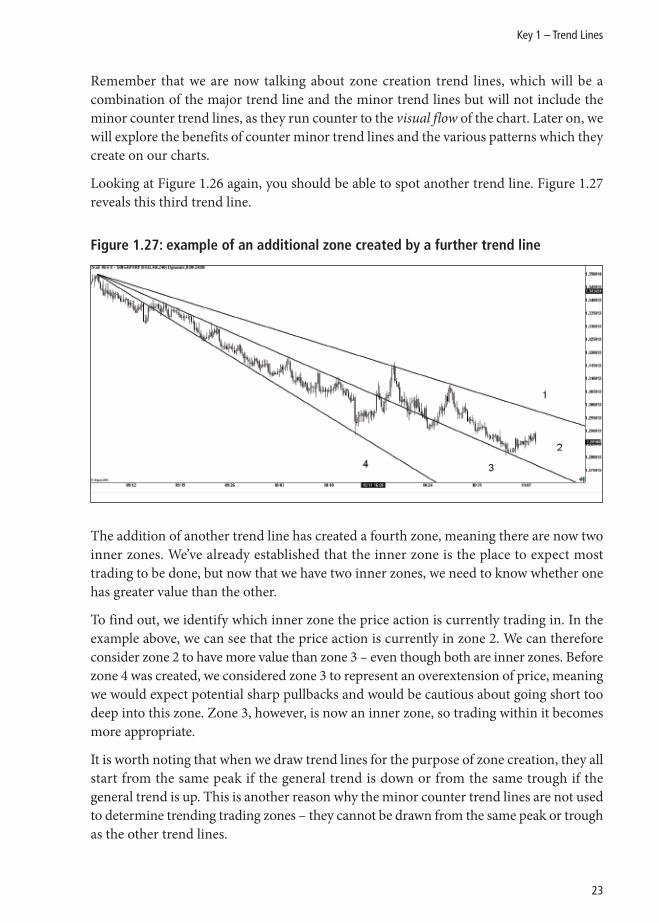
Looking at Figure 1.26 again, you should be able to spot another trend line. Figure 1.27reveals this third trend line.
Figure 1.27: example of an additional zone created by a further trend line
The addition of another trend line has created a fourth zone, meaning there are now twoinner zones. We’ve already established that the inner zone is the place to expect mosttrading to be done, but now that we have two inner zones, we need to know whether onehas greater value than the other.
To find out, we identify which inner zone the price action is currently trading in. In theexample above, we can see that the price action is currently in zone 2. We can thereforeconsider zone 2 to have more value than zone 3 – even though both are inner zones. Beforezone 4 was created, we considered zone 3 to represent an overextension of price, meaningwe would expect potential sharp pullbacks and would be cautious about going short toodeep into this zone. Zone 3, however, is now an inner zone, so trading within it becomesmore appropriate.
It is worth noting that when we draw trend lines for the purpose of zone creation, they allstart from the same peak if the general trend is down or from the same trough if thegeneral trend is up. This is another reason why the minor counter trend lines are not usedto determine trending trading zones – they cannot be drawn from the same peak or troughas the other trend lines.
23
Key 1 – Trend Lines
Summary
In summary, drawing trend lines creates zones. It is best to keep the maximum numberof zones at four, to guard against a busy chart. The outer zones represent the overextendedareas of the chart and are therefore not ideal for trading. This is because when price getstoo extended it becomes more difficult to predict turning points, which can be fast andfurious. In the inner zones, safer, more stable price action is found. This is where we lookfor the majority of our setups. If there is more than one inner zone, greater value is placedon the zone where current price action is happening.
Entry and Exit StrategiesAs we have seen, trend lines provide us with the information required to determinewhether to look for long or short trades and create projected trading zones which help usto know if the price action is trading within its normal trend, overextending too quicklyor breaking out of the current trend. It is now time to look at two trend line tradingstrategies, both of which clearly define the entry, risk exit (stop loss) and target exit (takeprofit) of the trade.
Successful trading strategies always define the entry point of a position relatively precisely.All entries can be classed as either a bounce-off or a break-through a certain level. Thereis no other form of entry in technical trading. The two strategies we will be looking at are:
1. Trend line bounce strategy
2. Trend line break strategy
1. Trend line bounce strategyThe aim of the trend line bounce strategy is to catch the move of the price just as it bouncesoff the trend line and rejoins the flow of the trend.
This approach is relatively aggressive compared to more traditional styles of trading. Byaggressive, I mean that we will be looking for buying opportunities while the price actionis falling into an upward trend line and looking for selling opportunities while the priceaction is rising into a downward trend line.
More conservative traders wait for the price to action begin to change direction beforeentering a trade. But while this approach stops us from entering the occasional bad trade,it also reduces the amount of profit taken from winning trades. Over time, this will havea dramatic effect on the overall return.
24
The 4 Keys to Profitable Forex Trend Trading
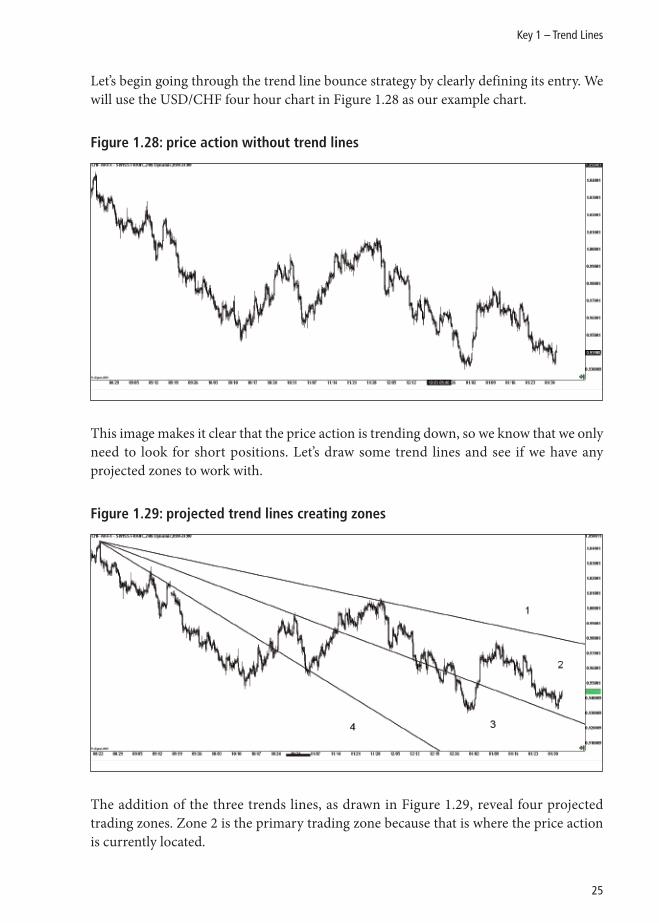
Let’s begin going through the trend line bounce strategy by clearly defining its entry. Wewill use the USD/CHF four hour chart in Figure 1.28 as our example chart.
Figure 1.28: price action without trend lines
This image makes it clear that the price action is trending down, so we know that we onlyneed to look for short positions. Let’s draw some trend lines and see if we have anyprojected zones to work with.
Figure 1.29: projected trend lines creating zones
The addition of the three trends lines, as drawn in Figure 1.29, reveal four projectedtrading zones. Zone 2 is the primary trading zone because that is where the price actionis currently located.
25
Key 1 – Trend Lines
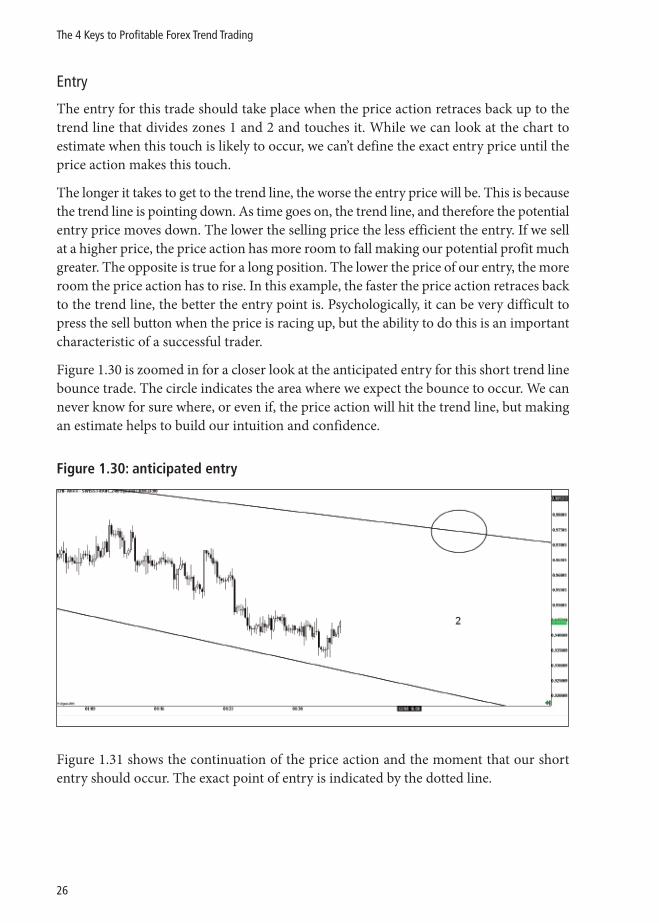
Entry
The entry for this trade should take place when the price action retraces back up to thetrend line that divides zones 1 and 2 and touches it. While we can look at the chart toestimate when this touch is likely to occur, we can’t define the exact entry price until theprice action makes this touch.
The longer it takes to get to the trend line, the worse the entry price will be. This is becausethe trend line is pointing down. As time goes on, the trend line, and therefore the potentialentry price moves down. The lower the selling price the less efficient the entry. If we sellat a higher price, the price action has more room to fall making our potential profit muchgreater. The opposite is true for a long position. The lower the price of our entry, the moreroom the price action has to rise. In this example, the faster the price action retraces backto the trend line, the better the entry point is. Psychologically, it can be very difficult topress the sell button when the price is racing up, but the ability to do this is an importantcharacteristic of a successful trader.
Figure 1.30 is zoomed in for a closer look at the anticipated entry for this short trend linebounce trade. The circle indicates the area where we expect the bounce to occur. We cannever know for sure where, or even if, the price action will hit the trend line, but makingan estimate helps to build our intuition and confidence.
Figure 1.30: anticipated entry
Figure 1.31 shows the continuation of the price action and the moment that our shortentry should occur. The exact point of entry is indicated by the dotted line.
26
The 4 Keys to Profitable Forex Trend Trading
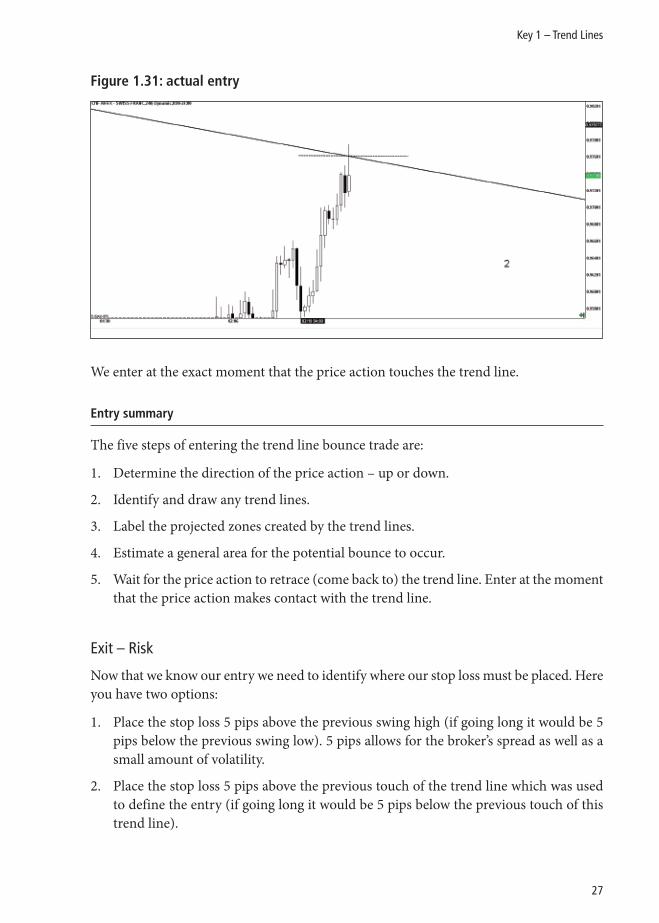
Figure 1.31: actual entry
We enter at the exact moment that the price action touches the trend line.
Entry summary
The five steps of entering the trend line bounce trade are:
1. Determine the direction of the price action – up or down.
2. Identify and draw any trend lines.
3. Label the projected zones created by the trend lines.
4. Estimate a general area for the potential bounce to occur.
5. Wait for the price action to retrace (come back to) the trend line. Enter at the momentthat the price action makes contact with the trend line.
Exit – Risk
Now that we know our entry we need to identify where our stop loss must be placed. Hereyou have two options:
1. Place the stop loss 5 pips above the previous swing high (if going long it would be 5pips below the previous swing low). 5 pips allows for the broker’s spread as well as asmall amount of volatility.
2. Place the stop loss 5 pips above the previous touch of the trend line which was usedto define the entry (if going long it would be 5 pips below the previous touch of thistrend line).
27
Key 1 – Trend Lines
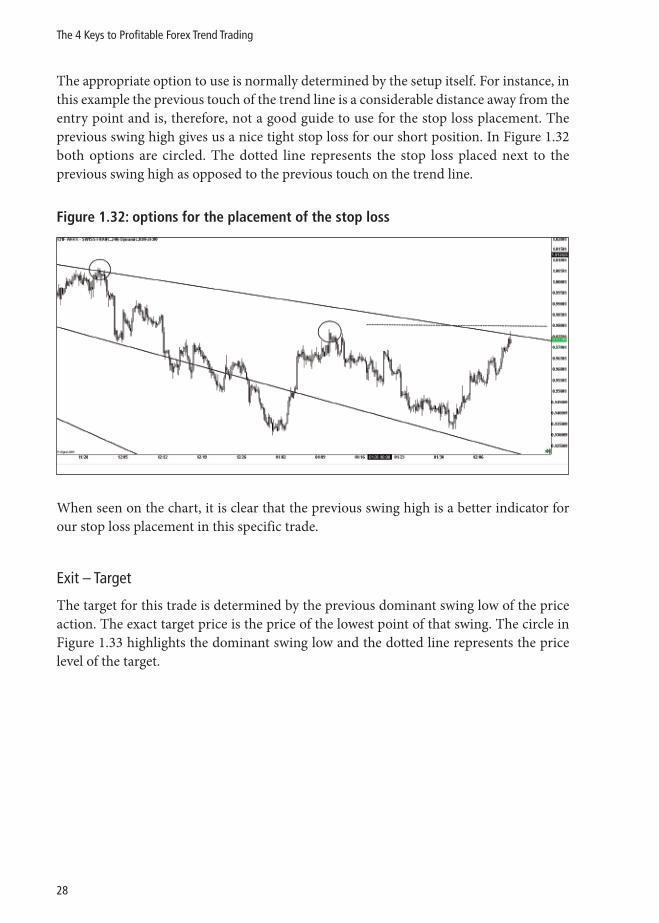
The appropriate option to use is normally determined by the setup itself. For instance, inthis example the previous touch of the trend line is a considerable distance away from theentry point and is, therefore, not a good guide to use for the stop loss placement. Theprevious swing high gives us a nice tight stop loss for our short position. In Figure 1.32both options are circled. The dotted line represents the stop loss placed next to theprevious swing high as opposed to the previous touch on the trend line.
Figure 1.32: options for the placement of the stop loss
When seen on the chart, it is clear that the previous swing high is a better indicator forour stop loss placement in this specific trade.
Exit – Target
The target for this trade is determined by the previous dominant swing low of the priceaction. The exact target price is the price of the lowest point of that swing. The circle inFigure 1.33 highlights the dominant swing low and the dotted line represents the pricelevel of the target.
28
The 4 Keys to Profitable Forex Trend Trading
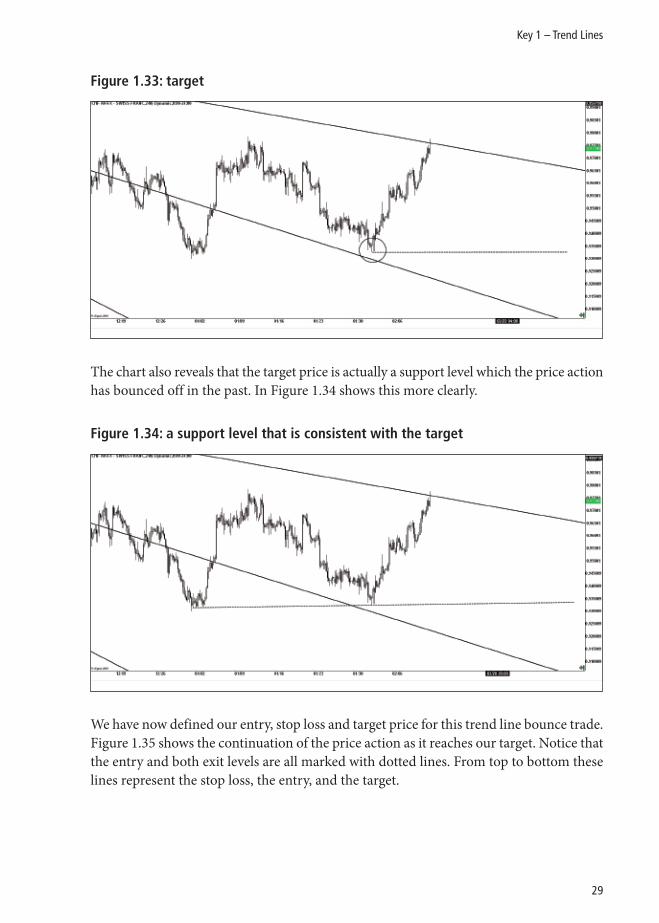
Figure 1.33: target
The chart also reveals that the target price is actually a support level which the price actionhas bounced off in the past. In Figure 1.34 shows this more clearly.
Figure 1.34: a support level that is consistent with the target
We have now defined our entry, stop loss and target price for this trend line bounce trade.Figure 1.35 shows the continuation of the price action as it reaches our target. Notice thatthe entry and both exit levels are all marked with dotted lines. From top to bottom theselines represent the stop loss, the entry, and the target.
29
Key 1 – Trend Lines
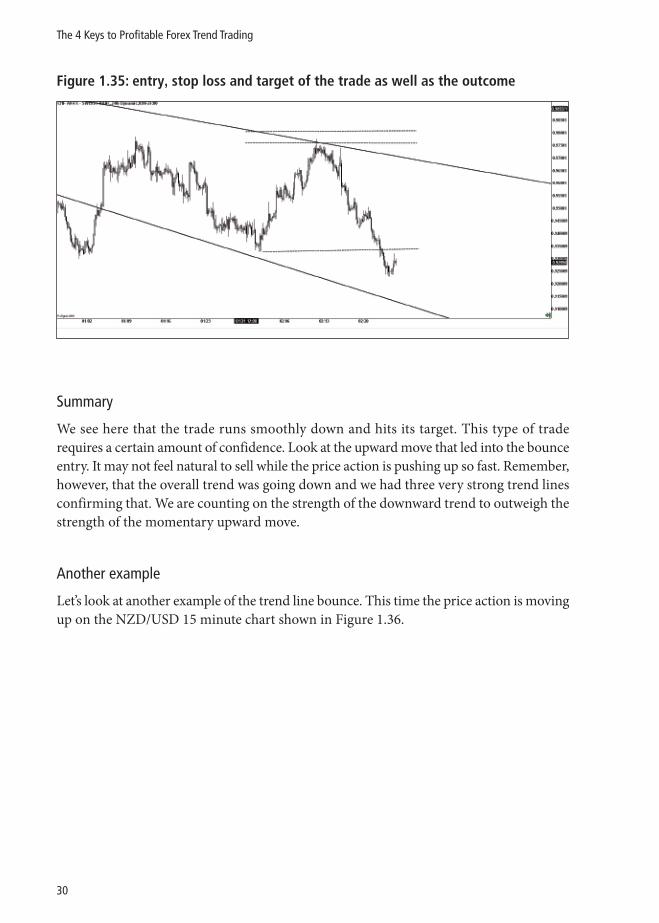
Figure 1.35: entry, stop loss and target of the trade as well as the outcome
Summary
We see here that the trade runs smoothly down and hits its target. This type of traderequires a certain amount of confidence. Look at the upward move that led into the bounceentry. It may not feel natural to sell while the price action is pushing up so fast. Remember,however, that the overall trend was going down and we had three very strong trend linesconfirming that. We are counting on the strength of the downward trend to outweigh thestrength of the momentary upward move.
Another example
Let’s look at another example of the trend line bounce. This time the price action is movingup on the NZD/USD 15 minute chart shown in Figure 1.36.
30
The 4 Keys to Profitable Forex Trend Trading
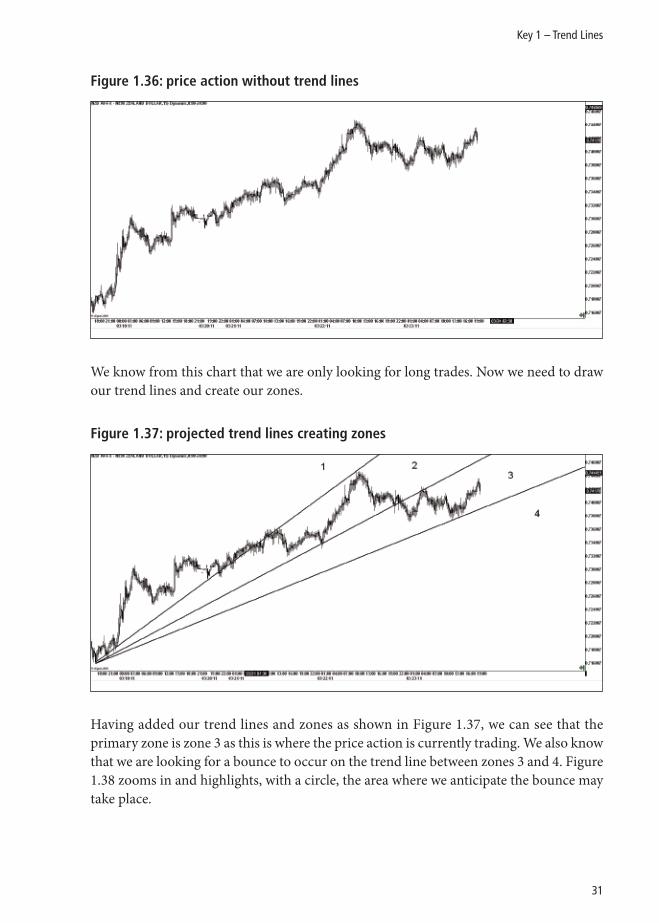
Figure 1.36: price action without trend lines
We know from this chart that we are only looking for long trades. Now we need to drawour trend lines and create our zones.
Figure 1.37: projected trend lines creating zones
Having added our trend lines and zones as shown in Figure 1.37, we can see that theprimary zone is zone 3 as this is where the price action is currently trading. We also knowthat we are looking for a bounce to occur on the trend line between zones 3 and 4. Figure1.38 zooms in and highlights, with a circle, the area where we anticipate the bounce maytake place.
31
Key 1 – Trend Lines
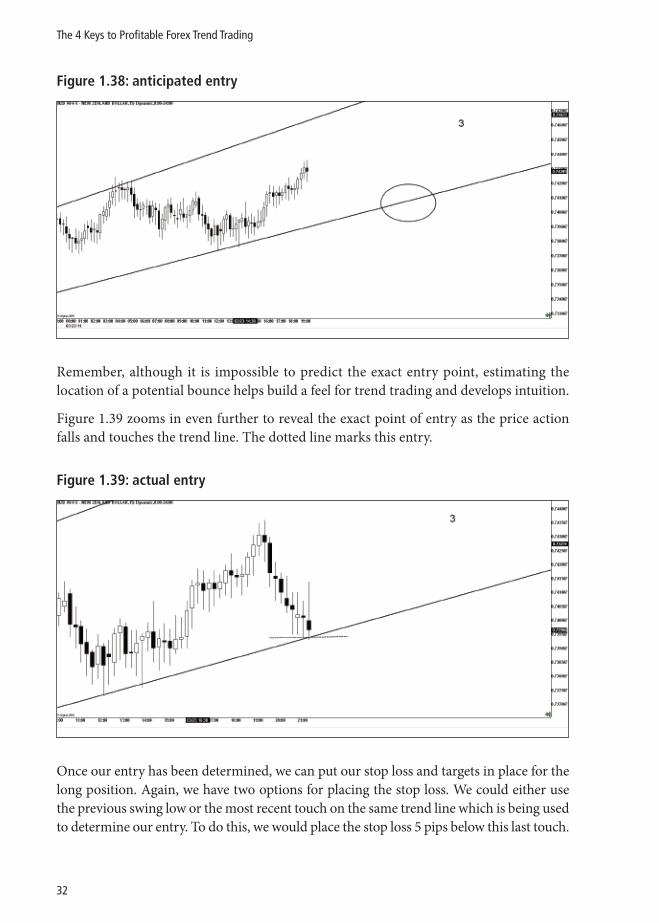
Figure 1.38: anticipated entry
Remember, although it is impossible to predict the exact entry point, estimating thelocation of a potential bounce helps build a feel for trend trading and develops intuition.
Figure 1.39 zooms in even further to reveal the exact point of entry as the price actionfalls and touches the trend line. The dotted line marks this entry.
Figure 1.39: actual entry
Once our entry has been determined, we can put our stop loss and targets in place for thelong position. Again, we have two options for placing the stop loss. We could either usethe previous swing low or the most recent touch on the same trend line which is being usedto determine our entry. To do this, we would place the stop loss 5 pips below this last touch.
32
The 4 Keys to Profitable Forex Trend Trading
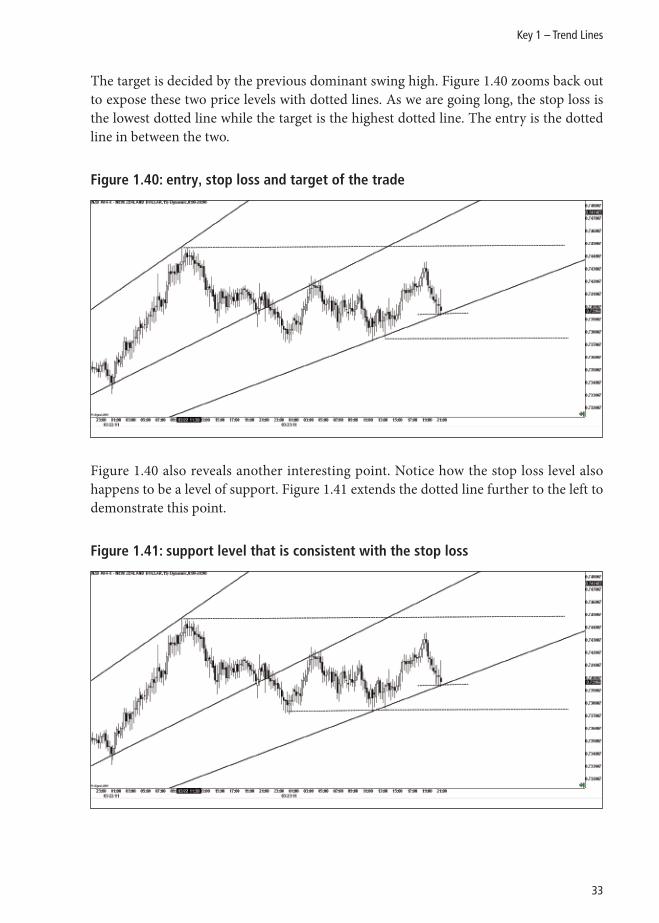
The target is decided by the previous dominant swing high. Figure 1.40 zooms back outto expose these two price levels with dotted lines. As we are going long, the stop loss isthe lowest dotted line while the target is the highest dotted line. The entry is the dottedline in between the two.
Figure 1.40: entry, stop loss and target of the trade
Figure 1.40 also reveals another interesting point. Notice how the stop loss level alsohappens to be a level of support. Figure 1.41 extends the dotted line further to the left todemonstrate this point.
Figure 1.41: support level that is consistent with the stop loss
33
Key 1 – Trend Lines
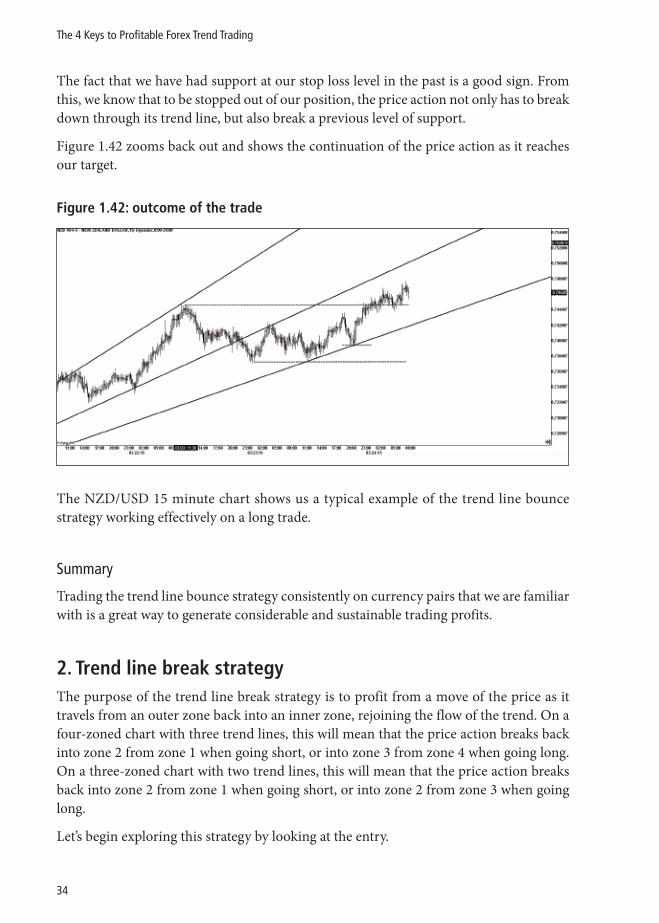
The fact that we have had support at our stop loss level in the past is a good sign. Fromthis, we know that to be stopped out of our position, the price action not only has to breakdown through its trend line, but also break a previous level of support.
Figure 1.42 zooms back out and shows the continuation of the price action as it reachesour target.
Figure 1.42: outcome of the trade
The NZD/USD 15 minute chart shows us a typical example of the trend line bouncestrategy working effectively on a long trade.
Summary
Trading the trend line bounce strategy consistently on currency pairs that we are familiarwith is a great way to generate considerable and sustainable trading profits.
2. Trend line break strategyThe purpose of the trend line break strategy is to profit from a move of the price as ittravels from an outer zone back into an inner zone, rejoining the flow of the trend. On afour-zoned chart with three trend lines, this will mean that the price action breaks backinto zone 2 from zone 1 when going short, or into zone 3 from zone 4 when going long.On a three-zoned chart with two trend lines, this will mean that the price action breaksback into zone 2 from zone 1 when going short, or into zone 2 from zone 3 when goinglong.
Let’s begin exploring this strategy by looking at the entry.
34
The 4 Keys to Profitable Forex Trend Trading
Entry
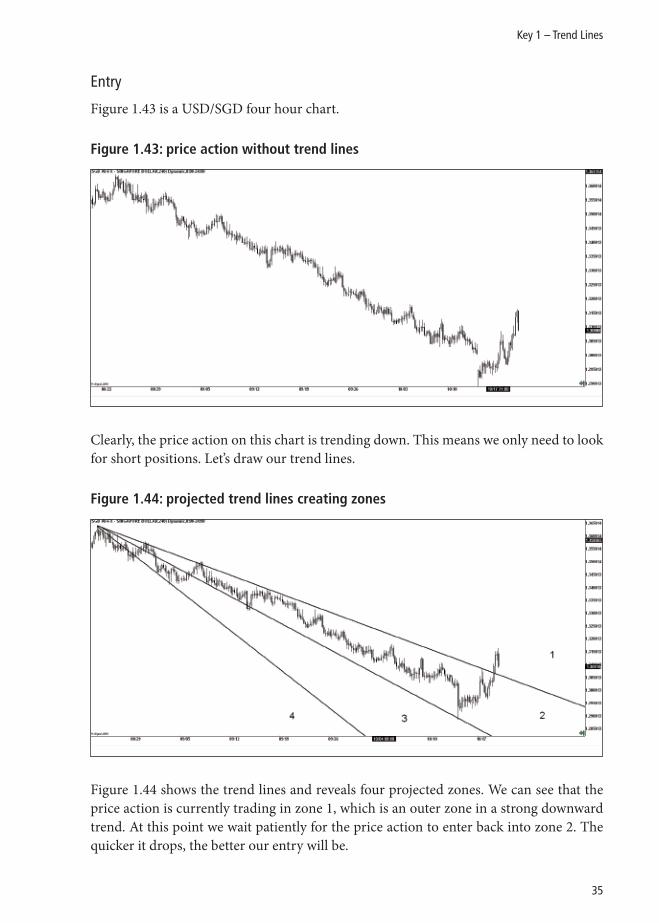
Figure 1.43 is a USD/SGD four hour chart.
Figure 1.43: price action without trend lines
Clearly, the price action on this chart is trending down. This means we only need to lookfor short positions. Let’s draw our trend lines.
Figure 1.44: projected trend lines creating zones
Figure 1.44 shows the trend lines and reveals four projected zones. We can see that theprice action is currently trading in zone 1, which is an outer zone in a strong downwardtrend. At this point we wait patiently for the price action to enter back into zone 2. Thequicker it drops, the better our entry will be.
35
Key 1 – Trend Lines
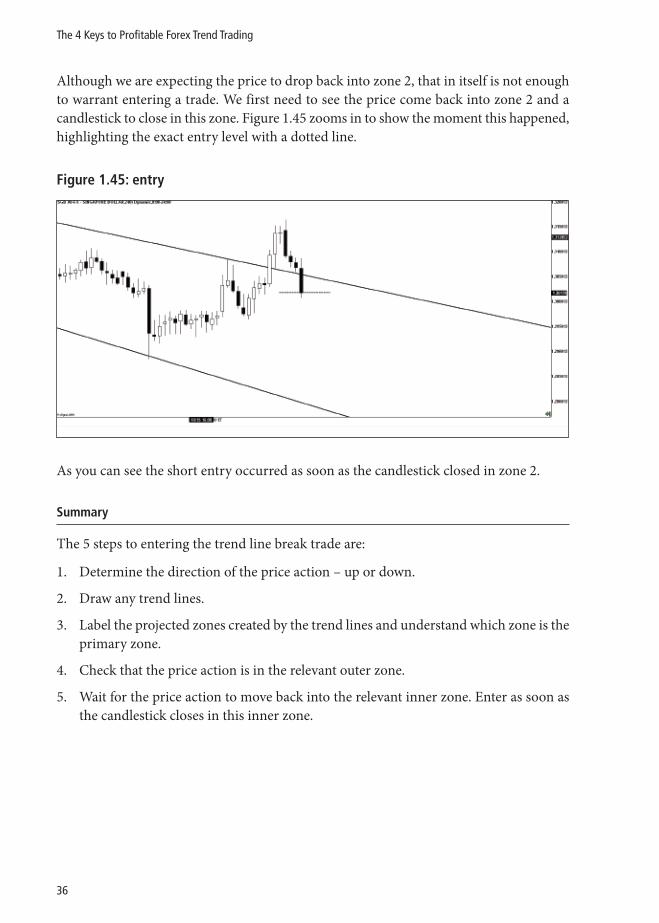
Although we are expecting the price to drop back into zone 2, that in itself is not enoughto warrant entering a trade. We first need to see the price come back into zone 2 and acandlestick to close in this zone. Figure 1.45 zooms in to show the moment this happened,highlighting the exact entry level with a dotted line.
Figure 1.45: entry
As you can see the short entry occurred as soon as the candlestick closed in zone 2.
Summary
The 5 steps to entering the trend line break trade are:
1. Determine the direction of the price action – up or down.
2. Draw any trend lines.
3. Label the projected zones created by the trend lines and understand which zone is theprimary zone.
4. Check that the price action is in the relevant outer zone.
5. Wait for the price action to move back into the relevant inner zone. Enter as soon asthe candlestick closes in this inner zone.
36
The 4 Keys to Profitable Forex Trend Trading
Exit – Risk
There are two options for the location of the stop loss in the trend line break strategy:
1. Place the stop loss 5 pips above the previous swing high when going short or 5 pipsbelow the previous swing low when going long. Either of these swings will be locatedin the outer zone.
2. Place the stop loss at the level of the previous touch on the trend line which the priceaction is coming back to.
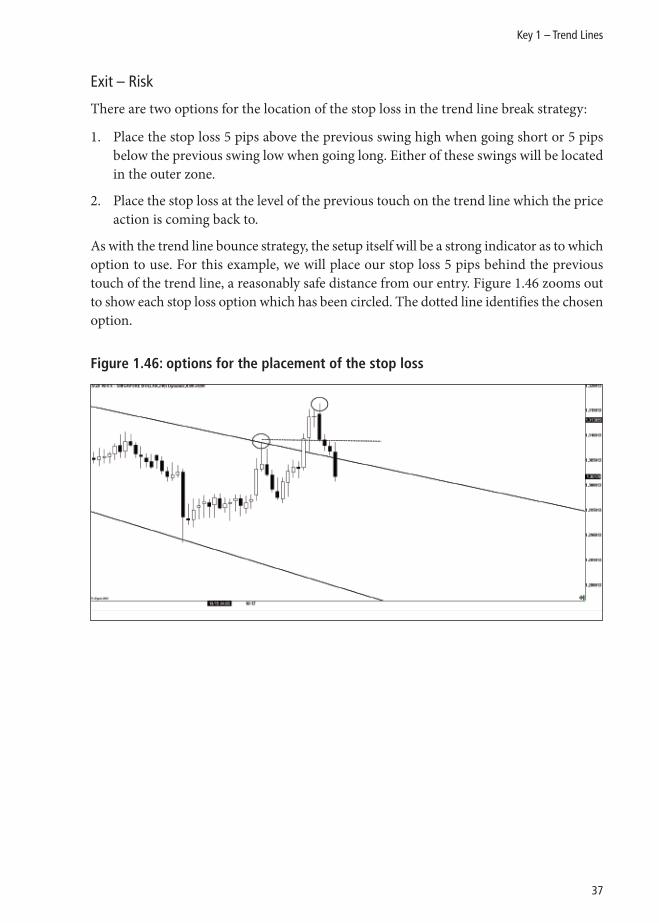
As with the trend line bounce strategy, the setup itself will be a strong indicator as to whichoption to use. For this example, we will place our stop loss 5 pips behind the previoustouch of the trend line, a reasonably safe distance from our entry. Figure 1.46 zooms outto show each stop loss option which has been circled. The dotted line identifies the chosenoption.
Figure 1.46: options for the placement of the stop loss
37
Key 1 – Trend Lines
Exit – Target
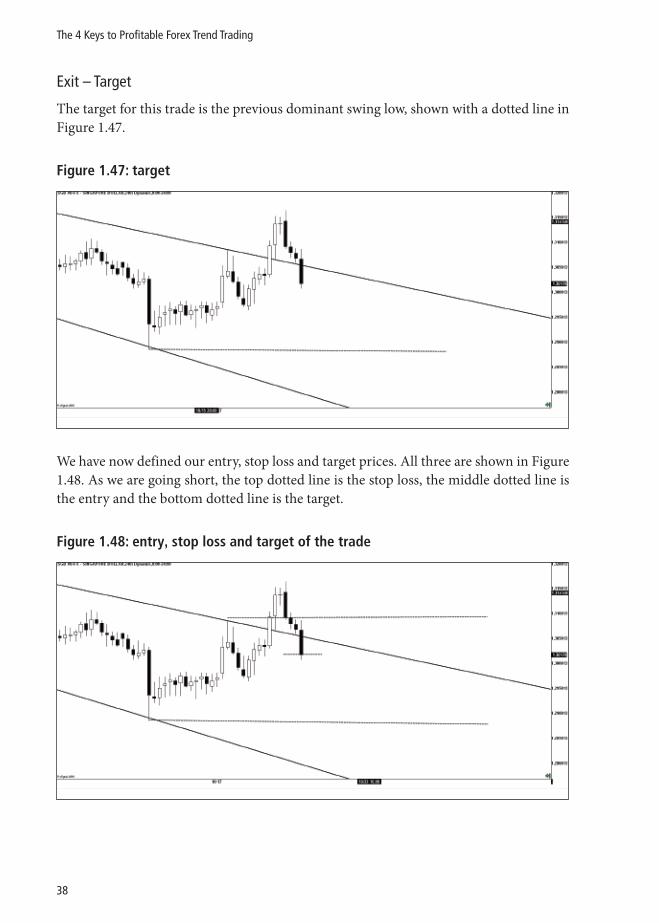
The target for this trade is the previous dominant swing low, shown with a dotted line inFigure 1.47.
Figure 1.47: target
We have now defined our entry, stop loss and target prices. All three are shown in Figure1.48. As we are going short, the top dotted line is the stop loss, the middle dotted line isthe entry and the bottom dotted line is the target.
Figure 1.48: entry, stop loss and target of the trade
38
The 4 Keys to Profitable Forex Trend Trading
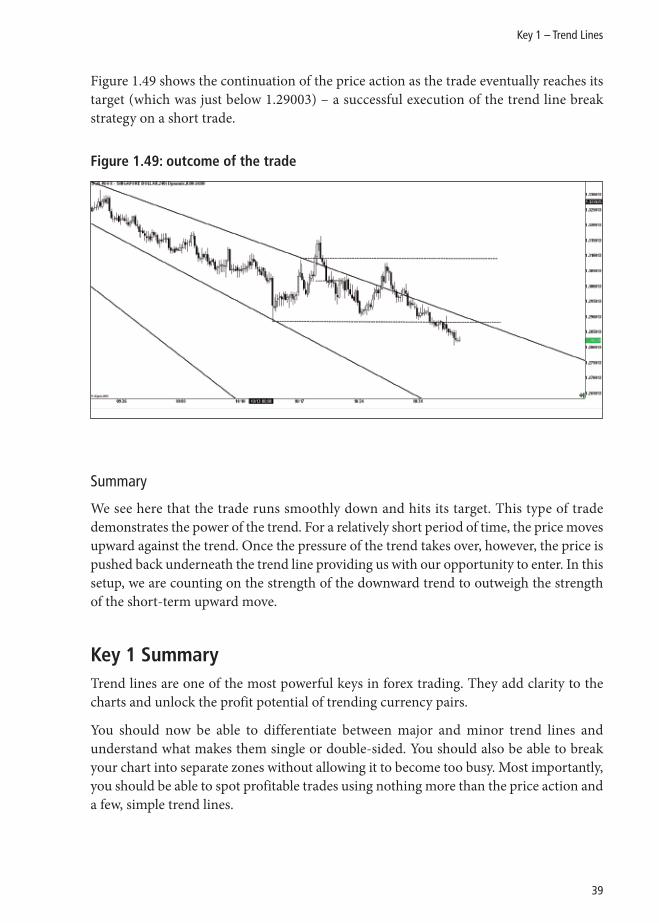
Figure 1.49 shows the continuation of the price action as the trade eventually reaches itstarget (which was just below 1.29003) – a successful execution of the trend line breakstrategy on a short trade.
Figure 1.49: outcome of the trade
Summary
We see here that the trade runs smoothly down and hits its target. This type of tradedemonstrates the power of the trend. For a relatively short period of time, the price movesupward against the trend. Once the pressure of the trend takes over, however, the price ispushed back underneath the trend line providing us with our opportunity to enter. In thissetup, we are counting on the strength of the downward trend to outweigh the strengthof the short-term upward move.
Key 1 SummaryTrend lines are one of the most powerful keys in forex trading. They add clarity to thecharts and unlock the profit potential of trending currency pairs.
You should now be able to differentiate between major and minor trend lines andunderstand what makes them single or double-sided. You should also be able to breakyour chart into separate zones without allowing it to become too busy. Most importantly,you should be able to spot profitable trades using nothing more than the price action anda few, simple trend lines.
39
Key 1 – Trend Lines

4 Keys to ProfitableForex Trend TradingUnlocking the Profit Potential of
Trending Currency PairsChristopher Weaver
www.harriman-house.com/keystoprofitableforextrendtrading
Paperback: 9780857190895eBook: 9780857192080
Available direct from Harriman House and all good booksellers. To ordera copy of the print or ebook edition go to: