reactor safety and mechanical design …fhr.nuc.berkeley.edu/wp-content/uploads/2014/10/09-001...pg....
TRANSCRIPT

Pg. 1 of 38
REACTOR SAFETY AND MECHANICAL DESIGN FOR THE ANNULAR PEBBLE-BED ADVANCED HIGH TEMPERATURE REACTOR
2009 NE 170 Senior Design Project
Rada Hong, Steve Huber, Kenneth Lee, Patrick Purcell, Sahak Margossian, and John-David Seelig
University of California
Department of Nuclear Engineering Berkeley, CA 94720-1730
Report UCBTH09-001
May 19, 2009
Executive Summary
The Pebble Bed Advanced High Temperature Reactor (PB-AHTR) is a liquid fluoride salt cooled, pebble-fuel high temperature reactor. This U.C. Berkeley NE 170 senior design report presents the results of the Reactor Safety and Mechanical Design (RSMD) group’s project to design and test a new annular core design for the PB-AHTR. The project identified different geometric configurations for the core that provide a high degree of fast neutron shielding to the solid graphite reflectors. This required close coordination with the Neutronics and Fuel Cycle (NFC) design group that studied the core neutronics and developed a thorium seed/blanket core design. The NFC group verified that the PB-AHTR can achieve a conversion ratio approaching or exceeding 1.0 using thorium, with the new annular core design. The RSMD group designed and built a scaled pebble recirculation experiment to demonstrate the generation of a radially and axially zoned core configuration and an experiment to measure the friction coefficient of graphite pebbles lubricated by fluoride salt. The group also modeled the steady-state core pressure drop and flow distribution using RELAP5-3D, COMSOL, and analytical calculations. The results of these tasks yielded a fully-functional scaled experiment radially and axially zoned by color, in which the friction coefficient of polyethylene pebbles on acrylic matched closely the coefficient of graphite pebbles in liquid salt. The computational work revealed expected values of the pressure drops and flow distributions. This report summarizes the results of this design study and recommends areas for additional research.

Pg. 2 of 38
CONTENTS

Pg. 3 of 38
1.0 INTRODUCTION
Advanced High Temperature Reactors (AHTR’s) are Generation IV reactors that use high-temperature coated particle fuels, along with a liquid fluoride salt coolant, to achieve high-temperature operation at high power density and low pressure. The 2008 NE 170 senior design class developed a detailed plant design for a 410-MWe Pebble Bed AHTR [1.1], shown in Figs. 1-1 and 1-2. The 2009 NE 170 senior design class has studied a new annular core design for the PB-AHTR. The new core design studied here uses a solid graphite central reflector similar to the PBMR, with a radial and axially zoned pebble bed. As with other PB-AHTR designs, the pebbles float and are injected at the bottom of the core and removed from defueling chutes located above the top of the core. Our Reactor Safety and Mechanical Design (RSMD) group designed and built two experiments and used RELAP5-3D, COMSOL, and analytical calculations to study the core pressure drop, flow distribution, and transient response. The first experiment used polyethylene spheres to demonstrate the generation of a radially and axially zoned core configuration in a 15° section of the PB-AHTR core. The second experiment measured the friction coefficient of graphite pebbles lubricated by fluoride salt at the PB-AHTR operating temperature, and confirmed that fluoride salts are good lubricants and that the friction coefficients are very close to those for the polyethylene spheres.
Fig. 1-1 PB-AHTR 3-D power plant model.
The RSMD group worked with the other NE 170 design team, the Neutronics and Fuel Cycle (NFC) design group, which had responsibility for developing the reactor physics design for the annular PB-AHTR core [1.2]. This required close coordination to assure that the mechanical design also works for optimized neutronics.

Pg. 4 of 38
Fig. 1-2 900 MWth, 410 MWe PB-AHTR power plant design.
The proposed approach to achieve radial zoning in the annular PB-AHTR is to have a diverging region at the bottom of the core. If the outside radius of the core diverges with a substantially larger angle than the inside radius, then the radial thickness occupied by driver pebbles drops rapidly toward the bottom of the core, as shown schematically in Fig. 1-3. This makes the bottom of the core subcritical, and thus reduces neutron fluence in this area (as occurs in the defueling chute of pebble bed reactors). This in turn makes it potentially possible to locate the radial partition rings in an area of sufficiently low neutron fluence to permit long life, particularly if the material is capable of withstanding large neutron fluences (e.g., ODS ferritic steels).
In the converging section at the top of the core, the pebbles converge into an annular slot that is 4 to 10 pebbles across, and this slot then converges above into 1 to 4 defueling chutes (with the transition designed to prevent pebble bridging), with the defueling channels then leading to defueling machines. Because the outside radius of the core converges while the inside radius remains constant or increases slightly, the thickness occupied by the fuel drops rapidly entering the defueling slot (because with plug flow the area occupied by the blanket pebbles and the driver pebbles must remain constant). This causes the core to be subcritical in the exit slot region. The length of the slot and the defueling chutes is designed to allow the pebbles to have 1 to 4 days residence time under subcritical conditions to allow fission product decay heat to drop before removal.

Pg. 5 of 38
Fig. 1-3 Schematic diagram showing a radially and axially zoned pebble bed core with inner
and outer radial blankets, center thorium pebble control channel, and coolant flow distribution.
Some type of partition is needed at the bottom of the annular PB-AHTR core to enable the radially-zoned injection of pebbles. Because pebbles bounce when they land on the bottom of the pebble bed, to generate a radially-zoned core it is necessary to have radial dividing partitions between the different pebble zones where the pebbles are added to the core [1.2]. Axially zoning is achieved by alternating the injection of seed and blanket pebbles. Because the partitions are in direct contact with the pebbles and the salt coolant, they must be constructed from a robust material capable of withstanding the resulting neutron flux, temperature, and corrosion. Fig. 1-4 shows an example of a radially zoned pebble core studied by MIT.

Pg. 6 of 38
Fig. 1-4 Radially zoned distribution of pebbles in an MIT PBMR experiment [1.2].
This project studied several key topics for reactor safety and mechanical design for the new annular PB-AHTR core. Section 2 reviews the mechanical design of the initial core design, performed using Solidworks. Section 3 discusses the modeling of the core that was performed using analytical methods as well as the codes RELAP5-3D and COMSOL. Section 4 covers scaled experiments that were performed with high-density polyethylene (HDPE) pebbles to verify that radial zoning can be created in an annular pebble core. Section 5 presents the results of experiments to measure the friction coefficient for graphite pebbles sliding on a graphite surface lubricated by fluoride salt, that verified the friction coefficient is quite close to the value for the HDPE pebbles sliding on acrylic. Section 6 summarizes and provides conclusions for the work we completed in our senior design class project.

Pg. 7 of 38
2.0 CORE MECHANICAL DESIGN
Given the reactor dimension specifications from the Neutronics and Fuel Cycle (NFC) design group, the initial design for the new PB-AHTR core shown in Fig. 2-1 and 2-2 was selected. Based upon our experimental results, future designs can evolve from this initial design. The outer and inner reflectors of the reactor (represented by the solid gray region) encase the annular pebble bed (represented by the red driver-pebble and green blanket-pebble regions). The outer reflector is determined to be at least 50 cm thick for adequate shielding, and the driver fuel region is 90 cm thick. The core geometry has a unique side profile specified to allow easy fueling and defueling chutes while maintaining the proper core width. At its widest, the core is 150 cm thick. A 30-cm layer of blanket pebbles (green) separate the seed pebbles (red) on either side from both the inner and the outer reflector. The diverging inlet on the bottom and converging outlet on the top are designed to have a angles of 30º and 45º off the vertical, respectively, ending in final inlet and output widths of 70 cm and 30 cm. The core constant-area height of the core is 300 cm, and with the conical top and bottom regions it has an effective height of approximately 320 cm. The inlet and outlet chutes are shown arbitrarily as 150 cm high. The optimal heights to provide adequate neutron shielding were not studied here.
Fig. 2-1 Elevation cross section of the annular PB-AHTR core design.

Pg. 8 of 38
Fig. 2-2 3-D isometric view of the PB-AHTR core design.

Pg. 9 of 38
3.0 THERMAL HYDRAULICS, FLUID MECHANICS DESIGN AND ANALYSIS
3.1 RELAP5-3D© Modeling
In order to analyze the steady state behavior of the core, one simulation tool used is RELAP5-3D© (Reactor Leakage Analysis Program). RELAP is a code designed for the analysis of transients and accidents in water-cooled nuclear power plants and related systems as well as the analysis of advanced reactor designs [3.1]. In the RELAP simulation developed here, only steady-state fluid flow modeling of flow distribution in the PB-AHTR core was performed. However, this same input deck can be used in the future for transient thermal analysis of annular PB-AHTRs. Appendix A provides a listing of this input deck.
3.1.1 Code Description
The hydrodynamic model used in RELAP5-3D© is a transient, two-fluid model for flow of a two-phase vapor/gas-liquid mixture that can contain noncondensable components in the vapor/gas phase and/or a soluble component in the liquid phase. A multi-dimensional component in RELAP is available for the user to model the hydrodynamic features of reactor applications, primarily in the vessel and steam generator [3.1]. In our case we are using the multi-dimensional component in cylindrical (r, ,z) coordinates. Figure 3-1-1 shows an example control volume used to generate the 2-D RELAP model for the PB-AHTR core.
Fig. 3-1-1 Example cylindrical control volume used to build the RELAP model for the annular PB-AHTR

Pg. 10 of 38
3.1.2 Numerical Solution Schemes
RELAP5-3D© utilizes a semi-implicit numerical scheme to solve for the transport of mass, momentum, and energy across the boundaries of the geometric mesh shown in the computational model description later.
The following are the governing equations solved by RELAP, as reported by ref [3.1]
Conservation of Mass
(3.1.1)
Conservation of Momentum
(3.1.2)
Conservation of Energy
(3.1.3)
These equations are discretized in time and space. The discretization of the components depends on the numerical scheme employed in order to solve these equations. In order to solve equations 3.1.1-3.1.3, these partial differential equations are replaced by finite difference equations. The difference equations are based on the concept of a control volume (or mesh cell) in which mass and energy are conserved by equating the accumulation to the rate of mass and energy in through the cell boundaries minus the rate of mass and energy through the cell boundaries plus the source terms. This model averages properties for all mesh cells and requires the knowledge of velocities at the volume boundaries. The velocities at the boundaries are most conveniently defined through the use of momentum control volumes centered on the mass and energy cell boundaries. This approach results in a numerical scheme having a shifted spatial mesh. The scalar properties of the flow are defined at cell centers, and vector quantities are defined on the cell boundaries [3.2].
3.1.3 Data Visualization Tools
An algorithm was constructed in MATLAB in order to better visualize the data output by RELAP. The algorithm takes the velocities at half of the junctions in the model, and averages them to display a velocity field inside the core.
3.1.4 Hydrodynamic Model
The hydrodynamic model was created using the multi-dimensional component in RELAP and several time-dependent volumes and junctions, single volumes, and single junctions. The multi-dimensional component is split into three vertical sections, each comprising of nine radial zones, nine axial zones, and one azimuthal zone, totaling 243 different zones, shown in Fig. 3-1-2.

Pg. 11 of 38
Fig. 3-1-2 Geometric Representation of the Full Core using RELAP
The dashed lines in Fig. 3-1-2 represent how the core is actually modeled. The meshes that lie outside of the core region have been given an area factor of 0.0 signifying that no flow can pass through them. This approximates the actual conical shapes of the expanding and contracting sections of the core.
Coolant injection and removal are accomplished using 14 radial inlets from the bottom of the core to the middle and 5 radial outlets from the middle of the core up. There are also four axial inlets at the bottom, 6 azimuthal outlets across the diagonal of the defueling and 2 more axial outlets at the very top.
The flow rate was determined from the energy conservation equation
(3.1.4)
where Q is the power output of the core (currently at 900MW) multiplied by the volume fraction being modeled (1/8) and Cp is the specific heat of the flibe at 600°C. The temperature difference is 104°C taken from the design specifications. The flow rate for this model then equates to 471.5 kg/s. This value is fixed as the flow rate, but it is broken up proportionally into various meshes along the boundary of the core corresponding to the cross sectional area of each mesh. The source and sink pressures are kept constant and because the junctions are only logic functions, this creates a constant pressure boundary for the inlet and outlet.
The initial conditions for the system were set to the values shown in Table 3.1.1.
Inlet Mid Core Outlet
Pressure (Pa) 600.0 E+3 600.0 E+3 101.33 E+3
Temperature (°C) 600 600 600
Table 3.1.1 Initial core temperature and pressure.

Pg. 12 of 38
All mass flow rates were set to zero initially and both inlets and outlets began their respective mass flows after 10.0 seconds. The time of simulation was set to 500.0 seconds.
A predictable and desirable steady-state flow pattern was produced, as shown in Fig. 3-1-3.
Fig. 3-1-3 Flow distribution in simulated core.
Another value we are interested in the radial pressure drop across the core. If we look at the greatest pressure drop across the mid section of the core we find that:
(3.1.5)
(3.1.6)
These findings show desirable results in our design. Future simulations should study the core heat transfer and eventually LOFC transients and LOCA accidents.
3.2 COMSOL Modeling
The COMSOL computer code has the capability to solve detailed, 3-D fluid mechanics problems. Here we used COMSOL to simulate the flow distribution in the PB-AHTR core,

Pg. 13 of 38
using a computational mesh that is much finer than the mesh possible with the RELAP code. A 2-D, axially symmetric model was used to predict the pressure drop, mass flow rate and the streamline velocity field. The same liquid-salt thermophysical properties that were used in RELAP5-3D© were also applied in COMSOL, and the pebble fuel is modeled using the porous media assumption.
3.2.1 Background
COMSOL modeling may be used for optimizing parameters within the experimental design, especially the arrangement of the inlet and outlet of the core. From a modeling point of view, this model is also a prerequisite for the understanding how the flow and heat transient systems work in the core. The hydrodynamic model used in COMSOL is a chemical engineering module using Brinkman’s equation for porous media flow. An axially symmetric view of the model was developed, as shown in Fig. 3-2-1, with the inlet, outlet and impermeable wall surfaces represented by the blue, red and black color lines, respectively.
.
Fig. 3-2-1 Axially symmetric COMSOL model for the annular PB-ATHR core.
3.2.2 Numerical Solution Method
The transport of mass, momentum, and energy across the boundaries of the geometric mesh are implemented in COMSOL for the numerical calculation.
The following are the governing equations utilized by COMSOL for the sub-domain and boundary numerical calculation
(3.2.1)
(3.2.2)

Pg. 14 of 38
(3.2.3) The density ( ), permeability (k), porosity ( p), normal inflow velocity (U0), and dynamic
viscosity ( ) are used in the above equations in order to perform the calculation. There are 604,379 mesh elements that were generated to ensure the proper calculation of the mass flow distribution.
Fig. 3-2-2 COMSOL geometric mesh representation of the annular core.
COMSOL has a built-in command to calculate the normal velocity to the inlet surface. Table 3-2-1 below shows the normal velocity of the axial and radial surface of the Fig. 3-2-2.
Table 3-2-1 COMSOL volumetric flow rates
Knowing the volumetric flow rate from COMSOL, one could perform the calculation of mass flow rate given the density of the flibe coolant is 1986 kg/m3. Equation (3.2.4) is used to calculate the mass flow rate
(3.2.4)
where is the mass flow rate, is the porosity, the density and the volumetric flow rate. The resulting mass flow rate is 3536 kg/s.
Figure 3-2-4 shows the velocity field across the core for different axial and radial positions.

Pg. 15 of 38
Fig. 3-2-4 COMSOL velocity field for the PB-AHTR core
The same values from RELAP5-3D© were used to calculate the pressure drop across the core using COMSOL. The inlet velocity is set at 0.153m/s and the outlet pressure is set at 101.33kPa. The greatest pressure drop across the core is about 50kPa as shown in Fig. 3-2-5 below (in the model, gravity has been set to zero so that the hydrostatic head difference can be neglected). Figure 3-2-6 shows streamlines for the flow distribution through the core.
Fig. 3-2-5 Pressure drop across the core

Pg. 16 of 38
Fig. 3-2-6 COMSOL predictions for the surface pressure and velocity field streamlines
3.2.3 COMSOL Modeling Conclusion
As can be seen from Table 3-2-2, both the COMSOL and RELAP5-3D models give consistent predictions. The next section shows that they are also consistent with analytical solution for the pressure drop in the core.
Final Numerical Results
Mass Flow Rate [kg/s]
Pressure Drop [atm]
RELAP5-3D 3772 0.50
COMSOL 3536 0.52
Table 3-2-2 Comparison of RELAP and COMSOL results
3.3 Analytical Modeling
To confirm the pressure losses predicted by the RELAP and COMSOL models, a simplified analytical model for the steady-state pressure drop was also developed. The velocity in the PB-AHTR core can be described as the superficial velocity through a porous media and thus the pressure drop can be predicted using the Ergun equation.
For the analytical solution several major simplifying assumptions must be introduced. The general discussion of the core then must be looked at in two geometrical perspectives, one for varying heat transfer and one for varying angle of flow across the core.

Pg. 17 of 38
The first geometrical profile isn’t required to be specifically accurate to the problem, so a simple 2-D geometrical basis is created. First it is assumed that the geometry is a simple right cylindrical annulus where the axis of rotation is the distance between the corners of rectangle created by making the differential radius of the reactor a side and the height a side. The radius of the right cylinder is then assumed to be the annular radius. This yields a simple cross sectional area of mass flow of A= r2 and a path length of the aforementioned axis length.
The second geometrical profile used to assimilate angle of fluid flow to the pressure drop, is done using an annular cylinder. The annular cylinder is kept at constant volume relative to the actual dimensions of the reactor. Then flow is rotated such that its starts uniformly radial and eventually becomes exactly vertical flow through the annular cylinder.
Once the approximate geometry is specified, it is important to understand the fluid mechanics of the design. The flow is described by assuming that the packed bed of spheres can be treated as a porous medium. In doing so one relates the dimensionless quantities such as the approximate friction factor and the Reynolds number [3.3]. It is important to note that the spheres are assumed to remain stationary, which is a valid assumption in this case due to the relatively large flow rate of the flibe coolant compared to the very slow motion of the seed and blanket pebbles.
The friction factor is defined as:
(3.3.1)
where Dp is the diameter or hydraulic diameter of the particle, is the void fraction created by the bed of particles, V is the superficial velocity of the fluid, p is the pressure drop, and L is the characteristic length of flow. This dimensionless quantity can be related to the Reynolds number via the Ergun equation as
(3.3.2)
The following representation of the Reynolds number is applicable to pebble beds:
(3.3.3)
where is the viscosity of the fluid and is the density of fluid.
These equations yield a reasonable approximation to the pressure drop. They mainly deal with geometrical and material properties aside from the v , or superficial velocity. Without creating any assumptions about the superficial velocity one looks to the analytics of the heat transfer to find this averaged property of liquid flow. The superficial velocity is found using equation (3.1.4).
The first geometrical case is used as a means to study the effects of desiring temperature change versus pressure drop.

Pg. 18 of 38
Fig. 3-3-1 Pressure drop with varying temperature differences
The second geometry takes into account angle distribution of the flow, from radial flow to completely vertical annular flow at a change in temperature drop of 104 degrees Celsius.
Fig. 3-3-2 Pressure drop vs angle of flow

Pg. 19 of 38
4.0 PREX-2 EXPERIMENT
In the PB-AHTR, a major issue is the motion of the pebble bed throughout the reactor when pebbles are recirculated. In particular, achieving radial zoning is a key interest to this project. To verify the flow of pebbles through a reactor core, we designed and constructed a proof-of-principle Pebble Recirculation Experiment (PREX-2), shown in Figure 4-1. This section presents results from this experiment
Fig 4-1: PREX-2 filled with 129,840 pebbles. (Inner reflector is modeled on the left side,
outer reflector is modeled on the right side)
The experiment was designed and built as a 15° slice of the core, scaled to 42% of the actual reactor size. The 3.0-cm diameter PB-AHTR pebbles were simulated using 1.253-cm (1/2”) diameter high density polyethylene spheres. While earlier PREX experiments have

Pg. 20 of 38
used water, for simplicity this PREX-2 experiment was designed to operate dry. Therefore the pebbles were added at the top of the experiment, instead of being injected into the bottom of the core and floating up to form the pebble bed. Styrofoam was used to construct the simulated inner and outer reflectors for the bed. Each section of the Styrofoam was individually cut to the correct shape using a heated nichrome wire cutter. The wire cutter created a flat surface that approximates the curved surface in the actual reactor, again simplifying the construction of the experiment. The pieces were then glued together and left 24 hours to set. The flat surface simplifies construction and approximates the curved surface of the actual reflector.
One-sixteenth inch acrylic was used to line the inner and outer reflector surfaces that the pebbles slide on. In order to fabricate the correct curved surface this thin acrylic sheet was heated with a heat gun so the sheet could be bent to the correct shape. To attach the thin acrylic sheet to the Styrofoam, Elmer’s© Ultimate GlueTM was used. Then large sheets of one-half inch acrylic were used to sandwich the Styrofoam reflector blocks, with all-thread bolts used to hold the sheets together, creating the 15° slice of the model. The acrylic sheets were 1.28-cm thick, sufficient to prevent significant bowing outward in the middle under the pressure of the loaded pebbles.
Acrylic was chosen as the inner surface for the reflectors because has approximately the same the friction factor with HDPE pebbles (approximately 0.3) as was measured for graphite spheres lubricated by fluoride salt (Section 5).
The loading process for the pebbles involved adding pebbles at the top of the experiment, and removing them from the bottom. Four different colors of pebbles were used, with light green (LG) dark green (DG) representing the blanket layers, and yellow (Y) and white (W) the driver fuel region, Different colors of pebbles were added in each of the six radial zones, with the arrangement from the inside radius to outside radius of LG, Y, W, Y, DG, and LG. Periodically a divider layer of pebbles was inserted, with the order DG, LG, LG, LG, LG, DG. Figure 4-2 shows the resulting distribution of pebbles, at various times as the pebbles were added into the experiment. Appendix B provides the detailed pebble loading procedure, as well as the detailed as-built dimensions of the PREX-2 experiment and a description of the design of the defueling chute used to remove pebbles from the bottom of the experiment.

Pg. 21 of 38
Fig 4-2: Pebble flow through the top of the PREX-2 (continued from left to right)
As one can see in Fig. 4-2, in the expanding region of the core the pebbles move more rapidly down the outer reflector (right side) than along the inner reflector (left side). This difference in the pebble speed is likely due to the asymmetric geometry of the expanding conic region. Because this difference in pebble speed causes shearing to occur in the pebble bed, some radial dispersion and mixing is observed between the pebble layers.
Conversely, in the constant cross section area of the core, the pebbles move in plug flow and no further radial dispersion or mixing occurs in this region. Finally, at the bottom of the experiment, in the contracting region of the core, the moving pebbles were again observed to undergo shear, in this case with the pebbles moving more rapidly down the inner reflector (left side) than outer reflector (right side).
Because it is desirable to minimize the radial mixing and dispersion of pebbles, it is recommended that the next PREX experiment use reflector designs that provide more symmetric inlet and outlet conical regions, to minimize shearing of the pebble flow.

Pg. 22 of 38
5.0 SALT LUBRICITY EXPERIMENT
The PB-AHTR’s liquid salt coolant offers many advantages over both traditional gas and water coolants. However, the impact of the liquid salt coolant on friction between graphite surfaces has, in the past, been unknown. This section of the report presents data for friction coefficients for hemispherical graphite pebbles lubricated by liquid-fluoride salt.
At room temperature in air, graphite acts as a lubricant. However, as temperature increases to over 200°C in a dry environment, adsorbed water vapor and oxygen are released, and graphite begins to lose lubricity [5.1-5.5]. Under Pebble Bed Modular Reactor (PBMR) operating conditions, graphite’s friction coefficient can be almost an order of magnitude greater than that of room temperature graphite. This leads to concerns about wear and pebble bridging and blockage and excessive graphite dust production, because pebbles like that shown in Fig. 5-1 must slide along graphite reflectors in the cores of PBMRs and similar helium-cooled, pebble-fueled reactor designs.
Fig. 5-1 Design of graphite coated fuel pebbles used in the PB-AHTR, showing the center low-density graphite kernel used to tune the pebble density and buoyancy.
Under PB-AHTR operating conditions, graphite will operate at somewhat lower maximum temperatures than in helium-cooled pebble bed reactors, but still sufficiently high that graphite friction would be substantial under dry conditions. However, the liquid salt acts as a lubricant, and works to reduce friction even after graphite has lost its lubricity.
Although the actual reactors will use flibe (67% LiF, 33% BeF2) in the primary loop, due to the toxicity of the beryllium in flibe the salt flinak (46.5% LiF, 11.5% NaF, 42% KF)—the leading candidate for the PB-AHTR intermediate salt loop—was used in this experiment, due to its greater availability, lower cost, and low toxicity. The University of Wisconsin, Madison provided the flinak which had been used previously for material corrosion testing. The flinak was shipped with an argon-gas cover and had relatively high purity and low oxygen

Pg. 23 of 38
contamination. All handling of the flinak during the experiment occurred in an inert gas environment.
To account for the difference in liquid salts, the experimental temperature—and as a result kinematic viscosity—was adjusted so that the Reynolds number would match that of flibe at reactor conditions, assuming that velocity and characteristic length remain constant, Flinak=
Flibe, where is the kinematic viscosity. Kinematic viscosities of flibe and flinak can be calculated using the following formulas [5.5, 5.6], respectively:
(in cP*cm3/g)
(in cP*cm3/g)
Figure 5-2 compares the kinematic viscosities for flibe and flinak.
Fig. 5-2 Kinematic viscosities for flibe and flinak. Experimental temperatures were picked so their viscosities would match those of flibe under reactor conditions.
Because the PB-AHTR’s normal operating temperature is 600°C at the core inlet and 704°C at the outlet, measurements were made with flinak at temperatures that would match the kinematic viscosity of flibe at 600°C, 650°C, and 700°C. This required operating the

Pg. 24 of 38
experiment at lower temperatures. Table 5-1 tabulates the temperatures that were used in the experiment.
TFlibe(°C) (cP*cm3/g) TFlinak(°C)
600 4.31 492
650 3.45 525
700 2.84 559
Table 5-1 Temperatures for the pebble friction experiment.
In addition, the normal force between the pebble and the graphite surface was varied by adjusting the mass loaded in the apparatus. Masses of 0.915 kg, 1.39 kg, and 1.86 kg were used to provide different normal forces for each temperature. Besides the friction measurements with flinak, an additional friction measurement was conducted at 559°C in a dry helium environment without any flinak present in the apparatus, to verify the graphite friction coefficient under dry conditions.
(a) (b)
Fig. 5-3 The 1.5-cm radius graphite hemispheres, spaced 5.1 cm apart on a torsion bar (a) and a graphite slab—with liquid flinak (b)—after use in the experiment.
The experimental apparatus was composed of two 1.5-cm radius graphite hemispheres attached 5.1 cm apart on a rotating stainless steel torsion bar (T-bar), shown in Fig. 5-3a. The T-bar was rotated by a shaft and pulley system. The hemispheres were placed in contact with a graphite plate, which had a shallow well machined in it to hold liquid flinak, shown in Fig. 5-3b after the experiment was completed. Both the hemispheres and plate were fabricated from graphite available in the Nuclear Engineering Department. Normal force was applied to the two hemispheres by weights placed in a container located on top of the T-bar shaft, shown in Fig. 5-4. The bottom half of the T-bar and graphite were placed in a stainless steel container, containing a helium purge tube to maintain a dry, inert atmosphere and a thermocouple to measure the local temperature.

Pg. 25 of 38
Fig. 5-4 The experimental apparatus, in the open (left) and closed (right) furnace.
Static and dynamic friction coefficients were measured in this experiment. The static friction coefficient was determined by adding weight to the pulley system until the torque on the shaft caused it to begin to move. The dynamic friction was measured by finding the mass required to cause the shaft to rotate at a constant velocity after being nudged to start it moving.
The friction coefficient μ is defined as:
where Ffriction is the tangential friction force, Fnormal the normal force, Mnormal the mass generating the normal force, and g gravitational acceleration. The friction force can be determined using a torque balance:
where mpulley is the mass suspended from the string wound around the pulley. The drive pulley radius rdrive and shaft-to-hemisphere radius rshaft-hemi are both 5.1 cm (2.0 in), so the equation reduces to:
The friction coefficient was therefore calculated using the following equation:
First, a dry graphite trial was conducted in helium at 559°C. As Table 5-2 shows, the dry static friction coefficient is approximately 0.53 and the dynamic friction coefficient approximately 0.45. The 1.86-kg case required so much mass in the pulley system that the
Pg. 26 of 38
apparatus began to tilt and the measurement had to be stopped—therefore reliable data could not be acquired for that high-normal-force trial, although it does show from a practical standpoint just how high the friction coefficient can be under dry conditions at high temperatures.
Normal Mass (kg) d s 0.915 .457 .551
1.39 .449 .512
1.86 over-torque over-torque
Table 5-2 Calculated friction coefficients for graphite without flinak
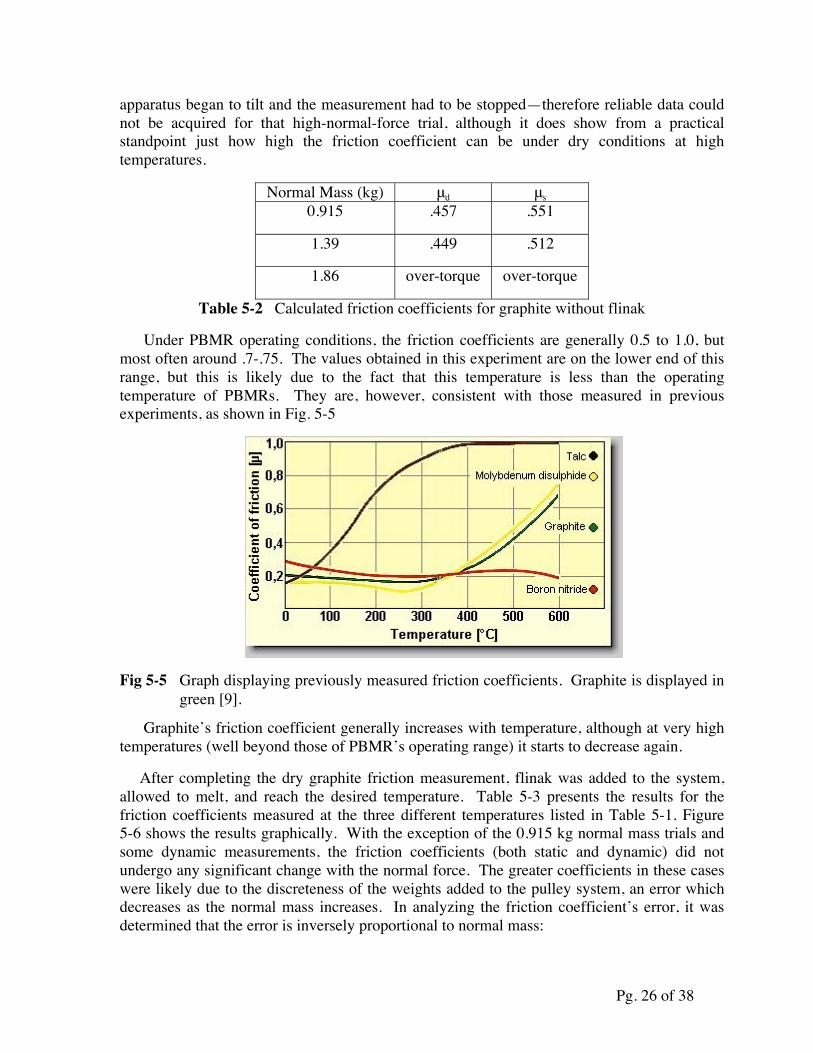
Under PBMR operating conditions, the friction coefficients are generally 0.5 to 1.0, but most often around .7-.75. The values obtained in this experiment are on the lower end of this range, but this is likely due to the fact that this temperature is less than the operating temperature of PBMRs. They are, however, consistent with those measured in previous experiments, as shown in Fig. 5-5
Fig 5-5 Graph displaying previously measured friction coefficients. Graphite is displayed in green [9].
Graphite’s friction coefficient generally increases with temperature, although at very high temperatures (well beyond those of PBMR’s operating range) it starts to decrease again.
After completing the dry graphite friction measurement, flinak was added to the system, allowed to melt, and reach the desired temperature. Table 5-3 presents the results for the friction coefficients measured at the three different temperatures listed in Table 5-1. Figure 5-6 shows the results graphically. With the exception of the 0.915 kg normal mass trials and some dynamic measurements, the friction coefficients (both static and dynamic) did not undergo any significant change with the normal force. The greater coefficients in these cases were likely due to the discreteness of the weights added to the pulley system, an error which decreases as the normal mass increases. In analyzing the friction coefficient’s error, it was determined that the error is inversely proportional to normal mass:

Pg. 27 of 38
Temperature (°C) Normal Mass (kg) d s
0.915 .237 .273 ±.0328 1.39 .190 .256 ±.0216
492
1.86 .180 .253 ±.0161 0.915 .224 .260 ±.0328 1.39 .189 .253 ±.0216
525
1.86 .182 .255 ±.0161 0.915 .215 .251 ±.0328 1.39 .187 .251 ±.0216
559
1.86 .177 .250 ±.0161 Table 5-3 Calculated dynamic and static friction coefficients for trials with flinak.
Fig. 5-6 Friction coefficient vs. normal mass.
As shown in Fig. 5-7, friction coefficients remained relatively constant with increasing temperature, although some cases showed a very slight decrease. In theory, the friction factor (not to be confused with the friction coefficient) is directly proportional to kinematic viscosity—which is in turn inversely proportional to temperature—for laminar flow (which is assumed for lubrication); and as the friction factor increases, larger pressure differences are required to perform the same jobs (all else being equal). Thus, one would expect a stronger

Pg. 28 of 38
decrease in friction coefficient with temperature. However, this experiment showed very little variation, as the PB-AHTR’s operating temperature range is too narrow to produce noticeable changes in the system’s viscous losses.
Fig. 5-7 Friction coefficient vs. temperature.
After recording the final measurement, the hemispheres were raised and the flinak was allowed to drip. Once cool, it was observed that small amounts of solid flinak remained frozen on the hemispheres’ tips. The reason that the flinak adhered so well to the graphite was the fact that it was machined, and therefore had fine roughness on its surface. Flinak adheres to glassy carbon surfaces much less readily than to machined graphite. This observation points to the importance of developing processes to remove salt from the surfaces of pebbles after defueling from the PB-AHTR.

Pg. 29 of 38
Fig 5-8 Graphite hemispheres after the experiment, showing flinak droplets adhering and frozen to the bottoms of the spheres.
This experiment demonstrated that graphite’s friction coefficient can drop by over a factor of two in the presence of liquid fluoride salt at the PB-AHTR operating temperature. While the measurements were performed with flinak rather than flibe, the temperatures were adjusted to match the viscosities. These results suggest that the PB-AHTR will experience significantly less erosion damage and graphite dust generation compared to helium cooled pebble bed reactors. Additionally, these friction coefficients are relatively close to those measured for HDPE spheres sliding on acrylic, as are used in the PREX experiments. The results also have important implications regarding potential increases in operating temperature (pending material advances). Because the results did not show an increase in friction coefficient with temperature (some trials showed a slight decrease with temperature), raising the operating temperature would, from a purely frictional standpoint, not create any problems. Future experiments will be needed to measure friction coefficients for graphite pebbles lubricated by flibe, and to measure erosion and graphite dust generation rates for lubricated pebbles. But it can be concluded that liquid salt’s lubricity gives the PB-AHTR yet another advantage over conventional helium-cooled pebble bed reactors.

Pg. 30 of 38
6.0 CONCLUSIONS
This project involved a multi-disciplinary effort to design and analyze a new radially-zoned annular core design for the PB-AHTR. The Reactor Safety and Mechanical Design group collaborated with the Neutronics and Fuel Cycle group to assess design tradeoffs and reach an initial conceptual design.
The RSMD group used several tools (RELAP, COMSOL, and analytical solutions) to study the flow distribution and pressure loss in the reference annular core design. The group also constructed a scaled 15° sector of the annular core, and verified that radial pebble zoning can be achieved in an annular core. Finally, the group performed an experiment to measure the friction coefficient for graphite pebbles lubricated by fluoride salt, and confirmed that fluoride salts can be effective lubricants for high-temperature graphite.
Combined with the neutronic and depletion results obtained by the NFC group confirming the potential to reach conversion ratios greater than 1.0 with thorium, this work verifies the attractiveness of the annular PB-AHTR core design.

Pg. 31 of 38
7.0 REFERENCES
1.1) D. Caron, A. Cheng , T. Dhanania, C. Eastridge, K. Evans, T. Fei, M. Foxe, D. Johnson, E. Keldrauk, Z. Kline, A. Mai, J. Mintz, D. Ogata, E. Park, K. Pham, B. Reinhart, J. Rodriguez, M. Solom, T. Visnjic, C. Wootton, C. Zhao, C. Xu, “A Modular Pebble-Bed Advanced High Temperature Reactor,” NE-170 Senior Design Project, UC Berkeley Thermal Hydraulics Laboratory, Report UCBTH-08-001, May 16, 2008.
1.2) B. Frisbie, J. La Barba, F. Rangel, C. Schopke, V. Singh, and R. Stroberg, “Neutronic and Fuel Cycle Analysis for the Annular Pebble-Bed Advanced High Temperature Reactor,” 2009 NE 170 Senior Design Project, U.C. Berkeley, Report UCBTH09-002, May 19, 2009.
1.3) Per F. Peterson, “Review of the Pebble-Bed Advanced High Temperature Reactor.” Department of Nuclear Engineering, University of California, Berkeley, 2009.
3.1) RELAP5-3D© Code Manual, Volume I: Code Structures, System Models, and Solution Methods, INEEL-EXT-98-00834 (April 2005)
3.2) C. Galvez “Modeling and Simulation of the Laser Ignition Fission / Fusion Energy Systems (LIFE).” MS thesis University of California, Berkeley, 2006.
3.3) Morton M. Denn, Process Fluid Mechanics. Prentice Hall Ptr: Upper Saddle River, New Jersey, 1980
5.1) A.P. Semenov, Tribology at High Temperatures. Tribology International, Elsevier Science Ltd.: Great Britian, Vol 28, 1995.
5.2) H. Zaidi, D. Paulmier, and J. Lepage. The Influence of the Environment on the Friction and Wear of Graphitic Carbons. Applied Surface Science: North Holland,1989.
5.3) Luo Xiaowei, Yu Suyuan, Sheng Xuanyu, He Shuyan, The Influence of Roughness on Tribological Properties on Nuclear Grade Graphite. INET, Tsinghua University, Beijing: China, 2005.
5.4) X. Sheng, S. Yu, X. Luo, S. He, Wear Behavior of Graphite Studies in an Air-Conditioned Environment. Institute of Nuclear Energy Technology, Tsinghua University, Beijing: China, 2003.
5.5) Dong Jianling, Yu Suyuan, Concept of Pebble Bed Based HTGR with Fast Pebble Discharge System. INET, Tsinghua University, Beijing: China, 2004.
5.5) D.F. Williams, L.M. Toth, K.T. Clarno, Assessment of Candidate Molten Salt Coolants for the Advanced High Temperature Reactor. Oak Ridge National Laboratory, ORNL/TM-2006/12, March 2006.
5.6) D.F. Williams, Assessment of Candidate Molten Salt Coolants for the NGNP/NHI Intermediate Loop. Oak Ridge National Laboratory, ORNL/TM-2006/69, June 2006.

Pg. 32 of 38
Appendix A: RELAP5 Input Deck

Pg. 33 of 38

Pg. 34 of 38

Pg. 35 of 38

Pg. 36 of 38

Pg. 37 of 38
Appendix B: PREX-2 Experiment Operating Procedure
The insertion point on PREX-2 has been marked at different points that determine our loading procedure.
Figure B-1: Pebble Insertion Zone
Starting from the top, the first two lines are used to create a divider layer. The second line, the “FILL TO POINT” line is the line we generally try to stay above when defueling. The third line from the top indicates the end of the dividers. There needs to be pebbles above this line at all times, or else the free surface will allow initial pebble mixing causing experimental errors. The next line down is our “TAKE PHOTO” line. When the bottom of the divider layer hits this line, we take a picture, but we have moved to taking a picture after every defueling. The last line, “ADD DIVIDER LAYER, TAKE PHOTO” is when, as stated, a new divider layer is filled in at the top. As is seen in the above photo, the pebbles move at different rates in the insertion point; the larger layers on the left flow fast than the layers on the right. Therefore, when the bottom of the divider layer reaches the last line, we level the

Pg. 38 of 38
insertion pebbles to the best of our ability, bring the level down to the “FILL TO POINT” line, and add the divider layer of pebbles.
A spreadsheet showing one complete layer fill is shown in Table B-1.
Table B-1: One complete pebble layer
Each row shows the number of pebbles that will occupy the insertion region. The number of rows in the regular region dictate how many times defueling occurs before the divider layer is introduced.
The distances to each line in the insertion region are given in Table B-2.
Distance from top of insertion (cm) ± 0.32cm
To “DIVIDER LAYER” line 6.83
To “FILL TO POINT” line 13.65
To end of divider plates 18.73
To “TAKE PHOTO” line 28.73
To “ADD DIVIDER LAYER, TAKE PHOTO” line
43.81
Table B-2: Insertion Dimensions