reactor pressure vessel assessment - fanc - federaal...
TRANSCRIPT
Version 1
28 10 2015v.u. Electrabel nv, Simón Bolívarlaan 34, 1000 Brussel
SAFETY CASE 2015
Doel 3Reactor Pressure Vessel
Assessment
Version 1
This document is the property of Electrabel S.A. Any duplication or transmission to third parties is forbidden without prior written approval.
2
Contents
Contents ....................................................................................................................... 2
1 Summary ................................................................................................................ 51.1 Executive Summary .................................................................................................... 51.2 Context ....................................................................................................................... 71.3 Main Conclusions of the 2012 Safety Case Reports and their Addenda ...................... 71.4 Further Developments since the 2013 Restart – Action Plan ...................................... 91.5 Conclusions .............................................................................................................. 101.6 External and Independent Review ........................................................................... 11
2 Roadmap for the Midterm Action Plan ................................................................ 13
3 Hydrogen Flaking ................................................................................................. 153.1 Phenomenology of flaking ........................................................................................ 153.2 Characterization of hydrogen flakes ......................................................................... 16
4 Ultrasonic Inspection ........................................................................................... 204.1 Ultrasonic Testing Qualification ............................................................................... 21
4.1.1 UT Qualification Process..................................................................................... 224.1.2 Outcome of the UT Qualification Process ........................................................... 244.1.3 Conclusions ........................................................................................................ 25
4.2 Re-inspection ........................................................................................................... 264.2.1 Verification of the In-Service Stability of the Flakes ............................................ 274.2.2 Updated Flake Cartography ................................................................................ 274.2.3 Clad interface imperfections .............................................................................. 314.2.4 Conclusions ........................................................................................................ 31
4.3 Acoustic Emission Measurements ............................................................................ 32
5 Material Properties .............................................................................................. 335.1 Tested Materials....................................................................................................... 35
5.1.1 Material Types ................................................................................................... 355.1.2 Manufacturing Process....................................................................................... 365.1.3 Characterization of the Microstructures ............................................................. 38
5.2 Material Tests for SIA ............................................................................................... 435.2.1 Material Test Matrix........................................................................................... 435.2.2 Results under Non-Irradiated Conditions ............................................................ 465.2.3 Results under Irradiated Conditions ................................................................... 48
5.3 Additional Material Investigations ........................................................................... 585.3.1 Effect of Thermal Ageing on Zones of Macro-segregation ................................... 585.3.2 Large-Scale Tests ................................................................................................ 595.3.3 Assessment of the Impact of H Uptake from the primary side ............................ 60
5.4 Assessment of Atypical Embrittlement of VB395 ..................................................... 625.5 Material Properties Considered in the SIA ............................................................... 68
Version 1
This document is the property of Electrabel S.A. Any duplication or transmission to third parties is forbidden without prior written approval.
3
5.5.1 2012 Safety Case and Addendum ....................................................................... 685.5.2 2015 Safety Case ................................................................................................ 69
6 Structural Integrity Assessment ........................................................................... 736.1 ASME XI – Flaw Acceptability Assessment ................................................................ 76
6.1.1 Flaw modelling ................................................................................................... 786.1.2 Flaw grouping .................................................................................................... 796.1.3 Pressure and temperature loads ........................................................................ 806.1.4 Acceptable flaw size curves ................................................................................ 816.1.5 Flaw Screening ................................................................................................... 826.1.6 Refined Analysis ................................................................................................. 826.1.7 Crack driving forces ............................................................................................ 84
6.2 Fatigue Crack Growth Analysis ................................................................................. 876.3 ASME III – Primary Stress Re-evaluation .................................................................. 896.4 10CFR50 Appendix G and PTS Analyses .................................................................... 92
6.4.1 10CFR50 Appendix G – Fracture Toughness Requirements ................................. 926.4.2 Deterministic PTS Analysis.................................................................................. 93
6.5 Conservativeness ..................................................................................................... 936.5.1 Conservativeness regarding the input data......................................................... 956.5.2 Conservativeness regarding the Flaw Acceptability Assessment ......................... 976.5.3 Conservativeness highlighted by refined analyses .............................................. 986.5.4 Conservativeness of Fatigue Crack Growth Analysis ........................................... 986.5.5 Conservativeness of ASME III – Primary Stress Re-evaluation ............................. 99
6.6 Conclusions of the SIA ............................................................................................ 100
7 Sensitivity Studies .............................................................................................. 1017.1 Consideration of an Alternative DZ Sizing Procedure ............................................. 1017.2 Impact of the KS 02-based RTNDT Curve on the Margins of the SIA ......................... 1027.3 SIA Analysis with 2012 Methodology ..................................................................... 1047.4 Conclusions ............................................................................................................ 105
8 Conclusions ........................................................................................................ 1068.1 Detailed Conclusions from the Safety Case Roadmap ............................................ 1068.2 Conservativeness and Sensitivity Studies ............................................................... 1088.3 General Conclusion ................................................................................................ 108
9 List of Abbreviations .......................................................................................... 109

Version 1
This document is the property of Electrabel S.A. Any duplication or transmission to third parties is forbidden without prior written approval.
5SummarySafety Case 2015 Doel 3 RPV
1 Summary
1.1 Executive Summary
In 2012, indications were found inside the shell material of the Doel 3 and Tihange 2 reactorpressure vessels (RPVs). These gave rise to a series of examinations, tests and inspectionswith a clear outcome. It was demonstrated that these indications are hydrogen flakes andthat they do not affect the structural integrity of the RPVs (Doel 3 and Tihange 2), regardlessof the operating mode, transient or accident condition. An independent review team ofnational and international experts and academics confirmed the outcome.
The results of the investigations were synthesized in comprehensive Safety Case Reports,and submitted to the Federal Agency for Nuclear Control (FANC) in December 2012.
Midterm requirements
On 30 January 2013, the FANC provided Electrabel with a Provisional Evaluation Reportidentifying a number of remaining issues. Some had to be addressed before a potentialrestart in 2013 (short-term requirements); others could be treated after restart (midtermrequirements). In response to these short-term requirements, Electrabel submitted an actionplan that was approved by the FANC. Two addenda to the Safety Cases Reports weresubmitted in April 2013.
Based on the addenda, the FANC issued its Final Evaluation Report and authorized the restartof both units on 17 May 2013. Operation of the two units was resumed in June 2013. Anaction plan was set up and deployed to address the midterm requirements. The actionsaddressed three main topics:
• Ultrasonic (UT) inspection
• Material properties investigation
• Structural Integrity Assessment (SIA)
Unexpected test results
One of the midterm requirements is related to an irradiation programme on specimenscontaining hydrogen flakes. It aimed at confirming the conservativeness of the additionalshift in RTNDT of 50°C on irradiated materials used in the Safety Case Reports for structuralanalyses.
In March 2014, preliminary results of the tests on irradiated specimens extracted from theAREVA VB395 shell (which was rejected during the manufacturing process) showedunexpected results regarding the shift in RTNDT. In other words, the conservativeness of the50°C value considered in the Safety Case Reports could not be confirmed. As a precautionarymeasure, Electrabel decided to immediately stop operations at the Doel 3 and Tihange 2nuclear power plants (NPP).
Version 1
This document is the property of Electrabel S.A. Any duplication or transmission to third parties is forbidden without prior written approval.
6SummarySafety Case 2015 Doel 3 RPV
Action plan extended
In order to fully address this concern, the initial action plan was gradually extended takingfull benefit of the available materials (i.e. Doel 3 and Tihange 2 RPV forgings, VB395 andKS 02):
• New irradiation campaigns were performed and microstructural material investigationswere launched in order to assess the atypical embrittlement of the flake-affected materialVB395.
• Investigation on another reference material (KS 02) was resumed, after discovery of theexistence of a remaining block of this vessel material known to contain defects.
In addition, the extension of qualification process of the applied MIS-B UT inspectionprocedure led to an update of the sizing methodology and to the choice of new inspectionsettings, in order to achieve a high confidence level in detection and sizing. This led to acomplete characterization of the hydrogen flakes (inclination and faceting) and an updatedcartography of the flakes as well as a decision to reassess the structural integrity of the RPV.
Within the framework of this updated action plan, it was also decided to implement amodification in the Doel 3 unit, i.e. a permanent heating of the water of the Safety InjectionSystem (SI) above 40°C, in order to reduce the thermal stresses in the inner part of thevessel wall.
Safety Case completed
The present document gives a structured and complete answer to each of the FANC’smidterm requirements for the Doel 3 RPV. It also provides the results and conclusions ofadditional analyses, tests, and inspections that were performed to complement the SafetyCase. The results of these complementary tests and analyses lead to the followingconclusions:
• Hydrogen flakes are fully characterized and have a laminar orientation.
• Qualified UT inspection procedure achieves high performance in detection and sizing.
• Re-inspection of the vessel shells delivers a complete cartography of the indications andconfirms that the flakes are stable.
• Conservative material properties are derived for use in the SIA.
• Structural integrity of the RPV is demonstrated with large safety margins, and has neverbeen a concern during the whole operation of the plant since commissioning.
Based on all of these inspections, additional tests and detailed analyses, Electrabel isconvinced that the structural integrity of the Doel 3 RPV has been demonstrated and that allsafety requirements are met. Therefore, Electrabel considers that the Doel 3 NPP can besafely restarted with no need for further action.
At the end of the next fuel cycle a follow-up inspection of the RPV will be performed with thequalified UT inspection procedure.
Version 1
This document is the property of Electrabel S.A. Any duplication or transmission to third parties is forbidden without prior written approval.
7SummarySafety Case 2015 Doel 3 RPV
1.2 Context
During the 2012 outage at the Doel 3 nuclear power plant (NPP), specific ultrasonic (UT) in-service inspections were performed to check for underclad cracking in the reactor pressurevessel (RPV). No underclad defects were found. However, a large number of nearly laminarindications were detected, mainly in the lower and upper core shells. A second inspection wasperformed with UT probes to inspect the entire thickness of the vessel. This inspectionidentified the same type of nearly laminar indications deeper in the material. A similarinspection performed in September 2012 at the Tihange 2 NPP showed similar indications, butto a lesser extent.
As a consequence, the Doel 3 and Tihange 2 NPPs remained core unloaded until proven thatthey can be safely operated.
Based on the findings of the in-service inspections, the manufacturing documentation review,and their vast experience with heavy forging manufacturing, the AREVA metallurgy expertscame to the preliminary conclusion that hydrogen flaking in the macro-segregation zone of theshells was the most likely cause of the indications and that they had originated during themanufacturing of the reactor shells. Hydrogen flaking is a known metallurgical phenomenonthat may occur during the casting and forging process and causes flaws in steel under specificcircumstances. This diagnosis triggered the development of a roadmap to confirm hydrogenflaking as the most likely cause and assess the structural integrity of the Doel 3 and Tihange 2RPVs.
Therefore a Safety Case (a case per unit) for requesting their restart has been prepared by theoperator, Electrabel, and submitted to the Federal Agency for Nuclear Control (FANC) on 5December 2012.
The FANC issued in January 2013 a Provisional Evaluation Report on the Safety Cases,identifying some remaining open issues. Some had to be addressed before a potential restart in2013 (short-term requirements), the others could be treated after restart (midtermrequirements). In response to these requirements, Electrabel submitted an Action Plan that wasapproved by the FANC.
In answer to the short-term requirements of the FANC, two Addenda to the Safety CasesReports were submitted in April 2013. Based on both Addenda, the FANC issued its FinalEvaluation Report and authorized the restart of both units on 17 May 2013. Operation of thetwo units was resumed in June 2013.
1.3 Main Conclusions of the 2012 SafetyCase Reports and their Addenda
The diagnosis of hydrogen flaking, initiated during manufacturing in macro-segregated areas (inparticular in ghost lines at manganese sulphide inclusions) was confirmed after thoroughinvestigation, based on a root cause analysis of all potential causes. It was also concluded thatthe identified indications were stable.
Version 1
This document is the property of Electrabel S.A. Any duplication or transmission to third parties is forbidden without prior written approval.
8SummarySafety Case 2015 Doel 3 RPV
Not all forged components of the Doel 3 and Tihange 2 RPVs contain the same amount ofhydrogen flakes. They were obtained from different sizes of ingots and with differentcombinations of sulphur and hydrogen content. Analysis of these characteristics revealed agood correlation with the amount of flakes found in each forged component.
A close review of all of the original manufacturing data and documentation confirmed that boththe Doel 3 and Tihange 2 RPVs were manufactured in accordance with the prevailinginternational codes and standards, in particular the ASME Boiler & Pressure Vessel Code.
In 2012, the Doel 3 and Tihange 2 RPVs were subjected to ultrasonic inspection using theautomated MIS-B (Machine d’Inspection en Service Belge) equipment, which has been used forover thirty years to inspect the RPVs of all Belgian units. The testing programme demonstratedthat the applied inspection technique is valid and appropriate for characterizing the quasi-laminar indications found in the Doel 3 and Tihange 2 RPVs.
A comprehensive testing programme was launched in addition to a material-related literaturesurvey. Many mechanical and metallurgical tests were performed on archived non-irradiatedmaterials, including a piece of 1.2m diameter originating from the Doel 3 vessel itself (D3H1nozzle shell cut-out), and on the rejected AREVA shell VB395 known to contain hydrogen flakes.These tests showed that there is no significant effect of orientation or macro-segregation onfracture toughness. All results confirmed that the curves required by the ASME code in theassessment are conservative. The destructive tests performed on steel samples containinghydrogen flakes also showed that the material between and around the flaws is sound and hasa similar microstructure as in absence of flaws.
Complementary tests performed on the D3H1 nozzle shell cut-out showed that the ghost lineshave no significant effect on the Charpy impact test results or fracture toughness properties.
Additional tests on the VB395 material containing hydrogen flakes confirmed the limited effectof hydrogen flaking on the material properties. The ductility of the material in the ligamentsbetween flakes is similar to the ductility of the material that is free of flakes. Large-scale testson material containing flakes confirmed the good ductility and load bearing capacity. Thefracture toughness of the ligaments between flakes is only slightly lower as compared to theflake-free material. This is confirmed through tests on specimens with a flake as crack tip.
Detailed methodologies were developed and validated for assessing the structural behaviour ofeach flaw that is detected in the vessel shells, in all possible operational modes and transients,as well as to assess general stresses in the vessel. Based on these methodologies, calculationswere made using state-of-the-art modelling and computing techniques, in order to verify theapplicable structural integrity requirements. The calculations confirmed that the acceptancecriteria of the deterministic studies are met with a significant safety margin. The suitability andconservativeness of the SIA was validated through large-scale tensile and bending tests onmaterial containing flakes.
Finally, a load test performed at a pressure slightly above the design pressure of the RPV didnot reveal any unexpected condition nor induce any flaw evolution.
Version 1
This document is the property of Electrabel S.A. Any duplication or transmission to third parties is forbidden without prior written approval.
9SummarySafety Case 2015 Doel 3 RPV
1.4 Further Developments since the2013 Restart – Action Plan
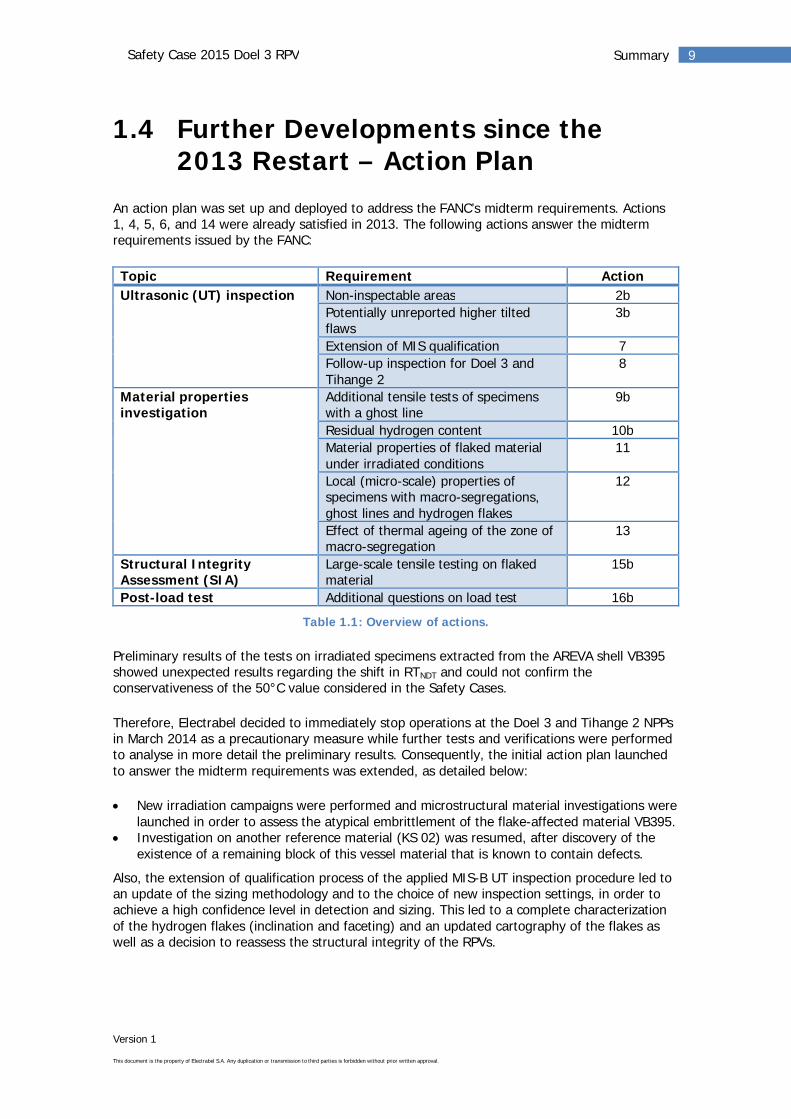
An action plan was set up and deployed to address the FANC’s midterm requirements. Actions1, 4, 5, 6, and 14 were already satisfied in 2013. The following actions answer the midtermrequirements issued by the FANC:
Topic Requirement ActionUltrasonic (UT) inspection Non-inspectable areas 2b
Potentially unreported higher tiltedflaws
3b
Extension of MIS qualification 7Follow-up inspection for Doel 3 andTihange 2
8
Material propertiesinvestigation
Additional tensile tests of specimenswith a ghost line
9b
Residual hydrogen content 10bMaterial properties of flaked materialunder irradiated conditions
11
Local (micro-scale) properties ofspecimens with macro-segregations,ghost lines and hydrogen flakes
12
Effect of thermal ageing of the zone ofmacro-segregation
13
Structural IntegrityAssessment (SIA)
Large-scale tensile testing on flakedmaterial
15b
Post-load test Additional questions on load test 16b
Table 1.1: Overview of actions.
Preliminary results of the tests on irradiated specimens extracted from the AREVA shell VB395showed unexpected results regarding the shift in RTNDT and could not confirm theconservativeness of the 50°C value considered in the Safety Cases.
Therefore, Electrabel decided to immediately stop operations at the Doel 3 and Tihange 2 NPPsin March 2014 as a precautionary measure while further tests and verifications were performedto analyse in more detail the preliminary results. Consequently, the initial action plan launchedto answer the midterm requirements was extended, as detailed below:
New irradiation campaigns were performed and microstructural material investigations werelaunched in order to assess the atypical embrittlement of the flake-affected material VB395.Investigation on another reference material (KS 02) was resumed, after discovery of theexistence of a remaining block of this vessel material that is known to contain defects.
Also, the extension of qualification process of the applied MIS-B UT inspection procedure led toan update of the sizing methodology and to the choice of new inspection settings, in order toachieve a high confidence level in detection and sizing. This led to a complete characterizationof the hydrogen flakes (inclination and faceting) and an updated cartography of the flakes aswell as a decision to reassess the structural integrity of the RPVs.
Version 1
This document is the property of Electrabel S.A. Any duplication or transmission to third parties is forbidden without prior written approval.
10SummarySafety Case 2015 Doel 3 RPV
Within the framework of this updated action plan, it was also decided to implement amodification in the Doel 3 unit, i.e. a permanent heating of the water of the Safety InjectionSystem (SI) above 40°C, in order to reduce the thermal stresses in the inner part of the vesselwall.
In September 2014, the FANC set up a group of Belgian and foreign scientists, the InternationalReview Board (IRB), in order to consolidate the regulatory body's analysis of the results of themechanical resistance tests and the finding on materials performed within the framework of thisextended action plan. The IRB held a Workshop in November 2014 and formulated a set ofcomments and questions that were included in a set of Recommendations and Suggestions thatthe FANC addressed to Electrabel in December 2014.The action plan was updated accordingly,to address these recommendations and suggestions.
The action plan is now completed and an answer was given to all of the requirements andsuggestions formulated by the FANC with the goal to confirm the structural integrity of thereactor pressure vessels (RPVs).
1.5 Conclusions
Electrabel is convinced of having demonstrated that the structural integrity of the Doel 3 RPV isfully maintained, under all operating and accidental conditions. The SIA has provided evidenceof the harmless character of all detected flaws in the RPV. This allows for a safe restart andoperation of the Doel 3 NPP with no need for further action.
The Safety Case roadmap with its extensive phase of studies and material tests has led to thefollowing results and conclusions (see Chapter 8 for more details):
Phenomenology of flaking is independent of the level of segregation in the materialHydrogen flakes are fully characterized and have a laminar orientation.Qualified UT inspection procedure achieves high performance in detection and sizing.Re-inspection of the vessel shells delivers a complete cartography of the indications andconfirms that the flakes are stable.Conservative material properties are derived for use in the SIA.Structural integrity of the RPV is demonstrated with large safety margins, and has neverbeen a concern during the whole operation of the plant since commissioning.
To ensure a high confidence in its conclusions, each step of the Safety Case has been takenfrom a very conservative approach. This conservativeness leads to the existence of additionalmargins between the assessments and reality.
At the end of the next fuel cycle a follow-up inspection of the RPV will be performed with thequalified UT inspection procedure.
Version 1
This document is the property of Electrabel S.A. Any duplication or transmission to third parties is forbidden without prior written approval.
11SummarySafety Case 2015 Doel 3 RPV
1.6 External and Independent Review
Due to the complexity of the issue, the licence holder Electrabel decided to install amultidisciplinary project team. This team consisted of experts from:
Electrabel: the license holder with expertise in nuclear operations and safetyLaborelec: knowhow in non-destructive testing techniques and material propertiesTractebel Engineering: specialized knowledge of nuclear engineering and design as well asstructural integrity, materials, and safety
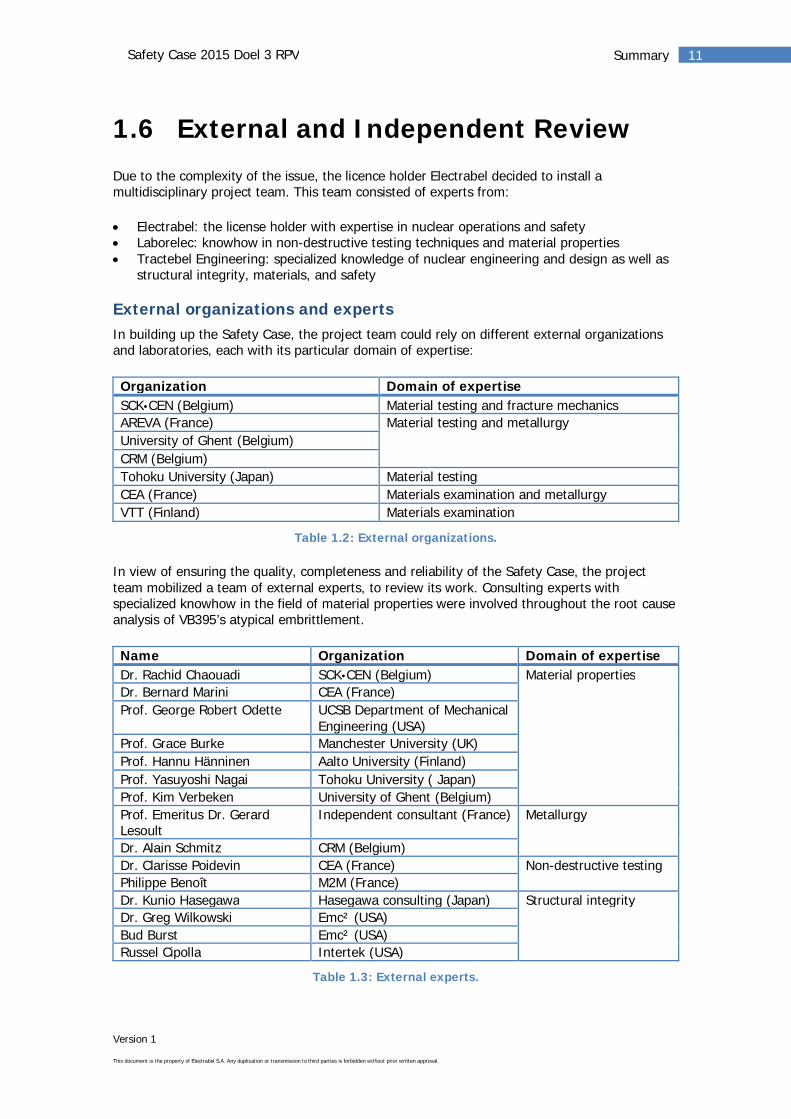
External organizations and expertsIn building up the Safety Case, the project team could rely on different external organizationsand laboratories, each with its particular domain of expertise:
Organization Domain of expertiseSCK•CEN (Belgium) Material testing and fracture mechanicsAREVA (France) Material testing and metallurgyUniversity of Ghent (Belgium)CRM (Belgium)Tohoku University (Japan) Material testingCEA (France) Materials examination and metallurgyVTT (Finland) Materials examination
Table 1.2: External organizations.
In view of ensuring the quality, completeness and reliability of the Safety Case, the projectteam mobilized a team of external experts, to review its work. Consulting experts withspecialized knowhow in the field of material properties were involved throughout the root causeanalysis of VB395’s atypical embrittlement.
Name Organization Domain of expertiseDr. Rachid Chaouadi SCK•CEN (Belgium) Material propertiesDr. Bernard Marini CEA (France)Prof. George Robert Odette UCSB Department of Mechanical
Engineering (USA)Prof. Grace Burke Manchester University (UK)Prof. Hannu Hänninen Aalto University (Finland)Prof. Yasuyoshi Nagai Tohoku University ( Japan)Prof. Kim Verbeken University of Ghent (Belgium)Prof. Emeritus Dr. GerardLesoult
Independent consultant (France) Metallurgy
Dr. Alain Schmitz CRM (Belgium)Dr. Clarisse Poidevin CEA (France) Non-destructive testingPhilippe Benoît M2M (France)Dr. Kunio Hasegawa Hasegawa consulting (Japan) Structural integrityDr. Greg Wilkowski Emc² (USA)Bud Burst Emc² (USA)Russel Cipolla Intertek (USA)
Table 1.3: External experts.
Version 1
This document is the property of Electrabel S.A. Any duplication or transmission to third parties is forbidden without prior written approval.
12SummarySafety Case 2015 Doel 3 RPV
Independent Analysis and ReviewOne of the requests formulated by the FANC involves an independent analysis and review byElectrabel’s Service de Contrôle Physique (SCP). They relied upon a panel of externalinternational academics and experts such as Sandia National Laboratories (US Department ofEnergy) as well as its own resources (both on corporate and site level).
Although it will be issued in a separate report, this independent review is part of the SafetyCase File and will be presented to the Belgian Safety Authorities.
Version 1
This document is the property of Electrabel S.A. Any duplication or transmission to third parties is forbidden without prior written approval.
13Roadmap for the Midterm Action PlanSafety Case 2015 Doel 3 RPV
2 Roadmap for the MidtermAction Plan
The Final Evaluation Report issued by the FANC on May 2013 contains a set of midtermrequirements to be fulfilled before restart after the next scheduled outage. During thedeployment of the corresponding action plan, several events led to the re-orientation andextension of this roadmap, as the initial conditions (flaw population and material properties)were no longer valid. The roadmap was consequently completed through an updated SIA,primarily based on the methodologies that were developed and validated for the initial SafetyCases. The roadmap incorporated the actions subsequent to the International Review Board(IRB) workshop that specifically addressed materials issues.
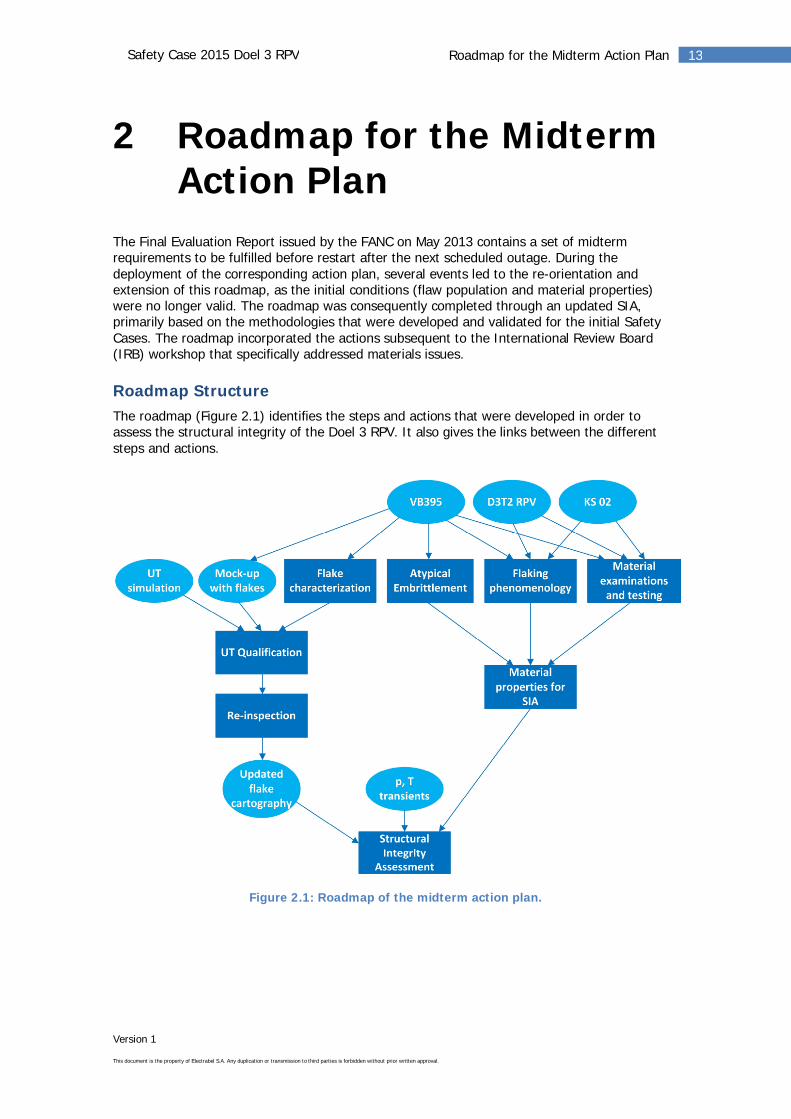
Roadmap StructureThe roadmap (Figure 2.1) identifies the steps and actions that were developed in order toassess the structural integrity of the Doel 3 RPV. It also gives the links between the differentsteps and actions.
Figure 2.1: Roadmap of the midterm action plan.
Version 1
This document is the property of Electrabel S.A. Any duplication or transmission to third parties is forbidden without prior written approval.
14Roadmap for the Midterm Action PlanSafety Case 2015 Doel 3 RPV
The left-hand side of this roadmap includes the following successive steps:
Characterization of the hydrogen flakes (orientation and faceting)Qualification of the applied UT inspection methodology in order to achieve a very high levelof confidence regarding the detection and characterization of the indicationsInspection of the RPV using the qualified procedure in order to assess the possibleevolution of the indications between successive inspections and the determination of theindications’ cartography in the RPV shell
The right-hand side of the roadmap concerns the materials aspects and includes the followingsteps:
Investigations of the different materials (VB395, Doel 3 and Tihange 2 RPV forgings andKS 02) used in the test programme, with evaluation of their basic properties and suitability,for determination of material properties of the Doel 3 RPV.Material tests, with presentation and discussion of the test results in non-irradiated andirradiated conditions.Assessment of the atypical embrittlement of the VB395 material.Characterization of the flaking phenomenologyDetermination of material properties to be used for SIA.
The roadmap ends with the performance of the SIA, based on the findings from the two sidesin the roadmap, as well as on the RPV’s geometric data and the pressure/temperature (p, T)loadings on the RPV wall. The structural integrity of the Doel 3 RPV is proven based on thesatisfaction of the acceptance criteria, the conservativeness of the methodology and theassumptions, and the existing safety margins.
Version 1
This document is the property of Electrabel S.A. Any duplication or transmission to third parties is forbidden without prior written approval.
15Hydrogen FlakingSafety Case 2015 Doel 3 RPV
3 Hydrogen Flaking
3.1 Phenomenology of flaking
The concern was raised that the high number of flakes found in some areas of the RPV shellscould be correlated with a high level of chemical enrichment inside the macro-segregation inthose areas. A complementary evaluation of the level of segregation of the Doel 3 andTihange 2 RPV forgings showed that no such correlation exists.
ContextThe Safety Case Report and the Addendum confirm that the indications in the RPV shell can beassociated with a zone of macro-segregations that is the result of complex mechanismsoccurring during solidification of the ingot during fabrication. Moreover, the flaws are situated invery specific locations: the so-called ‘ghost lines’, which correspond to the residual features ofthe ingot after forging.In addition, the Addendum explains why not all forged components of the Doel 3 and Tihange 2RPVs contain the same amount of hydrogen flakes. Based on an analysis of the ingot size andthe combined sulphur and hydrogen content, the forgings were ranked according to theirsusceptibility to hydrogen flaking. This revealed a good correlation with the amount of flakesfound in each forged component.During the discussion of the Safety Case Report, the concern was raised that the high density offlakes found in some macro-segregated areas of the RPV shells could be correlated with a highlevel of chemical enrichment inside those areas. If so, this would have to be considered whenassuming initial fracture toughness values for those zones.
ApproachThe level of segregation of the Doel 3 and Tihange 2 RPV forgings was evaluated through anempirical formula developed on the bases of examinations performed on a large number ofconventional ingots. This formula gives the level of carbon enrichment in the final forging as afunction of its average chemical composition. Since enrichment in other alloying elements isproportional to the carbon enrichment, the latter is thus a good indicator for the enrichmentlevel of segregations. In order to validate the formula, the predicted enrichment for the nozzleshells of Doel 3 and Tihange 2 was compared to carbon enrichments levels measured on therespective D3H1 and T2H2 cut-outs from those shells. And for all forgings, the predictedsegregation levels were compared to the observed numbers of hydrogen flakes.
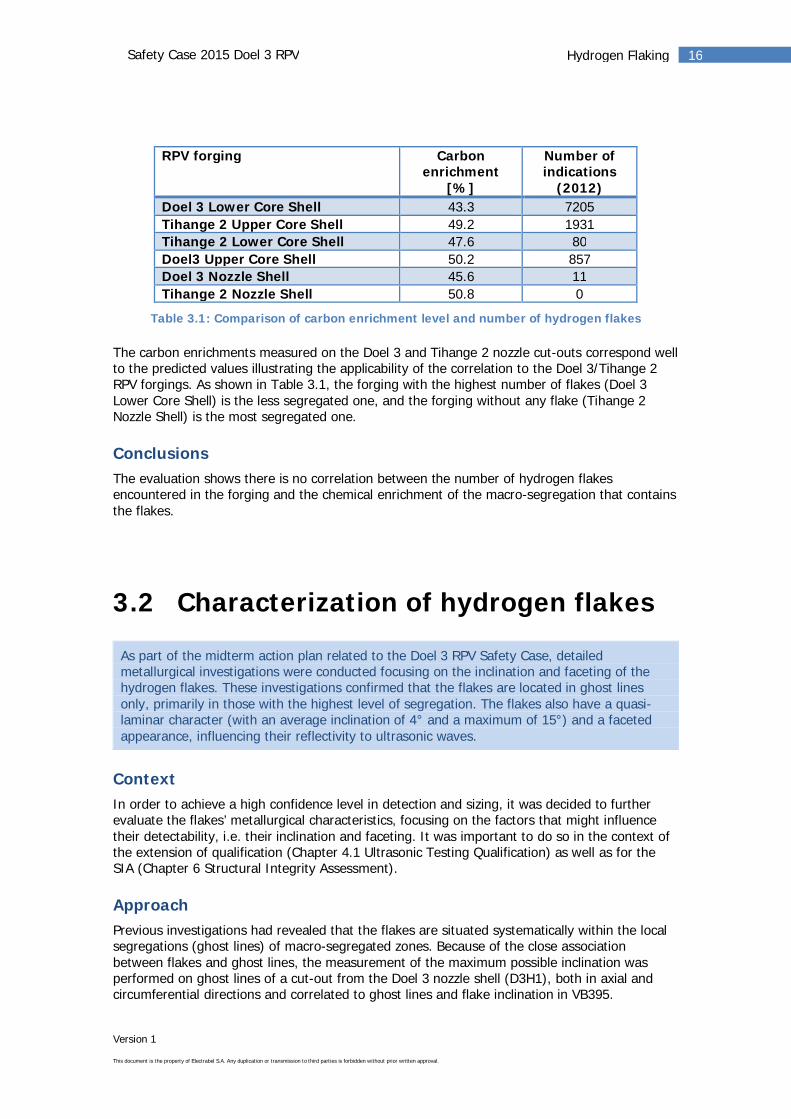
ResultsThe predicted carbon enrichment levels for the Doel 3 and Tihange 2 RPV forgings are given inTable 3.1. The enrichment is expressed as the ratio between the difference between themaximum and minimum carbon content encountered in the final forging, and the averagecarbon content of the ladle.
Version 1
This document is the property of Electrabel S.A. Any duplication or transmission to third parties is forbidden without prior written approval.
16Hydrogen FlakingSafety Case 2015 Doel 3 RPV
RPV forging Carbonenrichment
[%]
Number ofindications
(2012)Doel 3 Lower Core Shell 43.3 7205Tihange 2 Upper Core Shell 49.2 1931Tihange 2 Lower Core Shell 47.6 80Doel3 Upper Core Shell 50.2 857Doel 3 Nozzle Shell 45.6 11Tihange 2 Nozzle Shell 50.8 0
Table 3.1: Comparison of carbon enrichment level and number of hydrogen flakes
The carbon enrichments measured on the Doel 3 and Tihange 2 nozzle cut-outs correspond wellto the predicted values illustrating the applicability of the correlation to the Doel 3/Tihange 2RPV forgings. As shown in Table 3.1, the forging with the highest number of flakes (Doel 3Lower Core Shell) is the less segregated one, and the forging without any flake (Tihange 2Nozzle Shell) is the most segregated one.
ConclusionsThe evaluation shows there is no correlation between the number of hydrogen flakesencountered in the forging and the chemical enrichment of the macro-segregation that containsthe flakes.
3.2 Characterization of hydrogen flakes
As part of the midterm action plan related to the Doel 3 RPV Safety Case, detailedmetallurgical investigations were conducted focusing on the inclination and faceting of thehydrogen flakes. These investigations confirmed that the flakes are located in ghost linesonly, primarily in those with the highest level of segregation. The flakes also have a quasi-laminar character (with an average inclination of 4° and a maximum of 15°) and a facetedappearance, influencing their reflectivity to ultrasonic waves.
ContextIn order to achieve a high confidence level in detection and sizing, it was decided to furtherevaluate the flakes’ metallurgical characteristics, focusing on the factors that might influencetheir detectability, i.e. their inclination and faceting. It was important to do so in the context ofthe extension of qualification (Chapter 4.1 Ultrasonic Testing Qualification) as well as for theSIA (Chapter 6 Structural Integrity Assessment).
ApproachPrevious investigations had revealed that the flakes are situated systematically within the localsegregations (ghost lines) of macro-segregated zones. Because of the close associationbetween flakes and ghost lines, the measurement of the maximum possible inclination wasperformed on ghost lines of a cut-out from the Doel 3 nozzle shell (D3H1), both in axial andcircumferential directions and correlated to ghost lines and flake inclination in VB395.
Version 1
This document is the property of Electrabel S.A. Any duplication or transmission to third parties is forbidden without prior written approval.
17Hydrogen FlakingSafety Case 2015 Doel 3 RPV
The inclination and faceting of the flakes was evaluated by examination of the profile of severalflakes on metallographic samples from two test blocks from the AREVA VB395 shell (VB395/1and VB395/2), both in axial and circumferential directions. The inclination of ghost lines wasinvestigated using the same specimens as well as the cut-out D3H1. To get a statistically validevaluation, the measurements were performed on more than 30 ghost lines per test block. Thetest matrix is presented in Table 3.2.
Test block Flake inclination Detailed profile offlakes
Ghost line inclination
Axialdirection
Circumferentialdirection
Axialdirection
Circumferentialdirection
Axialdirection
Circumferentialdirection
VB395/1 46 25 18 11 192 34VB395/2 43 38 5 / 156 113D3H1 N.A. N.A. N.A. N.A. 62 58
Table 3.2: Test matrix with the number of measurements per test block, for each type ofanalysis.
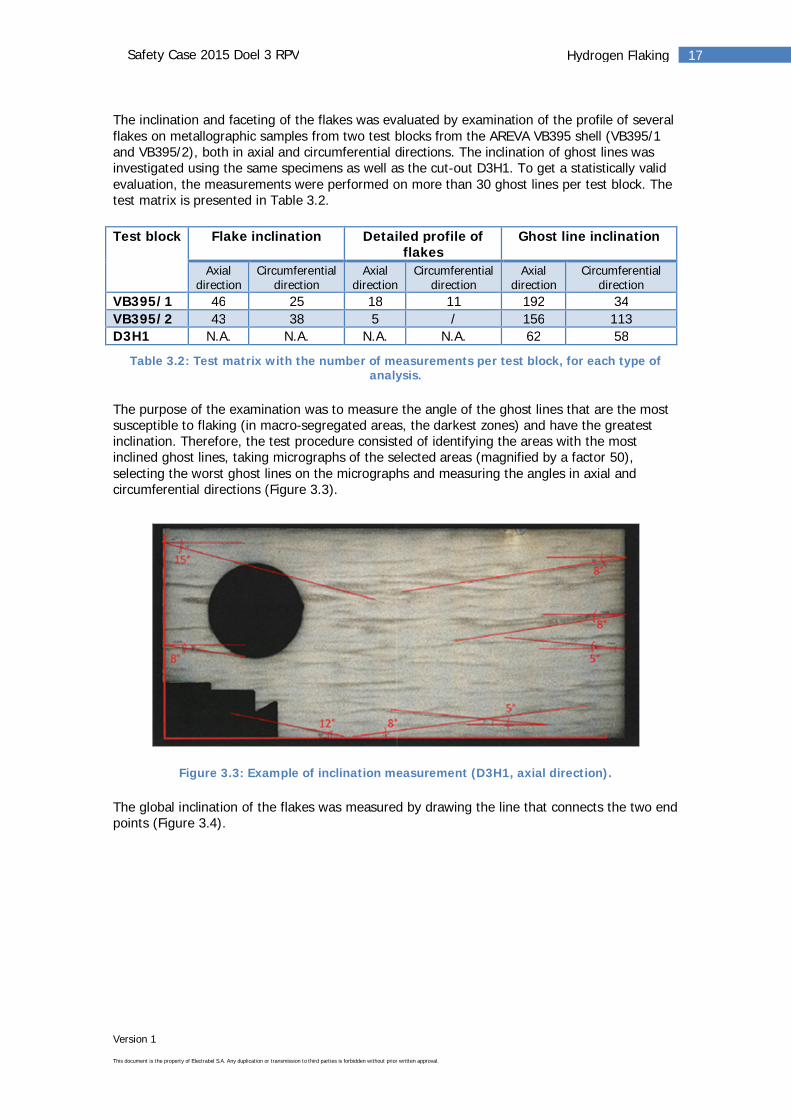
The purpose of the examination was to measure the angle of the ghost lines that are the mostsusceptible to flaking (in macro-segregated areas, the darkest zones) and have the greatestinclination. Therefore, the test procedure consisted of identifying the areas with the mostinclined ghost lines, taking micrographs of the selected areas (magnified by a factor 50),selecting the worst ghost lines on the micrographs and measuring the angles in axial andcircumferential directions (Figure 3.3).
Figure 3.3: Example of inclination measurement (D3H1, axial direction).
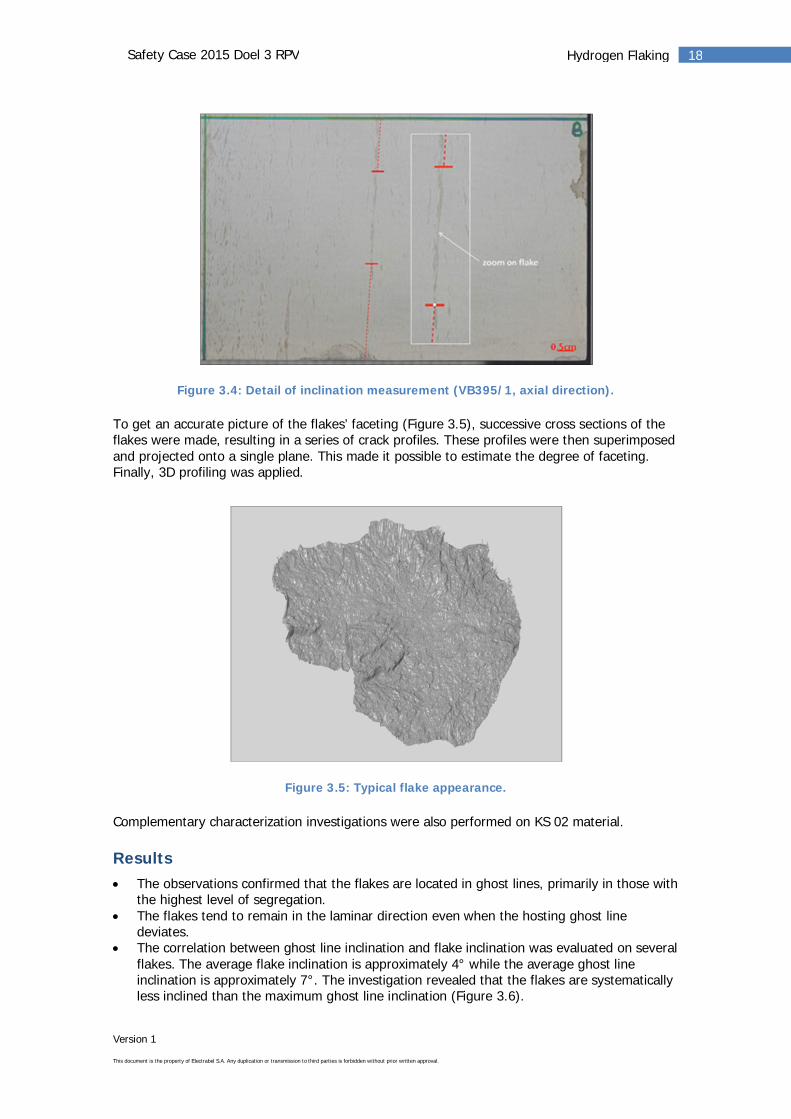
The global inclination of the flakes was measured by drawing the line that connects the two endpoints (Figure 3.4).
Version 1
This document is the property of Electrabel S.A. Any duplication or transmission to third parties is forbidden without prior written approval.
18Hydrogen FlakingSafety Case 2015 Doel 3 RPV
Figure 3.4: Detail of inclination measurement (VB395/1, axial direction).
To get an accurate picture of the flakes’ faceting (Figure 3.5), successive cross sections of theflakes were made, resulting in a series of crack profiles. These profiles were then superimposedand projected onto a single plane. This made it possible to estimate the degree of faceting.Finally, 3D profiling was applied.
Figure 3.5: Typical flake appearance.
Complementary characterization investigations were also performed on KS 02 material.
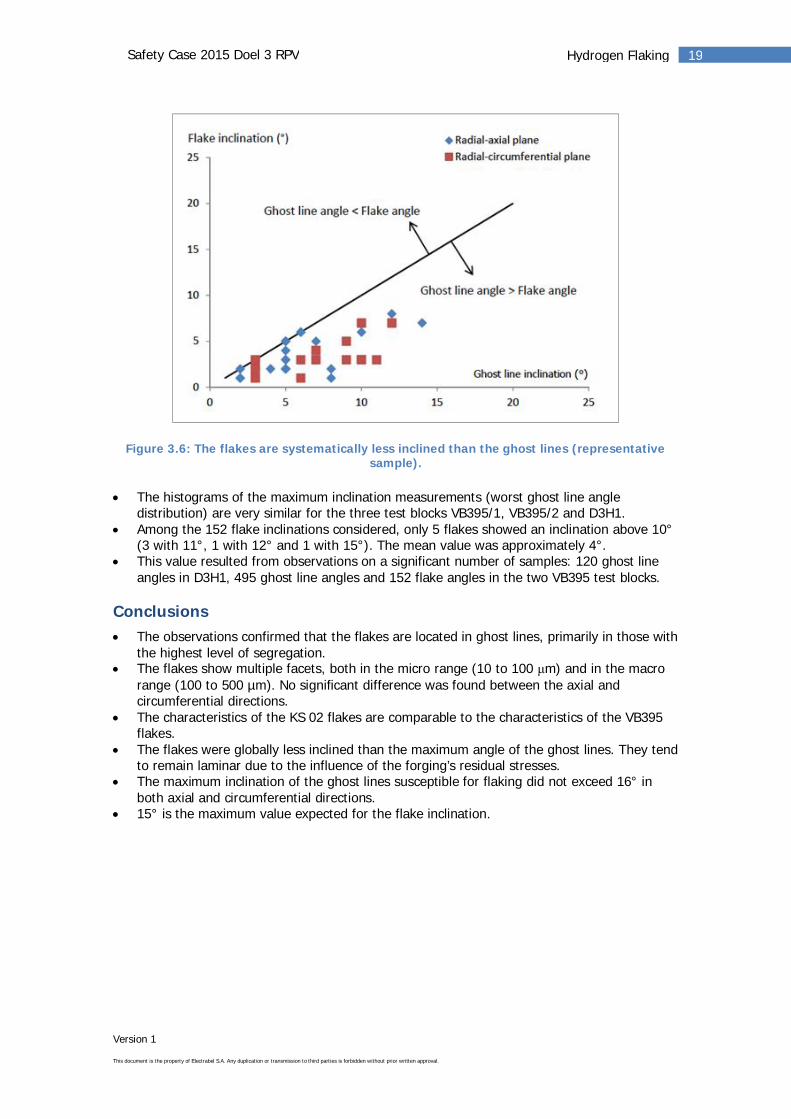
ResultsThe observations confirmed that the flakes are located in ghost lines, primarily in those withthe highest level of segregation.The flakes tend to remain in the laminar direction even when the hosting ghost linedeviates.The correlation between ghost line inclination and flake inclination was evaluated on severalflakes. The average flake inclination is approximately 4° while the average ghost lineinclination is approximately 7°. The investigation revealed that the flakes are systematicallyless inclined than the maximum ghost line inclination (Figure 3.6).
Version 1
This document is the property of Electrabel S.A. Any duplication or transmission to third parties is forbidden without prior written approval.
19Hydrogen FlakingSafety Case 2015 Doel 3 RPV
Figure 3.6: The flakes are systematically less inclined than the ghost lines (representativesample).
The histograms of the maximum inclination measurements (worst ghost line angledistribution) are very similar for the three test blocks VB395/1, VB395/2 and D3H1.Among the 152 flake inclinations considered, only 5 flakes showed an inclination above 10°(3 with 11°, 1 with 12° and 1 with 15°). The mean value was approximately 4°.This value resulted from observations on a significant number of samples: 120 ghost lineangles in D3H1, 495 ghost line angles and 152 flake angles in the two VB395 test blocks.
ConclusionsThe observations confirmed that the flakes are located in ghost lines, primarily in those withthe highest level of segregation.The flakes show multiple facets, both in the micro range (10 to 100 m) and in the macrorange (100 to 500 µm). No significant difference was found between the axial andcircumferential directions.The characteristics of the KS 02 flakes are comparable to the characteristics of the VB395flakes.The flakes were globally less inclined than the maximum angle of the ghost lines. They tendto remain laminar due to the influence of the forging’s residual stresses.The maximum inclination of the ghost lines susceptible for flaking did not exceed 16° inboth axial and circumferential directions.15° is the maximum value expected for the flake inclination.
Version 1
This document is the property of Electrabel S.A. Any duplication or transmission to third parties is forbidden without prior written approval.
20Ultrasonic InspectionSafety Case 2015 Doel 3 RPV
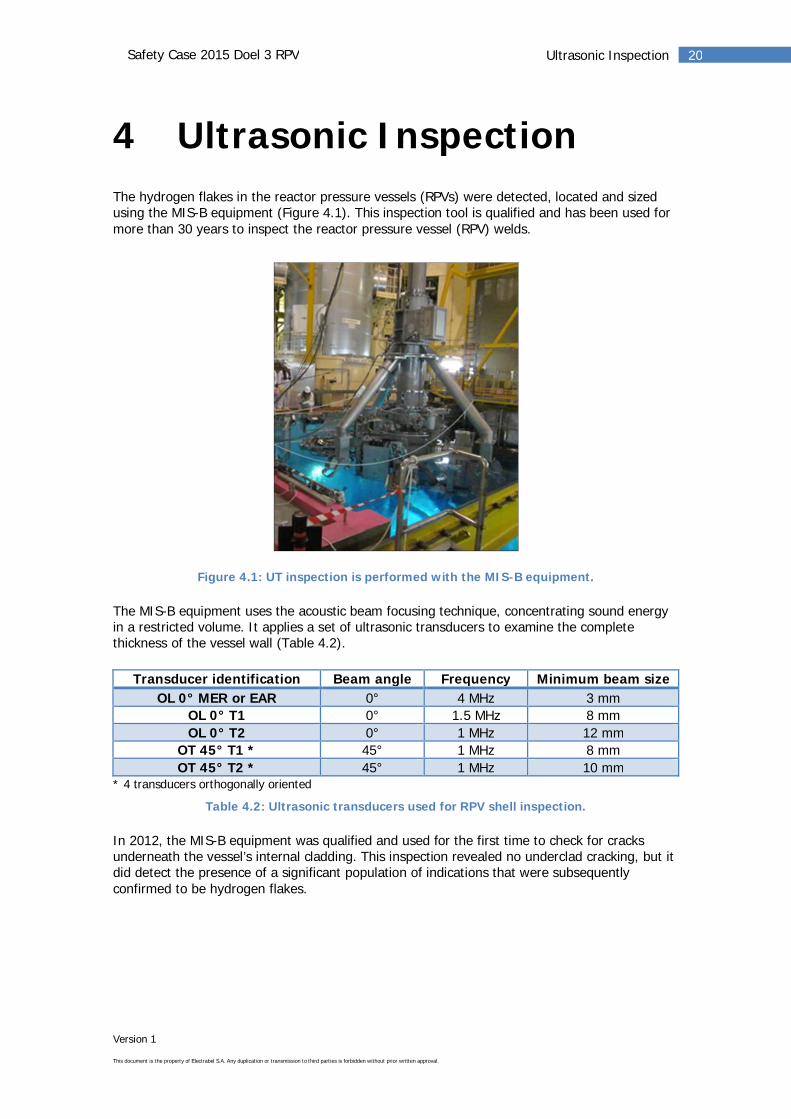
4 Ultrasonic InspectionThe hydrogen flakes in the reactor pressure vessels (RPVs) were detected, located and sizedusing the MIS-B equipment (Figure 4.1). This inspection tool is qualified and has been used formore than 30 years to inspect the reactor pressure vessel (RPV) welds.
Figure 4.1: UT inspection is performed with the MIS-B equipment.
The MIS-B equipment uses the acoustic beam focusing technique, concentrating sound energyin a restricted volume. It applies a set of ultrasonic transducers to examine the completethickness of the vessel wall (Table 4.2).
Transducer identification Beam angle Frequency Minimum beam sizeOL 0° MER or EAR 0° 4 MHz 3 mm
OL 0° T1 0° 1.5 MHz 8 mmOL 0° T2 0° 1 MHz 12 mm
OT 45° T1 * 45° 1 MHz 8 mmOT 45° T2 * 45° 1 MHz 10 mm
* 4 transducers orthogonally oriented
Table 4.2: Ultrasonic transducers used for RPV shell inspection.
In 2012, the MIS-B equipment was qualified and used for the first time to check for cracksunderneath the vessel’s internal cladding. This inspection revealed no underclad cracking, but itdid detect the presence of a significant population of indications that were subsequentlyconfirmed to be hydrogen flakes.
Version 1
This document is the property of Electrabel S.A. Any duplication or transmission to third parties is forbidden without prior written approval.
21Ultrasonic InspectionSafety Case 2015 Doel 3 RPV
4.1 Ultrasonic Testing Qualification
One of the midterm actions (Action 7) to be performed after the plant’s restart in 2013focused on the formal extension of qualification of the MIS-B UT inspection procedure for thedetection and sizing of hydrogen flakes. This qualification process has demonstrated that theUT inspection procedure is capable of achieving a very high confidence level. All necessaryparameters have been identified for performing a robust and reliable detection, localizationand characterization of hydrogen flakes in RPVs.
The validation of the MIS-B technique was explained in detail in the 2012 RPV Safety CaseReport.
RequirementsRegarding this validation, the AIA (Authorized Inspection Agency) requested additionalvalidation of the UT simulations. The main action regarding UT inspection aimed to achieve theformal extension of qualification of the MIS-B technique for detection, localization andcharacterization of hydrogen flakes. The FANC expressed the qualification requirement asfollows (Action 7):
The licensee shall achieve a full qualification program to demonstrate the suitabilityof the in-service inspection technique for the present case. The qualification shallgive sufficient confidence in the accuracy of the results with respect to the numberand features (location, size, orientation...) of the flaw indications. Whereappropriate, the process shall be substantiated by appropriate experimental datausing representative specimens. The full qualification program shall be achievedbefore the next planned outage for refuelling.
The objective of the extension of qualification is to ensure that the inspection procedurecorrectly and accurately detects, locates and sizes hydrogen flakes. The objective was to reacha very high confidence level, even for flakes inclined up to 16°, what is more than themaximum predicted inclination of the flakes, as demonstrated in Chapter 3.
In addition to this midterm Action 7, the FANC also asked to investigate the potentiallyunreported higher tilted flaws (Action 3b):
The licensee shall demonstrate that the applied ultrasonic testing procedure allowsthe detection of the higher tilt defects in the Doel 3/Tihange 2 data (2012inspections) with a high level of confidence.
Version 1
This document is the property of Electrabel S.A. Any duplication or transmission to third parties is forbidden without prior written approval.
22Ultrasonic InspectionSafety Case 2015 Doel 3 RPV
4.1.1UT Qualification ProcessA qualification programme was established, based on the methodology of the EuropeanNetwork for Inspection and Qualification (ENIQ). The entire programme was supervised by theAIA and consisted of three main parts:
Practical trialsUT modelling (computer simulations)Reconciliation of trials and modelling
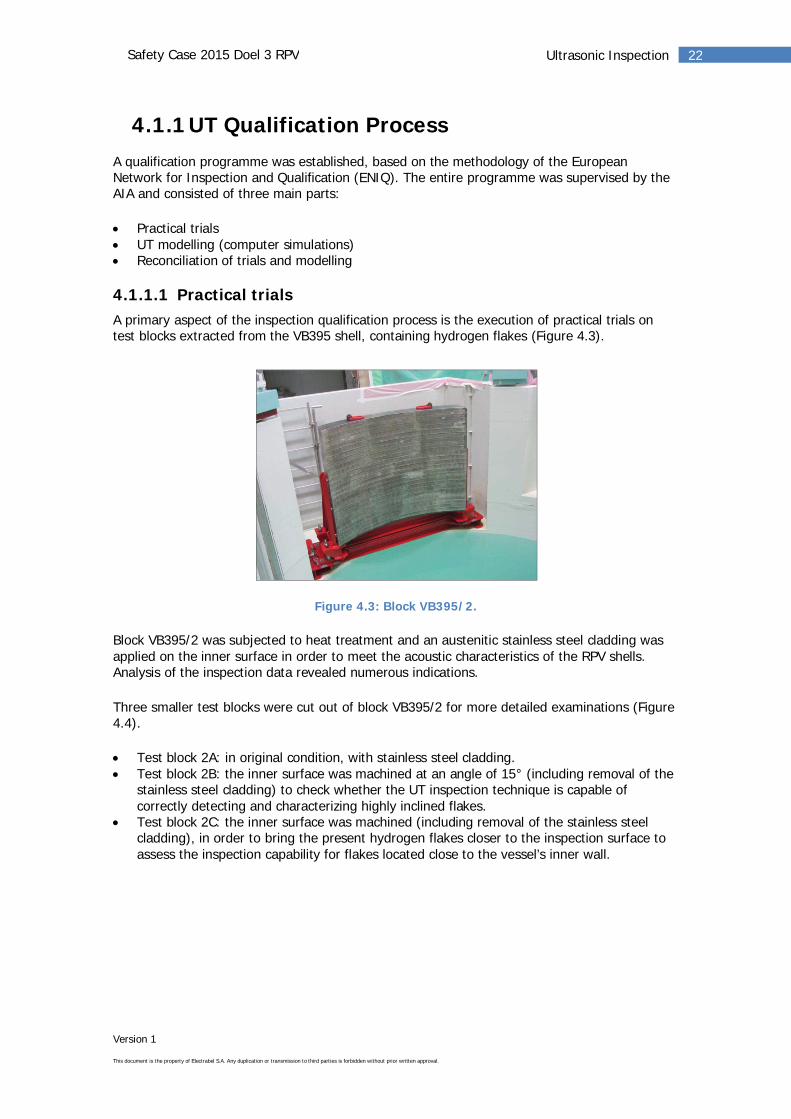
4.1.1.1 Practical trialsA primary aspect of the inspection qualification process is the execution of practical trials ontest blocks extracted from the VB395 shell, containing hydrogen flakes (Figure 4.3).
Figure 4.3: Block VB395/2.
Block VB395/2 was subjected to heat treatment and an austenitic stainless steel cladding wasapplied on the inner surface in order to meet the acoustic characteristics of the RPV shells.Analysis of the inspection data revealed numerous indications.
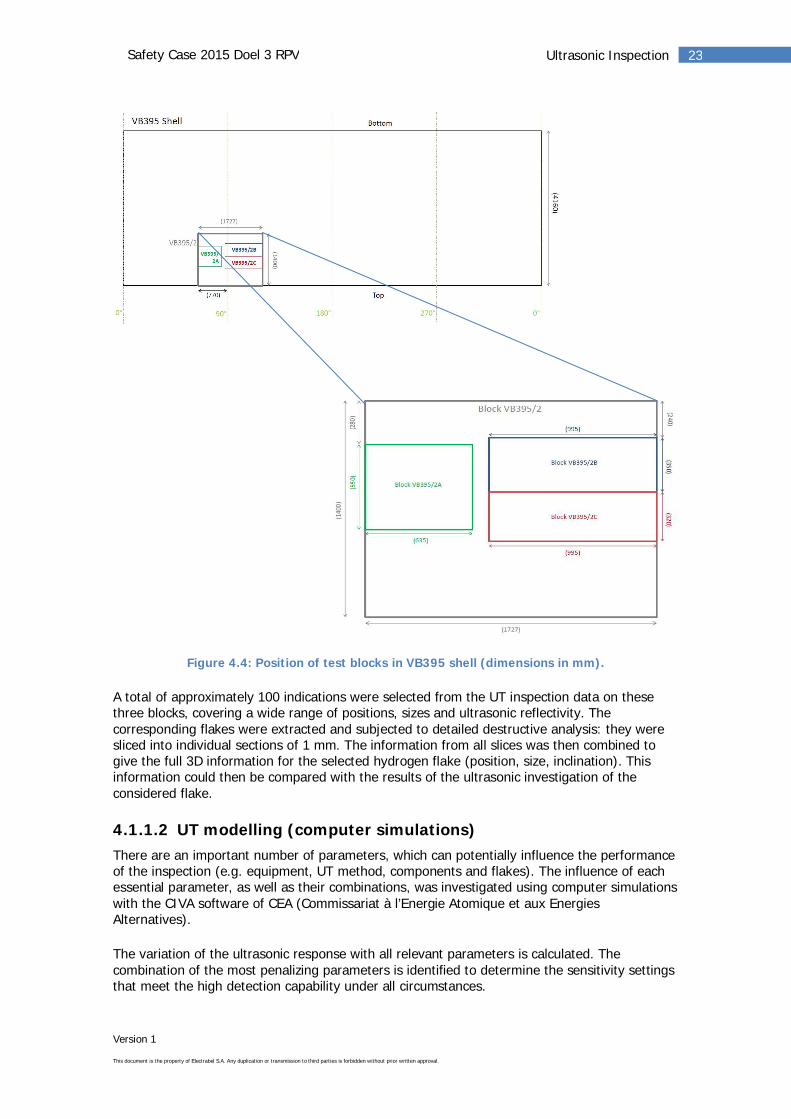
Three smaller test blocks were cut out of block VB395/2 for more detailed examinations (Figure4.4).
Test block 2A: in original condition, with stainless steel cladding.Test block 2B: the inner surface was machined at an angle of 15° (including removal of thestainless steel cladding) to check whether the UT inspection technique is capable ofcorrectly detecting and characterizing highly inclined flakes.Test block 2C: the inner surface was machined (including removal of the stainless steelcladding), in order to bring the present hydrogen flakes closer to the inspection surface toassess the inspection capability for flakes located close to the vessel’s inner wall.
Version 1
This document is the property of Electrabel S.A. Any duplication or transmission to third parties is forbidden without prior written approval.
23Ultrasonic InspectionSafety Case 2015 Doel 3 RPV
Figure 4.4: Position of test blocks in VB395 shell (dimensions in mm).
A total of approximately 100 indications were selected from the UT inspection data on thesethree blocks, covering a wide range of positions, sizes and ultrasonic reflectivity. Thecorresponding flakes were extracted and subjected to detailed destructive analysis: they weresliced into individual sections of 1 mm. The information from all slices was then combined togive the full 3D information for the selected hydrogen flake (position, size, inclination). Thisinformation could then be compared with the results of the ultrasonic investigation of theconsidered flake.
4.1.1.2 UT modelling (computer simulations)There are an important number of parameters, which can potentially influence the performanceof the inspection (e.g. equipment, UT method, components and flakes). The influence of eachessential parameter, as well as their combinations, was investigated using computer simulationswith the CIVA software of CEA (Commissariat à l’Energie Atomique et aux EnergiesAlternatives).
The variation of the ultrasonic response with all relevant parameters is calculated. Thecombination of the most penalizing parameters is identified to determine the sensitivity settingsthat meet the high detection capability under all circumstances.
Version 1
This document is the property of Electrabel S.A. Any duplication or transmission to third parties is forbidden without prior written approval.
24Ultrasonic InspectionSafety Case 2015 Doel 3 RPV
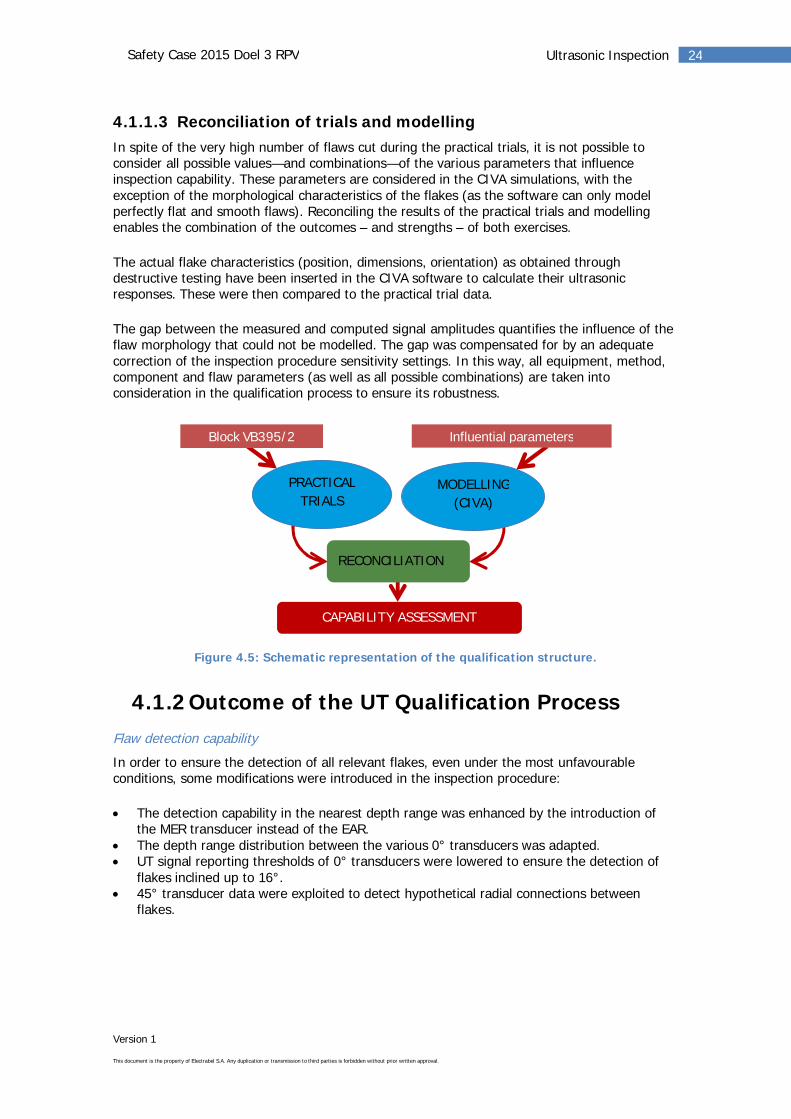
4.1.1.3 Reconciliation of trials and modellingIn spite of the very high number of flaws cut during the practical trials, it is not possible toconsider all possible values—and combinations—of the various parameters that influenceinspection capability. These parameters are considered in the CIVA simulations, with theexception of the morphological characteristics of the flakes (as the software can only modelperfectly flat and smooth flaws). Reconciling the results of the practical trials and modellingenables the combination of the outcomes – and strengths – of both exercises.
The actual flake characteristics (position, dimensions, orientation) as obtained throughdestructive testing have been inserted in the CIVA software to calculate their ultrasonicresponses. These were then compared to the practical trial data.
The gap between the measured and computed signal amplitudes quantifies the influence of theflaw morphology that could not be modelled. The gap was compensated for by an adequatecorrection of the inspection procedure sensitivity settings. In this way, all equipment, method,component and flaw parameters (as well as all possible combinations) are taken intoconsideration in the qualification process to ensure its robustness.
Figure 4.5: Schematic representation of the qualification structure.
4.1.2Outcome of the UT Qualification ProcessFlaw detection capability
In order to ensure the detection of all relevant flakes, even under the most unfavourableconditions, some modifications were introduced in the inspection procedure:
The detection capability in the nearest depth range was enhanced by the introduction ofthe MER transducer instead of the EAR.The depth range distribution between the various 0° transducers was adapted.UT signal reporting thresholds of 0° transducers were lowered to ensure the detection offlakes inclined up to 16°.45° transducer data were exploited to detect hypothetical radial connections betweenflakes.
PRACTICALTRIALS
MODELLING(CIVA)
Block VB395/2
RECONCILIATION
CAPABILITY ASSESSMENT
Influential parameters
Version 1
This document is the property of Electrabel S.A. Any duplication or transmission to third parties is forbidden without prior written approval.
25Ultrasonic InspectionSafety Case 2015 Doel 3 RPV
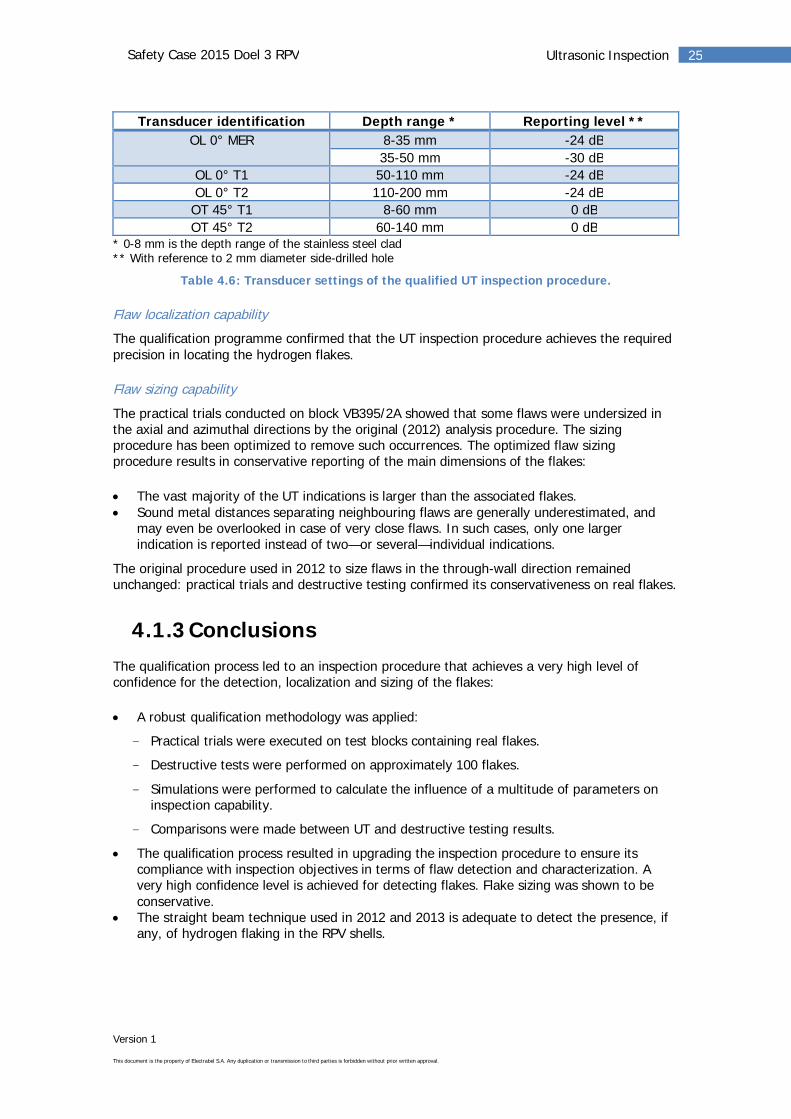
Transducer identification Depth range * Reporting level **OL 0° MER 8-35 mm -24 dB
35-50 mm -30 dBOL 0° T1 50-110 mm -24 dBOL 0° T2 110-200 mm -24 dBOT 45° T1 8-60 mm 0 dBOT 45° T2 60-140 mm 0 dB
* 0-8 mm is the depth range of the stainless steel clad** With reference to 2 mm diameter side-drilled hole
Table 4.6: Transducer settings of the qualified UT inspection procedure.
Flaw localization capability
The qualification programme confirmed that the UT inspection procedure achieves the requiredprecision in locating the hydrogen flakes.
Flaw sizing capability
The practical trials conducted on block VB395/2A showed that some flaws were undersized inthe axial and azimuthal directions by the original (2012) analysis procedure. The sizingprocedure has been optimized to remove such occurrences. The optimized flaw sizingprocedure results in conservative reporting of the main dimensions of the flakes:
The vast majority of the UT indications is larger than the associated flakes.Sound metal distances separating neighbouring flaws are generally underestimated, andmay even be overlooked in case of very close flaws. In such cases, only one largerindication is reported instead of two—or several—individual indications.
The original procedure used in 2012 to size flaws in the through-wall direction remainedunchanged: practical trials and destructive testing confirmed its conservativeness on real flakes.
4.1.3ConclusionsThe qualification process led to an inspection procedure that achieves a very high level ofconfidence for the detection, localization and sizing of the flakes:
A robust qualification methodology was applied:
- Practical trials were executed on test blocks containing real flakes.
- Destructive tests were performed on approximately 100 flakes.
- Simulations were performed to calculate the influence of a multitude of parameters oninspection capability.
- Comparisons were made between UT and destructive testing results.
The qualification process resulted in upgrading the inspection procedure to ensure itscompliance with inspection objectives in terms of flaw detection and characterization. Avery high confidence level is achieved for detecting flakes. Flake sizing was shown to beconservative.The straight beam technique used in 2012 and 2013 is adequate to detect the presence, ifany, of hydrogen flaking in the RPV shells.
Version 1
This document is the property of Electrabel S.A. Any duplication or transmission to third parties is forbidden without prior written approval.
26Ultrasonic InspectionSafety Case 2015 Doel 3 RPV
4.2 Re-inspection
In accordance with the action plan (Action 8), the Doel 3 RPV core shells were re-inspectedduring the plant’s outage of May 2014. The goal was to check for any possible evolution ofthe flakes since the 2012 UT inspection. No evolution was revealed. In addition, the qualifiedUT procedure was applied to the 2014 data. Due to the lower threshold, this resulted in ahigher number of reported flakes as compared to 2012, and pointed out an increasedindication density without an extension of the affected volume. It also indicated that all flakesare reported.
A visual examination of the bracket zones (Action 2b) was carried out in May 2014. Noimperfection was found during this examination.
RequirementsThe action plan called for a follow-up UT inspection of both Doel 3 RPV core shells to be carriedout during the next outage. This in-service inspection was meant to detect any possibleevolution of the previously reported flakes during operation. The FANC expressed therequirement as follows (Action 8):
The licensee shall perform follow-up in-service inspections during the next plannedoutage for refuelling to ensure that no evolution of the flaw indications hasoccurred during operation.
Previous analysis showed that the presence of hydrogen flakes in the few non-inspectable areascould be excluded, except behind and in the vicinity of the four welded brackets of the Doel 3RPV. The function of those brackets – above the weld to the transition ring, on the innersurface of the lower core shell – is to guide the insertion of the lower internal structures in theRPV. It was considered that these potential flaws could never be critical to the RPV’s structuralintegrity since the brackets would protect them in terms of stress and toughness (see RPVSafety Case Addendum). The AIA expressed the requirement as follows (Action 2b):
The Licensee is asked to apply an appropriate visual examination of the concernedbracket zones during the next outage.
ApproachDuring the 2014 outage, a follow-up UT inspection of the RPVs was performed. The objectiveswere to investigate the in-service growth of the flakes and establish an update of the flakecartography. To document any imperfection in material condition, and in accordance with theabove requirement, a visual examination of the austenitic clad surrounding the four bracketswas carried out in May 2014. The inspection was conducted with one of the cameras mountedon the MIS-B equipment and witnessed by the AIA.
Version 1
This document is the property of Electrabel S.A. Any duplication or transmission to third parties is forbidden without prior written approval.
27Ultrasonic InspectionSafety Case 2015 Doel 3 RPV
4.2.1Verification of the In-Service Stability of theFlakes
The hypothetical in-service growth of the flakes between the restart in 2013 and the shutdownin 2014 was investigated. For this purpose, the data collected during the 2014 UT inspectionwere analysed in accordance with the 2012 inspection procedure, applying the sameparameters and reporting thresholds. The optimized sizing procedure resulting from thequalification was implemented on both data sets.
The ultrasonic amplitude and dimensions associated to each indication of both the 2012 and2014 datasets were compared (using criteria derived from the French RSE-M code) to verify anyhypothetical occurrence of in-service growth of the flakes between 2012 and 2014. Thiscomparison revealed no evolution. None of the indications showed any sign of modificationbetween the two inspections.
4.2.2Updated Flake CartographyThe updated flake cartography was established using the qualified UT inspection procedure.
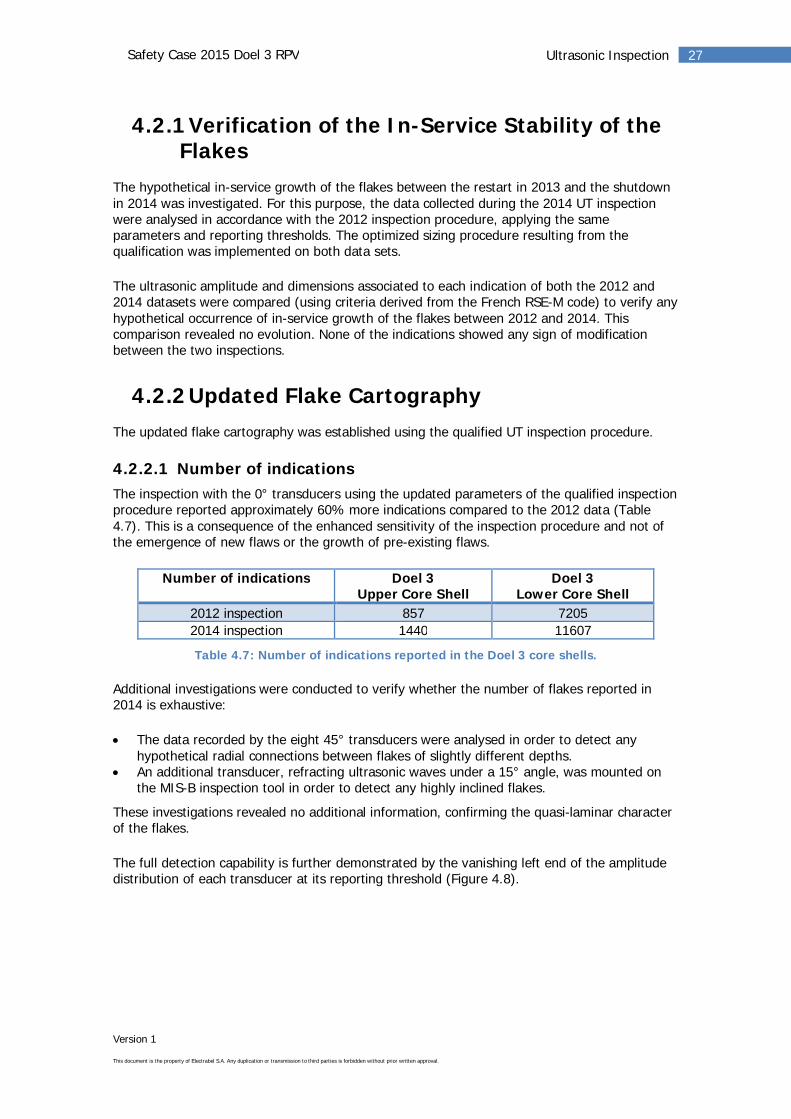
4.2.2.1 Number of indicationsThe inspection with the 0° transducers using the updated parameters of the qualified inspectionprocedure reported approximately 60% more indications compared to the 2012 data (Table4.7). This is a consequence of the enhanced sensitivity of the inspection procedure and not ofthe emergence of new flaws or the growth of pre-existing flaws.
Number of indications Doel 3Upper Core Shell
Doel 3Lower Core Shell
2012 inspection 857 72052014 inspection 1440 11607
Table 4.7: Number of indications reported in the Doel 3 core shells.
Additional investigations were conducted to verify whether the number of flakes reported in2014 is exhaustive:
The data recorded by the eight 45° transducers were analysed in order to detect anyhypothetical radial connections between flakes of slightly different depths.An additional transducer, refracting ultrasonic waves under a 15° angle, was mounted onthe MIS-B inspection tool in order to detect any highly inclined flakes.
These investigations revealed no additional information, confirming the quasi-laminar characterof the flakes.
The full detection capability is further demonstrated by the vanishing left end of the amplitudedistribution of each transducer at its reporting threshold (Figure 4.8).

Version 1
This document is the property of Electrabel S.A. Any duplication or transmission to third parties is forbidden without prior written approval.
28Ultrasonic InspectionSafety Case 2015 Doel 3 RPV
Figure 4.8: Indication amplitude distribution (4 shells).
4.2.2.2 Spatial distribution of the indicationsThe 2012 inspection showed that the indications are not spread over the entire volume of theRPV shells. The 2014 re-inspection confirmed that the indications are located in those parts ofthe shells that were already known to contain flakes during the 2012 inspection (Figure 4.9).
Figure 4.9: Depth distribution of the indications in the RPV shells.
0
600
1200
1800
2400
[0-1
0]]1
0-20
]]2
0-30
]]3
0-40
]]4
0-50
]]5
0-60
]]6
0-70
]]7
0-80
]]8
0-90
]]9
0-10
0]]1
00-1
10]
]110
-120
]]1
20-1
30]
]130
-140
]
Num
bero
find
icat
ions
Depth range [mm]
Doel 3
Upper shell 2012 Upper shell 2014
Lower shell 2012 Lower shell 2014
Version 1
This document is the property of Electrabel S.A. Any duplication or transmission to third parties is forbidden without prior written approval.
29Ultrasonic InspectionSafety Case 2015 Doel 3 RPV
As more indications have been reported in the same zones of the RPV shells, the indicationdensity has increased and the distance between the indications has decreased as compared to2012. The conservativeness of the optimized sizing process tending to report indications largerthan the actual flake size, even further decreases the measured distance between theindications.
Shallow flakes (located in the first 10 mm behind the austenitic cladding) are critical regardingthe shell’s structural integrity. Between 2012 and 2014, the number of reported shallowindications increased by approximately 100%. This result triggered a specific analysis on theshallow indications population of the Doel 3 lower core shell. This analysis showed that theshallow indications that were newly reported in 2014 have smaller dimensions than theindications already reported in 2012.
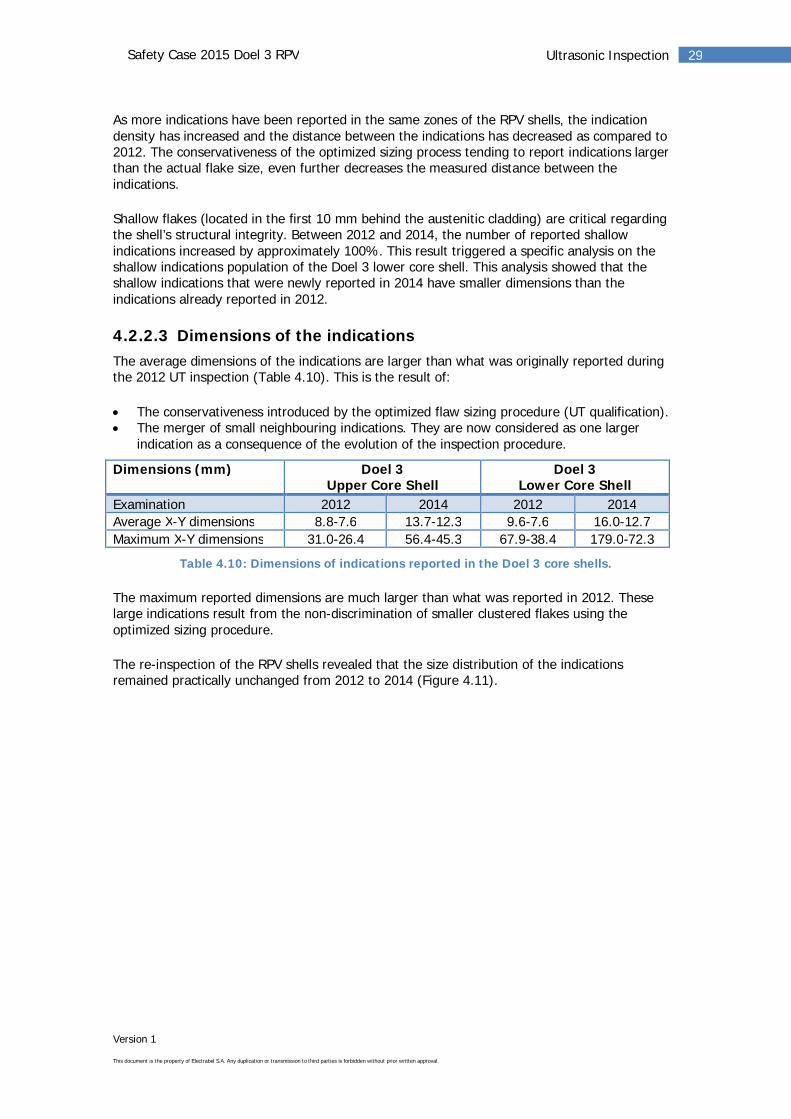
4.2.2.3 Dimensions of the indicationsThe average dimensions of the indications are larger than what was originally reported duringthe 2012 UT inspection (Table 4.10). This is the result of:
The conservativeness introduced by the optimized flaw sizing procedure (UT qualification).The merger of small neighbouring indications. They are now considered as one largerindication as a consequence of the evolution of the inspection procedure.
Dimensions (mm) Doel 3Upper Core Shell
Doel 3Lower Core Shell
Examination 2012 2014 2012 2014Average X-Y dimensions 8.8-7.6 13.7-12.3 9.6-7.6 16.0-12.7Maximum X-Y dimensions 31.0-26.4 56.4-45.3 67.9-38.4 179.0-72.3
Table 4.10: Dimensions of indications reported in the Doel 3 core shells.
The maximum reported dimensions are much larger than what was reported in 2012. Theselarge indications result from the non-discrimination of smaller clustered flakes using theoptimized sizing procedure.
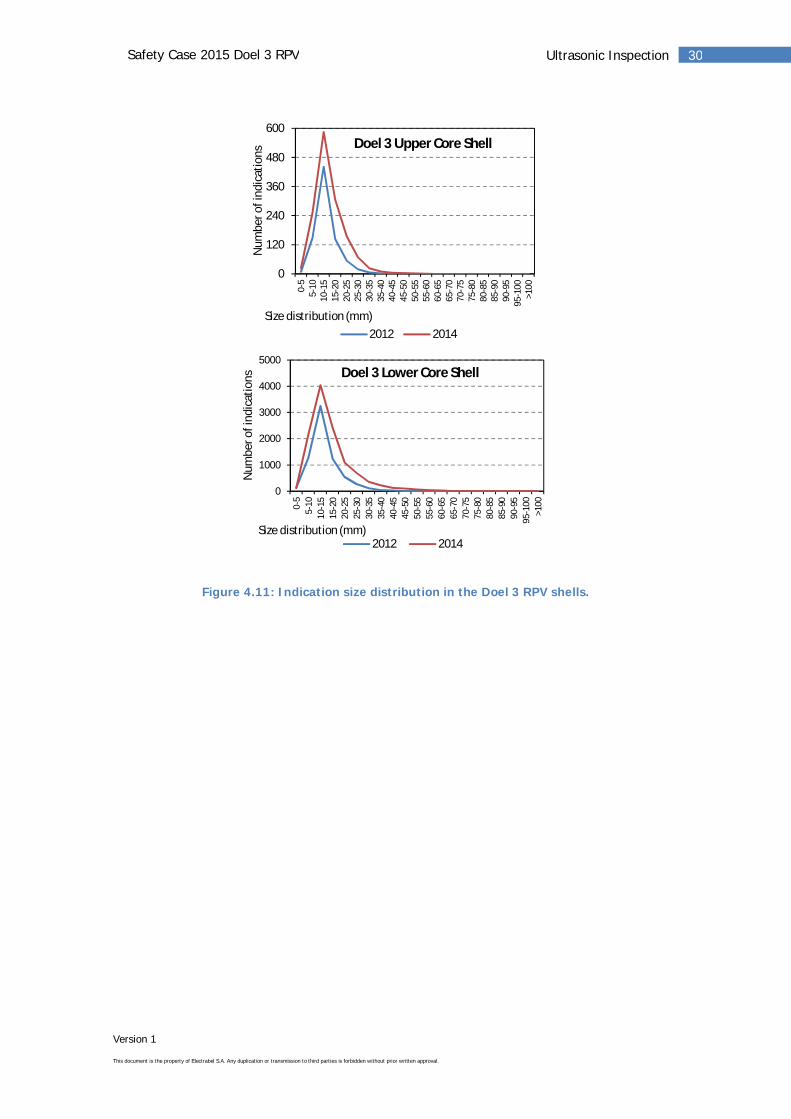
The re-inspection of the RPV shells revealed that the size distribution of the indicationsremained practically unchanged from 2012 to 2014 (Figure 4.11).
Version 1
This document is the property of Electrabel S.A. Any duplication or transmission to third parties is forbidden without prior written approval.
30Ultrasonic InspectionSafety Case 2015 Doel 3 RPV
Figure 4.11: Indication size distribution in the Doel 3 RPV shells.
0
120
240
360
480
600
0-5
5-10
10-1
515
-20
20-2
525
-30
30-3
535
-40
40-4
545
-50
50-5
555
-60
60-6
565
-70
70-7
575
-80
80-8
585
-90
90-9
595
-100
>100
Num
bero
find
icat
ions
Size distribution (mm)
Doel 3 Upper Core Shell
2012 2014
0
1000
2000
3000
4000
5000
0-5
5-10
10-1
515
-20
20-2
525
-30
30-3
535
-40
40-4
545
-50
50-5
555
-60
60-6
565
-70
70-7
575
-80
80-8
585
-90
90-9
595
-100
>100
Num
bero
find
icat
ions
Size distribution (mm)
Doel 3 Lower Core Shell
2012 2014
Version 1
This document is the property of Electrabel S.A. Any duplication or transmission to third parties is forbidden without prior written approval.
31Ultrasonic InspectionSafety Case 2015 Doel 3 RPV
4.2.3Clad interface imperfectionsAs mentioned in the Doel 3 Safety Case report Addendum, theRPV UT inspections also revealed, in addition to the hydrogenflakes, indications located at the interface between cladding andbase metal, that have been classified as clad interfaceimperfections (French: défauts technologiques de revêtement orDTR). In Doel 3, 268 such indications were found in the lowercore shell and 33 in the upper core shell. The majority were thuslocated in the lower core shell, in the volume where the cloud ofhydrogen flakes is situated close to the cladding-base metalinterface.
Since for a number of those indications the distinction betweenDTR and hydrogen flake could not be made for 100% sure, it wasdecided to conservatively consider all of them as additionalhydrogen flakes in the SIA.
4.2.4ConclusionsNo in-service growth of the hydrogen flakes was observed between 2012 and 2014.An update of the flake cartography is issued, based on the application of the qualifiedinspection procedure. As a consequence of the inspection procedure evolution, the numberof reported indications is significantly higher than in 2012.The newly reported indications are located in the same shell volumes as the indications thatwere reported in 2012. The indication density in those volumes therefore increasessignificantly, whereas the other shell parts are confirmed to be unaffected by flaking.The conservativeness introduced by the updated flaw sizing procedure and the tendency toreport clusters of indications as large individual flakes leads to the reporting of largeraverage dimensions and much larger maximum dimensions in 2014.The indications that were newly reported in 2014 that are close to the inner surface aregenerally smaller than the ones reported in 2012 in the same area.The re-inspection of the RPV shells revealed that the size distribution of the indicationsremained practically unchanged from 2012 to 2014.Additional inspections aimed at detecting non-laminar flaws reported no extra indications,confirming the quasi-laminar character of the hydrogen flakes.The re-inspection also revealed additional indications that have been classified as cladinterface imperfections. However, in the SIA, these indications are conservativelyconsidered as hydrogen flakes. In addition, these indications will be included in futureinspections of Doel 3 RPV and will be treated as hydrogen flakes in evolution checks.The results confirm the adequacy of the qualified UT inspection technique for the detection,localization and sizing of hydrogen flakes.The visual examination of the bracket zones revealed no imperfection.
A DTR is any flaw locatedat the cladding-base metalinterface, that does notpenetrate the base metalitself. A DTR should not beconfused with undercladcracks (French: défautssous revêtement or DSR),which are planar flaws atthe cladding-base metalinterface, located in thebase metal, orientedperpendicular to the RPVsurface and generated bycold cracking. No undercladcracks were discoveredduring the 2012inspections.

Version 1
This document is the property of Electrabel S.A. Any duplication or transmission to third parties is forbidden without prior written approval.
32Ultrasonic InspectionSafety Case 2015 Doel 3 RPV
4.3 Acoustic Emission Measurements
Under Action 16b additional questions were asked on the load tests performed on the Doel 3RPV in 2013. All questions have been successfully addressed, confirming the validity of theAcoustic Emission (AE) measurements performed during the load tests.
RequirementsIn 2013 the Doel 3 RPV was subjected to a load test, as required under Action 16.Simultaneously, AE measurements were performed in order to demonstrate that no unexpectedcondition was present in the RPV.
The goal of the AE test was to detect the propagation of flaws in the RPV core shells, if any. Inorder to reach this objective, the RPV was equipped with fifteen sensors positioned on the RPVhead, on the RPV inlet and outlet nozzles, and on the in-core instrumentation connected to thebottom of the RPV. The AE measurements performed on the Doel 3 RPV did not reveal anycritical sources and/or areas for which supplementary investigations are mandatory.
However, the Safety Authorities had some additional questions on the AE test (Action 16b).Besides asking for detailed information related to the test results and the equipment used, theyrequested to demonstrate that the method was correctly applied and that it would have alloweddetecting cracks anywhere in the RPV, as well as to verify whether sensors positioned in the in-core instrumentation room can provide useful information regarding the acoustic activity in theRPV core shells.
ApproachAs an answer to these questions, detailed information related to the test equipment and testresults were provided. In addition, tests were successfully performed on a mock-up in order todemonstrate the effectiveness of the method used for measuring the sensitivity of AE sensors incomparison with the method prescribed in the guide to good practices.
In order to demonstrate that any location of the RPV is covered by the AE test, signalattenuation values from an AE test performed in a French NPP were presented to the SafetyAuthorities. It proves that a signal coming from anywhere in the RPV can be detected by atleast one of the sensor placed on the RPV during the load test.
Sensors that are placed in the in-core instrumentation room are not used for the AE diagnosisbut it was confirmed by analysis that AE sources that were recorded by these sensors did notcome from the RPV core shells.
Version 1
This document is the property of Electrabel S.A. Any duplication or transmission to third parties is forbidden without prior written approval.
33Material PropertiesSafety Case 2015 Doel 3 RPV
5 Material PropertiesTests performed on flaked material from KS 02 and VB395 confirmed that the presence ofhydrogen flakes does not have any effect on the evolution of fracture toughness underirradiation. In a similar way, the evaluation of possible root causes for the atypicalembrittlement of the rejected VB395 shell excludes any role of hydrogen or hydrogen flakes.The tests also showed that the D3T2 RPV forgings and the KS 02 flange behave as expectedunder irradiated conditions. On the contrary, VB395 does not behave as expected underirradiated conditions, and is to be considered as an outlier.
Although it is very unlikely that the D3T2 RPV core shells would be more sensitive toirradiation due to the presence of hydrogen flakes, it is however conservatively postulatedthey are. The RTNDT trend curves considered in the SIA therefore include the atypicalembrittlement observed on VB395, more specifically in the material between hydrogen flakes.
ContextIn view of the Structural Integrity Assessment (SIA) of the D3T2 RPV core shells, it was ofutmost importance to determine the material properties in the most comprehensive andcomplete way. Central to this material properties investigation is the evolution of the fracturetoughness properties under irradiation.
As presented in the roadmap (Figure 2.1), three segregated material types containing highnumbers of hydrogen flakes were considered: the D3T2 RPV forgings, the VB395 shell and theKS 02 flange.
RequirementsThis Chapter reports on the comprehensive material investigation and testing programme. Assuch, it also covers all the midterm actions related to the properties of segregated materialsaffected by hydrogen flaking.
These midterm actions were formulated by the FANC (see each of the following sections in thisChapter) and can be listed as in Table 5.1.
Version 1
This document is the property of Electrabel S.A. Any duplication or transmission to third parties is forbidden without prior written approval.
34Material PropertiesSafety Case 2015 Doel 3 RPV
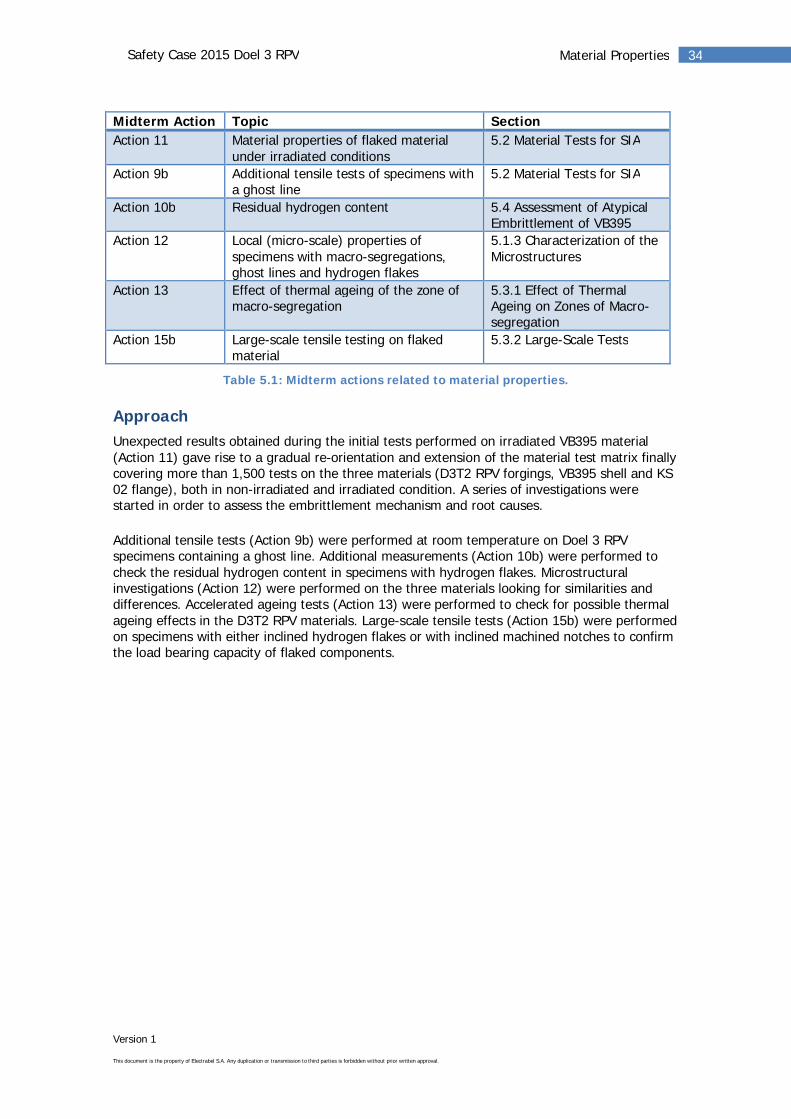
Midterm Action Topic SectionAction 11 Material properties of flaked material
under irradiated conditions5.2 Material Tests for SIA
Action 9b Additional tensile tests of specimens witha ghost line
5.2 Material Tests for SIA
Action 10b Residual hydrogen content 5.4 Assessment of AtypicalEmbrittlement of VB395
Action 12 Local (micro-scale) properties ofspecimens with macro-segregations,ghost lines and hydrogen flakes
5.1.3 Characterization of theMicrostructures
Action 13 Effect of thermal ageing of the zone ofmacro-segregation
5.3.1 Effect of ThermalAgeing on Zones of Macro-segregation
Action 15b Large-scale tensile testing on flakedmaterial
5.3.2 Large-Scale Tests
Table 5.1: Midterm actions related to material properties.
ApproachUnexpected results obtained during the initial tests performed on irradiated VB395 material(Action 11) gave rise to a gradual re-orientation and extension of the material test matrix finallycovering more than 1,500 tests on the three materials (D3T2 RPV forgings, VB395 shell and KS02 flange), both in non-irradiated and irradiated condition. A series of investigations werestarted in order to assess the embrittlement mechanism and root causes.
Additional tensile tests (Action 9b) were performed at room temperature on Doel 3 RPVspecimens containing a ghost line. Additional measurements (Action 10b) were performed tocheck the residual hydrogen content in specimens with hydrogen flakes. Microstructuralinvestigations (Action 12) were performed on the three materials looking for similarities anddifferences. Accelerated ageing tests (Action 13) were performed to check for possible thermalageing effects in the D3T2 RPV materials. Large-scale tensile tests (Action 15b) were performedon specimens with either inclined hydrogen flakes or with inclined machined notches to confirmthe load bearing capacity of flaked components.
Version 1
This document is the property of Electrabel S.A. Any duplication or transmission to third parties is forbidden without prior written approval.
35Material PropertiesSafety Case 2015 Doel 3 RPV
5.1 Tested Materials
In the context of the RPV Safety Case three types of materials were tested: samples comingfrom the D3T2 RPV forgings, VB395 shell and KS 02 flange, all belonging to two well-knownRPV steel type families. Although their manufacturing process was different, they are allsimilar materials with segregated areas containing large numbers of hydrogen flakes.
The macro- and microstructures of the examined D3T2 forgings are globally identical. TheVB395 shell can be considered as similar to the D3T2 forgings but with more temperedmartensite in the dark zones (ghost lines) and globally harder. The KS 02 forging has asimilar microstructure as the D3T2 forgings but with a slightly different chemical composition.
5.1.1Material Types
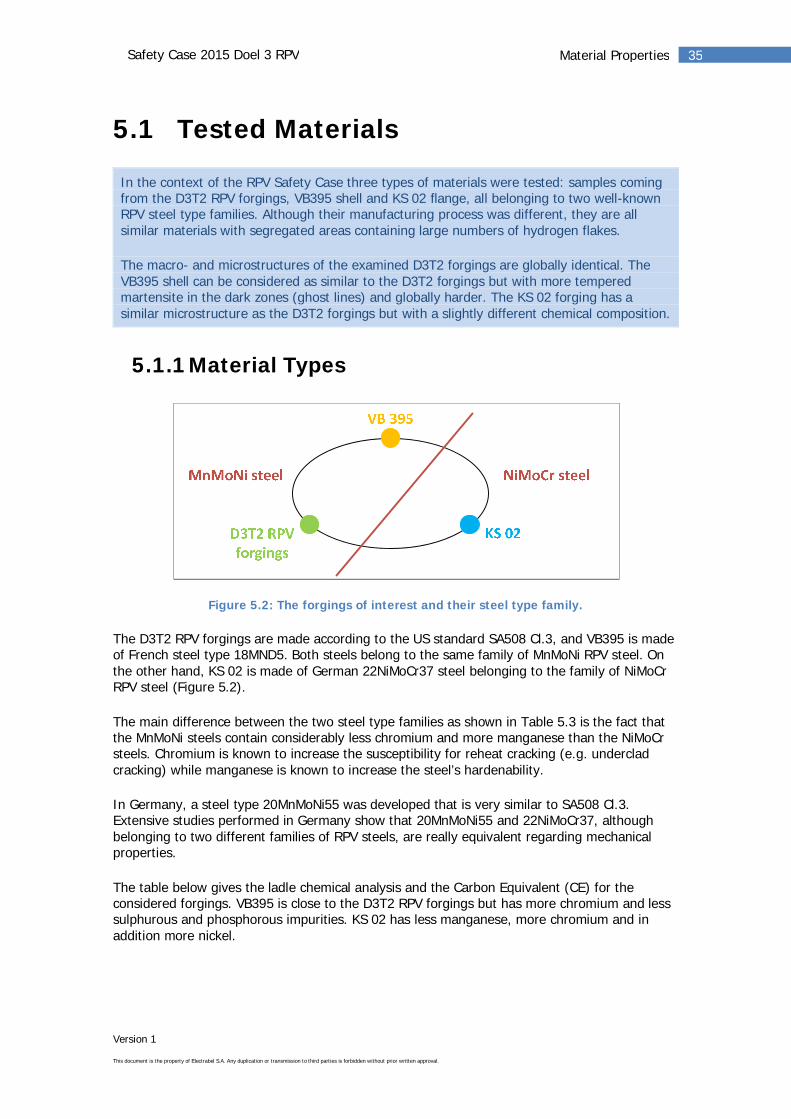
Figure 5.2: The forgings of interest and their steel type family.
The D3T2 RPV forgings are made according to the US standard SA508 Cl.3, and VB395 is madeof French steel type 18MND5. Both steels belong to the same family of MnMoNi RPV steel. Onthe other hand, KS 02 is made of German 22NiMoCr37 steel belonging to the family of NiMoCrRPV steel (Figure 5.2).
The main difference between the two steel type families as shown in Table 5.3 is the fact thatthe MnMoNi steels contain considerably less chromium and more manganese than the NiMoCrsteels. Chromium is known to increase the susceptibility for reheat cracking (e.g. undercladcracking) while manganese is known to increase the steel’s hardenability.
In Germany, a steel type 20MnMoNi55 was developed that is very similar to SA508 Cl.3.Extensive studies performed in Germany show that 20MnMoNi55 and 22NiMoCr37, althoughbelonging to two different families of RPV steels, are really equivalent regarding mechanicalproperties.
The table below gives the ladle chemical analysis and the Carbon Equivalent (CE) for theconsidered forgings. VB395 is close to the D3T2 RPV forgings but has more chromium and lesssulphurous and phosphorous impurities. KS 02 has less manganese, more chromium and inaddition more nickel.
Version 1
This document is the property of Electrabel S.A. Any duplication or transmission to third parties is forbidden without prior written approval.
36Material PropertiesSafety Case 2015 Doel 3 RPV
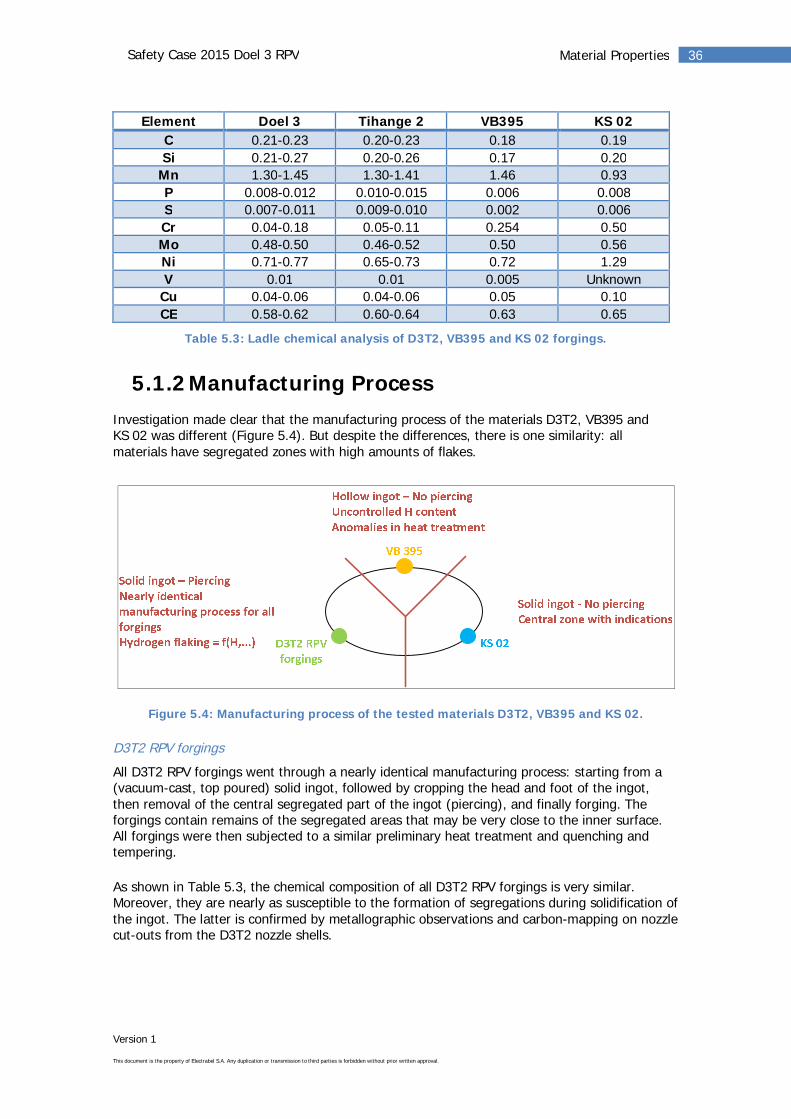
Element Doel 3 Tihange 2 VB395 KS 02C 0.21-0.23 0.20-0.23 0.18 0.19Si 0.21-0.27 0.20-0.26 0.17 0.20
Mn 1.30-1.45 1.30-1.41 1.46 0.93P 0.008-0.012 0.010-0.015 0.006 0.008S 0.007-0.011 0.009-0.010 0.002 0.006Cr 0.04-0.18 0.05-0.11 0.254 0.50Mo 0.48-0.50 0.46-0.52 0.50 0.56Ni 0.71-0.77 0.65-0.73 0.72 1.29V 0.01 0.01 0.005 Unknown
Cu 0.04-0.06 0.04-0.06 0.05 0.10CE 0.58-0.62 0.60-0.64 0.63 0.65
Table 5.3: Ladle chemical analysis of D3T2, VB395 and KS 02 forgings.
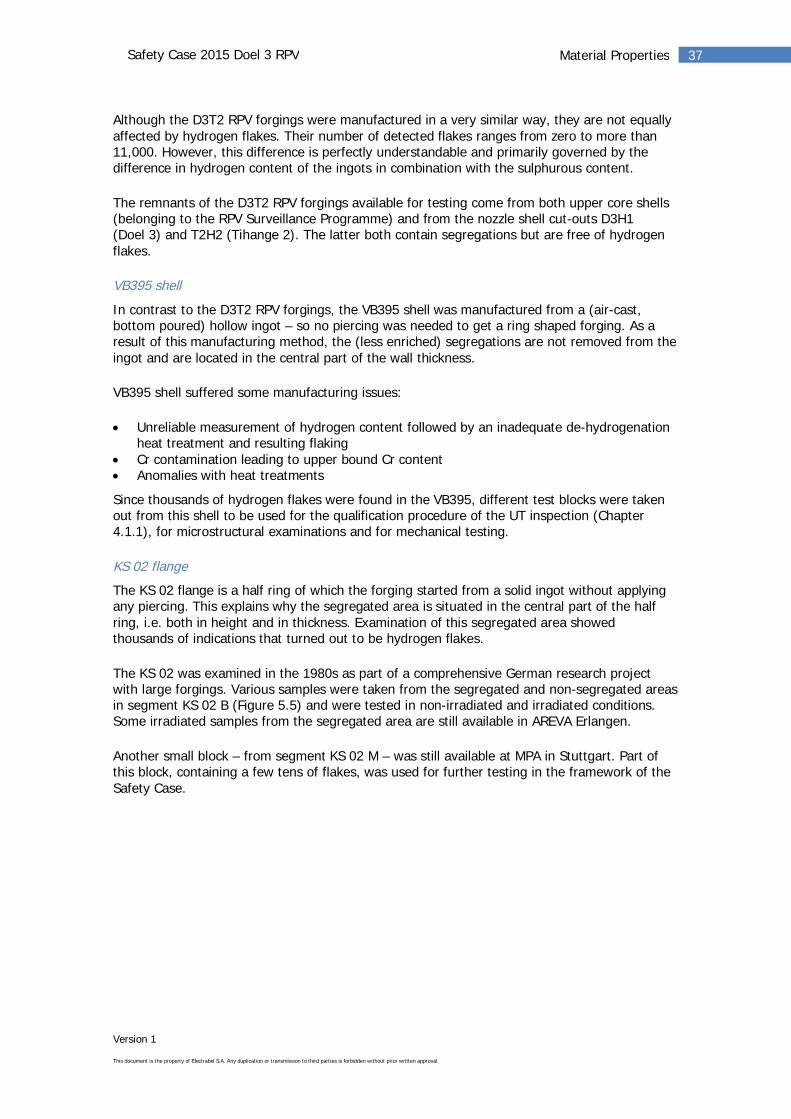
5.1.2Manufacturing ProcessInvestigation made clear that the manufacturing process of the materials D3T2, VB395 andKS 02 was different (Figure 5.4). But despite the differences, there is one similarity: allmaterials have segregated zones with high amounts of flakes.
Figure 5.4: Manufacturing process of the tested materials D3T2, VB395 and KS 02.
D3T2 RPV forgings
All D3T2 RPV forgings went through a nearly identical manufacturing process: starting from a(vacuum-cast, top poured) solid ingot, followed by cropping the head and foot of the ingot,then removal of the central segregated part of the ingot (piercing), and finally forging. Theforgings contain remains of the segregated areas that may be very close to the inner surface.All forgings were then subjected to a similar preliminary heat treatment and quenching andtempering.
As shown in Table 5.3, the chemical composition of all D3T2 RPV forgings is very similar.Moreover, they are nearly as susceptible to the formation of segregations during solidification ofthe ingot. The latter is confirmed by metallographic observations and carbon-mapping on nozzlecut-outs from the D3T2 nozzle shells.
Version 1
This document is the property of Electrabel S.A. Any duplication or transmission to third parties is forbidden without prior written approval.
37Material PropertiesSafety Case 2015 Doel 3 RPV
Although the D3T2 RPV forgings were manufactured in a very similar way, they are not equallyaffected by hydrogen flakes. Their number of detected flakes ranges from zero to more than11,000. However, this difference is perfectly understandable and primarily governed by thedifference in hydrogen content of the ingots in combination with the sulphurous content.
The remnants of the D3T2 RPV forgings available for testing come from both upper core shells(belonging to the RPV Surveillance Programme) and from the nozzle shell cut-outs D3H1(Doel 3) and T2H2 (Tihange 2). The latter both contain segregations but are free of hydrogenflakes.
VB395 shell
In contrast to the D3T2 RPV forgings, the VB395 shell was manufactured from a (air-cast,bottom poured) hollow ingot – so no piercing was needed to get a ring shaped forging. As aresult of this manufacturing method, the (less enriched) segregations are not removed from theingot and are located in the central part of the wall thickness.
VB395 shell suffered some manufacturing issues:
Unreliable measurement of hydrogen content followed by an inadequate de-hydrogenationheat treatment and resulting flakingCr contamination leading to upper bound Cr contentAnomalies with heat treatments
Since thousands of hydrogen flakes were found in the VB395, different test blocks were takenout from this shell to be used for the qualification procedure of the UT inspection (Chapter4.1.1), for microstructural examinations and for mechanical testing.
KS 02 flange
The KS 02 flange is a half ring of which the forging started from a solid ingot without applyingany piercing. This explains why the segregated area is situated in the central part of the halfring, i.e. both in height and in thickness. Examination of this segregated area showedthousands of indications that turned out to be hydrogen flakes.
The KS 02 was examined in the 1980s as part of a comprehensive German research projectwith large forgings. Various samples were taken from the segregated and non-segregated areasin segment KS 02 B (Figure 5.5) and were tested in non-irradiated and irradiated conditions.Some irradiated samples from the segregated area are still available in AREVA Erlangen.
Another small block – from segment KS 02 M – was still available at MPA in Stuttgart. Part ofthis block, containing a few tens of flakes, was used for further testing in the framework of theSafety Case.
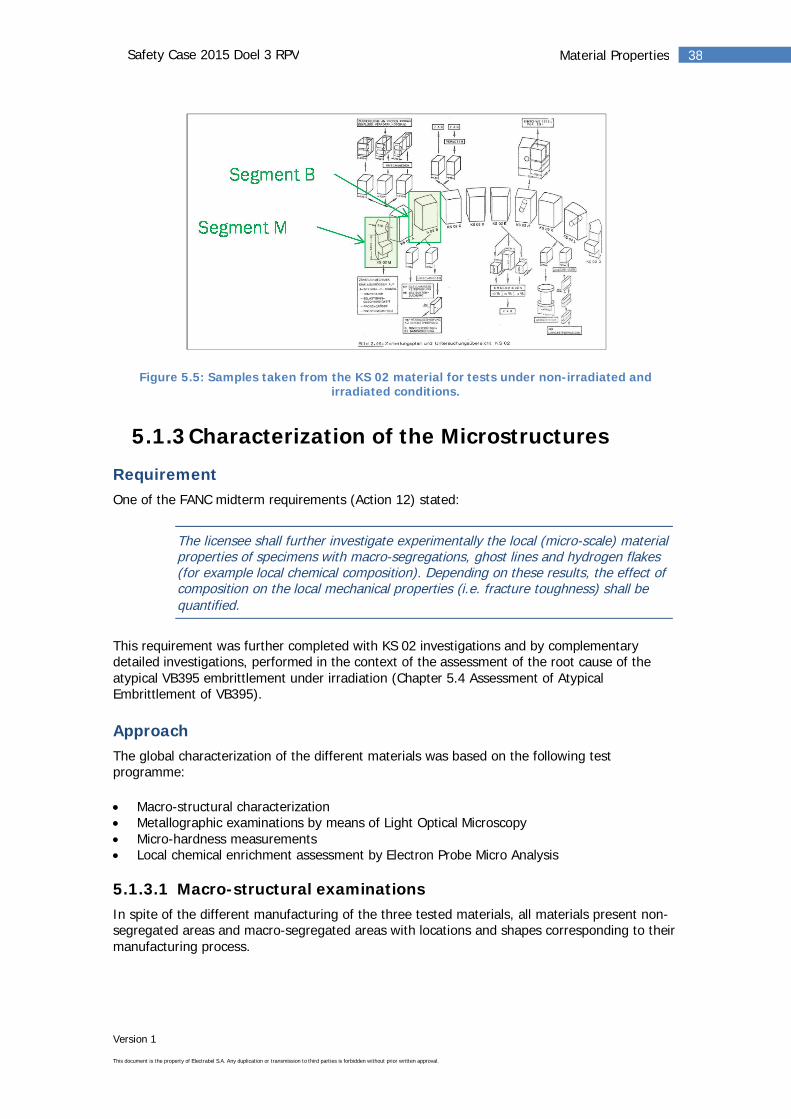
Version 1
This document is the property of Electrabel S.A. Any duplication or transmission to third parties is forbidden without prior written approval.
38Material PropertiesSafety Case 2015 Doel 3 RPV
Figure 5.5: Samples taken from the KS 02 material for tests under non-irradiated andirradiated conditions.
5.1.3Characterization of the Microstructures
RequirementOne of the FANC midterm requirements (Action 12) stated:
The licensee shall further investigate experimentally the local (micro-scale) materialproperties of specimens with macro-segregations, ghost lines and hydrogen flakes(for example local chemical composition). Depending on these results, the effect ofcomposition on the local mechanical properties (i.e. fracture toughness) shall bequantified.
This requirement was further completed with KS 02 investigations and by complementarydetailed investigations, performed in the context of the assessment of the root cause of theatypical VB395 embrittlement under irradiation (Chapter 5.4 Assessment of AtypicalEmbrittlement of VB395).
ApproachThe global characterization of the different materials was based on the following testprogramme:
Macro-structural characterizationMetallographic examinations by means of Light Optical MicroscopyMicro-hardness measurementsLocal chemical enrichment assessment by Electron Probe Micro Analysis
5.1.3.1 Macro-structural examinationsIn spite of the different manufacturing of the three tested materials, all materials present non-segregated areas and macro-segregated areas with locations and shapes corresponding to theirmanufacturing process.
Version 1
This document is the property of Electrabel S.A. Any duplication or transmission to third parties is forbidden without prior written approval.
39Material PropertiesSafety Case 2015 Doel 3 RPV
D3T2 RPV forgings
Because of their similar chemical composition andmanufacturing history, all D3T2 RPV forgings are similarlysusceptible to the formation of segregations. This is confirmedby the observed macro-segregations in the D3T2 nozzle shellcut-outs, D3H1 and T2H2 evidenced by carbon mapping andmacro-etching, which show comparable characteristics(location, shape) and enrichment. Both cut-outs contain alsoghost lines with the same maximum inclination of 16°(measured for D3H1).
VB395 shell
Due to a different manufacturing history (in particular, VB395is forged from a hollow ingot), the shape and the location ofthe macro-segregation, identified by carbon mapping andmacro-etching, are different than in the D3T2 forgings. Despitethe absence of a piercing operation removing segregatedareas, the local C-enrichment of VB395 is slightly lower than inthe D3T2 forgings. The ghost lines observed in the macro-segregations of VB395 have the same maximum inclination of16° and the hydrogen flakes are all located inside the ghostlines.
KS 02 flange
No detailed information is available on the macro-structural characteristics of the KS 02material: a macro-segregated zone was reported in the middle of the forging but not confirmedby chemical analyses. It is also worth to remind that no piercing of the ingot was performed.
5.1.3.2 Microstructural examinations
D3T2 RPV forgings
As previously mentioned, both D3 and T2 forgings contain non-segregated and segregatedareas, all presenting ghost lines. The ghost lines are mainly enriched in Mo and P. A significantamount of MnS is also present.
Similar microstructures are found in the dark and light zones of the different samples,respectively: tempered lower bainite with some tempered martensite and/or tempered upperbainite in the dark zones of the macro-segregated area (Figure 5.6) and upper bainite in thelight zones (Figure 5.7). The average grain size observed in the different zones and materials isabout 30µm.
Ghost lines are residues,after forging, of localizedsegregations formed iningots during theirsolidification. They appearas dark zones after etching.
Residues of A-segregates are residues,after forging-inducedflattening andfragmentation, of positivemacro-segregatedcylindrical channels,distributed along a conepointing towards the top ofthe ingot (A-segregates).They can be present in themacro-segregated as wellas in the non-segregatedzones. The residues of A-segregates can beconsidered as a specifictype of ghost line.
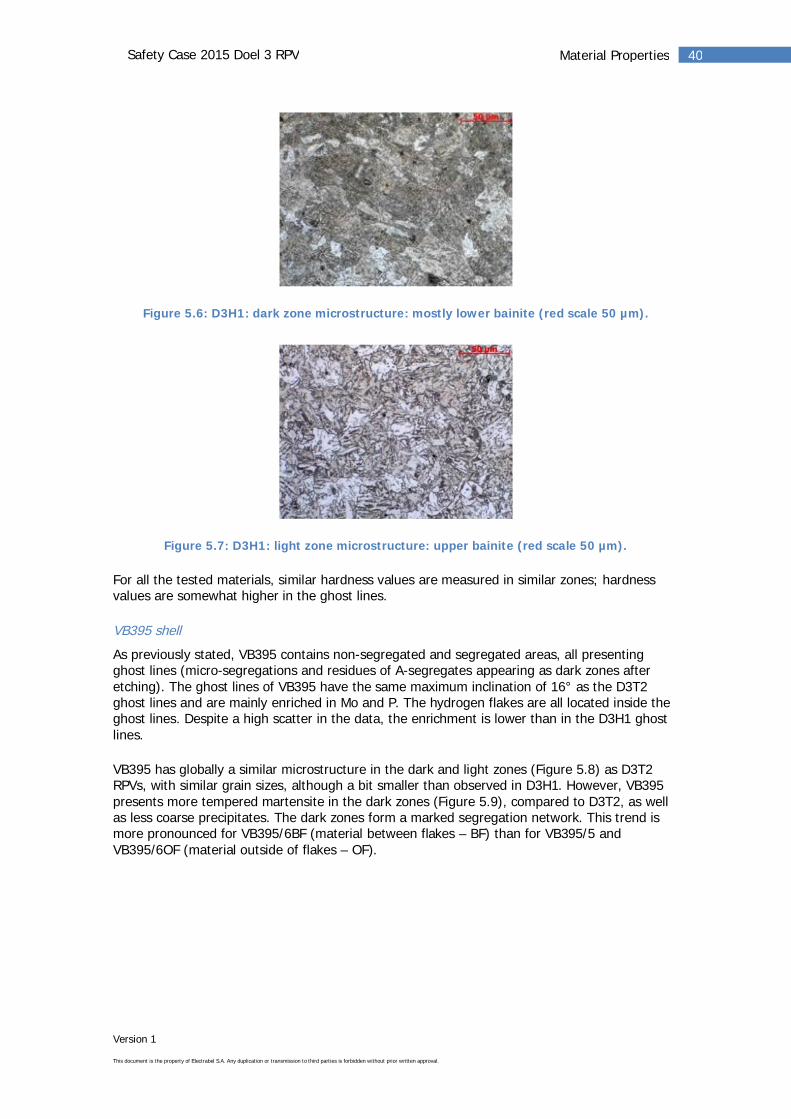
Version 1
This document is the property of Electrabel S.A. Any duplication or transmission to third parties is forbidden without prior written approval.
40Material PropertiesSafety Case 2015 Doel 3 RPV
Figure 5.6: D3H1: dark zone microstructure: mostly lower bainite (red scale 50 µm).
Figure 5.7: D3H1: light zone microstructure: upper bainite (red scale 50 µm).
For all the tested materials, similar hardness values are measured in similar zones; hardnessvalues are somewhat higher in the ghost lines.
VB395 shell
As previously stated, VB395 contains non-segregated and segregated areas, all presentingghost lines (micro-segregations and residues of A-segregates appearing as dark zones afteretching). The ghost lines of VB395 have the same maximum inclination of 16° as the D3T2ghost lines and are mainly enriched in Mo and P. The hydrogen flakes are all located inside theghost lines. Despite a high scatter in the data, the enrichment is lower than in the D3H1 ghostlines.
VB395 has globally a similar microstructure in the dark and light zones (Figure 5.8) as D3T2RPVs, with similar grain sizes, although a bit smaller than observed in D3H1. However, VB395presents more tempered martensite in the dark zones (Figure 5.9), compared to D3T2, as wellas less coarse precipitates. The dark zones form a marked segregation network. This trend ismore pronounced for VB395/6BF (material between flakes – BF) than for VB395/5 andVB395/6OF (material outside of flakes – OF).
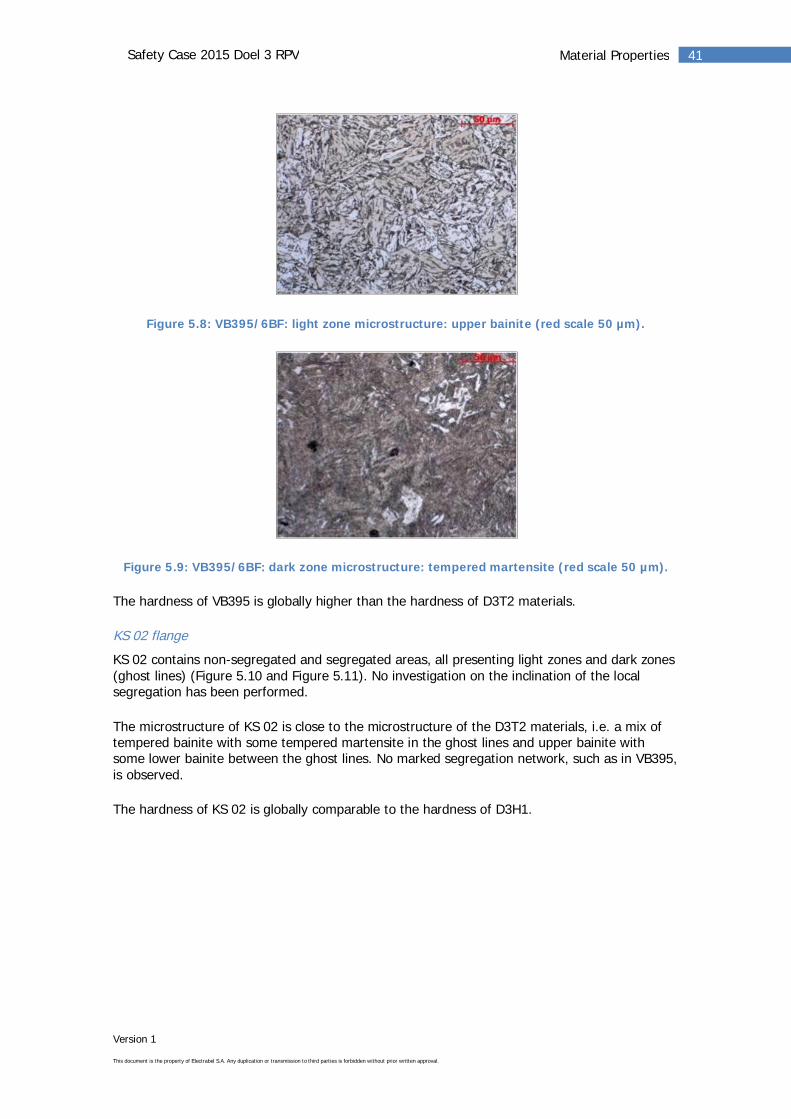
Version 1
This document is the property of Electrabel S.A. Any duplication or transmission to third parties is forbidden without prior written approval.
41Material PropertiesSafety Case 2015 Doel 3 RPV
Figure 5.8: VB395/6BF: light zone microstructure: upper bainite (red scale 50 µm).
Figure 5.9: VB395/6BF: dark zone microstructure: tempered martensite (red scale 50 µm).
The hardness of VB395 is globally higher than the hardness of D3T2 materials.
KS 02 flange
KS 02 contains non-segregated and segregated areas, all presenting light zones and dark zones(ghost lines) (Figure 5.10 and Figure 5.11). No investigation on the inclination of the localsegregation has been performed.
The microstructure of KS 02 is close to the microstructure of the D3T2 materials, i.e. a mix oftempered bainite with some tempered martensite in the ghost lines and upper bainite withsome lower bainite between the ghost lines. No marked segregation network, such as in VB395,is observed.
The hardness of KS 02 is globally comparable to the hardness of D3H1.
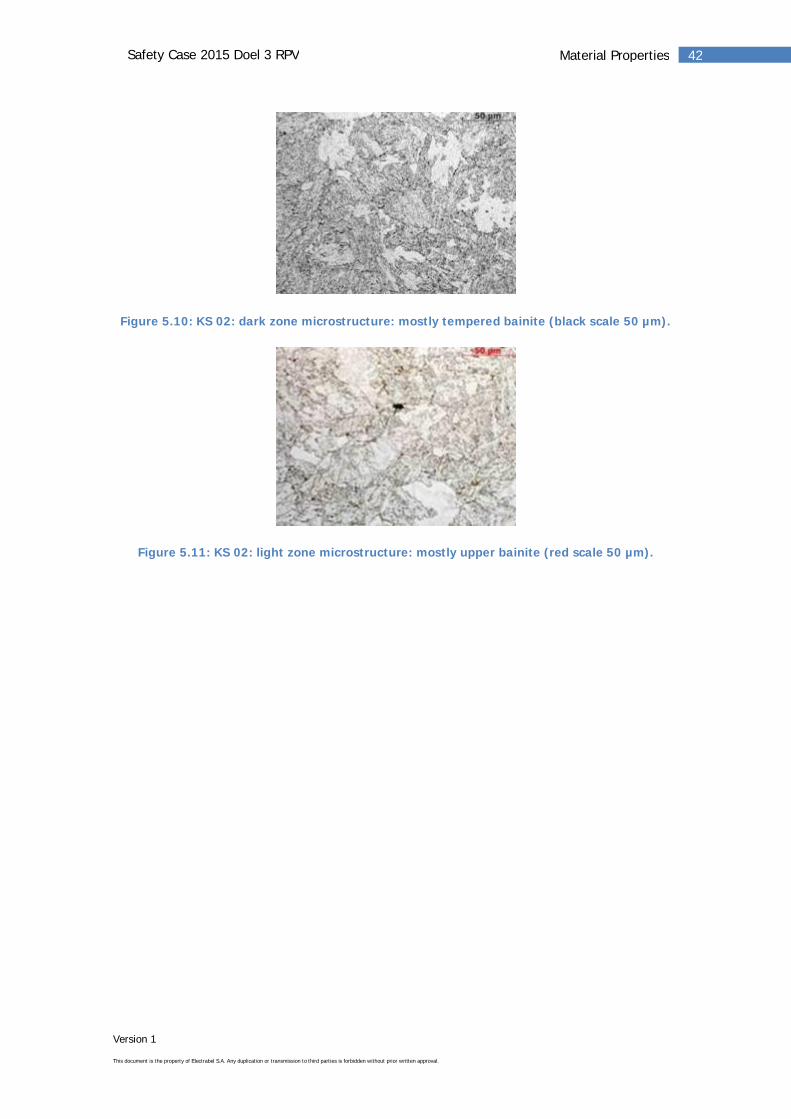
Version 1
This document is the property of Electrabel S.A. Any duplication or transmission to third parties is forbidden without prior written approval.
42Material PropertiesSafety Case 2015 Doel 3 RPV
Figure 5.10: KS 02: dark zone microstructure: mostly tempered bainite (black scale 50 µm).
Figure 5.11: KS 02: light zone microstructure: mostly upper bainite (red scale 50 µm).
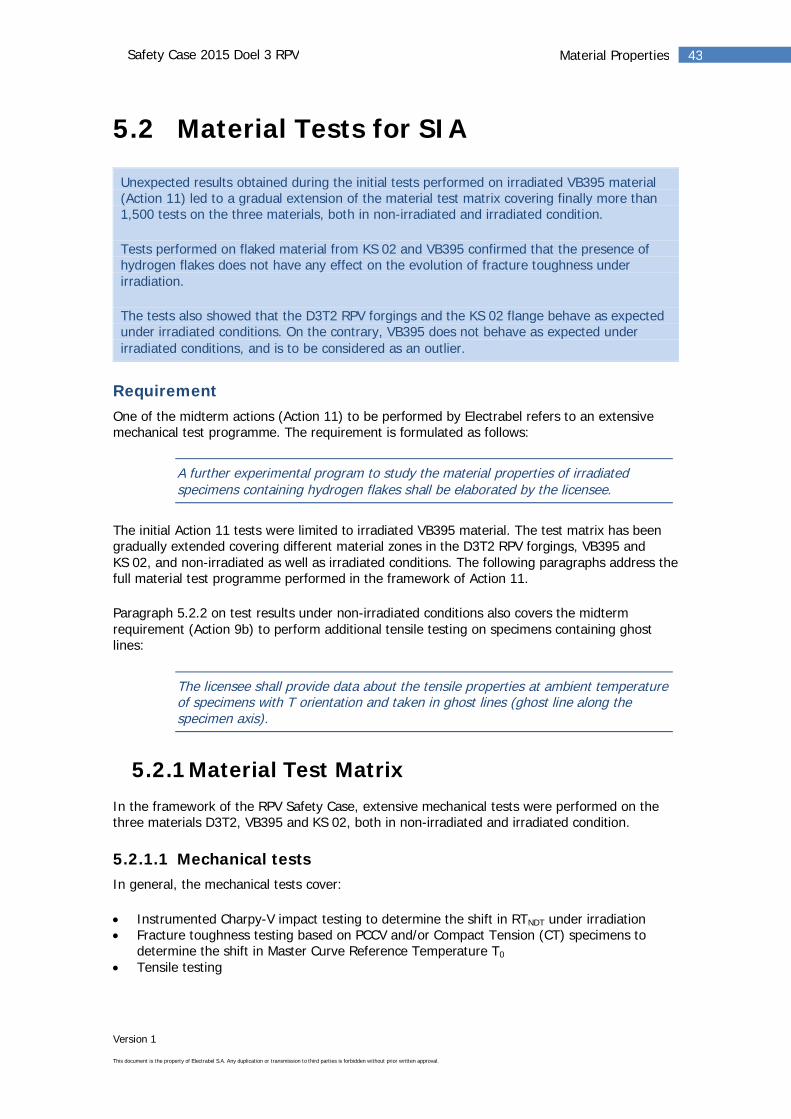
Version 1
This document is the property of Electrabel S.A. Any duplication or transmission to third parties is forbidden without prior written approval.
43Material PropertiesSafety Case 2015 Doel 3 RPV
5.2 Material Tests for SIA
Unexpected results obtained during the initial tests performed on irradiated VB395 material(Action 11) led to a gradual extension of the material test matrix covering finally more than1,500 tests on the three materials, both in non-irradiated and irradiated condition.
Tests performed on flaked material from KS 02 and VB395 confirmed that the presence ofhydrogen flakes does not have any effect on the evolution of fracture toughness underirradiation.
The tests also showed that the D3T2 RPV forgings and the KS 02 flange behave as expectedunder irradiated conditions. On the contrary, VB395 does not behave as expected underirradiated conditions, and is to be considered as an outlier.
RequirementOne of the midterm actions (Action 11) to be performed by Electrabel refers to an extensivemechanical test programme. The requirement is formulated as follows:
A further experimental program to study the material properties of irradiatedspecimens containing hydrogen flakes shall be elaborated by the licensee.
The initial Action 11 tests were limited to irradiated VB395 material. The test matrix has beengradually extended covering different material zones in the D3T2 RPV forgings, VB395 andKS 02, and non-irradiated as well as irradiated conditions. The following paragraphs address thefull material test programme performed in the framework of Action 11.
Paragraph 5.2.2 on test results under non-irradiated conditions also covers the midtermrequirement (Action 9b) to perform additional tensile testing on specimens containing ghostlines:
The licensee shall provide data about the tensile properties at ambient temperatureof specimens with T orientation and taken in ghost lines (ghost line along thespecimen axis).
5.2.1Material Test MatrixIn the framework of the RPV Safety Case, extensive mechanical tests were performed on thethree materials D3T2, VB395 and KS 02, both in non-irradiated and irradiated condition.
5.2.1.1 Mechanical testsIn general, the mechanical tests cover:
Instrumented Charpy-V impact testing to determine the shift in RTNDT under irradiationFracture toughness testing based on PCCV and/or Compact Tension (CT) specimens todetermine the shift in Master Curve Reference Temperature T0
Tensile testing
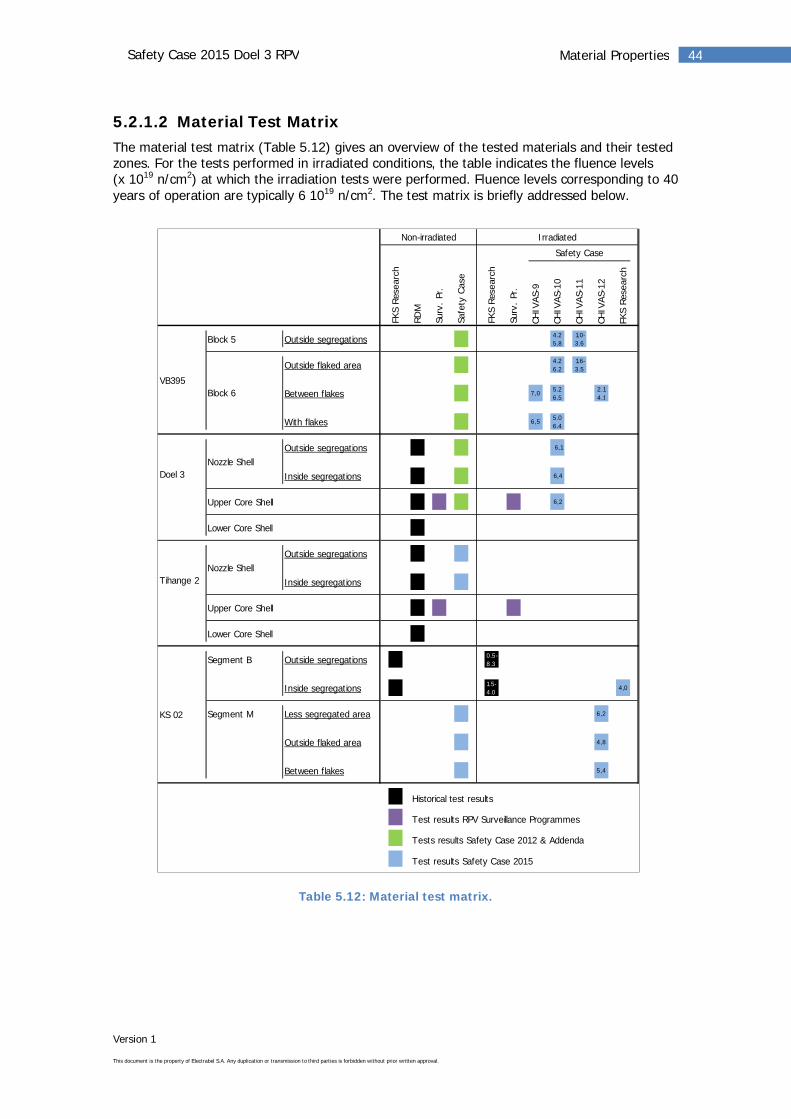
Version 1
This document is the property of Electrabel S.A. Any duplication or transmission to third parties is forbidden without prior written approval.
44Material PropertiesSafety Case 2015 Doel 3 RPV
5.2.1.2 Material Test MatrixThe material test matrix (Table 5.12) gives an overview of the tested materials and their testedzones. For the tests performed in irradiated conditions, the table indicates the fluence levels(x 1019 n/cm2) at which the irradiation tests were performed. Fluence levels corresponding to 40years of operation are typically 6 1019 n/cm2. The test matrix is briefly addressed below.
Table 5.12: Material test matrix.
CHIV
AS-
9
CHIV
AS-
10
CHIV
AS-
11
CHIV
AS-
12
FKS
Res
earc
h
Block 5 Outside segregations 4.25.8
1.0-3.6
Outside flaked area 4.26.2
1.6-3.5
Between flakes 7,0 5.26.5
2.14.1
With flakes 6,5 5.06.4
Outside segregations 6,1
Inside segregations 6,4
Upper Core Shell 6,2
Lower Core Shell
Outside segregations
Inside segregations
Upper Core Shell
Lower Core Shell
Segment B Outside segregations 0.5-8.3
Inside segregations 1.5-4.0
4,0
Segment M Less segregated area 6,2
Outside flaked area 4,8
Between flakes 5,4
Historical test results
Test results RPV Surveillance Programmes
Tests results Safety Case 2012 & Addenda
Test results Safety Case 2015
KS 02
Safety Case
Safe
tyCas
e
VB395
Doel 3
Tihange 2
Non-irradiated Irradiated
Block 6
Nozzle Shell
Nozzle Shell
Surv
.Pr
.
RDM
Surv
.Pr
.
FKS
Res
earc
h
FKS
Res
earc
h
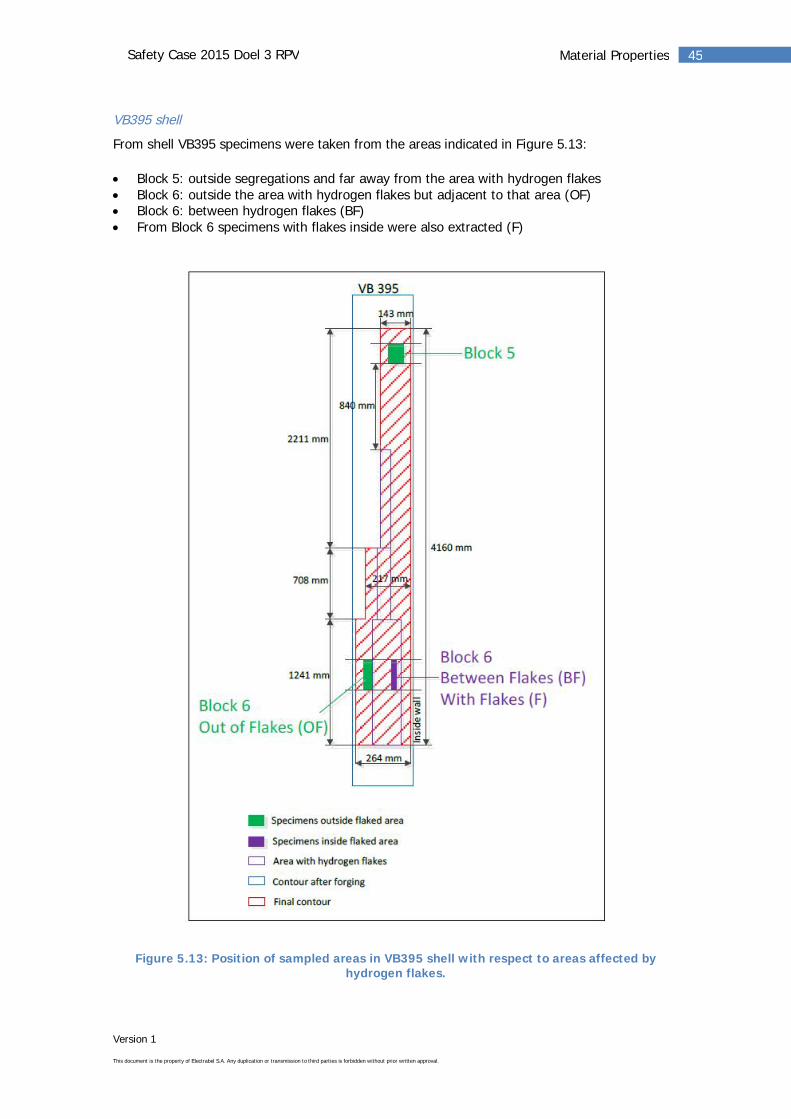
Version 1
This document is the property of Electrabel S.A. Any duplication or transmission to third parties is forbidden without prior written approval.
45Material PropertiesSafety Case 2015 Doel 3 RPV
VB395 shell
From shell VB395 specimens were taken from the areas indicated in Figure 5.13:
Block 5: outside segregations and far away from the area with hydrogen flakesBlock 6: outside the area with hydrogen flakes but adjacent to that area (OF)Block 6: between hydrogen flakes (BF)From Block 6 specimens with flakes inside were also extracted (F)
Figure 5.13: Position of sampled areas in VB395 shell with respect to areas affected byhydrogen flakes.
Version 1
This document is the property of Electrabel S.A. Any duplication or transmission to third parties is forbidden without prior written approval.
46Material PropertiesSafety Case 2015 Doel 3 RPV
D3T2 RPV forgings
The baseline mechanical properties of the D3T2 RPV forgings were determined through theacceptance tests performed by RDM at the time of manufacturing.The core shells of both RPVs were further covered by the RPV Surveillance Programme.This programme includes only material from the non-segregated area of the upper coreshells of both RPV’s and allows assessing the evolution of the mechanical properties as afunction of fluence. In the framework of the Safety Case, some additional testing wasperformed on specimens taken from remaining material from the Doel 3 RPV SurveillanceProgramme.Additional testing was also performed on specimens taken from the nozzle shell cut-outsD3H1 (Doel 3) and T2H2 (Tihange 2) corresponding to the central parts of the nozzleshells. In both cases, specimens were taken in the segregated and non-segregated areas.Only Doel 3 specimens were irradiated (Chivas-10) and tested.
KS 02 flange
Both in non-irradiated and irradiated conditions, the majority of tests on specimens fromthe segregated and non-segregated areas of segment KS 02 B, were performed in the1980s in the framework of the German FKS (Forschungsvorhaben Komponenten Sicherheit)research programme.The specimens from the segregated area were irradiated and tested by Siemens/KWU –part of them is still at AREVA Erlangen. In the framework of the Safety Case, it wasdemonstrated that the specimens tested in the framework of FKS were actually takenbetween the hydrogen flakes. In order to get a valid T0 value under irradiated condition (tobe compared to the corresponding RTNDT), PCCV specimens were reconstituted fromirradiated broken Charpy-halves and tested at AREVA Erlangen.In addition, testing and examinations were performed on specimens taken from theremaining segment KS 02 M containing a few tens of hydrogen flakes. The tests wereperformed under non-irradiated and irradiated conditions (Chivas-12).
Conclusions
A comprehensive mechanical test programme was performed on the three materials: D3T2 RPVforgings, VB395 shell and KS 02 flange, covering more than 1500 specimens. The specimenswere taken from segregated and non-segregated areas, between hydrogen flakes and outsidethe flaked area, and some specimens even contained flakes inside. In addition, specimens weretaken in different orientations within the forgings. Testing under irradiated conditions wasperformed at different fluence levels up to the expected fluence of the RPVs at 40 years ofoperation.
5.2.2Results under Non-Irradiated ConditionsBasically, mechanical properties under non-irradiated conditions must be determined in order tohave a reference point for addressing the effect of irradiation. As such, for all availablematerials the initial values of RTNDT and Master Curve T0 have been determined.
However, in the framework of the 2012 Safety Case and its Addenda, numerous tests wereperformed on non-irradiated specimens from the different zones of VB395 and from the D3nozzle shell cut-out in order to investigate the potential effect of specimen orientation, presenceof macro-segregations and the presence of flakes on the mechanical properties. Initially, mainlyfracture toughness tests were performed (T0 approach), either on PCCV or CT12.5 specimens,but in 2014 additional Charpy impact testing was performed in order to determine the differentmaterials reference RTNDT values.
Version 1
This document is the property of Electrabel S.A. Any duplication or transmission to third parties is forbidden without prior written approval.
47Material PropertiesSafety Case 2015 Doel 3 RPV
The mechanical testing on different materials under non-irradiated conditions showed that inthe transition region there is no significant effect of the specimen orientation or segregationlevel on the fracture toughness. More specifically, the following may be highlighted.
D3T2 RPV forgings
Tests performed during manufacturing showed there is only a very small differencebetween the initial RTNDT values for nozzle shells and core shells (15°C) and this differenceis even smaller for the four core shells (5°C only).Additional testing in the framework of the Safety Case confirmed the limited effect ofsegregations on the initial Charpy curve: the difference in T41J between segregated andnon-segregated zone is 22°C and 6°C for the T2H2 and D3H1 nozzle shell cut-outsrespectively. In a similar way, fracture toughness tests showed that the effect ofsegregations on the initial T0 was less than 10°C for both cut-outs.In addition, tests on the D3H1 nozzle shell cut-out showed that ghost lines have practicallyno effect on Charpy properties and on fracture toughness. Three additional tensile tests onspecimens with a ghost line along the specimen axis were performed at room temperatureat the request of the AIA (Action 9b). They confirmed the results obtained previously onsimilar specimens at operating temperature, thereby confirming the good ductility of thematerial.Tests performed on the spare surveillance material from the Doel 3 Upper Core Shellshowed there is little influence of specimen orientation on fracture toughness.
KS 02 flange
Tests performed on Pellini drop weight and Charpy-V specimens taken from the segregatedand non-segregated areas showed that there is only a very small difference in initial RTNDT
value between both areas (3°C).The difference in T41J observed on the Charpy impact energy transition curves betweensegregated and non-segregated areas varies between 31°C and 47°C. However, thisdifference can at least partly be attributed to the sampling position of the non-segregatedspecimens. They were taken close to the surface and hence take profit from the beneficialeffect of quenching on their mechanical properties. Also, the difference between both areasis smaller when considering other transition curve parameters such as lateral expansion.Consequently, the observed difference in T41J is not representative for the difference ininitial RTNDT.The difference in T0 between both areas is 25°C, i.e. much smaller than the difference inT41J. This is probably also due to the fact that the larger CT specimens (50 and 100 mmthick) were sampled farther away from the surface and hence were less subjected to thequenching effect. The difference in T0 is larger than in the D3T2 forgings, but similar toVB395.Specimens taken between hydrogen flakes or outside the flaked area yield very similar T41J
values which illustrates again that the presence of hydrogen flakes has no effect on thematerial properties.
VB395 shell
The difference in Master Curve T0 encountered in different material zones in Block 6(specimens with flakes, taken between flakes or adjacent to the flaked area) is less than25°C. In terms of RTNDT, this difference is less than 20°C.In particular no significant difference in T0 is observed between CT12.5 specimens takenbetween flakes and CT12.5 specimens with a real flake as pre-crack demonstrating that thepresence of hydrogen flakes has no effect on the material properties.The maximum difference between Block 5 and Block 6 is only slightly larger than insideBlock 6, i.e. 30°C in terms of T0 and 24°C in terms of RTNDT.
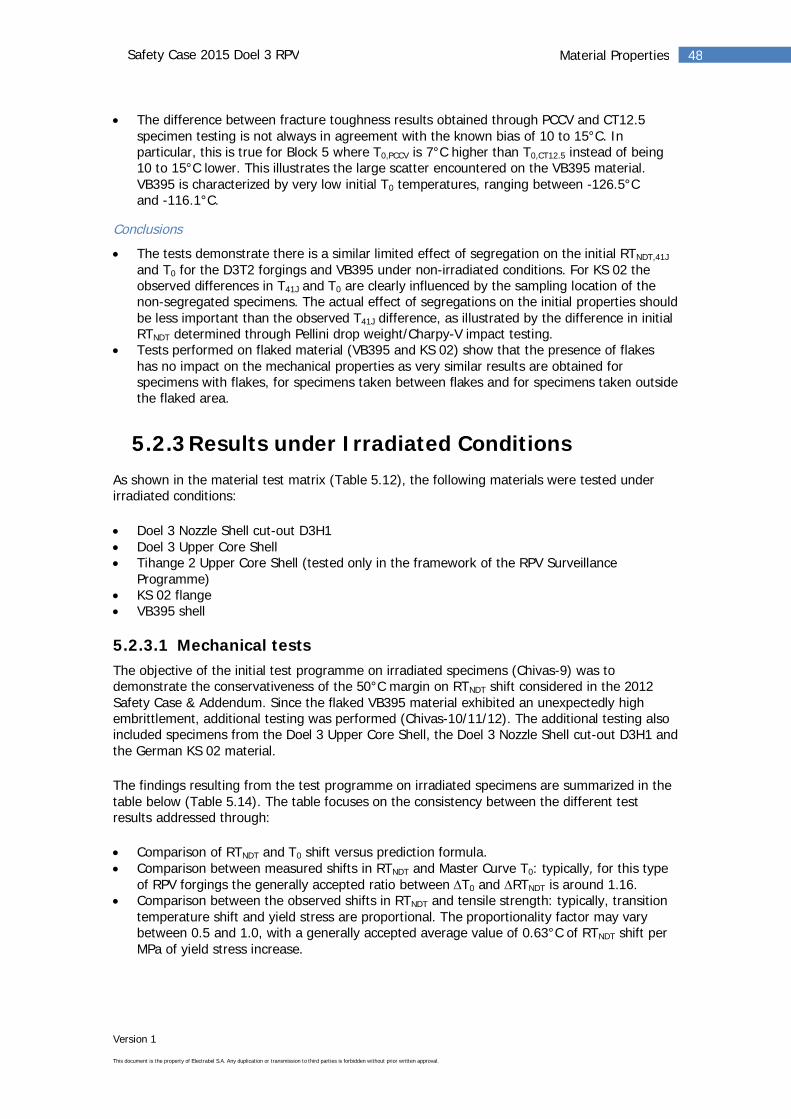
Version 1
This document is the property of Electrabel S.A. Any duplication or transmission to third parties is forbidden without prior written approval.
48Material PropertiesSafety Case 2015 Doel 3 RPV
The difference between fracture toughness results obtained through PCCV and CT12.5specimen testing is not always in agreement with the known bias of 10 to 15°C. Inparticular, this is true for Block 5 where T0,PCCV is 7°C higher than T0,CT12.5 instead of being10 to 15°C lower. This illustrates the large scatter encountered on the VB395 material.VB395 is characterized by very low initial T0 temperatures, ranging between -126.5°Cand -116.1°C.
Conclusions
The tests demonstrate there is a similar limited effect of segregation on the initial RTNDT,41J
and T0 for the D3T2 forgings and VB395 under non-irradiated conditions. For KS 02 theobserved differences in T41J and T0 are clearly influenced by the sampling location of thenon-segregated specimens. The actual effect of segregations on the initial properties shouldbe less important than the observed T41J difference, as illustrated by the difference in initialRTNDT determined through Pellini drop weight/Charpy-V impact testing.Tests performed on flaked material (VB395 and KS 02) show that the presence of flakeshas no impact on the mechanical properties as very similar results are obtained forspecimens with flakes, for specimens taken between flakes and for specimens taken outsidethe flaked area.
5.2.3Results under Irradiated ConditionsAs shown in the material test matrix (Table 5.12), the following materials were tested underirradiated conditions:
Doel 3 Nozzle Shell cut-out D3H1Doel 3 Upper Core ShellTihange 2 Upper Core Shell (tested only in the framework of the RPV SurveillanceProgramme)KS 02 flangeVB395 shell
5.2.3.1 Mechanical testsThe objective of the initial test programme on irradiated specimens (Chivas-9) was todemonstrate the conservativeness of the 50°C margin on RTNDT shift considered in the 2012Safety Case & Addendum. Since the flaked VB395 material exhibited an unexpectedly highembrittlement, additional testing was performed (Chivas-10/11/12). The additional testing alsoincluded specimens from the Doel 3 Upper Core Shell, the Doel 3 Nozzle Shell cut-out D3H1 andthe German KS 02 material.
The findings resulting from the test programme on irradiated specimens are summarized in thetable below (Table 5.14). The table focuses on the consistency between the different testresults addressed through:
Comparison of RTNDT and T0 shift versus prediction formula.Comparison between measured shifts in RTNDT and Master Curve T0: typically, for this typeof RPV forgings the generally accepted ratio between T0 and RTNDT is around 1.16.Comparison between the observed shifts in RTNDT and tensile strength: typically, transitiontemperature shift and yield stress are proportional. The proportionality factor may varybetween 0.5 and 1.0, with a generally accepted average value of 0.63°C of RTNDT shift perMPa of yield stress increase.
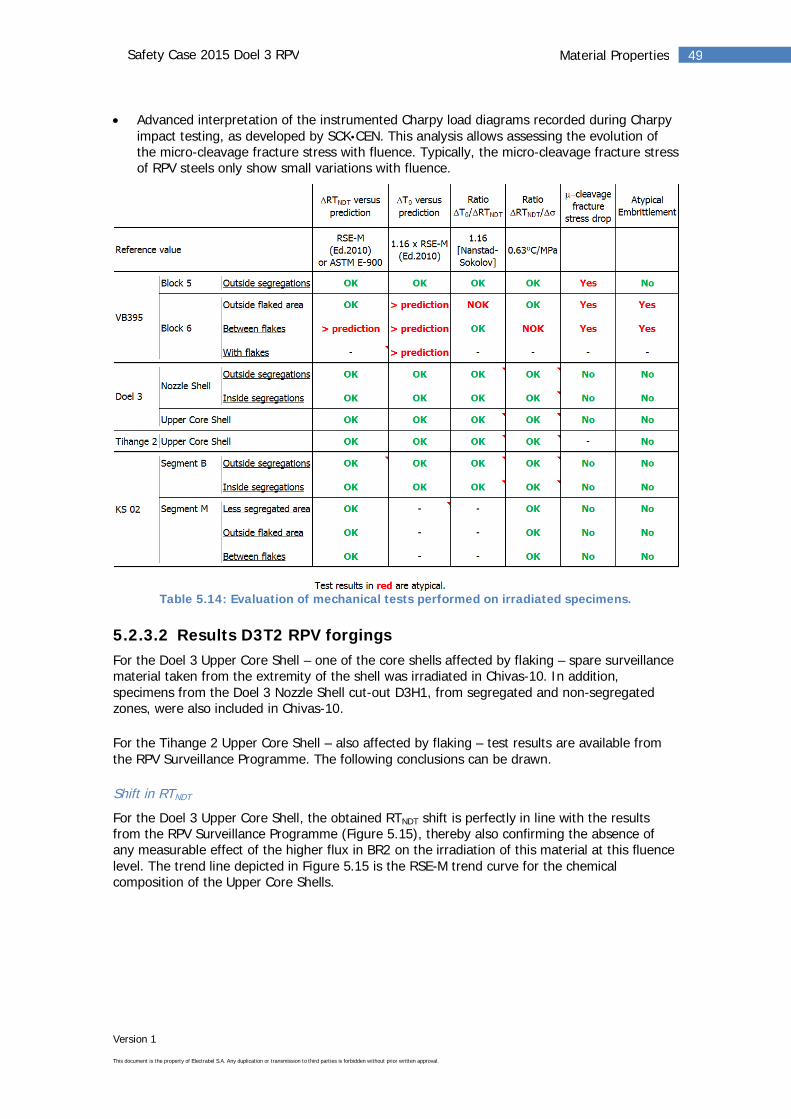
Version 1
This document is the property of Electrabel S.A. Any duplication or transmission to third parties is forbidden without prior written approval.
49Material PropertiesSafety Case 2015 Doel 3 RPV
Advanced interpretation of the instrumented Charpy load diagrams recorded during Charpyimpact testing, as developed by SCK•CEN. This analysis allows assessing the evolution ofthe micro-cleavage fracture stress with fluence. Typically, the micro-cleavage fracture stressof RPV steels only show small variations with fluence.
Table 5.14: Evaluation of mechanical tests performed on irradiated specimens.
5.2.3.2 Results D3T2 RPV forgingsFor the Doel 3 Upper Core Shell – one of the core shells affected by flaking – spare surveillancematerial taken from the extremity of the shell was irradiated in Chivas-10. In addition,specimens from the Doel 3 Nozzle Shell cut-out D3H1, from segregated and non-segregatedzones, were also included in Chivas-10.
For the Tihange 2 Upper Core Shell – also affected by flaking – test results are available fromthe RPV Surveillance Programme. The following conclusions can be drawn.
Shift in RTNDT
For the Doel 3 Upper Core Shell, the obtained RTNDT shift is perfectly in line with the resultsfrom the RPV Surveillance Programme (Figure 5.15), thereby also confirming the absence ofany measurable effect of the higher flux in BR2 on the irradiation of this material at this fluencelevel. The trend line depicted in Figure 5.15 is the RSE-M trend curve for the chemicalcomposition of the Upper Core Shells.
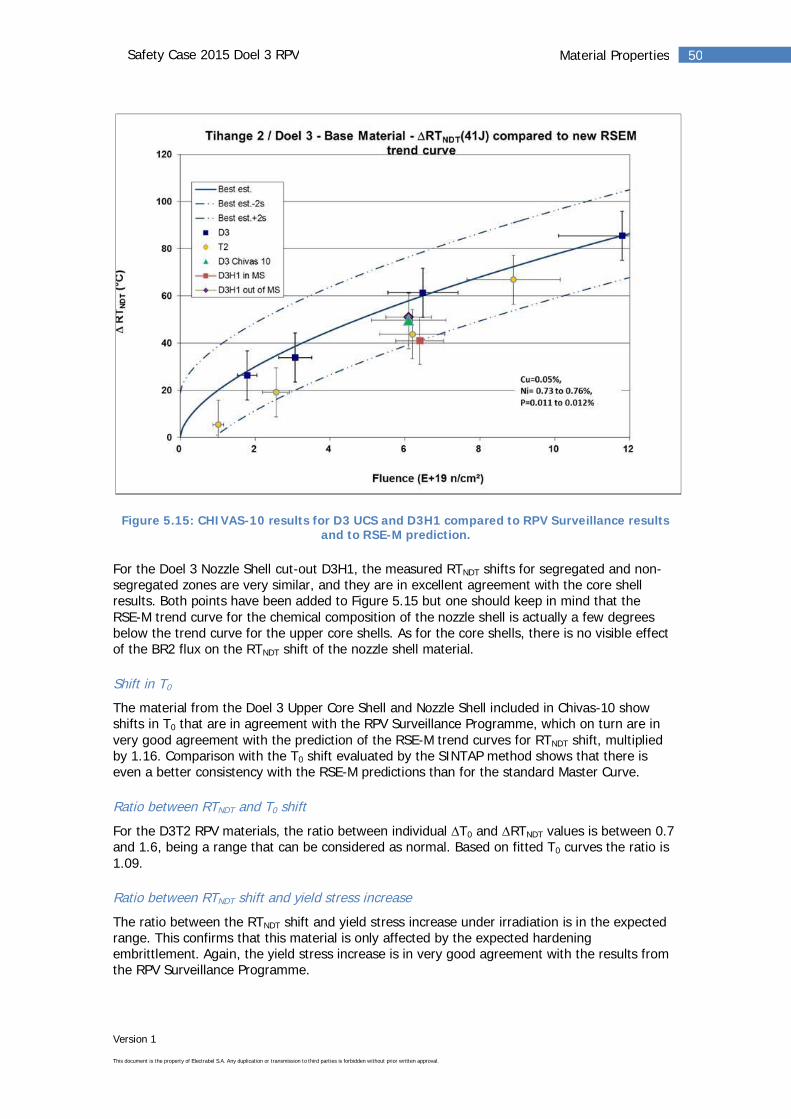
Version 1
This document is the property of Electrabel S.A. Any duplication or transmission to third parties is forbidden without prior written approval.
50Material PropertiesSafety Case 2015 Doel 3 RPV
Figure 5.15: CHIVAS-10 results for D3 UCS and D3H1 compared to RPV Surveillance resultsand to RSE-M prediction.
For the Doel 3 Nozzle Shell cut-out D3H1, the measured RTNDT shifts for segregated and non-segregated zones are very similar, and they are in excellent agreement with the core shellresults. Both points have been added to Figure 5.15 but one should keep in mind that theRSE-M trend curve for the chemical composition of the nozzle shell is actually a few degreesbelow the trend curve for the upper core shells. As for the core shells, there is no visible effectof the BR2 flux on the RTNDT shift of the nozzle shell material.
Shift in T0
The material from the Doel 3 Upper Core Shell and Nozzle Shell included in Chivas-10 showshifts in T0 that are in agreement with the RPV Surveillance Programme, which on turn are invery good agreement with the prediction of the RSE-M trend curves for RTNDT shift, multipliedby 1.16. Comparison with the T0 shift evaluated by the SINTAP method shows that there iseven a better consistency with the RSE-M predictions than for the standard Master Curve.
Ratio between RTNDT and T0 shift
For the D3T2 RPV materials, the ratio between individual T0 and RTNDT values is between 0.7and 1.6, being a range that can be considered as normal. Based on fitted T0 curves the ratio is1.09.
Ratio between RTNDT shift and yield stress increase
The ratio between the RTNDT shift and yield stress increase under irradiation is in the expectedrange. This confirms that this material is only affected by the expected hardeningembrittlement. Again, the yield stress increase is in very good agreement with the results fromthe RPV Surveillance Programme.
Version 1
This document is the property of Electrabel S.A. Any duplication or transmission to third parties is forbidden without prior written approval.
51Material PropertiesSafety Case 2015 Doel 3 RPV
Micro-cleavage fracture stress
None of the D3T2 RPV materials show a significant drop in micro-cleavage fracture stress whenfluence increases.
Conclusions on D3T2 RPV forgings
All tested D3T2 RPV materials from the upper core shells and nozzle shell show very similarshifts in RTNDT and T0, without any significant difference between segregated and non-segregated zones.The shifts are in excellent agreement with the predictive curves and correspond to theexpected hardening embrittlement.There is no measurable effect of the high BR2 flux on the measured shifts in RTNDT and T0.
5.2.3.3 Results KS 02 flangeIn the 1980s, in the framework of the German FKS research programme, specimens from thenon-segregated and segregated area of segment KS 02 B were tested under irradiatedconditions. Examinations of remnants of irradiated Charpy and Pellini specimens taken from thesegregated zone revealed laminar indications that were confirmed to be hydrogen flakes. Thisproves that KS 02 B specimens taken from the segregated zone have actually been takenbetween hydrogen flakes.
Since almost no fracture toughness values were available for the segregated zone underirradiated conditions, fracture toughness specimens were reconstituted in 2015 from remnantsof Charpy-V specimens irradiated at the highest fluence (4 1019 n/cm2), and tested.
In the CHIVAS-12 irradiation campaign specimens taken from a remaining segregated blockfrom segment KS 02 M were included. Specimens were taken between flakes (BF), outside theflaked area (OF) and in a less segregated zone.
For the different tested specimens of KS 02 the following results can be given (Figure 5.16 andFigure 5.17):
The shifts of RTNDT for specimens taken from non-segregated and segregated areas, andfrom both segments, fall practically on the same upper bound RSE-M trend curve (Figure5.16) (although not strictly applicable to this material due to its high Ni content).The CHIVAS-12 results are in line with the historical German results. This confirms theabsence of significant flux effect for this material, the BR2 flux being an order of magnitudehigher than in the German irradiations.As can be seen in Figure 5.17, the T0 shift for specimens from the segregated zone is onthe power law curve fitted through the existing results for the non-segregated area.The ratios between T0 and RTNDT are between 1.12 and 1.29, i.e. within the scatter bandaround the generally accepted value of 1.16.The ratios between RTNDT and y obtained in the FKS research programme and inCHIVAS-12 are similar and confirm there is no sign of Atypical Embrittlement of KS 02under irradiation.There is practically no evolution of the micro-cleavage fracture stress with fluence, whichagain confirms the expected embrittlement behaviour of the KS 02 material.The KS 02 results confirm that there is no specific sensitivity of this material to irradiationembrittlement due to the presence of hydrogen flakes.
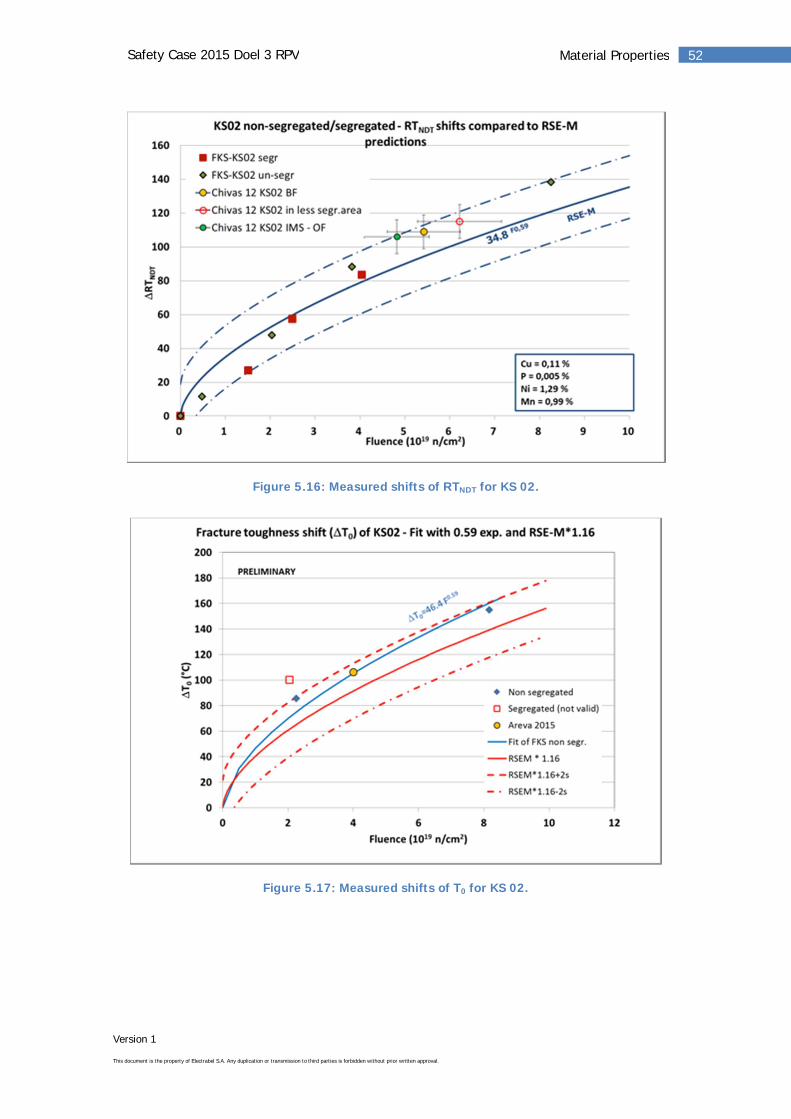
Version 1
This document is the property of Electrabel S.A. Any duplication or transmission to third parties is forbidden without prior written approval.
52Material PropertiesSafety Case 2015 Doel 3 RPV
Figure 5.16: Measured shifts of RTNDT for KS 02.
Figure 5.17: Measured shifts of T0 for KS 02.
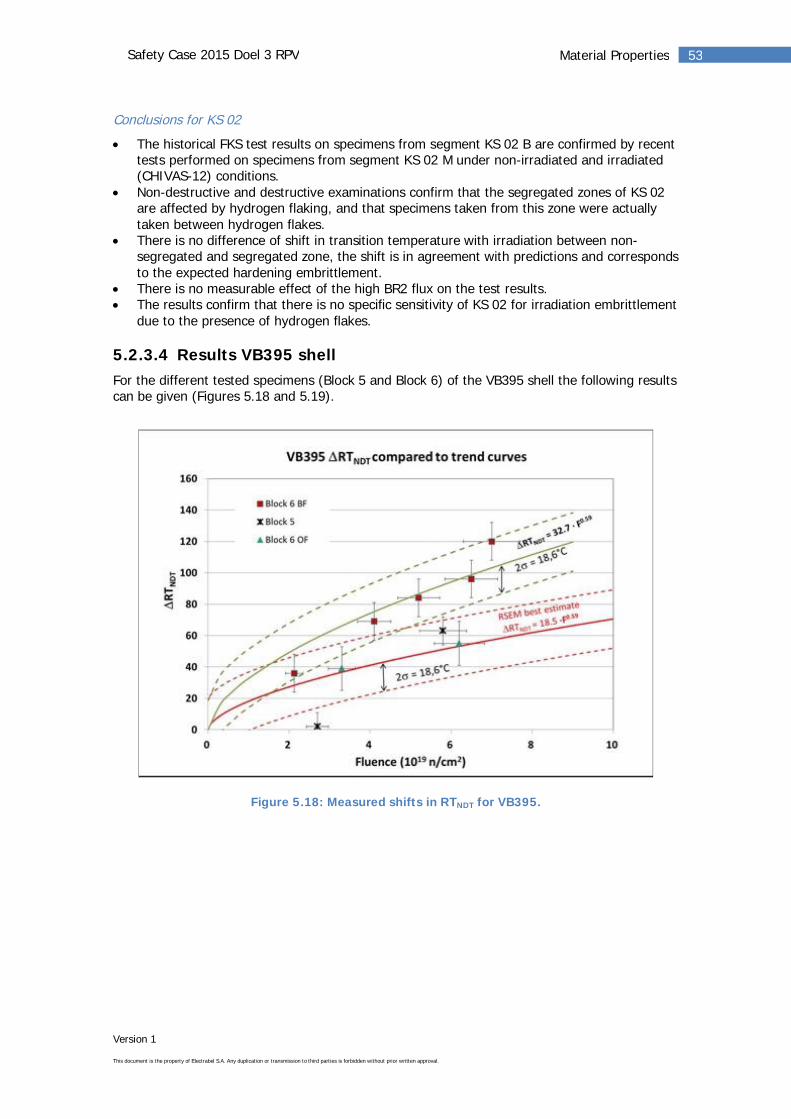
Version 1
This document is the property of Electrabel S.A. Any duplication or transmission to third parties is forbidden without prior written approval.
53Material PropertiesSafety Case 2015 Doel 3 RPV
Conclusions for KS 02
The historical FKS test results on specimens from segment KS 02 B are confirmed by recenttests performed on specimens from segment KS 02 M under non-irradiated and irradiated(CHIVAS-12) conditions.Non-destructive and destructive examinations confirm that the segregated zones of KS 02are affected by hydrogen flaking, and that specimens taken from this zone were actuallytaken between hydrogen flakes.There is no difference of shift in transition temperature with irradiation between non-segregated and segregated zone, the shift is in agreement with predictions and correspondsto the expected hardening embrittlement.There is no measurable effect of the high BR2 flux on the test results.The results confirm that there is no specific sensitivity of KS 02 for irradiation embrittlementdue to the presence of hydrogen flakes.
5.2.3.4 Results VB395 shellFor the different tested specimens (Block 5 and Block 6) of the VB395 shell the following resultscan be given (Figures 5.18 and 5.19).
Figure 5.18: Measured shifts in RTNDT for VB395.
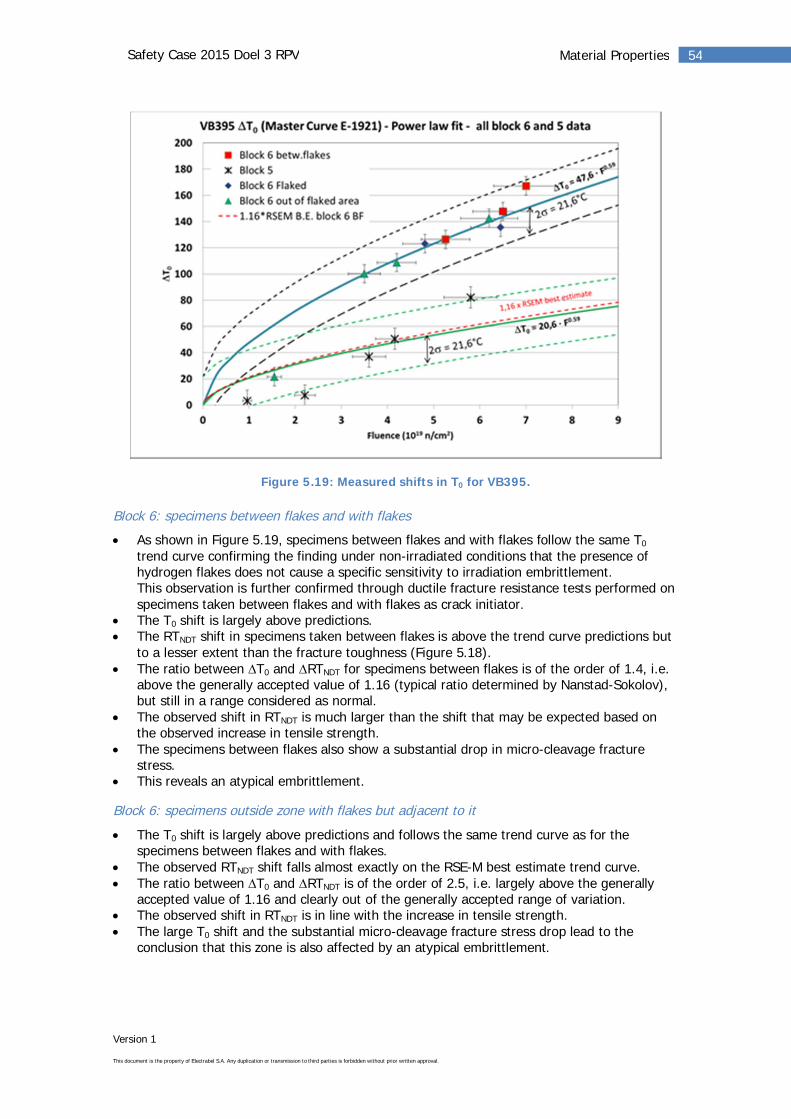
Version 1
This document is the property of Electrabel S.A. Any duplication or transmission to third parties is forbidden without prior written approval.
54Material PropertiesSafety Case 2015 Doel 3 RPV
Figure 5.19: Measured shifts in T0 for VB395.
Block 6: specimens between flakes and with flakes
As shown in Figure 5.19, specimens between flakes and with flakes follow the same T0
trend curve confirming the finding under non-irradiated conditions that the presence ofhydrogen flakes does not cause a specific sensitivity to irradiation embrittlement.This observation is further confirmed through ductile fracture resistance tests performed onspecimens taken between flakes and with flakes as crack initiator.The T0 shift is largely above predictions.The RTNDT shift in specimens taken between flakes is above the trend curve predictions butto a lesser extent than the fracture toughness (Figure 5.18).The ratio between T0 and RTNDT for specimens between flakes is of the order of 1.4, i.e.above the generally accepted value of 1.16 (typical ratio determined by Nanstad-Sokolov),but still in a range considered as normal.The observed shift in RTNDT is much larger than the shift that may be expected based onthe observed increase in tensile strength.The specimens between flakes also show a substantial drop in micro-cleavage fracturestress.This reveals an atypical embrittlement.
Block 6: specimens outside zone with flakes but adjacent to it
The T0 shift is largely above predictions and follows the same trend curve as for thespecimens between flakes and with flakes.The observed RTNDT shift falls almost exactly on the RSE-M best estimate trend curve.The ratio between T0 and RTNDT is of the order of 2.5, i.e. largely above the generallyaccepted value of 1.16 and clearly out of the generally accepted range of variation.The observed shift in RTNDT is in line with the increase in tensile strength.The large T0 shift and the substantial micro-cleavage fracture stress drop lead to theconclusion that this zone is also affected by an atypical embrittlement.
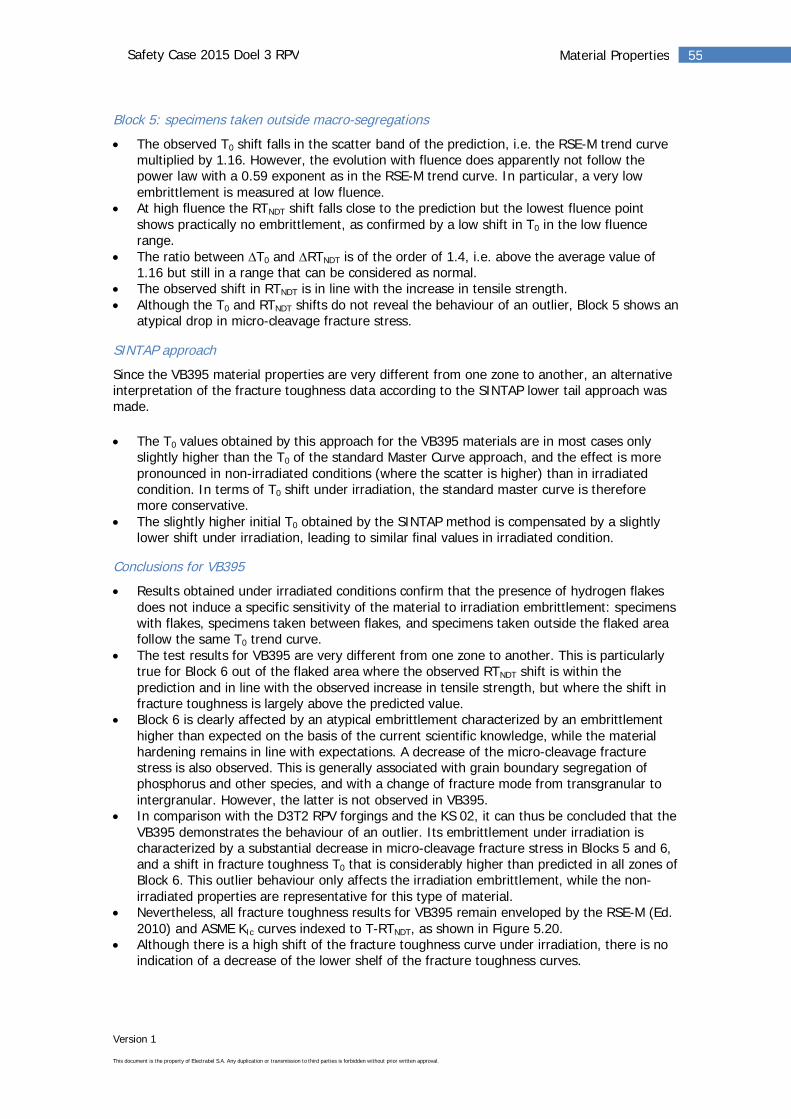
Version 1
This document is the property of Electrabel S.A. Any duplication or transmission to third parties is forbidden without prior written approval.
55Material PropertiesSafety Case 2015 Doel 3 RPV
Block 5: specimens taken outside macro-segregations
The observed T0 shift falls in the scatter band of the prediction, i.e. the RSE-M trend curvemultiplied by 1.16. However, the evolution with fluence does apparently not follow thepower law with a 0.59 exponent as in the RSE-M trend curve. In particular, a very lowembrittlement is measured at low fluence.At high fluence the RTNDT shift falls close to the prediction but the lowest fluence pointshows practically no embrittlement, as confirmed by a low shift in T0 in the low fluencerange.The ratio between T0 and RTNDT is of the order of 1.4, i.e. above the average value of1.16 but still in a range that can be considered as normal.The observed shift in RTNDT is in line with the increase in tensile strength.Although the T0 and RTNDT shifts do not reveal the behaviour of an outlier, Block 5 shows anatypical drop in micro-cleavage fracture stress.
SINTAP approach
Since the VB395 material properties are very different from one zone to another, an alternativeinterpretation of the fracture toughness data according to the SINTAP lower tail approach wasmade.
The T0 values obtained by this approach for the VB395 materials are in most cases onlyslightly higher than the T0 of the standard Master Curve approach, and the effect is morepronounced in non-irradiated conditions (where the scatter is higher) than in irradiatedcondition. In terms of T0 shift under irradiation, the standard master curve is thereforemore conservative.The slightly higher initial T0 obtained by the SINTAP method is compensated by a slightlylower shift under irradiation, leading to similar final values in irradiated condition.
Conclusions for VB395
Results obtained under irradiated conditions confirm that the presence of hydrogen flakesdoes not induce a specific sensitivity of the material to irradiation embrittlement: specimenswith flakes, specimens taken between flakes, and specimens taken outside the flaked areafollow the same T0 trend curve.The test results for VB395 are very different from one zone to another. This is particularlytrue for Block 6 out of the flaked area where the observed RTNDT shift is within theprediction and in line with the observed increase in tensile strength, but where the shift infracture toughness is largely above the predicted value.Block 6 is clearly affected by an atypical embrittlement characterized by an embrittlementhigher than expected on the basis of the current scientific knowledge, while the materialhardening remains in line with expectations. A decrease of the micro-cleavage fracturestress is also observed. This is generally associated with grain boundary segregation ofphosphorus and other species, and with a change of fracture mode from transgranular tointergranular. However, the latter is not observed in VB395.In comparison with the D3T2 RPV forgings and the KS 02, it can thus be concluded that theVB395 demonstrates the behaviour of an outlier. Its embrittlement under irradiation ischaracterized by a substantial decrease in micro-cleavage fracture stress in Blocks 5 and 6,and a shift in fracture toughness T0 that is considerably higher than predicted in all zones ofBlock 6. This outlier behaviour only affects the irradiation embrittlement, while the non-irradiated properties are representative for this type of material.Nevertheless, all fracture toughness results for VB395 remain enveloped by the RSE-M (Ed.2010) and ASME KIc curves indexed to T-RTNDT, as shown in Figure 5.20.Although there is a high shift of the fracture toughness curve under irradiation, there is noindication of a decrease of the lower shelf of the fracture toughness curves.
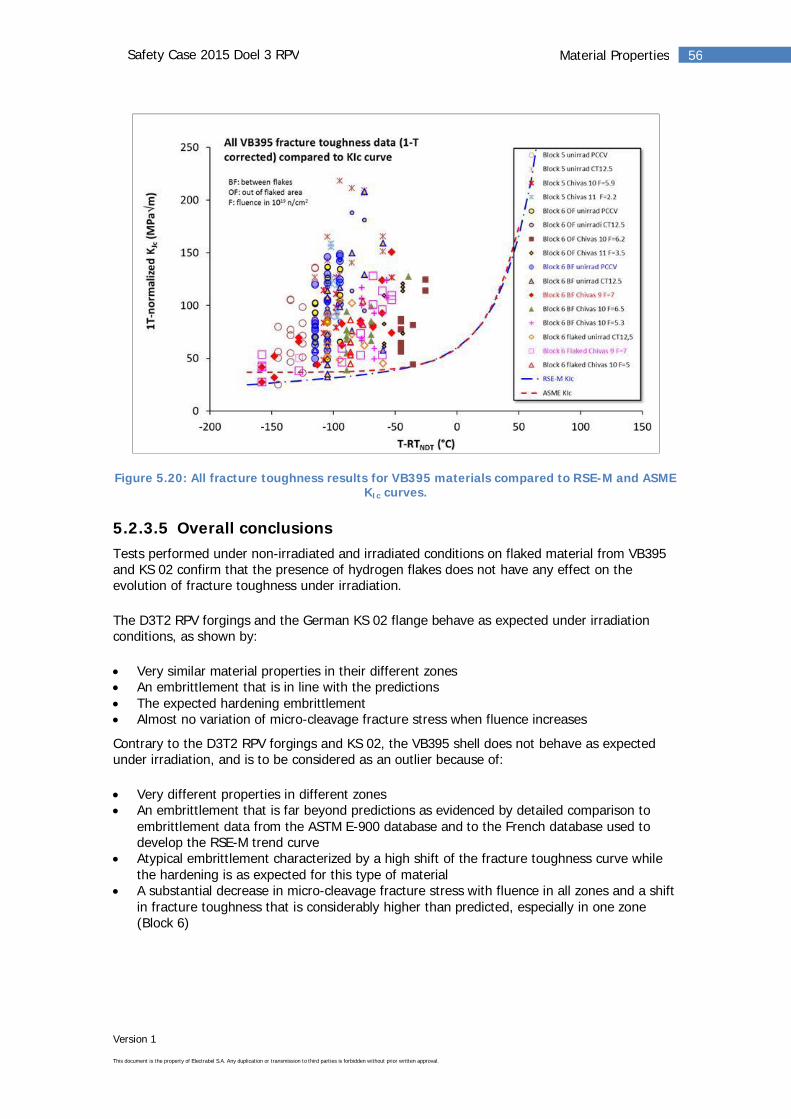
Version 1
This document is the property of Electrabel S.A. Any duplication or transmission to third parties is forbidden without prior written approval.
56Material PropertiesSafety Case 2015 Doel 3 RPV
Figure 5.20: All fracture toughness results for VB395 materials compared to RSE-M and ASMEKIc curves.
5.2.3.5 Overall conclusionsTests performed under non-irradiated and irradiated conditions on flaked material from VB395and KS 02 confirm that the presence of hydrogen flakes does not have any effect on theevolution of fracture toughness under irradiation.
The D3T2 RPV forgings and the German KS 02 flange behave as expected under irradiationconditions, as shown by:
Very similar material properties in their different zonesAn embrittlement that is in line with the predictionsThe expected hardening embrittlementAlmost no variation of micro-cleavage fracture stress when fluence increases
Contrary to the D3T2 RPV forgings and KS 02, the VB395 shell does not behave as expectedunder irradiation, and is to be considered as an outlier because of:
Very different properties in different zonesAn embrittlement that is far beyond predictions as evidenced by detailed comparison toembrittlement data from the ASTM E-900 database and to the French database used todevelop the RSE-M trend curveAtypical embrittlement characterized by a high shift of the fracture toughness curve whilethe hardening is as expected for this type of materialA substantial decrease in micro-cleavage fracture stress with fluence in all zones and a shiftin fracture toughness that is considerably higher than predicted, especially in one zone(Block 6)
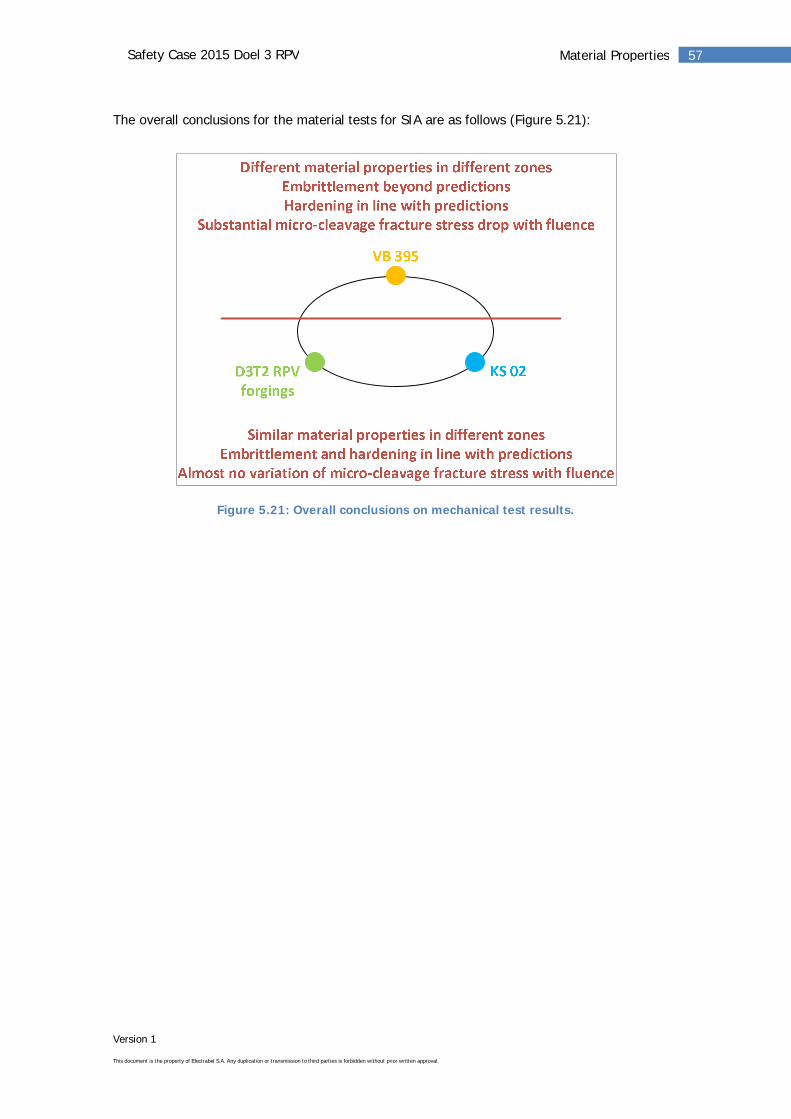
Version 1
This document is the property of Electrabel S.A. Any duplication or transmission to third parties is forbidden without prior written approval.
57Material PropertiesSafety Case 2015 Doel 3 RPV
The overall conclusions for the material tests for SIA are as follows (Figure 5.21):
Figure 5.21: Overall conclusions on mechanical test results.
Version 1
This document is the property of Electrabel S.A. Any duplication or transmission to third parties is forbidden without prior written approval.
58Material PropertiesSafety Case 2015 Doel 3 RPV
5.3 Additional Material Investigations
5.3.1 Effect of Thermal Ageing on Zones of Macro-segregation
A literature survey showed that thermal ageing is not to beexpected for the Doel 3 RPV forgings. The limited evolution ofthe mechanical properties and the small proportion of inter-granular fracture after irradiation and/or accelerated ageingtests confirmed that thermal ageing has no significant effect inthe D3T2 RPV materials.
RequirementThe FANC expressed the following additional requirement(Action 13):
The licensee shall further evaluate the effect of thermal ageing of the zone ofmacro-segregation.
ApproachThe following steps were taken to fulfil this requirement:
A literature survey was conducted on the effects of long-term thermal ageing and relatedaccelerated ageing tests.Thermal ageing was investigated through a qualitative evaluation of the sensitivity using anaccelerated ageing test (step cooling heat treatment), not representative of real serviceconditions but known to maximize thermal ageing effect. The mechanical tests wereconducted on the Doel 3 nozzle cut-out, on the VB395 materials, and for comparison withJRQ (IAEA material widely used for international benchmarking). Fractographic examinationof the fracture surfaces of the D3H1 and VB395 materials was performed using a ScanningElectron Microscope (SEM) to evaluate the intergranular character of the fracture surfaces.The fracture surfaces of (irradiated) specimens from the Doel 3 and Tihange 2 RPVSurveillance Programmes were examined by means of a SEM. The specimens had spentapproximately 25 equivalent full power years in the reactor at 285°C. The objective of theSEM examination was to look for intergranular fracture areas that could indicatephosphorus segregation on grain boundaries. Phosphorus migration towards the grainboundaries can induce embrittlement.
ConclusionsThe literature survey revealed that no thermal ageing effect is to be expected for the Doel 3RPV forgings, because of their fine grain size and relatively low phosphorus content.
Thermal Ageing is atemperature diffusion-induced embrittlement,typically characterized bysegregation at the grainboundaries inducing aninter-granular fracturemode.
Version 1
This document is the property of Electrabel S.A. Any duplication or transmission to third parties is forbidden without prior written approval.
59Material PropertiesSafety Case 2015 Doel 3 RPV
The accelerated ageing test (step cooling) showed a very limited effect on the Doel 3material in terms of Charpy properties. This effect was significantly smaller than the effecton the JRQ material. The VB395 was slightly more sensitive than the Doel 3 material butthe effect remained limited.The fracture toughness test results on D3H1 and JRQ showed an improvement of thefracture toughness (decrease of the T0 temperature) after step cooling. This illustrates thatthe occurrence of partially intergranular fracture is not synonymous of embrittlement.SEM examination of the fracture surfaces of Charpy and fracture toughness specimens fromthe Doel 3 and Tihange 2 RPV Surveillance Programme showed that the fracture mode isessentially transgranular cleavage, despite traces of local intergranular fracture.
5.3.2Large-Scale Tests
Fracture mechanics tests were performed at different temperatures by tensioning 25 mmdiameter tensile type specimens with flakes or machined notches inclined at 20° with respectto the specimen axis.
The tests confirmed the load bearing capacity of the flaked and notched specimens.
The fracture modes of the different types of specimens were as expected and were wellpredicted by the simulations using the Extended Finite Element Method.
RequirementThe FANC asked to consider two additional Bel V requirements (Action 15b):
Bel V considers that it would have been a significant contribution to thedemonstration to perform tensile testing of large-scale specimen(s) taken from theAREVA shell VB395 in the ligament between the flakes and provided with a notchmade by electro-erosion and representative of a flake with a 20° tilt angle.Comparing the results of these tests with the results of the tests performed onspecimens with tilted flakes would allow to discriminate between the effects of aflake configuration and the effects of a notch configuration on the fracturebehaviour.
Without putting into question this conclusion, Bel V reminds his reservations aboutthe fracture process of the large scale tensile specimens tested at 20°C. Thesereservations would be withdrawn if tensile testing at a temperature of about 100°Cof a specimen with 20° tilted flakes showed mostly ductile fracture.
ApproachThe following steps were taken to fulfil this requirement:
Two VB395 specimens with real flakes, artificially tilted at 20°, were tested at 100°C (in theinitial Safety Case similar specimens were tested at 20°C).Four tests were performed on 25 mm tensile VB395 specimens taken adjacent to the flakedarea and provided with an electro-eroded notch at a 20° tilt angle. Two specimens weretested at 20° and two at 100°C.The tests performed on the two types of specimens were compared.Simulations were performed using the Extended Finite Element Method in linear-elastic andelasto-plastic conditions in order to predict the fracture mode and fracture load.
Version 1
This document is the property of Electrabel S.A. Any duplication or transmission to third parties is forbidden without prior written approval.
60Material PropertiesSafety Case 2015 Doel 3 RPV
It should be pointed out that due to the presence of the inclined flake or notch, the test isactually a fracture mechanics test on a flawed component, not a traditional tensile test. Assuch, the fracture is governed by the rules of fracture mechanics, not by the tensile properties.
Results and DiscussionSpecimens with real flakes tested at 100°C show a typical ductile dimple fracture asconfirmed by SEM examinations of the fracture surface. In similar tests performed earlier at20°C some specimens had failed partly by cleavage rather than in a fully ductile manner.This is however not typical for flaked components, but it is generally observed for most RPVsteels with sharp crack tips, tested well above the Master Curve transition temperature T0.Specimens with tilted electro-eroded notches:
- At 100°C, those specimens show the same type of dimple fracture as the specimens withreal flakes.
- At 20°C, the tested specimens show a fully ductile fracture mode without cleavageinitiation. The difference with respect to the specimens with real flakes tested at 20°C isdue to the presence of a rounded notch (radius 0.15 mm) instead of a sharp crack tip inthe case of real flakes. The load-displacement curve is nevertheless comparable to thoseof the specimens with flakes.
ConclusionsThe tests confirm the load bearing capacity of specimens with real tilted hydrogen flakes ormachined tilted notches.The fracture mode of all tested specimens was well predicted by the Extended FiniteElement Method analyses.
5.3.3Assessment of the Impact of H Uptake fromthe primary side
Based on an extensive study, it can be concluded that the hydrogen uptake during operationis too low to induce propagation of the existing hydrogen flakes in the D3T2 RPVs by ahydrogen-related mechanism.
As described in the 2012 Safety Cases and their addenda (Action 10), the potential influence ofhydrogen uptake from the primary side on the propagation of the hydrogen flakes has beenextensively investigated based on literature research, calculations, finite element modellingsimulations and hydrogen measurements, as well as consultation with international experts. Theassessment has been re-validated in 2015, with an update of the literature review, with newlypublished results.
The assessment approach consisted of the following steps:
Identification of the possible hydrogen sources from the primary side (corrosion, watertreatment, radiolysis).Quantification of the hydrogen sources (the principal source is the primary H2 watertreatment; the total amount is very low).Calculation of hydrogen accumulation and pressure evolution in the flakes during normaloperation and cooldown transients using finite element and analytical modelling.Evaluation of the risk of propagation due to hydrogen-related mechanisms (hydrogen-induced cracking and blistering) based on the calculated hydrogen content and pressure inthe flakes.
Version 1
This document is the property of Electrabel S.A. Any duplication or transmission to third parties is forbidden without prior written approval.
61Material PropertiesSafety Case 2015 Doel 3 RPV
As the hydrogen content and pressure in the flakes is too low, no primary side hydrogen impactis expected on the material properties and no hydrogen-related propagation mechanism ispossible.
The approach and calculation hypotheses have been validated by measurements of residual Hcontent in flakes (showing no significant H content), through literature review and advice frominternational experts.
The absence of H-induced flake propagation is also confirmed by the absence of evolution ofthe flakes after one complete cycle and shutdown.
Version 1
This document is the property of Electrabel S.A. Any duplication or transmission to third parties is forbidden without prior written approval.
62Material PropertiesSafety Case 2015 Doel 3 RPV
5.4 Assessment of AtypicalEmbrittlement of VB395
Unexpected embrittlement results obtained on VB395 material triggered the implementationof a comprehensive root cause analysis approach. It included a literature study and acomprehensive programme of additional material investigations. A panel of internationalexperts participated actively in the whole process.
The analysis concludes that all hydrogen-related mechanisms may be excluded as root cause,showing that the hydrogen flakes are not responsible for the atypical embrittlement ofVB395. This conclusion is in line with the results on the flaked KS 02 material, which behavesas expected under irradiation.
Two possible mechanisms at the basis of the atypical embrittlement of VB395 have beenidentified. These mechanisms might be linked to the specific manufacturing history of therejected VB395 shell (different from the D3T2 RPV forgings in many aspects).
Consequently, the D3T2 RPV forgings are not expected to show an atypical embrittlementunder irradiation such as observed on VB395.
RequirementFollowing the unexpected embrittlement results obtained on the first set of irradiated VB395specimens (Action 11), additional tests were performed under different environmentalconditions and including additional reference materials. These tests allowed to exclude anytesting anomaly and confirmed the atypical embrittlement of VB395. As a consequence, asystematic root cause analysis approach was set up aiming at clarifying the unexpectedbehaviour of VB395.
This chapter addresses the implemented comprehensive root cause analysis approach. As such,it also covers Action 10b regarding the residual hydrogen content in flaked material. This item isclosely linked to the root cause analysis and was formulated as follows by the FANC:
The licensee shall perform additional measurements of the current residualhydrogen content in specimens with hydrogen flakes, in order to confirm the resultsof the limited number of tests achieved so far. For example, the licensee hasestimated an upper bound on the amount of residual hydrogen that might still bepresent in the flaws. The licensee should demonstrate that the chosen materialproperties are still valid, even if the upper bound quantity of hydrogen would stillbe present in critical flaws.
Version 1
This document is the property of Electrabel S.A. Any duplication or transmission to third parties is forbidden without prior written approval.
63Material PropertiesSafety Case 2015 Doel 3 RPV
ApproachThe implemented approach is double:
A mechanistic approach aiming at identifying the microstructural mechanisms at the basisof the atypical embrittlement of VB395. All possible embrittlement mechanisms were listed,a programme for additional material investigations was set-up (specific heat treatments,mechanical tests, chemical analyses, fractography, metallographic examinations, etc.).Based on literature data, test results and experts’ opinions, each mechanism was evaluatedand classified according to its plausibility: excluded, unlikely, possible or likely.A manufacturing history based approach looking for the possible relationship between thespecific manufacturing history of the rejected VB395 shell and its mechanical behaviourunder irradiation. Therefore, the specific aspects of the manufacturing history of VB395 ascompared to the D3T2 RPVs were identified, evaluated and classified according to the sameplausibility scale.
At the end, the combination of the findings of both approaches aims to identify the remainingpossible mechanisms at the origin of the atypical VB395 embrittlement and to determinewhether they can affect the D3T2 RPV forgings.
Results of the Mechanistic ApproachAll considered mechanisms have been qualified as excluded, unlikely or possible. The results arethe following (Figure 5.22):
Most of the mechanisms are excluded
H-induced embrittlement
Such mechanisms rely on diffusion of residual hydrogen present in the RPV material. As shownby the investigations performed under Action 10b, only a very low amount of hydrogen ismeasured, and most of it is trapped at high-energy traps. Hence, all H-induced mechanisms canbe excluded.
Irradiation induced precipitates
Cu-enriched precipitates and Mn-Ni-Si nanoscale clusters are too small to initiate cleavageand are associated with embrittlement that goes with hardening. This mechanism cannot beresponsible for the observed embrittlement that is not proportional to the observedhardening.Scanning Electron Microscope (SEM) and Transmission Electron Microscope (TEM)investigations have not revealed any large precipitates (other than expected carbides) thatcould initiate cleavage fracture.
Irradiation induced voids or bubbles
Positron Annihilation Spectroscopy (PAS) examinations on VB395 material yields similarresults as for other RPV materials. PAS results are in line with classical hardeningembrittlement, which suggests that the atypical embrittlement is not associated withirradiation induced vacancy-type defects.Bubbles of helium may be generated only at much higher fluence values.
Localised hardening due to ferrite or upper bainite phases
Metallographic analysis shows that VB395 has similar amounts of ferrite and upper bainite asthe D3H1 nozzle cut-out that behaves as expected under irradiation. Localised hardeningembrittlement resulting in a decrease of overall toughness without increase of overall hardnessis therefore excluded.
Version 1
This document is the property of Electrabel S.A. Any duplication or transmission to third parties is forbidden without prior written approval.
64Material PropertiesSafety Case 2015 Doel 3 RPV
Unstable matrix defects (UMD)
UMDs could appear during the accelerated irradiation at rather high flux in BR2, and embrittlethe material. However, applying a thermal treatment that is known to anneal UMDs did notresult in an improvement of the mechanical properties of the VB395 material, which means thatthis mechanism can be excluded.
Some mechanisms are considered as unlikely
Unlikely means that they have a low probability of being the main mechanism, but that there isno hard evidence to exclude they played some role.
Segregation of impurities to primary austenite grain and lath boundaries
Although thermal treatment test results could indicate some susceptibility of VB395 tosegregation of impurities such as P, potentially associated with the atypical embrittlement, theP-content is low and the total intergranular fracture remains low after irradiation.
Coarsening of carbides
This has never been observed at irradiation temperatures lower than 400°C and has neitherbeen observed by the performed TEM analyses. Nevertheless, the number of TEM investigationsis not high enough to totally exclude the mechanism.
Loss of strength of segregation network due to relaxation of internal stresses
Although VB395 has a specific segregation network, an annealing treatment which is notsupposed to re-introduce internal stresses, induces a quasi-complete recovery of the atypicalembrittlement.
Two mechanisms remain considered as possible
Possible means that there is no dominant evidence to demonstrate the occurrence of themechanism. The mechanism could contribute to the atypical embrittlement, but might not bethe only responsible mechanism.
Segregation of impurities to carbide or precipitate interface with matrix
Thermal treatment test results indicate some potential susceptibility of VB395 to segregation ofimpurities such as P, potentially associated with the atypical embrittlement. However, the P-content is low and hence this mechanism cannot be considered as a single mechanism.
Loss of strength of segregation network due to atypical embrittlement of martensite
A strongly marked segregation network containing tempered martensite is present in VB395,whereas this network is much less visible and contains much less tempered martensite in D3T2.Literature shows that this type of microstructure is particularly sensitive to irradiationembrittlement due to enhanced diffusion of P in martensite. As shown above, VB395 could besusceptible to segregation of impurities.
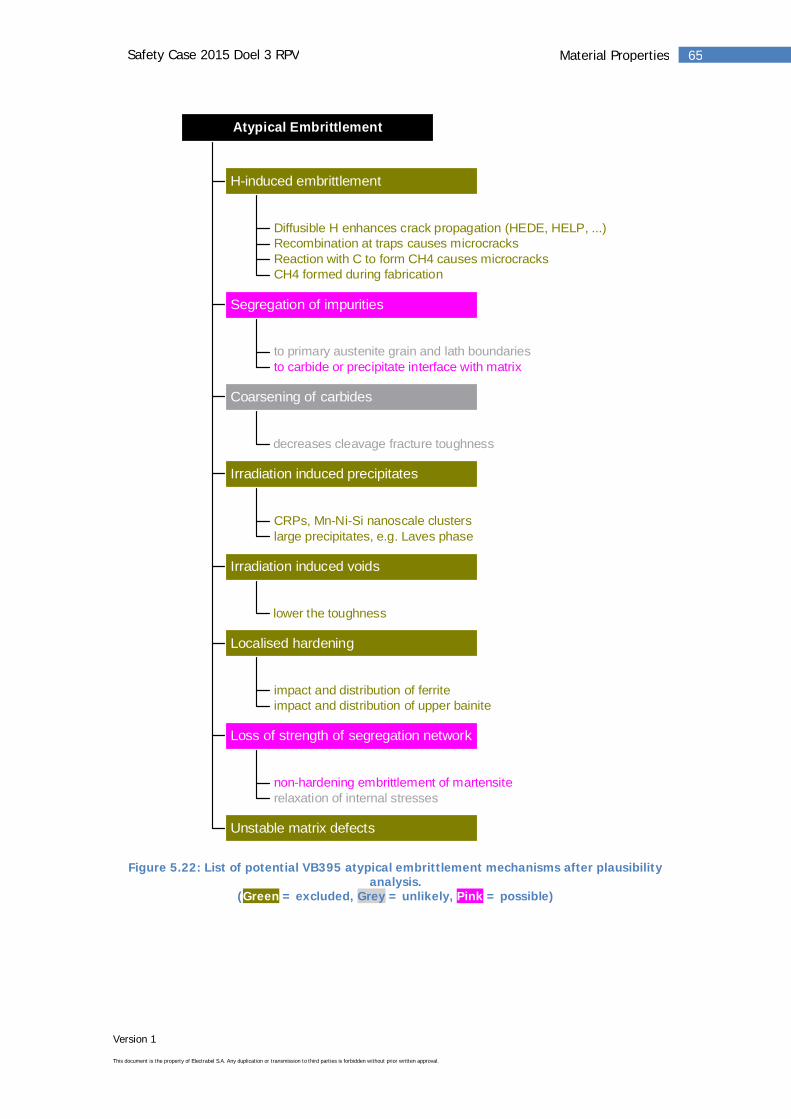
Version 1
This document is the property of Electrabel S.A. Any duplication or transmission to third parties is forbidden without prior written approval.
65Material PropertiesSafety Case 2015 Doel 3 RPV
Figure 5.22: List of potential VB395 atypical embrittlement mechanisms after plausibilityanalysis.
(Green = excluded, Grey = unlikely, Pink = possible)
Diffusible H enhances crack propagation (HEDE, HELP, ...)Recombination at traps causes microcracksReaction with C to form CH4 causes microcracksCH4 formed during fabrication
H-induced embrittlement
to primary austenite grain and lath boundariesto carbide or precipitate interface with matrix
Segregation of impurities
decreases cleavage fracture toughness
Coarsening of carbides
CRPs, Mn-Ni-Si nanoscale clusterslarge precipitates, e.g. Laves phase
Irradiation induced precipitates
lower the toughness
Irradiation induced voids
impact and distribution of ferriteimpact and distribution of upper bainite
Localised hardening
non-hardening embrittlement of martensiterelaxation of internal stresses
Loss of strength of segregation network
Unstable matrix defects
Atypical Embrittlement
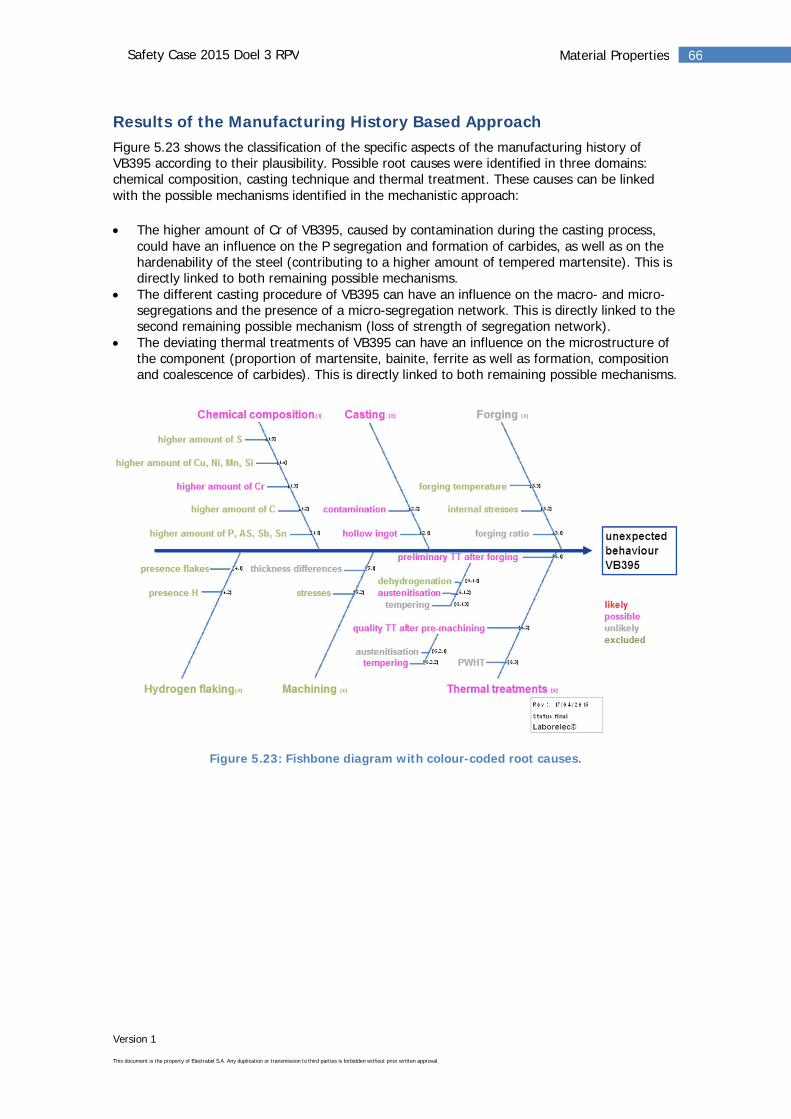
Version 1
This document is the property of Electrabel S.A. Any duplication or transmission to third parties is forbidden without prior written approval.
66Material PropertiesSafety Case 2015 Doel 3 RPV
Results of the Manufacturing History Based ApproachFigure 5.23 shows the classification of the specific aspects of the manufacturing history ofVB395 according to their plausibility. Possible root causes were identified in three domains:chemical composition, casting technique and thermal treatment. These causes can be linkedwith the possible mechanisms identified in the mechanistic approach:
The higher amount of Cr of VB395, caused by contamination during the casting process,could have an influence on the P segregation and formation of carbides, as well as on thehardenability of the steel (contributing to a higher amount of tempered martensite). This isdirectly linked to both remaining possible mechanisms.The different casting procedure of VB395 can have an influence on the macro- and micro-segregations and the presence of a micro-segregation network. This is directly linked to thesecond remaining possible mechanism (loss of strength of segregation network).The deviating thermal treatments of VB395 can have an influence on the microstructure ofthe component (proportion of martensite, bainite, ferrite as well as formation, compositionand coalescence of carbides). This is directly linked to both remaining possible mechanisms.
Figure 5.23: Fishbone diagram with colour-coded root causes.
Version 1
This document is the property of Electrabel S.A. Any duplication or transmission to third parties is forbidden without prior written approval.
67Material PropertiesSafety Case 2015 Doel 3 RPV
ConclusionThe root cause analysis of the atypical VB395 embrittlement concludes that severalmechanisms can be excluded. In particular, hydrogen flaking or any other hydrogen relatedmechanism can be excluded as the cause of the unexpected behaviour. This conclusion isalso further supported by the results on the German KS 02 material, which shows animportant amount of hydrogen flakes and is not affected by atypical embrittlement underirradiation.No likely mechanisms responsible for atypical embrittlement were identified. However, twomechanisms are considered as possible: segregation of impurities to carbide or precipitateinterface with matrix, and loss of strength of the segregation network due to atypicalembrittlement of martensite.Both mechanisms might be linked to specific aspects of the manufacturing history of therejected VB395 shell that were evaluated as being possible root causes. These aspects arerelated to chemical composition, casting technique and thermal treatment.Since the larger than predicted shift in transition temperature after irradiation of VB395 isnot linked with the hydrogen flaking and since none of the above mentioned manufacturingspecificities are reported for the D3T2 RPVs, it is expected the D3T2 RPV shells do notsuffer from the atypical embrittlement observed on VB395.

Version 1
This document is the property of Electrabel S.A. Any duplication or transmission to third parties is forbidden without prior written approval.
68Material PropertiesSafety Case 2015 Doel 3 RPV
5.5 Material Properties Considered in theSIA
Although it is very unlikely that the D3T2 RPV forgings would be more sensitive to irradiationbecause of the presence of hydrogen flakes, the SIA is based on the assumption that theD3T2 RPVs have an additional sensitivity to irradiation embrittlement of the same magnitudeas the VB395 material. This atypical embrittlement of the VB395 is superposed in aconservative way on the commonly used RSE-M trend curve for the D3T2 RPVs, consideringa conservative envelope of the macro-segregation chemical composition.
5.5.12012 Safety Case and AddendumThe SIA of the Doel 3 RPV included in the 2012 Safety Case was performed on the basis of theRTNDT versus fluence trend curve given in Figure 5.24. This trend curve was constructed startingfrom the French FIS embrittlement trend curve evaluated for the D3T2 core shell chemicalcomposition, with an additional shift of 50°C to take into account the effects of orientation,segregation and irradiation sensitivity of the segregated zone.
RTNDT = RTNDT,init + RTNDT,FIS + 50°C
Figure 5.24: Trend curve RTNDT as a function of fluence considered in 2012 Safety Case.
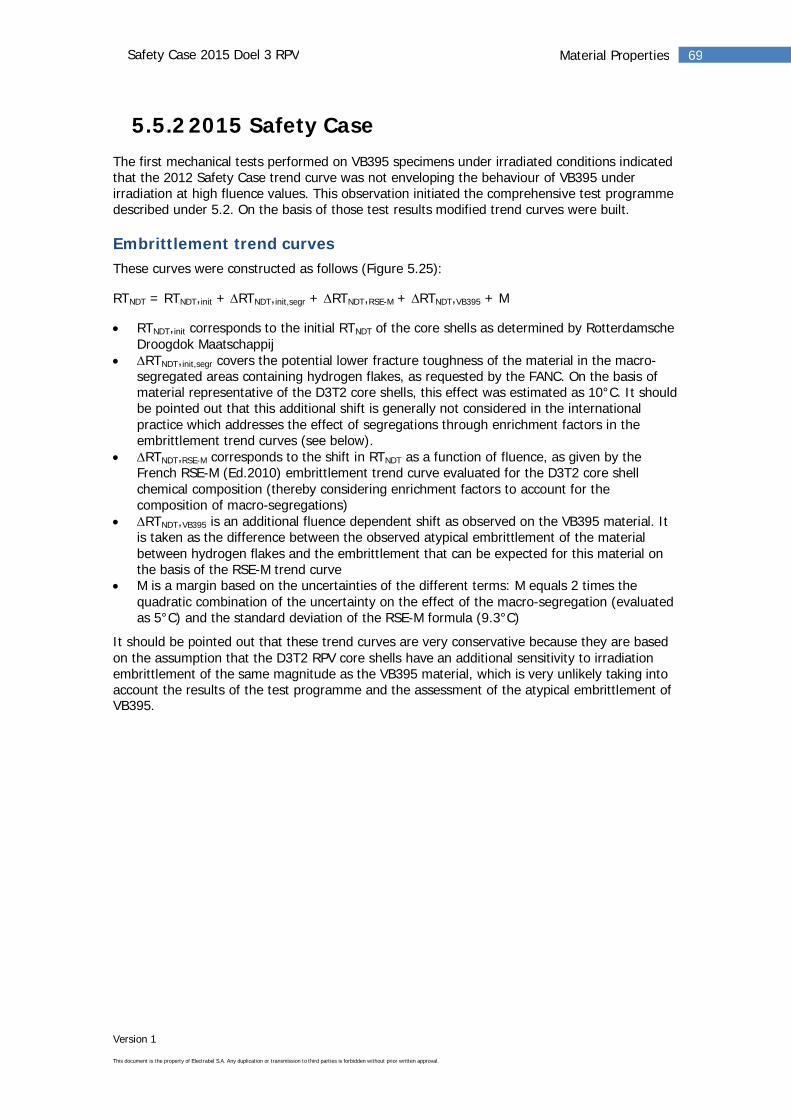
Version 1
This document is the property of Electrabel S.A. Any duplication or transmission to third parties is forbidden without prior written approval.
69Material PropertiesSafety Case 2015 Doel 3 RPV
5.5.22015 Safety CaseThe first mechanical tests performed on VB395 specimens under irradiated conditions indicatedthat the 2012 Safety Case trend curve was not enveloping the behaviour of VB395 underirradiation at high fluence values. This observation initiated the comprehensive test programmedescribed under 5.2. On the basis of those test results modified trend curves were built.
Embrittlement trend curvesThese curves were constructed as follows (Figure 5.25):
RTNDT = RTNDT,init + RTNDT,init,segr + RTNDT,RSE-M + RTNDT,VB395 + M
RTNDT,init corresponds to the initial RTNDT of the core shells as determined by RotterdamscheDroogdok MaatschappijRTNDT,init,segr covers the potential lower fracture toughness of the material in the macro-
segregated areas containing hydrogen flakes, as requested by the FANC. On the basis ofmaterial representative of the D3T2 core shells, this effect was estimated as 10°C. It shouldbe pointed out that this additional shift is generally not considered in the internationalpractice which addresses the effect of segregations through enrichment factors in theembrittlement trend curves (see below).RTNDT,RSE-M corresponds to the shift in RTNDT as a function of fluence, as given by the
French RSE-M (Ed.2010) embrittlement trend curve evaluated for the D3T2 core shellchemical composition (thereby considering enrichment factors to account for thecomposition of macro-segregations)RTNDT,VB395 is an additional fluence dependent shift as observed on the VB395 material. It
is taken as the difference between the observed atypical embrittlement of the materialbetween hydrogen flakes and the embrittlement that can be expected for this material onthe basis of the RSE-M trend curveM is a margin based on the uncertainties of the different terms: M equals 2 times thequadratic combination of the uncertainty on the effect of the macro-segregation (evaluatedas 5°C) and the standard deviation of the RSE-M formula (9.3°C)
It should be pointed out that these trend curves are very conservative because they are basedon the assumption that the D3T2 RPV core shells have an additional sensitivity to irradiationembrittlement of the same magnitude as the VB395 material, which is very unlikely taking intoaccount the results of the test programme and the assessment of the atypical embrittlement ofVB395.
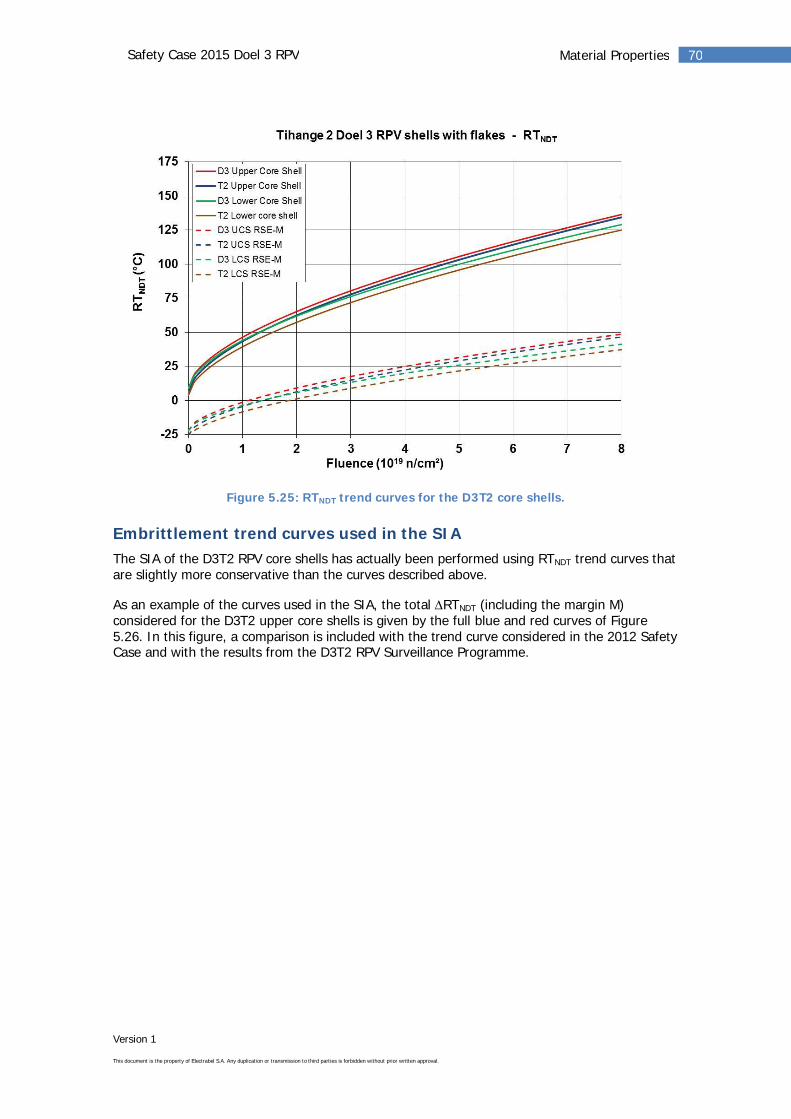
Version 1
This document is the property of Electrabel S.A. Any duplication or transmission to third parties is forbidden without prior written approval.
70Material PropertiesSafety Case 2015 Doel 3 RPV
Figure 5.25: RTNDT trend curves for the D3T2 core shells.
Embrittlement trend curves used in the SIAThe SIA of the D3T2 RPV core shells has actually been performed using RTNDT trend curves thatare slightly more conservative than the curves described above.
As an example of the curves used in the SIA, the total RTNDT (including the margin M)considered for the D3T2 upper core shells is given by the full blue and red curves of Figure5.26. In this figure, a comparison is included with the trend curve considered in the 2012 SafetyCase and with the results from the D3T2 RPV Surveillance Programme.
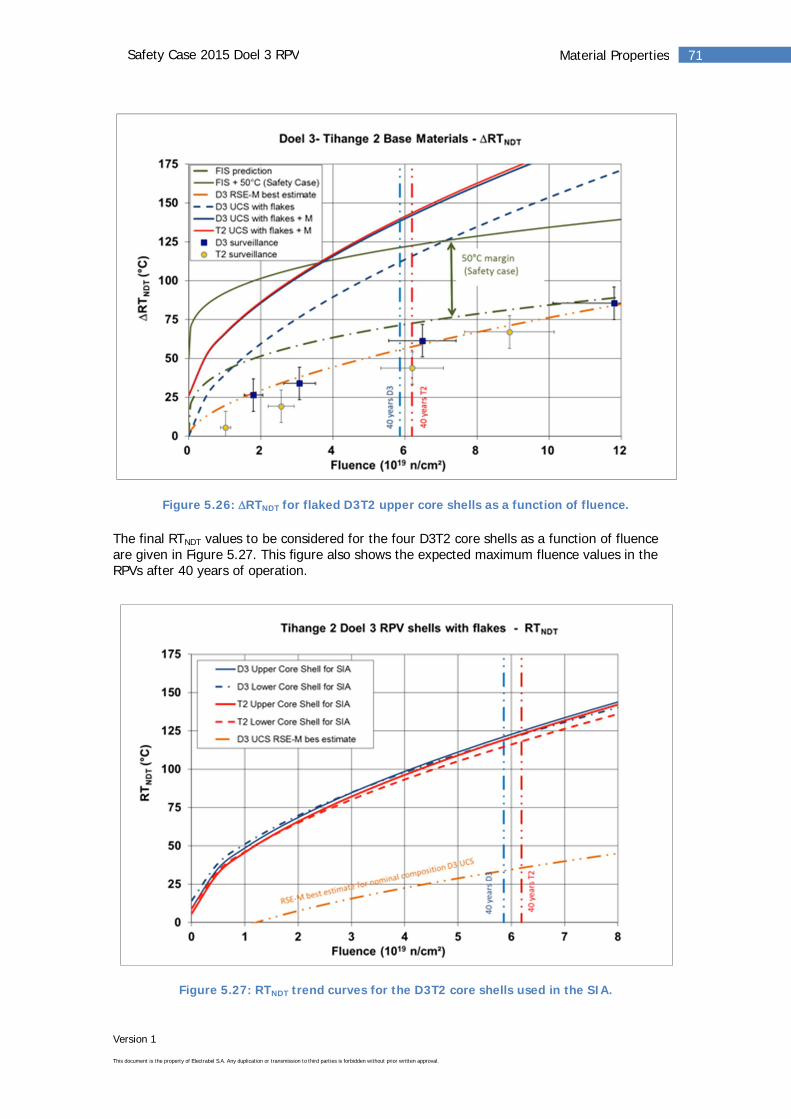
Version 1
This document is the property of Electrabel S.A. Any duplication or transmission to third parties is forbidden without prior written approval.
71Material PropertiesSafety Case 2015 Doel 3 RPV
Figure 5.26: RTNDT for flaked D3T2 upper core shells as a function of fluence.
The final RTNDT values to be considered for the four D3T2 core shells as a function of fluenceare given in Figure 5.27. This figure also shows the expected maximum fluence values in theRPVs after 40 years of operation.
Figure 5.27: RTNDT trend curves for the D3T2 core shells used in the SIA.
Version 1
This document is the property of Electrabel S.A. Any duplication or transmission to third parties is forbidden without prior written approval.
72Material PropertiesSafety Case 2015 Doel 3 RPV
In addition, several alternative ways of establishing trend curves for the D3T2 core shells havebeen addressed in detail, such as best estimate RTNDT approaches (based on Charpy shifts) andbest estimate RTT0 approaches (based on T0 shifts) considering different types of fits ofexperimental results (power law fit with 0.59 exponent, linear fit). However, it was shown thatthe trend curves applied in the SIA are much more conservative than all those alternatives.
Version 1
This document is the property of Electrabel S.A. Any duplication or transmission to third parties is forbidden without prior written approval.
73Structural Integrity AssessmentSafety Case 2015 Doel 3 RPV
6 Structural IntegrityAssessment
The Structural Integrity Assessment (SIA) of the Doel 3 RPV was performed for all relevantloading conditions according to the applicable rules of the ASME Boiler & Pressure Vesselcode.
The SIA covers all indications that have been classified as hydrogen flakes as well as theindications that were classified as clad interface imperfections but that are conservativelyconsidered as hydrogen flakes.
The Flaw Acceptability Assessment demonstrated that more than 99.75% of the flaws meetthe screening criterion 2a < 0.5 2aacc. The remaining 0.25% meet the acceptance criterion2a < 2aacc by a considerable margin as demonstrated through refined analysis.
The refined analyses clearly highlighted the very low level of the crack driving forces KMAX ofthe quasi-laminar hydrogen flakes: KMAX for all flaw configurations is well below the fracturetoughness lower shelf KIR,lower shelf demonstrating that the quasi-laminar hydrogen flakes areacceptable with respect to the structural integrity of the Doel 3 RPV.
The Fatigue Crack Growth analysis showed that the maximum potential growth of the flawsin the forgings over the entire service lifetime of the RPV, assessed by a conservativemethodology, is limited to 3.19% of their size. This confirms the results of the 2012 SafetyCase.
The Primary Stress Re-evaluation made clear that the collapse pressure is more than 1.5times the design pressure, confirming the criterion is met.
ContextThe purpose of the SIA is to verify that the structural integrity of the RPV is maintained underall operating and accidental conditions given the presence of detected flaws. The SIA wasperformed for all relevant loading conditions according to the applicable rules of the ASMEBoiler & Pressure Vessel code (Figure 6.1). As such, it includes:
Assessment of the absence of crack initiation for all individual flaws with adequate safetymarginsAssessment of the stability of the flaws through fatigue crack growth evaluationSatisfaction of the primary stress intensity acceptance criteria
The assessment methodologies use state-of-the-art modelling and calculation techniques. Theywere subjected to a thorough external review and validated on the basis of experimental work.More particularly, large-scale tests were performed on samples containing flakes. These testsdemonstrated that the ductility of the material in the ligament between the flakes is similar tothe ductility of the material free of flakes and that the load bearing capacity is not significantlyaffected.
Version 1
This document is the property of Electrabel S.A. Any duplication or transmission to third parties is forbidden without prior written approval.
74Structural Integrity AssessmentSafety Case 2015 Doel 3 RPV
Input dataThe SIA is based on the following input data:
The RPV geometryThe UT measurements i.e. the updated flake cartographyThe transient (p, T) loads from the design transient fileThe material properties
In the sequel of this chapter, the terms flake cartography or flaw covers both the indicationsthat were classified as hydrogen flakes as well as the indications that were classified as cladinterface imperfections but that are conservatively considered as hydrogen flakes in theStructural Integrity Analysis (Chapter 4.2.3).
Among the material properties, the RTNDT curve is obtained from the conservative transpositionof the properties obtained on shell VB395 (see Chapter 5.5 Material Properties considered in theSIA). The RTNDT is only needed for the verification of the ASME XI acceptability criteria. Theassessment of the crack driving forces is independent of the RTNDT value.
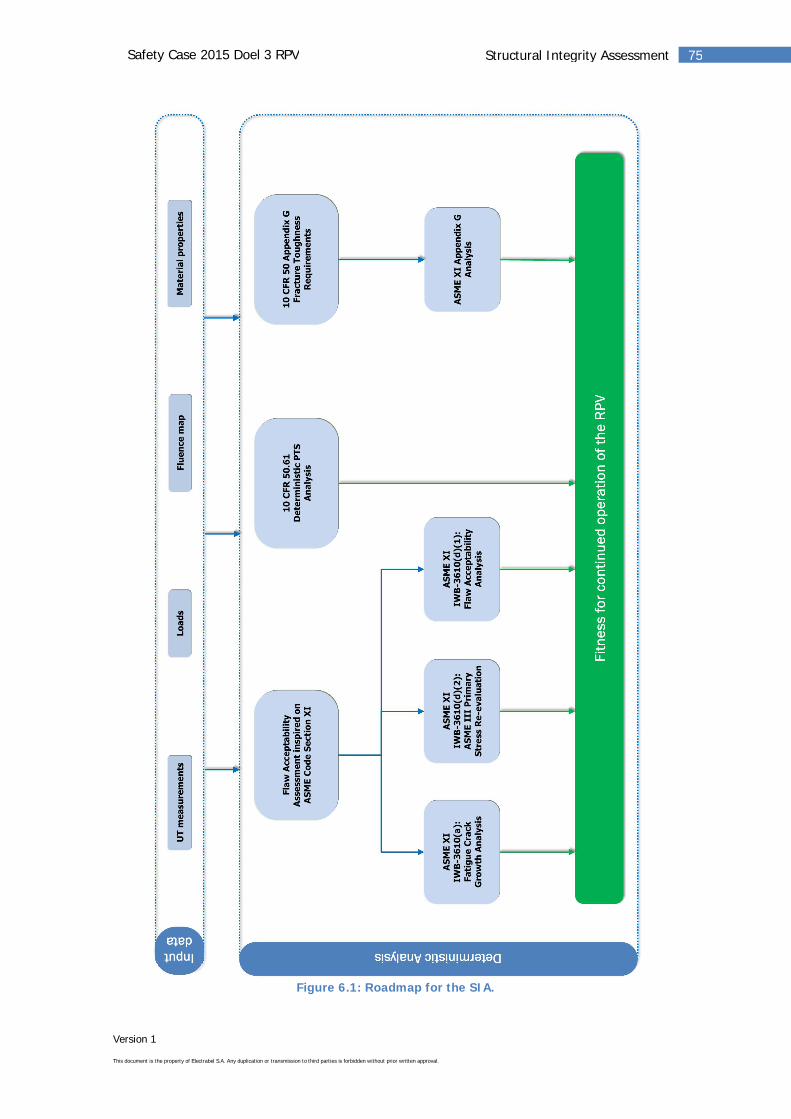
Version 1
This document is the property of Electrabel S.A. Any duplication or transmission to third parties is forbidden without prior written approval.
75Structural Integrity AssessmentSafety Case 2015 Doel 3 RPV
Figure 6.1: Roadmap for the SIA.
Version 1
This document is the property of Electrabel S.A. Any duplication or transmission to third parties is forbidden without prior written approval.
76Structural Integrity AssessmentSafety Case 2015 Doel 3 RPV
6.1 ASME XI – Flaw AcceptabilityAssessment
The flaw configurations – most of them – meeting the screening criterion 2a < 0.5 2aacc areconsidered harmless. The few remaining flaw configurations that did not meet the screeningcriterion were subjected to a more refined analysis. This refined analysis demonstrated thatall of these flaws meet the acceptance criterion with a considerable safety margin: maximum2a/2aacc ratio of 0.32 in the Doel 3 RPV.
RequirementA Flaw Acceptability Assessment was performed in accordance with ‘ASME Section XI (1992) –Rules for In-service Inspection of Nuclear Power Plant Components’. The assessment wasconducted on all flaws using the dimensional data gathered through ultrasound measurementsand the loads from the design transients.
ApproachThe general flowchart for performing this assessment is given below (Figure 6.2). Every step isthen explained in greater detail.
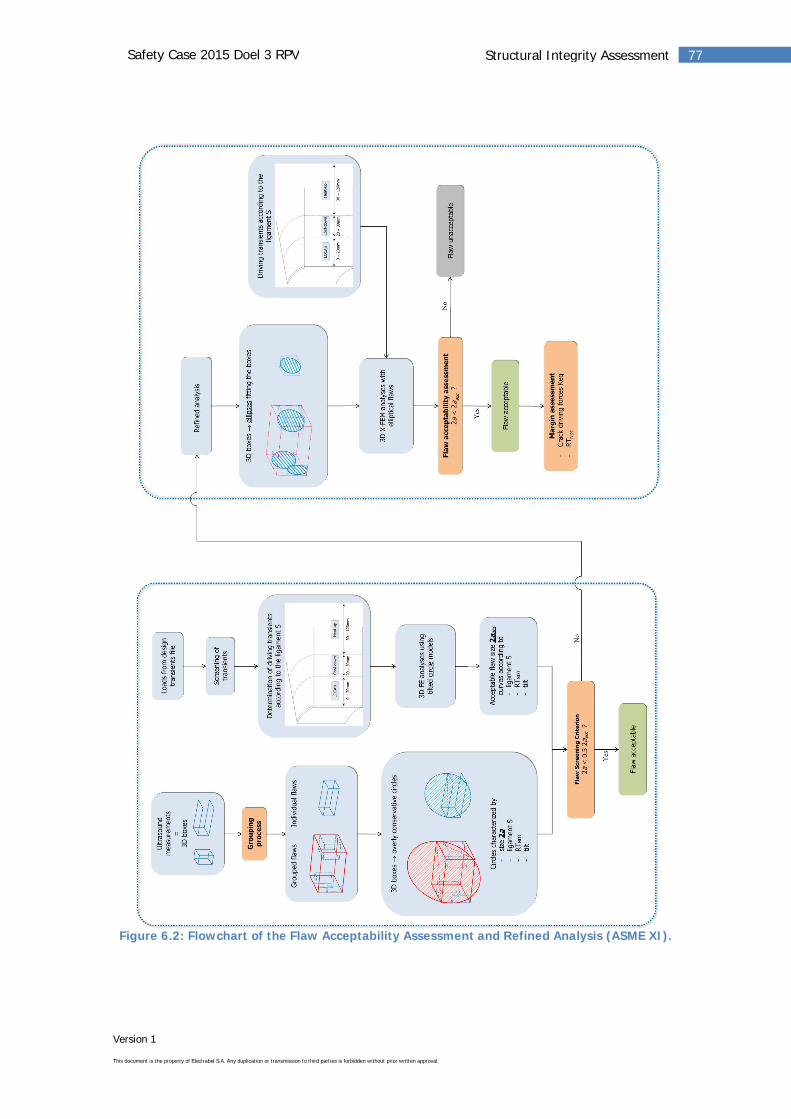
Version 1
This document is the property of Electrabel S.A. Any duplication or transmission to third parties is forbidden without prior written approval.
77Structural Integrity AssessmentSafety Case 2015 Doel 3 RPV
Figure 6.2: Flowchart of the Flaw Acceptability Assessment and Refined Analysis (ASME XI).
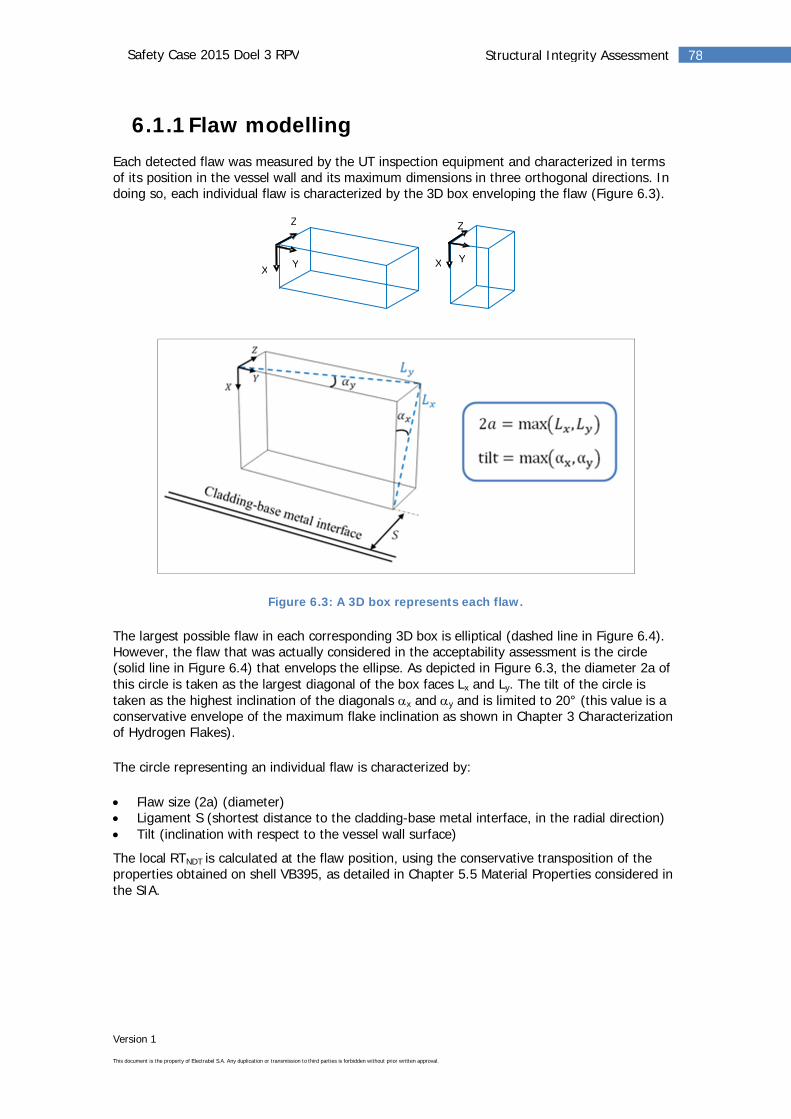
Version 1
This document is the property of Electrabel S.A. Any duplication or transmission to third parties is forbidden without prior written approval.
78Structural Integrity AssessmentSafety Case 2015 Doel 3 RPV
6.1.1Flaw modellingEach detected flaw was measured by the UT inspection equipment and characterized in termsof its position in the vessel wall and its maximum dimensions in three orthogonal directions. Indoing so, each individual flaw is characterized by the 3D box enveloping the flaw (Figure 6.3).
Figure 6.3: A 3D box represents each flaw.
The largest possible flaw in each corresponding 3D box is elliptical (dashed line in Figure 6.4).However, the flaw that was actually considered in the acceptability assessment is the circle(solid line in Figure 6.4) that envelops the ellipse. As depicted in Figure 6.3, the diameter 2a ofthis circle is taken as the largest diagonal of the box faces Lx and Ly. The tilt of the circle istaken as the highest inclination of the diagonals x and y and is limited to 20° (this value is aconservative envelope of the maximum flake inclination as shown in Chapter 3 Characterizationof Hydrogen Flakes).
The circle representing an individual flaw is characterized by:
Flaw size (2a) (diameter)Ligament S (shortest distance to the cladding-base metal interface, in the radial direction)Tilt (inclination with respect to the vessel wall surface)
The local RTNDT is calculated at the flaw position, using the conservative transposition of theproperties obtained on shell VB395, as detailed in Chapter 5.5 Material Properties considered inthe SIA.
X Y
Z
X Y
Z
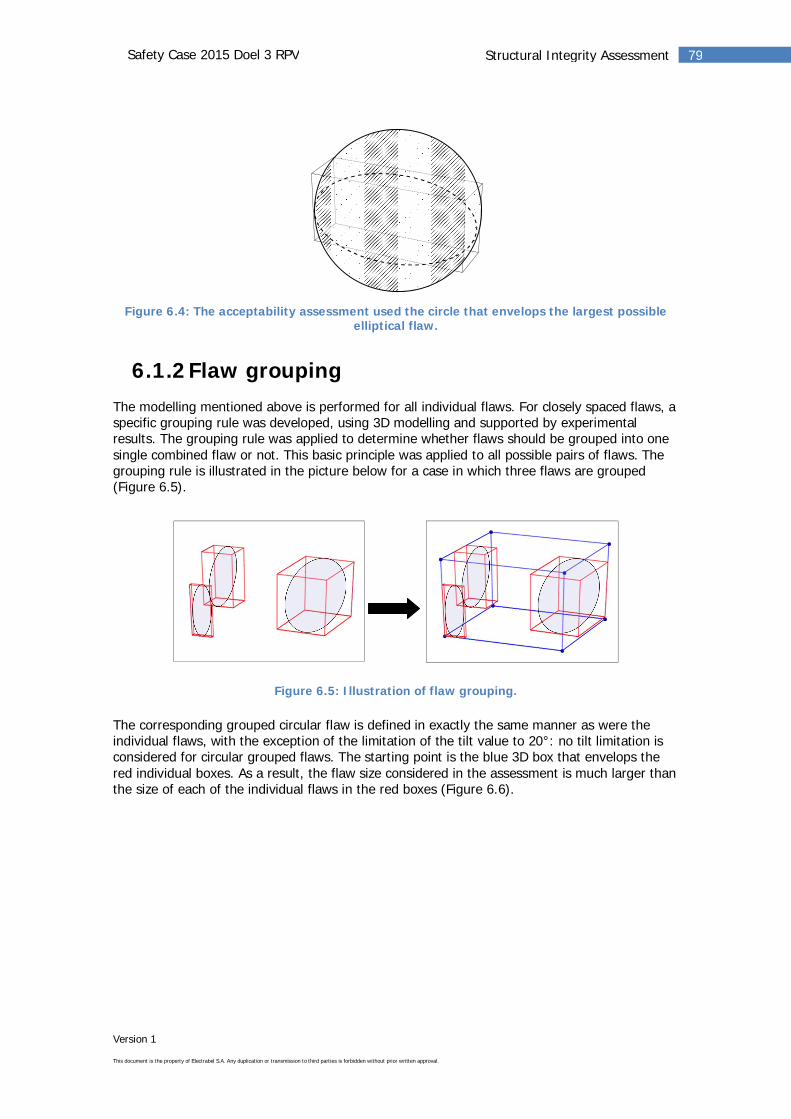
Version 1
This document is the property of Electrabel S.A. Any duplication or transmission to third parties is forbidden without prior written approval.
79Structural Integrity AssessmentSafety Case 2015 Doel 3 RPV
Figure 6.4: The acceptability assessment used the circle that envelops the largest possibleelliptical flaw.
6.1.2Flaw groupingThe modelling mentioned above is performed for all individual flaws. For closely spaced flaws, aspecific grouping rule was developed, using 3D modelling and supported by experimentalresults. The grouping rule was applied to determine whether flaws should be grouped into onesingle combined flaw or not. This basic principle was applied to all possible pairs of flaws. Thegrouping rule is illustrated in the picture below for a case in which three flaws are grouped(Figure 6.5).
Figure 6.5: Illustration of flaw grouping.
The corresponding grouped circular flaw is defined in exactly the same manner as were theindividual flaws, with the exception of the limitation of the tilt value to 20°: no tilt limitation isconsidered for circular grouped flaws. The starting point is the blue 3D box that envelops thered individual boxes. As a result, the flaw size considered in the assessment is much larger thanthe size of each of the individual flaws in the red boxes (Figure 6.6).
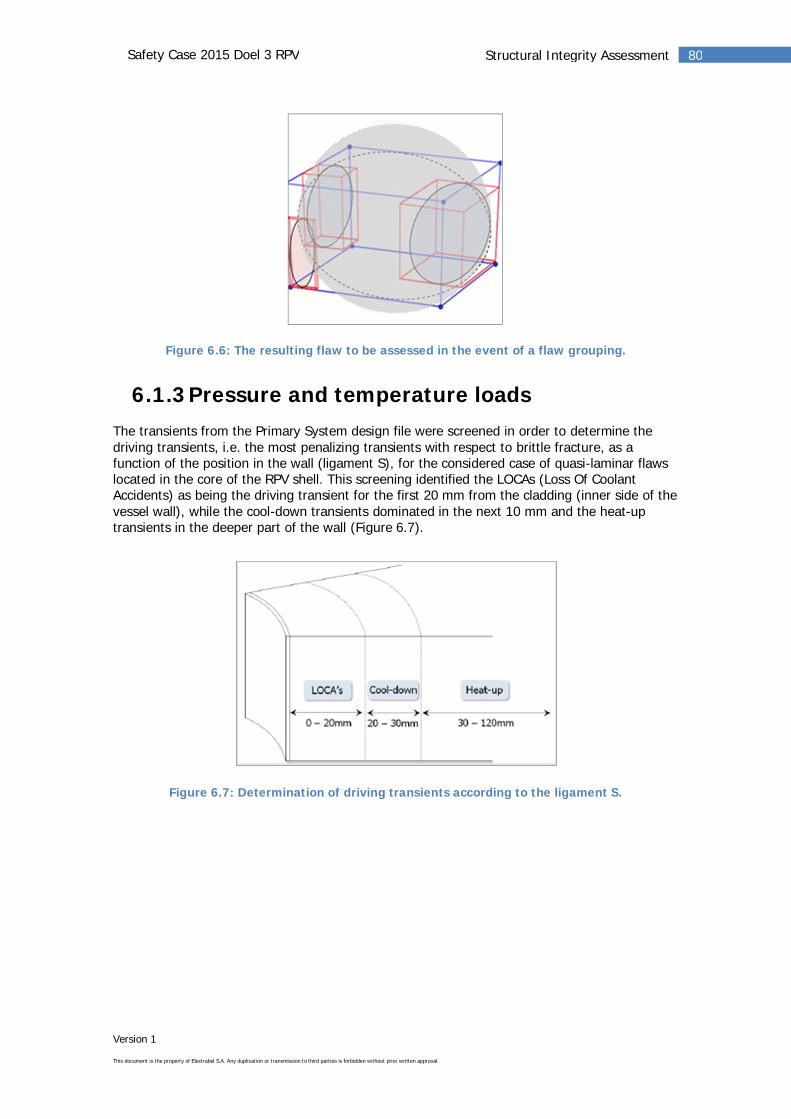
Version 1
This document is the property of Electrabel S.A. Any duplication or transmission to third parties is forbidden without prior written approval.
80Structural Integrity AssessmentSafety Case 2015 Doel 3 RPV
Figure 6.6: The resulting flaw to be assessed in the event of a flaw grouping.
6.1.3Pressure and temperature loadsThe transients from the Primary System design file were screened in order to determine thedriving transients, i.e. the most penalizing transients with respect to brittle fracture, as afunction of the position in the wall (ligament S), for the considered case of quasi-laminar flawslocated in the core of the RPV shell. This screening identified the LOCAs (Loss Of CoolantAccidents) as being the driving transient for the first 20 mm from the cladding (inner side of thevessel wall), while the cool-down transients dominated in the next 10 mm and the heat-uptransients in the deeper part of the wall (Figure 6.7).
Figure 6.7: Determination of driving transients according to the ligament S.
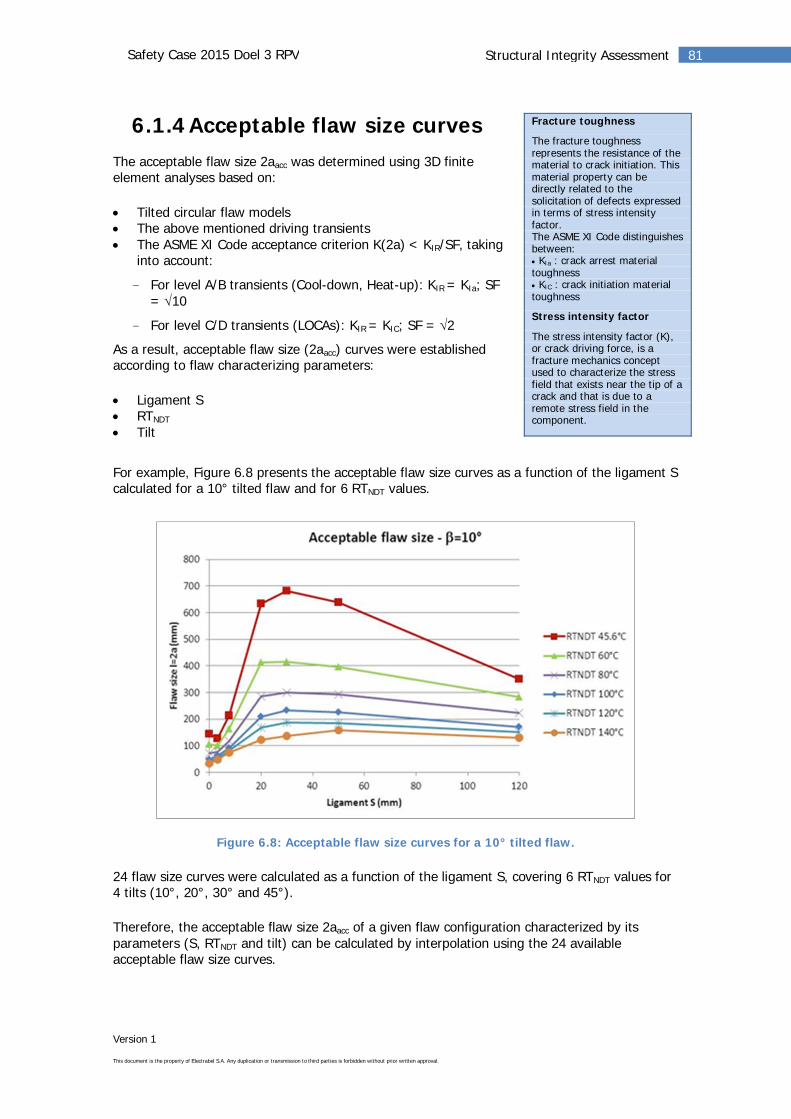
Version 1
This document is the property of Electrabel S.A. Any duplication or transmission to third parties is forbidden without prior written approval.
81Structural Integrity AssessmentSafety Case 2015 Doel 3 RPV
6.1.4Acceptable flaw size curvesThe acceptable flaw size 2aacc was determined using 3D finiteelement analyses based on:
Tilted circular flaw modelsThe above mentioned driving transientsThe ASME XI Code acceptance criterion K(2a) < KIR/SF, takinginto account:
- For level A/B transients (Cool-down, Heat-up): KIR = KIa; SF= 10
- For level C/D transients (LOCAs): KIR = KIC; SF = 2
As a result, acceptable flaw size (2aacc) curves were establishedaccording to flaw characterizing parameters:
Ligament SRTNDT
Tilt
For example, Figure 6.8 presents the acceptable flaw size curves as a function of the ligament Scalculated for a 10° tilted flaw and for 6 RTNDT values.
Figure 6.8: Acceptable flaw size curves for a 10° tilted flaw.
24 flaw size curves were calculated as a function of the ligament S, covering 6 RTNDT values for4 tilts (10°, 20°, 30° and 45°).
Therefore, the acceptable flaw size 2aacc of a given flaw configuration characterized by itsparameters (S, RTNDT and tilt) can be calculated by interpolation using the 24 availableacceptable flaw size curves.
Fracture toughness
The fracture toughnessrepresents the resistance of thematerial to crack initiation. Thismaterial property can bedirectly related to thesolicitation of defects expressedin terms of stress intensityfactor.The ASME XI Code distinguishesbetween: KIa : crack arrest material
toughness KIC : crack initiation material
toughness
Stress intensity factor
The stress intensity factor (K),or crack driving force, is afracture mechanics conceptused to characterize the stressfield that exists near the tip of acrack and that is due to aremote stress field in thecomponent.
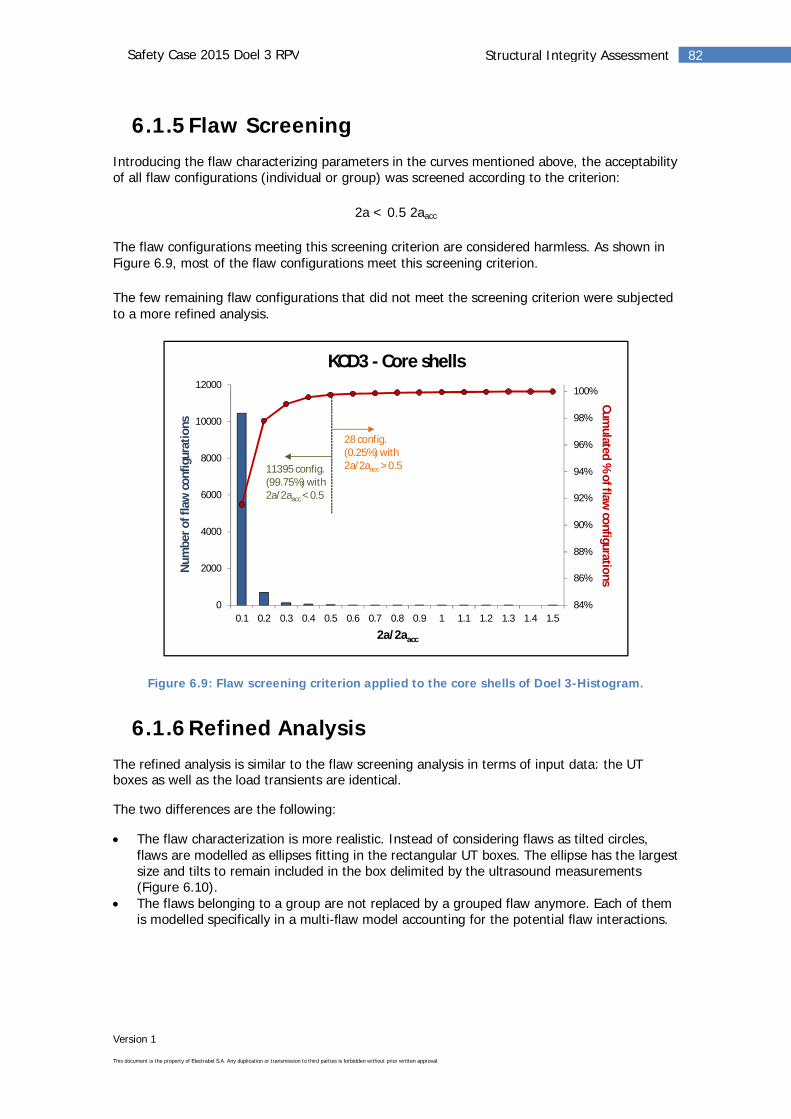
Version 1
This document is the property of Electrabel S.A. Any duplication or transmission to third parties is forbidden without prior written approval.
82Structural Integrity AssessmentSafety Case 2015 Doel 3 RPV
6.1.5Flaw ScreeningIntroducing the flaw characterizing parameters in the curves mentioned above, the acceptabilityof all flaw configurations (individual or group) was screened according to the criterion:
2a < 0.5 2aacc
The flaw configurations meeting this screening criterion are considered harmless. As shown inFigure 6.9, most of the flaw configurations meet this screening criterion.
The few remaining flaw configurations that did not meet the screening criterion were subjectedto a more refined analysis.
Figure 6.9: Flaw screening criterion applied to the core shells of Doel 3-Histogram.
6.1.6Refined AnalysisThe refined analysis is similar to the flaw screening analysis in terms of input data: the UTboxes as well as the load transients are identical.
The two differences are the following:
The flaw characterization is more realistic. Instead of considering flaws as tilted circles,flaws are modelled as ellipses fitting in the rectangular UT boxes. The ellipse has the largestsize and tilts to remain included in the box delimited by the ultrasound measurements(Figure 6.10).The flaws belonging to a group are not replaced by a grouped flaw anymore. Each of themis modelled specifically in a multi-flaw model accounting for the potential flaw interactions.
84%
86%
88%
90%
92%
94%
96%
98%
100%
0
2000
4000
6000
8000
10000
12000
0.1 0.2 0.3 0.4 0.5 0.6 0.7 0.8 0.9 1 1.1 1.2 1.3 1.4 1.5
Cumulated
%offlaw
configurationsNum
bero
ffla
wco
nfig
urat
ions
2a/2aacc
KCD3 - Core shells
11395 config.(99.75%) with2a/2aacc < 0.5
28 config.(0.25%) with2a/2aacc > 0.5
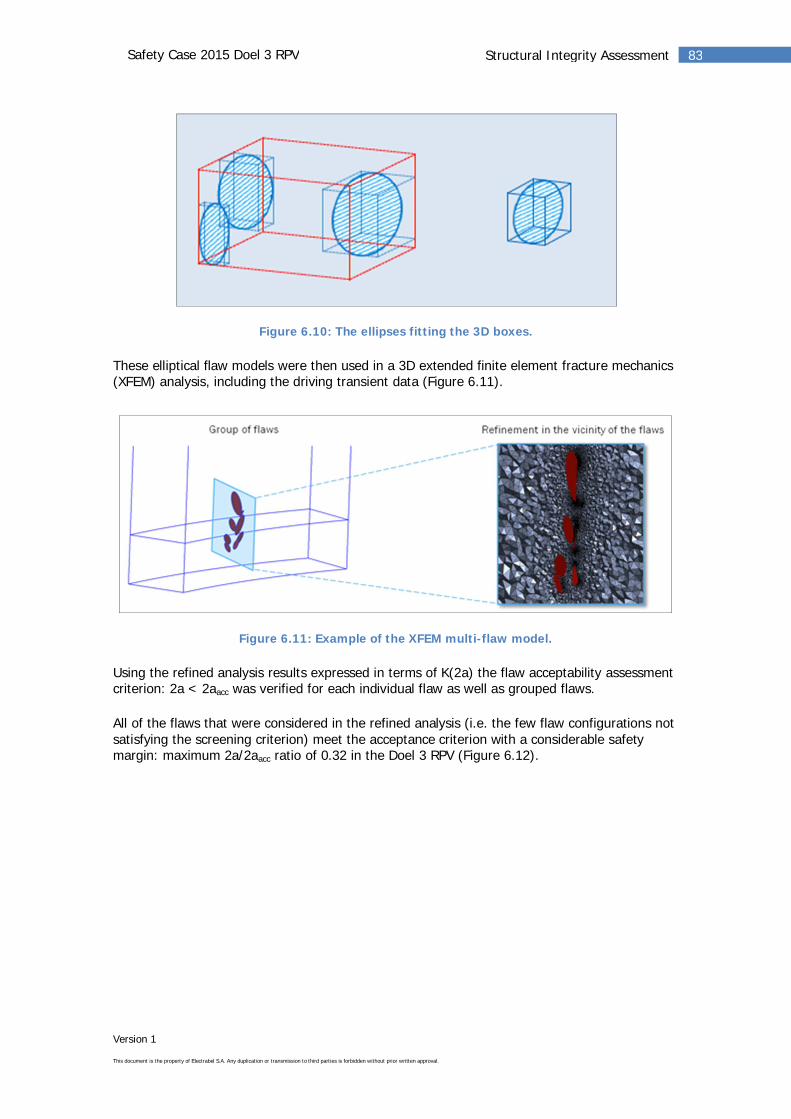
Version 1
This document is the property of Electrabel S.A. Any duplication or transmission to third parties is forbidden without prior written approval.
83Structural Integrity AssessmentSafety Case 2015 Doel 3 RPV
Figure 6.10: The ellipses fitting the 3D boxes.
These elliptical flaw models were then used in a 3D extended finite element fracture mechanics(XFEM) analysis, including the driving transient data (Figure 6.11).
Figure 6.11: Example of the XFEM multi-flaw model.
Using the refined analysis results expressed in terms of K(2a) the flaw acceptability assessmentcriterion: 2a < 2aacc was verified for each individual flaw as well as grouped flaws.
All of the flaws that were considered in the refined analysis (i.e. the few flaw configurations notsatisfying the screening criterion) meet the acceptance criterion with a considerable safetymargin: maximum 2a/2aacc ratio of 0.32 in the Doel 3 RPV (Figure 6.12).
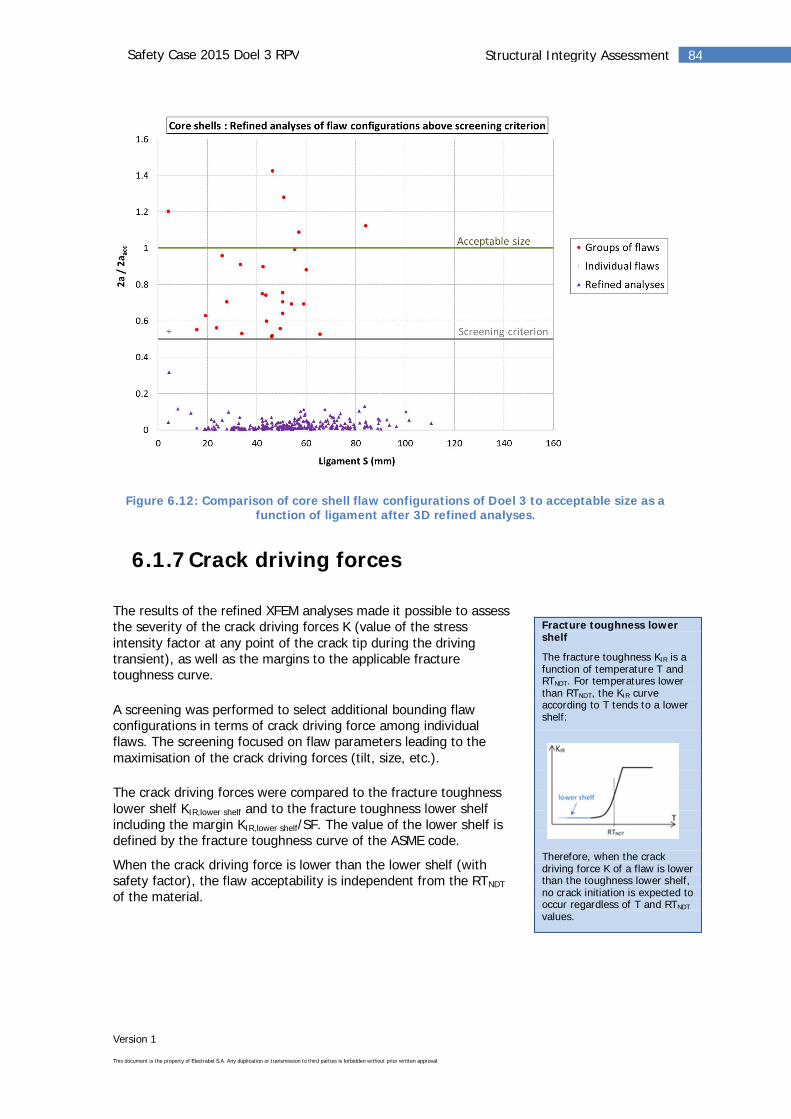
Version 1
This document is the property of Electrabel S.A. Any duplication or transmission to third parties is forbidden without prior written approval.
84Structural Integrity AssessmentSafety Case 2015 Doel 3 RPV
Figure 6.12: Comparison of core shell flaw configurations of Doel 3 to acceptable size as afunction of ligament after 3D refined analyses.
6.1.7Crack driving forces
The results of the refined XFEM analyses made it possible to assessthe severity of the crack driving forces K (value of the stressintensity factor at any point of the crack tip during the drivingtransient), as well as the margins to the applicable fracturetoughness curve.
A screening was performed to select additional bounding flawconfigurations in terms of crack driving force among individualflaws. The screening focused on flaw parameters leading to themaximisation of the crack driving forces (tilt, size, etc.).
The crack driving forces were compared to the fracture toughnesslower shelf KIR,lower shelf and to the fracture toughness lower shelfincluding the margin KIR,lower shelf/SF. The value of the lower shelf isdefined by the fracture toughness curve of the ASME code.
When the crack driving force is lower than the lower shelf (withsafety factor), the flaw acceptability is independent from the RTNDT
of the material.
Fracture toughness lowershelf
The fracture toughness KIR is afunction of temperature T andRTNDT. For temperatures lowerthan RTNDT, the KIR curveaccording to T tends to a lowershelf:
Therefore, when the crackdriving force K of a flaw is lowerthan the toughness lower shelf,no crack initiation is expected tooccur regardless of T and RTNDT
values.
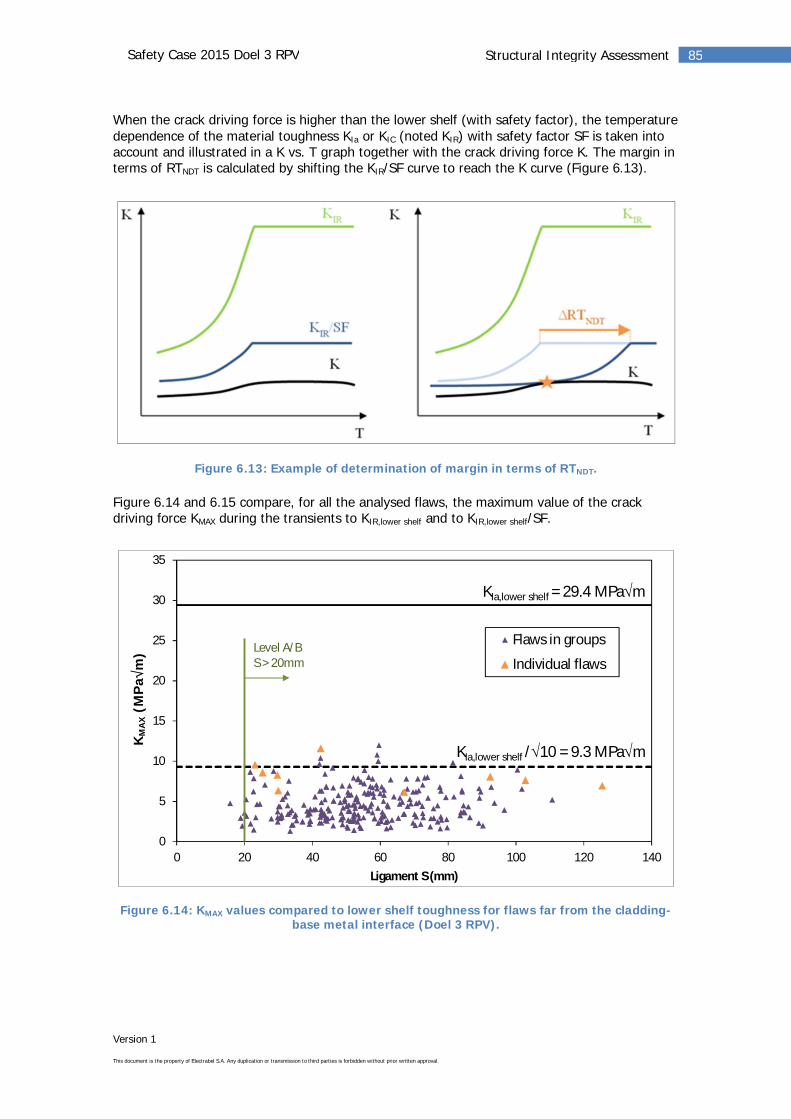
Version 1
This document is the property of Electrabel S.A. Any duplication or transmission to third parties is forbidden without prior written approval.
85Structural Integrity AssessmentSafety Case 2015 Doel 3 RPV
When the crack driving force is higher than the lower shelf (with safety factor), the temperaturedependence of the material toughness KIa or KIC (noted KIR) with safety factor SF is taken intoaccount and illustrated in a K vs. T graph together with the crack driving force K. The margin interms of RTNDT is calculated by shifting the KIR/SF curve to reach the K curve (Figure 6.13).
Figure 6.13: Example of determination of margin in terms of RTNDT.
Figure 6.14 and 6.15 compare, for all the analysed flaws, the maximum value of the crackdriving force KMAX during the transients to KIR,lower shelf and to KIR,lower shelf/SF.
Figure 6.14: KMAX values compared to lower shelf toughness for flaws far from the cladding-base metal interface (Doel 3 RPV).
0
5
10
15
20
25
30
35
0 20 40 60 80 100 120 140
Keq,
MAX
(MPa
m)
Ligament S (mm)
Flaws in groups
Individual flaws
KIa,lower shelf = 29.4 MPa m
KIa,lower shelf / 10 = 9.3 MPa m
Level A/BS > 20mm
KM
AX
(MP
am
)
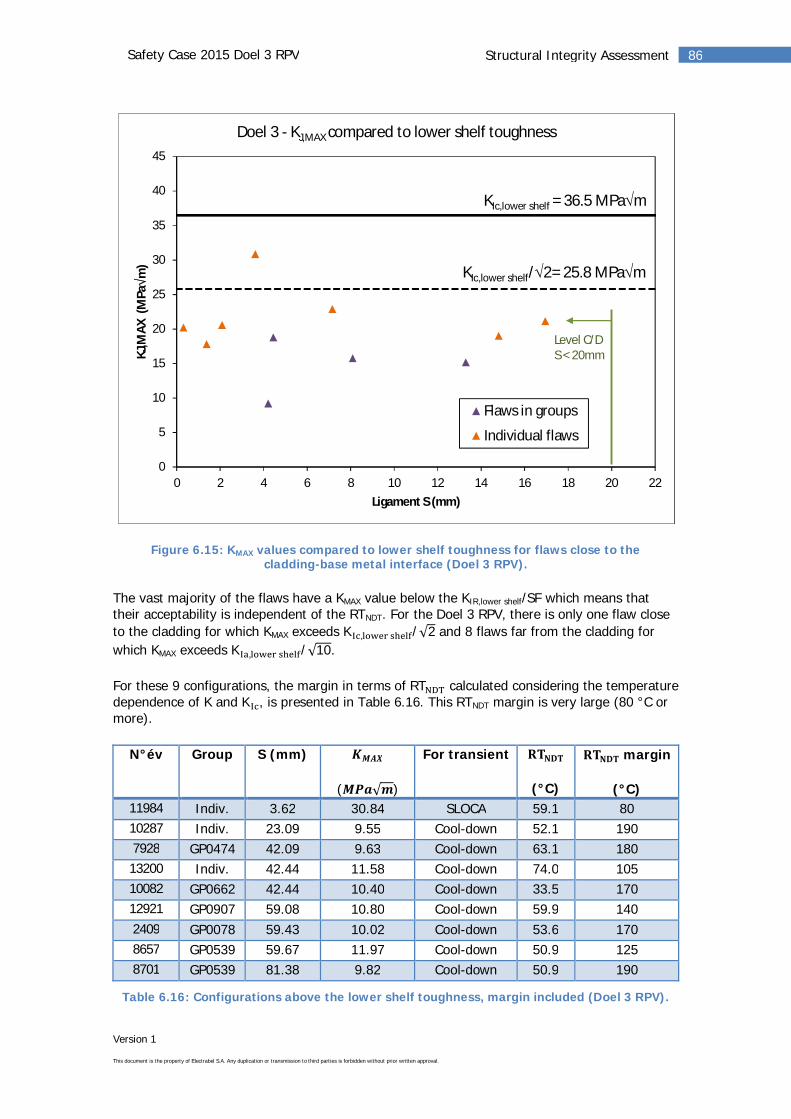
Version 1
This document is the property of Electrabel S.A. Any duplication or transmission to third parties is forbidden without prior written approval.
86Structural Integrity AssessmentSafety Case 2015 Doel 3 RPV
Figure 6.15: KMAX values compared to lower shelf toughness for flaws close to thecladding-base metal interface (Doel 3 RPV).
The vast majority of the flaws have a KMAX value below the KIR,lower shelf/SF which means thattheir acceptability is independent of the RTNDT. For the Doel 3 RPV, there is only one flaw closeto the cladding for which KMAX exceeds K , / 2 and 8 flaws far from the cladding forwhich KMAX exceeds K , / 10.
For these 9 configurations, the margin in terms of RT calculated considering the temperaturedependence of K and K , is presented in Table 6.16. This RTNDT margin is very large (80 °C ormore).
N°év Group S (mm)
( )
For transient
(°C)
margin
(°C)11984 Indiv. 3.62 30.84 SLOCA 59.1 8010287 Indiv. 23.09 9.55 Cool-down 52.1 1907928 GP0474 42.09 9.63 Cool-down 63.1 180
13200 Indiv. 42.44 11.58 Cool-down 74.0 10510082 GP0662 42.44 10.40 Cool-down 33.5 17012921 GP0907 59.08 10.80 Cool-down 59.9 1402409 GP0078 59.43 10.02 Cool-down 53.6 1708657 GP0539 59.67 11.97 Cool-down 50.9 1258701 GP0539 81.38 9.82 Cool-down 50.9 190
Table 6.16: Configurations above the lower shelf toughness, margin included (Doel 3 RPV).
0
5
10
15
20
25
30
35
40
45
0 2 4 6 8 10 12 14 16 18 20 22
KJ,M
AX(M
Pam
)
Ligament S (mm)
Doel 3 - KJ,MAX compared to lower shelf toughness
Flaws in groups
Individual flaws
KIc,lower shelf = 36.5 MPa m
KIc,lower shelf/ 2= 25.8 MPa m
Level C/DS < 20mm
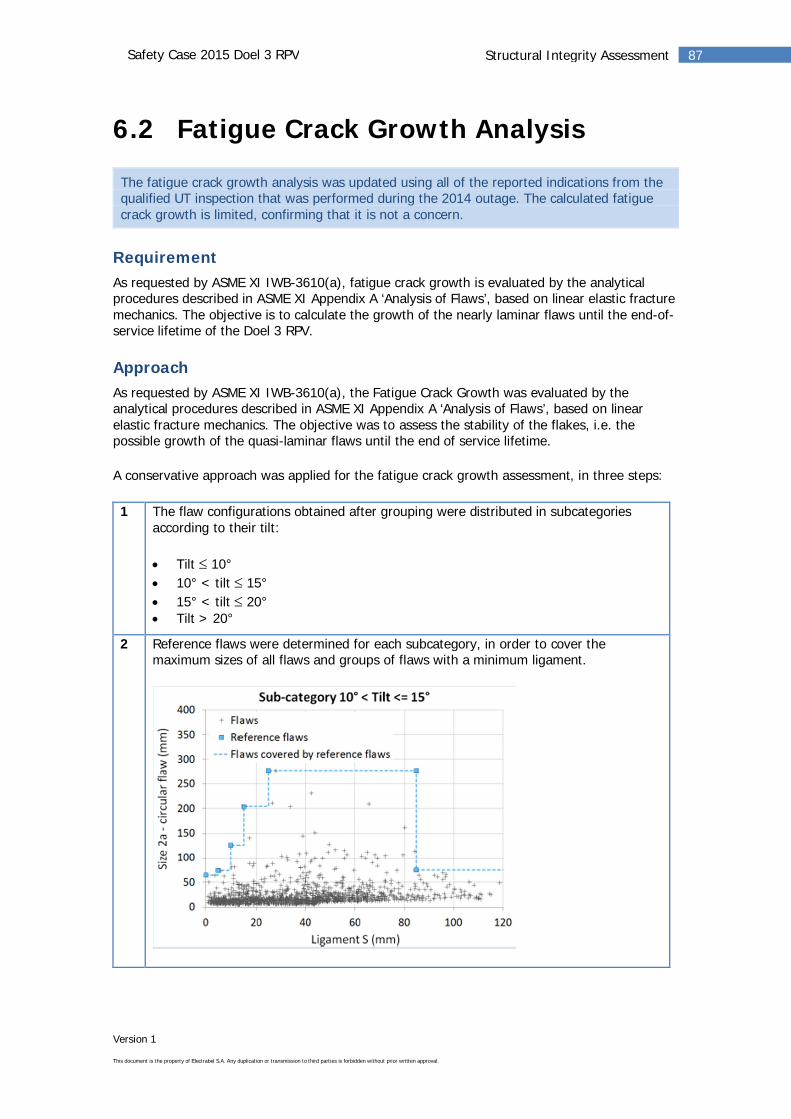
Version 1
This document is the property of Electrabel S.A. Any duplication or transmission to third parties is forbidden without prior written approval.
87Structural Integrity AssessmentSafety Case 2015 Doel 3 RPV
6.2 Fatigue Crack Growth Analysis
The fatigue crack growth analysis was updated using all of the reported indications from thequalified UT inspection that was performed during the 2014 outage. The calculated fatiguecrack growth is limited, confirming that it is not a concern.
RequirementAs requested by ASME XI IWB-3610(a), fatigue crack growth is evaluated by the analyticalprocedures described in ASME XI Appendix A ‘Analysis of Flaws’, based on linear elastic fracturemechanics. The objective is to calculate the growth of the nearly laminar flaws until the end-of-service lifetime of the Doel 3 RPV.
ApproachAs requested by ASME XI IWB-3610(a), the Fatigue Crack Growth was evaluated by theanalytical procedures described in ASME XI Appendix A ‘Analysis of Flaws’, based on linearelastic fracture mechanics. The objective was to assess the stability of the flakes, i.e. thepossible growth of the quasi-laminar flaws until the end of service lifetime.
A conservative approach was applied for the fatigue crack growth assessment, in three steps:
1 The flaw configurations obtained after grouping were distributed in subcategoriesaccording to their tilt:
Tilt 10°10° < tilt 15°15° < tilt 20°Tilt > 20°
2 Reference flaws were determined for each subcategory, in order to cover themaximum sizes of all flaws and groups of flaws with a minimum ligament.
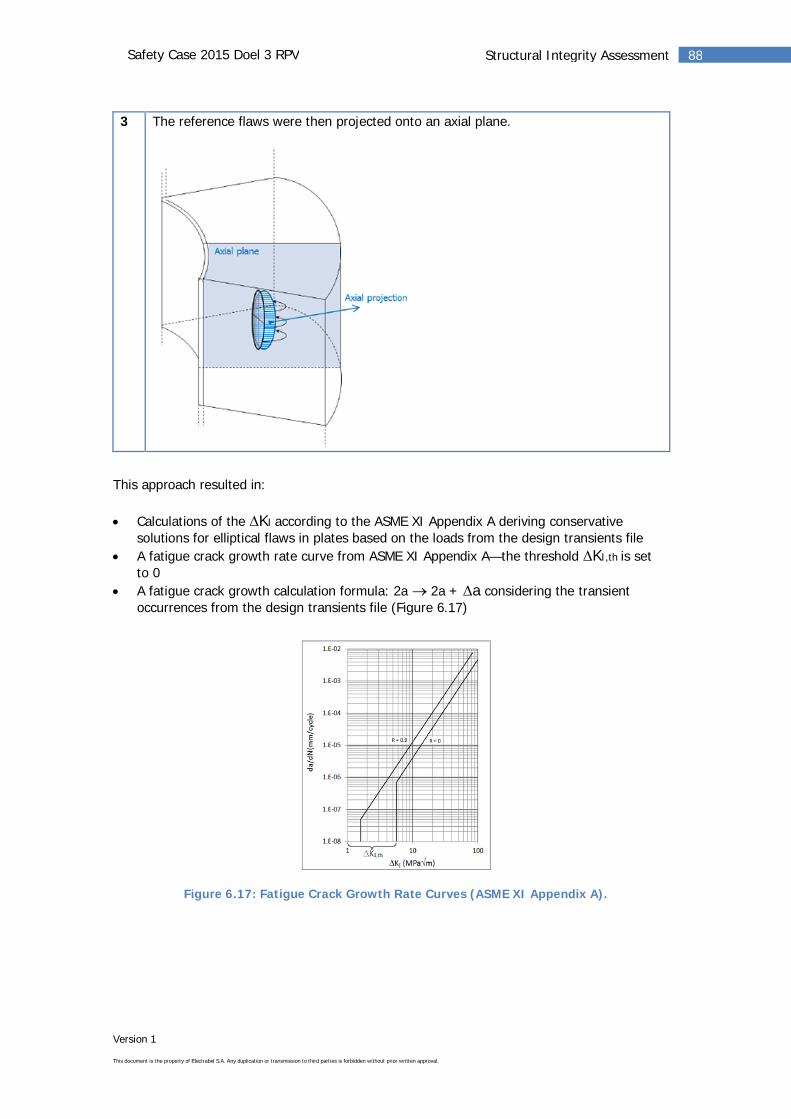
Version 1
This document is the property of Electrabel S.A. Any duplication or transmission to third parties is forbidden without prior written approval.
88Structural Integrity AssessmentSafety Case 2015 Doel 3 RPV
3 The reference flaws were then projected onto an axial plane.
This approach resulted in:
Calculations of the KI according to the ASME XI Appendix A deriving conservativesolutions for elliptical flaws in plates based on the loads from the design transients fileA fatigue crack growth rate curve from ASME XI Appendix A—the threshold KI,th is setto 0A fatigue crack growth calculation formula: 2a 2a + a considering the transientoccurrences from the design transients file (Figure 6.17)
Figure 6.17: Fatigue Crack Growth Rate Curves (ASME XI Appendix A).
Version 1
This document is the property of Electrabel S.A. Any duplication or transmission to third parties is forbidden without prior written approval.
89Structural Integrity AssessmentSafety Case 2015 Doel 3 RPV
ConclusionThe Fatigue Crack Growth analysis shows that the maximum potential growth of the flaws inthe forgings over the RPV’s entire service lifetime, assessed by a conservative methodology, islimited to 3.19% of their size in the Doel 3 RPV. This confirms the results of the Safety Case.Fatigue crack growth is not a concern and does not need to be considered further in the FlawAcceptability Analysis.
6.3 ASME III – Primary Stress Re-evaluation
The elasto-plastic analysis was updated using all of the reported indications from thequalified UT inspection that was performed during the 2014 outage. The results confirmedthat the collapse load for the most penalizing flaw configuration meets the ASME III NB-3228.3 acceptance criterion.
RequirementA Primary Stress Re-evaluation was performed in accordance with ‘ASME, Section III – Rules forConstruction of Nuclear Facility Components’. This evaluation takes into account the presence offlaws in the Doel 3 and Tihange 2 RPV shells. The re-evaluation was performed on all flawsusing the dimensional data gathered through ultrasound measurements and starting from theflaw modelling as in ASME XI. The acceptance criterion that needed to be verified is that thecalculated collapse pressure should be more than 1.5 times the design pressure.
ApproachThe general flowchart for performing this assessment is given in Figure 6.18. Every step is thenexplained in more detail.
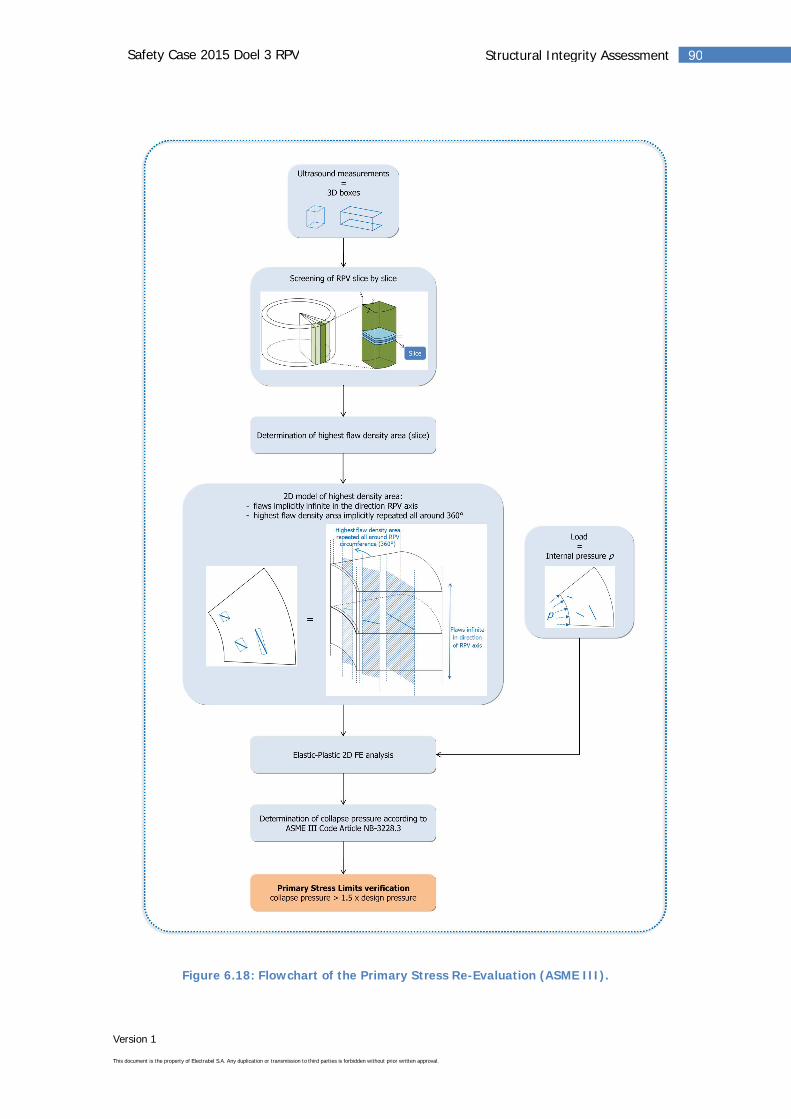
Version 1
This document is the property of Electrabel S.A. Any duplication or transmission to third parties is forbidden without prior written approval.
90Structural Integrity AssessmentSafety Case 2015 Doel 3 RPV
Figure 6.18: Flowchart of the Primary Stress Re-Evaluation (ASME III).
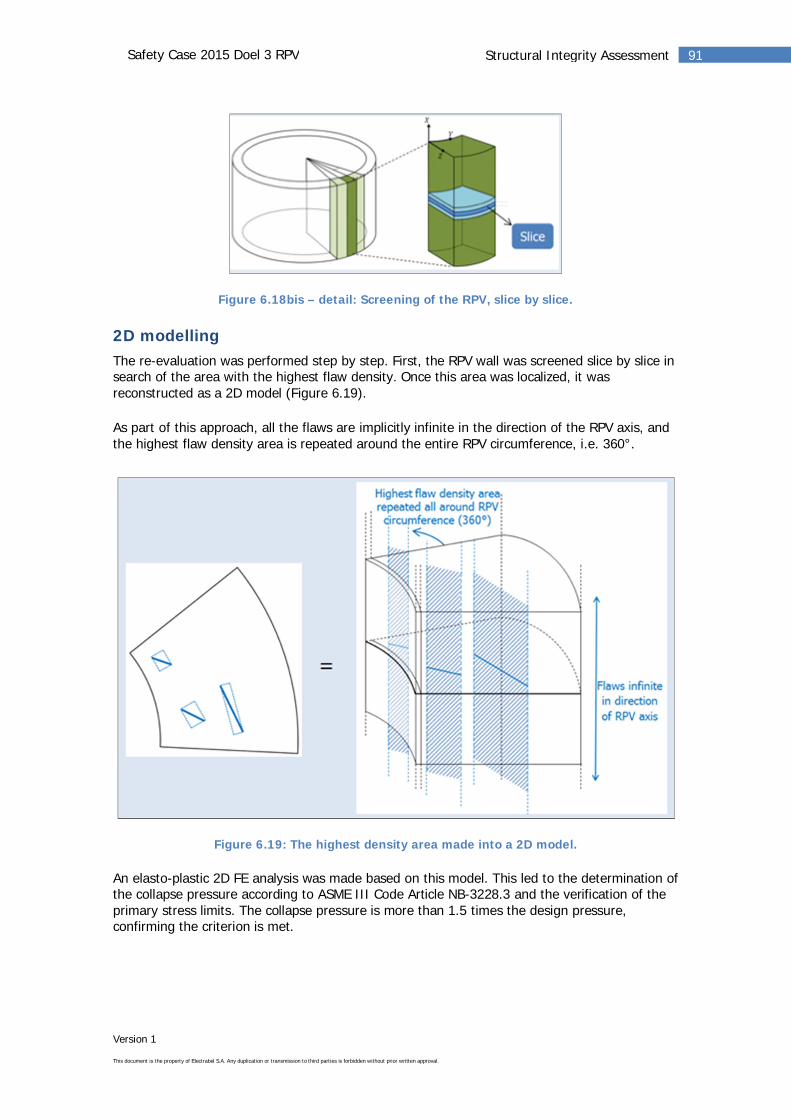
Version 1
This document is the property of Electrabel S.A. Any duplication or transmission to third parties is forbidden without prior written approval.
91Structural Integrity AssessmentSafety Case 2015 Doel 3 RPV
Figure 6.18bis – detail: Screening of the RPV, slice by slice.
2D modellingThe re-evaluation was performed step by step. First, the RPV wall was screened slice by slice insearch of the area with the highest flaw density. Once this area was localized, it wasreconstructed as a 2D model (Figure 6.19).
As part of this approach, all the flaws are implicitly infinite in the direction of the RPV axis, andthe highest flaw density area is repeated around the entire RPV circumference, i.e. 360°.
Figure 6.19: The highest density area made into a 2D model.
An elasto-plastic 2D FE analysis was made based on this model. This led to the determination ofthe collapse pressure according to ASME III Code Article NB-3228.3 and the verification of theprimary stress limits. The collapse pressure is more than 1.5 times the design pressure,confirming the criterion is met.
Version 1
This document is the property of Electrabel S.A. Any duplication or transmission to third parties is forbidden without prior written approval.
92Structural Integrity AssessmentSafety Case 2015 Doel 3 RPV
6.4 10CFR50 Appendix G and PTSAnalyses
The p-T curves integrated into the plant’s Technical Specifications in the framework of the2012 Safety Case remain valid and do not have to be updated.
The Deterministic PTS Analysis of the RPV core shells shows that the RTNDT of the base metalwill remain below 132 °C at the end of its service lifetime.
6.4.110CFR50 Appendix G – Fracture ToughnessRequirements
Appendix G of 10CFR50, which is applicable to the Doel 3 RPV, defines the fracture toughnessrequirements for ferritic materials of pressure-retaining components of the reactor coolantpressure boundary of light water nuclear power reactors. The goal is to provide sufficient safetymargins in any conditions of normal operation, as well as anticipated transient and accidentconditions, to which the pressure boundary may be subjected over its service lifetime. As such,10CFR50 Appendix G refers to the analysis method included in ASME XI Appendix G, whichcovers the requirements regarding Pressure-Temperature Operating Limits and Low-Temperature Overpressure Protection.
Pressure-Temperature Operating Limits
The pressure-temperature domain, in which the reactor can be operated safely, is characterizedby the pressure-temperature operating limits given in the form of pressure-temperature (p-T)curves.
In the framework of the 2012 Safety Case, the p-T curves were updated based on the RTNDT
embrittlement curve considering the absolute additional shift in RTNDT of 50°C (Chapter 5.5.1).The updated p-T curves were integrated into the plant’s Technical Specifications.
It was shown that the RTNDT value used for the calculation of the p-T curves and issued fromthe RTNDT curves of the present Safety Case (Chapter 5.5.2.) are lower than those issued fromthe absolute additional shift in RTNDT of 50°C as considered in the 2012 Safety Case.
The p-T curves updated in the framework of the 2012 Safety Case are therefore morerestrictive than an update performed with the current RTNDT.
The p-T curves integrated into the plant’s Technical Specifications remain valid and do not haveto be updated.
Low-Temperature Overpressure Protection
As the p-T curves remain unchanged, the same goes for the low-temperature overpressureprotection.
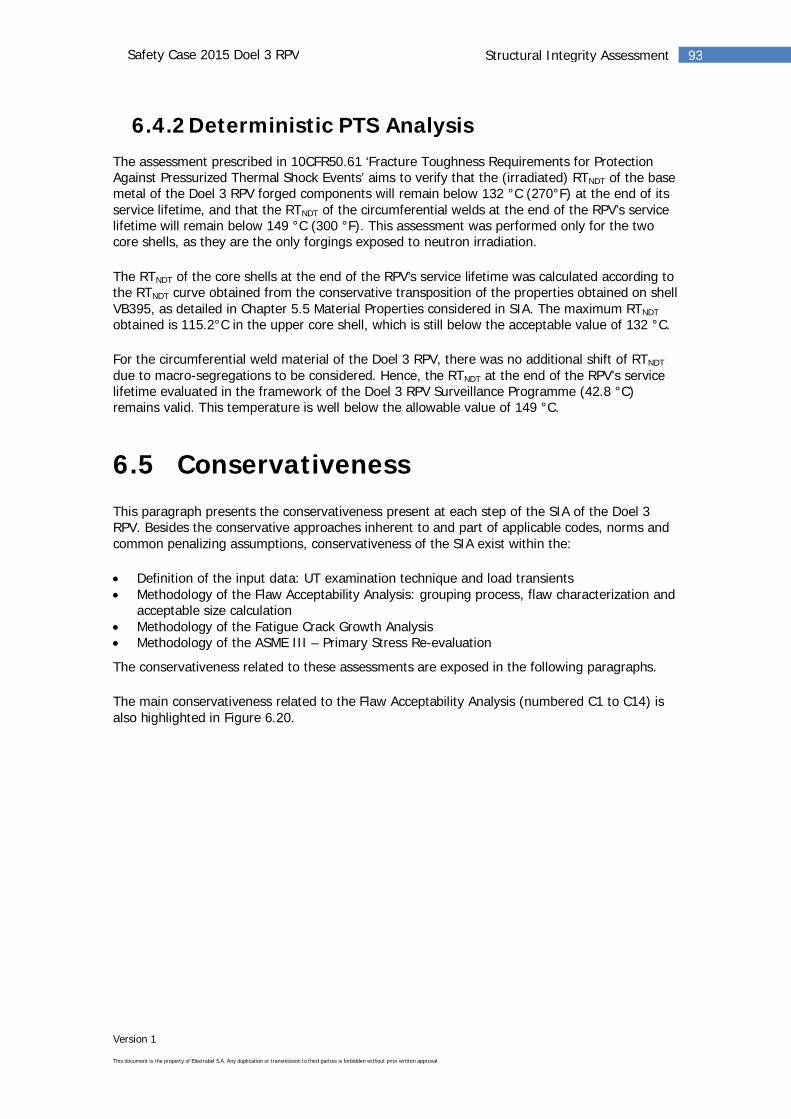
Version 1
This document is the property of Electrabel S.A. Any duplication or transmission to third parties is forbidden without prior written approval.
93Structural Integrity AssessmentSafety Case 2015 Doel 3 RPV
6.4.2Deterministic PTS AnalysisThe assessment prescribed in 10CFR50.61 ‘Fracture Toughness Requirements for ProtectionAgainst Pressurized Thermal Shock Events’ aims to verify that the (irradiated) RTNDT of the basemetal of the Doel 3 RPV forged components will remain below 132 °C (270°F) at the end of itsservice lifetime, and that the RTNDT of the circumferential welds at the end of the RPV’s servicelifetime will remain below 149 °C (300 °F). This assessment was performed only for the twocore shells, as they are the only forgings exposed to neutron irradiation.
The RTNDT of the core shells at the end of the RPV’s service lifetime was calculated according tothe RTNDT curve obtained from the conservative transposition of the properties obtained on shellVB395, as detailed in Chapter 5.5 Material Properties considered in SIA. The maximum RTNDT
obtained is 115.2°C in the upper core shell, which is still below the acceptable value of 132 °C.
For the circumferential weld material of the Doel 3 RPV, there was no additional shift of RTNDT
due to macro-segregations to be considered. Hence, the RTNDT at the end of the RPV’s servicelifetime evaluated in the framework of the Doel 3 RPV Surveillance Programme (42.8 °C)remains valid. This temperature is well below the allowable value of 149 °C.
6.5 Conservativeness
This paragraph presents the conservativeness present at each step of the SIA of the Doel 3RPV. Besides the conservative approaches inherent to and part of applicable codes, norms andcommon penalizing assumptions, conservativeness of the SIA exist within the:
Definition of the input data: UT examination technique and load transientsMethodology of the Flaw Acceptability Analysis: grouping process, flaw characterization andacceptable size calculationMethodology of the Fatigue Crack Growth AnalysisMethodology of the ASME III – Primary Stress Re-evaluation
The conservativeness related to these assessments are exposed in the following paragraphs.
The main conservativeness related to the Flaw Acceptability Analysis (numbered C1 to C14) isalso highlighted in Figure 6.20.
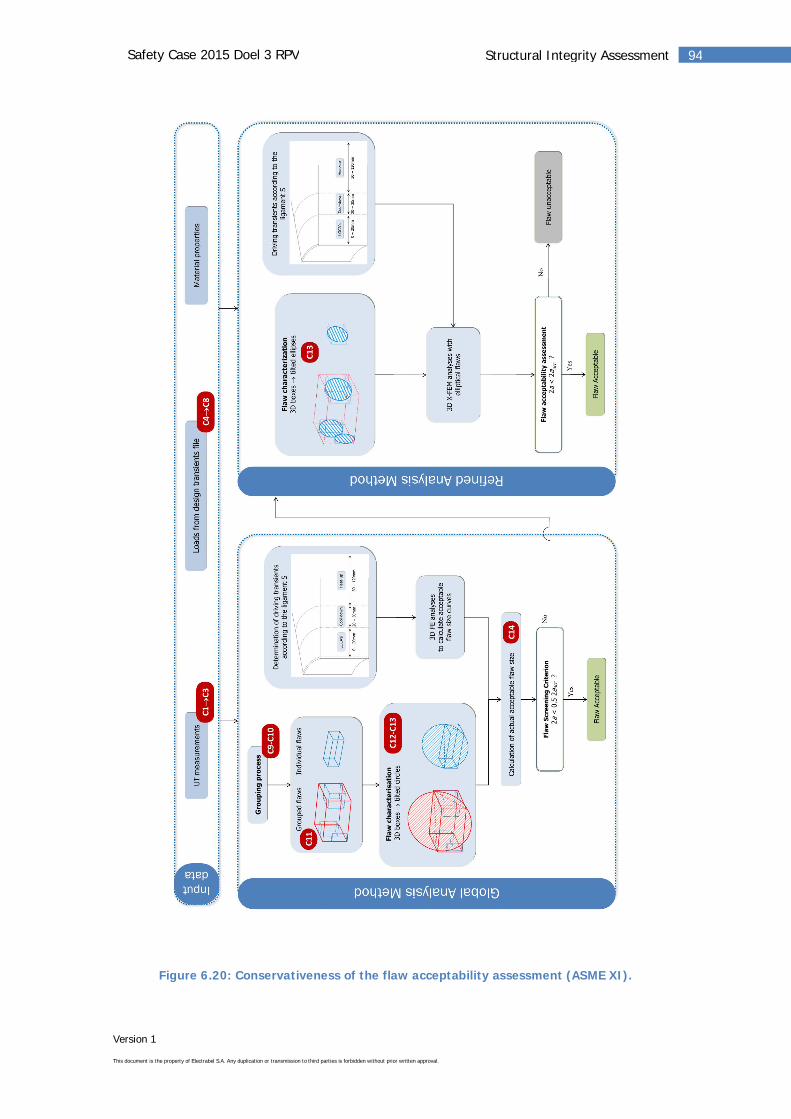
Version 1
This document is the property of Electrabel S.A. Any duplication or transmission to third parties is forbidden without prior written approval.
94Structural Integrity AssessmentSafety Case 2015 Doel 3 RPV
Figure 6.20: Conservativeness of the flaw acceptability assessment (ASME XI).
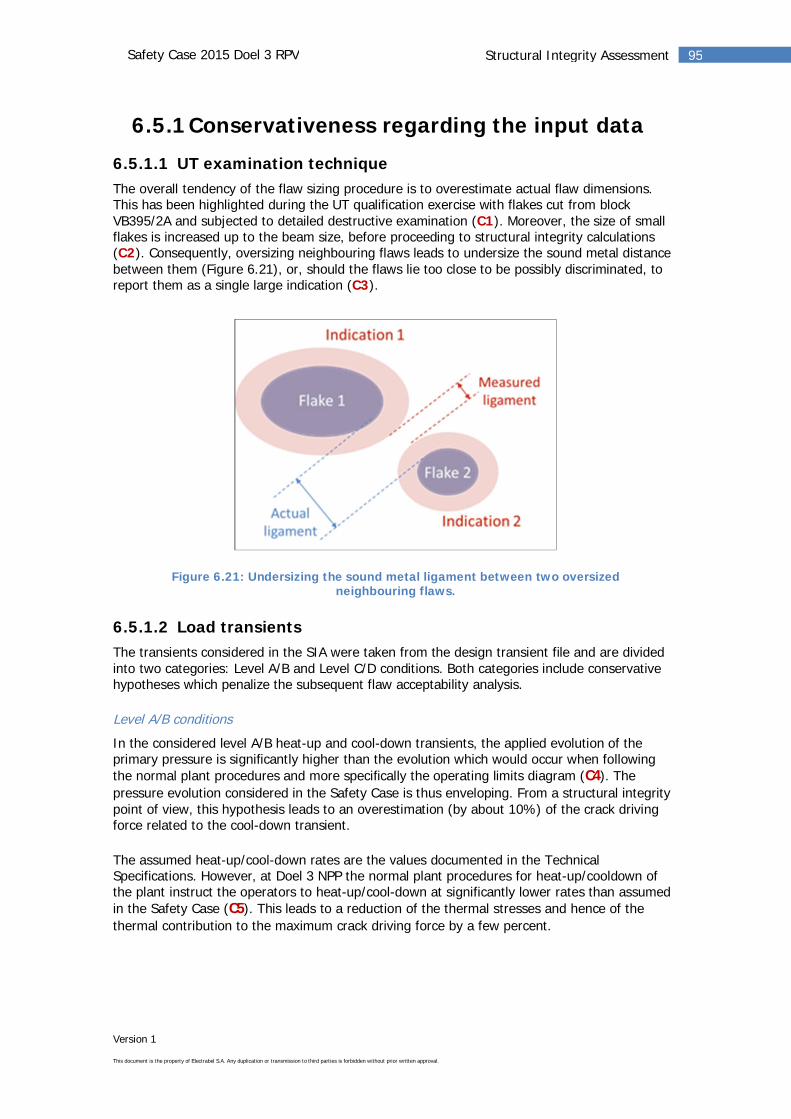
Version 1
This document is the property of Electrabel S.A. Any duplication or transmission to third parties is forbidden without prior written approval.
95Structural Integrity AssessmentSafety Case 2015 Doel 3 RPV
6.5.1Conservativeness regarding the input data
6.5.1.1 UT examination techniqueThe overall tendency of the flaw sizing procedure is to overestimate actual flaw dimensions.This has been highlighted during the UT qualification exercise with flakes cut from blockVB395/2A and subjected to detailed destructive examination (C1). Moreover, the size of smallflakes is increased up to the beam size, before proceeding to structural integrity calculations(C2). Consequently, oversizing neighbouring flaws leads to undersize the sound metal distancebetween them (Figure 6.21), or, should the flaws lie too close to be possibly discriminated, toreport them as a single large indication (C3).
Figure 6.21: Undersizing the sound metal ligament between two oversizedneighbouring flaws.
6.5.1.2 Load transientsThe transients considered in the SIA were taken from the design transient file and are dividedinto two categories: Level A/B and Level C/D conditions. Both categories include conservativehypotheses which penalize the subsequent flaw acceptability analysis.
Level A/B conditions
In the considered level A/B heat-up and cool-down transients, the applied evolution of theprimary pressure is significantly higher than the evolution which would occur when followingthe normal plant procedures and more specifically the operating limits diagram (C4). Thepressure evolution considered in the Safety Case is thus enveloping. From a structural integritypoint of view, this hypothesis leads to an overestimation (by about 10%) of the crack drivingforce related to the cool-down transient.
The assumed heat-up/cool-down rates are the values documented in the TechnicalSpecifications. However, at Doel 3 NPP the normal plant procedures for heat-up/cooldown ofthe plant instruct the operators to heat-up/cool-down at significantly lower rates than assumedin the Safety Case (C5). This leads to a reduction of the thermal stresses and hence of thethermal contribution to the maximum crack driving force by a few percent.
Version 1
This document is the property of Electrabel S.A. Any duplication or transmission to third parties is forbidden without prior written approval.
96Structural Integrity AssessmentSafety Case 2015 Doel 3 RPV
Level C/D conditions
The most stringent level C/D transient regarding the RPV structural integrity is the small breakLOCA. In the Safety Case analysis of this transient, a constant High-Pressure Safety Injection(HPSI) flow rate is considered. This constant flow rate is equal to the run-out flow rate of theHPSI pump, i.e. the flow rate corresponding to a counterpressure of 1 bar abs (cf. Figure 6.22).This assumption is conservative as it does not account for the actual counterpressure during thetransient (C6). Accounting for the actual counterpressure leads to a lower SI flow rate and thusto a lower downcomer cool-down rate and final temperature. In terms of structural integrity,this conservativeness is assessed on selected flaws from the Doel 3 RPV (with maximal 2a/2aacc
and with the highest crack driving force) and leads to an overestimation of:
The ratio to acceptable flaw size by 5% (for the highest 2a/2aacc flaw).The maximum crack driving force by 7% (for the highest KJ,MAX flaw).
Figure 6.22: Conservative hypotheses C6 and C7 in the definition of Small Break LOCAtransient.
On the other hand, a complete interruption of the circulation flow rate (be it forced or natural)in the primary loops is considered during the entire small break LOCA transient (C7). As aconsequence no mixing occurs between the relatively hot water coming from the SGs and therelatively cold SI flow. The temperature of the water reaching the RPV downcomer is thusconservatively assumed to be equal to the relatively low SI temperature and this during theentire transient. This results in a high cool-down rate of the RPV downcomer wall leading to anoverestimation (based on the same selected flaws from the Doel 3 RPV) of:
The ratio to acceptable flaw size up to 18% (for the highest 2a/2aacc flaw).The maximum crack driving force up to 41% (for the highest KJ,MAX flaw).
The small break LOCA is defined with a minimum SI temperature of 40°C at Doel 3 (C8).However, when considering best-estimate temperatures (45°C at Doel 3), calculations based onthe flaws with maximal 2a/2acc and with the highest crack driving force (from the Doel 3 andTihange 2 RPVs) have shown additional margins:
7% on the ratio to acceptable flaw size (for the highest 2a/2aacc flaw).4% on the maximum crack driving force (for the highest KJ,MAX flaw).
The conservativeness is illustrated in Figure 6.23 for an individual flaw close to the cladding-base metal interface.
0
50
100
150
200
250
300
0 500 1000 1500 2000 2500 3000
Volu
met
ricFl
owra
te[m
³/h]
Time [s]
HPSI flow rate
Safety caseSensitivity C6 - Variable flow
0
50
100
150
200
250
300
0 400 800 1200 1600
Tem
pera
ture
[°C]
Time [s]
Downcomer temperature
Safety case
Sensitivity C7 (nointerruption of NC)
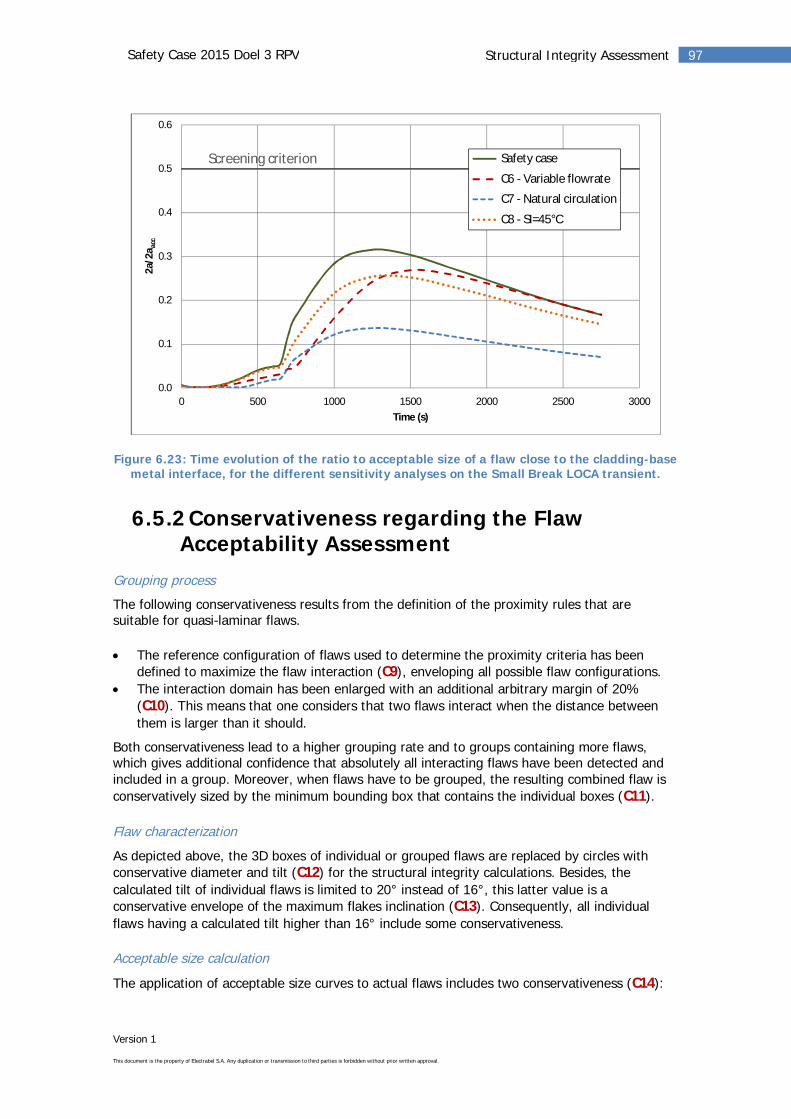
Version 1
This document is the property of Electrabel S.A. Any duplication or transmission to third parties is forbidden without prior written approval.
97Structural Integrity AssessmentSafety Case 2015 Doel 3 RPV
Figure 6.23: Time evolution of the ratio to acceptable size of a flaw close to the cladding-basemetal interface, for the different sensitivity analyses on the Small Break LOCA transient.
6.5.2Conservativeness regarding the FlawAcceptability Assessment
Grouping process
The following conservativeness results from the definition of the proximity rules that aresuitable for quasi-laminar flaws.
The reference configuration of flaws used to determine the proximity criteria has beendefined to maximize the flaw interaction (C9), enveloping all possible flaw configurations.The interaction domain has been enlarged with an additional arbitrary margin of 20%(C10). This means that one considers that two flaws interact when the distance betweenthem is larger than it should.
Both conservativeness lead to a higher grouping rate and to groups containing more flaws,which gives additional confidence that absolutely all interacting flaws have been detected andincluded in a group. Moreover, when flaws have to be grouped, the resulting combined flaw isconservatively sized by the minimum bounding box that contains the individual boxes (C11).
Flaw characterization
As depicted above, the 3D boxes of individual or grouped flaws are replaced by circles withconservative diameter and tilt (C12) for the structural integrity calculations. Besides, thecalculated tilt of individual flaws is limited to 20° instead of 16°, this latter value is aconservative envelope of the maximum flakes inclination (C13). Consequently, all individualflaws having a calculated tilt higher than 16° include some conservativeness.
Acceptable size calculation
The application of acceptable size curves to actual flaws includes two conservativeness (C14):
0.0
0.1
0.2
0.3
0.4
0.5
0.6
0 500 1000 1500 2000 2500 3000
2a/2
a acc
Time (s)
Safety case
C6 - Variable flowrate
C7 - Natural circulation
C8 - SI=45°C
Screening criterion
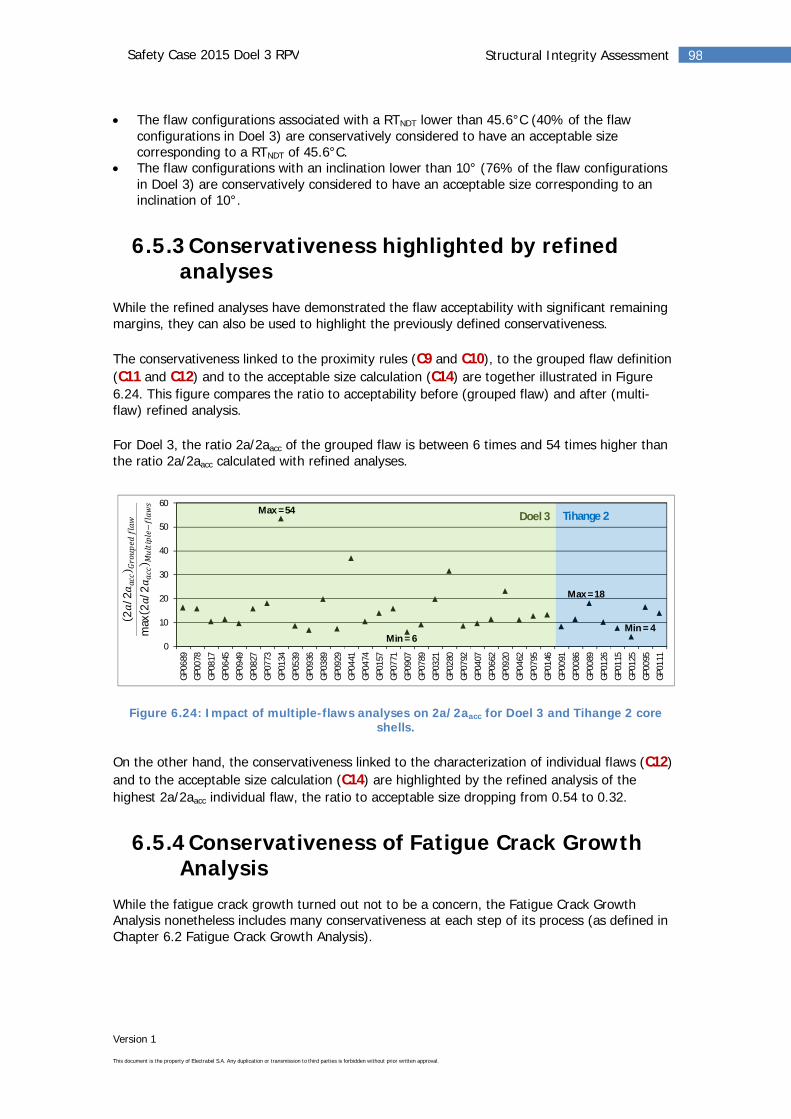
Version 1
This document is the property of Electrabel S.A. Any duplication or transmission to third parties is forbidden without prior written approval.
98Structural Integrity AssessmentSafety Case 2015 Doel 3 RPV
The flaw configurations associated with a RTNDT lower than 45.6°C (40% of the flawconfigurations in Doel 3) are conservatively considered to have an acceptable sizecorresponding to a RTNDT of 45.6°C.The flaw configurations with an inclination lower than 10° (76% of the flaw configurationsin Doel 3) are conservatively considered to have an acceptable size corresponding to aninclination of 10°.
6.5.3Conservativeness highlighted by refinedanalyses
While the refined analyses have demonstrated the flaw acceptability with significant remainingmargins, they can also be used to highlight the previously defined conservativeness.
The conservativeness linked to the proximity rules (C9 and C10), to the grouped flaw definition(C11 and C12) and to the acceptable size calculation (C14) are together illustrated in Figure6.24. This figure compares the ratio to acceptability before (grouped flaw) and after (multi-flaw) refined analysis.
For Doel 3, the ratio 2a/2aacc of the grouped flaw is between 6 times and 54 times higher thanthe ratio 2a/2aacc calculated with refined analyses.
Figure 6.24: Impact of multiple-flaws analyses on 2a/2aacc for Doel 3 and Tihange 2 coreshells.
On the other hand, the conservativeness linked to the characterization of individual flaws (C12)and to the acceptable size calculation (C14) are highlighted by the refined analysis of thehighest 2a/2aacc individual flaw, the ratio to acceptable size dropping from 0.54 to 0.32.
6.5.4Conservativeness of Fatigue Crack GrowthAnalysis
While the fatigue crack growth turned out not to be a concern, the Fatigue Crack GrowthAnalysis nonetheless includes many conservativeness at each step of its process (as defined inChapter 6.2 Fatigue Crack Growth Analysis).
0
10
20
30
40
50
60
GP06
89GP
0078
GP08
17GP
0645
GP09
49GP
0827
GP07
73GP
0134
GP05
39GP
0936
GP03
89GP
0929
GP04
41GP
0474
GP01
57GP
0771
GP09
07GP
0789
GP03
21GP
0280
GP07
92GP
0407
GP06
62GP
0920
GP04
62GP
0795
GP01
46GP
0091
GP00
86GP
0089
GP01
26GP
0115
GP01
25GP
0095
GP01
11
2/2
max
2/2
Doel 3 Tihange 2Max = 54
Min = 6Min = 4
Max = 18
Version 1
This document is the property of Electrabel S.A. Any duplication or transmission to third parties is forbidden without prior written approval.
99Structural Integrity AssessmentSafety Case 2015 Doel 3 RPV
The conservativeness related to the input data used in the fatigue analysis are similar to theones of the Flaw Acceptability Analysis (at least for the UT measurements and transient loaddefinition). Moreover, a conservative heat transfer coefficient between the primary coolant andthe vessel wall is considered whatever the level A/B transient. As far as the transient occurrenceis concerned, the considered number of transients is greater than the actual one, leading to ahigher calculated crack growth.
Regarding the calculation methodology, the main conservativeness are related to:
The application of the conservative grouping process, and the resulting flawcharacterization, just as in the Flaw Acceptability Analysis.The use of conservative reference flaws which envelope the whole population of flawconfigurations present in the RPVs.The consideration of the axial projection of these reference flaws to assess the stressintensity factors, leading to overestimate the crack growth 2 by more than a factor 13compared to the actual quasi-laminar flaw configuration.
6.5.5Conservativeness of ASME III – PrimaryStress Re-evaluation
The ASME III analysis relies on the same conservativeness regarding the UT measurements asthe Flaw Acceptability Analysis. Moreover, as detailed in Chapter 6.3 ASME III—Primary StressRe-evaluation, the replication of the highest flaw density area as well as the use of a 2D modelwith infinite flaws make the applied methodology overly conservative.
Version 1
This document is the property of Electrabel S.A. Any duplication or transmission to third parties is forbidden without prior written approval.
100Structural Integrity AssessmentSafety Case 2015 Doel 3 RPV
6.6 Conclusions of the SIA
The SIA of the Doel 3 RPV was performed considering all indications that were revealed by thequalified UT inspection procedure. As such, it covers the indications that were classified ashydrogen flakes as well as the indications that were classified as clad interface imperfectionsbut that are conservatively considered and treated as hydrogen flakes.
The Flaw Acceptability Assessment with its refined analysis was based on conservative data andcalculation methodologies. More than 99.75% (Doel 3) of the flaw configurations meet thescreening criterion 2a < 0.5 2aacc. This means that most of the flaws affecting the Doel 3 RPVshells are harmless in the event of a transient. This is a consequence of their quasi-laminarcharacter.
The remaining 0.25% (Doel 3) flaw configurations that were subjected to a refined 3D XFEManalysis meet the acceptance criterion 2a < 2aacc by a considerable margin (maximum ratio of0.32 in the Doel 3 RPV).
The refined analyses clearly highlighted the very low level of the crack driving forces KMAX of thequasi-laminar hydrogen flakes: KMAX for all flaw configurations is well below the fracturetoughness lower shelf KIR,lower shelf demonstrating that the quasi-laminar hydrogen flakes areacceptable with respect to the structural integrity of the Doel 3 RPV.
The majority of the flaws even have a KMAX value below the lower shelf considering the safetyfactor KIR,lower shelf/SF which means that their acceptability is independent from the RTNDT.
For the few flaws of which KMAX exceeds KIR,lower shelf/SF, the margin in terms of RTNDT iscalculated based on the conservative transposition of the VB395 properties. The calculatedmargin is very large (80°C and more).
The Fatigue Crack Growth analysis shows that the maximum potential growth of the flaws inthe forgings over the entire service lifetime of the RPV, assessed by a conservativemethodology, is limited to 3.19% of their size in the Doel 3 RPV. This confirms the results ofthe Safety Case. Fatigue crack growth is not a concern and does not need to be consideredfurther in the Flaw Acceptability Analysis.
The Primary Stress Re-evaluation was performed using 2D modelling of the highest flaw densityarea. The re-evaluation made clear that the collapse pressure is more than 1.5 times the designpressure, confirming the criterion is met.
Version 1
This document is the property of Electrabel S.A. Any duplication or transmission to third parties is forbidden without prior written approval.
101Sensitivity StudiesSafety Case 2015 Doel 3 RPV
7 Sensitivity StudiesThe project team performed several sensitivity studies in order to assess the robustness of theSafety Case with respect to variations of some parameters of the methodologies or input data.These studies concern the different key elements of the roadmap: UT inspection, materialproperties and Structural Integrity Assessment (SIA). The following sensitivity studies wereperformed:
UT inspection: consideration of an alternative DZ sizing procedure for the indicationsMaterial properties: impact of the KS 02-based RTNDT curve on the margins of the SIASIA: SIA Analysis with 2012 Methodology
7.1 Consideration of an Alternative DZSizing Procedure
The DZ sizing procedure, based on a 6 dB drop from the maximum amplitude of theindication, shows that the structural integrity is not impacted by the variation of the Zcoordinates of indications larger than 20 mm in the DX and DY dimensions.
An alternative methodology has been used to evaluate the sensitivity of the SIA results to thesizing along the Z-axis (radial) for the large indications and groups of indications. The sizingmethod for DZ as implemented in the examination procedure (DZ sizing procedure) is based ona 6 dB drop from the maximum amplitude of the indication. This sizing is performed by anautomatic measurement on the UT contour.
The alternative DZ sizing method that was used for the present evaluation is based on a -6 dBdrop performed manually on each of the different maxima of a given indication.
Results for the qualification blocks
The qualification is based on the correlation between UT and destructive tests on a largenumber of cut flaws. It shows that the DZ sizing procedure generally leads to overestimate theDZ value.
The comparison shows that the DZ sizing procedure has a level of performance equivalent orvery close to the alternative DZ sizing. The conclusion is applicable to the numerous cutindications used in the qualification and also to the six clusters of indications (total 23indications) examined by destructive testing.
Results for Doel 3 core shells
The objective was to compare UT dimensions obtained by two different sizing methods and tohighlight the differences between them.
It appears that the DX or DY dimension of 20 mm is a limit beyond which the DZ sizingprocedure and alternative DZ sizing may lead to different results.
Version 1
This document is the property of Electrabel S.A. Any duplication or transmission to third parties is forbidden without prior written approval.
102Sensitivity StudiesSafety Case 2015 Doel 3 RPV
Sensitivity study for SIA
In order to illustrate that the alternative DZ sizing method has no impact on the structuralintegrity of the RPV shells, a sensitivity study was performed for all indications larger than 20mm in the DX or DY dimension, based on the alternative DZ values. In this study, the groupingand screening steps of the SIA methodology were applied on another data set of indicationsdimensions, where the DZ sizing procedure value was replaced for each concerned indication bythe alternative DZ value. The results were then compared for each vessel shell and showed thatvery similar results were obtained in terms of 2a/2aacc values.
Conclusion
The sensitivity study shows that the structural integrity is not impacted by the variation of the Zcoordinates of indications larger than 20 mm.
7.2 Impact of the KS 02-based RTNDT
Curve on the Margins of the SIA
The impact of considering the KS 02-based RTNDT embrittlement curve (an overestimation ofwhat can be expected in the D3T2 RPV forgings) on the margins of the SIA has beenassessed. As all of the considered flaw configurations are in the low fluence range, applyingthe KS 02-based approach is more conservative as compared to the VB395-based curve usedin the SIA. However, the KS 02-based RTNDT margins still remain very large: above 70°C(instead of 80°C with VB395 based RTNDT curve).
The fracture toughness curve used in the SIA is based on the conservative transfer of VB395’satypical embrittlement to the D3T2 RPV shells. A sensitivity study was performed to evaluate analternative approach based on the German KS 02 material.
The principle of the KS 02-based approach is to consider that the irradiation embrittlement isnormal and well-predicted by the RSE-M formula for the D3T2 RPVs (evaluated for the D3T2core shell’s chemical composition thereby considering conservative enrichment factors toaccount for the composition of macro-segregations), but that a fixed penalty should beconsidered in the entire fluence range, to take into account the potential difference inproperties between the surveillance specimens’ sampling location (out of the segregation) andthe zone affected by flaking (in the macro-segregation). This penalty is taken as the maximumdifference observed between the segregated and non-segregated zones in the KS 02 material:47°C. As explained in § 5.2.2., this difference is larger than the difference observed on theD3T2 nozzle shell cut-outs and it is an overestimation of what can be expected in the D3T2 RPVforgings for the following reasons:
In the D3T2 RPV forgings a large part of the segregated zone was removed by the piercingof the ingots. In the KS 02 component, no piercing was performed and hence the wholesegregated zone is maintained.The difference of 47°C is read from the Charpy curves inside and outside the segregatedzone at the 41J level. This difference cannot be interpreted as a difference in RTNDT inunirradiated conditions as the latter is defined by a combination of Pellini drop weight andCharpy impact tests. For the KS 02 material, this leads to a difference in RTNDT inunirradiated conditions of only 3°C instead of 47°C.
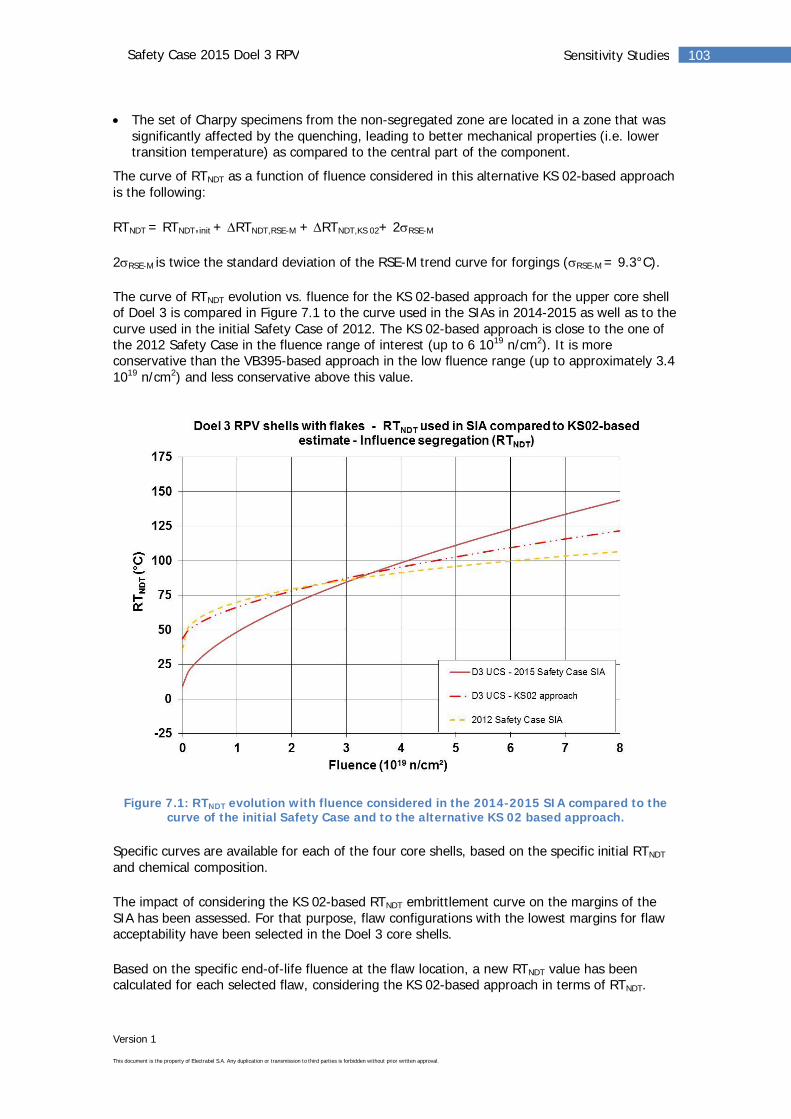
Version 1
This document is the property of Electrabel S.A. Any duplication or transmission to third parties is forbidden without prior written approval.
103Sensitivity StudiesSafety Case 2015 Doel 3 RPV
The set of Charpy specimens from the non-segregated zone are located in a zone that wassignificantly affected by the quenching, leading to better mechanical properties (i.e. lowertransition temperature) as compared to the central part of the component.
The curve of RTNDT as a function of fluence considered in this alternative KS 02-based approachis the following:
RTNDT = RTNDT,init + RTNDT,RSE-M + RTNDT,KS 02+ 2 RSE-M
2 RSE-M is twice the standard deviation of the RSE-M trend curve for forgings ( RSE-M = 9.3°C).
The curve of RTNDT evolution vs. fluence for the KS 02-based approach for the upper core shellof Doel 3 is compared in Figure 7.1 to the curve used in the SIAs in 2014-2015 as well as to thecurve used in the initial Safety Case of 2012. The KS 02-based approach is close to the one ofthe 2012 Safety Case in the fluence range of interest (up to 6 1019 n/cm2). It is moreconservative than the VB395-based approach in the low fluence range (up to approximately 3.41019 n/cm2) and less conservative above this value.
Figure 7.1: RTNDT evolution with fluence considered in the 2014-2015 SIA compared to thecurve of the initial Safety Case and to the alternative KS 02 based approach.
Specific curves are available for each of the four core shells, based on the specific initial RTNDT
and chemical composition.
The impact of considering the KS 02-based RTNDT embrittlement curve on the margins of theSIA has been assessed. For that purpose, flaw configurations with the lowest margins for flawacceptability have been selected in the Doel 3 core shells.
Based on the specific end-of-life fluence at the flaw location, a new RTNDT value has beencalculated for each selected flaw, considering the KS 02-based approach in terms of RTNDT.
Version 1
This document is the property of Electrabel S.A. Any duplication or transmission to third parties is forbidden without prior written approval.
104Sensitivity StudiesSafety Case 2015 Doel 3 RPV
As all of the considered flaw configurations are in the low fluence range (less than 3.4 1019
n/cm2), applying the KS 02-based approach is more conservative than the VB395-based curveused in the SIA. However, the KS 02-based RTNDT margins still remain very large: above 70°C(instead of 80°C with VB395-based curve).
7.3 SIA Analysis with 2012 Methodology
The acceptability of all 2014 UT reported flaws in the Doel 3 core shells is demonstrated evenwhen applying the analysis method and the input parameters of the 2012 Safety Case. Thisconfirms that the structural integrity of the RPV has always been guaranteed.
Scope
The aim of this sensitivity analysis is to demonstrate the acceptability of all 2014 UT reportedflaws in the Doel 3 core shells even when applying the assumptions used in the 2012 SafetyCase for performing the SIA of the RPV in presence of flaws.
Changes in the assumptions
Changes between the SIA of the 2012 Safety Case and its 2014 update are related to analysismethods on the one hand and input parameters on the other hand.
Changes in analysis methods:
Grouping process: update of grouping rules of flaws based on 3D supporting calculations(2014) instead of 2D calculations (2012).
Changes in input parameters (2014 vs. 2012):
Fluence map: update of the reactor pressure vessel fluence after 40 years of operation,taking extra downtime in 2014 and 2015 into account, and consideration of the fluencedecrease in the lower part of the core shellsEmbrittlement law (2014 vs 2012): reassessment of the RTNDT shift of the core shellmaterial from the transposition of the properties obtained on shell VB395 (addition of avariable margin on top of the RSE-M formula), instead of the consideration of a fixedmargin 50°C on top of the FIS formula.Safety Injection System water temperature: 40°C (2014) vs. 7°C (2012).
Results
The SIA (screening and refined analysis) of the Doel 3 core shells was performed for theupdated cartography of the 2014 UT reported flaws, with application of the same analysismethod and input parameters as in the 2012 Safety Case. This showed that all 2014 UTreported flaws are acceptable even when applying the analysis method and input parameters ofthe 2012 Safety Case.
This sensitivity analysis also highlights the robustness of the set up methodology and thesoundness of the assumptions update compared to the 2012 Safety Case.

Version 1
This document is the property of Electrabel S.A. Any duplication or transmission to third parties is forbidden without prior written approval.
105Sensitivity StudiesSafety Case 2015 Doel 3 RPV
7.4 Conclusions
The sensitivity studies performed on three key elements of the roadmap have demonstrated therobustness of the approach that is applied in the Safety Case.
The sensitivity study based on an alternative sizing procedure shows that the structural integrityis not impacted by the variation of the Z coordinates of indications larger than 20 mm.
The use of alternate fracture toughness properties based on the transfer of tests resultsobtained on the KS 02 component, instead of the VB395 shell, has a very limited effect on theevolution of the RTNDT with fluence and hence on the results of the SIA.
The application of the methodology used in 2012 for SIA, even when based on assumptionsthat have been updated in the meantime, to the indications cartography obtained in 2014 withapplication of the qualified inspection procedure, has confirmed that the severity of the loadingis marginally affected and that the acceptance criteria were always satisfied at any time in thelife of the RPV, even without consideration of the heat-up of the SI water implemented now atDoel 3.
Version 1
This document is the property of Electrabel S.A. Any duplication or transmission to third parties is forbidden without prior written approval.
106ConclusionsSafety Case 2015 Doel 3 RPV
8 ConclusionsThrough this Safety Case Report Electrabel is convinced of having demonstrated that thestructural integrity of the Doel 3 RPV is fully maintained, with considerable margins, under alloperating and accidental conditions. The Structural Integrity Assessment (SIA) has providedevidence of the harmless character of all detected flaws in the RPV. This allows for a saferestart and operation of the Doel 3 NPP.
8.1 Detailed Conclusions from the SafetyCase Roadmap
To demonstrate the integrity of the reactor pressure vessel under all conditions, the Safety Caseroadmap specified an extensive phase of studies and material tests. This led to the followingresults and conclusions.
Hydrogen flaking is fully characterizedThe Safety Cases of 2012 and 2013 confirmed the diagnosis of flaking, caused duringfabrication. Flaking is not correlated to the chemical enrichment level of the segregation in thematerial, as both mechanisms are explained by independent factors. Further examinationdemonstrated the facetted appearance of the flakes and their nearly laminar character, with amaximum possible inclination of 15° towards the inner surface of the reactor pressure wall.
Qualified UT inspection procedure achieves high performance indetection and sizingThe formal qualification process has led to an inspection procedure with a very high level ofconfidence for the detection, localization and sizing of the flakes. The qualification processresulted in upgrading the inspection procedure to ensure its compliance with inspectionobjectives in terms of flaw detection and characterization. A very high confidence level isachieved for detecting flakes. The flake sizing was shown to be conservative. The appliedstraight beam technique (2012 and 2013) has proven to be adequate in detecting the presence,if any, of hydrogen flaking in the RPV shells.
Re-inspection of the vessel shells delivers a complete cartography ofthe indications and confirms that the flakes are stableThe inspection of 2014 confirmed that the flakes are stable (there has been no growth), thatthey have a quasi-laminar character, and that there is no radial connection between them. Byapplying the improved settings of the qualified inspection procedure, the number of reportedindications proved to be significantly higher than in 2012 though the affected volume remainedunchanged. The conservativeness introduced by the updated flaw sizing procedure and thenon-discrimination of clustered flakes have led to the reporting of larger average dimensionsand much larger maximum dimensions. The new and complete cartography, that integrated theclad interface imperfections further treated as hydrogen flakes, has entirely been taken over asinput for the SIA. The clustered flakes have been considered as single flaws.
Version 1
This document is the property of Electrabel S.A. Any duplication or transmission to third parties is forbidden without prior written approval.
107ConclusionsSafety Case 2015 Doel 3 RPV
Conservative material properties are derived for use in the SIAThe extended and comprehensive material test programme has shown that the microstructureof the Doel 3 and Tihange 2 forgings is identical, and that these forgings – such as the GermanKS 02 – behave as expected under irradiated conditions. The tests on the flaked material havealso shown that the presence of hydrogen flakes does not have any effect on the evolution ofthe fracture toughness under irradiation.
The mechanical tests and the assessment of atypical embrittlement of the VB395 shell havemade clear that it is very unlikely that the Doel 3 RPV core shell forging would be moresensitive to irradiation because of the presence of hydrogen flakes. However, as a conservativemeasure, it has been postulated that the Doel 3 RPV core shells have an additional sensitivity toirradiation embrittlement of the same magnitude as the VB395 material.
In general, the RTNDT trend curves built for use in the SIA include considerable margins and areconservative.
Structural integrity of the RPV is demonstrated with large safetymargins, and has never been a concern during the whole operation ofthe plant since commissioningGiven the presence of the detected flaws, the goal of the SIA is to demonstrate that thestructural integrity of the RPV is maintained under all operating and accidental conditions.Therefore it addressed the following in a very comprehensive way:
Assessment of the absence of crack initiation for all individual flawsAssessment of the stability of the flaws through fatigue crack growth evaluationSatisfaction of the primary stress intensity acceptance criteria
The SIA has provided evidence of the harmless character of all detected flaws. It concludes thatthe driving forces Kmax are very low, even below the lower shelf of fracture toughness. Giventhe presence of the detected flaws, the structural integrity of the Doel 3 RPV is fully maintained,with considerable margins, under all operating and accidental conditions.
The application of the methodology used in 2012 for SIA to the indications cartographyobtained in 2014 has confirmed that the severity of the loading is marginally affected and thatthe acceptance criteria were always satisfied at any time in the life of the RPV, even withoutconsideration of the SI water heat-up, which is now implemented at Doel 3.
Version 1
This document is the property of Electrabel S.A. Any duplication or transmission to third parties is forbidden without prior written approval.
108ConclusionsSafety Case 2015 Doel 3 RPV
8.2 Conservativeness and SensitivityStudies
To ensure a high confidence in its conclusions, each step of the Safety Case was taken from avery conservative approach. This conservativeness had led to the existence of additionalmargins between the assessments and reality. Some of those margins have been quantified,others have been assessed through sensitivity studies or remain qualitative. The overallconservative approach is present through every step of the assessment:
The ultrasonic examination techniqueThe deterministic SIAThe material properties for use in the SIA
This conservativeness is associated with both the input data and the applied methodology. Theconservative approach is also inherent to and part of the applicable codes, standards, andcommon penalizing assumptions.
Sensitivity studies have been performed on three key elements of the roadmap. They havedemonstrated the robustness of the applied approach in the Safety Case.
8.3 General Conclusion
The current Safety Case takes into account the operational p-T limits that were adapted in 2013and the permanent heating of the water of the SI system above 40°C implemented in the frameof the extended action plan.
This Safety Case Report demonstrates that all studies and calculations are solid, and that allsafety criteria in the SIA of the reactor pressure vessel are met with considerable margins andfor each detected flaw. Consequently, no further action needs to be implemented.
All studies and calculations have been subjected to a rigid review process and validated byexternal experts.
Having thoroughly assessed the roadmap results, Electrabel is convinced that the integrity ofthe reactor vessel has been demonstrated, allowing for a safe restart and operation of theDoel 3 NPP.
At the end of the next fuel cycle a follow-up inspection of the RPV will be performed with thequalified UT inspection procedure.
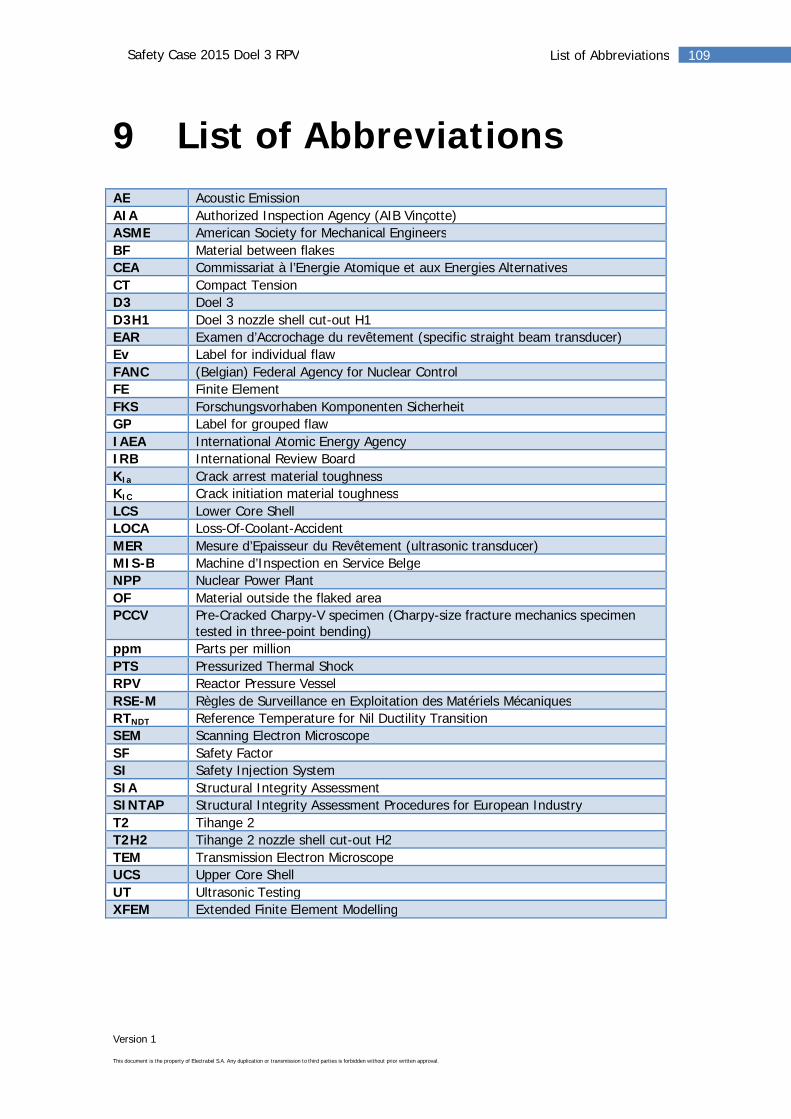
Version 1
This document is the property of Electrabel S.A. Any duplication or transmission to third parties is forbidden without prior written approval.
109List of AbbreviationsSafety Case 2015 Doel 3 RPV
9 List of AbbreviationsAE Acoustic EmissionAIA Authorized Inspection Agency (AIB Vinçotte)ASME American Society for Mechanical EngineersBF Material between flakesCEA Commissariat à l’Energie Atomique et aux Energies AlternativesCT Compact TensionD3 Doel 3D3H1 Doel 3 nozzle shell cut-out H1EAR Examen d’Accrochage du revêtement (specific straight beam transducer)Ev Label for individual flawFANC (Belgian) Federal Agency for Nuclear ControlFE Finite ElementFKS Forschungsvorhaben Komponenten SicherheitGP Label for grouped flawIAEA International Atomic Energy AgencyIRB International Review BoardKIa Crack arrest material toughnessKIC Crack initiation material toughnessLCS Lower Core ShellLOCA Loss-Of-Coolant-AccidentMER Mesure d’Epaisseur du Revêtement (ultrasonic transducer)MIS-B Machine d’Inspection en Service BelgeNPP Nuclear Power PlantOF Material outside the flaked areaPCCV Pre-Cracked Charpy-V specimen (Charpy-size fracture mechanics specimen
tested in three-point bending)ppm Parts per millionPTS Pressurized Thermal ShockRPV Reactor Pressure VesselRSE-M Règles de Surveillance en Exploitation des Matériels MécaniquesRTNDT Reference Temperature for Nil Ductility TransitionSEM Scanning Electron MicroscopeSF Safety FactorSI Safety Injection SystemSIA Structural Integrity AssessmentSINTAP Structural Integrity Assessment Procedures for European IndustryT2 Tihange 2T2H2 Tihange 2 nozzle shell cut-out H2TEM Transmission Electron MicroscopeUCS Upper Core ShellUT Ultrasonic TestingXFEM Extended Finite Element Modelling