reaction kinetics and reactor design in food production binti zakaria.pdf · levenspiel, o.,...
TRANSCRIPT

Reaction Kinetics and
Reactor Design in Food
Production
DR RABITAH ZAKARIA
DEPARTMENT OF PROCESS AND FOOD ENGINEERING
UNIVERSITY PUTRA MALAYSIA

Main Texts:
Earle, R. Earle ,M., Fundamentals of Food Reaction Technology (www. nzifst.org.nz/foodreactiontechnology/index.htm)
Levenspiel, O., Chemical Reaction Engineering, Third Edition. John Wiley and Sons, New York, 1998
Additional Recommended Texts:
Fogler, H.S., Elements of Chemical Reaction Engineering, Forth Edition. Prentice-Hall Int. Series, New Jersey, 2005
References

2 hours lecture
1 hour tutorial
Assignments
Quiz
Final Exam
CLASS CONDUCTS
OVERVIEW OF SYLLIBUS
Topic 1 : Introduction to Reaction Kinetics in Food Processing
Topic 2: Determination of Kinetics Parameter
Topic 3 : Effect of Concentration
Topic 4: Effect of Temperature
Topic 5 : Combining Effect of Temperature and Time
Topic 6: Case Study : Canning and Shelf Life of Food
Topic 7: Kinetics of Enzymatic Reaction
Topic 8: Application of Reaction Kinetics on Novel Food Processing
Technology
Topic 8: Design of Mix Flow Reactor
Topic 10: Design of Plug Flow Reactor

Topic 1
INTRODUCTION TO REACTION KINETICS IN
FOOD PROCESSING

Agricultural and
marine productsFood ProductProcessing change
Processing leads to:•More attractive food
• Safer
• Easier to eat
• Preserved from
deterioration
Introduction: Food Processing

Process Includes:
◐Building up desirable constituents◐Removing undesirable constituents◐Encourage enzyme to develop flavour and texture◐Removing enzymes◐Growing microorganisms to create flavour and texture◐Destroys microorganisms to prevent harm to consumers
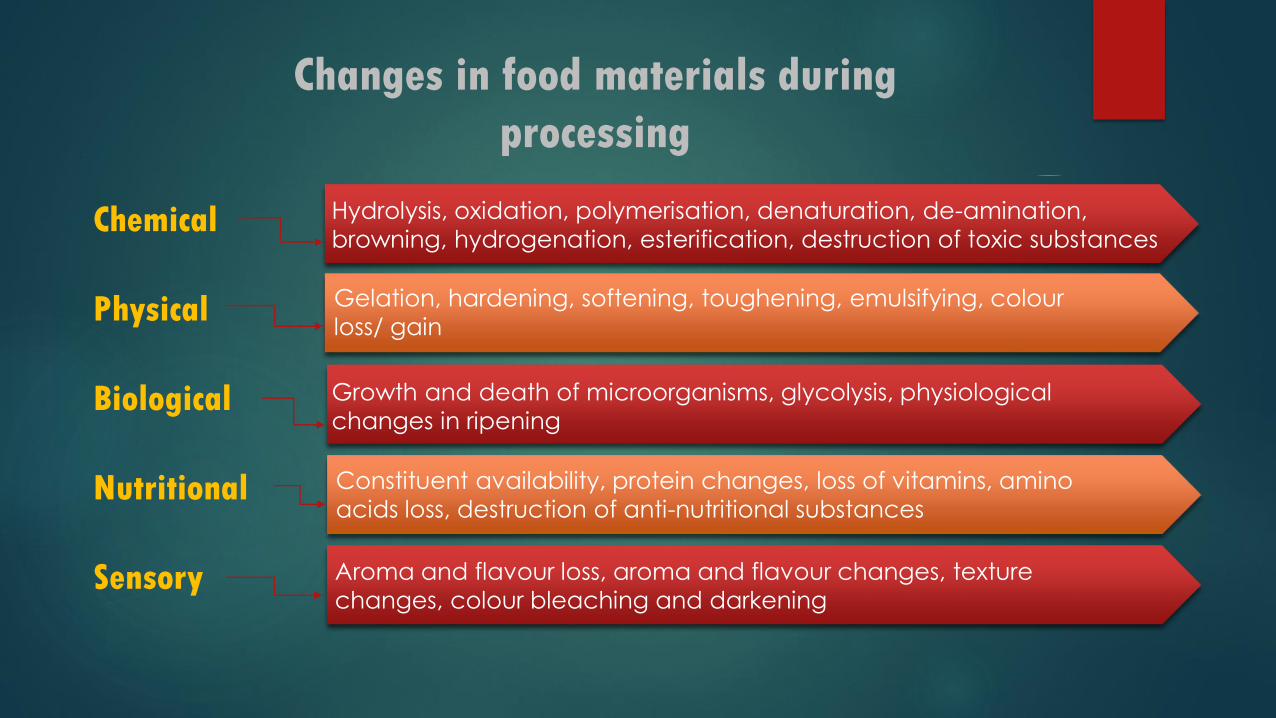
Changes in food materials during
processing
Chemical
Physical
Biological
Nutritional
Sensory
Hydrolysis, oxidation, polymerisation, denaturation, de-amination,
browning, hydrogenation, esterification, destruction of toxic substances
Gelation, hardening, softening, toughening, emulsifying, colour
loss/ gain
Growth and death of microorganisms, glycolysis, physiological
changes in ripening
Constituent availability, protein changes, loss of vitamins, amino
acids loss, destruction of anti-nutritional substances
Aroma and flavour loss, aroma and flavour changes, texture
changes, colour bleaching and darkening
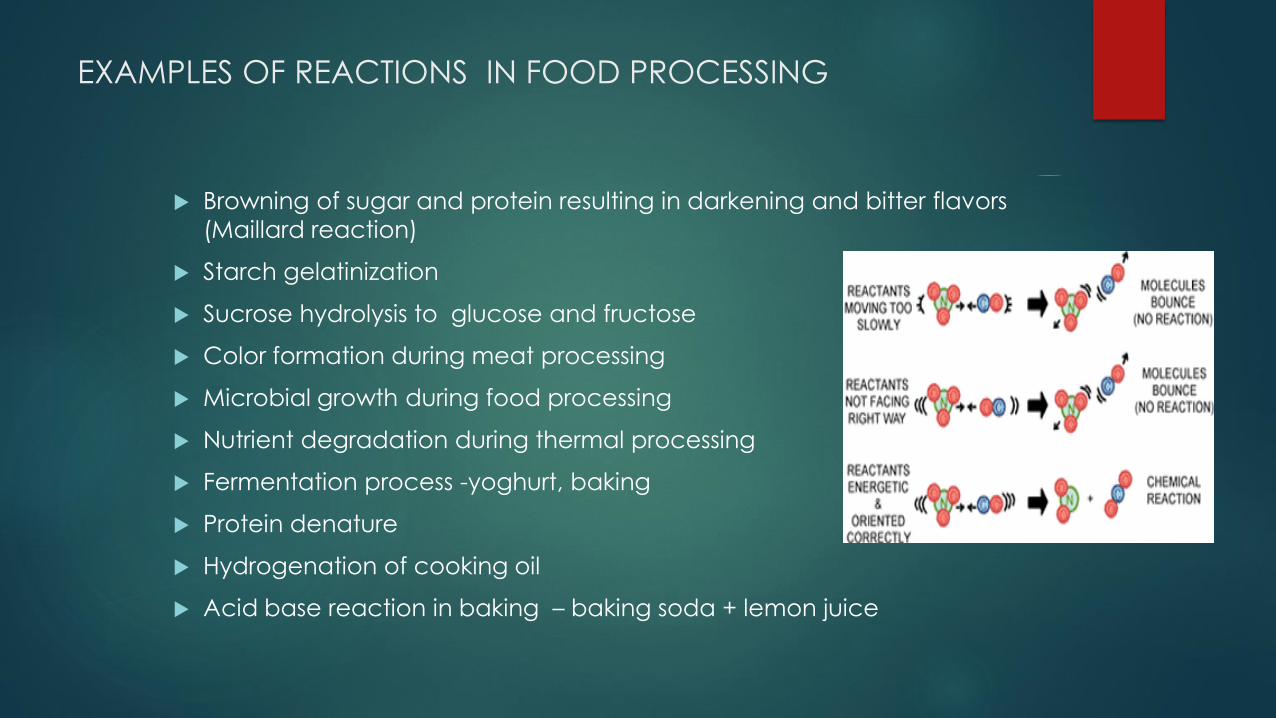
EXAMPLES OF REACTIONS IN FOOD PROCESSING
Browning of sugar and protein resulting in darkening and bitter flavors
(Maillard reaction)
Starch gelatinization
Sucrose hydrolysis to glucose and fructose
Color formation during meat processing
Microbial growth during food processing
Nutrient degradation during thermal processing
Fermentation process -yoghurt, baking
Protein denature
Hydrogenation of cooking oil
Acid base reaction in baking – baking soda + lemon juice

Examples of reaction in food:
hydrolysis

Examples of reaction in food:
protein denature

Examples of reaction in food:
Maillard reaction/browning

Examples of reaction in food:
Hyodrogenation of oil
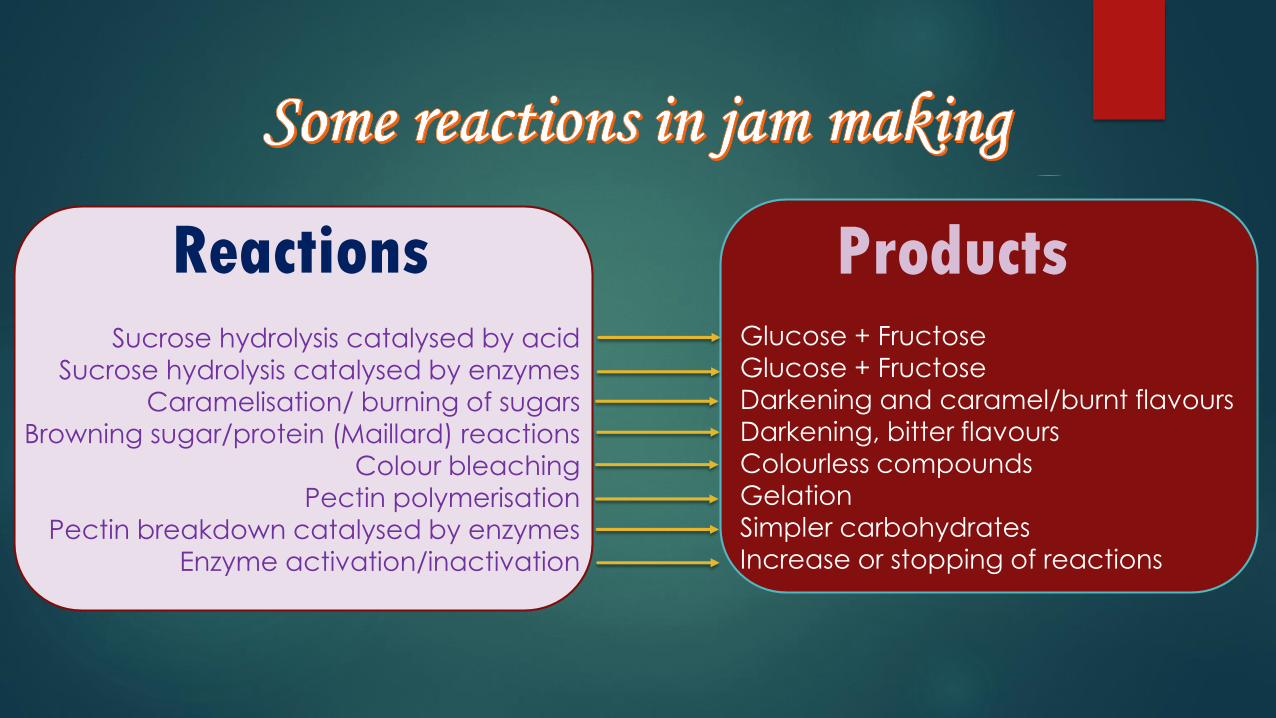
ReactionsSucrose hydrolysis catalysed by acid
Sucrose hydrolysis catalysed by enzymes
Caramelisation/ burning of sugars
Browning sugar/protein (Maillard) reactions
Colour bleaching
Pectin polymerisation
Pectin breakdown catalysed by enzymes
Enzyme activation/inactivation
ProductsGlucose + Fructose
Glucose + Fructose
Darkening and caramel/burnt flavours
Darkening, bitter flavours
Colourless compounds
Gelation
Simpler carbohydrates
Increase or stopping of reactions

Consumer
expectationsAppearance
Colour AromaPrice/value
Nutritional value
Safety
Packaging, brand
Attractiveness
Convenience
Versatility
Ease of storage
Sensory Properties
Enjoyability
Nutrition
Pleasant after-taste
Digestibility
Stomach filling
Physical: size, shape, hardness,
softness, colour
Nutrional: calories, fats, proteins,
vitamins, minerals, amino acids
fatty acids: saturation
Microbiological: pathogens,
bacteria, yeasts, moulds
Sensory: Colour, aroma, flavour, texture
Chemical: Composition, flavour
compounds
fatty acids: hydrolysis
: oxidation
browning compounds
Functional product
CONSUMER COMPANY
Consumer
expectations
Consumer
product concept
Total company
product
Functional product

Progress of changes can be measured during processing
Chemical analysis of composition changes
Physical measurements
Counts of microorganisms
Colour assessment
Texture assessment
Flavour assessment

Knowledge of
raw material
attributes
Control of process
conditions
Rate of change in food
attributes in all stages of food processing
Levels of product
attributes in final
productTemperature, time, pH, moisture, catalysts, enzymes, atmosphere
Raw
material
specificatio
ns
Production
specifications
Product
specifications
Raw materialsNature
Composition
Concentrations
Attributes
ReactionsChemical changes
Attribute changes

Changes of product attributes with time
The changes in product attributes are mainly due to physical
or chemical reactions within the food products
What is Reaction Kinetics
The study of how reaction progress:
Rate of reaction
Development mathematical model to
quantify rate of reaction
Factors that affect reaction rate
Mechanism of reactions
Examples of Application of Reaction
Kinetics in Food Processing
Assessing sensitivity of products attributes( i..e time, catalyst ,
temperature, moisture) to the processing conditions
Control of processing conditions (i.e. time, pH ,temperature) to attain specific product attributes
Processing of juice
Pasteurization milk
Canning
Design of New products
Product Shelf life
Food Process Design

Pasteurisation of milk
milkTime
Controls heating
temperaturePasteurised
milkAlternative process:
- Higher temperature- Shorter time
Pasteurised milk
Faster production
Unwanted reactions
- Browning
- Caramelization
- Vitamin losses
Cooked
flavours

Pasteurization of Milk
Rate can be quantified and the sensitivity to time and temperature of each
product attributes can be measured
-Optimum process condition can be found –give superior product
- Wanted reaction can be maximized
- Unwanted reaction can be minimized

Design of New Products
Milk protein products
Whey was produced in huge quantities in the dairy industry as the
byproduct of the manufacture of butter and cheese
Major waste problem
Utilization of whey
Whey is heated to denature the different protein and the different protein
precipitate out from the whey
Rates of precipitation different with different protein –different time and
temperature
Systematic separation from of different protein from milk– new products

Design of New Products
Pasteurized egg in shells
Vegetative pathogens in eggs can be destroyed by heat treatment
But this also denature the protein
However rate of denaturation and pathogen destruction varies
significantly with time and temperature
At longer processing time and lower temperature, destruction of
pathogen is faster then protein denaturation
Can lead to pasteurization of eggs in their shell

Shelf life study
Shelf life of frozen foods can be predicted at different
storage temperature based on kinetics study of products
attribute
Deterioration of quality at different storage temperature
can be predicted
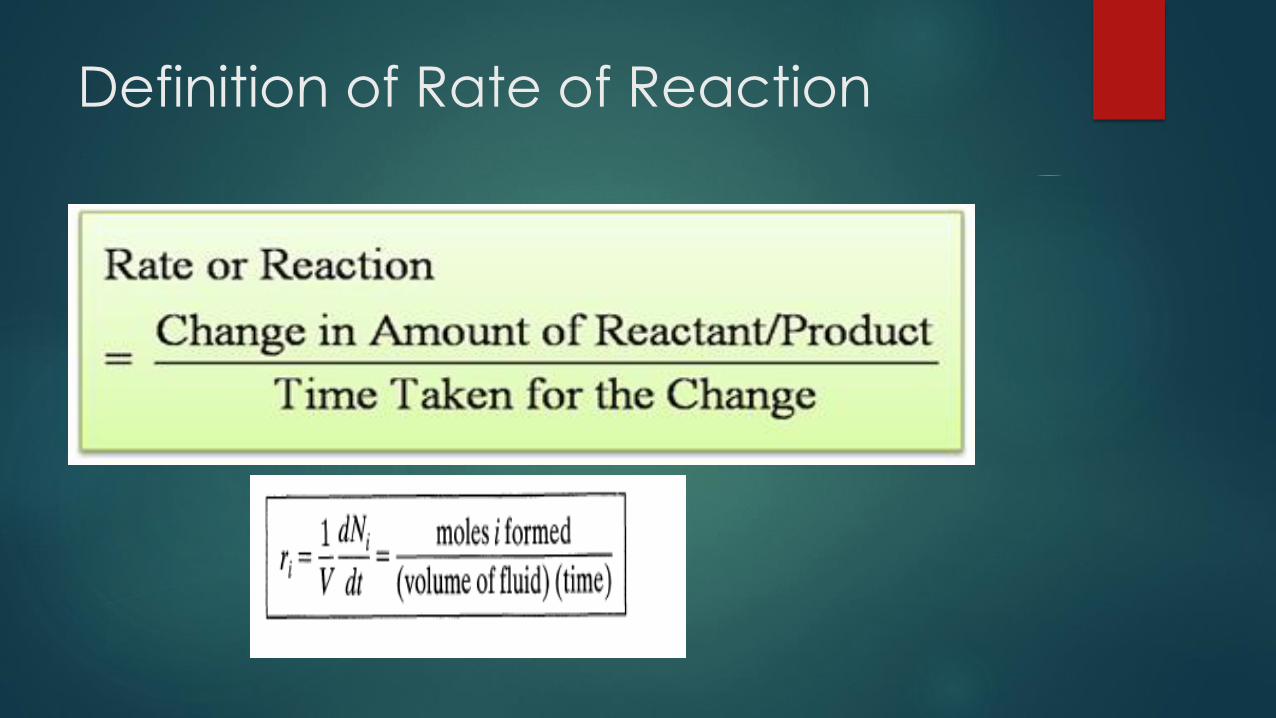
Definition of Rate of Reaction

Factors that effect the rate of
reaction
Nature of
Reactants
Pressure ( Gas
only)Concentration
of Reactants
Catalyst TemperatureSurface Area

Nature of Reactants
Acid-base reactions, formation of salts, and exchange of ions are
fast reactions.
Reactions in which large molecules are formed or break apart are
usually slow.
Reactions breaking strong covalent bonds are also slow.
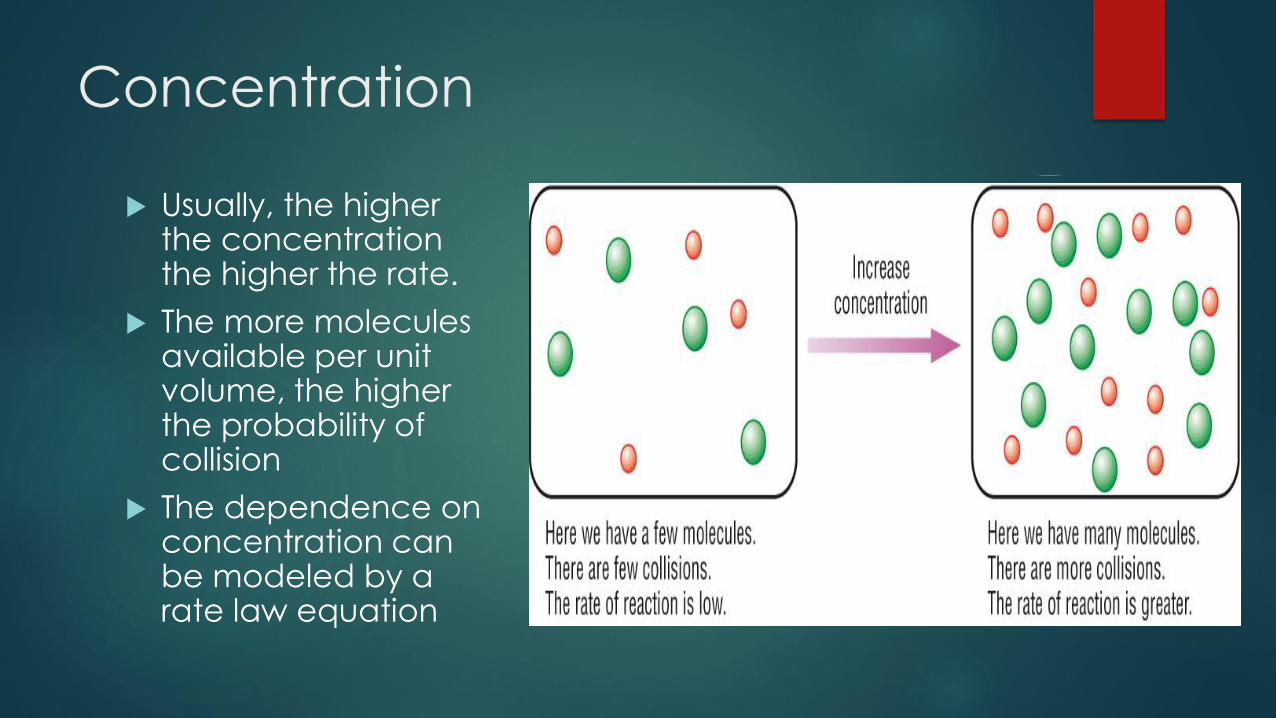
Concentration
Usually, the higher the concentration the higher the rate.
The more molecules available per unit volume, the higher the probability of collision
The dependence on concentration can be modeled by a rate law equation

Temperature
Usually, the higher the temperature,
the faster the reaction.
The higher the temperature, molecules moves faster and stronger
collision happen between molecule.
Collision has higher energy to pass the
activation energy barrier. Higher
probability for reaction to occur.

Catalyst
Catalysts: substances used to
facilitate reactions without
changing forms and being
consumed in the reaction
Catalyst provides a different path
for reaction to occur
It reduce the activation energy
barrier
Reaction can occur faster

Surface Area
For heterogeneous reaction, the higher the surface area,
the more site for reaction to occur the faster reaction

Think Break
What is the discipline that studies chemical reactions with respect to reaction rates, effect of various variables, re-arrangement of atoms, formation of intermediates etc
Which one of the following reactions reacts the most rapidly at room temperature.
a. 2 H2 + O2 -> 2 H2O
b. H+ + OH- -> H2O (neutralization)
c. C12H22O11 (sugar) -> 12 C + 11 H2O
d. H + OH -> H2O (radical reaction)
Which one of the following burns easily and why?a. a bar of steelb. steel woolc. steel sheetd. steel pipe
Which one takes the least period of time to cook a potato of 10 cm in diameter?a. boil in a pressure cookerb. boil on top of a 6000-m mountainc. bath in a steam

TOPIC 2 :
DETERMINATION OF KINETICS
PARAMETERS

Chapter 2 Kinetics of Homogenous
ReactionSuppose a reaction :
aA + bB rR + sS
A +b/a B r/a R +s/a S

Rate Equation
Specific
reaction rate

Example rate law:
Reaction is α order with respect to A and β order with
respect to B
Overall reaction order n = α + β
Rate law is determined from experimental observation
The Reaction Order and Rate Law
-rA = kA CAαCB
β

Zero order reaction
For zero order when n=0, then
Integrate this equation
dCA = kdt
CA – CA0 = -k t
where CAo is the concentration of A at time 0
-r = dCA/dt = kCA0 = k

Example 1: ascorbic acid loss on multivitamin
storageIn a classical investigation of loss of ascorbic acid in a multivitamin mix on storage at different temperatures, the concentrations of ascorbic acid at different times when stored at 50 °C were:
TIME (days) 10 20 30 40 50 60 70
Ascorbic acid (mg/ml) 21 19 16 14 12 10 8
Determine the rate law for ascorbic acid degradation and the kinetics constant
SOLUTION
Try zero order reaction : Plot concentration versus time
The graph clearly shows the linear relationship with time, independent of concentration.
so this is a zero order reaction : -r = k
the rate k can be determined by taking:
(change in concentration/(time taken) from the tabulated date or the slope of the line = (21-8)/(70-10) = 13/60 = 0.22 mg/ml/day.

Example 1

First Order Reaction
1.
First order n = 1
-r = -dC/dt = kC
dC/C = -k dt
ln C/C0 = -k (t-t0)
if C=C0 when t=t0 = 0
- ln C/C0 = kt

First Order Reaction
Plot -lnCA/CA0 versus time
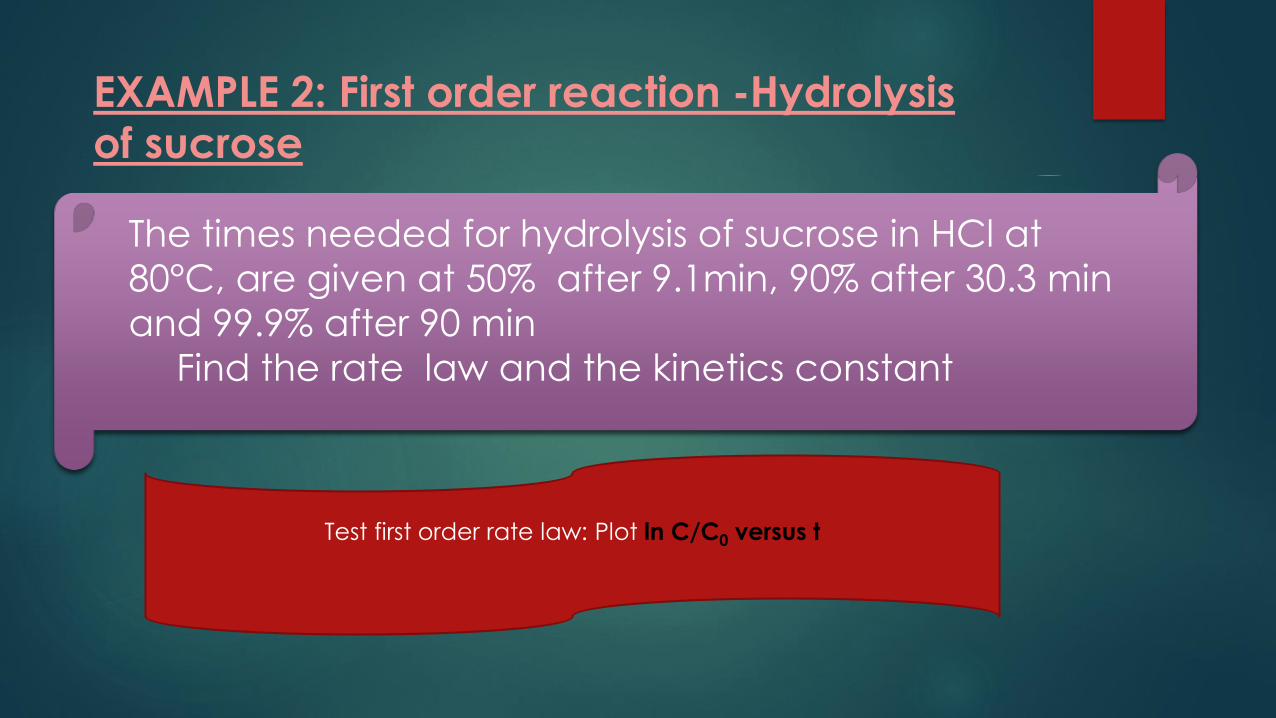
EXAMPLE 2: First order reaction -Hydrolysis
of sucrose
The times needed for hydrolysis of sucrose in HCl at
80°C, are given at 50% after 9.1min, 90% after 30.3 min
and 99.9% after 90 min
Find the rate law and the kinetics constant
Test first order rate law: Plot ln C/C0 versus t

Example 2:

Second Order Reaction
n= 2
- -r = -dC/dt = kC2
dC/C2 = -k dt
if C=C0 when t=t0 = 0
Plot 1/ CA – 1/CA0 versus t with slope k

Straight line plots for different orders
Plot experimental data using X axis and Y axis to produce a straight line for different orders:
Order
0 order
1 order
2 order
X axis
time
time
time
Y axis
C
-In C/C0
(1/C – 1/C0
Slope Y/X
-k
k
k
Where ‘C’ is typically concentration, but may be some other convenient, consistent
measure, and k is the reaction rate constant

Tutorial 1
The reaction of chlorophyll degradation can be represented by the
equation
A -- > B
occurred in a constant volume batch reactor at 50oC. The initial
concentration of chlorophyll (A) is 0.1 mg/l . The progress of the reaction was
monitored by measuring the concentration of chlorophyll (A) as follows:
t(min) 0 2 4 6 8
CA(mg/L) 0.33 0.23 0.146 0.096 0.063
Determine whether the reaction is zero, first or second order and
calculate the reaction rate constant, k, and its unit.
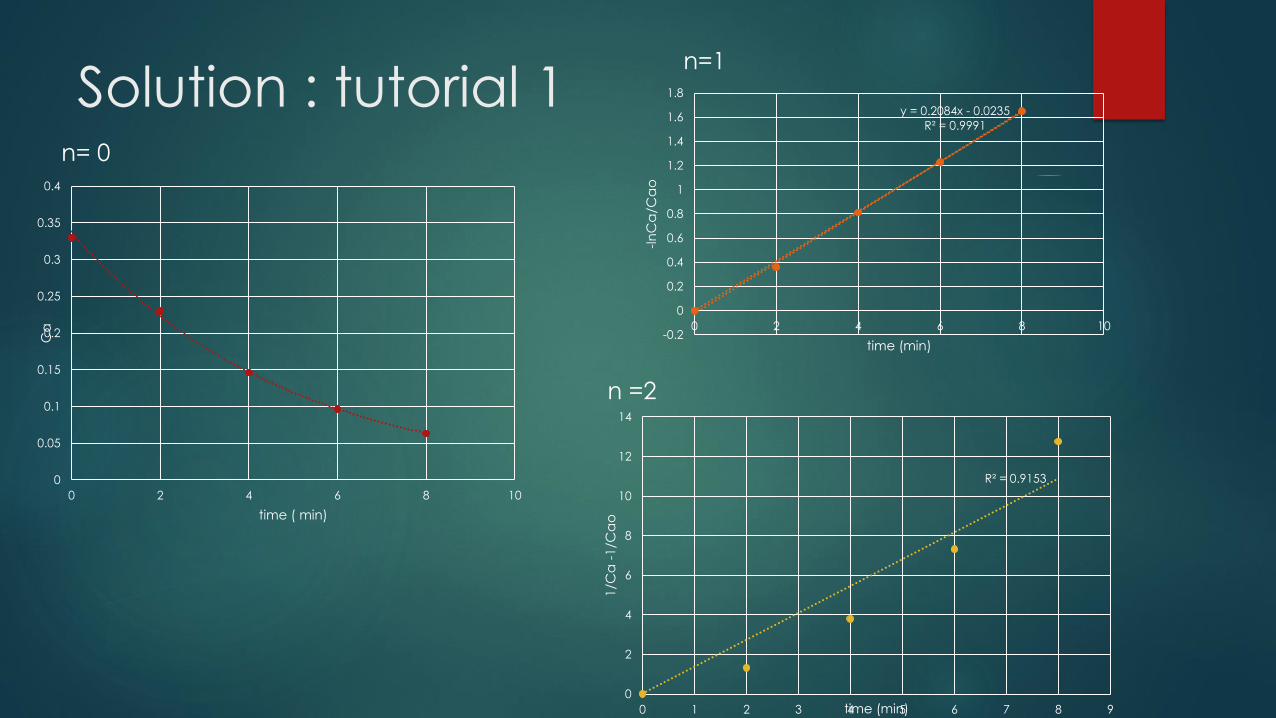
Solution : tutorial 1
0
0.05
0.1
0.15
0.2
0.25
0.3
0.35
0.4
0 2 4 6 8 10
Ca
time ( min)
n= 0
n=1
y = 0.2084x - 0.0235
R² = 0.9991
-0.2
0
0.2
0.4
0.6
0.8
1
1.2
1.4
1.6
1.8
0 2 4 6 8 10
-ln
Ca
/Ca
o
time (min)
R² = 0.9153
0
2
4
6
8
10
12
14
0 1 2 3 4 5 6 7 8 9
1/C
a -
1/C
ao
time (min)
n =2

Reactions in parallel
Example
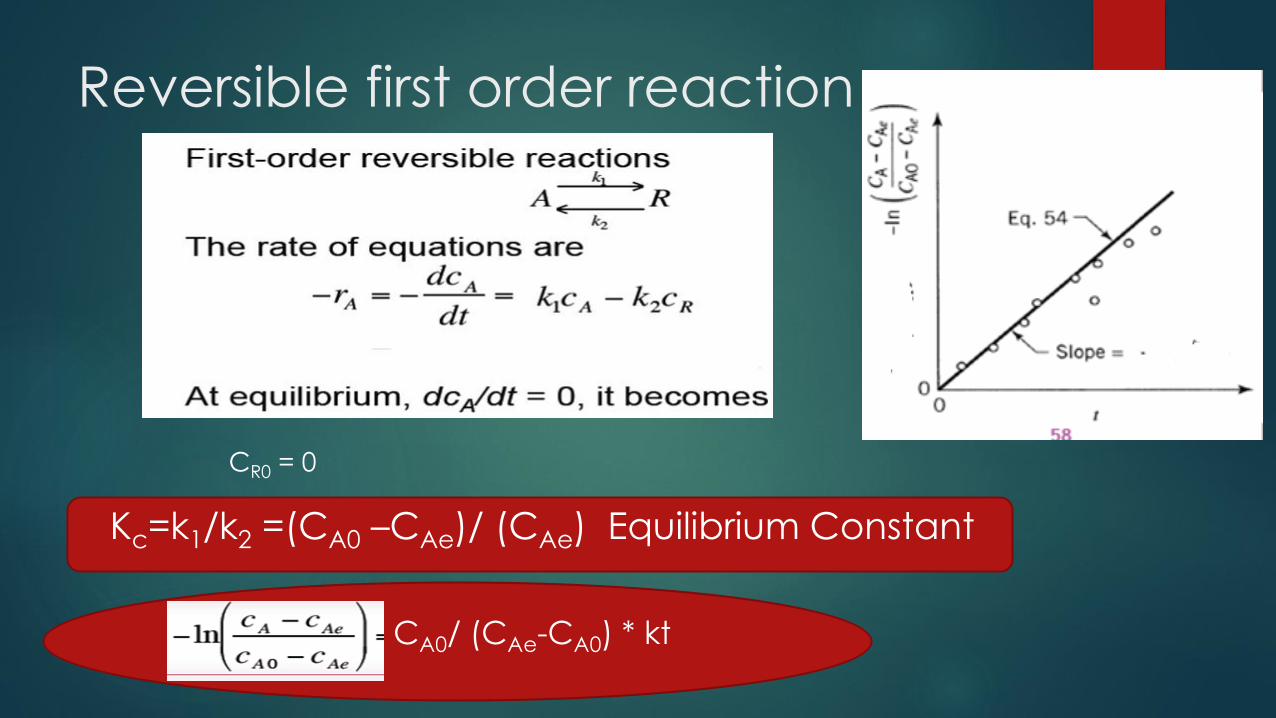
Reversible first order reaction
Kc=k1/k2 =(CA0 –CAe)/ (CAe) Equilibrium Constant
CR0 = 0
CA0/ (CAe-CA0) * kt

Reactions of shifting order
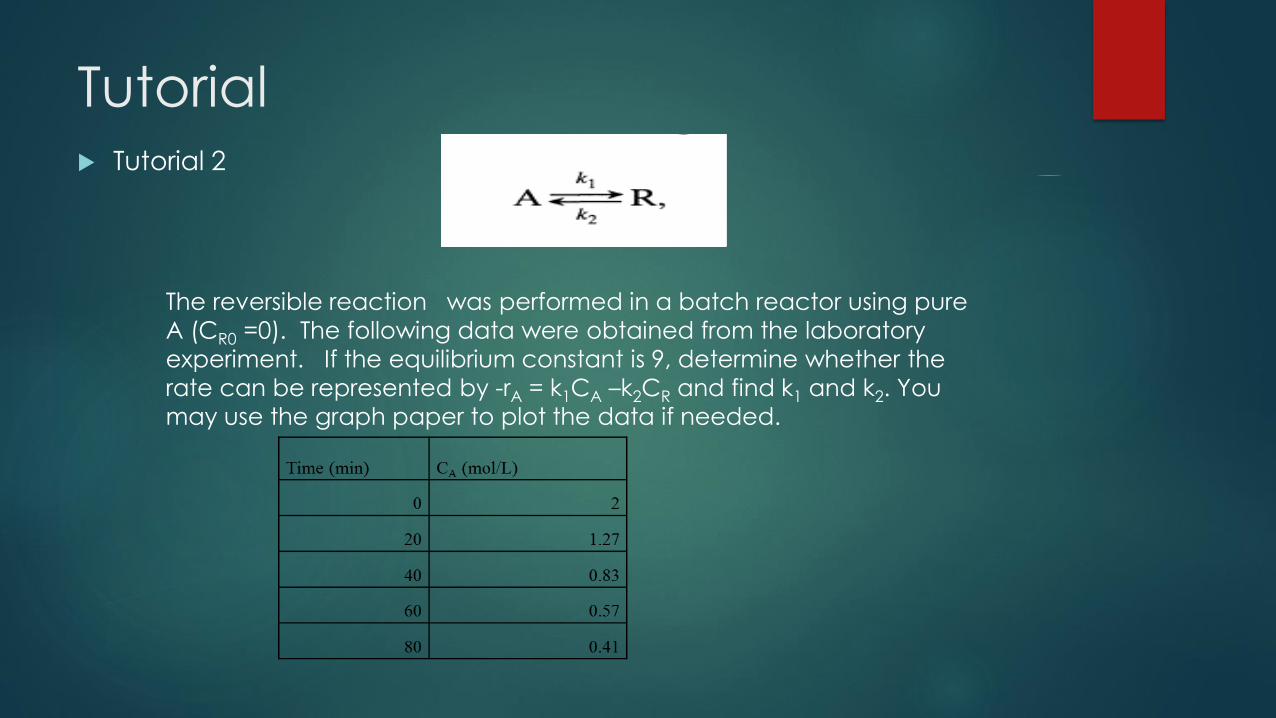
Tutorial Tutorial 2
The reversible reaction was performed in a batch reactor using pure
A (CR0 =0). The following data were obtained from the laboratory
experiment. If the equilibrium constant is 9, determine whether the
rate can be represented by -rA = k1CA –k2CR and find k1 and k2. You
may use the graph paper to plot the data if needed.
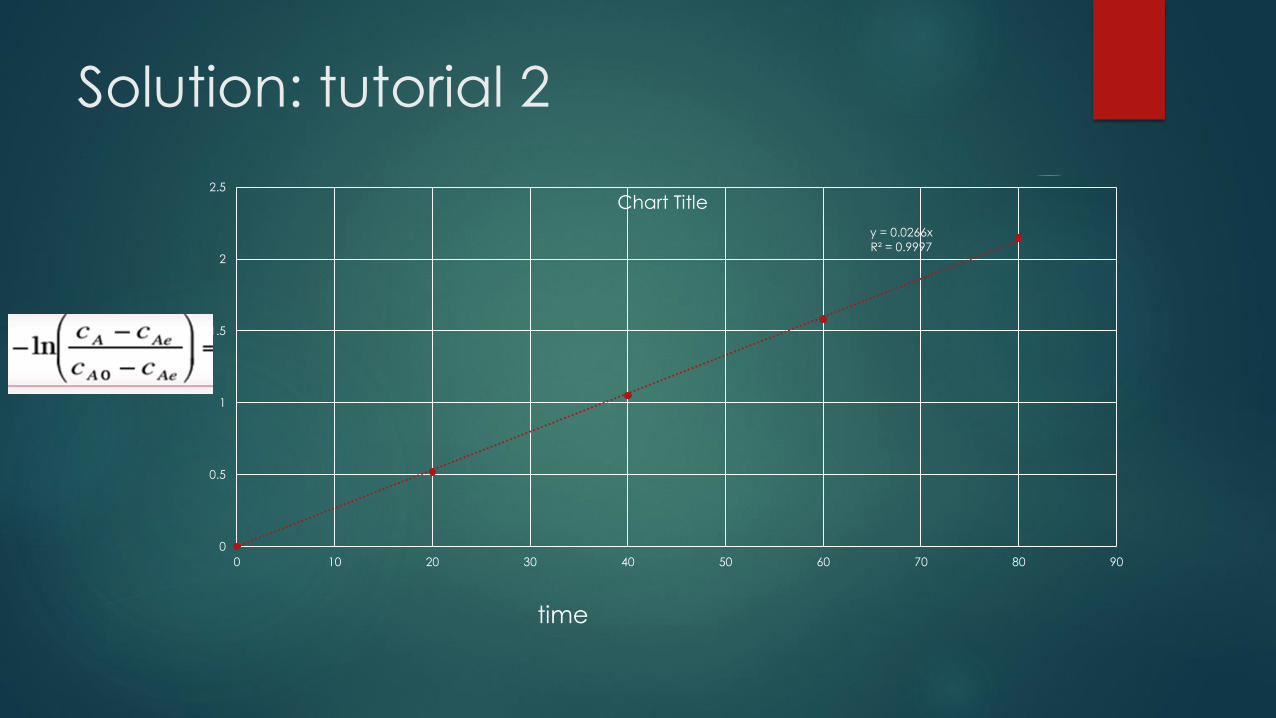
Solution: tutorial 2
y = 0.0266x
R² = 0.9997
0
0.5
1
1.5
2
2.5
0 10 20 30 40 50 60 70 80 90
Chart Title
time

Tutorial 3
Find k1 and k2

Solution

Topic 3:
Effect of Concentration on Rate

Time for reaction
Zero order reaction
t = (CA – CA0)/-k
First order reaction
t = (-ln CA/CA0 )/k
Second order reaction
t = (1/ CA – 1/CA0)/k
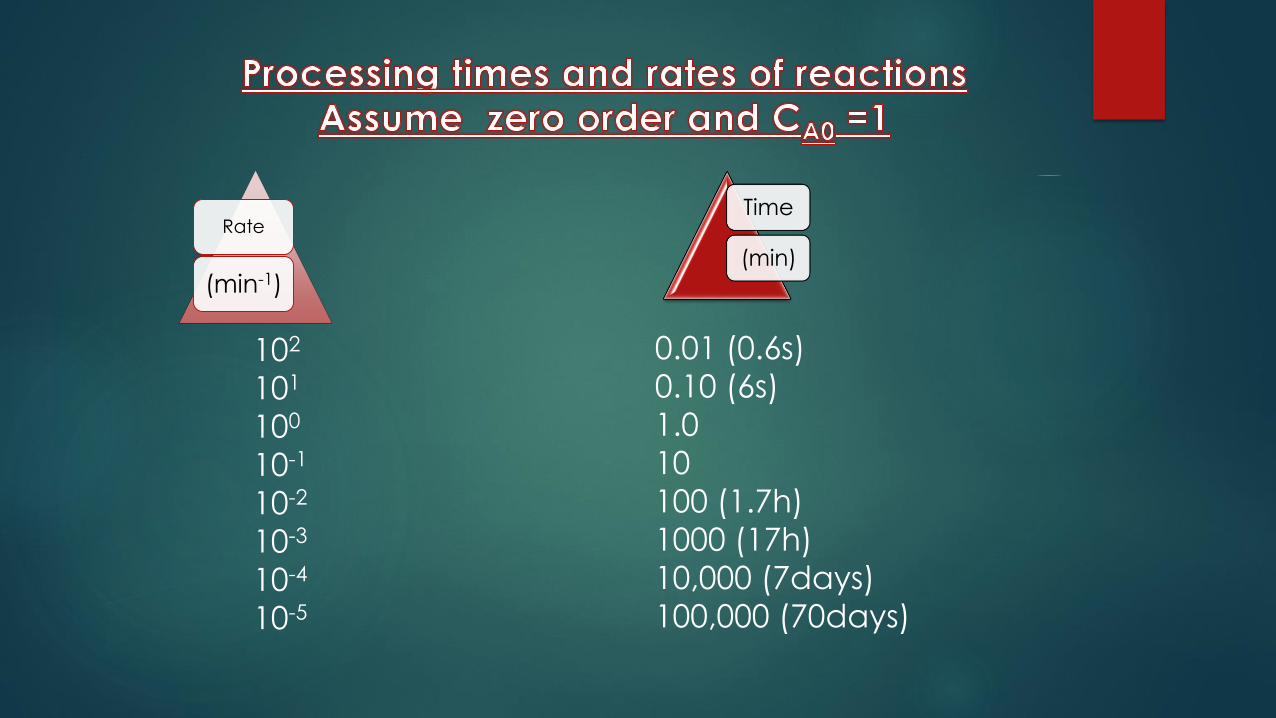
Time
(min)
Rate
(min-1)
0.01 (0.6s)
0.10 (6s)
1.0
10
100 (1.7h)
1000 (17h)
10,000 (7days)
100,000 (70days)
102
101
100
10-1
10-2
10-3
10-4
10-5
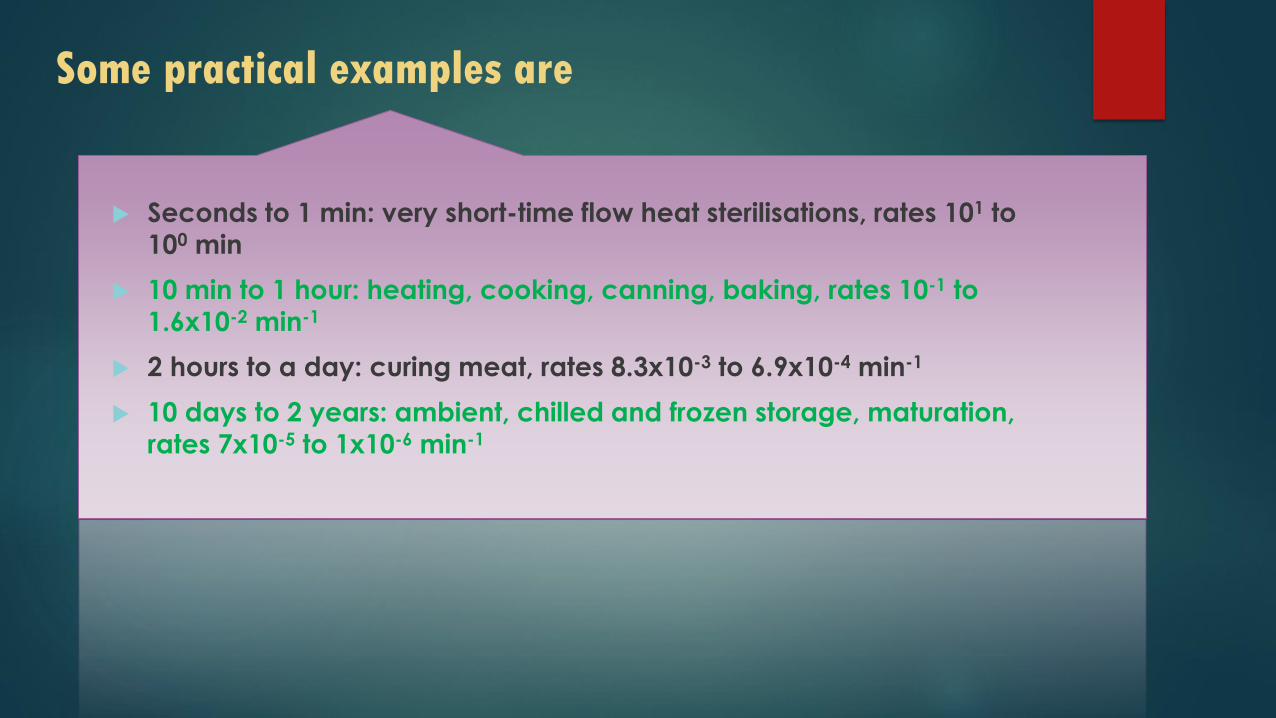
Some practical examples are
Seconds to 1 min: very short-time flow heat sterilisations, rates 101 to
100 min
10 min to 1 hour: heating, cooking, canning, baking, rates 10-1 to
1.6x10⁻² min-1
2 hours to a day: curing meat, rates 8.3x10⁻³ to 6.9x10⁻⁴ min-1
10 days to 2 years: ambient, chilled and frozen storage, maturation,
rates 7x10⁻⁵ to 1x10⁻⁶ min-1

Half life of Reaction for first order
reaction
Time for the concentration to reduce by half (t0.5)
First order reaction
CA/CAO = 0.5
t0.5= (-ln 0.5 )/k
If t = 9.1 min
In 9.1 min the concentration reduce by half and in another 9.1 min it
will half again.

Example : sucrose hydrolysis: calculations of
concentration with timeTo see how concentration change is calculated, consider again the sucrose hydrolysis, it is known that its half-life at a particular temperature is 20 min. this means that starting at a concentration of 0.5kg sucrose/litre
After 20 min it will have fallen to (0.50/2) = 0.25 kg/l, and
After a further 40 min to (0.25/22) = (0.25/4) = 0.063 kg/l
this can be extended to take into account any desired time by returning to the fundamental first-order equation.
ln {C0/C} = k t
And finding k from the fundamental first order constant/half-life relationship of
k = 0.693/ t0.5
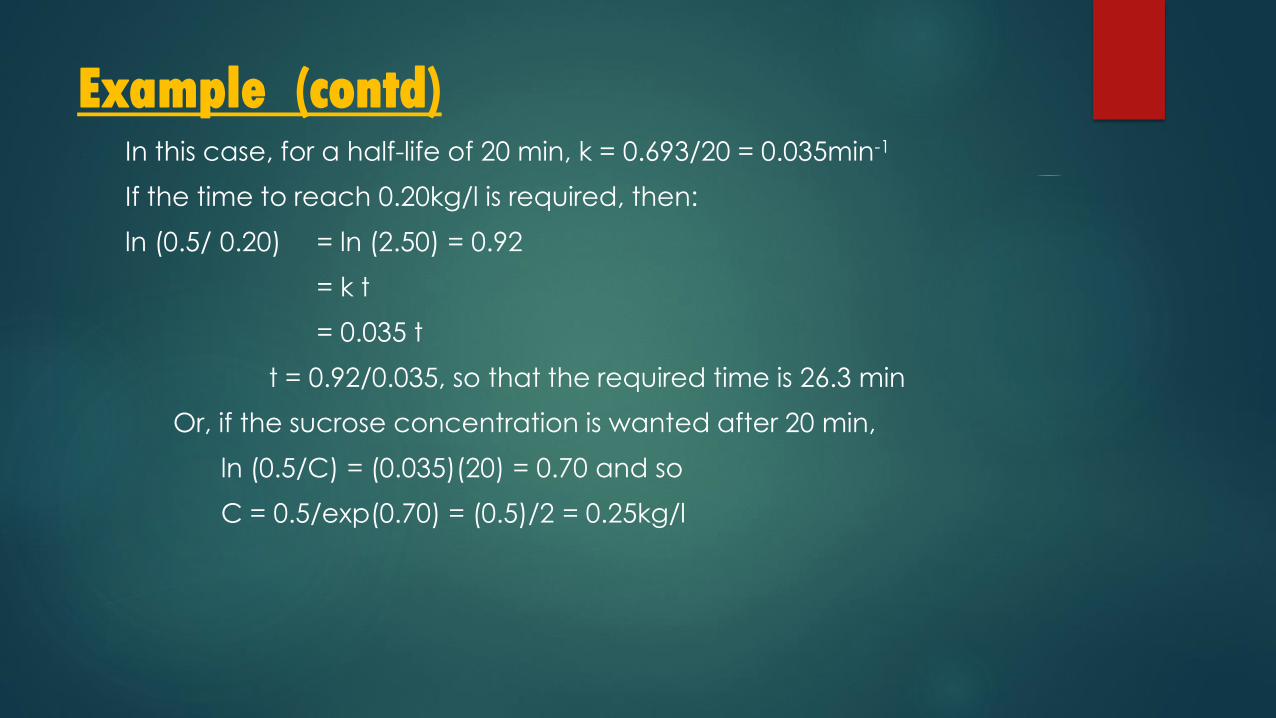
Example (contd)In this case, for a half-life of 20 min, k = 0.693/20 = 0.035min-1
If the time to reach 0.20kg/l is required, then:
ln (0.5/ 0.20) = ln (2.50) = 0.92
= k t
= 0.035 t
t = 0.92/0.035, so that the required time is 26.3 min
Or, if the sucrose concentration is wanted after 20 min,
ln (0.5/C) = (0.035)(20) = 0.70 and so
C = 0.5/exp(0.70) = (0.5)/2 = 0.25kg/l

Effect of reaction order on rate
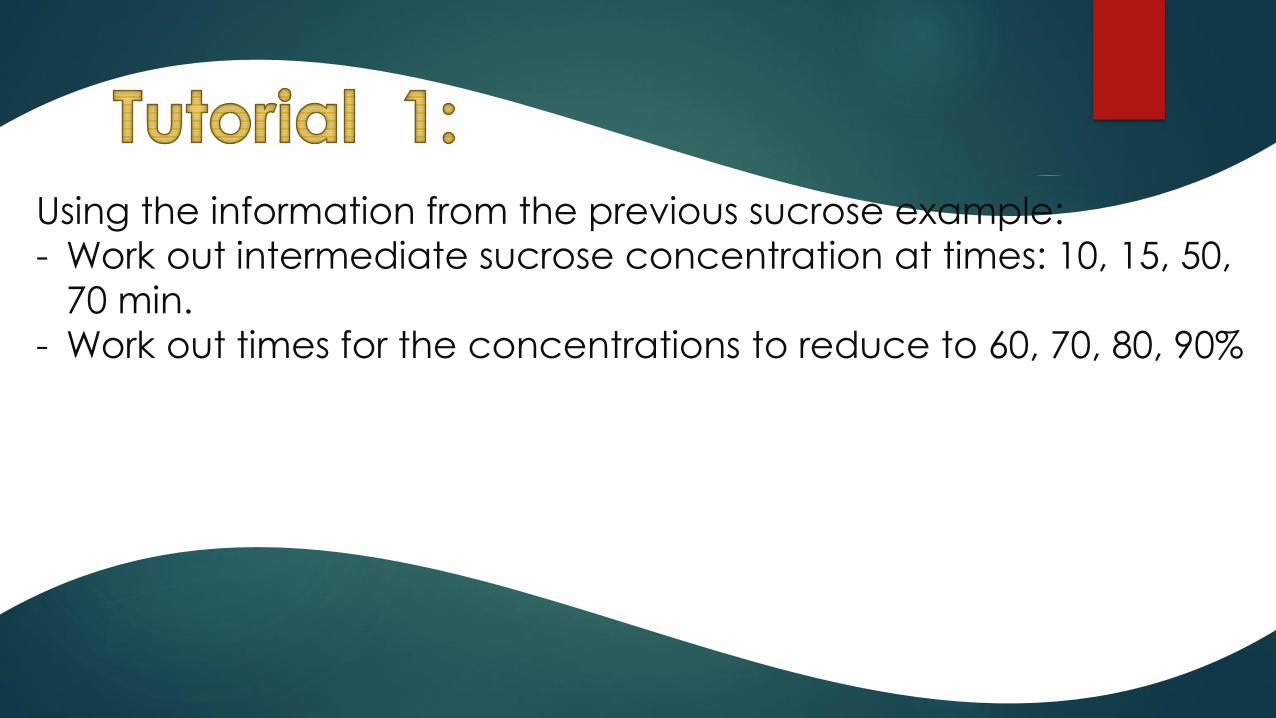
Using the information from the previous sucrose example:
- Work out intermediate sucrose concentration at times: 10, 15, 50,
70 min.
- Work out times for the concentrations to reduce to 60, 70, 80, 90%
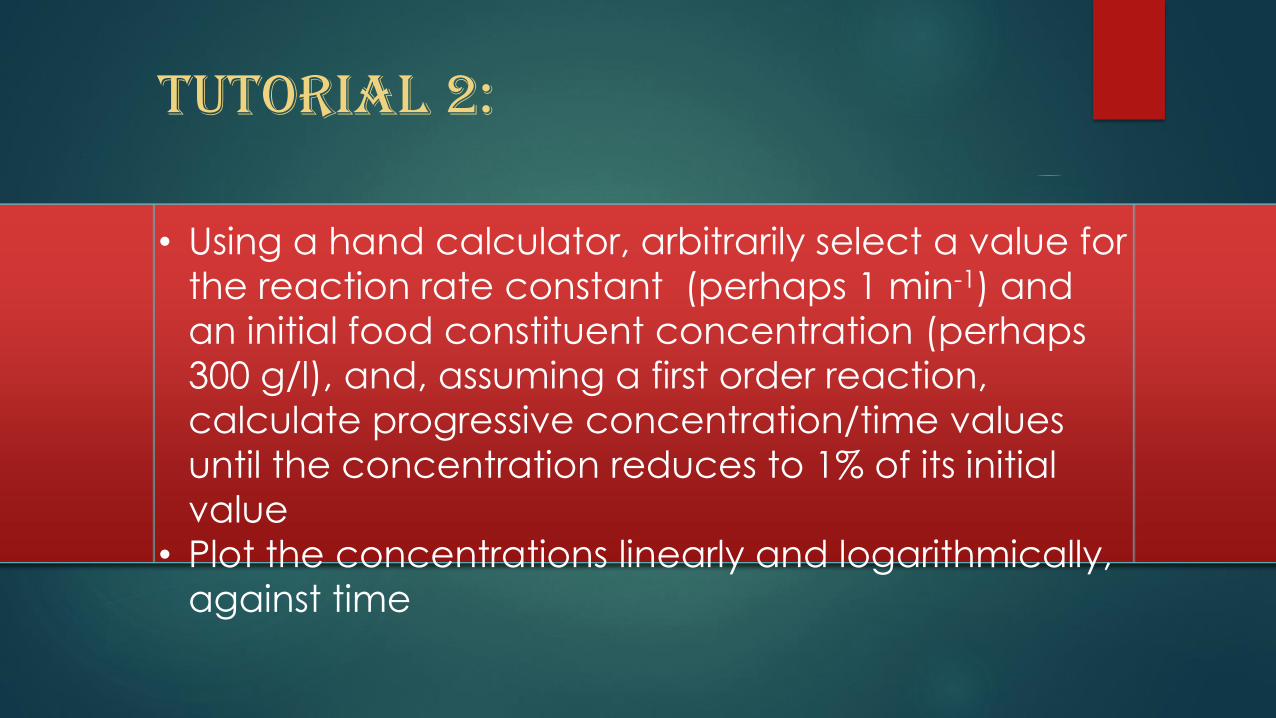
TUTORIAL 2:
• Using a hand calculator, arbitrarily select a value for
the reaction rate constant (perhaps 1 min-1) and
an initial food constituent concentration (perhaps
300 g/l), and, assuming a first order reaction,
calculate progressive concentration/time values
until the concentration reduces to 1% of its initial
value
• Plot the concentrations linearly and logarithmically,
against time

Topic 4Effect of Temperature

Temperature-dependent term of a rate
equation

Activation Energy
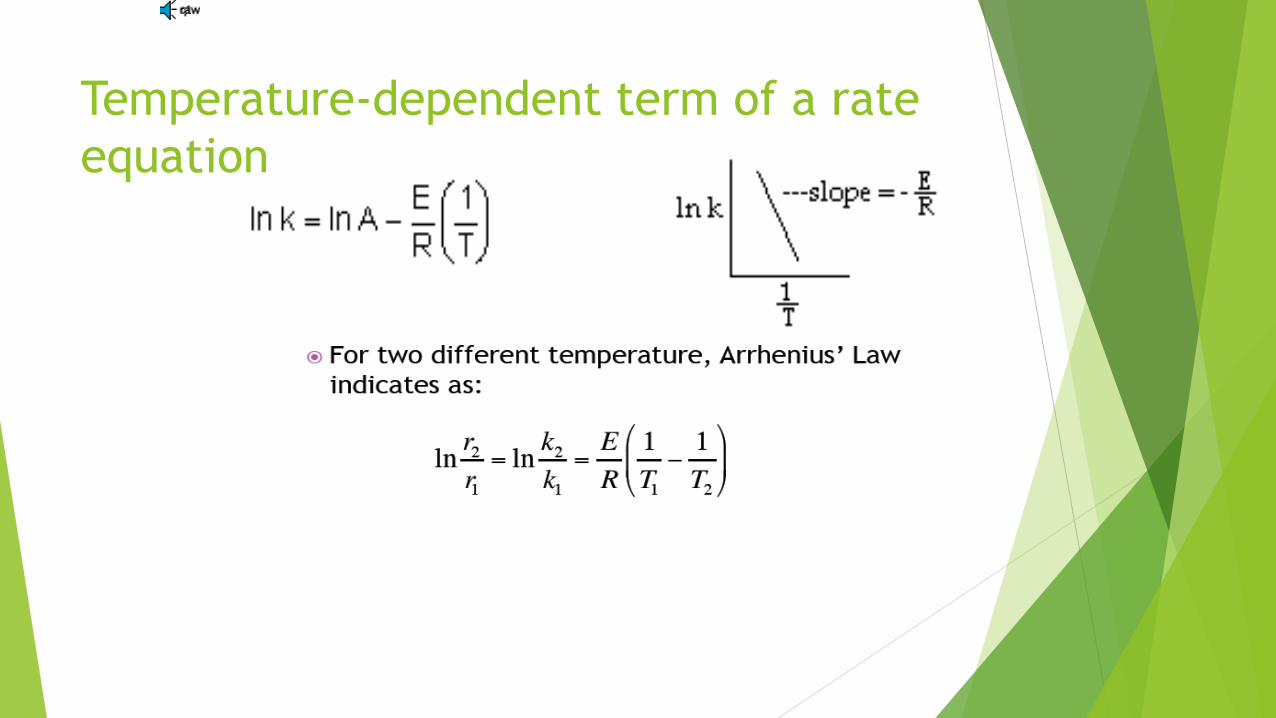
Temperature-dependent term of a rate
equation

Temperature Dependency of Reaction
Rate
How does temperature affect reaction with
high E compared to low E ?
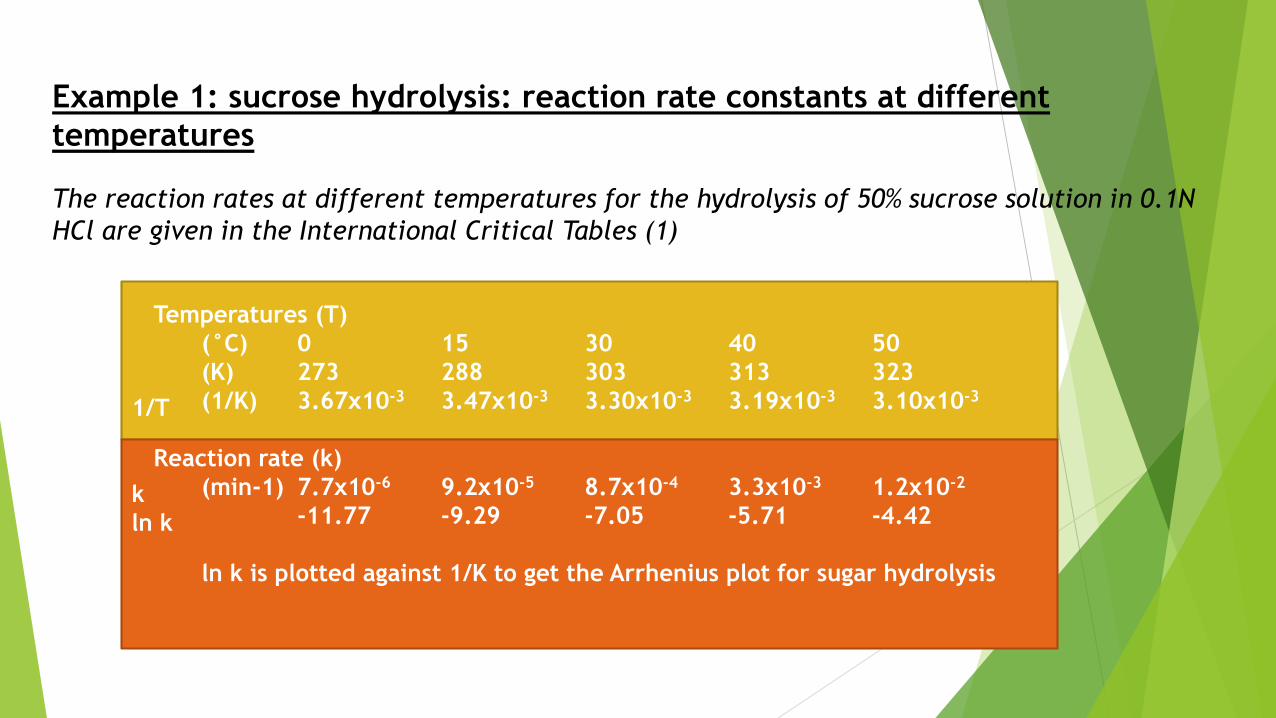
Example 1: sucrose hydrolysis: reaction rate constants at different
temperatures
The reaction rates at different temperatures for the hydrolysis of 50% sucrose solution in 0.1N
HCl are given in the International Critical Tables (1)
Temperatures (T)
(°C) 0 15 30 40 50
(K) 273 288 303 313 323
(1/K) 3.67x10⁻³ 3.47x10⁻³ 3.30x10⁻³ 3.19x10⁻³ 3.10x10⁻³
Reaction rate (k)
(min-1) 7.7x10⁻⁶ 9.2x10⁻⁵ 8.7x10⁻⁴ 3.3x10⁻³ 1.2x10⁻²
-11.77 -9.29 -7.05 -5.71 -4.42
ln k is plotted against 1/K to get the Arrhenius plot for sugar hydrolysis
1/T
k
ln k

Sucrose Hydrolysis- Arrhenius Plot

Example 1 (contd)
this is a straight-line relationship, so the slope gives the value of:
E/R = (11.77 – 4.42)/(3.67x10-3 – 3.1x10⁻³) = 7.35/0.57 x 10-3
= 12.9x10³K
R, the gas constant, is 8.314 joules/mol K
so E = 107x103 J/mol
= 107 kJ/mol
To estimate the reaction rate at 110°C, that is 383 K,
k383 / k323 = exp {-E/RT383} / exp {-E/RT323}
so k383/ 1.2x10-2 = exp {ER (1/323 – 1/383)}
= exp (12.99x10³ (3.096x10⁻³ – 2.611x10-3
= exp (6.30)
= 545
and so k383 = 545 x 1.2 x 10-2
= 6.54 min-1
To estimate the time for 50% hydrolysis at 110°C, that is 383 K
-t0.5 = (1/6.54)(1n ½)
= 0.153 x -0.693
= 0.11 min

In a continuous liquid sterilizing operation , the product
need to be heated at a holding temperature of 118 deg C
for 7 min . One morning you discover from the product
output that fluid pumps has unaccountably increased the
flowrate by 30%. The only available way to rectify it in the
short term to get usable product is to increase the
reaction rate of spore destruction by 30%. This can be
done by lifting the holding temperature. To what
temperature should you lift it?.
E for bacteria spore destruction= 298 KJ/mol
R = 8.314 J/mol/K
Example 2

Other Temperature Coefficients used in
Food Industry
D value : Decimal Reduction Time
The time needed for the amount of reactant to be reduced to 1/10 of its
original value ( assuming first order reaction)
ln (CA/CAO) = -kt
ln(0.1) = -kD
D = 2.303/k

Other Temperature Coefficients used in
Food Industry
z value
Temperature increase to multiply the rate of the reactions ten fold
z is defined by 10 = kT+z/kT
z = 2.303 RT2/E

Other Temperature Coefficients used in
Food Industry
Sensitivity
(kT+1)/(kT) = 1 + sensitivity
The Arrhenius equation is
k = Ae-ERT
Taking the derivative dk/kd(T) = (Ae-ERT) E/(RT2) = k [ E/(RT2)]
Therefore, dk/kd(T) = d(lnk)/dT = E/RT2
And since d(lnk)/dT = ln [(kT+1)/(kT)]
Therefore E/(RT2) = ln [(kT+1)/(kT)]
exp (E/RT2) = (kT+1)/(kT) = 1 + sensitivity
or exp (E/RT2) -1 = sensitivity

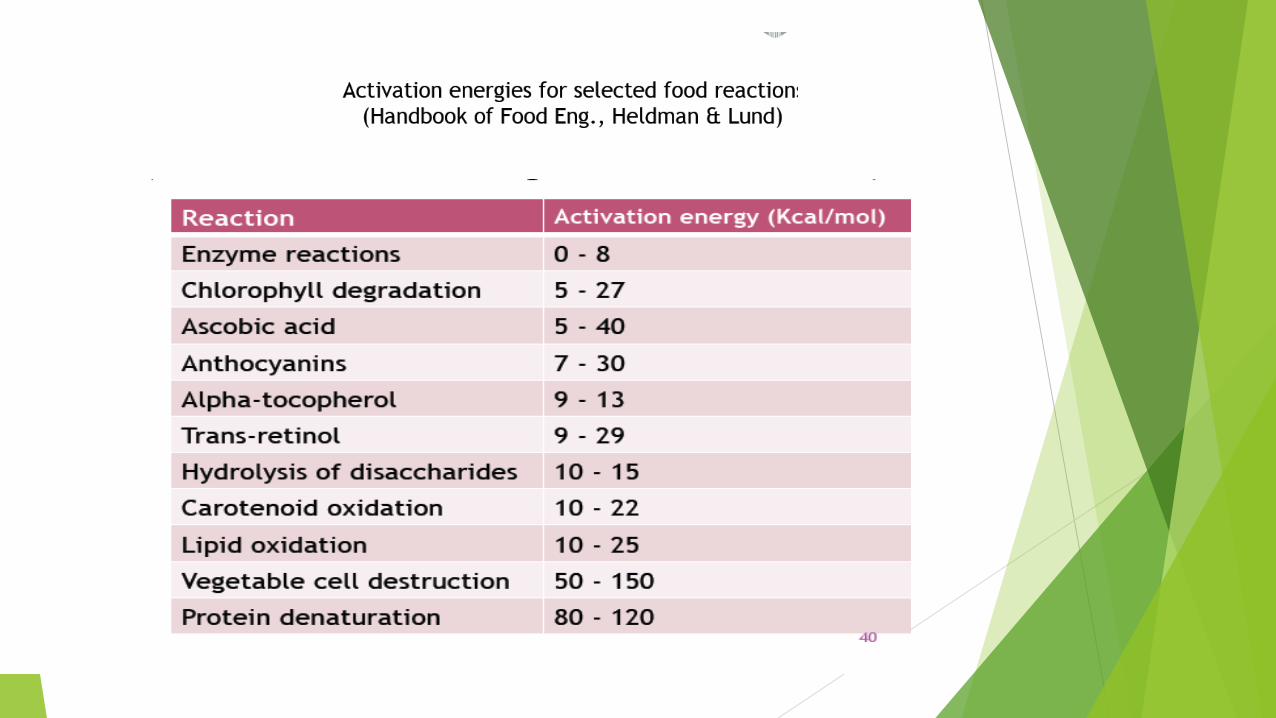
Activation energies for typical food processing reactions
Chemical reactions
General chemical reactions
Hydrolysis reactions
Lipid oxidations
Browning (non-enzymic) reactions
Vitamin destruction
Protein denaturation/ coagulation
Microbiological changes
Microorganism growth
Vegetative microorganism death
Spore death
E
kJ/mol
40-100
60-120
40-100
100-200
70-150
200-500
100-150
300-500
250-350
(40°c)
13°/o/°C
16°/o/°C
13°/o/°C
28°/o/°C
18°/o/°C
84°/o/°C
18°/o/°C
84°/o/°C
53°/o/°C
(120°C)
8°/o/°C
10°/o/°C
8°/o/°C
17°/o/°C
12°/o/°C
47°/o/°C
na
47°/o/°C
31°/o/°C
Sensitivity*
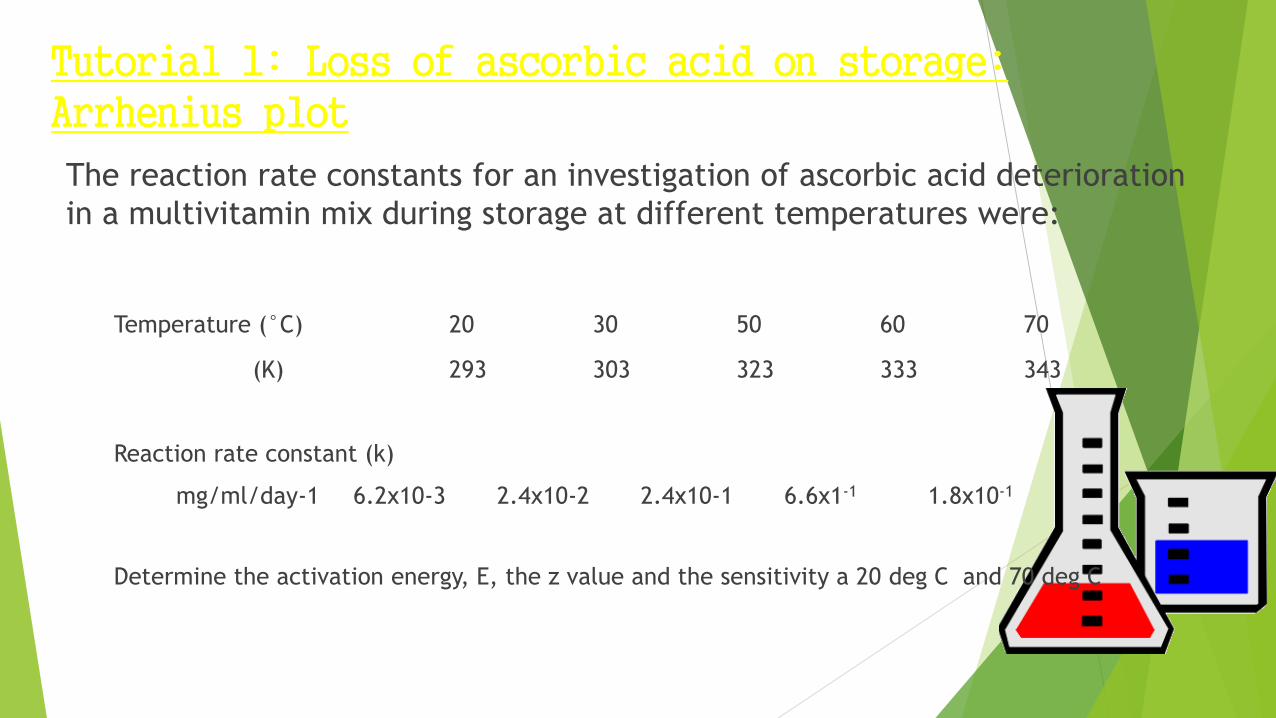
Tutorial 1: Loss of ascorbic acid on storage: Arrhenius plot
The reaction rate constants for an investigation of ascorbic acid deterioration
in a multivitamin mix during storage at different temperatures were:
Temperature (°C) 20 30 50 60 70
(K) 293 303 323 333 343
Reaction rate constant (k)
mg/ml/day-1 6.2x10⁻³ 2.4x10⁻² 2.4x10⁻¹ 6.6x1-1 1.8x10⁻¹
Determine the activation energy, E, the z value and the sensitivity a 20 deg C and 70 deg C
Tutorial 2
For three activation energies: 100, 200 and 400 kJ/mol
Work out the sensitivities at temperatures of 100°C and 110°C
Determine the ratio of reaction rate constants, k110/k100
Reflect on the magnitudes of these numbers and of their significance in a
food process in

Tutorial 3
A batch process is being used for cooking the food product, but the process also
cause the breakdown of vitamin C. At present the process is carried out at 121
deg C for 20 min in order to achieve satisfactory cooking. What percentage of
vitamin C is destroyed in the current process ? (assume first order reaction for
both cooking and vitamin)
k121 = 3.2 *10-3 s-1 (for cooking)
k121 = 1.57 *10-4 s-1 (for vitamin C destruction)
A modification of the process is considered to improve the process with less
destruction of vitamin C by reducing the cooking time and increasing the
temperature t 130 deg C. What is the new cooking time and what do the changes
have on the percentage of vitamin C reduction
z cooking = 21 deg C
z vitamin C = 51 deg C

Topic 5Combining Effect of Time and Temperature
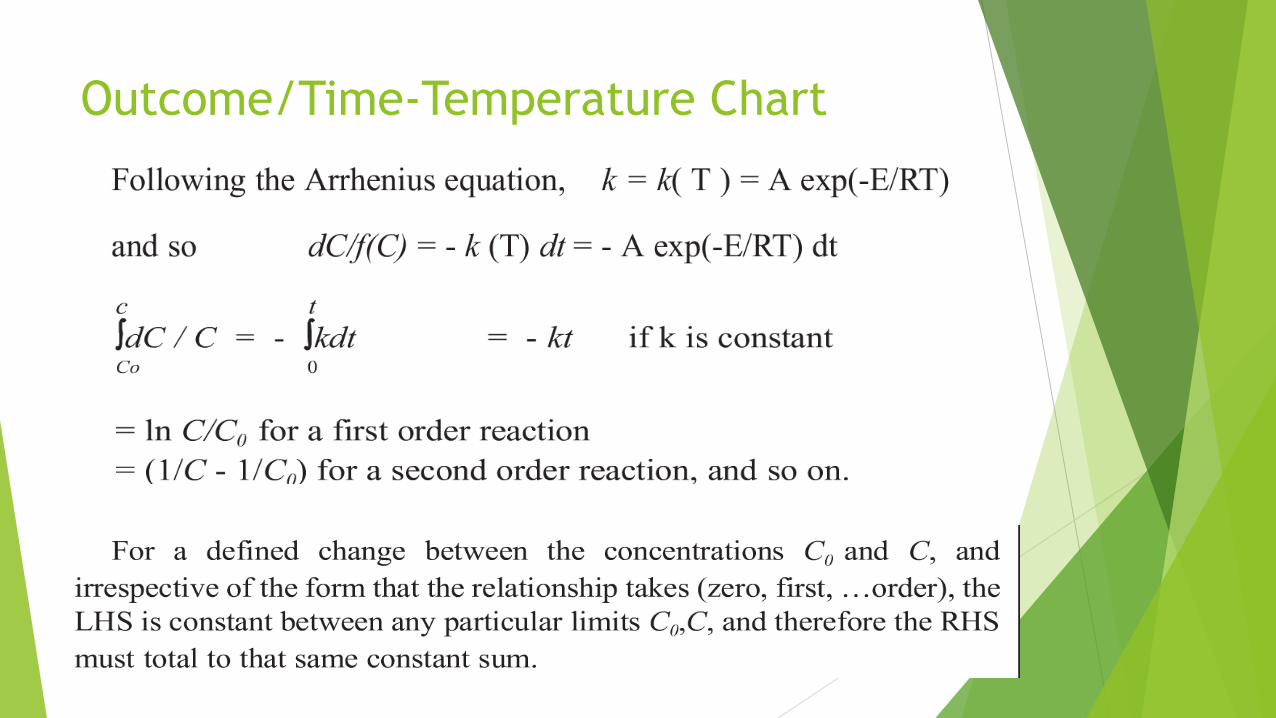
Outcome/Time-Temperature Chart
Outcome/Time-Temperature Chart
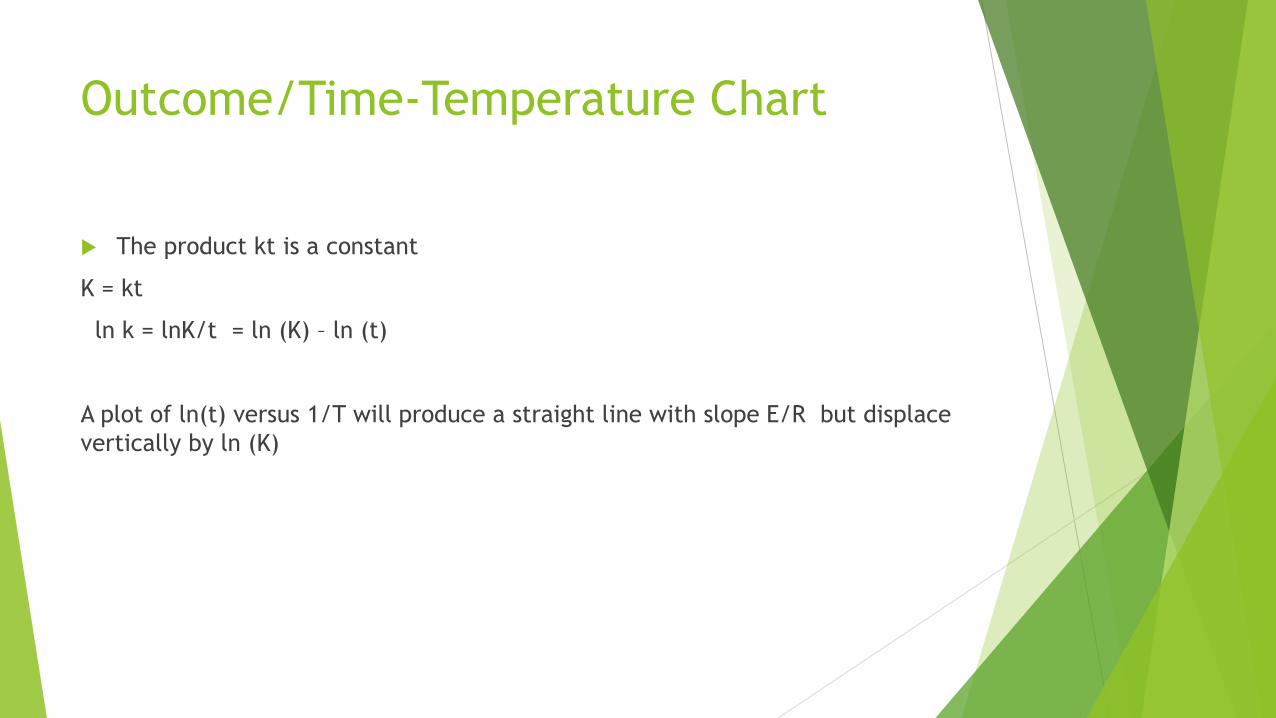
The product kt is a constant
K = kt
ln k = lnK/t = ln (K) – ln (t)
A plot of ln(t) versus 1/T will produce a straight line with slope E/R but displace
vertically by ln (K)

Combining effect of time and
temperature

OTT Chart

Tutorial 1
Construct an OTT chart if the processing specifications is 15 s at 72 deg C and
assuming a z value of 8 deg C

Application OTT Chart: Pasteurization
Microbial death confirm to first order kinetics
Bacterial reduction ratios are much higher than normal reaction requirement
Typically 10^9 to 10^12 reduction ratios
Conveniently abbreviated by 9D or 12D reductions
OTT chart at different reductions enable the operator to use a combination of
time and temperature to get adequate pasteurization

Pasteurization
63oC for 30 minutes
72oC for 15 seconds
140oC for 1 second
Pasteurization reduces spoilage organisms and pathogens

OTT chart: pasteurization of milk

Exercise:
If the critical requirement is mesophilc sopores must be reduced to 9D, flavour limit and the protease
destruction is 90% determine the allowable area for the process.

Example OTT chart : Food pasteurization
1
10
100
1000
10000
100 110 120 130 140 150 160 170Tim
e (
s)
Temp (deg F)
Time 5D hamburger

Example OTT Chart: Juice pasteurization
Exercise:
Develop the OTT chart for this data and determine the E value

OTT Chart: pasteurization of liquid
whole eggs

Application :Canning/Sterilization
Killing of c. botulinum spores typically up to 12 D
Reference canning temperature 121. 1 deg C ( boiling temperature at 2
atmospheric pressure)
D121 c. botulinum = 0.2 min
Fo value is usually encountered in canning = time taken to reduce the spore
concentration to 12 D at 121.1 deg C with z =10 deg C
Exercise:
Find a Fo value of a sterilization process taking 1 min at 128 deg C

Topic 6Application of Kinetics Model: Shelf Life
Prediction

How LONG Does Food Last?
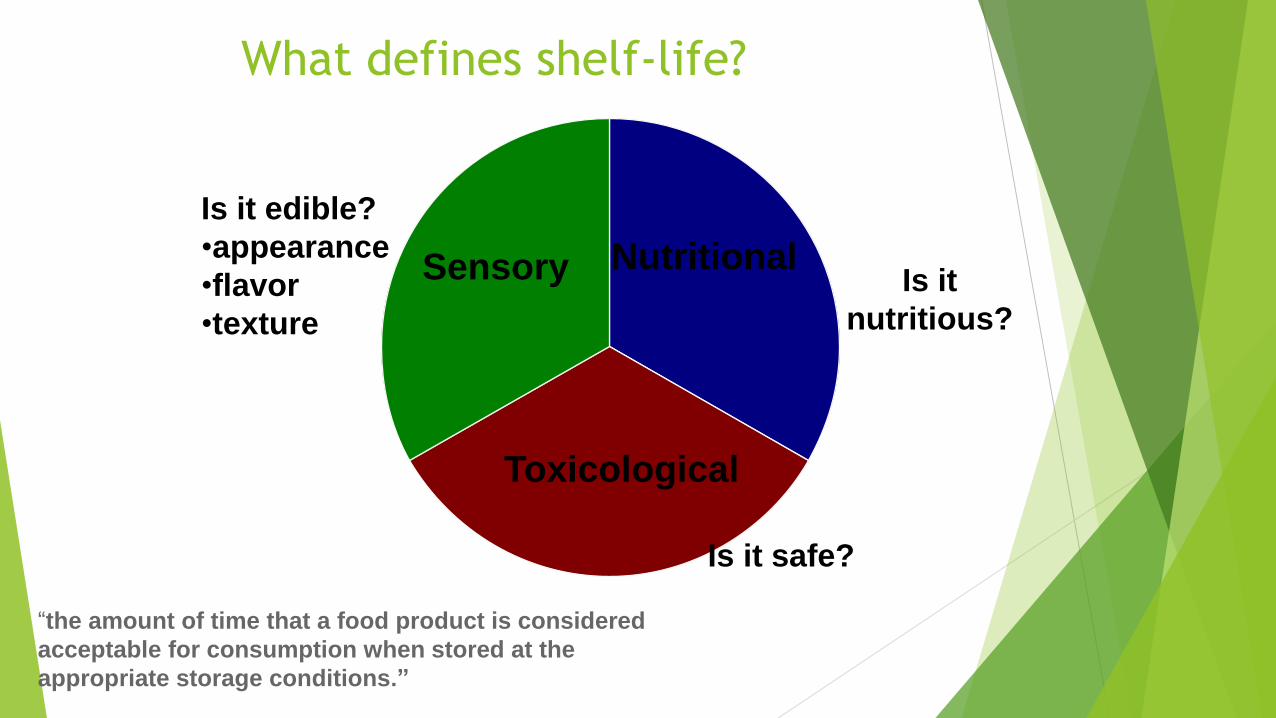
Is it safe?
Is it
nutritious?
Is it edible?
•appearance
•flavor
•texture
Sensory Nutritional
Toxicological
What defines shelf-life?
“the amount of time that a food product is considered
acceptable for consumption when stored at the
appropriate storage conditions.”

What affects shelf-life of food?
Composition
Water
Fat
Protein
Carbohydrate
Other components
Storage Conditions
Food
PerishableShelf Stable
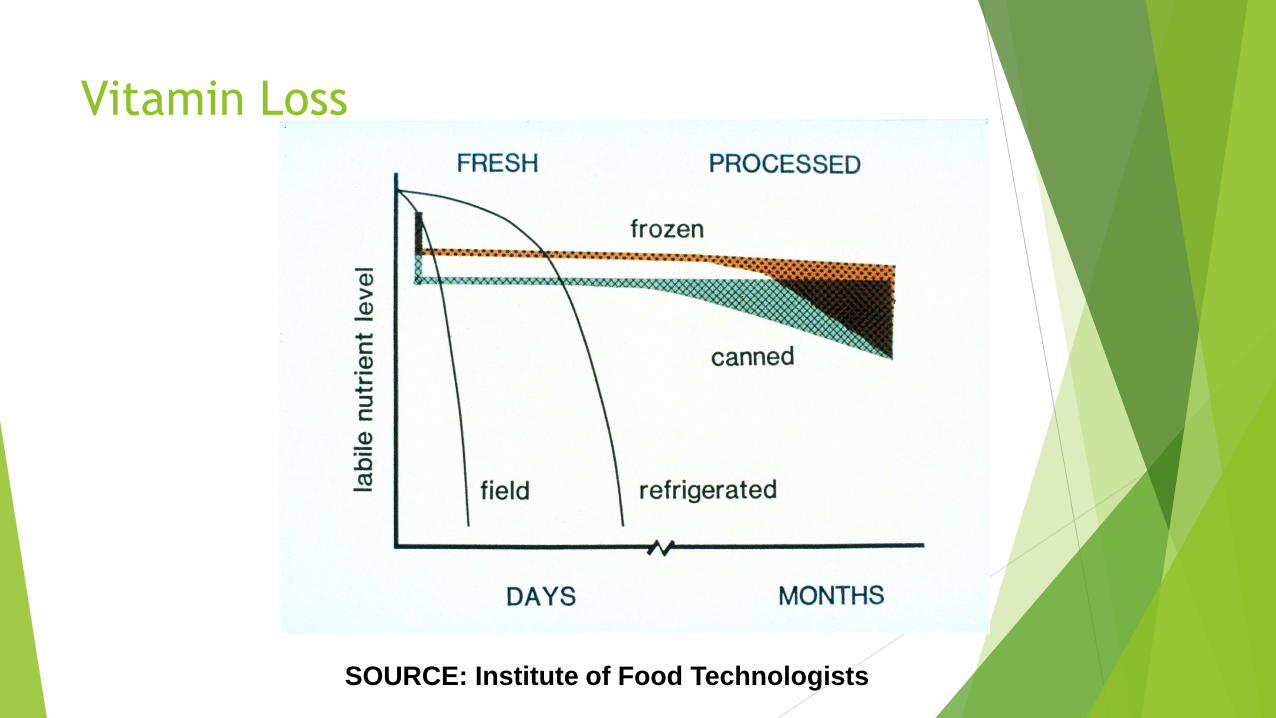
Vitamin Loss
SOURCE: Institute of Food Technologists

Common modes of food deterioration
Microbial decay – pH, aw
Senesence – Normal enzymatic reactions in post-harvest physiology of food stuffs
Non-enzymatic browning – aw, pH, temperature, etc.
Lipid oxidation –rancidity
Hydrolytic Rancidity – Hydrolysis of triglycerides into fatty acids and glycerol, resulting in a distinctive “soapy” flavor when the product has spoiled
Oxidative Rancidity – Lipid oxidation of unsaturated fatty acids into hydroperoxides, which later form aldehydes, causing a distinctive “cardboard” flavor/aroma when the product has spoiled
Off flavor – Loss of solubility and biological value of proteins – Bleaching of fat-soluble pigments (carotenoids)
Loss of efficacy of fat soluble vitamins (A, D, E, and K)

Common modes of food deterioration
Vitamin loss – Hydrolysis – Light – Heat – Acid – Oxidation • Vitamin C is
most labile
Color changes – Loss of Mg from chlorophyll
Enzymatic activity – PPO – Pectic enzymes – Lipase
Sensory changes
Physical deterioration – Decreased solubility of certain constituents –
Mushiness – Freezing-thawing – Melting-recrystallization of fat – Bread
staling
Shelf Life Studies
Direct Method
Indirect Method (Predictive Model)
Direct method) for a ‘best-before’ date
This requires the food to be stored for a period of time that is longer than
the expected shelf life, in order to observe, test and record changes in the
products characteristics.
From this information a shelf life can be estimated.
The shelf life will need to take into account possible variability between
product batches and in storage conditions, including whether the product is
intended to be consumed over a period of time and so will be subjected to
a number of temperature cycles.
For some products it will be important to take into account conditions that
could impact unfavourably during normal storage and transport.
Indirect method :General methodology
Select the major mode of deterioration to
study
Measure some quality factor related to this
mode
Apply mathematical models to make
predictions
Kinetics and food deterioration
Why is this technique needed?
Evaluation of new ingredients –
Setting of “use by” and best before dates –
To insure nutritional labelling

Selecting what to measure
In selecting what to measure, consider
Key labile ingredients
Characteristics of the packaging material
How the product will be shipped and stored
Relative humidity
Temperature
Susceptibility to light
If no chemical test exists, would a sensory test work?
Kinetic approach to accelerating shelf
life deterioration
Accelerated shelf life testing is needed to reduce
the time needed for study especially during the
early stage of product development to evaluate
the effect of various parameters
Concentration acceleration
Moisture or relative humidity acceleration
Temperature acceleration – This is usually done
The food product is conditioned and stored at elevated
temperature and the quality changes of the product are
evaluated at a specific sampling rate. The accelerated shelf
life study could significantly shorten the duration of shelf life
study to ½ or ¼ of the standard shelf life study.

Accelerated Shelf Life Test
Using the Arrhenius equation
We can find k at several higher temperatures (accelerated shelf life study)
than the one in which we are interested.
Then, plot ln k vs. 1/T to get a straight line which you can extrapolate to
lower temperatures.
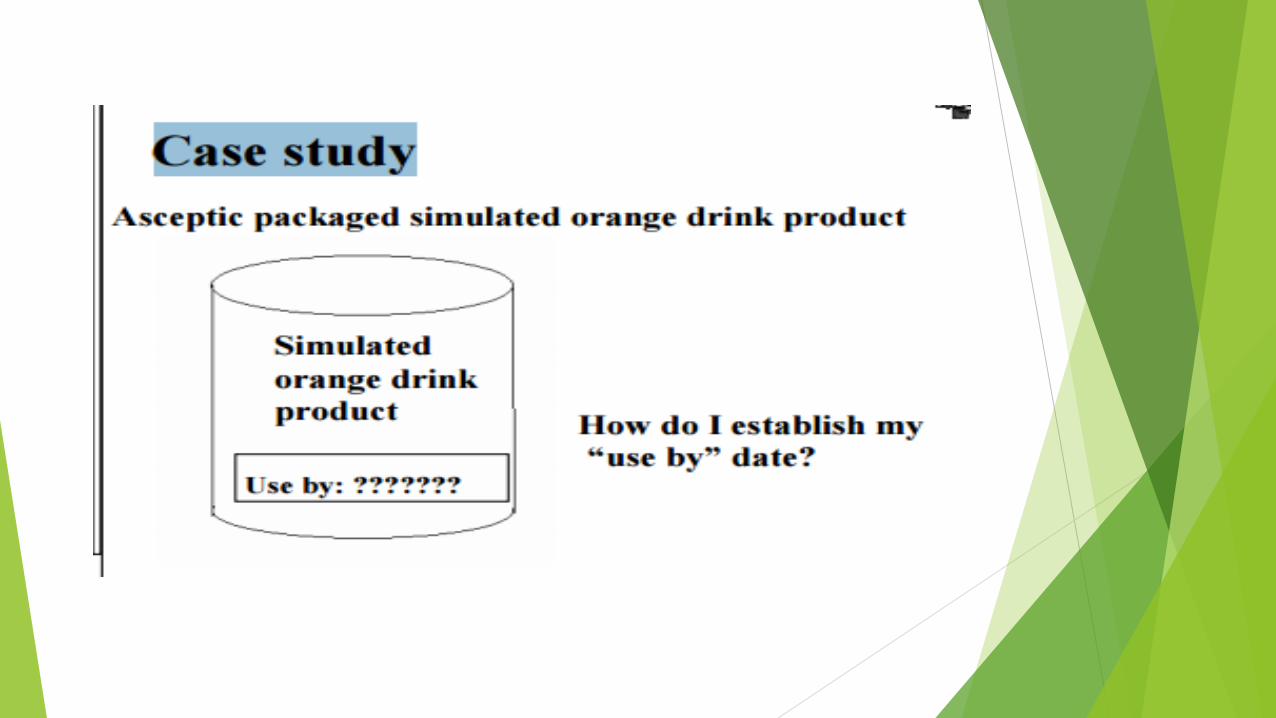

Case Study
On the label of my asceptic packaged orange
drink product it states that each serving provides
100% of the % DV for vitamin C. I know that
vitamin C is the most labile constituent of my
product, therefore I can use it as a marker
%DV = 60 mg

Case Study
Number of servings per package = 6
Total minimum vitamin C needed in package at time of
consumption = 360 mg
To account for breakdown, I add enough vitamin C to
make the total at manufacture = 720 mg
Question: How do I determine my “use by” date?

Case Study Answer: Do an accelerated shelf life study. Measure k at C
(323, 333, and 343oK)
Do an Arrhenius plot

Case Study
Extrapolate to storage temperature, in this case 25
degrees C (298 deg K).
Case Study
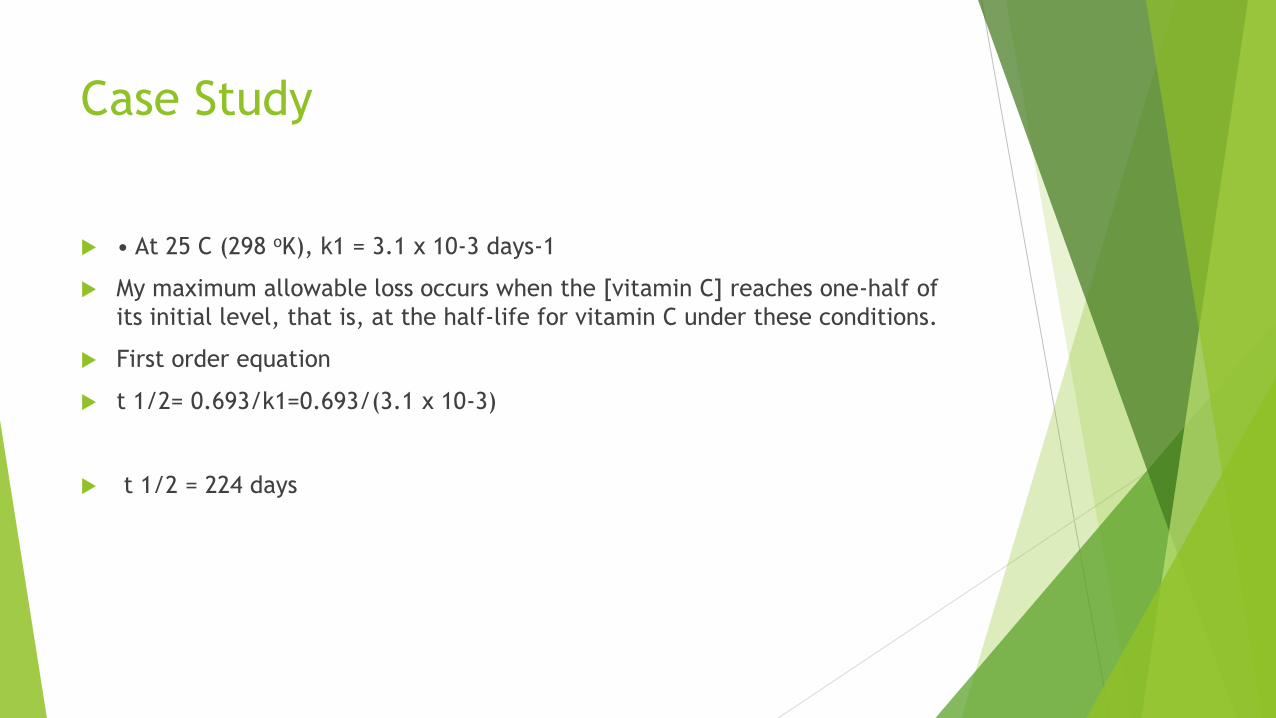
• At 25 C (298 oK), k1 = 3.1 x 10⁻³ days-1
My maximum allowable loss occurs when the [vitamin C] reaches one-half of
its initial level, that is, at the half-life for vitamin C under these conditions.
First order equation
t 1/2= 0.693/k1=0.693/(3.1 x 10-3)
t 1/2 = 224 days
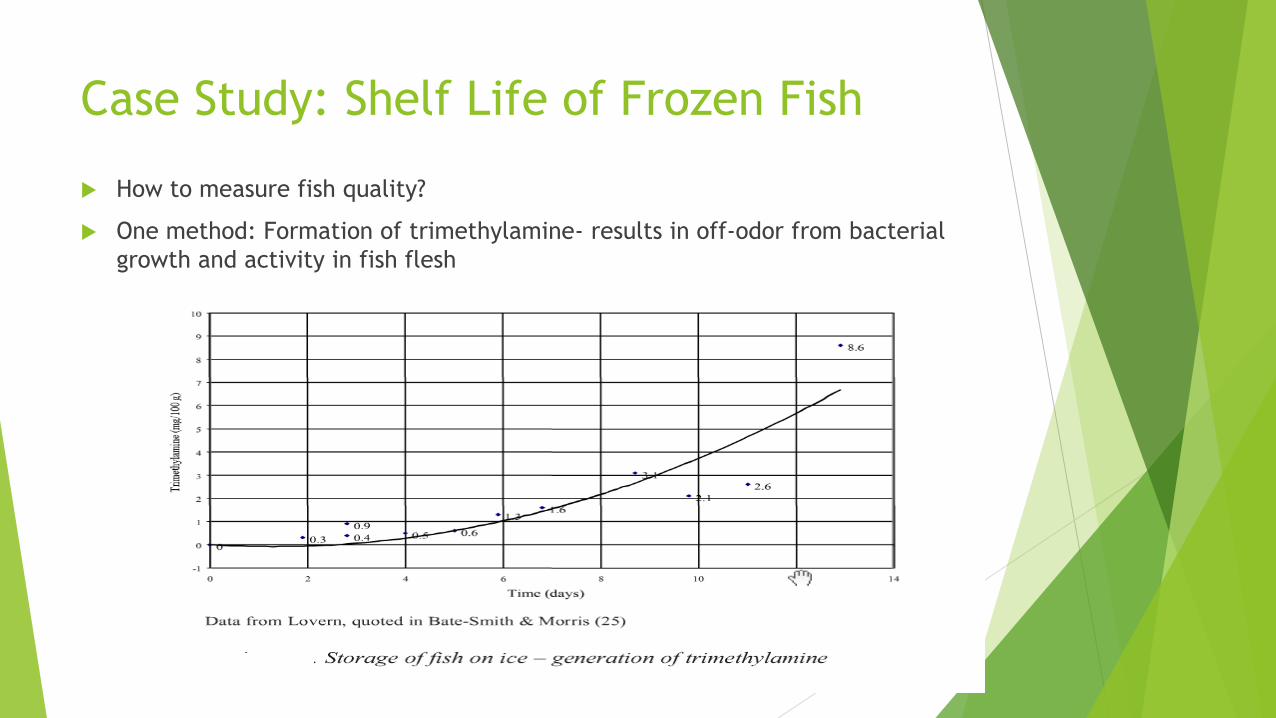
Case Study: Shelf Life of Frozen Fish
How to measure fish quality?
One method: Formation of trimethylamine- results in off-odor from bacterial
growth and activity in fish flesh
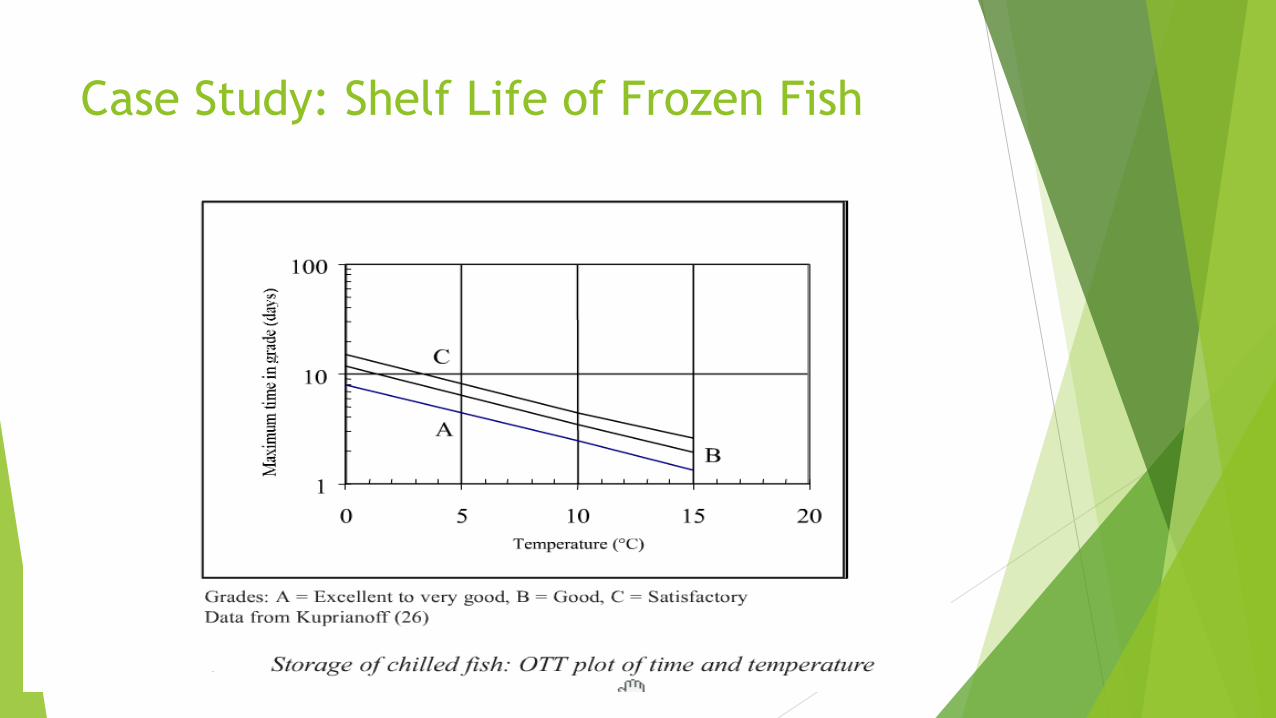
Case Study: Shelf Life of Frozen Fish
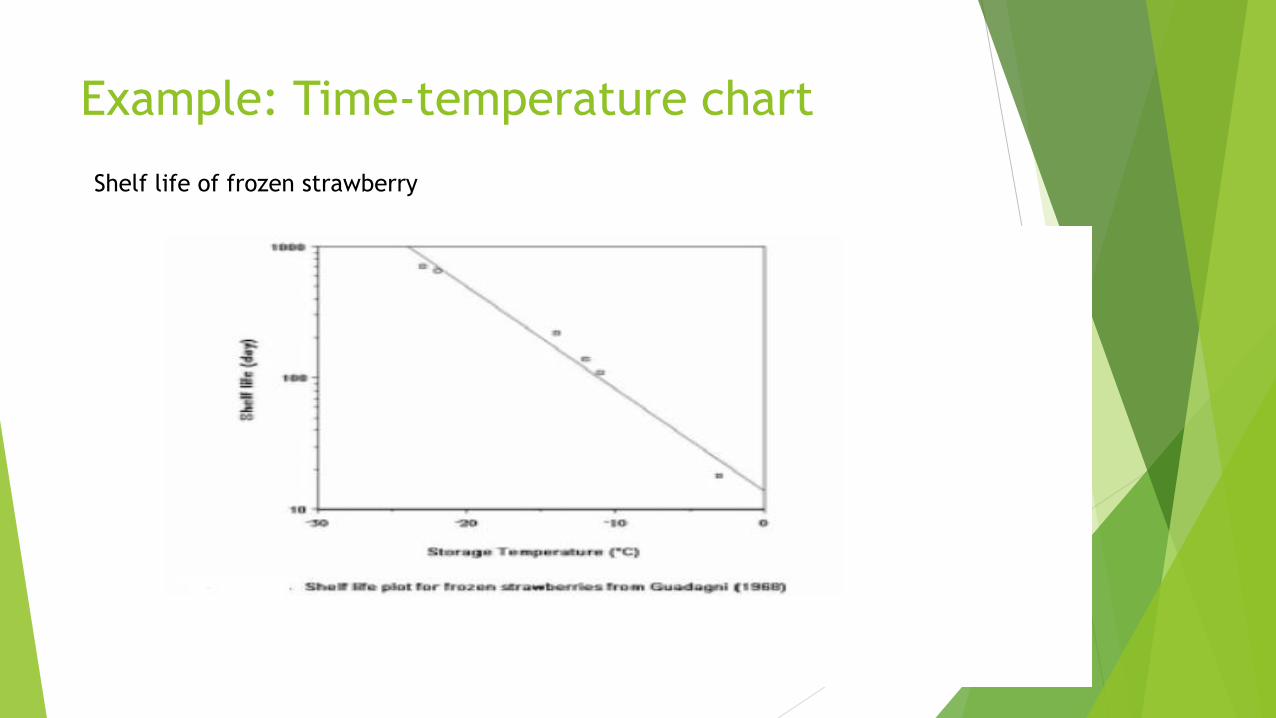
Example: Time-temperature chart
Shelf life of frozen strawberry

Tutorial 1
Nutrition is an important part of ready-to-eat cereal. To make cereal healthier many nutrients are added. Unfortunately, nutrients degrade over time, making it necessary to add more than the declared amount to assure enough for the life of the cereal. Vitamin V1 is declared at a level of 20% of the Recommended Daily Allowance per serving ( serving size = 30 g). The recommended daily allowance is 6500 IU (1.7 X 10⁶ IU = 1 g) . It has been found that the degradation of this nutrient is first order in the amount of nutrients. Accelerated storage tests have been conducted on this cereal, with the following results:
Temp ( deg C) 45 55 65
k ( week -1) 0.0061 0.0097 0.0185
Given this information and the fact that the cereal needs to have a vitamin level above the declared value of 6500 IU for 1 year at 25 deg C, what IU should be present in the cereal at the time it is manufactured ?
Biochemical Reactions
Topic 7-8


Enzymatic Reactions
Proposed reaction mechanisms

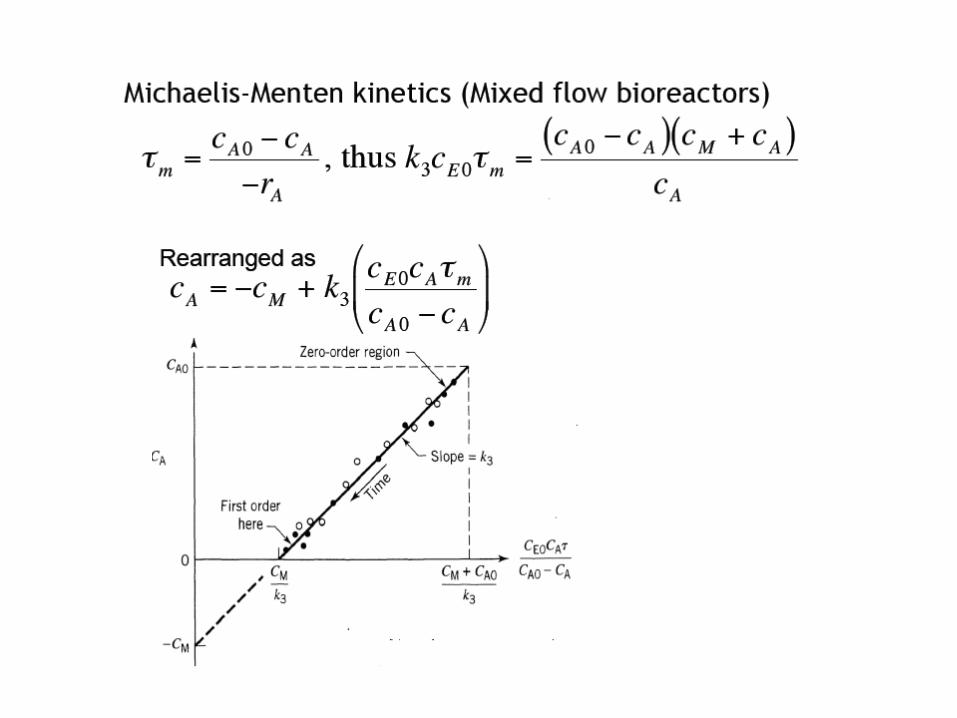
M-M Kinetics
Assumptions


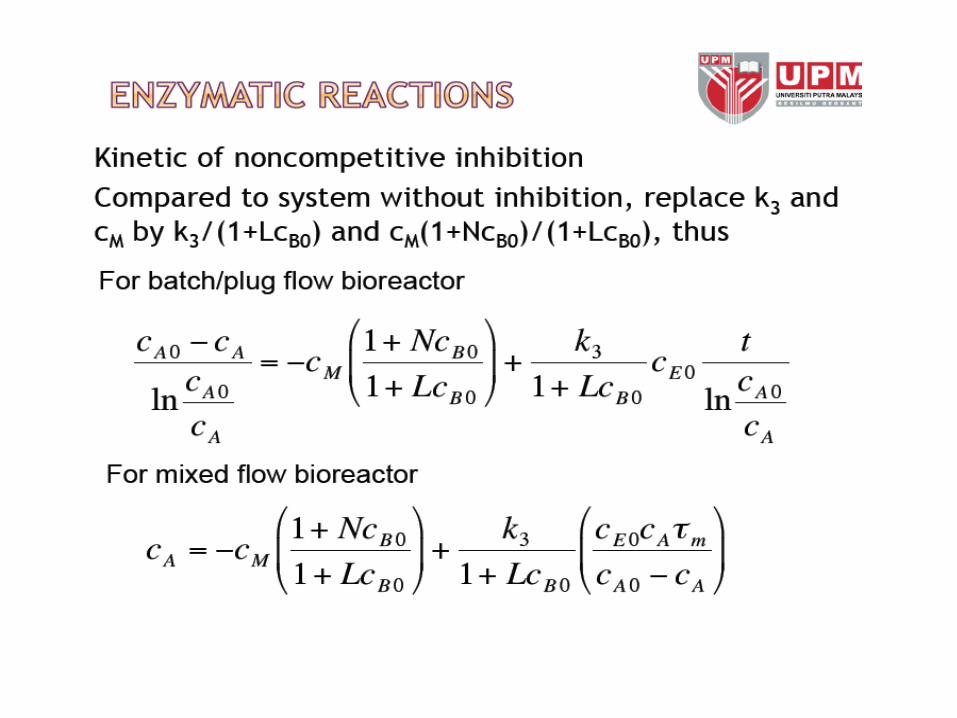


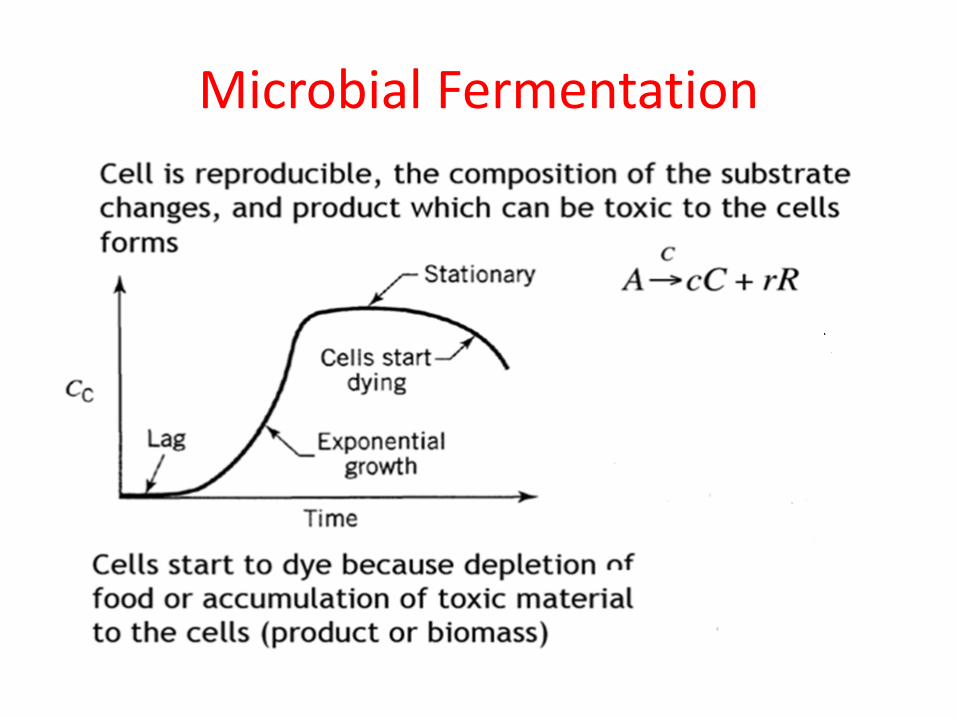
Microbial Fermentation
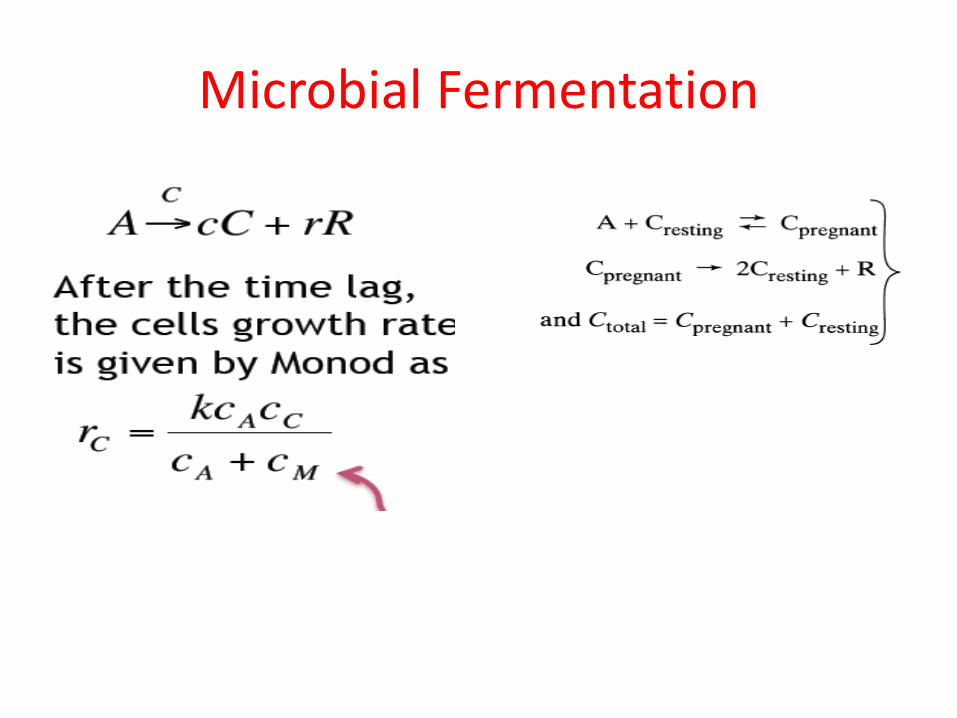
Microbial Fermentation

Limiting Mechanism

Microbial Fermentation

Effects of Harmful Waste•As Harmful product increase, the observed rate constant starts to decrease

Substrate Limiting Microbial Fermentation

Substrate Limiting: Batch Plug Flow Fermentors
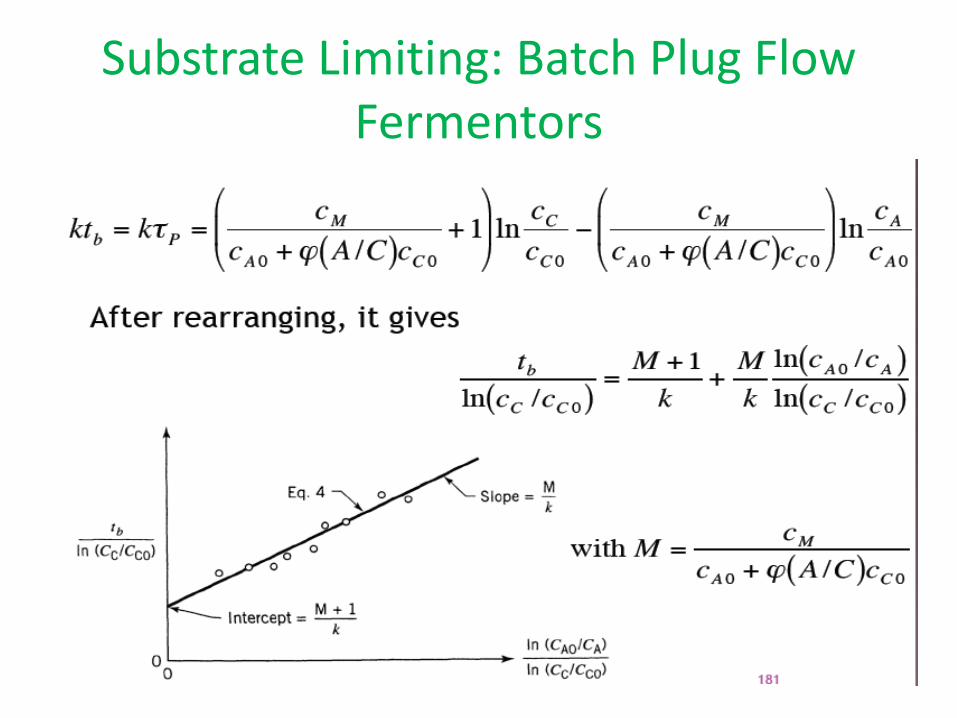
Substrate Limiting: Batch Plug Flow Fermentors

Substrate Limiting: Mix Flow Fermentors
Design Equation
Feed stream contains no cells :

Substrate Limiting: Mix Flow Fermentors

Substrate Limiting: Mix Flow Fermentors

Substrate Limiting: Mix Flow Fermentors
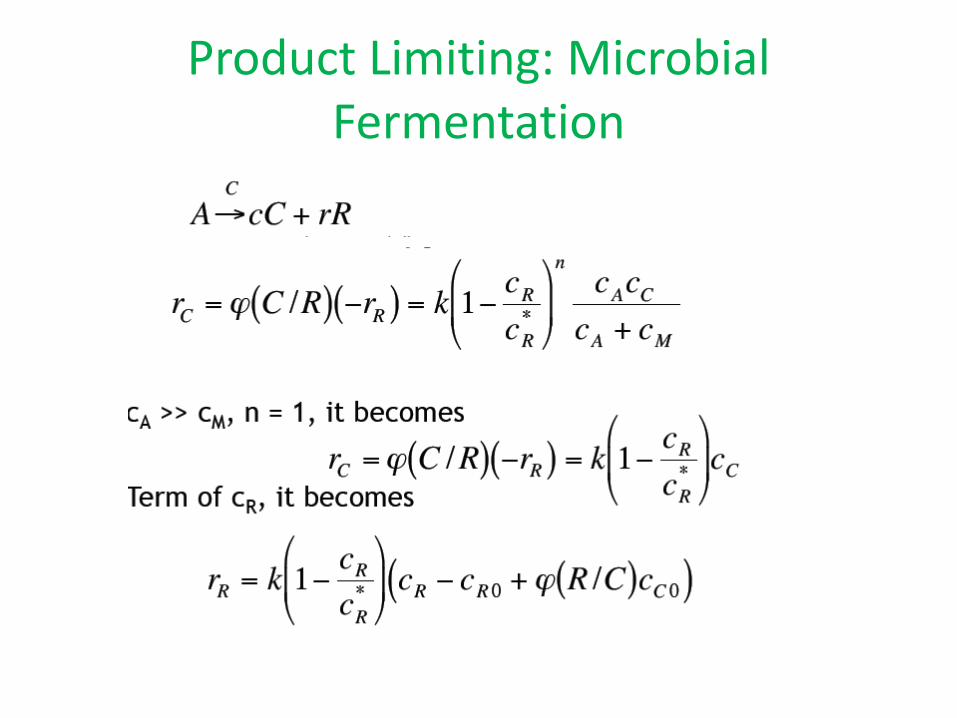
Product Limiting: Microbial Fermentation

Product Limiting: Microbial Fermentation

Product Limiting: Microbial Fermentation (Batch/Plug Flow Reactor)

Product Limiting: Microbial Fermentation (Batch/Plug Flow Reactor)

Product Limiting: Microbial Fermentation (Mixed Flow Reactor)

Product Limiting: Microbial Fermentation (Mixed Flow Reactor)

Product Limiting: Microbial Fermentation (Mixed Flow Reactor)
Topic 9 Reactor Design• Elements of reaction kinetics
– Rates of which different reaction occurs– Factors that affect reaction rates– Reactions mechanisms– Rate limiting steps that control the reaction– Mathematical model describing reaction rate
Elements of Reactor Design
– Exploitation of chemical reaction in commercial scale– Sizing of chemical reactor– Determination of best process conditions i.e flow, temperature,
pressure for optimum performance– Types of reactors: Flow patterns– Arrangement of reactors: staged, recycle etc– How materials behave (chemically and physically) within a reactor

Ideal Reactors

Mole Balances and Energy Balances
• Fundamental principle
• Starting point to develop design equation for different type of reactors
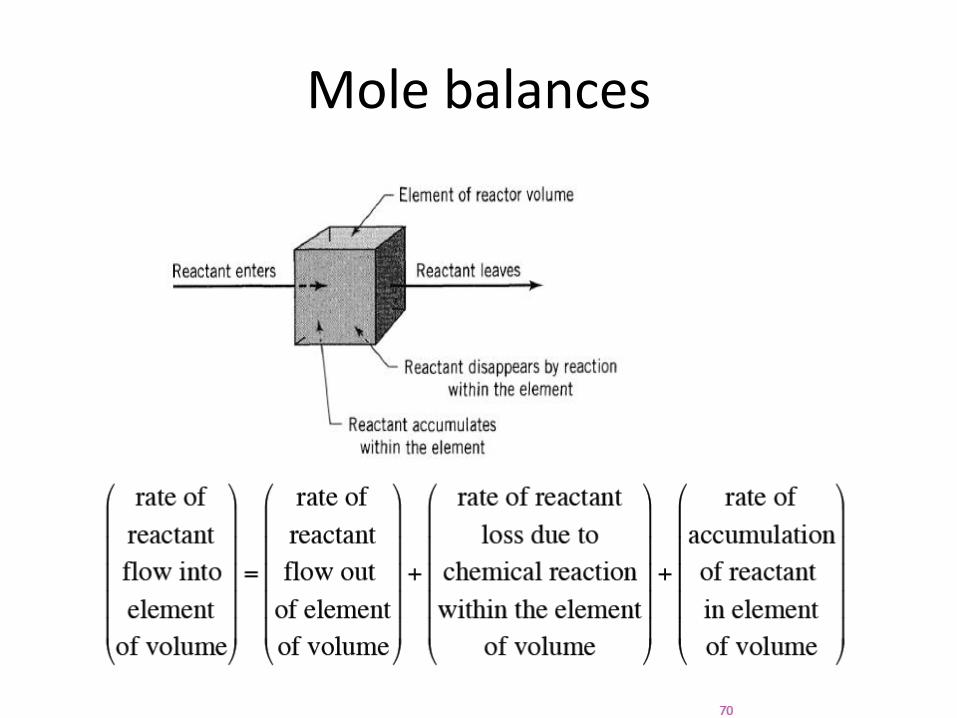
Mole balances

‘


Tutorial 1
• Liquid A decomposed by a second order kinetics. In batch reactor 50% of A is converted in a 5 minute run. How much longer would it take to reach 75 % conversion?

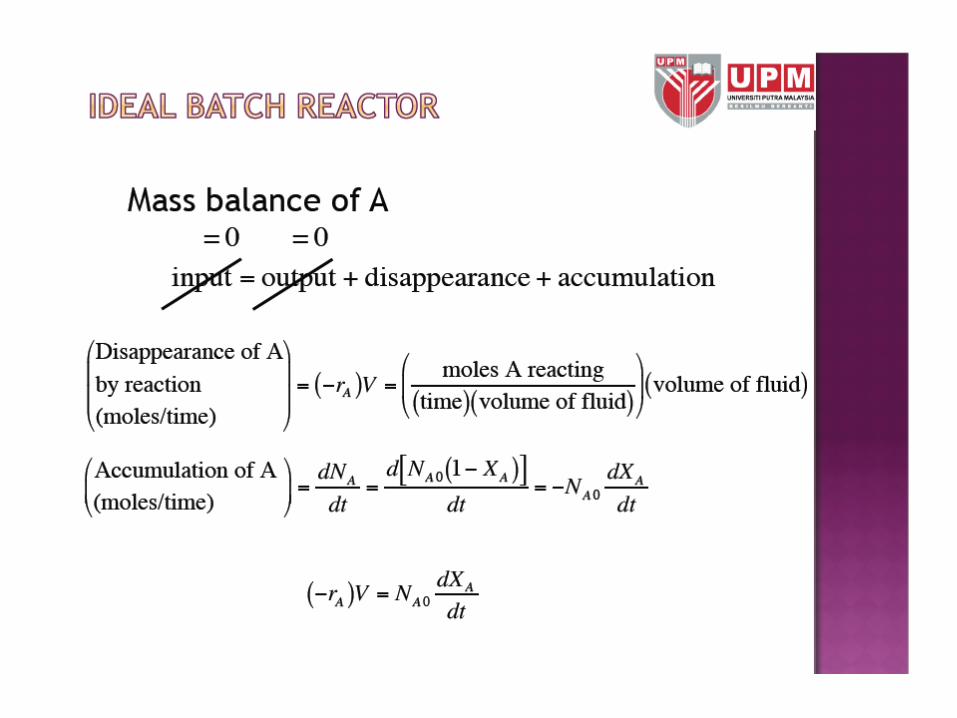
Example• Liquid reaction A R is to be performed in a batch reactor.
The rate of the reaction is given in the table below. If the initial A concentration is 1.3 mol/L how long does it need to reduce the concentration to 0.3 mol/L?
•

Example


Space time


Topic 10 Mole Balance Applied to Flow Reactors
Tubular (Plug Flow) Reactor (PFR):
reactants products
y
y+yy
VFA(y) FA(y+y)
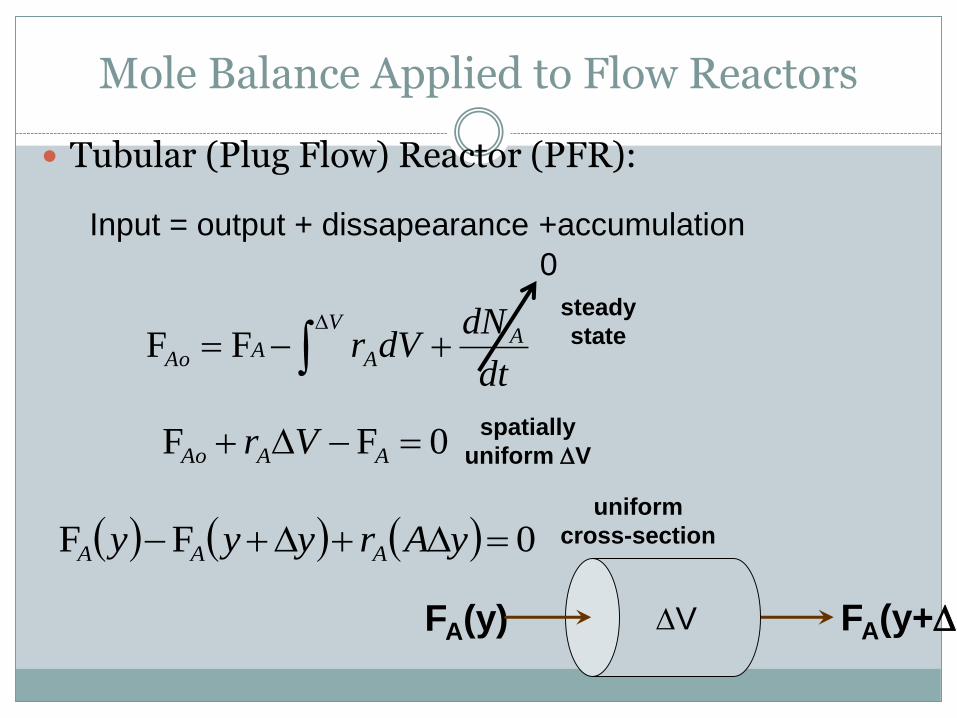
Mole Balance Applied to Flow Reactors
Tubular (Plug Flow) Reactor (PFR):
dt
dNdVr A
V
AAAo
FF
0
steady
state
0FF AAAo Vrspatially
uniform V
VFA(y) FA(y+y)
Input = output + dissapearance +accumulation
0FF yAryyy AAA
uniform
cross-section

Mole Balance Applied to Flow Reactors
Tubular (Plug Flow) Reactor (PFR):
AA r
dV
d
F PFR
Design
Equation
dy
dVrAr
dy
dAA
A F
Ar
y
yyyA
AA
F-F
dx
df
x
xf-xxflim
0x

Conversion
AA r
dV
Fd X1FF AoA
AAo rdV
dXF
X
0A
Aor
dXFV
differential formintegral form

Rate law
AAo rdV
dXF
XkCkCr AoAA 1
BA CkCr A
Relate CA and CB using stoichiometric table
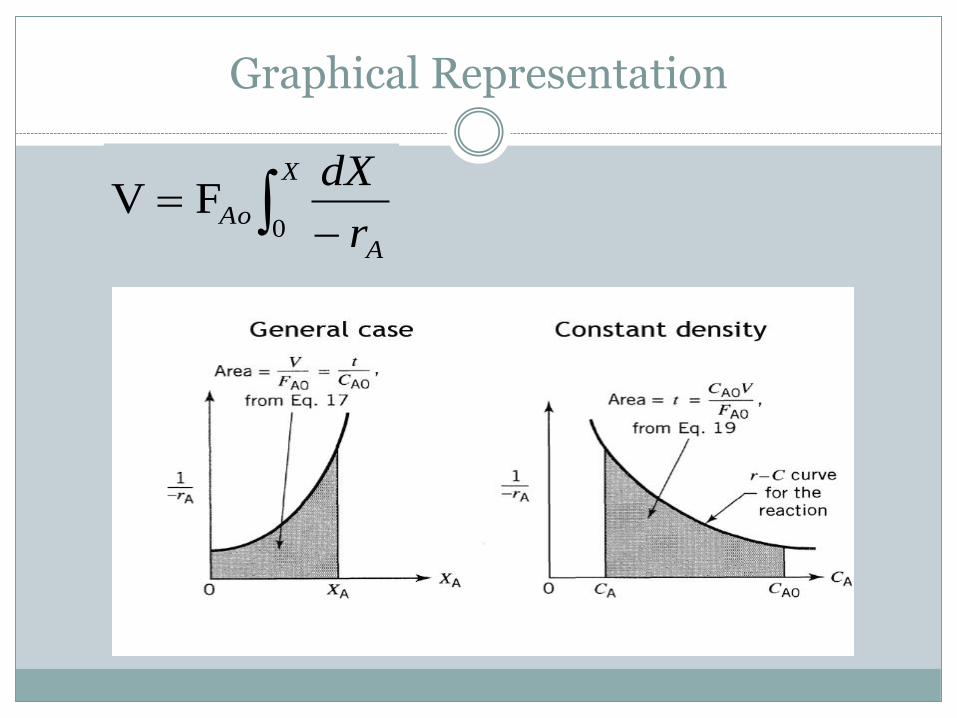
Graphical Representation
X
A
Aor
dX
0FV

Reaction Kinetics and Introduction to Reactor Design in Food
Production
Lecturer: Dr. Rabitah Zakaria
Phone: (W) 03-89464307 Email: [email protected]
Required Text: Earle, R. Earle ,M., Fundamentals of Food Reaction Technology
Additional
Recommended Text: Levenspiel, O., Chemical Reaction Engineering, Third Edition.
John Wiley and Sons, New York, 1998
Fogler, H.S., Elements of Chemical Reaction Engineering, Forth
Edition. Prentice-Hall Int. Series, New Jersey, 2005
Course Description: This course covers the fundamental of reaction kinetics and its
application in food processing. The kinetic models of various
reaction types are developed. Evaluation of kinetics parameters are
made. Effect of temperature, concentration and time on the kinetic
models are discussed. The kinetics models are then applied to
various processes in the food production. The design of ideal
reactors are also treated at an introductory level.
Course Objectives:
1. Students will learn the kinetics models of various types of reaction and
the method to determine the kinetic parameters from batch reactor
data.
2. Students will learn to predict the concentration, temperature and
processing time requirement based on the kinetics model.
3. Students will apply the kinetics models of various food processes
particularly pasteurization, sterilization, cooking and shelf life study.
4. Students will have basic knowledge of the design of ideal reactors used
in food processing.
Topical Outline of the Course Content:
SUBJECTS
Introduction to Reaction Kinetics in Food Processing
Changes and Reactions in Food Material during Processing
Important Application of Kinetics in Food Processing

Factors Affecting Rate of Reactions
Determination of Kinetics Parameters Zero Order Reaction
First Order Reaction
Second Order Reaction
Reversible Reaction
Parallel Reactions
Reaction of Shifting Order
Effect of Concentration
Determination of Time and Concentration
Half life of Reaction
Effect of Reaction Order on Rate
Effect of Temperature
Dependency on Temperature: Arrhenius Equation
Activation Energy
z, D, F, sensitivity and Q values
Combining Effect of Temperature and Time
Outcome Time and Temperature Chart
Application in Food Processes
Case Studies : Pasteurization, Sterilizations and Shelf Life of Food
Application of kinetics models to predict Pasteurization/Sterilization Time and
Temperature
Shelf Life Prediction using Kinetics Model: Accelerated Storage Test
Kinetics of Enzymatic Reaction
Michelis Menten Kinetics
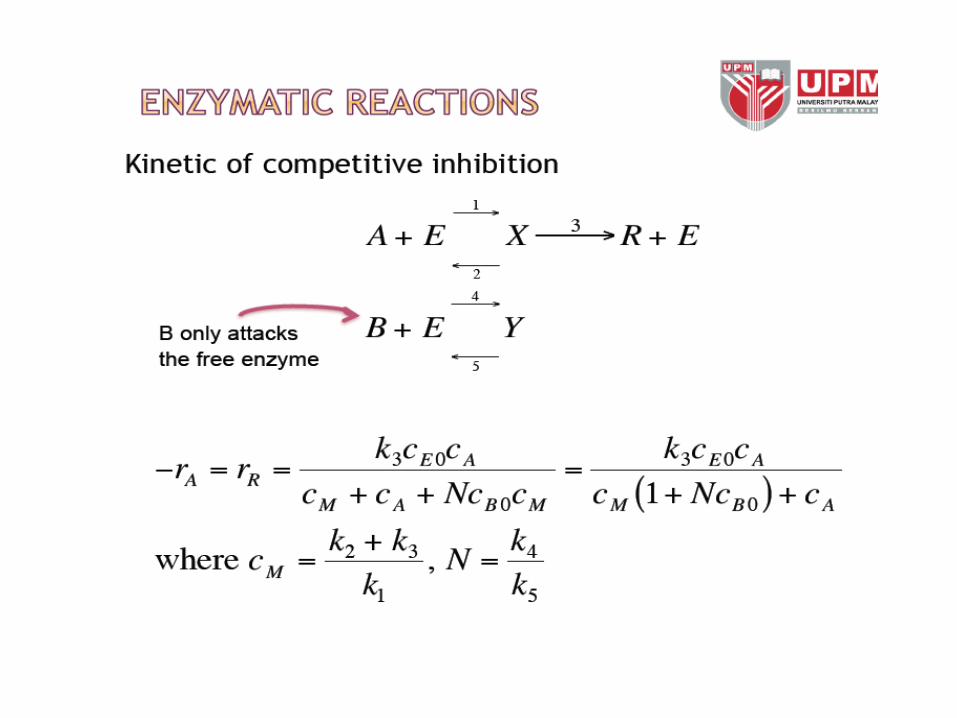
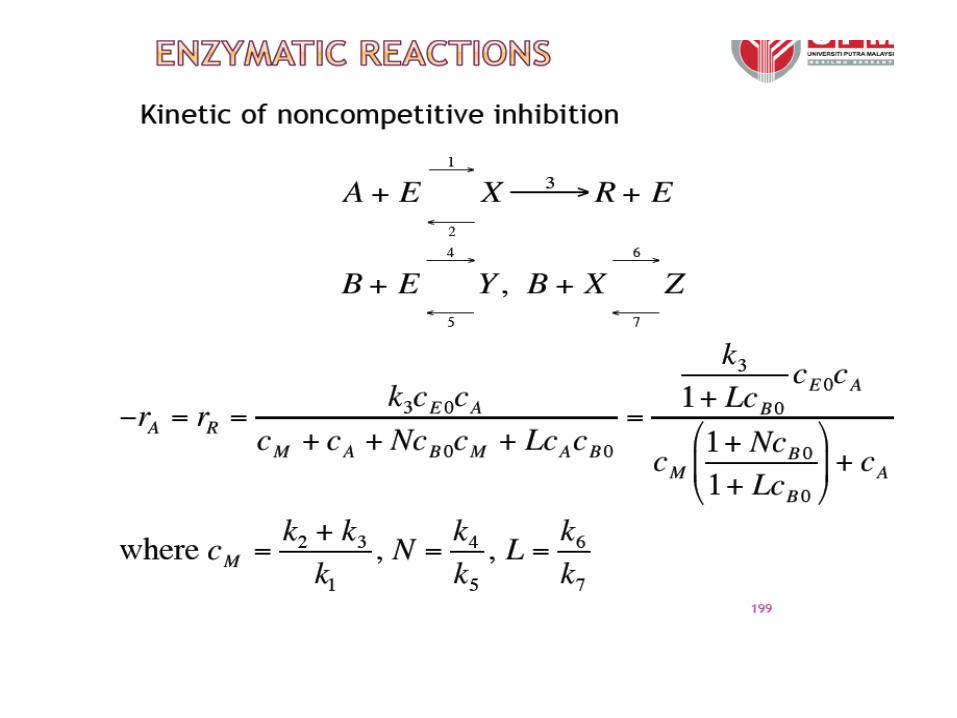
Inhibition Effect
Kinetics of Microbial Growth
Monod Kinetics
Substrate Limiting
Product Limiting
Design of Mixed Flow Reactor
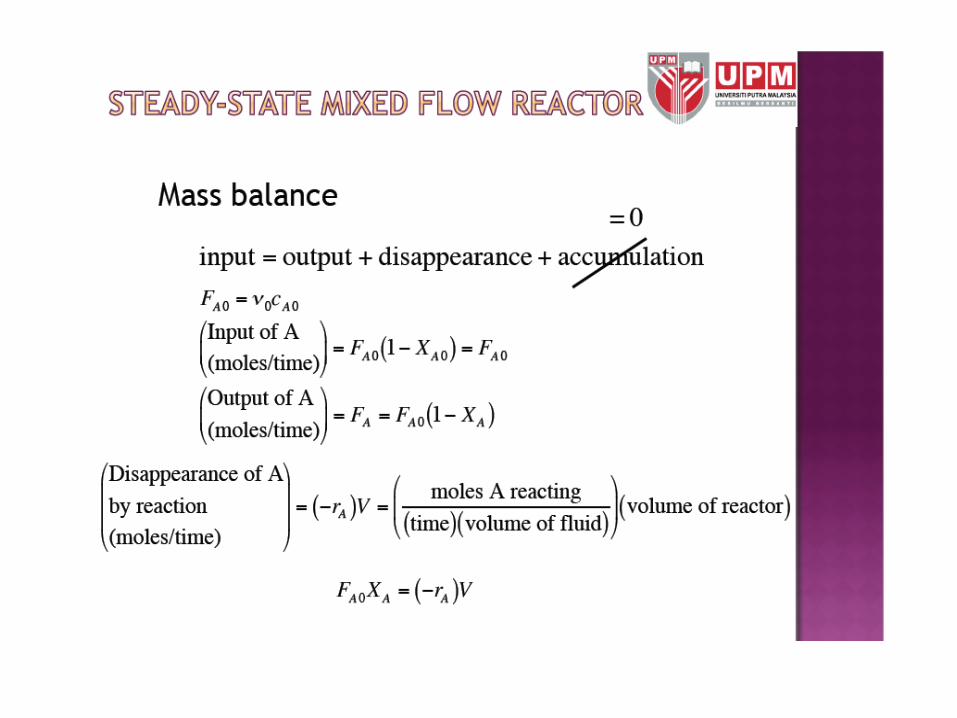
Mass Balance Fundamental
Determination of Reactor Size and Conversion
Design of Plug Flow Reactor
Mass Balance Fundamental
Determination of Reactor Size and Conversion

Grading Policy
Class participation: Attendance is required as all exam questions will come
directly from class discussion. Attendance will constitute
10% of the grades.
Tests: There will be a Test 1 that constitute 20% of your grade
and a Final Exam that constitute 70% of your grade. The
Final is Cumulative!
If you have any question – ASK!!! If I am going too fast, please ask me to slow
down.
To help encourage the proper educational environment and out of courtesy for
your fellow classmates, please turn of all cell phones prior to entering the
classroom and be on time.