reaching the limits of nuclear stability - nsclthoennes/personal/papers/rpp67_1187.pdf · reaching...
TRANSCRIPT

INSTITUTE OF PHYSICS PUBLISHING REPORTS ON PROGRESS IN PHYSICS
Rep. Prog. Phys. 67 (2004) 1187–1232 PII: S0034-4885(04)56511-9
Reaching the limits of nuclear stability
M Thoennessen
National Superconducting Cyclotron Laboratory and Department of Physics & Astronomy,Michigan State University, East Lansing, MI 48824, USA
E-mail: [email protected]
Received 17 February 2004Published 8 June 2004Online at stacks.iop.org/RoPP/67/1187doi:10.1088/0034-4885/67/7/R04
Abstract
The limits of nuclear stability have not been reached for most elements. Only for the lightestelements are the minimum and maximum number of neutrons necessary to form an isotopefor a given element known. The current limits, novel features of nuclei at these limits as wellas the future possibilities of pushing these limits even further will be discussed.
0034-4885/04/071187+46$90.00 © 2004 IOP Publishing Ltd Printed in the UK 1187

1188 M Thoennessen
Contents
Page1. Introduction 11892. Nuclear landscape 1189
2.1. Definition of the dripline 11922.2. Definition of a nucleus 11942.3. Experimental observation of the driplines 11952.4. General features of the dripline 1196
3. Production of nuclei at the dripline 11963.1. Transfer reactions 11993.2. Fusion-evaporation 11993.3. Target spallation 12003.4. Deep inelastic reactions 12013.5. Projectile fragmentation 12013.6. Pion exchange reactions 12013.7. Fission of fast beams 12023.8. Reactions with rare isotopes 1202
4. Proton dripline 12034.1. Light mass nuclei: Z � 20 12034.2. Medium mass nuclei I: 20 < Z � 50 12054.3. Medium mass nuclei II: 50 < Z � 82 12064.4. Heavy nuclei: 83 � Z 12084.5. Predictions of the proton dripline 12104.6. Exotic decay modes 1212
5. Neutron dripline 12135.1. Isotones with N � 8 12155.2. Isotones with 8 < N � 20 12165.3. Isotones with N > 20 12175.4. Predictions of the neutron dripline 12185.5. Exotic structures and decay modes 1221
6. Astrophysical implications 12216.1. rp-process 12216.2. r-process 1223
7. Future of dripline studies 12257.1. Proton dripline 12257.2. Neutron dripline 1226
8. Conclusion 1227Acknowledgments 1228References 1228
Reaching the limits of nuclear stability 1189
1. Introduction
Reaching limits has always been a major driving force for explorations in every field of science.In addition to the pure curiosity of finding something new, something that nobody else hasever observed before, the observation (or non-observation) of a new type of matter or thediscovery of new particles yields crucial information for the understanding of the underlyingforces.
Nuclei, consisting of a combination of protons and neutrons, can be pushed to many limits.These limits are typically reached by the collision of two nuclei. At moderate beam energies(∼10 MeV/nucleon), the two nuclei can fuse into a compound system which starts rotating dueto the collision. Very fast rotating nuclei can change their shapes to be extremely deformedbefore they ultimately reach the fission limit [1, 2]. At higher energies the compound systemreaches a temperature limit where it will disintegrate by multifragmentation [3]. The collisionof two heavy nuclei at even higher energies leads to densities and temperatures at which theprotons and neutrons of the nucleus cease to exist as individual identifiable entities. A newform of matter, a plasma consisting of quarks and gluons may be formed [4–6].
The limit discussed in this review concerns the question: which combinations of neutronsand protons can form a nucleus? The number of protons (Z) in a nucleus determines theelement, and the quest for the heaviest element continues to be an exciting field of research.This is a topic in itself and has been reviewed on a continuous basis as the limit has been pushedto increasingly heavier elements [7–9]. Just as interesting is the question of what is the largestor smallest number of neutrons (N ) that can form a nucleus for any given Z. These limits arecalled the neutron and proton driplines, respectively [10, 11], although the exact definition ofthe driplines is ambiguous and will be discussed in this review.
Pushing the boundary of knowledge further towards more proton-rich and neutron-richnuclei has been a priority of nuclear physics for the last 40 years. Exploring the properties ofall these nuclei is important for the understanding of the nuclear force, nuclear astrophysicsand the formation of the elements. Significant progress has been made since the last majorreviews of exotic nuclei and the driplines [12, 10, 13]. A most recent review concentrated onthe features of light neutron-rich nuclei at and beyond the neutron dripline [11].
The following section will give an overview of the chart of nuclei and the definition of thedriplines and nuclei themselves. In section 3 different methods of reaching the driplines willbe discussed. The nuclei at and even beyond these driplines can exhibit unusual properties.In particular, these nuclei can potentially exhibit exotic decay modes, for example, neutronradioactivity or di-proton decay. These topics will be discussed in sections 4 and 5 for theproton and neutron dripline, respectively. The astrophysical implications of the location ofthe driplines will be explored in section 6. Finally new opportunities to reach and explore thedripline towards heavier nuclei will be presented in section 7.
2. Nuclear landscape
There are many combinations of neutrons and protons that can make up a nucleus of a givenmass. In the ‘Table of Isotopes’ known properties of all nuclei are published. Since the firstpublication in 1940 [14] it has grown to several thousands of pages over the last 60 years[15–17]. It has been customary to use the word isotope synonymously with nucleus. Strictlyspeaking, isotopes are defined as nuclei with the same number of protons (Z = constant) butdifferent number of neutrons. Similarly, isotones are nuclei with the same number of neutrons(N = constant) but different number of protons. In addition isobars are nuclei with the samenumber of nucleons (A = constant).

1190 M Thoennessen
Figure 1. Chart of nuclei: stable (black), presently observed (dark-grey) and still unknown nucleias predicted by Tachibana et al [18] (light-grey) are shown. The Z = 28 isotopes, N = 82 isotonesand A = 100 isobars are indicated by the horizontal, vertical and diagonal line, respectively.
The chart of nuclei shown in figure 1 displays the nuclei as a function of neutron numberand proton number. A horizontal line corresponds to isotopes, vertical lines to isotones, anddiagonals from the top left to bottom right are isobars. The Z = 28 isotopes, N = 82 isotonesand A = 100 isobars are indicated by the horizontal, vertical and diagonal lines, respectively.
There are almost 300 stable nuclei (with a lifetime greater than 109 years) which areindicated by the black squares in figure 1. All other nuclei convert to these nuclei by radioactivedecay with different lifetimes that range from nanoseconds to millions of years. For massesup to A = 209 typically one or two stable isobars exist for each mass. A few exceptionsare, for example, A = 5 and 8 for which there are no stable isobars and A = 96 which hasthree stable isobars (96Ru, 96Mo, 96Zr). Over 2500 of these nuclei are known and shown indark-grey in the figure. However, there could be as many as an additional 5000 nuclei thathave yet to be discovered. Potentially bound nuclei as predicted by Tachibana et al [18] areshown in light-grey.
Isobars with the lowest mass are stable where the mass is given by (see also top part offigure 4):
M = ZmH + Nmn − EB
c2(1)
with mH = 938.8 MeV/c2 and mn = 939.6 MeV/c2. EB corresponds to the binding energywhich is unique for each nucleus. Changing protons into neutrons or neutrons into protonsincreases the mass (or energy: E = Mc2) of the stable isobars and reduces the binding energy.The binding energy per nucleon (EB/A) corresponds to the average binding energy for anucleon within the nucleus. Figure 2 shows EB/A as a function of Z and N in a surface plot.The figure reveals some of the nuclear structure features. The odd–even staggering shows theincreased binding energy due to the pairing of two neutrons or two protons. Additional bindingoccurs also for nuclei with magic numbers of protons and neutrons, which occur when majorshells are filled. The lines for the magic numbers of 8, 20, 50, 82 and 126 are indicated inthe figure and show up as slight ridges in the surface plot. The most bound nuclei in terms of

Reaching the limits of nuclear stability 1191
Figure 2. Binding energy per nucleon (EB/A) as a function of N (x-axis) and Z (y-axis). Thedarker squares indicate stable nuclei.
EB/A are 64Ni and 58Fe. Overall the binding energy per nuclei stays fairly constant around8 MeV with only a small reduction towards the edge of stability and towards the upper andlower ends of the nuclear chart.
The binding energy per nucleon represents the overall binding of nuclei, however, thequestion of stability in terms of neutron and proton numbers is not determined by this averagequantity, but by the energy necessary to bind the last or least bound nucleon. This separationenergy corresponds to the energy required to remove a single nucleon from a nucleus. Theneutron separation energy Sn and proton separation energy Sp can be calculated from thedifference of the binding energies of two corresponding adjacent nuclei:
Sn = EB(Z, N) − EB(Z, N − 1), (2)
Sp = EB(Z, N) − EB(Z − 1, N). (3)
Figure 3 demonstrates the valley of stability by plotting the separation energies with the largervalues towards the negative vertical axis. The figure shows the smaller value of Sn and Sp fora given nucleus. In order to avoid the odd–even staggering, only odd–odd nuclei, i.e. nucleiwith odd numbers of protons and odd numbers of neutrons, are plotted. The special role of themagic numbers at the shell closures can be seen with the major shells indicated by the darkerlines. In addition, the dashed diagonal line shows nuclei with equal numbers of protons andneutrons (N = Z nuclei). The trend of the valley of stability towards more neutron-rich nucleidue to the increasing Coulomb repulsion for heavier nuclei becomes apparent. The figure alsoshows that the slope for proton-rich nuclei is steeper than the slope on the neutron-rich side.

1192 M Thoennessen
Figure 3. Separation energies as a function of Z (increasing towards the upper left) and N
(increasing towards the upper right). For each odd–odd nucleus the numerical smaller value of Sn
and Sp is shown with the larger separation energies towards the negative vertical axis. The solidlines indicate the proton and neutron magic numbers and dashed line corresponds to N = Z.
2.1. Definition of the dripline
There is no clear definition of the dripline. In their 1993 review, Mueller and Sherrill [10]defined the driplines ‘. . . where the last nucleon is no longer bound for the lightest or heaviestisotope and the nucleus decays on the timescale of the strong interactions (10−22 s or faster)’.

Reaching the limits of nuclear stability 1193
Figure 4. Masses (top) and proton (- - - -) and neutron (——) separation energies (bottom) forA = 21 isotones from 21Al8 to 21C15.
The latest edition of the chart of nuclei defined the dripline as: ‘The value of Z and N forwhich the last nucleon is no longer bound and for which the nucleus decays on the timescale of10−22 s or faster defines the dripline’ [19]. In his recent review, Jonson states: ‘The driplinesare the limits of the nuclear landscape, where additional protons or neutrons can no longer bekept in the nucleus—they literally drip out’ [11].
In contrast, most theoretical papers use a different definition. Brown [20] defined theproton dripline as ‘the boundary beyond which nuclei are unbound to direct proton decay’.This definition was also adopted in the review by Hansen and Tostevin [21]: ‘(the dripline is)where the nucleon separation energy goes to zero’. Hansen and Tostevin also point out that thedripline should follow the isotones for neutron-rich nuclei and the isotopes for the proton-richnuclei. In other words 11Be and 14Be are both dripline nuclei. With the above definition thereare no cases for which the dripline is double-valued.
For the present review the latter approach is followed and the dripline is defined as thelimits where Sn or Sp cross zero. Figure 4 shows the mass (top) and the single proton andneutron separation energies (bottom) for the A = 21 isotones as an example. Again, the figuredisplays positive separation energies towards the negative vertical axis. Nuclei close to thevalley of stability decay by converting a proton into a neutron or vice versa and the emissionof a β+ or β−, respectively. If the difference between neutrons and protons becomes too large,the separation energies can become negative and the last neutron or proton is not bound to thenucleus anymore. These are the nuclei beyond the dripline and they can decay by the emissionof a proton or a neutron. They are sometimes also called particle-unbound or just unboundnuclei. In the figure, 21C and 21Al are neutron- and proton-unbound, respectively.
The decay of an unbound nucleus by the emission of a proton or neutron is sometimescalled proton- or neutron-decay. This terminology can be confused with the decay of the

1194 M Thoennessen
Figure 5. Calculated lifetimes of 16B, 16F and 151Lu as a function of decay energy for angularmomenta of L = 0 (——), L = 1 (- - - -), L = 2 (— · —) and L = 5 (· · · · · ·). 16B is a neutronemitter and 16F and 151Lu are proton emitters.
proton or neutron itself. Similarly, α-decay refers to the decay of a nucleus by the emission ofan α particle and not the decay of the α particle itself.
The separation energy for unbound nuclei is by definition negative and the absolute valueof the separation energy corresponds to the energy of the decay: Edecay = |Sn,p|.
2.2. Definition of a nucleus
The definition of the driplines as the limit where Sn or Sp cross zero determines the locationof the dripline unambiguously. However, the definition of the existence of nuclei as an entityis not as clear. Sometimes very short-lived unbound nuclei are not referred to as nuclei at all,but rather only as resonances.
The above definition of the dripline does not limit the existence of a nucleus. Especiallyat the proton dripline, the emission of a proton from the unbound nucleus can be significantlyhindered by the presence of the Coulomb barrier. The unbound proton has to tunnel through thebarrier which can lead to significant lifetimes for the emission of the proton. These lifetimescan be even longer than the β+ lifetimes and even though a nucleus is unbound with respect toproton emission it decays by the emission of a β+, towards the valley of stability.
In addition to the Coulomb barrier the angular momentum can provide another barrier.For neutron-unbound nuclei it is the only barrier that hinders the neutron emission.
The influence of the barriers on the lifetime is demonstrated in figure 5 for neutronand proton emitters with different angular momenta. The possible lifetimes for the neutron-unbound nucleus 16B are extremely short and there is only a very small energy range (a few keV)where the decay can have directly measurable lifetimes. On the proton-rich side the lifetimesdepend strongly on the charge of the nucleus. While for 16F (Z = 9) only decay energies of�100 keV lead to longer lifetimes, energies of 1 to 2 MeV are sufficient for 151Lu (Z = 71).The lifetimes also depend strongly on the angular momentum and measured lifetimes havebeen used to extract the angular momentum state of the emitted nucleon [13].
A potential definition for the existence of a nucleus could be set by the definition of radio-activity. Goldanskii stated that ‘10−12 s corresponds to an approximate limit for radioactivity

Reaching the limits of nuclear stability 1195
as such’ [22]. This statement was supported later by Cerny and Hardy [23]: ‘. . . lifetimeslonger than 10−12 s, a possible lower limit for the process to be called radioactivity’.
This definition would be more restrictive than the definition of an element and thus isinappropriate. The International Union of Pure and Applied Chemistry (IUPAC) has publishedguidelines for the discovery of a chemical element [24]. In addition to other criteria they statethat ‘the discovery of a chemical element is the experimental demonstration, beyond reasonabledoubt, of the existence of a nuclide with an atomic number Z not identified before, existingfor at least 10−14 s’. The justification for this limit is also given: ‘This lifetime is chosenas a reasonable estimate of the time it takes a nucleus to acquire its outer electrons. It isnot considered self-evident that talking about an ‘element’ makes sense if no outer electrons,bearers of the chemical properties, are present’.
Similarly the definition of a nucleus should be related to the typical timescales of nuclearmotion. Nuclear rotation and vibration times are of the order of 10−22 s which can be considereda characteristic nuclear timescale [22]. The above mentioned definitions of the driplines byMueller and Sherrill [10] and the Chart of Nuclei [19] can be used as the definition of theexistence of a nucleus. If a nucleus lives long compared to 10−22 s it should be considered anucleus. Unfortunately this is no sharp clear limit. The most recent editions of the chart ofnuclei include unbound nuclei with lifetimes that are of the order of 10−22 s [19, 25].
2.3. Experimental observation of the driplines
The fact that nuclei exist even beyond the dripline makes the experimental determination of theactual dripline much more complicated. The production and unique identification of a specificnucleus in a reaction is sufficient reason to claim its existence. Typical direct measurementscan identify nuclei with lifetimes longer than ∼10−9 s. For shorter lifetimes it is possible touse the uncertainty principle relating the lifetime to the decay width � = h/τ . Typical detectorresolutions in these experiments being of the order of keV, however, limit this method to timesshorter than ∼10−19 s. Thus there is a wide range of lifetimes that is currently not accessible(10−10–10−19 s).
The distinction between dripline and existence is not an issue at the neutron dripline.The shortest β-decay lifetimes are of the order of milliseconds which is well in the range ofdirectly observable nuclei. As shown in figure 5 neutron emission lifetimes are generally muchshorter than picoseconds. The observation of direct neutron emission with a lifetime longerthan picoseconds would qualify as neutron radioactivity and is an extremely unlikely processbecause the window of separation energy is extremely small.
Thus the neutron dripline can experimentally be determined as the boundary betweendirectly observed and non-observed nuclei. The difficulty is to decide if the experimentalevidence is sufficient to claim the observation of a nucleus or to set an upper detection limit.There have been several cases where claims of existence as well as non-existence have beenmade based on limited statistics which turned out to be incorrect.
Already, in the early 1960s there were controversies about the existence of certain nuclei.5H was first observed to be particle-bound [26], but its existence could not be confirmed in laterexperiments [27]. The first evidences for the observation of 21C and 25O [28] were premature,and these nuclei are unstable with respect to neutron emission and are thus beyond the neutrondripline [29]. In contrast, 14Be [30] and 31Ne [31] were both first determined to be unbound,but were subsequently observed (14Be [32], 31Ne [33]). Controversial cases at the protondripline were, for example, 45Fe [34, 35] and 69Br [36, 37].
The determination of the proton dripline is much harder. Simple observation or non-observation is insufficient evidence to locate the dripline. In order to decide whether a nucleus

1196 M Thoennessen
at the proton dripline is bound or unbound, it is necessary to measure the mass of the nucleuswith proton and neutron numbers (Z, N ) itself, as well as the mass of the nucleus with(Z − 1, N ). The proton separation energy can then be calculated from the difference of thebinding energies (see equations (1) and (3)), or directly from the masses:
Sp = M(Z − 1, N) + MH − M(Z, N). (4)
In order to establish the proton dripline between the nuclei (Z, N ) and (Z, N + 1) the massesof the four nuclei (Z, N ), (Z, N + 1), (Z − 1, N ) and (Z − 1, N + 1) have to be measured. Incase of the unbound nuclei, it is sufficient to determine a lifetime limit which is shorter thanthe shortest β-decay lifetimes (∼1 ms). Of course, the direct observation of an emitted protonis also sufficient proof that a nucleus is beyond the dripline.
2.4. General features of the dripline
The edges of the light-grey area of figure 1 and the edges of the valley shown in figure 3correspond to the driplines as predicted by the mass model of Tachibana, Uno, Yamada andYamada (TUYY) [18]. Overall the neutron dripline is significantly further from the valley ofstability than the proton dripline.
The horizontal staggering of the proton dripline and the vertical staggering of the neutrondripline is due to pairing. The pairing of two protons or two neutrons adds significant stabilityto the nucleus so that even-Z nuclei are more stable toward the proton dripline compared toodd-Z nuclei and even-N nuclei are more stable than odd-N nuclei toward the neutron dripline.The staggering is not as obvious in figure 1 for medium mass nuclei (40 � Z � 80) along theproton dripline because it also displays odd-Z nuclei located beyond the proton dripline whichhave already been observed.
The influence of shell effects is also apparent in figure 3. For example the N = 50, 82 and126 isotones are significantly more stable than isotones just above these shell closures. Thefigure also shows that closed neutron shells shape the landscape for the neutron-rich nucleibut have essentially no effect on the proton-rich side (see, e.g. the N = 50 line). The sameis also true for the closed proton shells. While the Z = 20 shell forms a sharp ridge forproton-rich nuclei it has no influence on the neutron-rich side. One of the most interestingcurrent questions is if these traditional shell closures still exist for very neutron-(or proton-) richnuclei [38, 39].
Approaching the proton dripline is typically discussed for isotopes (constant Z). Thus thenuclei closer to the dripline should be described as neutron-deficient rather than proton-rich. Inorder to be consistent, the neutron dripline should then be discussed for isotones (constant N )instead of isotopes [21]. The present practice of describing the neutron dripline in terms ofisotopes is problematic due to the odd–even staggering. For example, 27F, 29F, and 31F arebound, while 28F and 30F are unbound. 32F is most probably unbound. However, in order toconfirm that the dripline has actually been reached, a definite measurement of 33F is necessary.Changing the description to isotones eliminates this discussion and it is clear that the neutrondripline in this region has been reached for all isotones up to N = 23, assuming that 30O isunbound. In the following, the neutron dripline will be discussed in terms of isotones.
3. Production of nuclei at the dripline
Over the years, several different experimental techniques were developed to reach the driplines.Figure 6 shows the first observation of exotic nuclei with Z � 20 (calcium) as a function of time.

Reaching the limits of nuclear stability 1197
Figure 6. Bound observed nuclei for Z � 20 (calcium). The different shadings indicate the timeof first observation of the nuclei.
The black squares correspond to stable nuclei, the light-grey squares corresponds to nucleifirst observed prior to 1960 and nuclei discovered in the subsequent years are represented bysquares shaded as indicated in the figure.
It is obviously easiest to reach the dripline for the lightest nuclei, where the driplines arevery close to the valley of stability. The proton dripline up to Z = 11 (20Na) and the neutrondripline up to N = 9 (14B) were already reached by 1966. Single or multiple particle transferreactions with stable beams and targets as well as target spallation (SP) reactions were usedto reach the dripline. The increased use of heavy-ion fusion evaporation reactions in the early1970s explored more proton-rich nuclei, while in 1971 deep inelastic reactions began to extendthe knowledge of neutron-rich nuclei. However, in spite of these developments, by 1974 theproton dripline had been only extended by one additional proton (Z = 12, 20Mg) and theneutron dripline by three neutrons (N = 12, 17B). The exploration of the driplines towardssignificantly larger proton and neutron numbers was made possible by the development of theprojectile fragmentation (PF) method in 1979 [40].
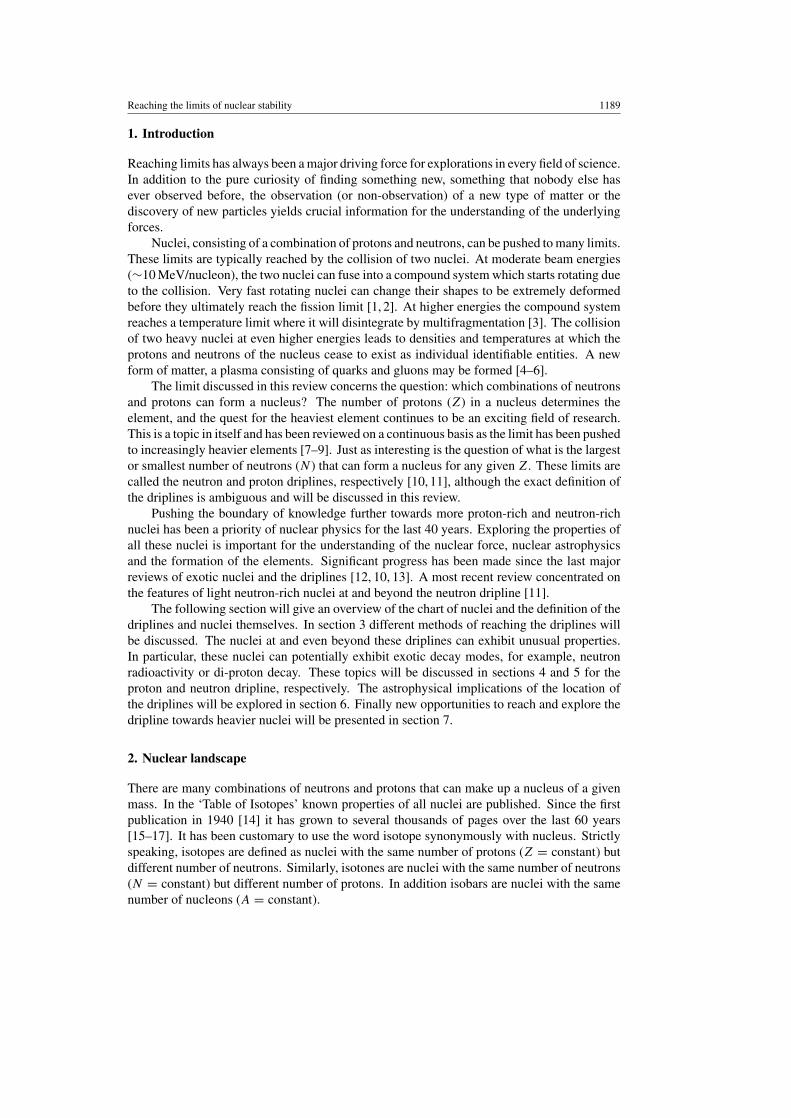
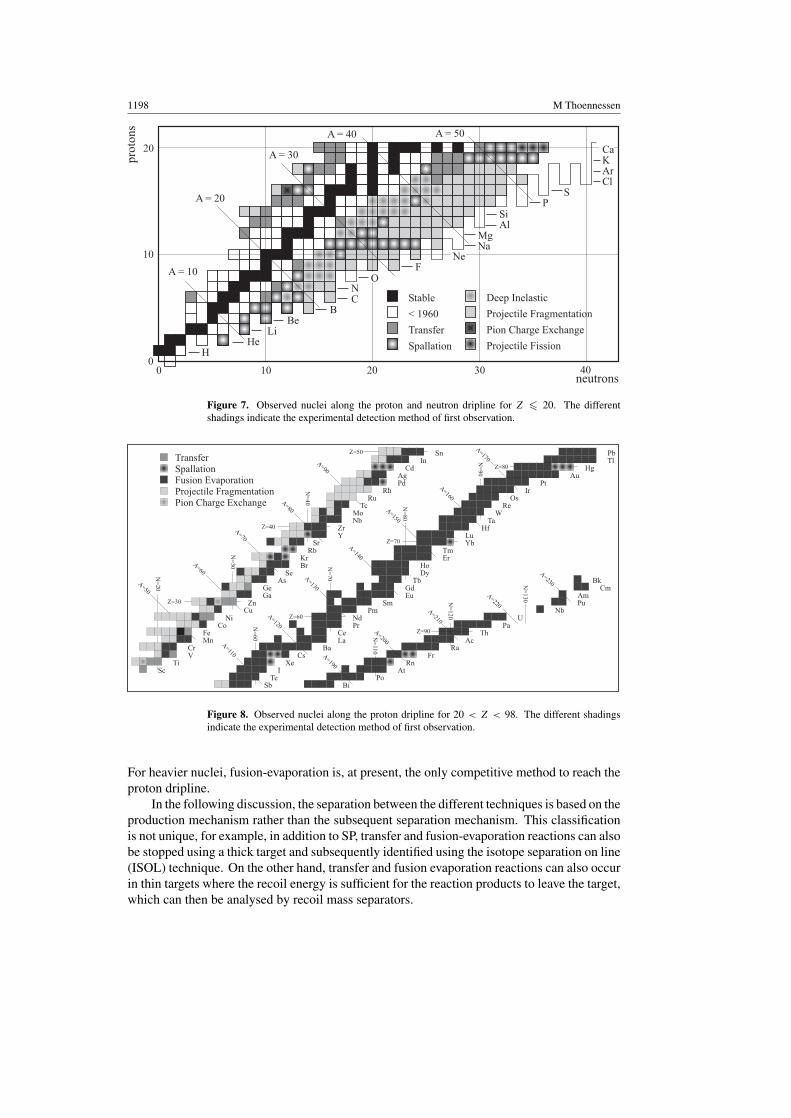
Figure 7 shows the different production mechanisms used to observe proton- and neutron-rich nuclei for the first time up to Z � 20. Figure 8 displays only the production of nucleialong the proton dripline up to Z < 98. The subsequent discussion will concentrate on theseregions because it is unlikely that the proton dripline will be explored beyond Z = 93 and theneutron dripline beyond N = 40, in the near future.
In the present review the first observation of nuclei is defined by the first publication ina refereed journal. Observations of nuclei reported earlier in annual reports or conferenceproceedings are not considered.
Again, black squares are stable nuclei, white squares are nuclei discovered before 1960 andthe shading of the other nuclei corresponds to the production mechanism of the first observationas indicated in the figure. With the exception of 39Sc, only nuclei with lifetimes larger than∼10−9 s are shown. In addition to transfer, deep inelastic, SP and PF a few nuclei have beenfirst observed in pion exchange reactions and fission of relativistic beams. PF is the methodof choice to reach the neutron dripline for N < 40 and also the proton dripline for Z < 50.
1198 M Thoennessen
Figure 7. Observed nuclei along the proton and neutron dripline for Z � 20. The differentshadings indicate the experimental detection method of first observation.
Figure 8. Observed nuclei along the proton dripline for 20 < Z < 98. The different shadingsindicate the experimental detection method of first observation.
For heavier nuclei, fusion-evaporation is, at present, the only competitive method to reach theproton dripline.
In the following discussion, the separation between the different techniques is based on theproduction mechanism rather than the subsequent separation mechanism. This classificationis not unique, for example, in addition to SP, transfer and fusion-evaporation reactions can alsobe stopped using a thick target and subsequently identified using the isotope separation on line(ISOL) technique. On the other hand, transfer and fusion evaporation reactions can also occurin thin targets where the recoil energy is sufficient for the reaction products to leave the target,which can then be analysed by recoil mass separators.

Reaching the limits of nuclear stability 1199
In addition, the boundaries between the different production methods are not well-defined.For example, the transition from fusion-evaporation to deep inelastic to PF is gradual. Also,even at very high beam energies, projectiles can pick up nucleons from the target, however, inthe following, this process is also considered to be PF.
3.1. Transfer reactions
Transfer reactions are extremely useful to extract detailed structure information. For theexploration of the driplines transfer reactions with stable beams and stable targets are limitedto the lightest nuclei. Obviously, simple one- or two-nucleon transfer reactions, for example,(p,d), (d,p), (p,t) etc and single charge exchange reactions like (p,n) and (t,3He) are limited tothe study of nuclei close to the valley of stability.
The use of more complicated multiparticle transfer reactions lead to the first observation ofthe proton dripline nuclei 9C, 20Mg, and 22Al by means of the reactions 12C(3He,6He)9C [41],24Mg(α,8He)20Mg [42] and 24Mg(3He,p4n)22Al. Examples for multiparticle transfer reactionspopulating neutron-rich nuclei are 48Ca(6Li,8B)46Ar [43] and 48Ca(3He,8B)43Cl [44].
Transfer reactions with light ions have also been very successful in studying particle-unstable nuclei. For example the reaction 7Li(t,3He)7He was used to prove the instability 7He[45]. At the proton-rich side example reactions are 10B(3He,6He)7B [46], 24Mg(p,6He)19Na[47] and 12C(α,8He)8C [42].
The study of unbound nuclei with transfer reactions is always indirect. The unboundnucleus decays instantaneously in the target and thus cannot be analysed in a magnetic separator.The energy levels of the unbound nucleus, however, can be inferred from the energy-lossspectrum of the ejectile. It is advantageous if the ejectile itself does not have any boundexcited states, in order to avoid mis-identification of excitations in the unbound nucleus andthe ejectile.
3.2. Fusion-evaporation
Fusion-evaporation reactions have been very successful in exploring the proton driplineespecially above Z = 50, where at the present it is essentially the only way to produce nucleiat and beyond the dripline. This technique is limited to the proton dripline because of thecurvature of the valley of stability towards neutron-rich nuclei and the preferential evaporationof neutrons during the cooling of the fused compound nuclei.
Nuclei close to the dripline have been populated with fusion-evaporation reactions asearly as 1964. 108Te and 109Te have been identified by their α decay following the reactions96Ru(16O,4n)108Te and 96Ru(16O,5n)107Te [48].
Pushing closer to the limit involved increasingly smaller cross sections, thus requiringmore sophisticated separation and detection techniques. With the development of velocityfilters [49] and mass separators [50] tremendous progress was made along the proton dripline.The experimental techniques are described in detail in the review by Woods and Davids [13].
The accessibility of the proton dripline with fusion-evaporation reactions relies on theavailability of stable target–projectile combinations. Figure 9 is the same as figure 1, withthe addition of all compound nuclei that can, in principle, be produced by means of fusion-evaporation reactions using any combination of all stable beams and targets. These compoundnuclei are indicated by the small dots. Assuming that the xn or pxn evaporation channels (withx between 2 and 6) can be separated and identified, the figure shows that the dripline can beexplored above Z = 30. It can be seen in the figure that above Z = 50 a few specific choices oftarget and projectile combinations get really close to the dripline, making fusion-evaporation

1200 M Thoennessen
Figure 9. Chart of nuclei: stable (black), presently observed (dark-grey) and still unknown (light-grey) nuclei are shown. The small dots represent compound nuclei that can be populated by fusionreactions with all possible combinations of stable projectiles and stable targets. Dripline nuclei canbe reached by multiple neutron evaporation.
an effective tool to reach the dripline in this region (see also tables 3 and 5). Although it seemspossible that the dripline should reach beyond Z = 80 this is apparently not the case. In orderto populate these very proton-rich heavy nuclei, very symmetric projectile–target combinationshave to be chosen. The Coulomb barrier for these reactions are large, so that it is not possibleto produce these nuclei at excitation energies where none, or only one proton, is evaporated.These excited compound nuclei decay by fission or α-emission. In addition, not all targetprojectile combinations are practical.
3.3. Target spallation
SP was the first method that reached the dripline for nuclei which were not accessible withsimple transfer reactions. Dripline nuclei up to N = 13 (19C) were first observed using SP.
In 1965 Poskanzer et al [51] bombarded a 15N target with 2.2 GeV protons. They were ableto show the existence of 12Be by the (p,4p) reaction. With the development of semiconductordetectors it became possible to identify nuclei directly, without measuring the subsequentdecay [52]. The addition of time-of-flight measurements to the particle identification techniquewith silicon telescopes increased the sensitivity even further. 17C [53], 19N and 21O [54] werefirst observed with this technique.
Another major step forward was the development of online mass spectrometry. Thismethod was especially competitive for alkali metals which could easily diffuse out of heatedgraphite targets [55]. In a series of experiments at ISOLDE sodium isotopes from 27Na up to35Na were observed [55–58].
Although a very important method to produce rare isotopes, SP can compete with fusion-evaporation and PF for the exploration of new nuclei along the dripline in only a very fewspecific cases. More experimental details of SP can be found in [59, 60].

Reaching the limits of nuclear stability 1201
3.4. Deep inelastic reactions
Deep inelastic reactions occur typically in a beam energy range between 5 and 10 MeV/nucleon.The term refers to reactions where the target and projectile exchange a certain number of nuclei.There is not a clear distinction between deep inelastic reactions and fusion-evaporation on onehand and PF on the other. In figures 7 and 8 reactions with energies below 10 MeV/nucleonare considered to be deep inelastic reactions, while those with energies above 35 MeV/nucleonare considered to be PF. The energy regime between these values has not been used to producenew nuclei.
Deep inelastic reactions were first successfully used to explore neutron-rich nuclei fromcarbon to chlorine [61–65].
3.5. Projectile fragmentation
PF, as the next step up in beam energy from deep inelastic reactions, was first used to produceneutron-rich nuclei in 1979 [40]. Beginning in 1985 [66] it was also used to explore the protondripline. Experimental details of this method can be found in [60, 67].
Just like fusion evaporation the success of PF is based on the extremely high level ofsensitivity. In order to identify the most exotic nuclei of interest it is necessary to separatethem not only from the intense primary beam, but also from the large number of other fragmentsthat are produced simultaneously.
Figure 10(a) shows the distribution of fragments following the fragmentation of140 MeV/nucleon 48Ca on a 9Be target. The initial 48Ca intensity is ∼1012 particles persecond. The selection of the isotope of interest is achieved by a magnetic separator locatedimmediately behind the target. Figure 10(b) shows the isotopes transmitted by the separatortuned in this specific case for 31F which is produced only with an intensity of a few nuclei perhour. If the number of overall events are still too large for the rarest events to be observed,an energy-degrading wedge can be inserted in the centre of the separator and a second stageof magnetic separation can reduce the number of unwanted fragments even further as seenin figure 10(c). The rates of figure 10 were calculated with LISE++, a general purposefragmentation code [68, 69].
PF is currently the only mechanism to explore new nuclei at and beyond the neutrondripline and it also has been the dominant production mechanism to push the proton driplinebelow Z ∼ 50 to its present limit.
For a few special cases PF has also been used to populate and study particle unstablenuclei. The decay of 7He, 10Li and 13Be in flight following the production from a 18Obeam was measured by coincidence detection of the emitted neutron and the fragment[70–72].
3.6. Pion exchange reactions
In a few special cases pion double charge exchange reactions were used to observe nuclei forthe first time. For example 28S and 40Ti were populated by the reactions 28Si(π+, π−)28S and40C(π+, π−)40Ti [73].
Similar to transfer reactions, pion charge exchange reactions can also be used to studyunbound nuclei, because the energy levels of the product nucleus is deduced from theenergy-loss spectrum of the π− ejectile. States of unbound 9He [74] and most recently 6H [75]were observed with this technique.

1202 M Thoennessen
Figure 10. Production of dripline nuclei using fragmentation of 48Ca: (a) intensity distribution ofall produced secondary fragments, (b) nuclei selected following magnetic separation, (c) additionalpurification of 31F using a second stage separation.
(This figure is in colour only in the electronic version)
3.7. Fission of fast beams
Figure 7 shows that the first observation of the neutron-rich calcium isotopes 54–56Ca wasachieved by fission of fast beams [76]. In this experiment, a total of 58 new nuclei wereproduced in the projectile fission (FI) of 750 MeV/nucleon 238U. The new nuclei ranged fromcalcium (56Ca) to silver (127Ag) with A/Z ratios of up to 2.8. However, the dripline in thismass region is predicted to be significantly further away at about 70Ca and 155Ag or A/Z ratiosof approximately 3.4.
In the near future, it is not anticipated that even this powerful technique of FI will be ableto reach the dripline in this mass region.
3.8. Reactions with rare isotopes
With the increasing intensities of rare isotope beams, produced either by the ISOL method orby PF, it has become feasible to use these beams for secondary reactions.

Reaching the limits of nuclear stability 1203
For example elastic and inelastic scattering [77], Coulomb excitation [78, 79], transfer[77,80,81], knock-out [21] and most recently secondary fragmentation [82] have been used tostudy properties of neutron- and proton-rich nuclei. Except for the secondary fragmentation,the references refer to reviews of the topics. The intensities of rare isotope beams are, at present,not sufficient to use these reactions to explore the dripline themselves, with the exception ofthe very lightest elements.
In the lightest mass region, however, reactions with rare isotopes already play an importantrole in the study of unbound nuclei. For example, resonances in 7H and 10He were first observedwith single charge exchange reactions [83,84]. In addition, single proton knock-out reactionsconfirmed that 16B [85] and 25O [86] are unbound.
On the proton-rich side, single neutron knock-out reactions populated the unbound nuclei12O [87], 11N [88] and 19Mg [89]. More complicated transfer reactions populated 18Na and19Na [89]. In addition, elastic resonance scattering of rare isotopes was used to determineground-states as well as excited states in the unbound nuclei 11N [90,91], 15F [92] and 19Na [93].
4. Proton dripline
The proton dripline has been studied since the beginning of nuclear reactions, because it ismuch closer to the valley of stability than the neutron dripline. For 4,5Li the proton driplineis located right next to the stable isotopes of 3,4He and 6Li. In addition, as shown in figure 9,fusion evaporation reactions always populate proton-rich nuclei making the proton driplinemore accessible than the neutron dripline. By 1987 all the nuclei on the proton-rich side thatwere expected to be particle-stable up to Z = 23 (vanadium) had been observed. Today, thedripline has been reached for all odd Z nuclei up to Z = 91. Bound nuclei that have yet tobe discovered are limited to even Z nuclei in the regions from Z = 32 through Z = 64 andfor Z � 82. As mentioned earlier, only those nuclei which have been reported in refereedpublications are included in the present review.
Although nuclei at and beyond the dripline have been observed for almost all the elements,it is surprising that the actual location of the dripline is known for only a few elements. Aswas discussed in section 2.3 the experimental determination of the proton dripline involvesthe measurement of several masses in the vicinity of the dripline. With extrapolations andinterpolations from known masses and decay energies the proton dripline is probably fairlywell predicted, but purely experimentally the dripline has only been determined up to Z = 12(magnesium), and then again only for a few elements, for example scandium, lutethium andtantalum.
4.1. Light mass nuclei: Z � 20
The proton dripline was reached up to sodium (Z = 11) already by 1960. Table 1 liststhe reactions populating the most neutron-deficient isotopes for heavier elements. They aremost probably the limit of isotopes with lifetimes longer than a millisecond. The significantshorter lifetimes of the unbound isotopes have been determined for 7B [46], 8C [42], 10N [100],11N [101], 12O, 15F, 16Ne [102], 19Na [47] and 18Na [89]. 15F was reported simultaneouslyin [103].
For 19Mg [104] and 21Al [95] upper limits of the lifetime were measured. Although notexplicitly stated in figure 3 of [97] it can be concluded that 25P, 29,30Cl and 33,34K are beyondthe proton dripline and have lifetimes shorter than the time-of-flight of 170 ns. However, thisis not true for the even-Z nuclei 26S, 30Ar and 34Ca. As stated in [97]: ‘The steepness of thevalley of β stability on the proton-rich side and some remaining background events do preclude

1204 M Thoennessen
Table 1. Lightest observed bound isotopes, at present, for 12 � Z � 20. The production reaction,laboratory and reference of the first observation are listed.
Z Isotope Method Laboratory Reference
12 20Mg 24Mg(4He,8He) Julich [42]13 22Al 24Mg(3He,p4n) LBL [94]14 22Si Ni(36Ar,X) 85 MeV/u GANIL [95]15 26P 28Si(3He,p4n) LBL [96]16 27S Ni(40Ca,X) 77.4 MeV/u GANIL [97]17 31Cl 36Ar(3He,8Li) MSU [98]18 31Ar Ni(40Ca,X) 77.4 MeV/u GANIL [97]19 35K 40Ca(3He,8Li) MSU [99]20 35Ca 40Ca(3He,α4n) LBL [66]
Figure 11. Nuclei at and beyond the proton dripline for Z � 20.
any definite statement as to the non-observation of a given isotope’. Also, 21Si has not beenexplored at all.
Figure 11 shows all nuclei close to and beyond the proton dripline. The black squares arestable nuclei and the dark-grey squares show all bound observed nuclei. The circled light-greysquares are unbound nuclei where spectroscopic measurements have been performed. For thelight-grey squares upper limits on the lifetime have been reported. The thick solid line showsthe measured dripline. The dripline is shown as a dashed line for elements where it has beenpredicted but not explicitly measured.
The proton dripline is well established up to magnesium. The uncertainties for the odd-Znuclei begin with 22Al and 26P (striped squares). The latest mass evaluation [105] quotes proton

Reaching the limits of nuclear stability 1205
separation energies of 17±95 keV and 140±196 keV for these two nuclei, respectively. Thusit is not clear on which side of the dripline these nuclei are located.
The situation for the even-Z nuclei is different. Although 22Si and 31Ar (dashed squares)are predicted to be bound with respect to one-proton emission, the two-proton separationenergies, defined as
S2p = M(Z − 2, N) + 2MH − M(Z, N) (5)
are calculated to be −16 ± 202 keV (22Si) and 126 ± 212 keV (31Ar). Thus they are possiblecandidates for di-proton decay. This exotic decay has been predicted already in 1960 [22] andattempts to observe it have been performed in many different systems [13] (see also section 4.6).In the case of 22Si and 31Ar the searches were unsuccessful because, even if these nuclei areunbound with respect to two-proton emission, the decay energy is too small, and thus thelifetimes too long to be able to compete with β-decay.
It should be mentioned that the search for the di-proton decay in this mass region belowZ � 12 has concentrated on larger decay energies. These decays then do not compete withβ-decay but the corresponding lifetimes are so short that they cannot be measured with directtechniques. First evidence for the possible observation of di-proton emission has been reportedin this mass region for the decay of an excited state of 18Ne [106].
The proton dripline exhibits also changes in the shell structures which is a strong effectat the neutron dripline. The Z = 8 closed shell disappears for highly proton-rich nuclei. Thelast proton of 11N does not populate the 1p state as expected in the normal shell model, butrather the 2s state. This level inversion has first been observed in the mirror nucleus 11Be (seesection 5.1). The existence of 22Si is due to the emergence of the new shell at Z = 14 fornuclei located far away from the valley of stability. These effects are less pronounced at theproton dripline relative to the neutron dripline because the proton dripline occurs closer to thevalley of stability.
4.2. Medium mass nuclei I: 20 < Z � 50
Initially the proton dripline in this mass region was approached with fusion evaporationreactions starting in the early 1970s, however, the available stable target projectile combinationsare not ideally suited to reach the dripline (see figure 9). With a few exceptions the nucleiat and beyond the dripline were produced with PF. Table 2 lists the most neutron-deficientisotopes observed at present.
In this mass region nuclei beyond the dripline begin to have significant lifetimes to survivefragment separator flight times. The Coulomb barrier for proton emission becomes sufficientlylarge, so that for nuclei with small decay energies β-decay can compete with proton emission.If the nuclei decay by proton emission the lifetimes can be long enough to qualify as protonradioactivity (see discussion in section 2.2). Till now no proton emitter has been observed inthis mass region. However, most recently, evidence for two-proton radioactivity was reportedin the decay of 45Fe [124, 125] (see also section 4.6).
Figure 12 shows the nuclei along the proton dripline for nuclei with 20 < Z � 50. Thenotations in the figure are different from figure 11. The valley of stability is not shown. Thedark-grey squares are nuclei which have been observed with lifetimes longer than ∼1 µs [126].
Lifetime limits for nuclei beyond the dripline (light-grey squares) were determined for38Ti [35], 42V, 44,45Mn [34], 49Co, 54Cu [127], 73Rb [36], 81Nb and 85Tc [119]. In addition,reference [126] adopted a lifetime limit of <1.2 µs from the data of [37] for 68Br and 72Rb.
The only element for which the dripline has been experimentally determined is scandium,for which it is located between 39Sc and 40Sc (doubled black line). 39Sc (circled light-grey

1206 M Thoennessen
Table 2. Lightest observed isotopes, at present, for 20 < Z � 50. The production reaction,laboratory and reference of the first observation are listed.
Z Isotope Method Laboratory Reference
21 39Sc 40Ca(7Li,8He) MSU [107]22 39Ti Ni(58Ni,X) 65 MeV/u GANIL [108]23 43V Ni(58Ni,X) 55 MeV/u GANIL [109]24 42Cr Be(58Ni,X) 600 MeV/u GSI [35]25 46Mn Ni(58Ni,X) 55 MeV/u GANIL [109]26 45Fe Be(58Ni,X) 600 MeV/u GSI [35]27 50Co Ni(58Ni,X) 55 MeV/u GANIL [109]28 48Ni Ni(58Ni,X) 74.5 MeV/u GSI [110]29 55Cu Ni(58Ni,X) 55 MeV/u GANIL [109]30 55Zn Ni(58Ni,X) 74.5 MeV/u GANIL [111]31 60Ga Ni(78Kr,X) 73 MeV/u GANIL [37]32 61Ge 40Ca(24Mg,3n) LBL [112]33 64As Ni(78Kr,X) 73 MeV/u GANIL [37]34 65Se 40Ca(28Si,3n) LBL [113]35 70Br 58Ni(14N,2n) BNL [114]36 69Kr Ni(78Kr,X) 73 MeV/u GANIL [37]37 74Rb Nb(p,4pxn) 600 MeV CERN [115]38 73Sr 40Ca(36Ar,3n) LBL [116]39 76Y Be(112Sn,X) 1 GeV/u GSI [117]40 78Zr Be(112Sn,X) 1 GeV/u GSI [117]41 82Nb 58Ni(92Mo,X) 70 MeV/u MSU [118]42 83Mo Ni(92Mo,X) 60 MeV/u GANIL [119]43 86Tc 58Ni(92Mo,X) 70 MeV/u MSU [118]44 87Ru Ni(112Sn,X) 63 MeV/u GANIL [120]45 89Rh Ni(112Sn,X) 63 MeV/u GANIL [120]46 91Pd Ni(112Sn,X) 63 MeV/u GANIL [120]47 94Ag Ni(106Cd,X) 60 MeV/u MSU [121]48 97Cd Sn(p,3pxn) 600 MeV CERN [122]49 98In Ni(112Sn,X) 63 MeV/u GANIL [120]50 100Sn Be(124Xe,X) 1095 MeV/u GSI [123]
square) is also the only nucleus beyond the dripline in this region whose mass has beenmeasured [107].
The thick solid line in the figure corresponds to the dripline extrapolated from the latestmass evaluation [105]. The striped squares show nuclei where the uncertainty of the calculatedseparation energy is too large to determine if the nucleus is bound or unbound. With theexception of strontium, the predictions for the even-Z nuclei between krypton and palladiumdo not extend beyond the dripline. The dashed line indicates the limit of the last calculatedisotope, which does not necessarily have to correspond to the last bound isotope.
Experimentally, the dripline has most likely been reached for all odd-Z nuclei in this massregion. The lightest nucleus that potentially can still be bound and has not yet been observedis 60Ge. It has a predicted two-proton separation energy of 48 ± 238 keV [105]. For even-Znuclei beyond strontium the dripline has, most probably, not yet been reached experimentally.
4.3. Medium mass nuclei II: 50 < Z � 82
The lifetimes for proton emission in this mass region are becoming so large for a wide rangeof energies that β-decays dominate for many unbound isotopes. For some elements there

Reaching the limits of nuclear stability 1207
Sc
MnCrV
Ti
NiCo
Fe
BrSe
AsGe
Ga
YSr
RbKr
RhRu
TcMo
Nb
InCd
AgPd
observed
unbound - limit
measured dripline
unknown
calculated dripline
calc. uncertain
Zn
unbound - observed
Zr
Snpr
oton
s
neutrons
50
20
30
40
20 30 40 50
A = 80
Cu
A = 50
A = 60
A = 70
A = 90
Figure 12. Nuclei at and beyond the proton dripline for 20 < Z � 50.
are 3–4 β-emitting isotopes before the proton separation energies become large enough forproton emission to compete with β-decay. Table 3 lists the lightest observed isotopes in thismass region and the reactions with which they were first observed. With the exception ofZ = 51, all of them have been produced in fusion-evaporation reactions. The table also liststhe primary decay mode.
Figure 13 shows again the nuclei along the proton dripline. The notation is the same as infigure 12. With the exception of even-Z nuclei between cerium and hafnium the dripline hasmost probably been reached for all nuclei. The solid line again shows the extrapolated driplinederived from the AME2003 atomic mass evaluation [105], the dashed line is used for nucleiwhere the extrapolation does not extend towards the dripline. Experimentally, the driplinehas only been determined for lutetium, tantalum and gold (double black line). In addition,for thallium the dripline could be either between 181Tl and 182Tl or between 182Tl and 183Tlbecause the measured proton separation energy is −21 ± 77 keV for 182Tl [105].
The surprisingly large uncertainty of the location of the dripline in this mass regiondemonstrates the fact that there is no easy signature for the dripline. The fairly shallowreduction of the separation energy as a function of isotopes requires high resolution massmeasurements. For example, table 4 lists the proton separation energies for neutron-deficientholmium isotopes [105]. The separation energies for 142–146Ho have to be extracted frommass measurements and extrapolations with uncertainties of hundreds of keV. In contrast, thedirect observation of the proton emission of 141Ho [152] and 140Ho [139] allows an accuratedetermination of the separation energy.
The observation of ground-state proton emitters which were first discovered in this massregion [153] is thus a great spectroscopic tool. However, in terms of the dripline, the discovery

1208 M Thoennessen
Table 3. Lightest observed isotopes, at present, for 50 < Z � 82. The production reaction,observed decay, laboratory and reference of the first observation are listed.
Z Isotope Reaction Decay Laboratory Reference
51 103Sb Ni(112Sn,X) 63 MeV/u — GANIL [120]52 106Te 58Ni(58Ni,2p4n)110Xe(α) α GSI [128]53 108I 54Fe(58Ni,p3n) α Daresbury [129]54 110Xe 58Ni(58Ni,2p4n) α GSI [128]55 112Cs 58Ni(58Ni,p3n) p Daresbury [130]56 114Ba 58Ni(58Ni,2n) β GSI [131]57 117La 64Zn(58Ni,p4n) p Legnaro [132]58 121Ce 92Mo(32S,3n) β Lanzhou [133]59 121Pr 96Ru(32S,p6n) β Dubna [134]60 125Nd 92Mo(36Ar,3n) β Lanzhou [135]61 128Pm 96Ru(36Ar,p3n) β Lanzhou [135]62 129Sm 96Ru(36Ar,3n) β Lanzhou [135]63 130Eu 58Ni(78Kr,p5n) p ANL [136]64 135Gd 106Cd(32S,3n) β Lanzhou [137]65 139Tb 106Cd(36Ar,p2n) β Lanzhou [138]66 139Dy 106Cd(36Ar,3n) β Lanzhou [135]67 140Ho 92Mo(54Fe,p5n) p HRIBF [139]68 144Er 92Mo(58Ni,p4n)145Tm(p) — HRIBF [140]69 145Tm 92Mo(58Ni,p4n) p HRIBF [141]70 149Yb 112Sn(40Ca,3n) β Lanzhou [142]71 150Lu 96Ru(58Ni,p3n) p Daresbury [143]72 154Hf 106Cd(58Ni,2p4n)158W(α) α GSI [144]73 155Ta 102Pd(58Ni,p4n) p ANL [145]74 158W 106Cd(58Ni,2p4n) α GSI [144]75 160Re 106Cd(58Ni,p3n) p Daresbury [146]76 162Os 106Cd(58Ni,2n) α GSI [147]77 164Ir 92Mo(78Kr,p5n) p ANL [136]78 166Pt 92Mo(78Kr,4n) α ANL [148]79 170Au 96Ru(78Kr,p3n) p ANL [136]70 172Hg 96Ru(78Kr,2n) α ANL [149]81 177Tl 102Pd(78Kr,p2n) p,α ANL [150]82 180Pb 144Sm(40Ca,4n) α LBL [151]
of proton emitters only establishes that these nuclei are beyond the dripline. The actual locationof the dripline has to be determined from mass measurements which are significantly moredifficult.
With the recent developments in different mass measurement techniques [154, 155] andthe application of digital pulse processing [140] to access even shorter lived proton emittersthe proton dripline for at least the odd-Z nuclei should be determined in the near future.
Table 4 also indicates another interesting phenomenon, i.e. the possibility that the driplineis not continuous within an isotope chain. 145Ho could be unbound with 144Ho being boundagain. This is similar to the case of 9B.
4.4. Heavy nuclei: 83 � Z
This mass region is dominated by α emitters and so far no ground-state proton emitters havebeen observed. Again all nuclei are populated by fusion-evaporation reactions. Table 5 showsthe lightest observed isotopes and the reaction with which they were first observed. It should

Reaching the limits of nuclear stability 1209
Figure 13. Nuclei at and beyond the proton dripline for 50 < Z � 82.
Table 4. Proton separation energies for neutron-deficient holmium isotopes.
Isotope Sp (keV)
140 −1094 ± 10141 −1177 ± 7142 −554 ± 585143 −390 ± 540144 +163 ± 357145 −113 ± 300146 +568 ± 201
Table 5. Lightest observed isotopes, at present, for 82 < Z < 98. The production reaction,laboratory and reference of the first observation are listed.
Z Isotope Reaction Laboratory Reference
83 184Bi 93Nb(94Mo,3n) GSI [156]84 188Po 142Nd(52Cr,6n) GSI [157]85 191At 141Pr(54Fe,4n) JYFL [158]86 195Rn 142Nd(56Fe,3n) JYFL [159]87 199Fr 169Tm(36Ar,6n) RIKEN [160]88 202Ra 170Yb(36Ar,4n) JYFL [161]89 206Ac 175Lu(36Ar,5n) JYFL [162]90 209Th 182W(32S,5n) JAERI [163]91 212Pa 182W(35Cl,5n) JAERI [164]92 217U 182W(40Ar,5n) JINR [165]93 225Np 209Bi(20Ne,4n) JINR [166]94 228Pu 208Pb(24Mg,4n) JINR [167]95 230Am 197Au(40Ar,3n)234Bk(α) RIKEN [168]96 233Cm 198Pt(40Ar,5n) GSI [169]97 234Bk 197Au(40Ar,3n) RIKEN [168]

1210 M Thoennessen
Figure 14. Nuclei at and beyond the proton dripline for 82 < Z < 98.
be mentioned that proton radioactivity has been observed in this mass region from an intruderstate in 185Bi [170]. Also, the observations of the two heaviest isotopes 233Cm and 234Bk havebeen made only very recently [168,169] and are the only nuclei included in the present reviewwhich have not yet been published in a refereed journal.
Figure 14 shows nuclei along the dripline up to Z = 97. As in figure 11 the solid linecorresponds again to the experimentally determined dripline. The dripline has been reachedfor all odd-Z nuclei up to protactinium. The location of the dripline for even-Z nuclei is stillunknown. The extrapolations [105] (dashed line) for these nuclei do not extend to negativeseparation energies and the dripline is most likely located towards even more neutron-deficientisotopes.
In contrast to the medium mass regions, the dripline for odd-Z nuclei is experimentallyknown in this mass region because most of these nuclei decay by α-emission. The accuratelymeasured α-decay energy can be linked to more stable nuclei where high resolution massmeasurements are possible.
With the possibility that 194At might be bound by 117 ± 189 keV (striped square), 195Atcould be an unbound nucleus (Sp = −234 ± 15 keV) surrounded by bound nuclei.
For nuclei beyond uranium, the dripline is out of reach for all nuclei. However, it shouldbe mentioned that in the region of the superheavy nuclei (Z > 110) the produced nuclei areagain closer to the dripline [171].
4.5. Predictions of the proton dripline
The location of the driplines is directly related to the nuclear masses determined by equations (4)and (5). A recent review compared the predictive power of the commonly used global massmodels in detail [155]. Thus the different models will not be discussed here and only a fewrepresentative models will be compared to demonstrate the theoretical uncertainties in theprediction of the proton dripline. It should be mentioned that the dripline can be calculatedfairly accurately from the binding energies of analogous neutron-rich nuclei and Coulombenergy shifts [172]. However, this method can only be applied in mass regions (Z � 30)where the binding energies of the analog nuclei are well known.
Figure 15 shows the deviations of the empirical model based on p–n interaction byTachibana et al [18], the finite-range droplet model (FRDM) [173] and the Hartree–Fock–Bogolyubov model (HFB-2) [174] from the extrapolated masses of the AME2003 atomicmass evaluation [105]. The agreement of the three models is quite good over the whole chart

Reaching the limits of nuclear stability 1211
Figure 15. Difference of the calculated location of the dripline for odd-Z (top) and even-Z(bottom) nuclei between the extrapolation by the recent mass evaluation NAME [105] and the threemass models indicated in the figure.
of nuclei. The figure shows the deviations for the odd-Z (top) and the even-Z (bottom) nucleiseparately.
With a few exceptions the dripline for odd-Z nuclei is reproduced within one neutron up totin. Even beyond tin up to lutetium the deviations are not more than two neutrons. Consideringthat the uncertainty of the extrapolated dripline in this region can be as large as four neutrons(see table 4) these deviations are probably not significant. The mean standard deviation of themodels for known masses is of the order of a few hundred keV [155].
The calculations seem to be even better for the even-Z nuclei. Neither of the modelsdeviates by more than two neutrons all the way up to lead. With the exception of theHFB-2 model in the heavy mass region, most of the deviations are towards negative valueswhich is due to the fact that for many of the even-Z isotopes the mass evaluation does notextrapolate to negative separation energy. This suggests that the predictions of these modelsare probably correct and that the dripline is actually located at even more neutron-deficientisotopes.

1212 M Thoennessen
Figure 16. One-proton (· · · · · ·) and two-proton (——) separation energies for N = 19 isotones(top). Decay scheme for the potential two-proton emitter 45Fe (bottom).
Even the large deviation of 4–6 neutrons beyond lead are most probably due to the limitedextrapolation. Figure 2 of [175] shows that the known two-proton separation energies foreven–even nuclei in this mass region do not extend to the proton dripline.
4.6. Exotic decay modes
Ground-state two-proton radioactivity has been predicted already in 1960 [22]. This decaycan occur in even-Z nuclei beyond the proton dripline where the pairing energy between thelast two protons causes the one-proton decay channel to be energetically forbidden or at leaststrongly hindered. The emission of the two protons can theoretically proceed through severalmechanisms [176, 177]. The simultaneous correlated emission of a ‘di-proton’ competeswith the direct three-body breakup and the sequential binary decay if energetically possible.Searches for short-lived ground-state ‘di-proton’ emitters in the light mass region as well asfor real two-proton radioactivity in medium mass nuclei have been unsuccessful [13] untilrecently.
Several theoretical calculations predicted that the best candidates for two-protonradioactivity were 45Fe, 48Ni and 54Zn [20, 172, 178]. Finally, in 2002, over 40 years afterthe initial prediction, evidence for this exotic decay was reported for 45Fe [124, 125].
Figure 16 shows the one-proton and two-proton separation energies for the N = 19isotones (top) and the relations between 45Fe, 44Mn and 43Cr (bottom) as calculated within

Reaching the limits of nuclear stability 1213
HFB-2 [174]. The figure shows that the pairing effect is responsible for the possible occurrenceof two-proton radioactivity. While the decrease of the two-proton separation energy towardsthe dripline is smooth, the one-proton separation energy is larger for even-Z nuclei comparedto odd-Z nuclei towards the dripline. When the crossing of Sp and S2p occurs at the driplinethe nucleus (45Fe) is bound with respect to one-proton emission but unbound with respect totwo-proton emission.
The recent experiments did not observe the individual protons, so that the exact decay modeof 45Fe is not clear. In order to rule out direct three-body breakup, the angular correlation ofthe two emitted protons has to be measured. The sequential emission of two protons dependscritically on the one-proton separation energy of 45Fe. In all previous two-proton emissionexperiments where intermediate states were energetically allowed, no evidence for correlatedemission was observed [87, 106, 179–181].
The one-proton separation energy of 180 keV shown in figure 16 seems to indicate that for45Fe the sequential decay channel is not open. The AME2003 [105] quotes a similar value of110 keV, however, it has a large uncertainty of 550 keV. The more detailed calculations predictthe single proton separation energy to be between −24 keV and 10 keV [20, 172, 178]. Evenif 45Fe is unbound with respect to one-proton emission, the very small decay energy wouldlead to an extremely long lifetime for this decay mode. Thus, 45Fe is an ideal case to finallyobserve di-proton emission.
Two-proton radioactivity is so rare and hard to observe because the energy window israther small. It is a delicate balance between a decay energy which is too high, leading to anunobservable fast decay on the one hand, and a too low decay energy, making the decay so slowthat it cannot compete with β+ emission. In addition to the efforts in the Fe/Ni region, thereis, currently, significant interest in the potential two-proton emission of 19Mg [89, 104, 182].
Since it took over 40 years to observe two-proton radioactivity, one might speculate thateven more exotic decays could exist and could be observed eventually. As an example, figure 17shows the one-, two-, three- and four-proton separation energies of the N = 105 isotones (top)and the relations between the decay energies of 191Rn, 190At, 189Po, 188Bi and 187Pb (bottom)as calculated with the HFB-2 model. In addition to the pairing effect influencing the one-and three-proton separation energies, the two-proton separation energy is predicted to increasefor 191Rn and 192Fr. Thus, for 191Rn, the one-, two, and three-proton separation energies arepositive, while the four-proton separation energy is negative. This could potentially result inan emission of a four-proton cluster. This particular case is unrealistic because already 188Bihas been measured to be an α emitter and the two-proton separation energy of 189Po is positive.However, figure 17 demonstrates that the interplay of the different nuclear forces can lead tosurprising results for the multi-proton separation energies and in the region well beyond thedripline very exotic decay modes might exist.
Even if the emission of a four-proton cluster is very unlikely, the sequential emissionof two or more protons similar to the α-decay chains could become observable once even-Znuclei significantly beyond the proton dripline become accessible.
5. Neutron dripline
The first exotic nucleus observed on the neutron-rich side was 16C [183] with a (t,p) reactionon a radioactive 14C target. An exotic nucleus is defined here as a nucleus that is more thanone proton or neutron away from the valley of stability.
Figure 18 shows the chart of nuclei for stable and neutron-rich nuclei up to calciumZ = 20. Stable nuclei are shown in black, bound nuclei in dark-grey and unbound nuclei inlight-grey. For the circled light-grey unbound nuclei spectroscopic measurements have been

1214 M Thoennessen
Figure 17. One- (— · —), two- (- - - -), three- (· · · · · ·) and four-proton (——) separation energiesfor N = 102 isotones (top). Decay scheme for the potential two- (189Po), three- (190At), andfour-proton emitter (191Rn) (bottom).
performed. The experimentally determined dripline is shown by the thick black line. Thedashed line shows the most probable location of the dripline, but which has strictly speakingexperimentally not been confirmed. The dashed squares are nuclei which could be either boundor unbound based on the uncertainties of the AME2003 extrapolations [105]. The grey lineshows the dripline as predicted by the mass model of Tachibana et al [18].
In the present review only nuclei up to Z = 20 (calcium) will be discussed, becausebeyond calcium the dripline diverges significantly from the reach of current accelerators.
Following the usual description of the neutron dripline in terms of elements, it is commonlybelieved that the neutron dripline has been reached for all elements up to oxygen. The lastdripline nucleus is 24O which was already discovered in 1970 [63]. If it turns out that 31F isthe last stable fluorine isotope [184], it will have taken almost 30 years to push the driplinelimit from Z = 8 to Z = 9.
However, the observation of a certain isotope is not sufficient to determine the locationof the dripline. In addition it is necessary to prove that the next isotope is unbound and thusbeyond the dripline. If the neutron dripline is discussed in terms of elements even this is notsufficient. In order to show that 24O represents the dripline, it had to be shown that 25O [29],26O [31] and even 28O [185], which had been predicted to be bound due to the shell effects,are unbound.

Reaching the limits of nuclear stability 1215
Figure 18. Nuclei at and beyond the neutron dripline for Z � 20.
As mentioned in section 2.4 it is more appropriate to discuss the neutron dripline in termsof isotones, just like the proton dripline was discussed in terms of isotopes.
5.1. Isotones with N � 8
According to the above definition, the first exotic dripline nucleus observed was 8He [186].With a neutron to proton ratio of 3, 8He can also be considered the most neutron-rich boundnucleus. The location of the dripline was then established for the isotones 4 � N � 8with the ‘non-observation’ of 5H [27], 7He [52], 7H [187], 10Li and 10He [52]. With thedripline so close to the valley of stability, spectroscopic measurements were also performedfor these nuclei. From the width of the measured resonances lifetimes of >1.3 zs (5H, [188]),4.4 zs (7He, [189]), 0.022 zs (7H, [83, 126]), >2.9 zs (10Li, [190]) and 3.9 zs (10He [84]) wereextracted (1 zs = 10−21 s). With the exception of 7H these nuclei have lifetimes which are longcompared to the nuclear timescale (∼10−22 s) and should be considered nuclei. The resonanceparameters for 5H are still controversial [191, 192]. The lifetime for 7H of 2.2 × 10⁻²³ s wasextracted from an estimated peak width of 20 MeV [126] and was not quoted in the originalpaper [83]. Within the present definition of a nucleus 7H certainly does not qualify.
Spectroscopic measurements were even performed on 6H [75, 193] and 9He [74, 194].In addition to 4H [192] these are presently the only measured nuclei within an isotone chainwhich are removed from the dripline by two nucleons.
The discussion on whether these extremely short-lived nuclei can be viewed as nuclei atall has to address another issue concerning unbound nuclei beyond the neutron dripline. Inabsence of the Coulomb barrier, the only force holding an unbound neutron to the nucleus isthe centrifugal force due to the angular momentum. For nuclei between 2 < N � 8 the lastneutron should fill the p shell, i.e. have an angular momentum of one. The angular momentumbarrier for an l = 1 neutron and a decay energy smaller than ∼1 MeV results in lifetimes ofthe order of 10−21 s (see also figure 5).
However, already in 1960 Talmi and Unna [195] explained the spectrum of 11Be by aninversion of the 1p shell with the 2s shell. This level inversion is not an isolated occurrence

1216 M Thoennessen
Table 6. Last bound and first unbound isotones along the neutron dripline for 8 < N � 20.The nuclei are produced by target spallation (SP) or projectile fragmentation (PF). The productionreaction and reference of the first observation are listed.
N Last Bound Reaction Reference First Unbound Reaction Reference
9 14B SP [52] 13Be SP [53]10 14Be SP [32] — — —11 17C SP [53] 16B SP [32]12 17B SP [32] 16Be PF [201]13 19C SP [202] 18B PF [203]14 19B PF [203] — — —15 22N PF [204] 21C PF [29]16 22C PF [205] 21B PF [206]17 26F PF [204] 25O PF [29]18 27F PF [28] 26O PF [31]19 29Ne PF [29] 28F PF [184]20 29F PF [200] 28O PF [185]
but continues for N = 7 isotones beyond the dripline [70, 194, 196]. The unbound neutronin the ground-state of 10Li and 9He is in the s shell and has zero angular momentum. Thus,there is no barrier which prevents the neutron from being emitted. The definition of a lifetimebased on the width of a resonance is not valid anymore. These nuclei can only be describedas scattering states, or virtual resonances.
The most famous dripline nucleus is probably 11Li. The initial assumption that itwas unbound lead to a misidentification of 12Be [51]. 11Li, together with 14,15B was firstobserved in a spallation reaction [52]. The lifetime of 8.5 ± 1 ms was first measuredin 1969 [56]. However, it was the observation of its unexpected neutron halo structure[197] that sparked the tremendous interest in the field of exotic nuclei. The structure andnature of the halo in 11Li has since been studied extensively (see, e.g. [198] and referencestherein).
Following the observation of 11Li as a two-neutron halo, many other neutron-rich nucleifor example 12,14Be and 19C have been identified as two-neutron halos (see [11]). 14Be caneven be viewed as a four-neutron halo with a 10Be core. The breakup of 14Be into 10Be andfour neutrons has been measured and resulted in the surprising evidence for the observation ofa four-neutron cluster structure [199].
5.2. Isotones with 8 < N � 20
Initially the dripline was first explored with proton spallation reactions, however, starting fromN = 14, PF is essentially the only method to explore the dripline. Table 6 shows the nucleiat and beyond the dripline together with production mechanism of the first observation, ornon-observation. Although 28F was stated as being unbound in [200] it was not explicitlyshown. However, later it was confirmed that 28F is indeed beyond the neutron dripline [184].13Be is at present the heaviest neutron unbound nucleus where spectroscopic information hasbeen measured [72].
As can be seen from table 6, the dripline has not been unambiguously measured forN = 10. Although not observed in the data of [32, 202], the authors could not conclusivelydetermine that 13Li was unbound. Thus, strictly speaking, the neutron dripline has only beenestablished up to N = 9. Again, at N = 14, the non-existence of 18Be has not been shown.However, extrapolations of the existing surrounding nuclei make it very unlikely that either of

Reaching the limits of nuclear stability 1217
these two nuclei (13Li, 18Be) are bound. Otherwise the neutron dripline has been mapped verywell in this mass region.
The most interesting feature of the dripline in this mass range is the change of the shellstructures. The inversion of the p and s shell for the ground-states of the N = 7 isotonesclose and beyond the dripline reflects the disappearance of the N = 8 shell gap. It was a firstindication that the classical shell structure derived from properties of nuclei along the valleyof stability changes significantly for neutron-rich nuclei.
The disappearance of the N = 20 shell at the dripline is responsible for the fact thatthe otherwise double magic nucleus 28O is unbound. Even 26O is not bound. It should bementioned that as early as 1970 it was predicted that, contrary to other calculations [207,208]24O should be the last particle stable oxygen isotope [63].
The first evidence of the unbound character of 26O was reported in 1990, however, thesame measurement also concluded that 31Ne would be unstable [31]. In 1996 it was confirmedthat 26O was indeed unbound [209].
The question of the instability of the 26O and 28O resulted in a detailed survey of thismass region. For the three isotones 17 < N < 19 the instability of nuclei with two neutronsaway from the dripline was reported with 24N [205], 25N, and 27O [184]. Indications for theinstability of 27O [185] had been reported in the search for 28O.
Connected with the disappearance of the N = 20 shell gap is the appearance of a new gapat N = 16. A survey of neutron separation energies, in addition to other evidence, showedclearly the emergence of a new shell gap for oxygen isotopes at N = 16 [210]. In a plot oftwo-neutron separation energies the shift of the gap from N = 20 to N = 16 can be seen [211].Another indication for the existence of this shell is the fact that N = 16 corresponds to the lastbound nucleus not only for oxygen (24O) but also for nitrogen (23N) and even carbon (22C).It has been speculated that because of this shell gap 21B might be bound. However, a recentexperiment could not find any evidence for the existence of 21B [206].
There are also experimental indications that another gap exists for N = 14 [212]. Theexistence of 19B could be evidence for additional binding due to this gap. However, it alsomight be a motivation to search for the potential existence of 18Be.
The disappearance and appearance of these shells along the neutron dripline can beaccounted for by recent shell model calculations [213]. In the near future more spectroscopicdata of unbound nuclei beyond beryllium should become available, which would solidify theshell model calculations.
5.3. Isotones with N > 20
The dripline for odd-N nuclei has experimentally unambiguously been determined up toN = 27. The heaviest observed dripline nucleus up to date is probably 43Si or maybe even 46P.For even-N nuclei the location of the dripline has not been established beyond N = 20 althoughit is very unlikely that 30O could be bound. Table 7 lists the bound and unbound isotones for20 < N � 36.
The present approach to question the unbound character of 30O seems extreme. However,extrapolations from known properties to predict the location of the dripline are unreliable.For example, the measured very short β-decay half-life of 35Na of 1.5 ms [58], which is theshortest β-decay half-life measured so far, lead to the assumption that 37Na should be unbound.Nevertheless, it was subsequently observed to be bound [214,215]. The mass measurement of41Si [216] corresponds to a negative one-neutron separation energy of −20 ± 1930 keV [105].Although this value is consistent with the observation that 41Si is bound [200], one wouldexpect 43Si to be unbound (−190 ± 860 keV, [105]). However, 43Si is also bound [214].

1218 M Thoennessen
Table 7. Last bound and first unbound isotones along the neutron dripline for 20 < N � 36. Thenuclei are produced by target spallation (SP), projectile fragmentation (PF), or projectile fission(FI). The production reaction and reference of the first observation are listed.
N Last Bound Reaction Reference First Unbound Reaction Reference
21 31Ne PF [33] 30F PF [184]22 31F PF [184] — — —23 34Na SP [58] 33Ne PF [214, 215]24 34Ne PF [214, 215] — PF —25 37Mg PF [33] 36Na PF [214, 215]26 37Na PF [214, 215] — — —27 40Al PF [217] 39Mg PF [214]28 41Al PF [217] — — —29 43Si PF [214] — — —30 45P PF [218] — — —31 46P PF [218] — — —32 48S PF [218] — — —33 51Ar PF [200] — — —34 51Cl PF [218] — — —35 54K SP [58] — — —36 56Ca FI [76] — — —
The question as to where the dripline is located for N = 24 is the same as to where thedripline is located for Z = 9, i.e. is 33F bound or not? If it is bound it would be the first caseon the neutron-rich side where a gap in an isobar chain occurs (33Na is unbound). These gapscertainly do exist for heavier masses along the neutron dripline and it is just a question forwhich mass it occurs for the first time. Along the proton dripline such gaps appear for the firsttime for masses above A = 40.
The next interesting question regarding the location of the dripline in this mass region isthe presence of the N = 28 shell gap. Will the gap persist towards the dripline and influencethe stability of 40Mg and 39Na? Evidence for a weakening of the shell gap has been reportedfor neutron-rich nuclei not located directly at the dripline [216, 219, 220]. Most global massmodels (see, e.g. [18,173,174]) as well as the AME2003 [105] predict 40Mg to be bound. Thenon-observation of 40Mg would thus be additional strong evidence for the weakening of theN = 28 shell at the neutron dripline.
For nuclei beyond the N = 28 shell the dripline may have been reached for some odd-Nnuclei but certainly not for the even-N nuclei. While a few more dripline nuclei will beproduced in the near future, major advances will have to wait for second generation radioactivebeam facilities (see section 7).
5.4. Predictions of the neutron dripline
Since the driplines will not be accessible much beyond N ∼ 28 in the near future the predictionsof the neutron dripline for heavier nuclei by the different mass models can not be tested. Thusthey will be discussed here only briefly.
Figure 19 shows the neutron dripline for the same global models presented for the protondripline: the empirical model by Tachibana et al [18], the FRDM [173] and the HFB-2 [174].In order to show the differences between the models the curves are offset with respect to eachother by their linewidths.

Reaching the limits of nuclear stability 1219
Figure 19. Neutron dripline predicted by the mass models indicated in the figure.
Figure 20. Difference of the calculated location of the first isotope beyond the dripline betweenthe mass model of Tachibana, Uno, Yamada and Yamada (TUYY) and the two other mass modelsindicated in the figure.
The valley of stability on the neutron-rich side is much shallower than on the proton-richside (see figure 3). Thus assuming the same uncertainties in the models the uncertainty of thelocation of the neutron dripline covers a larger range of neutrons.
In order to compare the models more quantitatively, the difference of the FRDM and theHFB-2 from the TUYY model were calculated. A comparison with the AME2003 as wasdone for the proton dripline in figure 15 is not possible because the heaviest extrapolation fora nucleus beyond the neutron dripline is for 49S. First, the differences are shown in the usualdescription of the dripline as a function of Z.
Figure 20 shows deviations of up to 15 neutrons for the location of the dripline which issignificantly worse than the deviations for the proton dripline. However, as has been mentioned

1220 M Thoennessen
Figure 21. Difference of the calculated location of the dripline for odd-N (top) and even-N(bottom) nuclei between the mass model of Tachibana, Uno, Yamada and Yamada (TUYY) andthe two other mass models indicated in the figure.
already before, the location of the dripline as a function of Z is problematic. Because of theodd–even staggering due to the pairing effect it is hard to define the exact location of thedripline. For figure 20 the dripline was defined as the first occurrence of an unbound nucleus.
To be consistent with the proton dripline, the deviations of the neutron dripline betweenthe models should be displayed as a function of N . Figure 21 shows these differences forodd-N (top) and even-N (bottom) nuclei. In this presentation the location of the dripline isfairly well defined. There may be a few exceptions where an unbound nucleus is surroundedby bound nuclei. The effect also can potentially occur on the proton dripline as was mentionedfor example for 145Ho and 194At.
Figure 21 shows surprisingly good agreement between the models. On the average thedeviations are less than 3 protons (note the change of scale relative to figure 20). A largerdeviation between the HFB-2 and the TUYY model occurs close to the N = 126 shell closure.
Thus the differences between the model calculations for the location of the neutron driplineare not as large as is commonly believed.

Reaching the limits of nuclear stability 1221
5.5. Exotic structures and decay modes
Even though the di-neutron is unbound it has been speculated that even larger neutron clustersmight be bound. The existence of an 3n has been reported in 1965 [221] which startedspeculation about the stability of 4n [222].
This discussion was recently started again by an observation of four neutrons in the breakupof 14Be into 10Be. It was claimed that the data were consistent with a four-neutron cluster andall other possible background events were ruled out [199]. However, this observation has notbeen confirmed.
In addition to the search for large neutron clusters, a simple but exotic decay would beneutron radioactivity. In absence of the Coulomb barrier, neutron radioactivity has to rely onthe angular momentum barrier. Even large angular momenta will open up only a narrow energywindow for the unbound nucleus to exhibit significant lifetimes. Unfortunately, larger angularmomentum states at the dripline are populated only in heavier nuclei which are currently andmaybe even in the future out of reach.
Another possibility is the di-neutron decay. The di-neutron decay has the advantageover the di-proton decay, that even for the smallest decay energies the lifetimes will be smallcompared to β-decay lifetimes. The decaying nucleus still has to be bound with respect to one-neutron emission and the width of this intermediate state has to be narrow in order to rule outsequential two neutron emission. The relation between the one- and two-neutron separationenergies and the decay schemes is equivalent to the di-proton emission shown in figure 16.
It might be that already 16Be is a di-neutron emitter. 16Be is extrapolated [105] to bebound with respect to one-neutron emission by 191 ± 711 keV and unbound with respect totwo-neutron emission by −1581 ± 520 keV.
Essentially all of the even-N nuclei along the dripline could be di-neutron emittersdepending of course on the ground-state properties of the intermediate state. All three massmodels chosen as examples for this review predict 42Mg to be a di-neutron emitter [18,173,174].In addition, 33F [18], 36Ne, and 39Na [174] could also decay by emitting a correlated di-neutron.
Of course, if di-neutron emission is possible one can also speculate about the tetra-neutronemission. Even if the free tetra-neutron is not confirmed, the possibility for the emission of acorrelated four-neutron cluster from a neutron-rich nucleus is not excluded. The FRDM doesindeed predict 38Ne and 44Mg to be unbound with respect to four-neutron emission but boundwith respect to one-, two- or three-neutron emission. Although these nuclei are necessarilyfour neutrons beyond the dripline, they might be within reach for future generation facilities.
6. Astrophysical implications
The importance of understanding the nuclei along the driplines for the astrophysical rapidproton capture process (rp-process) and the rapid neutron capture process (r-process) iscurrently one of the most interesting problems in nuclear physics. There are excellentreviews [223, 224] and the details of these processes will not be described here. Actually,in the following it will only been shown that the location of the driplines themselves bear verylittle importance for these processes. This does not mean that the nuclear structure of the nucleiat and even beyond the dripline are not extremely important for the rp- and the r-process.
6.1. rp-process
The rp-process is responsible for powering stellar explosions such as x-ray bursts and followsvery closely the proton dripline. It consists of a combination of radiative proton capture

1222 M Thoennessen
Figure 22. Possible decay schemes involving the rp-process waiting nucleus 68Se, assuming:(a) Sp < 0, (b) Sp = 0, and (c) Sp > 0 for 69Br.
reactions (p,γ ) and β-decays. Waiting points occur when the (p,γ )/β sequence reaches theproton dripline and the last nucleus at the dripline has a long lifetime. The lifetimes of thewaiting point nuclei determine the duration of the rp-process and the shape of the x-ray burstlight curves.
Although very closely related to the rp-process, the exact location of the dripline is notrelevant. Figure 22 shows as an example the situation for the waiting point nucleus 68Se.The figure depicts three different scenarios for the separation energy of 69Br: (a) Sp < 0,(b) Sp = 0, and (c) Sp > 0. In all cases it is assumed that 70Kr is bound with respect to one-and two-proton emission, which is a reasonable assumption for all even-Z nuclei along therp-process path.
If 69Br is unbound, a minimum proton energy (equal to Sp) is necessary in order for thefirst capture reaction to proceed. This initial reaction can either be followed by a secondproton capture populating 70Kr, or the proton can be re-emitted decaying back to 68Se. Theinitial capture cross section decreases with increasing separation energy and the probability todecay back increases as the separation energy increases. Both effects reduce the probabilityof bridging the waiting point by sequential two proton capture.
On the other hand, if 69Br is bound, no minimum energy is required and the direct protoncapture can populate states in 69Br which cannot or are very unlikely to decay back to 68Se.Thus, once captured, 69Br will de-excite to its ground-state where it can capture the secondproton to continue the rp-process to heavier masses.

Reaching the limits of nuclear stability 1223
Figure 23. Stellar lifetime of 68Se as a function of the 69Br proton separation energy Sp (adaptedfrom [223]). The arrows refer to the energy schemes of figure 22.
Sp = 0 is not a singularity and has no special significance as it applies to the stellarlifetime. For low temperatures (T < 2 GK) during the rp-process the total decay width for awaiting point nucleus with proton number Z is given by [223]:
λtotal = λβ(Z) + g(T )eSp/kT < pγ >Z+1 (6)
The overall stellar lifetime of 68Se (τStellar = h/λtotal) in this environment depends on theβ-decay width of 68Se (λβ(Z)) and the proton capture rate on 69Br. g(T ) is a smooth functionof temperature. The most important parameter is the exponential factor.
Figure 23 shows the overall stellar lifetime of 68Se at a temperature of 1.5 GK and adensity of 106 g cm−3. The figure was adapted from the review by Schatz et al [223]. Thethree arrows indicate the location of the three scenarios of figure 22. It is obvious thatthere is nothing special about the point Sp = 0. The overall lifetime of the waiting pointnucleus already begins to decrease while the intermediate nucleus 69Br is still unbound.The actual crossing of the dripline is just an undistinguishable point along the decreasinglifetime.
Nevertheless it is crucial to measure the masses of all three nuclei involved (68Se, 69Brand 70Kr) in order to determine if a particular nucleus (68Se) is a waiting point along therp-process path.
6.2. r-process
The r-process is the equivalent process on the neutron-rich side. It consists of a rapid successionof radiative neutron capture processes until it reaches very neutron-rich nuclei where the(n, γ ) process is in equilibrium with the inverse (γ , n) process, at which point it continues byβ-decay [224–226]. The r-process follows approximately a path along nuclei for which theneutron binding energy is ∼2–4 MeV.
Figure 24 shows a possible r-process path, assuming it follows along nuclei with neutronseparation energies of 3 MeV, for the three different global mass models used as examples inthis review.

1224 M Thoennessen
Figure 24. Location of the r-process assuming a path of nuclei with Sn = 3 MeV as predicted bythe mass models indicated in the figure.
The figure demonstrates the importance of the detailed nuclear structure. The question ofthe disappearance of the standard shell gaps and the possible emergence of new gaps is crucialfor the r-process path. Nuclei with neutron shell gaps are waiting points for the r-processbecause the separation energy for the next isotope beyond the magic number is small andthe lifetimes of the shell gap nuclei are long. If the shell gaps vanish, the waiting pointsdisappear and the path changes significantly resulting in different distributions of the finalabundances [227].
The discussion of the neutron dripline in terms of neutron numbers chosen in this reviewis not adequate for the r-process. The r-process follows isotopic chains by the neutron capturereactions. The balance between (n, γ ) and (γ , n) reactions occurs for nuclei with the same Z.The r-process proceeds by means of β-decay as soon as the neutron separation energy dropssignificantly below 3 MeV (for the current example). Thus, for the r-process a descriptionsimilar to figure 20 instead of figure 21 has to be chosen.
The deviations between the models for the constant Z description was significantly largerthan the constant N description. Figure 25 shows the difference between the models for thelocation along an isotopic chain, where the neutron separation energy drops below 3 MeV forthe first time.
The deviations follow closely the trend of the neutron dripline shown in figure 20, however,although still significant, the magnitude of these deviations is not quite as large as for thedripline. This is due to the fact that obviously Sn = 3 MeV is closer to the valley of stabilitythen Sn = 0 MeV, and the divergences of the mass model extrapolations are smaller.
While the neutron dripline may potentially never be reached in the mass region of ther-process, the r-process path has already been explored for nuclei at the N = 82 shell and it isanticipated that the major part of the r-process path will be mapped with the next generationradioactive beam facilities. The most important nuclear quantities that have to be measuredfor nuclei along the r-process are the masses to determine the neutron separation energies andthe lifetimes.

Reaching the limits of nuclear stability 1225
Figure 25. Difference of the calculated location of the r-process (assuming a path alongSn = 3 MeV) between the mass model of Tachibana, Uno, Yamada and Yamada (TUYY) [18]and the two other mass models indicated in the figure.
7. Future of dripline studies
The present day facilities will not be able to push the knowledge of the driplines much further.Increases of primary beam intensities at PF facilities might discover a few more isotopes atthe proton dripline below Z = 50 and at the neutron dripline for N < 30. The possibleobservation of proton dripline nuclei above Z = 50 using PF [228] could be explored furtherand might compete with fusion evaporation reactions. Improvements of the sensitivity of thefusion evaporation reactions could lead to the observation of a few more new isotopes at theproton dripline above Z = 50.
Significant advances have to wait for the next generation radioactive beam facilities.Many different approaches are currently being pursued, for example the Radioactive Ion BeamFactory at RIKEN [229] and the International Facility at GSI [230] as PF facilities and the nextgeneration ISOL type machine EURISOL [231]. The proposal for the rare isotope accelerator(RIA) in the US combines the two approaches [232].
These new facilities will be able to produce hundreds of new nuclei, most of them towardsthe neutron dripline.
7.1. Proton dripline
It is important to distinguish between observing new nuclei at and beyond the dripline andmeasuring the dripline itself. As was pointed out earlier, the actual location of the protondripline is virtually unknown beyond Z = 12. In order to determine the proton dripline, highresolution mass measurements of the nuclei at and beyond the dripline are necessary. Recentadvances in storage rings [233] and ion traps [234,235] resulted in many new measured massesduring the last few years. Over 300 new masses have been reported since the mass evaluation of1997 [236] and they are included in the most recent NUBASE evaluation [126]. It is conceivablethat the proton dripline for at least the odd-Z nuclei will be mapped experimentally within thenext few years.
The observation of new nuclei beyond the dripline and the determination of the actuallocation of the limit of nuclear existence is probably harder. In the heavy mass region (Z ∼ 80)

1226 M Thoennessen
Figure 26. Reach of the proposed rare isotope accelerator RIA at and beyond the proton dripline.
nuclei with lifetimes of the order of picoseconds can be located up to ∼11 neutrons away fromthe driplines [175].
Figure 26 shows the presently known nuclei (black squares), the dripline calculated byTUYY [18] (dashed line), and a simple extrapolation of the lifetime limit of ∼10−9 s (solidline). The grey squares show the estimated reach of the proposed RIA with a production limitof approximately one nucleus per day. The figure shows that RIA will be able to map out thewhole dripline including all even-Z nuclei up to Z = 80. RIA has the potential to producewell over 200 new nuclei most of them beyond the proton dripline. About 100 nuclei will stillbe out of reach.
In addition to the direct production of these nuclei by means of PF, the high intensities forradioactive nuclei closer to the dripline will potentially make fusion evaporation reactions withthese nuclei possible. Thus the limitation of stable projectiles shown in figure 9 is not relevantanymore and new nuclei at and beyond the proton dripline might also be populated with fusionevaporation reactions with radioactive projectiles. The expected reduced beam intensity mightbe compensated by the choice of evaporation channels with larger cross sections. For nucleibeyond Z ∼ 80, this might be the only chance to further explore the proton dripline.
7.2. Neutron dripline
The neutron dripline is significantly harder to reach than the proton dripline. Even RIA willnot be able to produce all bound neutron-rich nuclei. Figure 27 shows the presently observednuclei (black squares), the neutron dripline predicted by TUYY [18] (solid line) and the nucleiexpected to be populated at RIA with a rate of one per day (grey squares). It is expected thatRIA will reach the dripline (depending on the model) up to Z ∼ 30 (N ∼ 60) and the lastsighting of the dripline could be at N ∼ 88.
For the mass region shown in the figure (Z � 50) approximately 400 new nuclei will beproduced with hundreds more above Z = 50. However, the neutron dripline itself will be outof reach. Potentially the only chance to advance the knowledge of the neutron dripline even

Reaching the limits of nuclear stability 1227
Figure 27. Reach of the proposed rare isotope accelerator RIA at the neutron dripline.
further is secondary fragmentation or secondary fission of radioactive beams. This concept iscurrently being explored for the next generation European ISOL facility EURISOL [237].
8. Conclusion
There are at least three different definitions of the driplines. In the present review the driplinewas defined as the zero crossing of the neutron or proton separation energies. Others use thetypical nuclear timescale of 10−22 s as the definition of the dripline, whereas in this review thistimescale is referred to as the limit of nuclear existence. A third definition is the condition thatthe nucleus must be directly observable (�10−9s).
The first and the third definition are identical for the neutron dripline. The second definitionwould include several light mass nuclei with lifetimes of <10−22 s. It is not easy to set a sharplimit and the recent charts of nuclei include even nuclei with lifetimes as short as 10−22 s.
The location of the proton dripline when defined as Sp = 0 is experimentally not well-determined. However, this is not critical, because the location of the dripline itself does nothave any practical implications. Due to the Coulomb barrier there is no unique experimentalsignature. Several mass measurements of nuclei in the vicinity of the dripline are necessary inorder to locate the Sp = 0 dripline. The definition of the dripline related to direct observationis in a sense arbitrary because it will change with time as experimental techniques improve.
No major breakthroughs are expected for the observation of new nuclei at and beyondthe dripline in the near future. The improvements of mass measurements should be able toestablish the exact location of the proton dripline (Sp = 0) for many more nuclei. The neutrondripline might be extended by a few more isotones (or isotopes) with increases in primarybeam intensities. In the light mass region neutron and proton coincidence measurements ofnuclei beyond the neutron and proton driplines will yield new spectroscopic information. Theelusive di-proton emission is finally within experimental reach and additional cases might befound.
However, significant advances will have to wait until the next generation of radioactivebeam facilities are completed. Overall they will be able to produce more than a thousand newnuclei. About 200 new nuclei beyond the proton dripline and approximately 400 new nucleiat or very close to the neutron dripline will be accessible.

1228 M Thoennessen
Acknowledgments
MT would like to thank Chasity Fudella for help with the manuscript and Thomas Baumannfor the preparation of figures 2 and 3. MT also would like to thank Sam M Austin, ThomasBaumann, P Gregers Hansen and Hendrik Schatz for their comments and suggestions.
References
[1] Nolan P J and Twin P J 1988 Annu. Rev. Nucl. Part. Sci. 38 533[2] Janssens R V F and Khoo T L 1991 Annu. Rev. Nucl. Part. Sci. 41 32[3] Moretto L G and Wozniak G J 1993 Annu. Rev. Nucl. Part. Sci. 43 379[4] Muller B 1995 Rev. Mod. Phys. 58 611[5] Harris J W and Muller B 1996 Annu. Rev. Nucl. Part. Sci. 46 71[6] Gutbrod H, Aichelin J and Werner K (ed) 2003 Proc. 16th Int. Conf. on Ultra-Relativistic Nucleus–Nucleus
Collisions, (Nantes, France, 18–24 July 2002) Nucl. Phys. A 715[7] Armbruster P 1999 Rep. Prog. Phys. 62 465[8] Armbruster P 2000 Annu. Rev. Nucl. Part. Sci. 50 411[9] Hofmann S and Munzenberg G 2000 Rev. Mod. Phys. 72 733
[10] Mueller A C and Sherrill B M 1993 Annu. Rev. Nucl. Part. Sci. 43 529[11] Jonson B 2004 Phys. Rep. 389 1[12] Roeckl E 1992 Rep. Prog. Phys. 55 1661[13] Woods P J and Davids C N 1997 Annu. Rev. Nucl. Part. Sci. 47 541[14] Livingood J J and Seaborg G T 1940 Rev. Mod. Phys. 12 30[15] Firestone R B, Shirley V S, Chu S Y F, Baglin C M and Zipkin J 1996 Table of Isotopes (New York: Wiley)[16] Firestone R B, Chu S Y F and Baglin C M 1998 1998 Update to the 8th Edition of the Table of Isotopes
(New York: Wiley)[17] Firestone R B, Chu S Y F and Baglin C M 1999 1999 Update to the 8th Edition of the Table of Isotopes
(New York: Wiley)[18] Tachibana T, Uno M, Yamada M and Yamada S 1988 At. Data Nucl. Data Tables 39 251[19] Baum E M, Knox H D and Miller T R 2002 Nuclides and Isotopes—Chart of Nuclides 16th edn (New York,
Schenectady: Knolls Atomic Power Laboratory and Lockheed Martin)[20] Brown B A 1991 Phys. Rev. C 43 R1513[21] Hansen P G and Tostevin J A 2003 Annu. Rev. Nucl. Part. Sci. 53 219[22] Goldanskii V I 1960 Annu. Rev. Nucl. Part. Sci. 16 1[23] Cerny J and Hardy J C 1977 Annu. Rev. Nucl. Part. Sci. 27 323[24] IUPAC Transfermium Working Group 1991 Pure Appl. Chem. 63 879[25] Antony M S 2002 Nuclide Chart 2002 (Nancy, France: Association Europeenne contre les Leucodystrophies)[26] Nefkens B M K 1963 Phys. Rev. Lett. 10 55[27] Schwarzschild A, Poskanzer A M, Emergy G T and Goldhaber M 1964 Phys. Rev. 133 B1[28] Stevenson J D and Price P B 1981 Phys. Rev. C 24 2102[29] Langevin M et al 1985 Phys. Lett. B 150 71[30] Artukh A G, Avdeichikov V V, Ero J, Gridnev G F, Mikheev V L, Volkov V V and Wilczynski J 1970 Phys.
Lett. B 33 407[31] Guillemaud-Mueller D et al 1990 Phys. Rev. C 41 937[32] Bowman J D, Poskanzer A M, Korteling R G and Butler G W 1973 Phys. Rev. Lett. 31 614[33] Sakurai H et al 1996 Phys. Rev. C 54 R2802[34] Borrel V et al 1992 Z. Phys. A 344 135[35] Blank B et al 1996 Phys. Rev. Lett. 77 2893[36] Mohar M F et al 1991 Phys. Rev. Lett. 66 1571[37] Blank B et al 1995 Phys. Rev. Lett. 74 4611[38] Dobaczewski J, Hamamoto I, Nazarewicz W and Sheikh J A 1994 Phys. Rev. Lett. 72 981[39] Dobaczewski J, Nazarewicz W, Werner T R, Berger J F, Chinn C R and Decharge J 1996 Phys. Rev. C 53 2809[40] Symons T J M et al 1979 Phys. Rev. Lett. 42 40[41] Cerny J, Pehl R H, Goulding F S and Landis D A 1964 Phys. Rev. Lett. 13 726[42] Robertson R G H, Martin S, Falk W R, Ingham D and Djaloeis A 1974 Phys. Rev. Lett. 32 1207[43] Jelley N A, Wilcox K H, Weisenmiller R B, Wozniak G J and Cerny J 1974 Phys. Rev. C 9 2067[44] Kashy E, Benenson W, Mueller D, Nann H and Robinson L 1976 Phys. Rev. C 14 1773
Reaching the limits of nuclear stability 1229
[45] Stokes R H and Young P G 1967 Phys. Rev. Lett. 18 611[46] McGrath R L, Cerny J and Norbeck E 1967 Phys. Rev. Lett. 19 1442[47] Cerny J, Mendelson R A Jr, Wozniak G J, Esterl J E and Hardy J C 1969 Phys. Rev. Lett. 22 612[48] Macfarlane R D and Siivola A 1965 Phys. Rev. Lett. 14 114[49] Munzenberg G, Faust W, Hofmann S, Armbruster P, Guttner K and Ewald H 1979 Nucl. Instrum. Methods
161 65[50] Bruske C, Burkhard K H, Huller W, Kirchner R, Klepper O and Roeckl E 1981 Nucl. Instrum. Methods 186 61[51] Poskanzer A M, Reeder P L and Dostrovsky I 1965 Phys. Rev. 138 B18[52] Poskanzer A M, Cosper S W and Hyde E K 1966 Phys. Rev. Lett. 17 1271[53] Poskanzer A M, Butler G W, Hyde E K, Cerny J, Landis D A and Goulding F S 1968 Phys. Lett. B 27 414[54] Thomas T D, Raisbeck G M and Boerstling P 1968 Phys. Lett. B 27 504[55] Klapisch R, Philippe C, Suchorzewska J, Detraz C and Bernas R 1968 Phys. Rev. Lett. 20 740[56] Klapisch R, Philippe C, Detraz C, Chaumont J, Bernas R and Beck E 1969 Phys. Rev. Lett. 23 652[57] Klapisch R, Thibault C, Poskanzer A M, Prieels R, Rigaud C and Roeckl E 1972 Phys. Rev. Lett. 29 1254[58] Langevin M, Detraz C, Guillemaud-Mueller D, Mueller A C, Thibault C, Touchard F and Epherre M 1983
Phys. Lett. B 125 116[59] Hansen P G 1979 Annu. Rev. Nucl. Part. Sci. 29 69[60] Geissel H, Munzenberg G and Riisager K 1995 Annu. Rev. Nucl. Part. Sci. 95 163[61] Artukh A G, Gridnev G F, Mikheev V L and Volkov V V 1969 Nucl. Phys. A 137 348[62] Artukh A G, Avdeichikov V V, Gridnev G F, Mikheev V L, Volkov V V and Wilczynski J 1970 Phys. Lett. B
31 129[63] Artukh A G, Avdeichikov V V, Chelnokov L P, Gridnev G F, Mikheev V L, Vakatov V I, Volkov V V and
Wilczynski J 1970 Phys. Lett. B 32 43[64] Artukh A G, Avdeichikov V V, Gridnev G F, Mikheev V L, Volkov V V and Wilczynski J 1971 Nucl. Phys. A
176 284[65] Auger P, Chiang T H, Galin J, Gatty B, Guerreau D, Nolte E, Pouthas J, Tarrago X and Girard J 1979 Z. Phys.
A 289 255[66] Aysto J, Moltz D M, Xu X J, Reiff J E and Cerny J 1985 Phys. Rev. Lett. 55 1384[67] Morrissey D J and Sherrill B M 1998 Proc. R. Soc. Lond. A 356 1985[68] Tarasov O B, Bazin D, Lewitowicz M and Sorlin O 2002 Nucl. Phys. A 701 661[69] Bazin D, Tarasov O B, Lewitowicz M and Sorlin O 2002 Nucl. Instrum. Methods A 482 314[70] Kryger R A et al 1993 Phys. Rev. C 47 R2439[71] Thoennessen M et al 1999 Phys. Rev. C 59 111[72] Thoennessen M, Yokoyama S and Hansen P G 2001 Phys. Rev. C 63 014308[73] Morris C L, Fortune H T, Bland L C, Gilman R, Greene S J, Cottingame W B, Holtkamp D B, Burleson G R
and Moore C F 1982 Phys. Rev. C 25 3218[74] Seth K K, Artuso M, Barlow D, Iversen S, Kaletka M, Nann H, Parker B and Soundranayagam R 1987 Phys.
Rev. Lett. 58 1930[75] Gurov Yu B, Aleshkin D V, Lapushkin S V, Morokhov P V, Panin A V, Pechkurov V A, Poroshin N O,
Sandukovsky V G, Tel’kushev M V and Chernyshev B A 2003 JETP Lett. 78 183[76] Bernas M et al 1997 Phys. Lett. B 415 111[77] Mittig W and Roussel-Chomaz P 2001 Nucl. Phys. A 693 495[78] Glasmacher T 1998 Annu. Rev. Nucl. Part. Sci. 48 1[79] Glasmacher T 2001 Nucl. Phys. A 693 90[80] von Oertzen W and Vitturi A 2001 Rep. Prog. Phys. 64 1247[81] Catford W N 2002 Nucl. Phys. A 701 1[82] Leistenschneider A et al 2002 Phys. Rev. C 65 064607[83] Korsheninnikov A A et al 2003 Phys. Rev. Lett. 90 082501[84] Korsheninnikov A A et al 1994 Phys. Lett. B 326 31[85] Kryger R A, Azhari A, Brown J, Caggiano J, Hellstrom M, Kelley J H, Sherrill B M, Steiner M and
Thoennessen M 1996 Phys. Rev. C 53 1971[86] Thoennessen M et al 2003 Phys. Rev. C 68 044318[87] Kryger R A et al 1995 Phys. Rev. Lett. 74 860[88] Azhari A et al 1998 Phys. Rev. C 57 628[89] Zerguerras T et al 2004 Eur. Phys. J. A, at press[90] Axelson L et al 1996 Phys. Rev. C 54 R1511[91] Markenroth K et al 1998 Phys. Rev. C 62 034308[92] Peters W A et al 2003 Phys. Rev. C 68 034607

1230 M Thoennessen
[93] Angulo C et al 2003 Phys. Rev. C 67 014308[94] Cable M D, Honkanen J, Parry R F, Thierens H M, Wouters J M, Zhou Z Y and Cerny J 1982 Phys. Rev. C
26 1778[95] Saint-Laurent M G et al 1987 Phys. Rev. Lett. 59 33[96] Cable M D, Honkanen J, Parry R F, Zhou S H, Zhou Z Y and Cerny J 1983 Phys. Lett. B 123 25[97] Langevin M et al 1986 Nucl. Phys. A 455 149[98] Benenson W, Mueller D, Kashy E, Nann H and Robinson L W 1977 Phys. Rev. C 15 1187[99] Benenson W, Guichard A, Kashy E, Mueller D and Nann H 1976 Phys. Rev. C 13 1479
[100] Lepine-Szily A et al 2002 Phys. Rev. C 65 054318[101] Benenson W, Kashy E, Kong-A-Siou D H, Moalem A and Nann H 1974 Phys. Rev. C 9 2130[102] KeKelis G J, Zisman M S, Scott D K, Jahn R, Vieira D J, Cerny J and Ajzenberg-Selove F 1978 Phys. Rev. C
17 1929[103] Benenson W, Kashy E, Ledebuhr A G, Pardo R C, Robertson R G H and Robinson L W 1978 Phys. Rev. C
17 1939[104] Frank N, Baumann T, Bazin D, Clement R R, Cooper M W, Heckman P, Peters W A, Stolz A, Thoennessen M
and Wallace M S 2003 Phys. Rev. C 68 054309[105] Audi G, Wapstra A H and Thibault C 2003 Nucl. Phys. A 729 337[106] Gomez del Campo J et al 2001 Phys. Rev. Lett. 86 43[107] Mohar M F et al 1988 Phys. Rev. C 38 737[108] Detraz C et al 1990 Nucl Phys. A 519 529[109] Pougheon F et al 1987 Z. Phys. A 327 17[110] Blank B et al 2000 Phys. Rev. Lett. 84 1116[111] Giovinazzo J et al 2001 Eur. Phys. J. A 11 247[112] Hotchkis M A C, Reiff J E, Vieira D J, Blonnigen F, Lang T F, Moltz D M, Xu X and Cerny J 1987 Phys.
Rev. C 35 315[113] Batchelder J C, Moltz D M, Ognibene T J, Rowe M W and Cerny J 1993 Phys. Rev. C 47 2038[114] Alburger D E 1978 Phys. Rev. C 18 1875[115] D’Auria J M et al 1977 Phys. Lett. B 66 233[116] Batchelder J C, Moltz D M, Ognibene T J, Rowe M W, Tighe R J and Cerny J 1993 Phys. Rev. C 48 2593[117] Kienle P et al 2001 Prog. Part. Nucl. Phys. 46 73[118] Yennello S J, Winger J A, Antaya T, Benenson W, Mohar M F, Morrissey D J, Orr N A and Sherrill B M 1992
Phys. Rev. C 46 2620[119] Janas Z et al 1999 Phys. Rev. Lett. 82 295[120] Rykaczewski K et al 1995 Phys. Rev. C 52 R2310[121] Hencheck M et al 1994 Phys. Rev. C 50 2219[122] Elmroth T, Hagberg E, Hansen P G, Hardy J C, Jonson B, Ravn H L and Tidemand-Petersson P 1978 Nucl.
Phys. A 304 493[123] Schneider R et al 1994 Z. Phys. A 348 241[124] Giovinazzo J et al 2002 Phys. Rev. Lett. 89 102501[125] Pfutzner M et al 2002 Eur. Phys. J. A 14 279[126] Audi G, Bersillion O, Blachot J and Wapstra A H 2003 Nucl. Phys. A 729 3[127] Blank B et al 1994 Phys. Rev. C 50 2398[128] Schardt D, Batsch T, Kirchner R, Klepper O, Kurcewicz W, Roeckl E and Tidemand-Petersson 1981 Nucl.
Phys. A 368 153[129] Page R D, Woods P J, Bennett S J, Freer M, Fulton B R, Cunningham R A, Groves J, Hotchkis M A C and
James A N 1991 Z. Phys. A 338 295[130] Page R D, Woods P J, Cunningham R A, Davinson T, Davis N J, James A N, Livingston K and Sellin P J 1994
Phys. Rev. Lett. 72 1798[131] Janas Z et al 1997 Nucl Phys. A 627 119[132] Soramel F et al 2001 Phys. Rev. C 63 031304[133] Zhankui L, Shuwei X, Yuanxiang X, Ruichang M, Yuanxiu G, Chunfang W, Wenxue H and Tianmei Z 1997
Phys. Rev. C 56 1157[134] Bogdanov D D, Bugrov V P and Kadmenskii S G 1990 Sov. J. Nucl. Phys. 52 229[135] Xu S-W et al 1999 Phys. Rev. C 60 061302[136] Mahmud H et al 2002 Eur. Phys. J. A 15 85[137] Shuwei X et al 1996 Z. Phys. A 356 227[138] Yuanxiang X, Shuwei X, Zhankui L, Yong Y, Qiangyan P, Chunfang W and Tianmei Z 1999 Eur. Phys. J. A
6 239

Reaching the limits of nuclear stability 1231
[139] Rykaczewski K et al 1999 Phys. Rev. C 60 011301[140] Karny M et al 2003 Phys. Rev. Lett. 90 012502[141] Batchelder J C et al 1998 Phys. Rev. C 57 R1042[142] Xu S W, Li Z K, Xie YX, Wang X D, Guo B, Leng C G and Yu Y 2001 Eur. Phys. J. A 12 1[143] Sellin P J, Woods P J, Davinson T, Davis N J, Livingston K, Page R D, Shotter A C, Hofmann S and James A N
1993 Phys. Rev. C 47 1933[144] Hofmann S, Munzenberg G, Heßberger F, Reisdorf W, Armbruster P and Thuma B 1981 Z. Phys. A 299 281[145] Uusitalo J et al 1999 Phys. Rev. C 59 R2975[146] Page R D et al 1992 Phys. Rev. Lett. 68 1287[147] Hofmann S et al 1989 Z. Phys. A 333 107[148] Bingham C R et al 1996 Phys. Rev. C 54 R20[149] Seweryniak D et al 1999 Phys. Rev. C 60 031304[150] Poli G L et al 1999 Phys. Rev. C 59 R2979[151] Toth K S, Batchelder J C, Moltz D M and Robertson J D 1996 Z. Phys. A 355 225[152] Davids C N et al 1998 Phys. Rev. Lett. 80 1849[153] Hofmann S, Reisdorf W, Munzenberg G, Hessberger F P, Schneider J R H and Armbruster P 1982 Z. Phys. A
305 111[154] Scheidenberger C 2002 Eur. Phys. J. A 15 7[155] Lunney D, Pearson J M and Thibault C 2003 Rev. Mod. Phys. 75 1021[156] Andreyev A N et al 2003 Eur. Phys. J. A 18 55[157] Andreyev A N et al 1999 Eur. Phys. J. A 6 381[158] Kettunen H et al 2003 Eur. Phys. J. A 17 537[159] Kettunen H et al 2001 Phys. Rev. C 63 044315[160] Tagaya Y et al 1999 Eur. Phys. J. A 5 123[161] Leino M et al 1996 Z. Phys. A 355 157[162] Eskola K et al 1998 Phys. Rev. C 57 417[163] Ikezoe H, Ikuta T, Hamada S, Nagame Y, Nishinaka I, Tsukada K, Oura Y and Ohtsuki T 1996 Phys. Rev. C
54 2043[164] Mitsuoka S, Ikezoe H, Ikuta T, Nagame Y, Tsukada K, Nishinaka I, Oura Y and Zhao Y L 1997 Phys. Rev. C
55 1555[165] Malyshev O N et al 2000 Eur. Phys. J. A 8 295[166] Yeremin A V et al 1994 Nucl. Instrum. Methods 350 608[167] Andreyev A N et al 1994 Z. Phys. A 347 225[168] Morimoto K et al 2003 RIKEN Accelerator Progress Report 36 89[169] Cagarda P et al 2002 GSI Scientific Report 2001 15[170] Davids C N et al 1996 Phys. Rev. Lett. 76 592[171] Lalazissis G A, Vretenar D and Ring P 2001 Nucl. Phys. A 679 481[172] Cole B J 1996 Phys. Rev. C 54 1240[173] Moller P, Nix J R and Swiatecki W J 1995 At. Data Nucl. Data Tables 59 185[174] Goriely S, Samyn M, Heenen P H, Pearson J M and Tondeur F 2002 Phys. Rev. C 66 024326[175] Novikov Yu N et al 2002 Nucl. Phys. A 697 92[176] Grigorenko L V, Johnson R C, Mukha I G, Thompson I J and Zhukov M V 2000 Phys. Rev. Lett. 85 22[177] Grigorenko L V and Zhukov M V 2003 Phys. Rev. C 68 054005[178] Ormand W E 1996 Phys. Rev. C 53 214[179] Geesaman D F, McGrath R L, Lesser P M S, Urone P P and VerWest B 1977 Phys. Rev. C 15 1835[180] Bain C R et al 1996 Phys. Lett. B 373 35[181] Fynbo H O U et al 2000 Nucl. Phys. A 677 38[182] Mukha I and Schrieder G 2001 Nucl. Phys. A 690 280c[183] Hinds S, Middleton R, Litherland A E and Pullen D J 1961 Phys. Rev. Lett. 6 113[184] Sakurai H et al 1999 Phys. Lett. B 448 180[185] Tarasov O et al 1997 Phys. Lett. B 409 64[186] Poskanzer A M, Esterlund R A and McPherson R 1965 Phys. Rev. Lett. 15 1030[187] Evseev V S, Kurbatov V S, Sidorov V M, Velyaev V B, Wrzecionko J, Daum M, Frosch R, McCulloch J and
Steiner E 1981 Nucl. Phys. A 352 379[188] Golovkov M S et al 2003 Phys. Lett. B 566 70[189] Meister M et al 2002 Phys. Rev. Lett. 88 102501[190] Young B M et al 1994 Phys. Rev. C 49 279[191] Meister M et al 2003 Phys. Rev. Lett. 91 162504
1232 M Thoennessen
[192] Meister M et al 2003 Nucl. Phys. A 723 13[193] Belozyorov A V, Borcea C, Dlouhy Z, Kalinin A M, Kalpakchieva R, Nguyen H C, Oganessian Yu Ts and
Penionzhkevich Yu E 1986 Nucl. Phys. A 460 352[194] Chen L, Blank B, Brown B A, Chartier M, Galonsky A, Hansen P G and Thoennessen M 2001 Phys. Lett. B
505 21[195] Talmi I and Unna I 1960 Phys. Rev. Lett. 4 469[196] Amelin A I et al 1990 Sov. J. Nucl. Phys. 52 782[197] Tanihata I, Hamagaki H, Hashimoto O, Shida Y, Yoshikawa N, Sugimoto K, Yamakawa O, Kobayashi T and
Takahashi N 1985 Phys. Rev. Lett. 55 2676[198] Simon H et al 1999 Phys. Rev. Lett. 83 496[199] Marques F M et al 2002 Phys. Rev. C 65 044006[200] Guillemaud-Mueller D et al 1989 Z. Phys. A 332 189[201] Baumann T et al 2003 Phys. Rev. C 67 061303(R)[202] Bowman J D, Poskanzer A M, Korteling R G and Butler G W 1974 Phys. Rev. C 9 836[203] Musser J A and Stevenson J D 1984 Phys. Rev. Lett. 53 2544[204] Westfall G D et al 1979 Phys. Rev. Lett. 43 1859[205] Poucheon F et al 1986 Europhys. Lett. 2 505[206] Ozawa A et al 2003 Phys. Rev. C 67 014610[207] Meyers W D and Swiatecki W J 1966 Nucl. Phys. A 81 1[208] Garvey G T 1969 Annu. Rev. Nucl. Part. Sci. 19 433[209] Fauerbach M, Morrissey D J, Benenson W, Brown B A, Hellstrom M, Kelley J H, Kryger R A, Pfaff R,
Powell C F and Sherrill B M 1996 Phys. Rev. C 53 647[210] Ozawa A, Kobayashi T, Suzuki T, Yoshida K and Tanihata I 2000 Phys. Rev. Lett. 84 5493[211] Thoennessen M 2003 Proc. 3rd Int. Balkan School on Nuclear Physics ed G Lalazissis (Greece: Publishing &
Graphic Arts Co) p 243[212] Thirolf P et al 2000 Phys. Lett. B 485 16[213] Otsuka T, Fujimoto R, Utsuno Y, Brown B A, Honma M and Mizusaki T 2001 Phys. Rev. Lett. 87 082502[214] Notani M et al 2002 Phys. Lett. B 542 49[215] Lukyanov S M et al 2002 J. Phys. G: Nucl. Part. Phys. 28 L41[216] Sarazin F et al 2000 Phys. Rev. Lett. 84 5062[217] Sakurai H et al 1997 Nucl. Phys. A 616 311c[218] Lewitowicz M et al 1990 Z. Phys. A 335 117[219] Sorlin O et al 1993 Phys. Rev. C 47 2941[220] Glasmacher T et al 1997 Phys. Lett. B 395 163[221] Ajdacic V, Cerino M, Lalovic B, Paic G, Slaus I and Tomas P 1965 Phys. Rev. Lett. 14 444[222] Detraz C, Cerny J and Pehl R H 1965 Phys. Rev. Lett. 14 708[223] Schatz H et al 1998 Phys. Rep. 294 167[224] Qian Y Z 2003 Prog. Part. Nucl. Phys. 50 153[225] Meyer B S 1994 Annu. Rev. Astron. Astrophys. 32 153[226] Kappeler F, Thielemann F K and Wiescher M 1998 Annu. Rev. Nucl. Part. Sci. 48 175[227] Pfeiffer B, Kratz L, Thielemann F K 1997 Z. Phys. A 357 235[228] Souliotis G A 2000 Phys. Scr. T 88 153[229] Motobayashi T 2003 Nucl. Instrum. Methods B 204 736[230] Henning W F 2003 Nucl. Instrum. Methods B 204 725[231] Vervier J 2003 Nucl. Instrum. Methods B 204 759[232] Sherrill B M 2003 Nucl. Instrum. Methods B 204 765[233] Geissel H and Wollnik H 2001 Nucl. Phys. A 693 19[234] Bollen G 2001 Nucl. Phys. A 693 3[235] Bollen G 2002 Eur. Phys. J. A 15 237[236] Audi G, Bersillion O, Blachot J and Wapstra A H 1997 Nucl. Phys. A 624 1[237] Helariutta K, Benlliure J, Ricciardi M V and Schmidt K H 2003 Eur. Phys. J. A 17 181