reaching students in the chesapeake bay region: a …
TRANSCRIPT
i
REACHING STUDENTS IN THE CHESAPEAKE BAY REGION:
A Study on the Feasibility of Replicating Ocean
Discovery Institute’s Model
Final Report
April 30, 2015
By
Sarah Schoedinger, NOAA Office of Education
John Dillow, Orenda Associates
Shara Fisler, Ocean Discovery Institute
Lindsay Goodwin, Ocean Discovery Institute
Carla Pisbe, Ocean Discovery Institute
MacKenzie Sandy, Ocean Discovery Institute
ii
Table of Contents
List of Figures ………………..…………………………………………………………………………….. iii
List of Tables ………………..…………………………………………………………………………….. iv
Abstract ……………………………………………………………………………………………………… v
Executive Summary …………………………………………………………………………………….. 1
Introduction
History of Project .………………………………………………………………………………………. 6 Who is Ocean Discovery Institute? .………………………………………………………………… 12
What is the Model Being Replicated? ……………………………………………………………. 12
Methods
Approach ………………………………………………………………………………………………….. 16
The Project Team ………………………………………………………………………………………… 16
Data Collection and Analysis …………………………………………………………………………. 18
Tools and Process for Communications and Documentation ………………………………… 23
Results and Discussion
Coarse Level Site Assessment …………………………………………………………………………. 24
Replication Strategy Assessment ……………………………………………………………………. 34
Medium Level Assessment …………………………………………………………………………….. 39
Fine Level Assessment …………………………………………………………………………………. 44
Other Lessons Learned …………………………………………………………………………………. 52
Conclusions and Recommendations ……………………………………………………………… 53 Literature Cited ……………………………………………………………………………………………. 56 List of Appendices ………………………………………………………………………………………... 56
A. Feasibility Study’s Design B. List of Questions Asked During Site Visits C. Coarse, Medium and Fine Level Data on Schools and Community D. Replication of Ocean Discovery Institute Model: Coarse Level Site Assessment E. STEM Industry Research for the Hampton Roads Region of Virginia: Chesapeake, Hampton, Newport News, Norfolk, and Portsmouth F. “Replication of Ocean Discovery Institute: An Urban STEM Model that Will Empower
Decision Makers and Leadership for the Chesapeake Bay Region”: Replication Strategy Assessment: Literature Review
G. Detailed version of the Ocean Discovery Institute Business Model H. Norfolk Public Schools – relevant school-shed feeder pattern I. Replication Strategy Gantt Chart, Matrix, and Budget
iii
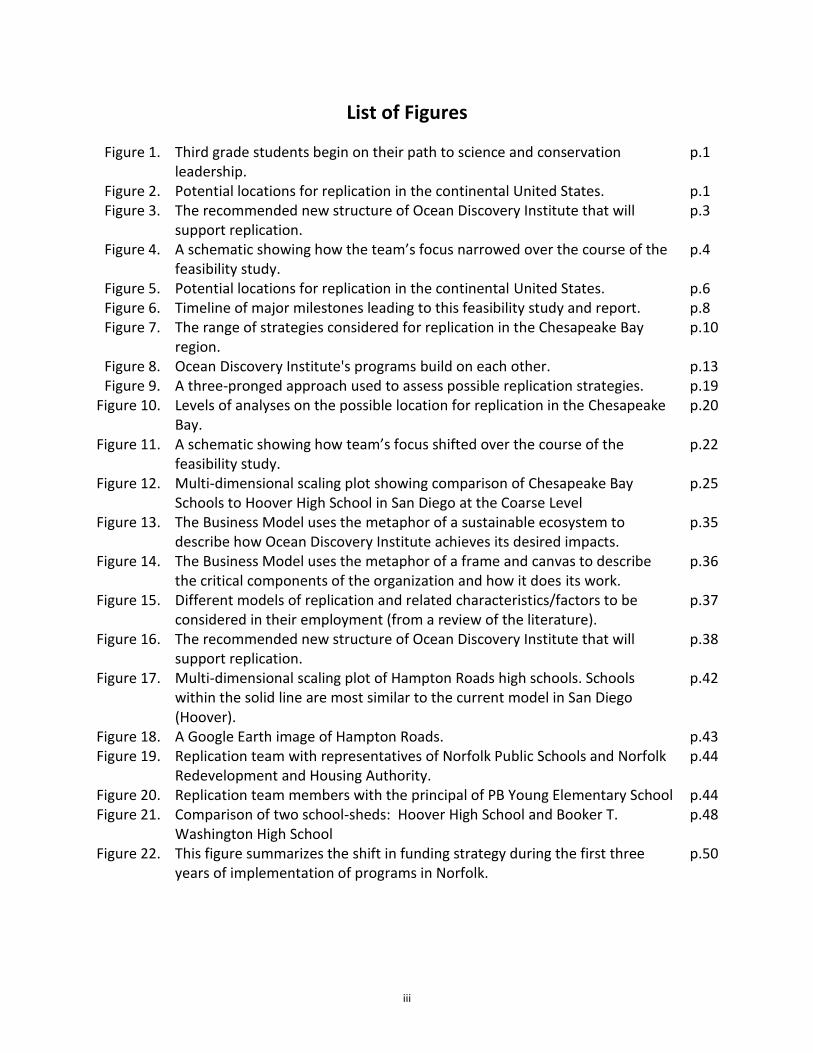
List of Figures
Figure 1. Third grade students begin on their path to science and conservation leadership.
p.1
Figure 2. Potential locations for replication in the continental United States. p.1 Figure 3. The recommended new structure of Ocean Discovery Institute that will
support replication. p.3
Figure 4. A schematic showing how the team’s focus narrowed over the course of the feasibility study.
p.4
Figure 5. Potential locations for replication in the continental United States. p.6 Figure 6. Timeline of major milestones leading to this feasibility study and report. p.8 Figure 7. The range of strategies considered for replication in the Chesapeake Bay
region. p.10
Figure 8. Ocean Discovery Institute's programs build on each other. p.13 Figure 9. A three-pronged approach used to assess possible replication strategies. p.19
Figure 10. Levels of analyses on the possible location for replication in the Chesapeake Bay.
p.20
Figure 11. A schematic showing how team’s focus shifted over the course of the feasibility study.
p.22
Figure 12. Multi-dimensional scaling plot showing comparison of Chesapeake Bay Schools to Hoover High School in San Diego at the Coarse Level
p.25
Figure 13. The Business Model uses the metaphor of a sustainable ecosystem to describe how Ocean Discovery Institute achieves its desired impacts.
p.35
Figure 14. The Business Model uses the metaphor of a frame and canvas to describe the critical components of the organization and how it does its work.
p.36
Figure 15. Different models of replication and related characteristics/factors to be considered in their employment (from a review of the literature).
p.37
Figure 16. The recommended new structure of Ocean Discovery Institute that will support replication.
p.38
Figure 17. Multi-dimensional scaling plot of Hampton Roads high schools. Schools within the solid line are most similar to the current model in San Diego (Hoover).
p.42
Figure 18. A Google Earth image of Hampton Roads. p.43 Figure 19. Replication team with representatives of Norfolk Public Schools and Norfolk
Redevelopment and Housing Authority. p.44
Figure 20. Replication team members with the principal of PB Young Elementary School p.44 Figure 21. Comparison of two school-sheds: Hoover High School and Booker T.
Washington High School p.48
Figure 22. This figure summarizes the shift in funding strategy during the first three years of implementation of programs in Norfolk.
p.50
iv
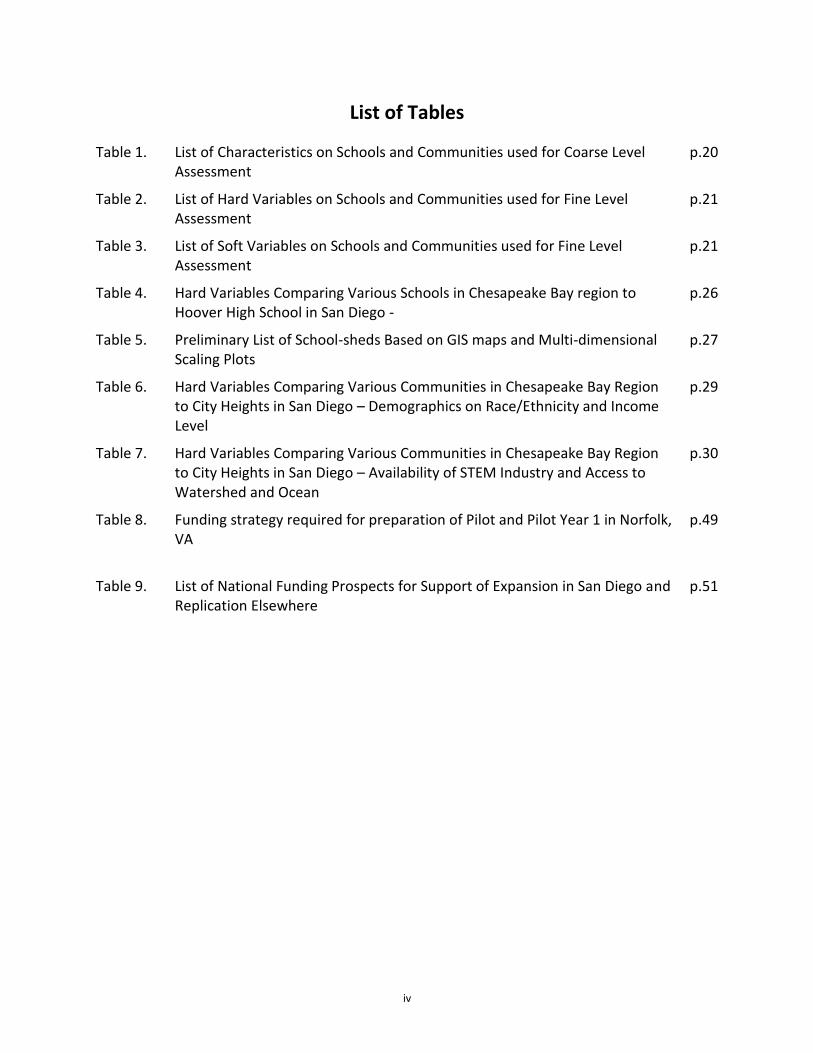
List of Tables
Table 1. List of Characteristics on Schools and Communities used for Coarse Level Assessment
p.20
Table 2. List of Hard Variables on Schools and Communities used for Fine Level Assessment
p.21
Table 3. List of Soft Variables on Schools and Communities used for Fine Level Assessment
p.21
Table 4. Hard Variables Comparing Various Schools in Chesapeake Bay region to Hoover High School in San Diego -
p.26
Table 5. Preliminary List of School-sheds Based on GIS maps and Multi-dimensional Scaling Plots
p.27
Table 6. Hard Variables Comparing Various Communities in Chesapeake Bay Region to City Heights in San Diego – Demographics on Race/Ethnicity and Income Level
p.29
Table 7. Hard Variables Comparing Various Communities in Chesapeake Bay Region to City Heights in San Diego – Availability of STEM Industry and Access to Watershed and Ocean
p.30
Table 8. Funding strategy required for preparation of Pilot and Pilot Year 1 in Norfolk, VA
p.49
Table 9. List of National Funding Prospects for Support of Expansion in San Diego and Replication Elsewhere
p.51
v
Abstract
“Reaching Students in the Chesapeake Bay Region” focuses on a planning effort to replicate Ocean
Discovery Institute’s successful program model, which cultivates a new generation of science and
conservation leaders from populations that are traditionally under-represented in Science, Technology,
Engineering and Mathematics (STEM) fields. In order to increase the impact of this model, Ocean
Discovery Institute planned to expand operations locally in San Diego, California and nationally through
replication in other urban watersheds. With support from NOAA’s B-WET Program, Ocean Discovery
Institute embarked on a study to investigate the feasibility of replication in the Chesapeake Bay’s
watershed. A team was assembled to pursue two lines of inquiry: (1) “Which replication strategy will be
most successful?” and (2) “Which location, if any, would enable implementation of the model to
succeed?” The team utilized instinct based on experience and data from multiple sources; including
online demographic and organizational data, interviews, literature, and site visits; to make decisions
throughout the study. With regard to replication strategy, the team concluded that a parent-affiliate
structure would best support implementation of the model in San Diego and other urban underserved
communities. This replication strategy required Ocean Discovery Institute to expand their program
model to a more fully fleshed out business model that focuses on essential components that are
required for success but allow for adaptation to local conditions. With regard to location, three urban
areas were considered - Baltimore, Maryland; Washington, DC; and Hampton Roads, Virginia. Based on
the similarity of community/student characteristics to the benchmark high school in San Diego; breadth
of community-based, academic and STEM industry partners; funding capacity; and the degree of
openness and interest demonstrated by all stakeholders in the region, the team selected the Booker T.
Washington school-shed in Norfolk, Virginia as the best location for the first attempt at replication. A
framework articulating specific objectives related to funding, development of organizational
infrastructure, and program development will guide implementation from now through the start-up of
operations in Norfolk. Securing funding will likely be the primary driver of the rate of implementation
and, therefore, this should be an immediate priority. Ultimately, fidelity to the model is more important
than meeting the estimated timeline. Success in San Diego, Norfolk, and any future sites, will depend
upon this.
1
Executive Summary
Background on Project
This project, titled “Reaching Students in the Chesapeake Bay Region,” focuses on a planning effort to
replicate a successful model that recruits and retains underserved youth from urban communities in
science, technology, engineering and mathematics (STEM). Currently, Ocean Discovery Institute
provides tuition-free (but not commitment-free) programming to students within a single high-poverty,
ethnically diverse community – City Heights in San Diego, California. This model engages students in
rigorous educational, scientific research, and
environmental stewardship experiences as they grow from
curious youngsters to young adults who will make a
difference as science and conservation leaders. Ocean
Discovery Institute’s model has demonstrated significant
impacts on student achievement. Nine of the 13
elementary schools served by Ocean Discovery Institute
have demonstrated increased scores on their state
standardized tests during the course of their involvement
with the program. Further, while nationally 1 in 10 low-
income, first-generation college students earn a degree, 8
of 10 high school students in Ocean Discovery Institute’s
programs earn a bachelor’s degree within 5 years. Sixty
percent of those graduates have majored in science or
conservation fields.
Because of these achievements, Ocean
Discovery Institute’s model has received national
recognition for its success in cultivating a new
generation of leaders from populations that are
traditionally under-represented in STEM fields and
living in an urban, high-poverty community. Twelve
years after our founding, Ocean Discovery Institute was
awarded The White House’s 2011 Presidential Award
for Science, Mathematics, and Engineering Mentoring.
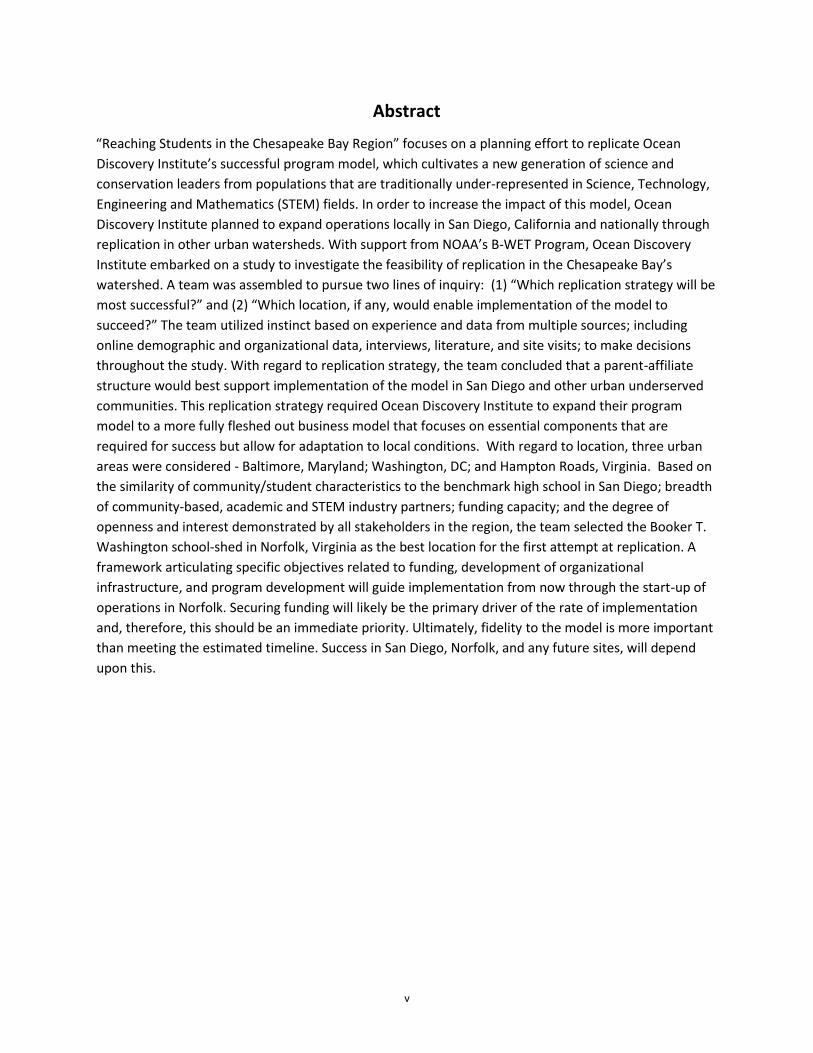
Figure 1. Third grade students begin on their path to science and conservation leadership, exploring their curiosities and gaining scientific understanding and skills as they perform a sea star dissection.
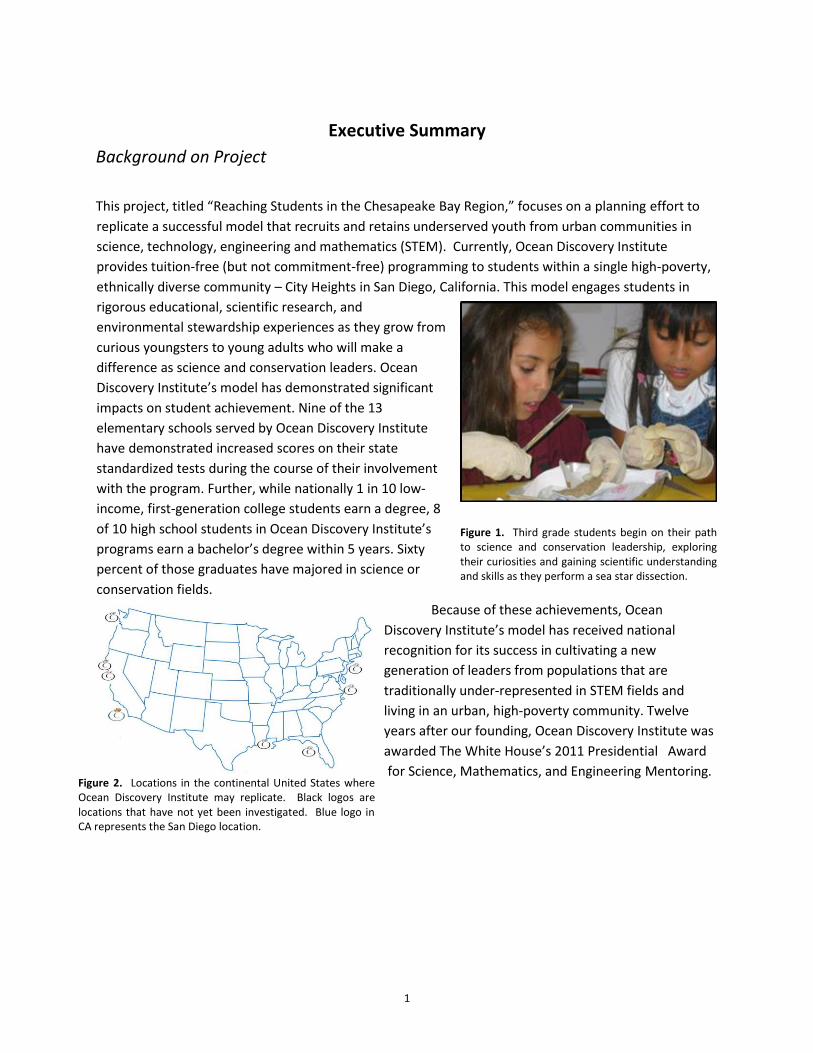
Figure 2. Locations in the continental United States where Ocean Discovery Institute may replicate. Black logos are locations that have not yet been investigated. Blue logo in CA represents the San Diego location.
2
The planning to expand the impact of Ocean Discovery Institute’s programs began in 2008. Back then
the idea of increasing the scale of operations on both local and national levels began to take shape, all
with the goal of reaching more underserved, urban youth. The strategy for local expansion has been
focused on building the Living Lab, a place in the City Heights neighborhood where youth and their
families from the community can learn about and participate in science and conservation activities. The
strategy for national expansion focused on replication1 of Ocean Discovery Institute’s model in a number
of US urban communities (Figure 2).
As part of a growing partnership with Ocean Discovery Institute, staff from the National Oceanic and
Atmospheric Administration (NOAA) approached Ocean Discovery Institute’s leadership to explore the
possibility of replicating the model in the Chesapeake Bay region because Ocean Discovery Institute’s
model addresses NOAA’s educational goals to improve environmental literacy and diversify the US
workforce in fields related to NOAA’s mission. Further, the model could fill an existing gap in STEM
education and workforce development in urban centers throughout the region. With support from
NOAA’s B-WET Program in 2013, Ocean Discovery Institute embarked on a study to investigate
feasibility of replicating their model in an urban center within the Chesapeake Bay’s watershed. The
three urban areas considered were Baltimore, Maryland; Washington, DC; and Hampton Roads, Virginia.
Methodology
To assess whether replication of the model was feasible in the Chesapeake Bay region, Ocean Discovery
Institute assembled a team of staff members, consultants, and advisors who collectively pursued two
lines of inquiry: (1) “Which replication strategy will be most successful?” and (2) “Which location, if any,
would enable implementation of the model to succeed?” These two questions were investigated more
or less simultaneously but relied on different methods and sources of data, including publicly available
online data on demographics and organizations, stakeholder interviews, and site visits to the region.
Additionally, the research was grounded by a review of the literature on replication of non-profit
organizations, internal evaluation of Ocean Discovery Institute’s model, and a review of case studies of
non-profit educational or workforce development organizations that have successfully replicated in the
United States. The team utilized these data, as well as their instincts based on experience, to make
decisions throughout the study.
Findings Regarding Replication Strategy
At the outset of this study, the replication team assumed that the best strategy for replication in the
Chesapeake Bay would be to find a local partner that would adopt and adapt Ocean Discovery Institute’s
model. However, nine months into the study, that assumption was proven wrong. This meant that the
team’s investigations with potential partners would focus on partners who might assist with
programming but not full adoption of the model. The team had to shift the approach from adoption by
a partner to setting up a whole new organization. Therefore, in order for replication to occur, 1 For the purposes of this project, replication is “the transfer to a different location of test concept, a pilot project, a small
enterprise, and so forth, in order to repeat success elsewhere”, and is also sometimes referred to as “scale-out” (Creech 2008).
3
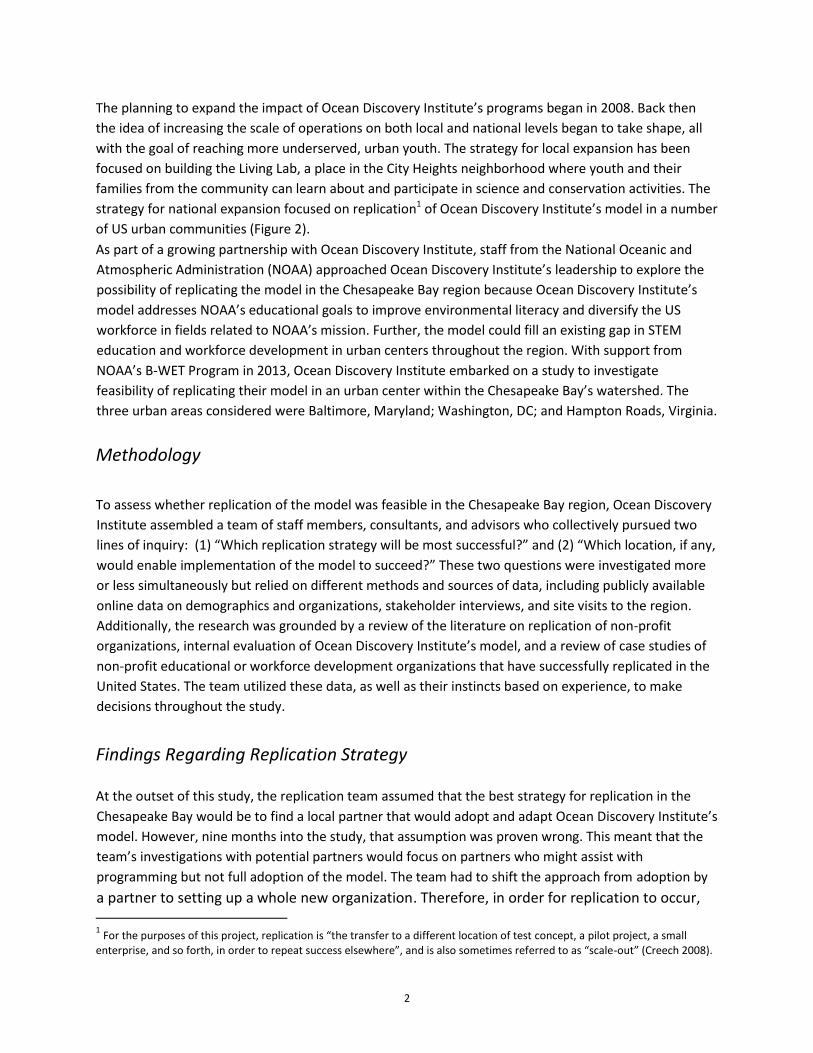
the organizational structure of Ocean Discovery Institute must transition to one with a parent
organization and local affiliates (Figure 3). Once this occurs, the existing San Diego-based organization
will become an affiliate, Norfolk may be established as the second affiliate, and other sites may follow.
This shift in approach also meant that
Ocean Discovery Institute needed to
expand their program model to a more
fully fleshed out business model that could
guide work in San Diego but also
development of new organizations in
other geographical locations. The business
model has been designed to maintain
fidelity to aspects that are essential for
reaching and sustaining success regardless
of location. These essential components
include: the organizational culture
founded on the unshakeable belief in
young people’s ability to transform their lives; the systems that support operations; the cost structure
and resources needed to sustain operations; and the programs that result in transformational impacts
on the students and their community. But the model also requires adaptation to local conditions
including the needs and assets of the community being served.
Findings Regarding Location for Replication
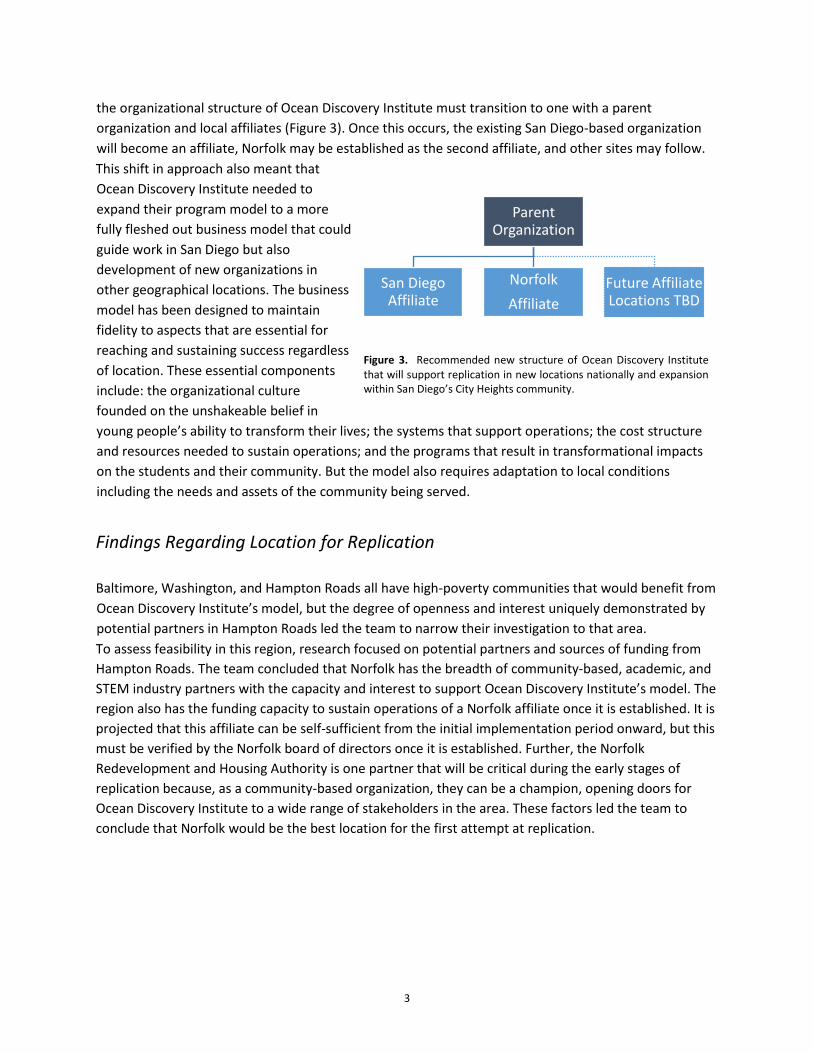
Baltimore, Washington, and Hampton Roads all have high-poverty communities that would benefit from
Ocean Discovery Institute’s model, but the degree of openness and interest uniquely demonstrated by
potential partners in Hampton Roads led the team to narrow their investigation to that area.
To assess feasibility in this region, research focused on potential partners and sources of funding from
Hampton Roads. The team concluded that Norfolk has the breadth of community-based, academic, and
STEM industry partners with the capacity and interest to support Ocean Discovery Institute’s model. The
region also has the funding capacity to sustain operations of a Norfolk affiliate once it is established. It is
projected that this affiliate can be self-sufficient from the initial implementation period onward, but this
must be verified by the Norfolk board of directors once it is established. Further, the Norfolk
Redevelopment and Housing Authority is one partner that will be critical during the early stages of
replication because, as a community-based organization, they can be a champion, opening doors for
Ocean Discovery Institute to a wide range of stakeholders in the area. These factors led the team to
conclude that Norfolk would be the best location for the first attempt at replication.
Figure 3. Recommended new structure of Ocean Discovery Institute that will support replication in new locations nationally and expansion within San Diego’s City Heights community.
Parent Organization
San Diego Affiliate
Norfolk
Affiliate
Future Affiliate Locations TBD

4
Within Norfolk, the Booker T. Washington High School feeder pattern has been identified as the school-
shed2, which includes the housing projects of Young
Terrace and Tidewater Gardens, managed by Norfolk
Redevelopment and Housing Authority. Why the Booker T.
Washington school-shed? The demographics of the
student population were closest to the benchmark school-
shed, Hoover High School in San Diego, with respect to
racial diversity, the size of the student population, the
percentage of students qualifying for Federal free or
reduced lunch, the high school graduation rate, and the
academic proficiency scores. In addition, input from the
Deputy Superintendent of Norfolk Public Schools and
representatives of the Norfolk Redevelopment and Housing
Authority confirmed that the Booker T. Washington school-
shed has the greatest need for Ocean Discovery Institute’s
model.
Conclusions
Replication in the Chesapeake Bay region is feasible, and Norfolk, Virginia and Booker T. Washington
High School’s school-shed are the best places to start. It is recommended that replication in this city and
school-shed proceeds in accordance with Ocean Discovery Institute’s Replication Strategy Matrix
(Appendix I), which is a framework for implementation from now through early years of program
implementation in Norfolk. This framework is divided into distinct phases of implementation containing
groups of objectives (fundraising, organizational infrastructure, and program development) that must be
met before the next phase begins. The
following considerations should guide how the objectives of Ocean Discovery Institute’s replication
strategy are implemented in the coming year:
1. The Replication Task Force of Ocean Discovery Institute’s Board of Directors should remain in
place to ensure that objectives are met before the next phase begins. The full Board should be
kept informed of progress, particularly as each phase concludes.
2. Ocean Discovery Institute’s relationship with NOAA (codified in a memorandum of
understanding signed in January 2015) should be leveraged to ensure that NOAA’s assets and
capabilities are appropriately integrated as replication unfolds.
2 A school-shed is defined as the area in which all of the young people “flow” into a single high school. It is how Ocean
Discovery Institute defines the geographical extent of the community to be served by their model.
Figure 4. A schematic showing how the team’s focus narrowed over the course of the feasibility study.
5
3. Additional advisors and consultants should be integrated as needed to provide expertise not
present among staff and Replication Task Force to develop the parent organization’s business
model and the materials the parent organization will provide to the Norfolk affiliate.
4. A strong communications plan should be developed to ensure existing relationships with
partners and potential partners in Norfolk continue to be fostered.
5. Norfolk relationships should be the primary mechanism for identifying potential board
members.
6. Start-up funding must rely on national funders to support (1) Ocean Discovery San Diego
growing to reach its entire school-shed, (2) the establishment of a parent organization, and (3)
the establishment of the Norfolk affiliate so that it is ready to begin operations.
7. Securing funding for each phase will likely be the primary driver of the rate of implementation
and, therefore, embarking upon the national funding strategy should be an immediate priority.
8. Ultimately, fidelity to the model is more important than meeting the estimated timeline.
Success in San Diego, Norfolk, and any future sites, will depend upon this.
6
Reaching Students in the Chesapeake Bay Region – A Replication Project
Introduction
History of the Project
This project, titled “Reaching Students in the Chesapeake Bay Region,” focuses on a planning effort to
replicate a successful program that recruits and retains underserved youth from urban communities in
science, technology, engineering and mathematics (STEM). Ocean Discovery Institute’s model has
received national recognition for its success in cultivating a new generation of leaders from populations
that are traditionally under-represented in STEM fields and living in an urban, high-poverty community.
With support from the National Oceanic and Atmospheric Administration (NOAA), Ocean Discovery
Institute has been studying the feasibility of replicating their model of programs in an urban center
within the Chesapeake Bay’s watershed.
The planning to expand the impact of Ocean Discovery Institute’s programs began in 2008. Back then
the idea of increasing the scale of operations on both local and national levels began to take shape, all
with the goal of reaching more underserved, urban youth. The strategy for local expansion has been
focused on building the Living Lab3, a place in the City Heights neighborhood of San Diego, California
where youth from the community
and their families can learn about and
participate in science and
conservation activities. This strategy
is based on a thoughtful analysis by
board members and staff examining
the need within San Diego’s City
Heights neighborhood (with 20,000
underserved residents under the age
of 18), the capacity of the
organization to achieve desired
outcomes with a much larger
population of students, and the
capacity of the San Diego area to
provide the resources to do so.
3 Ocean Discovery Institute will build a permanent facility in the heart of this community, allowing Ocean Discovery Institute to
reach every child in the school-shed. This will be the Living Lab, a state-of-the-art facility that will enable 20,000 young people to be engaged annually, increase quality of programming, and set the expectations the young people deserve.
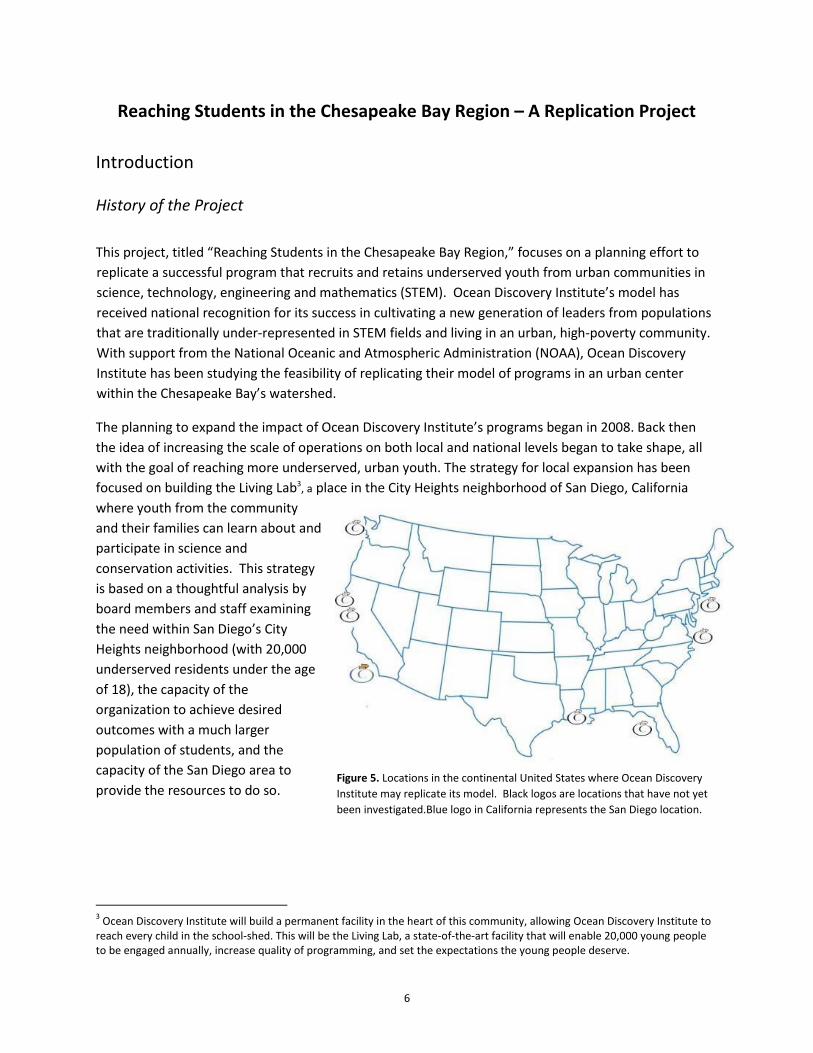
Figure 5. Locations in the continental United States where Ocean Discovery
Institute may replicate its model. Black logos are locations that have not yet
been investigated.Blue logo in California represents the San Diego location.
7
The strategy for national expansion focused on replication4of Ocean Discovery Institute’s model in a
number of US urban communities (Figure 5). Although both strategies were developed at the same time
by the organization’s board of directors and staff with input from local stakeholders, implementation
initially focused on local scaling. Once expansion of the organization’s capacity within San Diego was
well underway, the organization was able to consider model replication in another region.
While continuing to refine its model, measure program impact, and make progress on building the Living
Lab in City Heights, the organization’s leadership met with the leadership of NOAA’s Office of Education
in February 2011 to discuss opportunities to expand collaborations between the two organizations.
NOAA had recently created a 20-year strategic plan that outlined two main goals: (1) improving public
environmental literacy and (2) creating a diverse workforce in scientific and engineering fields related to
NOAA’s mission. Thus, the educational goals of both Ocean Discovery Institute and NOAA were well
aligned. Further, Ocean Discovery Institute already had ongoing, strong collaborations with NOAA’s
National Marine Fisheries Service that involved high school students in authentic scientific research, so it
was logical to all parties to explore a deeper partnership. At that same time, Ocean Discovery Institute
was in the midst of planning the design of the Living Lab in City Heights; NOAA’s Office of Education
assisted in recruiting scientists whose expertise was needed for the Living Lab design workshops in June
and September of that year.
The Living Lab workshops provided participants from NOAA with a deeper understanding of, and
appreciation for, Ocean Discovery Institute’s impacts on urban and underserved youth. In
September 2011, at the end of the second Living Lab workshop, representatives from NOAA’s
Office of Education, NOAA’s Chesapeake Bay Office, and senior staff of Ocean Discovery
Institute discussed the possibility of implementing Ocean Discovery’s model of programs in Washington,
DC or Baltimore, Maryland. At this same time Ocean Discovery had been notified that they would be given
a Presidential Award for Excellence in Science, Mathematics, and Engineering Mentoring (which was
officially awarded in December 2012). This award provided national recognition for the successes of Ocean
Discovery’s model in engaging and retaining underserved, urban youth in STEM fields. Since NOAA’s
Chesapeake Bay Office has a robust environmental education program and network of environmental
education practitioners in Maryland, the District of Columbia and Virginia, Christos Michalopoulos and
Sarah Schoedinger in NOAA’s Office of Education reached out to their colleagues managing the Bay
Watershed Education & Training (B-WET) Program for the Chesapeake Bay about replicating the Ocean
Discovery model in their region. Everyone agreed it was worth exploring and in January 2012
NOAA convened a meeting of representatives of Ocean Discovery Institute, NOAA’s Office of
Education, NOAA’ s Chesapeake Bay Office, and B-WET partners from Washington, DC and Baltimore.
During that meeting, the B-WET partners and NOAA Chesapeake Bay staff identified gaps in current
educational programming in the region that Ocean Discovery’s model would be uniquely positioned to fill.
These included the integration of STEM practices and content into environmental education programming,
as well as the fact that Ocean Discovery Institute provides programming and opportunities to
underserved, urban students over the course of their school careers.
4 For the purposes of this project, replication is “the transfer to a different location of test concept, a pilot project, a small
enterprise, and so forth, in order to repeat success elsewhere”, and is also sometimes referred to as “scale-out” (Creech 2008).
8
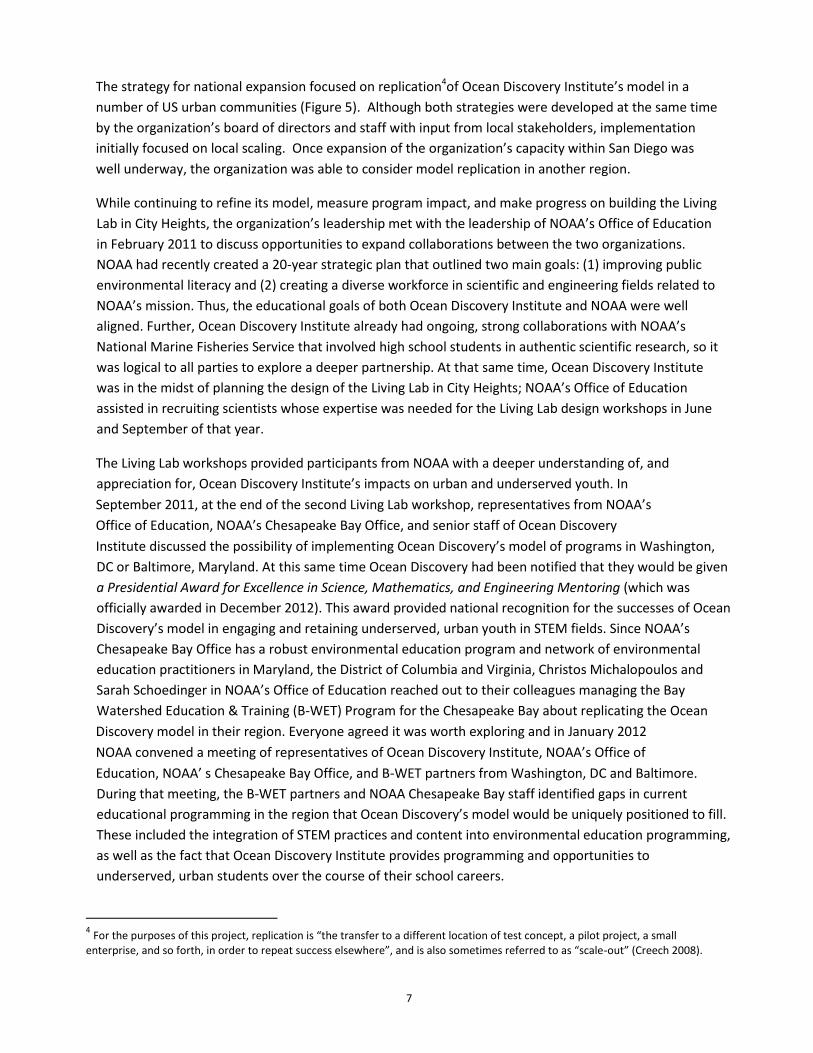
Figure 6. Timeline of major milestones leading to this feasibility study and report.
As a result of that meeting in January 2012, the staff managing the B-WET program for the Chesapeake
Bay agreed to include replication as one of the priorities of their next funding opportunity in Fiscal Year
2013. In preparation for submitting a grant proposal to the Chesapeake B-WET Program, Ocean
Discovery’s Board of Directors assisted the staff in defining the criteria essential to the success of their
model. These key characteristics (described on p.9) would guide the project’s research phase, even as the
strategy for replication shifted. In addition to these criteria, Ocean Discovery Institute staff and board
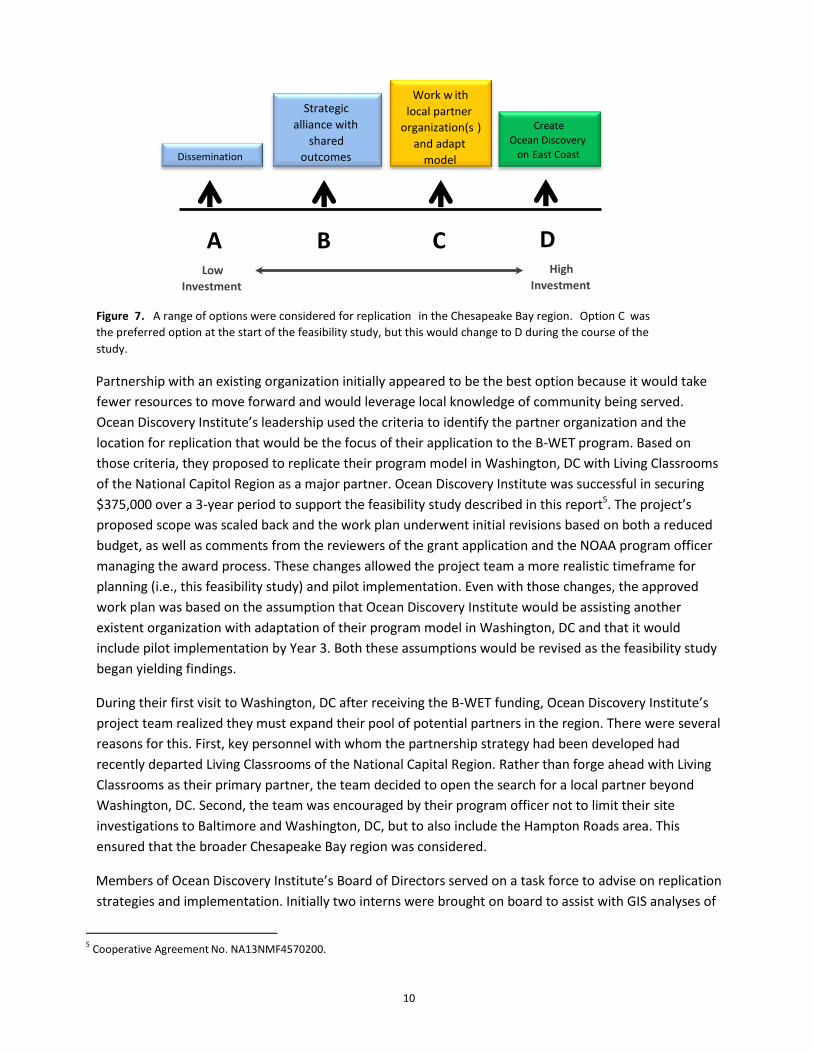
members identified a range of potential approaches for replication (Figure 7).
• Replication feasibility study report completed
Apr 2015
• Research conducted on best location and strategy for replication
Oct 2013 -
Dec 2014
• B - WET planning grant begins, supporting replication feasibility study
Sep 2013
• NOAA Office of Education and Chesapeake Bay Office explore idea of replicating Ocean Discovery's model in Chesapeake Bay region
Jan 2012
• Ocean Discovery Institute includes expansion by replication in its strategic vision
2008
9
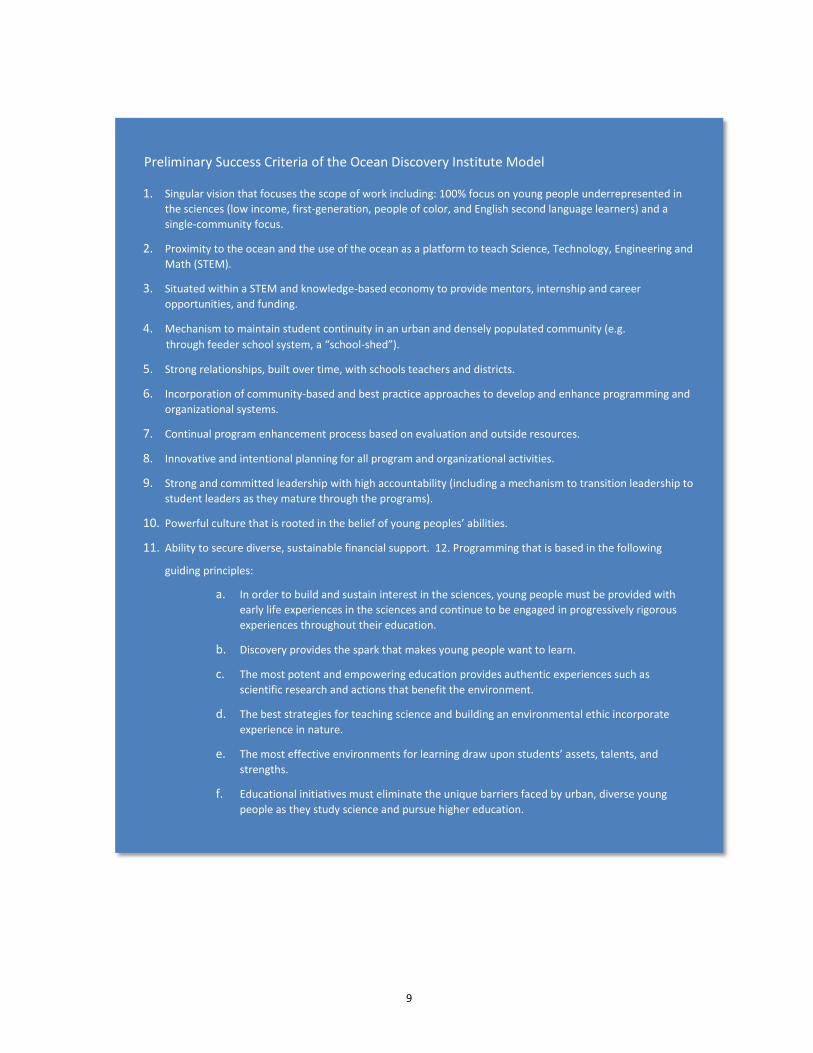
Preliminary Success Criteria of the Ocean Discovery Institute Model
1. Singular vision that focuses the scope of work including: 100% focus on young people underrepresented in
the sciences (low income, first-generation, people of color, and English second language learners) and a
single-community focus.
2. Proximity to the ocean and the use of the ocean as a platform to teach Science, Technology, Engineering and
Math (STEM).
3. Situated within a STEM and knowledge-based economy to provide mentors, internship and career
opportunities, and funding.
4. Mechanism to maintain student continuity in an urban and densely populated community (e.g. through feeder school system, a “school-shed”).
5. Strong relationships, built over time, with schools teachers and districts.
6. Incorporation of community-based and best practice approaches to develop and enhance programming and
organizational systems.
7. Continual program enhancement process based on evaluation and outside resources.
8. Innovative and intentional planning for all program and organizational activities.
9. Strong and committed leadership with high accountability (including a mechanism to transition leadership to
student leaders as they mature through the programs).
10. Powerful culture that is rooted in the belief of young peoples’ abilities.
11. Ability to secure diverse, sustainable financial support. 12. Programming that is based in the following
guiding principles:
a. In order to build and sustain interest in the sciences, young people must be provided with
early life experiences in the sciences and continue to be engaged in progressively rigorous
experiences throughout their education.
b. Discovery provides the spark that makes young people want to learn.
c. The most potent and empowering education provides authentic experiences such as
scientific research and actions that benefit the environment.
d. The best strategies for teaching science and building an environmental ethic incorporate
experience in nature.
e. The most effective environments for learning draw upon students’ assets, talents, and
strengths.
f. Educational initiatives must eliminate the unique barriers faced by urban, diverse young
people as they study science and pursue higher education.
10
Partnership with an existing organization initially appeared to be the best option because it would take
fewer resources to move forward and would leverage local knowledge of community being served.
Ocean Discovery Institute’s leadership used the criteria to identify the partner organization and the
location for replication that would be the focus of their application to the B-WET program. Based on
those criteria, they proposed to replicate their program model in Washington, DC with Living Classrooms
of the National Capitol Region as a major partner. Ocean Discovery Institute was successful in securing
$375,000 over a 3-year period to support the feasibility study described in this report5. The project’s
proposed scope was scaled back and the work plan underwent initial revisions based on both a reduced
budget, as well as comments from the reviewers of the grant application and the NOAA program officer
managing the award process. These changes allowed the project team a more realistic timeframe for
planning (i.e., this feasibility study) and pilot implementation. Even with those changes, the approved
work plan was based on the assumption that Ocean Discovery Institute would be assisting another
existent organization with adaptation of their program model in Washington, DC and that it would
include pilot implementation by Year 3. Both these assumptions would be revised as the feasibility study
began yielding findings.
During their first visit to Washington, DC after receiving the B-WET funding, Ocean Discovery Institute’s
project team realized they must expand their pool of potential partners in the region. There were several
reasons for this. First, key personnel with whom the partnership strategy had been developed had
recently departed Living Classrooms of the National Capital Region. Rather than forge ahead with Living
Classrooms as their primary partner, the team decided to open the search for a local partner beyond
Washington, DC. Second, the team was encouraged by their program officer not to limit their site
investigations to Baltimore and Washington, DC, but to also include the Hampton Roads area. This
ensured that the broader Chesapeake Bay region was considered.
Members of Ocean Discovery Institute’s Board of Directors served on a task force to advise on replication
strategies and implementation. Initially two interns were brought on board to assist with GIS analyses of
5 Cooperative Agreement
No. NA13NMF4570200.
Figure 7 . A range of options were considered for replication in the Chesapeake Bay region. Option C was the preferred option at the start of the feasibility study, but this would change to D during the course of the study.
A B
C
D
Dissemination
Strategic alliance with
shared outcomes
Create Ocean Discovery
on East Coast
Work w ith local partner
organization(s ) and adapt
model
Low I nvestment
High I nvestment
11
key characteristics of the urban centers under consideration, and to investigate the literature on
partnership models vis á vis replication. The latter was completed by a paid consultant as the team
realized they needed someone with relevant experience who could work independently to produce the
needed deliverables6. Lastly, the core replication team was complete when John Dillow, formerly of
Living Classrooms of the National Capitol Region, was brought on as a consultant because of his extensive
experience with non-profit replication, and Sarah Schoedinger agreed to serve the project advisor from
NOAA. With the replication team and task force in place, the team gathered at Ocean Discovery
Institute’s offices in San Diego to map out processes and define metrics for the selection of a site and
partnering organizations as well as refine the project’s research targets.
In order to address the feasibility of replication in the Chesapeake Bay region, the project team used their
model criteria (see box on p.9) to guide the development of quantitative and qualitative research methods
in this feasibility study and these criteria were translated into Ocean Discovery Institute’s Business Model.
The Methods section of this report will go into greater detail about how the team gathered and analyzed
data, as well as managed the project. The Findings and Discussion section summarizes key findings and
lessons learned, and in the Conclusions and Recommendations section we will discuss the recommended
course of action and identify milestones that will be important to maintaining forward progress.
6 More on lessons learned about the use of unpaid interns are at the end of the Findings and Discussion section.
12
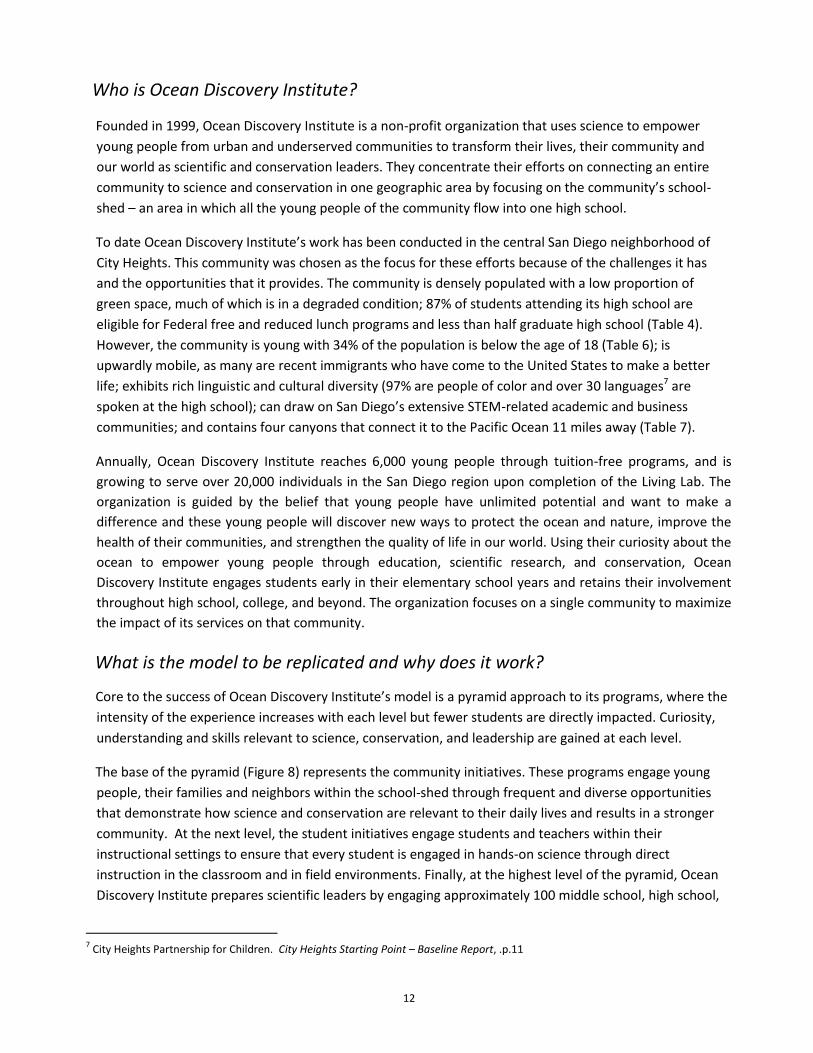
Who is Ocean Discovery Institute?
Founded in 1999, Ocean Discovery Institute is a non-profit organization that uses science to empower
young people from urban and underserved communities to transform their lives, their community and
our world as scientific and conservation leaders. They concentrate their efforts on connecting an entire
community to science and conservation in one geographic area by focusing on the community’s school-
shed – an area in which all the young people of the community flow into one high school.
To date Ocean Discovery Institute’s work has been conducted in the central San Diego neighborhood of
City Heights. This community was chosen as the focus for these efforts because of the challenges it has
and the opportunities that it provides. The community is densely populated with a low proportion of
green space, much of which is in a degraded condition; 87% of students attending its high school are
eligible for Federal free and reduced lunch programs and less than half graduate high school (Table 4).
However, the community is young with 34% of the population is below the age of 18 (Table 6); is
upwardly mobile, as many are recent immigrants who have come to the United States to make a better
life; exhibits rich linguistic and cultural diversity (97% are people of color and over 30 languages7 are
spoken at the high school); can draw on San Diego’s extensive STEM-related academic and business
communities; and contains four canyons that connect it to the Pacific Ocean 11 miles away (Table 7).
Annually, Ocean Discovery Institute reaches 6,000 young people through tuition-free programs, and is
growing to serve over 20,000 individuals in the San Diego region upon completion of the Living Lab. The
organization is guided by the belief that young people have unlimited potential and want to make a
difference and these young people will discover new ways to protect the ocean and nature, improve the
health of their communities, and strengthen the quality of life in our world. Using their curiosity about the
ocean to empower young people through education, scientific research, and conservation, Ocean
Discovery Institute engages students early in their elementary school years and retains their involvement
throughout high school, college, and beyond. The organization focuses on a single community to maximize
the impact of its services on that community.
What is the model to be replicated and why does it work?
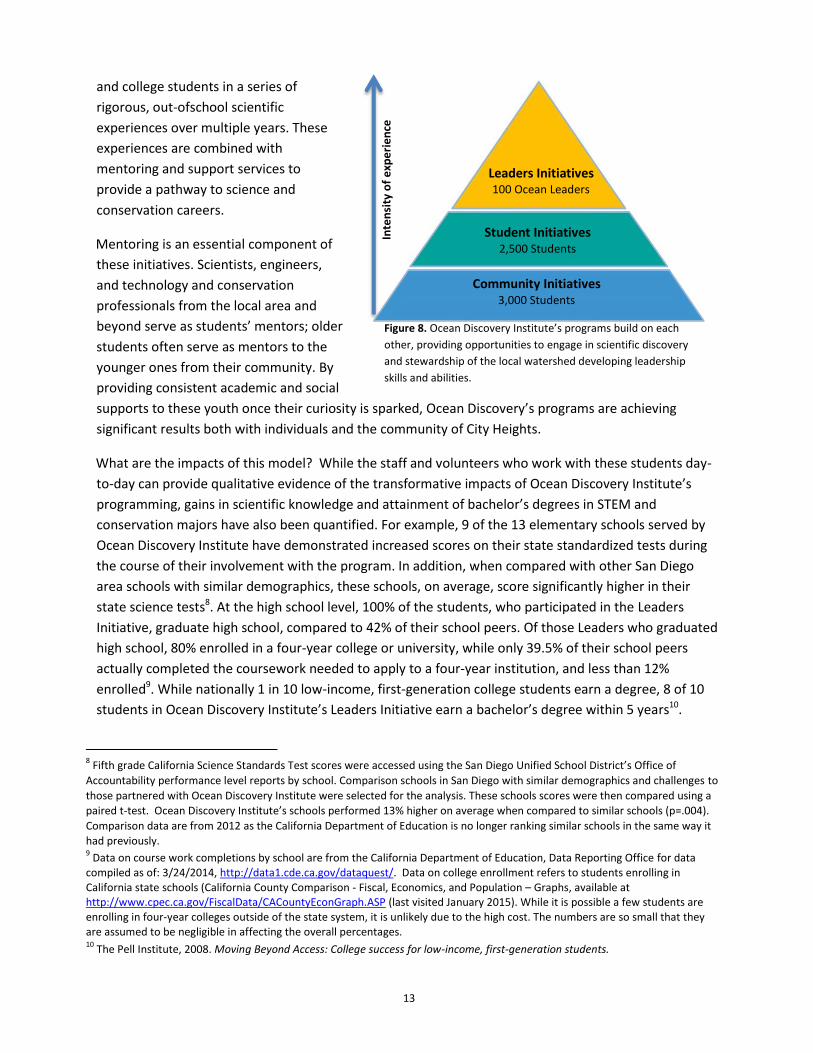
Core to the success of Ocean Discovery Institute’s model is a pyramid approach to its programs, where the
intensity of the experience increases with each level but fewer students are directly impacted. Curiosity,
understanding and skills relevant to science, conservation, and leadership are gained at each level.
The base of the pyramid (Figure 8) represents the community initiatives. These programs engage young
people, their families and neighbors within the school-shed through frequent and diverse opportunities
that demonstrate how science and conservation are relevant to their daily lives and results in a stronger
community. At the next level, the student initiatives engage students and teachers within their
instructional settings to ensure that every student is engaged in hands-on science through direct
instruction in the classroom and in field environments. Finally, at the highest level of the pyramid, Ocean
Discovery Institute prepares scientific leaders by engaging approximately 100 middle school, high school,
7 City Heights Partnership for Children. City Heights Starting Point – Baseline Report, .p.11
13
and college students in a series of
rigorous, out-ofschool scientific
experiences over multiple years. These
experiences are combined with
mentoring and support services to
provide a pathway to science and
conservation careers.
Mentoring is an essential component of
these initiatives. Scientists, engineers,
and technology and conservation
professionals from the local area and
beyond serve as students’ mentors; older
students often serve as mentors to the
younger ones from their community. By
providing consistent academic and social
supports to these youth once their curiosity is sparked, Ocean Discovery’s programs are achieving
significant results both with individuals and the community of City Heights.
What are the impacts of this model? While the staff and volunteers who work with these students day-
to-day can provide qualitative evidence of the transformative impacts of Ocean Discovery Institute’s
programming, gains in scientific knowledge and attainment of bachelor’s degrees in STEM and
conservation majors have also been quantified. For example, 9 of the 13 elementary schools served by
Ocean Discovery Institute have demonstrated increased scores on their state standardized tests during
the course of their involvement with the program. In addition, when compared with other San Diego
area schools with similar demographics, these schools, on average, score significantly higher in their
state science tests8. At the high school level, 100% of the students, who participated in the Leaders
Initiative, graduate high school, compared to 42% of their school peers. Of those Leaders who graduated
high school, 80% enrolled in a four-year college or university, while only 39.5% of their school peers
actually completed the coursework needed to apply to a four-year institution, and less than 12%
enrolled9. While nationally 1 in 10 low-income, first-generation college students earn a degree, 8 of 10
students in Ocean Discovery Institute’s Leaders Initiative earn a bachelor’s degree within 5 years10.
8 Fifth grade California Science Standards Test scores were accessed using the San Diego Unified School District’s Office of
Accountability performance level reports by school. Comparison schools in San Diego with similar demographics and challenges to
those partnered with Ocean Discovery Institute were selected for the analysis. These schools scores were then compared using a
paired t-test. Ocean Discovery Institute’s schools performed 13% higher on average when compared to similar schools (p=.004).
Comparison data are from 2012 as the California Department of Education is no longer ranking similar schools in the same way it
had previously. 9 Data on course work completions by school are from the California Department of Education, Data Reporting Office for data
compiled as of: 3/24/2014, http://data1.cde.ca.gov/dataquest/. Data on college enrollment refers to students enrolling in California state schools (California County Comparison - Fiscal, Economics, and Population – Graphs, available at http://www.cpec.ca.gov/FiscalData/CACountyEconGraph.ASP (last visited January 2015). While it is possible a few students are enrolling in four-year colleges outside of the state system, it is unlikely due to the high cost. The numbers are so small that they are assumed to be negligible in affecting the overall percentages. 10
The Pell Institute, 2008. Moving Beyond Access: College success for low-income, first-generation students.
Figure 8. Ocean Discovery Institute’s programs build on each
other, providing opportunities to engage in scientific discovery
and stewardship of the local watershed developing leadership
skills and abilities.
Figure 8. Ocean Discovery Institute’s programs build on each
other, providing opportunities to engage in scientific discovery
and stewardship of the local watershed developing leadership
skills and abilities.
Leaders Initiatives
100 Ocean Leaders
Student Initiatives
2,500 Students
Community Initiatives
3,000 Students
Inte
nsi
ty o
f e
xpe
rie
nce
14
Finally, of the Leaders Initiative students who enrolled in a four-year college or university, 60% graduate
with a major in a STEM or conservation field.
By providing rigorous educational, scientific research, and environmental stewardship experiences, Ocean
Discovery Institute develops curiosity, scientific understanding and skills, and leadership abilities in
underserved urban youth as they grow from early ages into early careers. This is achieved through
providing continuous, tuition-free experiences across one entire school-shed.
The use of a watershed as both a real-world connection for the community they serve as well as a
metaphor for student matriculation, enables transferability of the model to other urbanized communities
in the United States as everyone lives in a watershed and each urban community has at least one school-
shed. This study set out to discover if Ocean Discovery Institute’s model could be replicated in any of the
urban communities of the Chesapeake Bay and under what circumstances.
15
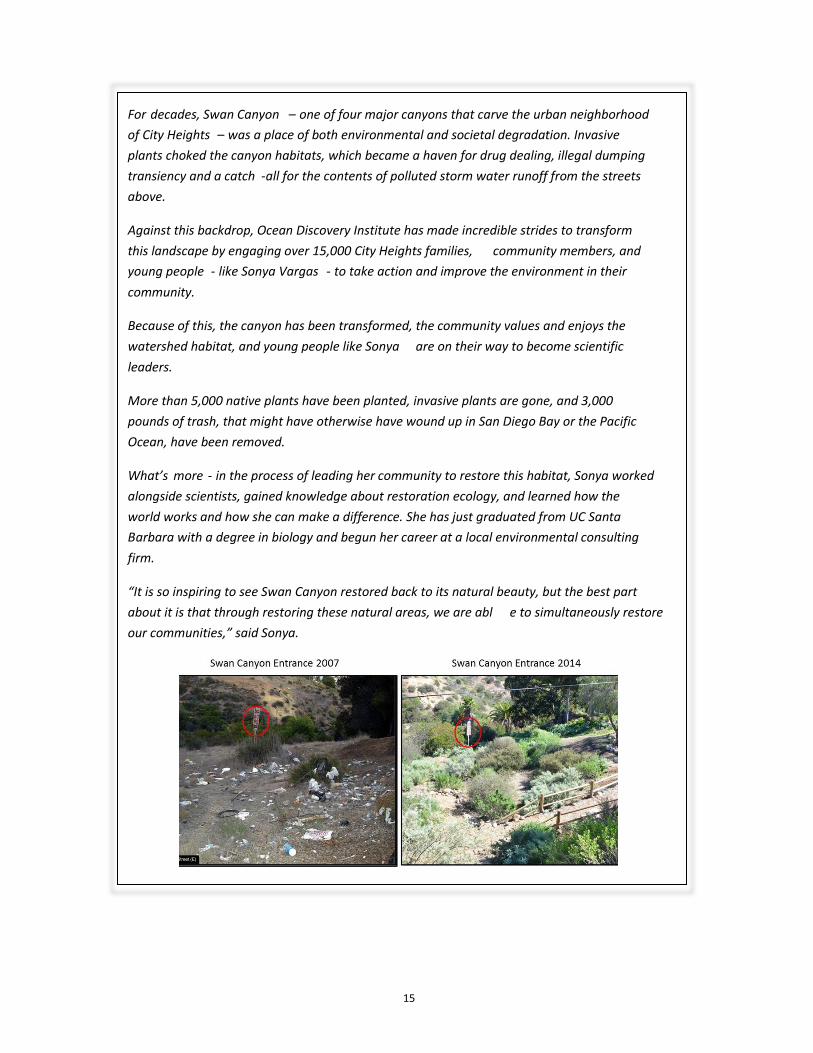
For decades, Swan Canyon – one of four major canyons that carve the urban neighborhood
of City Heights – was a place of both environmental and societal degradation. Invasive
plants choked the canyon habitats, which became a haven for drug dealing, illegal dumping
transiency and a catch - all for the contents of polluted storm water runoff from the streets
above.
Against this backdrop, Ocean Discovery Institute has made incredible strides to transform
this landscape by engaging over 15,000 City Heights families, community members, and
young people - like Sonya Vargas - to take action and improve the environment in their
community.
Because of this, the canyon has been transformed, the community values and enjoys the
watershed habitat, and young people like Sonya are on their way to become scientific
leaders.
More than 5,000 native plants have been planted, invasive plants are gone, and 3,000
pounds of trash, that might have otherwise have wound up in San Diego Bay or the Pacific
Ocean, have been removed.
What’s more - in the process of leading her community to restore this habitat, Sonya worked
alongside scientists, gained knowledge about restoration ecology, and learned how the
world works and how she can make a difference. She has just graduated from UC Santa
B arbara with a degree in biology and begun her career at a local environmental consulting
firm.
“It is so inspiring to see Swan Canyon restored back to its natural beauty, but the best part
about it is that through restoring these natural areas, we are abl e to simultaneously restore
our communities,” said Sonya.
16
Methods
Approach
Is it feasible to replicate Ocean Discovery Institute’s model in the Chesapeake Bay region? This is the
main question this study sought to address. This question was broken down into two sub-parts: (1)
“Which replication strategy will be most successful?” and (2) “Which location, if any, would enable
implementation of the model to succeed?” These two parts to the overall research question were
investigated more or less simultaneously but relied on different methods and sources of data which will
be described further in this section and Appendix A. The team utilized instinct based on experience and
data to make decisions throughout the study.
The Project Team
Planning for replication in the Chesapeake Bay has relied on an array of stakeholders and staff for
guidance. Various members from these groups provided input prior to the B-WET Program award as
well as during this feasibility study phase of the project. This input has guided the core replication team
throughout the project. The core team comprises:
• Shara Fisler, Ocean Discovery Institute’s Executive Director and Founder. She provided strategic
guidance with staff and board.
• Lindsay Goodwin, Ocean Discovery Institute’s Associate Director, has been with the organization
since 2001. She focused on developing and growing programs in San Diego and was responsible
for development of key project deliverables for the study.
• Carla Pisbe, Ocean Discovery Institute’s Replication Project Coordinator, began as student in 2004.
She coordinated the project team and represented community and student instincts during the
study.
• MacKenzie Sandy, Ocean Discovery Institute’s Director of Philanthropy, has been with the
organization since 2010, leading fundraising efforts and ensuring financial sustainability of the
organization. She assisted with development of a plan to start and sustain replication in a new
location.
• John Dillow, a consultant with Orenda Associates, has extensive experience with creating,
acquiring, merging, and replicating non-profit organizations focused on environmental education
and youth development in Baltimore and Washington, DC (among other locations). He assisted
the team with on-the-ground research of potential partners, locations, and STEM and funding
resources.
• Sarah Schoedinger, a senior program manager with NOAA’s Office of Education, provided linkages
to regional partners, ensured NOAA’s resources in the region will be integrated into replication,
and wrote this report.
Searching their local professional networks, Ocean Discovery Institute’s leadership assembled a team of
two interns one to assist with GIS mapping of census data in the regions being considered for
replication and the other to conduct a literature review of replication strategies. Ultimately, they hired a
17
consultant to complete the work of the interns. Bemmy Mahammarov, a GIS specialist pursuing a PhD at
University of California-Irvine, used GIS with publicly available data sources to assist the core team in
identifying potential school-sheds in Baltimore, Washington, DC and the Hampton Roads11 region. Her
preliminary analyses were supplemented by additional research by the project team members and
Sarvat Maharramli. Sarvat is an independent management consultant who was with AECOM for 5 years
where he managed operations, finance, procurement, reporting, monitoring, evaluation and client
relationships of a regional climate change adaptation project that covered 27 countries in Asia and the
Pacific. Sarvat also completed a review of the literature regarding replication models of social and
educational programs. In addition, he provided continual guidance during the development of this
report.
Ocean Discovery Institute’s Board of Directors established a task force composed of four members who
have expertise in leadership development and culture management; communications; starting companies
and bringing new products to market; and strategic planning for organizational development and funding.
The members are:
• Kurt Gering (Board chair), Director of Talent Culture & Capability, San Diego International Airport;
• Scott Grimes, Program Officer, Endangered Habitats League; and
• John Johns, President, Providence Marketing Corporation;
• Benson Lam, Vice President of Strategies and Operations, Qualcomm Technologies, Inc.
Additionally, board member Ted Griswold, Partner with Procopio, Cory, Hargreaves & Savitch, LLP,
provided legal expertise on the proposed organizational structure to support replication.
Finally, Ocean Discovery staff, students, and their parents were asked to provide input at key points in
preparation for and during the feasibility study on replication. Of particular importance to this feasibility
study, all these stakeholders assisted in the development of the
Ocean Discovery Institute Business Model, which defines the characteristics of the organization, of its
operations, and of the community in which it works that together contribute to Ocean Discovery
Institute’s success.
11
Hampton Roads is the name of a metropolitan area in Southeastern Virginia that includes the cities of Norfolk Chesapeake,
Newport News, Hampton, Portsmouth, Suffolk, Poquoson, Virginia Beach and Williamsburg
(http://visithampton.com/discover/trivia/ and http://en.wikipedia.org/wiki/Hampton_Roads.
18
Data Collection and Analysis
Which replication strategy will be most successful?
To answer the question of which replication strategy would be best for successful implementation of
Ocean Discovery Institute’s model, three methods were used:
1. Literature review on published studies of replication by social service organizations in the United
States and the United Kingdom;
2. Research on thirteen active models by conducting interviews and/or reading case studies of
educational or youth and workforce development organizations that had expanded operations
through replication12; and
3. Internal evaluation by Ocean Discovery Institute staff and board members regarding their
existing business model.
The information that was gleaned through this three-pronged approach (Figure 9) provided continual
guidance as the team delved into the research on the best strategy for replication. The literature review
and active model research identified successful models and lessons learned regarding expansion via
replication. This research informed refinement of Ocean Discovery Institute’s Business Model and
recommendations for an organizational structure that can support replication long term and across
multiple locations.
The internal evaluation consisted of a series of facilitated workshops that brought together Ocean
Discovery Institute staff, board members, students and families, and external partners to identify the
essential components of their model, i.e., the components that drive success and are non-negotiable
requirements. This internal evaluation identified the initial model criteria that eventually evolved into a
more fully-described business model and informed decisions about the proposed organizational
structures to support replication. These criteria were also translated into quantitative and qualitative
variables that assisted the team in answering the second part of the overall research question regarding
which location that would be best for replication based on how well the locations fit Ocean Discovery
Institute’s model.
12
Replication team members from Ocean Discovery Institute, reviewed case studies or conducted interviews with representatives of
The Aravind Eye Hospital, AVID, Goodwill, Green Dot Public Schools, Harlem Children's Zone, Joblink, KaBOOM!, KIPP, Living
Classrooms, Luna Dance Institute, Manchester Bidwell Corporation, Strive, and Year Up.

19
Which location, if any, would enable implementation of the model to succeed?
Although initial meetings with potential partners and NOAA staff in January 2012 indicated that Ocean
Discovery Institute’s model could fill a need, the question was still open regarding which location, if any,
would be suitable for replication. This question was addressed through two additional lines of
investigation: (1) an analysis of how well each metro area fits the model and (2) an analysis of the capacity
of the region to financially support the model. The team used quantitative and qualitative approaches to
inform these analyses.
(1) Analysis of How Well Each Metro Area Fits the Model
The locations’ fit to the model was investigated using hard (essential) and soft (important but not
essential) variables that were identified in the internal evaluation and then mapped to publicly available
data sources (i.e., US Census data from 2010, state departments of education and local school districts’
data from 2011-2012 academic year). These variables were reviewed at increasing levels of geographic
granularity as the team’s research proceeded (Figure 10). Hard variables were characteristics of the
school or community deemed essential to successful replication (Table 1 and Table 2). Threshold values
for a few of the hard variables were established to assist in the winnowing process. Soft variables are
variables that were deemed important to determining place but not “deal-breakers” (Table 3). Hoover
High School, the main high school serving City Heights, provided the benchmark for school and
community variables that were researched.
Replication Strategy
Assessment
Literature Review:
Research supporting replication approaches
Active Models:
Best practices & lessons learned
from practitioners
Internal Evaluation:
Successful practices &
lessons learned
Figure 9 . The team’s approach to understanding which strategy for replication would be most successful in implementing Ocean Discovery’s model comprised three methods whi ch drew on native knowledge of the staff and board members, findings from published literature on replication by other nonprofits providing educational and/or social services, and interviews with practitioners whose programs had grown from local level to r egional/national level .
20
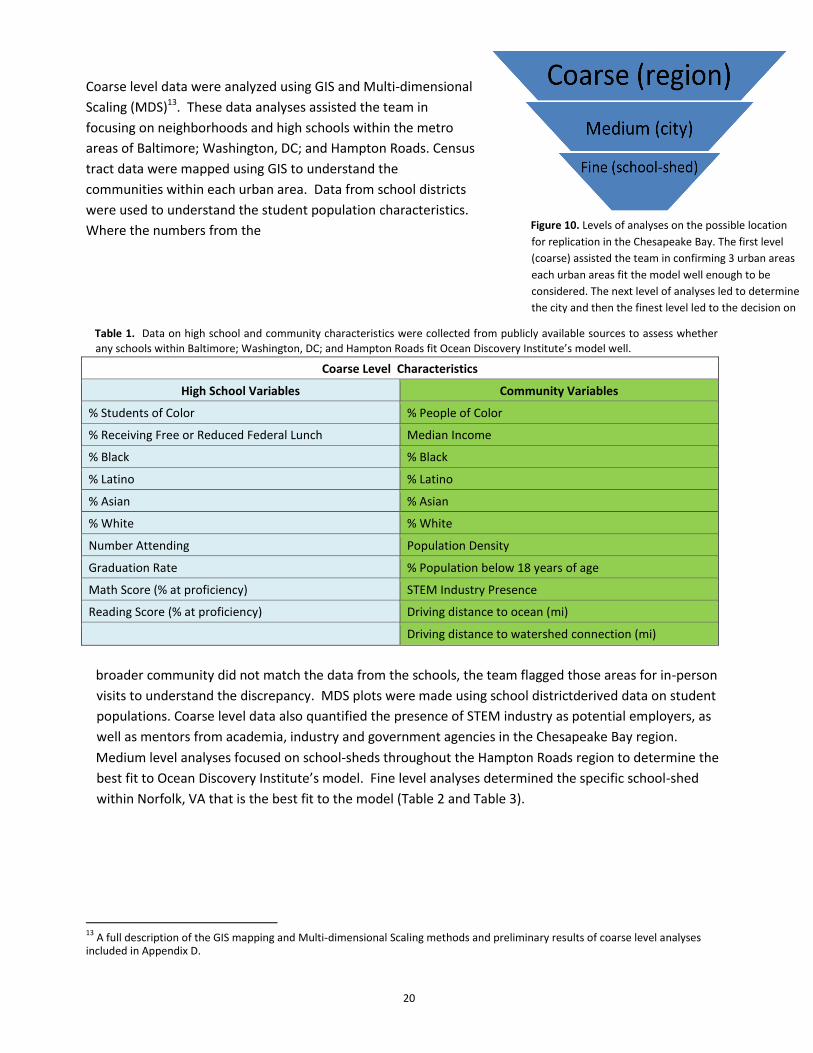
Coarse level data were analyzed using GIS and Multi-dimensional
Scaling (MDS)13. These data analyses assisted the team in
focusing on neighborhoods and high schools within the metro
areas of Baltimore; Washington, DC; and Hampton Roads. Census
tract data were mapped using GIS to understand the
communities within each urban area. Data from school districts
were used to understand the student population characteristics.
Where the numbers from the
Table 1. Data on high school and community characteristics were collected from publicly available sources to assess whether
any schools within Baltimore; Washington, DC; and Hampton Roads fit Ocean Discovery Institute’s model well.
Coarse Level Characteristics
High School Variables Community Variables
% Students of Color % People of Color
% Receiving Free or Reduced Federal Lunch Median Income
% Black % Black
% Latino % Latino
% Asian % Asian
% White % White
Number Attending Population Density
Graduation Rate % Population below 18 years of age
Math Score (% at proficiency) STEM Industry Presence
Reading Score (% at proficiency) Driving distance to ocean (mi)
Driving distance to watershed connection (mi)
broader community did not match the data from the schools, the team flagged those areas for in-person
visits to understand the discrepancy. MDS plots were made using school districtderived data on student
populations. Coarse level data also quantified the presence of STEM industry as potential employers, as
well as mentors from academia, industry and government agencies in the Chesapeake Bay region.
Medium level analyses focused on school-sheds throughout the Hampton Roads region to determine the
best fit to Ocean Discovery Institute’s model. Fine level analyses determined the specific school-shed
within Norfolk, VA that is the best fit to the model (Table 2 and Table 3).
13
A full description of the GIS mapping and Multi-dimensional Scaling methods and preliminary results of coarse level analyses included in Appendix D.
Figure 10. Levels of analyses on the possible location
for replication in the Chesapeake Bay. The first level
(coarse) assisted the team in confirming 3 urban areas
each urban areas fit the model well enough to be
considered. The next level of analyses led to determine
the city and then the finest level led to the decision on
school-shed.
Figure 10. Levels of analyses on the possible location for
replication in the Chesapeake Bay. The first level (coarse)
assisted the team in confirming 3 urban areas each urban
areas fit the model well enough to be considered. The next
level of analyses led to determine the city and then the
finest level led to the decision on school-shed.
21
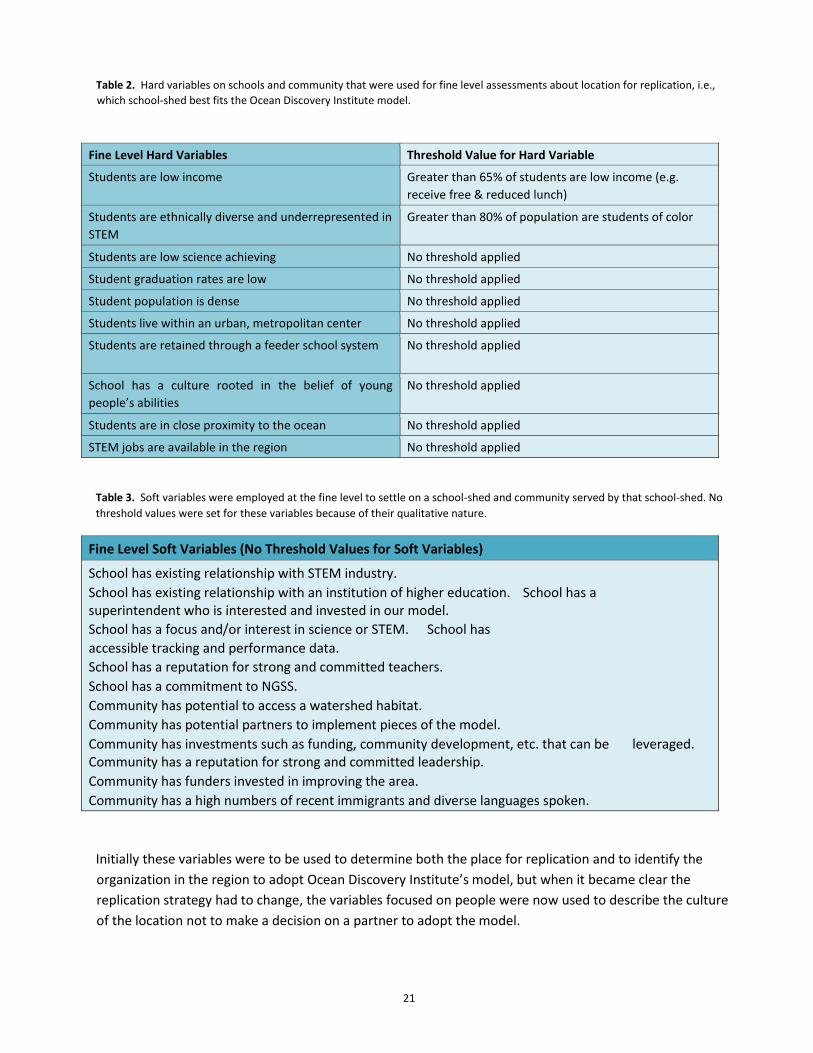
Table 2. Hard variables on schools and community that were used for fine level assessments about location for replication, i.e.,
which school-shed best fits the Ocean Discovery Institute model.
Fine Level Hard Variables Threshold Value for Hard Variable
Students are low income Greater than 65% of students are low income (e.g. receive free & reduced lunch)
Students are ethnically diverse and underrepresented in
STEM Greater than 80% of population are students of color
Students are low science achieving No threshold applied
Student graduation rates are low No threshold applied
Student population is dense No threshold applied
Students live within an urban, metropolitan center No threshold applied
Students are retained through a feeder school system No threshold applied
School has a culture rooted in the belief of young
people’s abilities No threshold applied
Students are in close proximity to the ocean No threshold applied
STEM jobs are available in the region No threshold applied
Table 3. Soft variables were employed at the fine level to settle on a school-shed and community served by that school-shed. No
threshold values were set for these variables because of their qualitative nature.
Fine Level Soft Variables (No Threshold Values for Soft Variables)
School has existing relationship with STEM industry.
School has existing relationship with an institution of higher education. School has a superintendent who is interested and invested in our model.
School has a focus and/or interest in science or STEM. School has
accessible tracking and performance data.
School has a reputation for strong and committed teachers.
School has a commitment to NGSS.
Community has potential to access a watershed habitat.
Community has potential partners to implement pieces of the model.
Community has investments such as funding, community development, etc. that can be leveraged. Community has a reputation for strong and committed leadership.
Community has funders invested in improving the area.
Community has a high numbers of recent immigrants and diverse languages spoken.
Initially these variables were to be used to determine both the place for replication and to identify the
organization in the region to adopt Ocean Discovery Institute’s model, but when it became clear the
replication strategy had to change, the variables focused on people were now used to describe the culture
of the location not to make a decision on a partner to adopt the model.
22
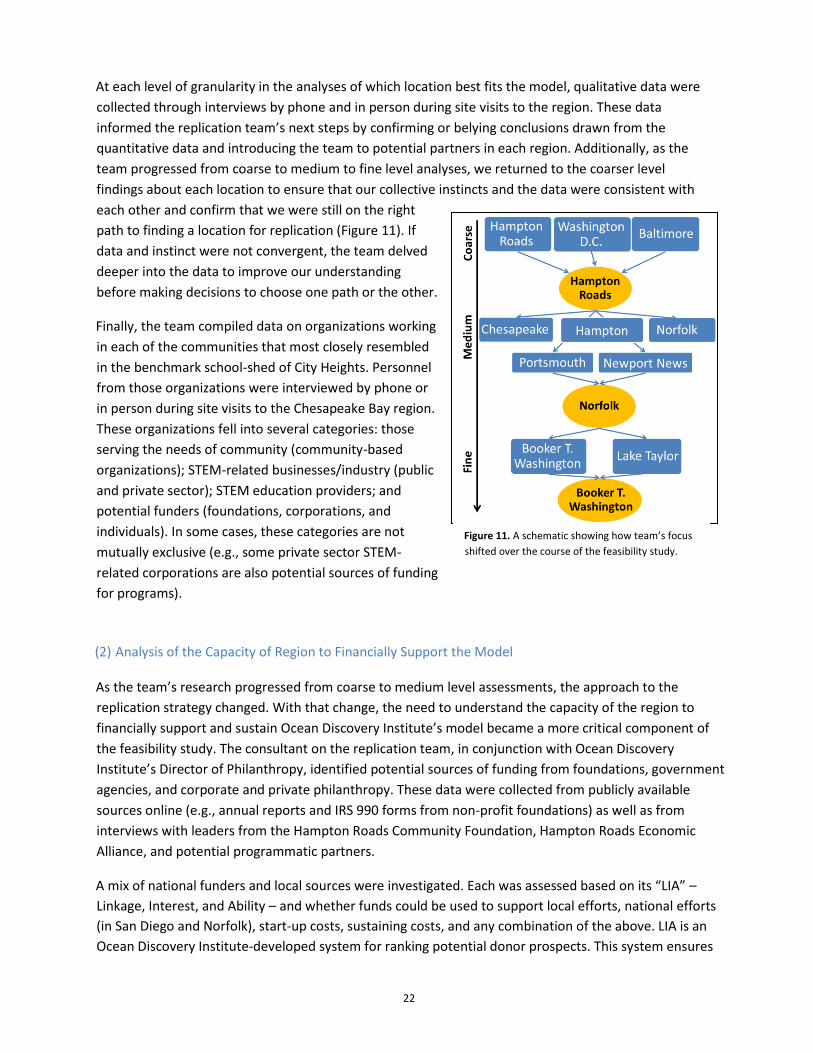
At each level of granularity in the analyses of which location best fits the model, qualitative data were
collected through interviews by phone and in person during site visits to the region. These data
informed the replication team’s next steps by confirming or belying conclusions drawn from the
quantitative data and introducing the team to potential partners in each region. Additionally, as the
team progressed from coarse to medium to fine level analyses, we returned to the coarser level
findings about each location to ensure that our collective instincts and the data were consistent with
each other and confirm that we were still on the right
path to finding a location for replication (Figure 11). If
data and instinct were not convergent, the team delved
deeper into the data to improve our understanding
before making decisions to choose one path or the other.
Finally, the team compiled data on organizations working
in each of the communities that most closely resembled
in the benchmark school-shed of City Heights. Personnel
from those organizations were interviewed by phone or
in person during site visits to the Chesapeake Bay region.
These organizations fell into several categories: those
serving the needs of community (community-based
organizations); STEM-related businesses/industry (public
and private sector); STEM education providers; and
potential funders (foundations, corporations, and
individuals). In some cases, these categories are not
mutually exclusive (e.g., some private sector STEM-
related corporations are also potential sources of funding
for programs).
(2) Analysis of the Capacity of Region to Financially Support the Model
As the team’s research progressed from coarse to medium level assessments, the approach to the
replication strategy changed. With that change, the need to understand the capacity of the region to
financially support and sustain Ocean Discovery Institute’s model became a more critical component of
the feasibility study. The consultant on the replication team, in conjunction with Ocean Discovery
Institute’s Director of Philanthropy, identified potential sources of funding from foundations, government
agencies, and corporate and private philanthropy. These data were collected from publicly available
sources online (e.g., annual reports and IRS 990 forms from non-profit foundations) as well as from
interviews with leaders from the Hampton Roads Community Foundation, Hampton Roads Economic
Alliance, and potential programmatic partners.
A mix of national funders and local sources were investigated. Each was assessed based on its “LIA” –
Linkage, Interest, and Ability – and whether funds could be used to support local efforts, national efforts
(in San Diego and Norfolk), start-up costs, sustaining costs, and any combination of the above. LIA is an
Ocean Discovery Institute-developed system for ranking potential donor prospects. This system ensures
Figure 11. A schematic showing how team’s focus
shifted over the course of the feasibility study.
23
that Ocean Discovery Institute prioritizes the strongest prospects rather than expending valuable
resources on all funding opportunities that present themselves. These three characteristics are defined
as:
1) Linkage - whether or not Ocean Discovery Institute has an existing relationship that could result in an
introduction to a prospect;
2) Interest - whether or not the prospect has interests aligned with Ocean Discovery Institute’s mission;
and
3) Ability - whether or not the prospect has the capacity to contribute financially.
Each characteristic is assessed and given a score of 1 to 3, with 1 being the weakest and 3 being the
strongest. The scores are averaged and a final LIA score of 1 to 3 is assigned to all prospects.
Tools and Process for Communication and Documentation
The team also developed communication tools for reaching out to prospective partners in each city
about the replication project. We developed a protocol for interviewing people in each region (including
questions and process to be followed in each interview) to ensure we consistently gathered data on
potential partners, locations, and strategies that would lead to successful replication (Appendix B).
However, strict adherence was not required and we deviated from these protocols when circumstances
required it. Additionally, the members of the core replication team provided project updates to potential
partners and current stakeholders every few months.
Because of the geographical distribution of the core replication team (one member near Baltimore, one in
Charlotte, and four in San Diego), the team set up an online space for sharing documents (BaseCamp) and
maintaining a project calendar. Throughout the project, the core team held regular conference calls every
four to six weeks with two- to three-person teams checking in with each other more frequently as needed.
The project coordinator tracked the team’s progress with a Gantt chart and prepared detailed agendas
and briefing materials for each in-person meeting (i.e., site visits to Baltimore; Washington, DC; and
Hampton Roads or planning meetings in San Diego). During site visits, the core team would conduct a
daily debrief of the team’s findings. These were semi-structured to ensure we addressed outstanding
questions that the site visit was intended to answer, and that we defined and assigned next steps. Notes
about the daily debriefs were collated with notes taken by individual members of team to summarize the
findings of each site visit.
24
Results and Discussion
Which location, if any, would enable implementation of the model to succeed?
Coarse Level Assessment of How Well the Locations Fit Ocean Discovery Institute’s Model
and the Capacity of the Region to Support the Model
The original plan for replication assumed that Ocean Discovery Institute would share their program
model with another organization already operating in the region and assist them with adapting the
model. This organization would be chosen because it was working with underserved youth in one of the
Chesapeake Bay’s urban areas as well as its strong alignment with Ocean Discovery Institute’s mission
and culture. The initial proposal to NOAA identified Living Classrooms of the National Capitol Region as
the implementing partner, and proposed Ward 7 or 8 in Washington, DC as the potential site for
replication. However, with a the change in leadership at Living Classrooms of the National Capital Region
early in the project, the replication team expanded the site options to include the metropolitan areas of
Hampton Roads and Baltimore. Regardless, the assumption remained that the replication team would
identify a lead organization to adopt the program model. Therefore data collection and analysis at the
coarse level focused on confirming that (1) there was need for the model within the region and (2) there
were communities and school-sheds that could serve as the focus for pilot implementation. Since the
team relied on data gathering and instincts based on experience to guide its research, the findings below
will reflect a blend of quantitative and qualitative data and instincts.
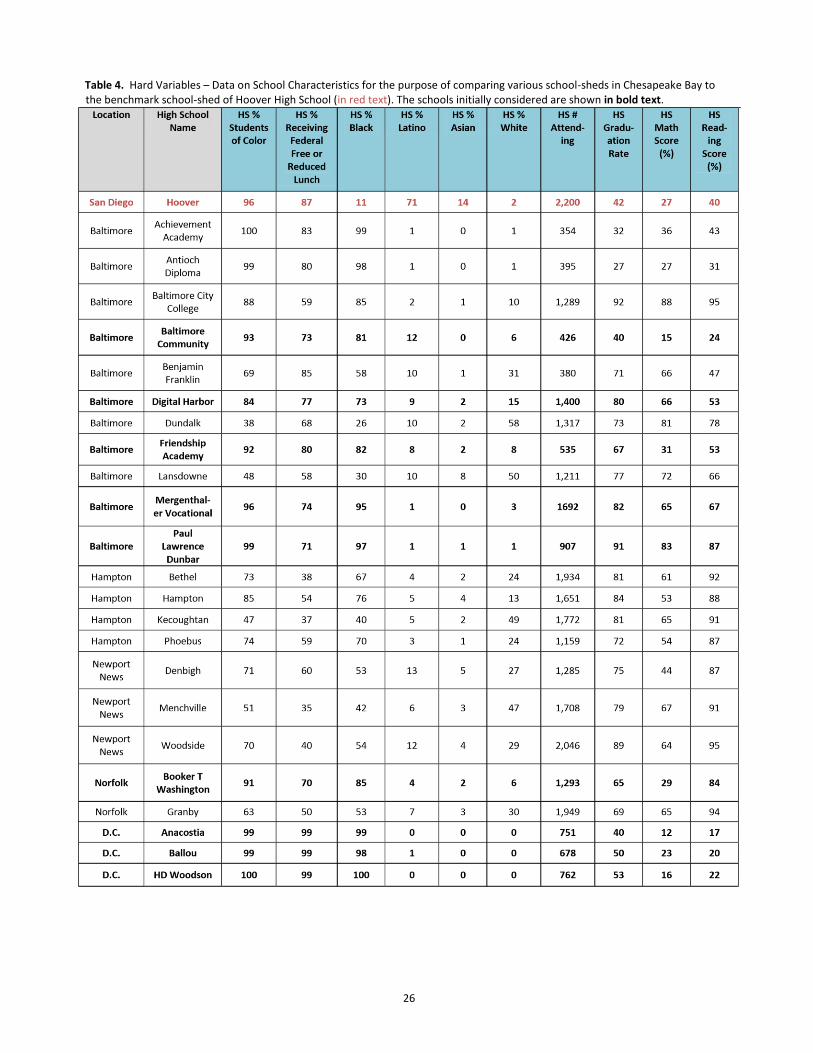
Finding #1: There is high need for Ocean Discovery Institute’s model in the Chesapeake Bay region.
While not a shocking conclusion (given the feasibility study was funded based on preliminary analysis of
the needs in the region), data on the “hard variables” for community and high school characteristics that
fit Ocean Discovery Institute’s model indicated there were high schools that may have school-sheds with
similarity to the benchmark, Hoover High School. These data also showed how unique the Hoover High
school-shed and City Heights community are in terms of density and diversity of the population. None of
the areas in the Chesapeake Bay region examined by the team were as densely populated or as racially
diverse as City Heights, although several high schools showed high percentages of students of color (Table
4).
The GIS mapping of community variables and a multi-dimensional scaling plot of school and community
variables confirmed that there were pockets of need within each urban area in the region that were high
enough to meet the threshold values for the hard variables of Ocean Discovery Institute’s model with
respect to percentage of students on Federal free/reduced lunch and percentage of students of color
(Table 4 and Table 6).
25
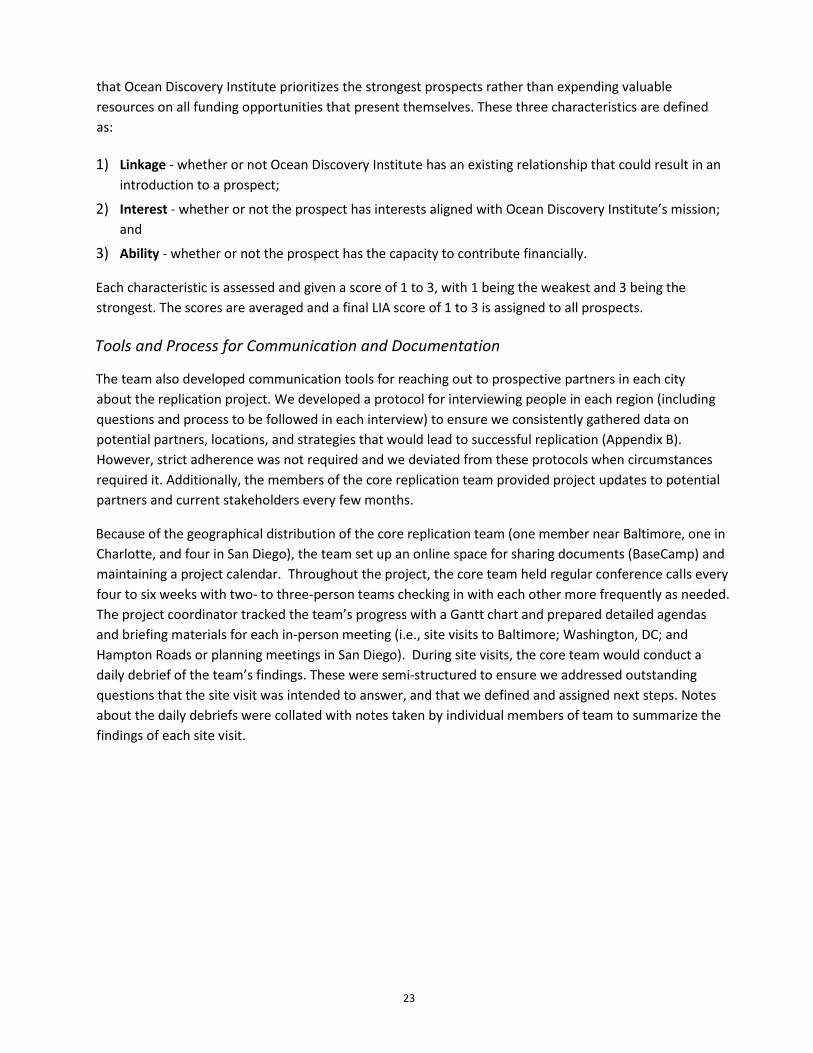
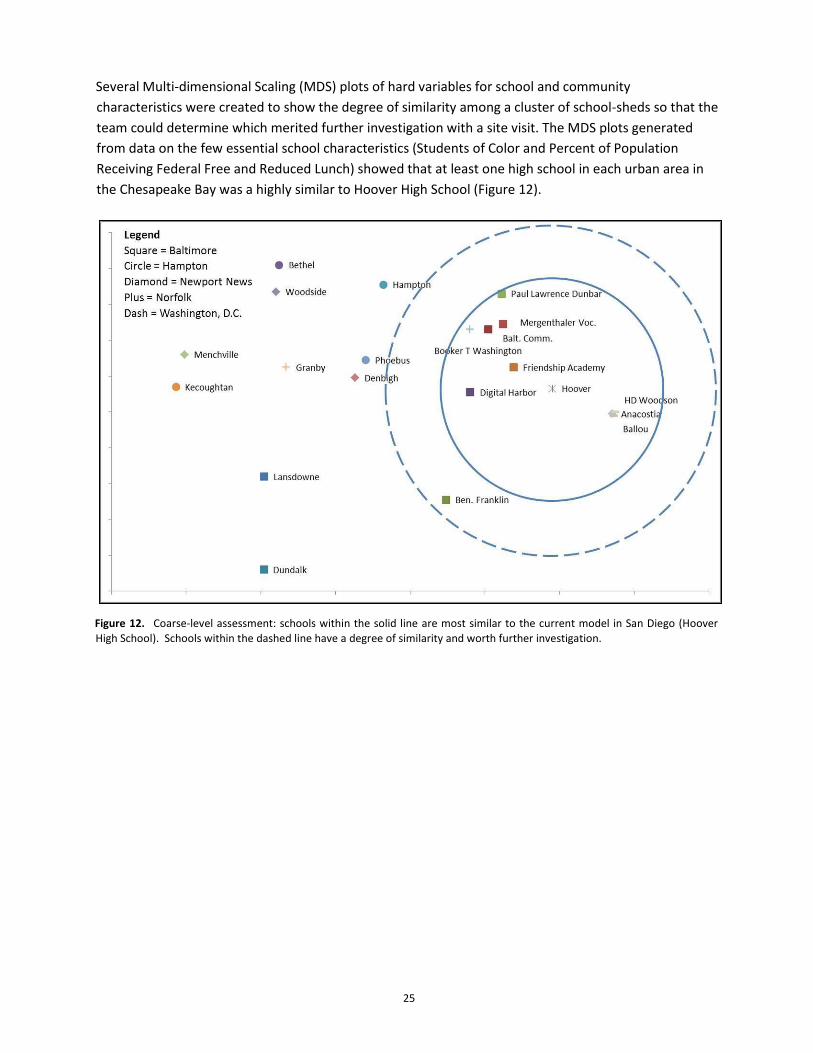
Several Multi-dimensional Scaling (MDS) plots of hard variables for school and community
characteristics were created to show the degree of similarity among a cluster of school-sheds so that the
team could determine which merited further investigation with a site visit. The MDS plots generated
from data on the few essential school characteristics (Students of Color and Percent of Population
Receiving Federal Free and Reduced Lunch) showed that at least one high school in each urban area in
the Chesapeake Bay was a highly similar to Hoover High School (Figure 12).
Figure 12. Coarse-level assessment: schools within the solid line are most similar to the current model in San Diego (Hoover
High School). Schools within the dashed line have a degree of similarity and worth further investigation.
26
Table 4. Hard Variables – Data on School Characteristics for the purpose of comparing various school-sheds in Chesapeake Bay to the benchmark school-shed of Hoover High School (in red text). The schools initially considered are shown in bold text.
27
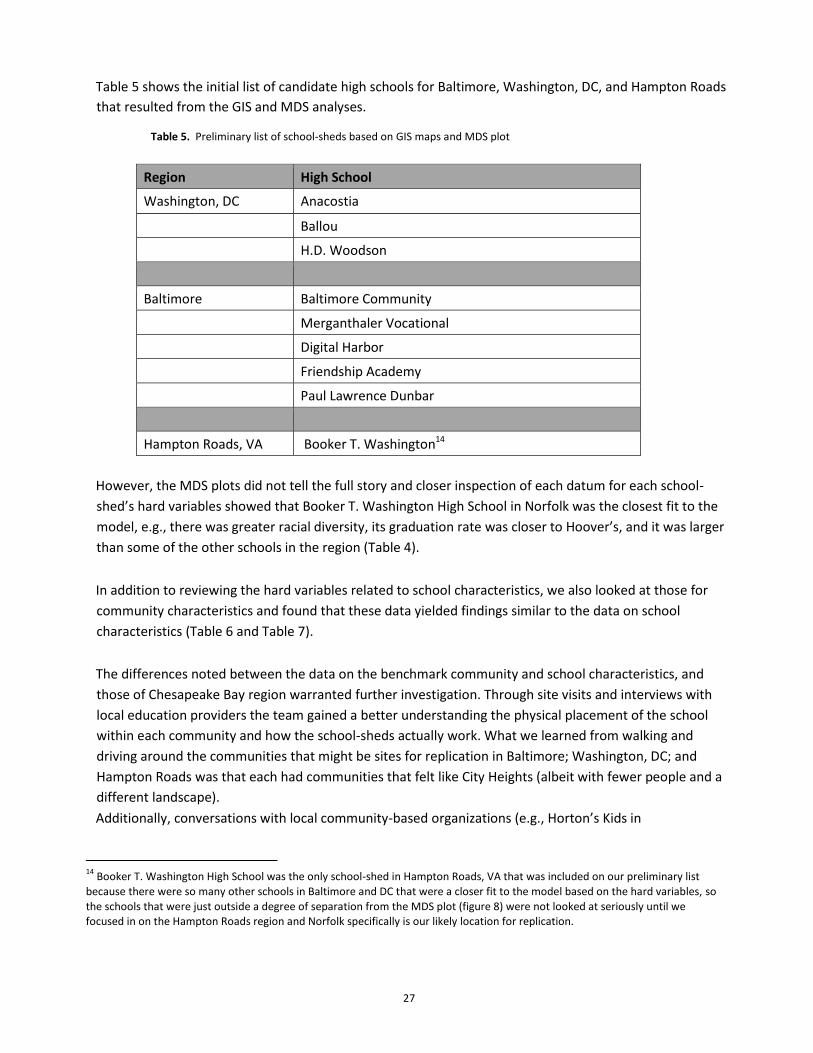
Table 5 shows the initial list of candidate high schools for Baltimore, Washington, DC, and Hampton Roads
that resulted from the GIS and MDS analyses.
Table 5. Preliminary list of school-sheds based on GIS maps and MDS plot
Region High School
Washington, DC Anacostia
Ballou
H.D. Woodson
Baltimore Baltimore Community
Merganthaler Vocational
Digital Harbor
Friendship Academy
Paul Lawrence Dunbar
Hampton Roads, VA Booker T. Washington14
However, the MDS plots did not tell the full story and closer inspection of each datum for each school-
shed’s hard variables showed that Booker T. Washington High School in Norfolk was the closest fit to the
model, e.g., there was greater racial diversity, its graduation rate was closer to Hoover’s, and it was larger
than some of the other schools in the region (Table 4).
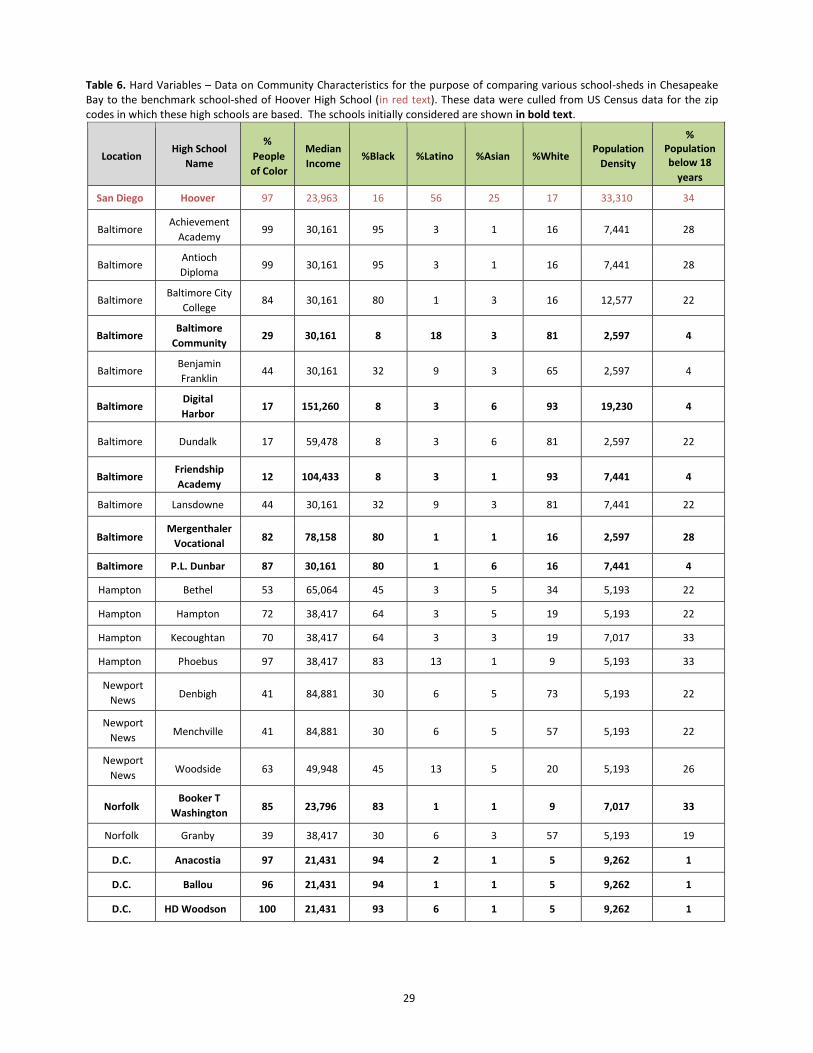
In addition to reviewing the hard variables related to school characteristics, we also looked at those for
community characteristics and found that these data yielded findings similar to the data on school
characteristics (Table 6 and Table 7).
The differences noted between the data on the benchmark community and school characteristics, and
those of Chesapeake Bay region warranted further investigation. Through site visits and interviews with
local education providers the team gained a better understanding the physical placement of the school
within each community and how the school-sheds actually work. What we learned from walking and
driving around the communities that might be sites for replication in Baltimore; Washington, DC; and
Hampton Roads was that each had communities that felt like City Heights (albeit with fewer people and a
different landscape).
Additionally, conversations with local community-based organizations (e.g., Horton’s Kids in
14
Booker T. Washington High School was the only school-shed in Hampton Roads, VA that was included on our preliminary list
because there were so many other schools in Baltimore and DC that were a closer fit to the model based on the hard variables, so
the schools that were just outside a degree of separation from the MDS plot (figure 8) were not looked at seriously until we focused in on the Hampton Roads region and Norfolk specifically is our likely location for replication.
28
Washington, Choice Jobs in Baltimore, Norfolk Redevelopment and Housing Authority in Norfolk)
confirmed that the need for Ocean Discovery Institute’s model was high as students in the high-poverty
areas of each city were completely disconnected from opportunities for STEM education and careers (see
box below).
As we embarked on our journey to explore cities for potential
replication in the Chesapeake Bay region, we never imagined finding
such an expansive science wasteland among the region’s high-poverty
communities.
We were well familiar with the data on the lack of science and low
science performance common in underserved communities, but it was
very different to experience this first hand. We sat through multiple
meetings with educators and community leaders and were reminded
of the entrenched challenges these students face. In a meeting with an
organization that has provided tutoring for over 15 years, not once
have they seen a student bring in science homework. When asking a
workforce development organization about their student’s career
interest they could not think of a single time when a student brought
up a career in science.
29
Table 6. Hard Variables – Data on Community Characteristics for the purpose of comparing various school-sheds in Chesapeake Bay to the benchmark school-shed of Hoover High School (in red text). These data were culled from US Census data for the zip codes in which these high schools are based. The schools initially considered are shown in bold text.
Location High School
Name
% People
of Color
Median
Income %Black %Latino %Asian %White
Population
Density
% Population below 18
years
San Diego Hoover 97 23,963 16 56 25 17 33,310 34
Baltimore Achievement
Academy 99 30,161 95 3 1 16 7,441 28
Baltimore Antioch
Diploma 99 30,161 95 3 1 16 7,441 28
Baltimore Baltimore City
College 84 30,161 80 1 3 16 12,577 22
Baltimore Baltimore
Community 29 30,161 8 18 3 81 2,597 4
Baltimore Benjamin
Franklin 44 30,161 32 9 3 65 2,597 4
Baltimore Digital Harbor
17 151,260 8 3 6 93 19,230 4
Baltimore Dundalk 17 59,478 8 3 6 81 2,597 22
Baltimore Friendship
Academy 12 104,433 8 3 1 93 7,441 4
Baltimore Lansdowne 44 30,161 32 9 3 81 7,441 22
Baltimore Mergenthaler
Vocational 82 78,158 80 1 1 16 2,597 28
Baltimore P.L. Dunbar 87 30,161 80 1 6 16 7,441 4
Hampton Bethel 53 65,064 45 3 5 34 5,193 22
Hampton Hampton 72 38,417 64 3 5 19 5,193 22
Hampton Kecoughtan 70 38,417 64 3 3 19 7,017 33
Hampton Phoebus 97 38,417 83 13 1 9 5,193 33
Newport
News Denbigh 41 84,881 30 6 5 73 5,193 22
Newport
News Menchville 41 84,881 30 6 5 57 5,193 22
Newport
News Woodside 63 49,948 45 13 5 20 5,193 26
Norfolk Booker T
Washington 85 23,796 83 1 1 9 7,017 33
Norfolk Granby 39 38,417 30 6 3 57 5,193 19
D.C. Anacostia 97 21,431 94 2 1 5 9,262 1
D.C. Ballou 96 21,431 94 1 1 5 9,262 1
D.C. HD Woodson 100 21,431 93 6 1 5 9,262 1
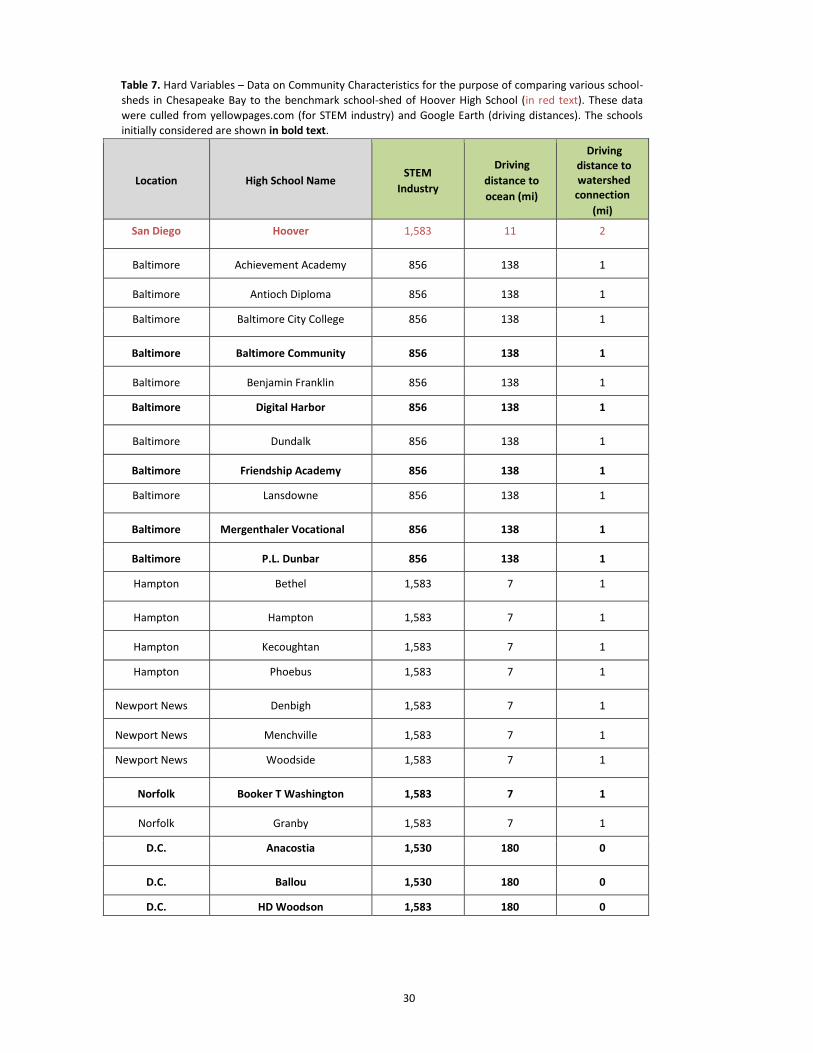
30
Table 7. Hard Variables – Data on Community Characteristics for the purpose of comparing various school-
sheds in Chesapeake Bay to the benchmark school-shed of Hoover High School (in red text). These data
were culled from yellowpages.com (for STEM industry) and Google Earth (driving distances). The schools
initially considered are shown in bold text.
Location High School Name STEM
Industry
Driving
distance to
ocean (mi)
Driving distance to watershed
connection (mi)
San Diego Hoover 1,583 11 2
Baltimore Achievement Academy 856 138 1
Baltimore Antioch Diploma 856 138 1
Baltimore Baltimore City College 856 138 1
Baltimore Baltimore Community 856 138 1
Baltimore Benjamin Franklin 856 138 1
Baltimore Digital Harbor 856 138 1
Baltimore Dundalk 856 138 1
Baltimore Friendship Academy 856 138 1
Baltimore Lansdowne 856 138 1
Baltimore Mergenthaler Vocational 856 138 1
Baltimore P.L. Dunbar 856 138 1
Hampton Bethel 1,583 7 1
Hampton Hampton 1,583 7 1
Hampton Kecoughtan 1,583 7 1
Hampton Phoebus 1,583 7 1
Newport News Denbigh 1,583 7 1
Newport News Menchville 1,583 7 1
Newport News Woodside 1,583 7 1
Norfolk Booker T Washington 1,583 7 1
Norfolk Granby 1,583 7 1
D.C. Anacostia 1,530 180 0
D.C. Ballou 1,530 180 0
D.C. HD Woodson 1,583 180 0
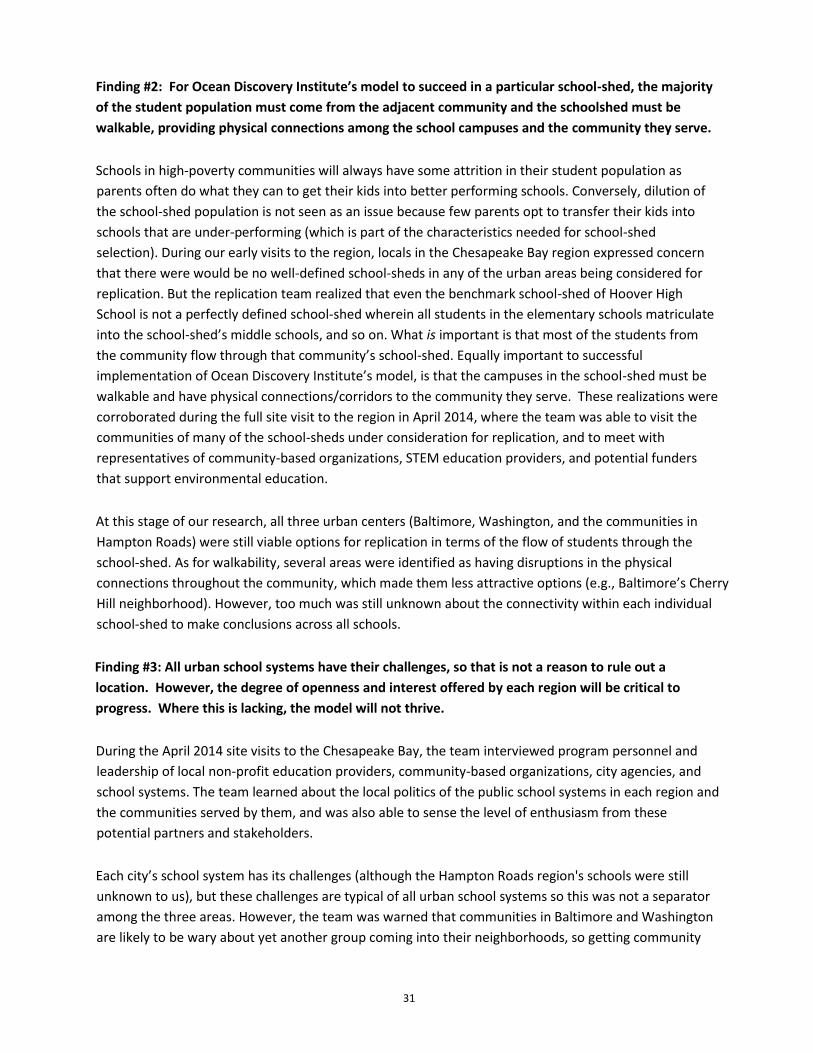
31
Finding #2: For Ocean Discovery Institute’s model to succeed in a particular school-shed, the majority
of the student population must come from the adjacent community and the schoolshed must be
walkable, providing physical connections among the school campuses and the community they serve.
Schools in high-poverty communities will always have some attrition in their student population as
parents often do what they can to get their kids into better performing schools. Conversely, dilution of
the school-shed population is not seen as an issue because few parents opt to transfer their kids into
schools that are under-performing (which is part of the characteristics needed for school-shed
selection). During our early visits to the region, locals in the Chesapeake Bay region expressed concern
that there were would be no well-defined school-sheds in any of the urban areas being considered for
replication. But the replication team realized that even the benchmark school-shed of Hoover High
School is not a perfectly defined school-shed wherein all students in the elementary schools matriculate
into the school-shed’s middle schools, and so on. What is important is that most of the students from
the community flow through that community’s school-shed. Equally important to successful
implementation of Ocean Discovery Institute’s model, is that the campuses in the school-shed must be
walkable and have physical connections/corridors to the community they serve. These realizations were
corroborated during the full site visit to the region in April 2014, where the team was able to visit the
communities of many of the school-sheds under consideration for replication, and to meet with
representatives of community-based organizations, STEM education providers, and potential funders
that support environmental education.
At this stage of our research, all three urban centers (Baltimore, Washington, and the communities in
Hampton Roads) were still viable options for replication in terms of the flow of students through the
school-shed. As for walkability, several areas were identified as having disruptions in the physical
connections throughout the community, which made them less attractive options (e.g., Baltimore’s Cherry
Hill neighborhood). However, too much was still unknown about the connectivity within each individual
school-shed to make conclusions across all schools.
Finding #3: All urban school systems have their challenges, so that is not a reason to rule out a
location. However, the degree of openness and interest offered by each region will be critical to
progress. Where this is lacking, the model will not thrive.
During the April 2014 site visits to the Chesapeake Bay, the team interviewed program personnel and
leadership of local non-profit education providers, community-based organizations, city agencies, and
school systems. The team learned about the local politics of the public school systems in each region and
the communities served by them, and was also able to sense the level of enthusiasm from these
potential partners and stakeholders.
Each city’s school system has its challenges (although the Hampton Roads region's schools were still
unknown to us), but these challenges are typical of all urban school systems so this was not a separator
among the three areas. However, the team was warned that communities in Baltimore and Washington
are likely to be wary about yet another group coming into their neighborhoods, so getting community
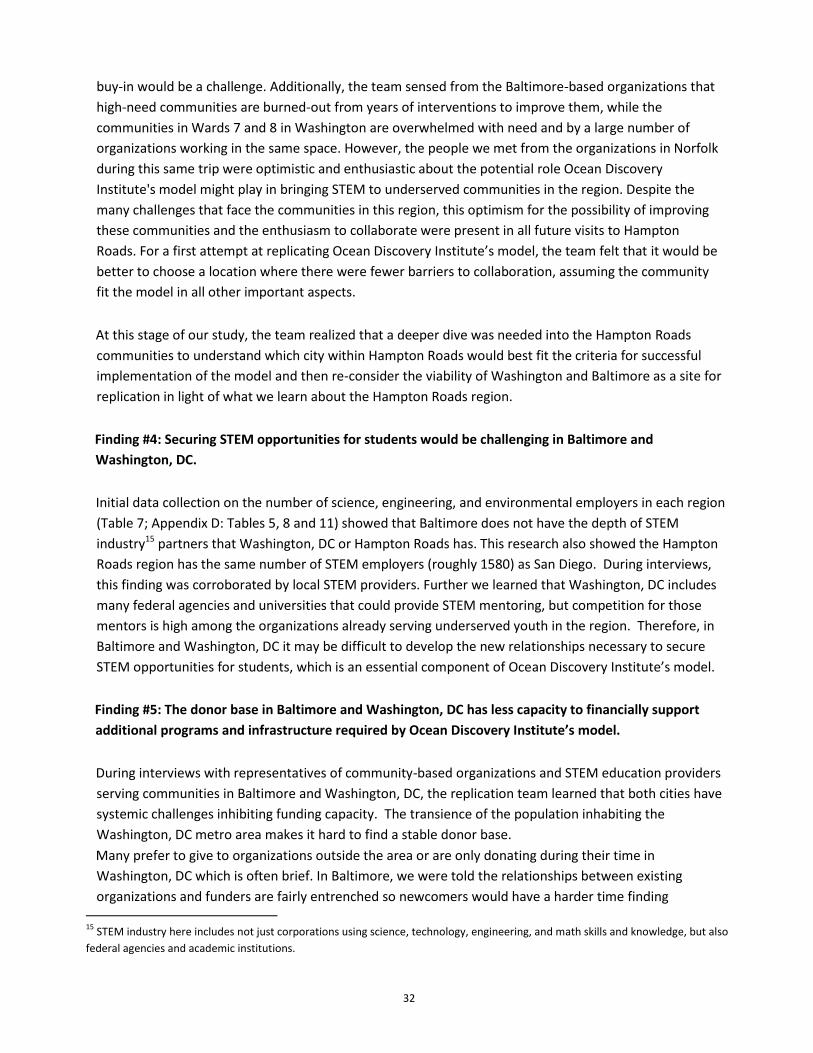
32
buy-in would be a challenge. Additionally, the team sensed from the Baltimore-based organizations that
high-need communities are burned-out from years of interventions to improve them, while the
communities in Wards 7 and 8 in Washington are overwhelmed with need and by a large number of
organizations working in the same space. However, the people we met from the organizations in Norfolk
during this same trip were optimistic and enthusiastic about the potential role Ocean Discovery
Institute's model might play in bringing STEM to underserved communities in the region. Despite the
many challenges that face the communities in this region, this optimism for the possibility of improving
these communities and the enthusiasm to collaborate were present in all future visits to Hampton
Roads. For a first attempt at replicating Ocean Discovery Institute’s model, the team felt that it would be
better to choose a location where there were fewer barriers to collaboration, assuming the community
fit the model in all other important aspects.
At this stage of our study, the team realized that a deeper dive was needed into the Hampton Roads
communities to understand which city within Hampton Roads would best fit the criteria for successful
implementation of the model and then re-consider the viability of Washington and Baltimore as a site for
replication in light of what we learn about the Hampton Roads region.
Finding #4: Securing STEM opportunities for students would be challenging in Baltimore and
Washington, DC.
Initial data collection on the number of science, engineering, and environmental employers in each region
(Table 7; Appendix D: Tables 5, 8 and 11) showed that Baltimore does not have the depth of STEM
industry15 partners that Washington, DC or Hampton Roads has. This research also showed the Hampton
Roads region has the same number of STEM employers (roughly 1580) as San Diego. During interviews,
this finding was corroborated by local STEM providers. Further we learned that Washington, DC includes
many federal agencies and universities that could provide STEM mentoring, but competition for those
mentors is high among the organizations already serving underserved youth in the region. Therefore, in
Baltimore and Washington, DC it may be difficult to develop the new relationships necessary to secure
STEM opportunities for students, which is an essential component of Ocean Discovery Institute’s model.
Finding #5: The donor base in Baltimore and Washington, DC has less capacity to financially support
additional programs and infrastructure required by Ocean Discovery Institute’s model.
During interviews with representatives of community-based organizations and STEM education providers
serving communities in Baltimore and Washington, DC, the replication team learned that both cities have
systemic challenges inhibiting funding capacity. The transience of the population inhabiting the
Washington, DC metro area makes it hard to find a stable donor base.
Many prefer to give to organizations outside the area or are only donating during their time in
Washington, DC which is often brief. In Baltimore, we were told the relationships between existing
organizations and funders are fairly entrenched so newcomers would have a harder time finding 15
STEM industry here includes not just corporations using science, technology, engineering, and math skills and knowledge, but also
federal agencies and academic institutions.
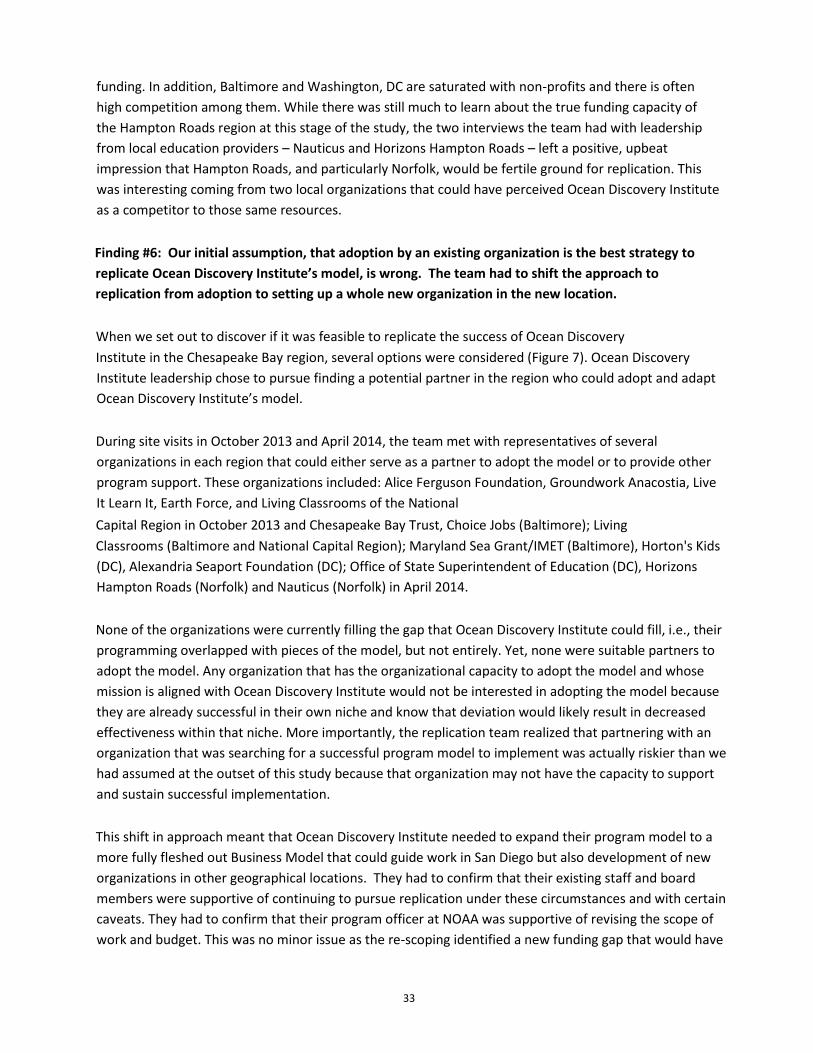
33
funding. In addition, Baltimore and Washington, DC are saturated with non-profits and there is often
high competition among them. While there was still much to learn about the true funding capacity of
the Hampton Roads region at this stage of the study, the two interviews the team had with leadership
from local education providers – Nauticus and Horizons Hampton Roads – left a positive, upbeat
impression that Hampton Roads, and particularly Norfolk, would be fertile ground for replication. This
was interesting coming from two local organizations that could have perceived Ocean Discovery Institute
as a competitor to those same resources.
Finding #6: Our initial assumption, that adoption by an existing organization is the best strategy to
replicate Ocean Discovery Institute’s model, is wrong. The team had to shift the approach to
replication from adoption to setting up a whole new organization in the new location.
When we set out to discover if it was feasible to replicate the success of Ocean Discovery
Institute in the Chesapeake Bay region, several options were considered (Figure 7). Ocean Discovery
Institute leadership chose to pursue finding a potential partner in the region who could adopt and adapt
Ocean Discovery Institute’s model.
During site visits in October 2013 and April 2014, the team met with representatives of several
organizations in each region that could either serve as a partner to adopt the model or to provide other
program support. These organizations included: Alice Ferguson Foundation, Groundwork Anacostia, Live
It Learn It, Earth Force, and Living Classrooms of the National
Capital Region in October 2013 and Chesapeake Bay Trust, Choice Jobs (Baltimore); Living
Classrooms (Baltimore and National Capital Region); Maryland Sea Grant/IMET (Baltimore), Horton's Kids
(DC), Alexandria Seaport Foundation (DC); Office of State Superintendent of Education (DC), Horizons
Hampton Roads (Norfolk) and Nauticus (Norfolk) in April 2014.
None of the organizations were currently filling the gap that Ocean Discovery Institute could fill, i.e., their
programming overlapped with pieces of the model, but not entirely. Yet, none were suitable partners to
adopt the model. Any organization that has the organizational capacity to adopt the model and whose
mission is aligned with Ocean Discovery Institute would not be interested in adopting the model because
they are already successful in their own niche and know that deviation would likely result in decreased
effectiveness within that niche. More importantly, the replication team realized that partnering with an
organization that was searching for a successful program model to implement was actually riskier than we
had assumed at the outset of this study because that organization may not have the capacity to support
and sustain successful implementation.
This shift in approach meant that Ocean Discovery Institute needed to expand their program model to a
more fully fleshed out Business Model that could guide work in San Diego but also development of new
organizations in other geographical locations. They had to confirm that their existing staff and board
members were supportive of continuing to pursue replication under these circumstances and with certain
caveats. They had to confirm that their program officer at NOAA was supportive of revising the scope of
work and budget. This was no minor issue as the re-scoping identified a new funding gap that would have
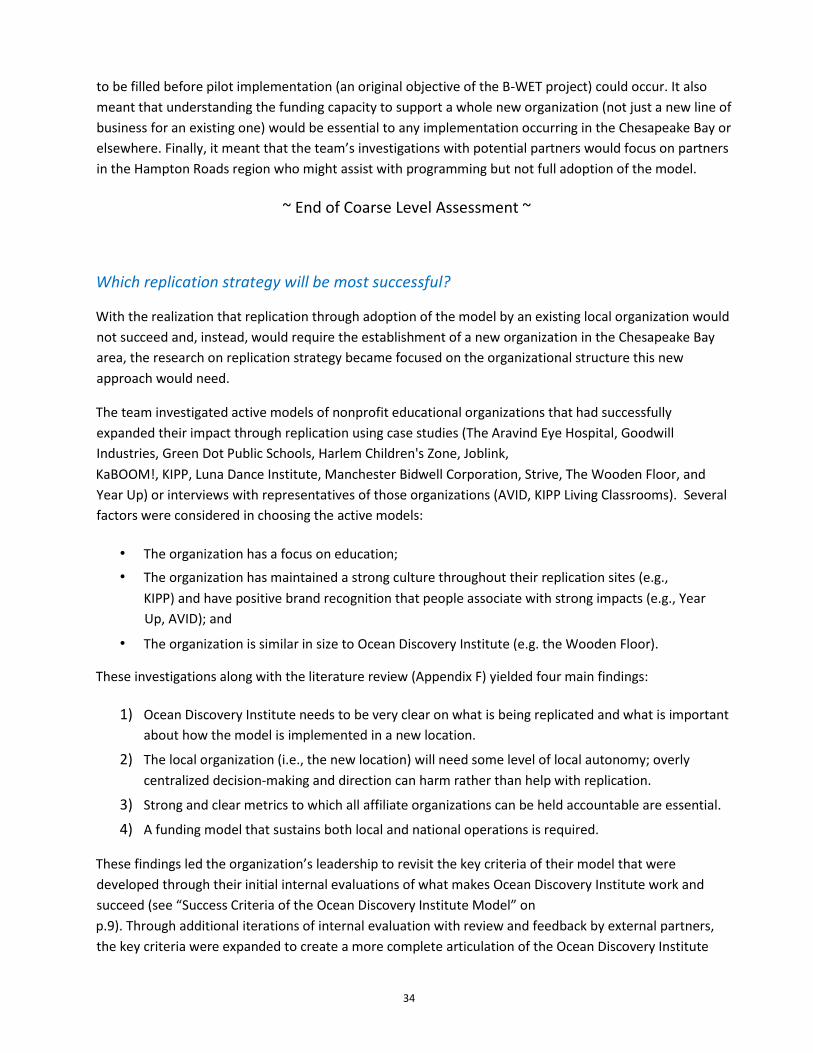
34
to be filled before pilot implementation (an original objective of the B-WET project) could occur. It also
meant that understanding the funding capacity to support a whole new organization (not just a new line of
business for an existing one) would be essential to any implementation occurring in the Chesapeake Bay or
elsewhere. Finally, it meant that the team’s investigations with potential partners would focus on partners
in the Hampton Roads region who might assist with programming but not full adoption of the model.
~ End of Coarse Level Assessment ~
Which replication strategy will be most successful?
With the realization that replication through adoption of the model by an existing local organization would
not succeed and, instead, would require the establishment of a new organization in the Chesapeake Bay
area, the research on replication strategy became focused on the organizational structure this new
approach would need.
The team investigated active models of nonprofit educational organizations that had successfully
expanded their impact through replication using case studies (The Aravind Eye Hospital, Goodwill
Industries, Green Dot Public Schools, Harlem Children's Zone, Joblink,
KaBOOM!, KIPP, Luna Dance Institute, Manchester Bidwell Corporation, Strive, The Wooden Floor, and
Year Up) or interviews with representatives of those organizations (AVID, KIPP Living Classrooms). Several
factors were considered in choosing the active models:
• The organization has a focus on education;
• The organization has maintained a strong culture throughout their replication sites (e.g.,
KIPP) and have positive brand recognition that people associate with strong impacts (e.g., Year
Up, AVID); and
• The organization is similar in size to Ocean Discovery Institute (e.g. the Wooden Floor).
These investigations along with the literature review (Appendix F) yielded four main findings:
1) Ocean Discovery Institute needs to be very clear on what is being replicated and what is important
about how the model is implemented in a new location.
2) The local organization (i.e., the new location) will need some level of local autonomy; overly
centralized decision-making and direction can harm rather than help with replication.
3) Strong and clear metrics to which all affiliate organizations can be held accountable are essential.
4) A funding model that sustains both local and national operations is required.
These findings led the organization’s leadership to revisit the key criteria of their model that were
developed through their initial internal evaluations of what makes Ocean Discovery Institute work and
succeed (see “Success Criteria of the Ocean Discovery Institute Model” on
p.9). Through additional iterations of internal evaluation with review and feedback by external partners,
the key criteria were expanded to create a more complete articulation of the Ocean Discovery Institute
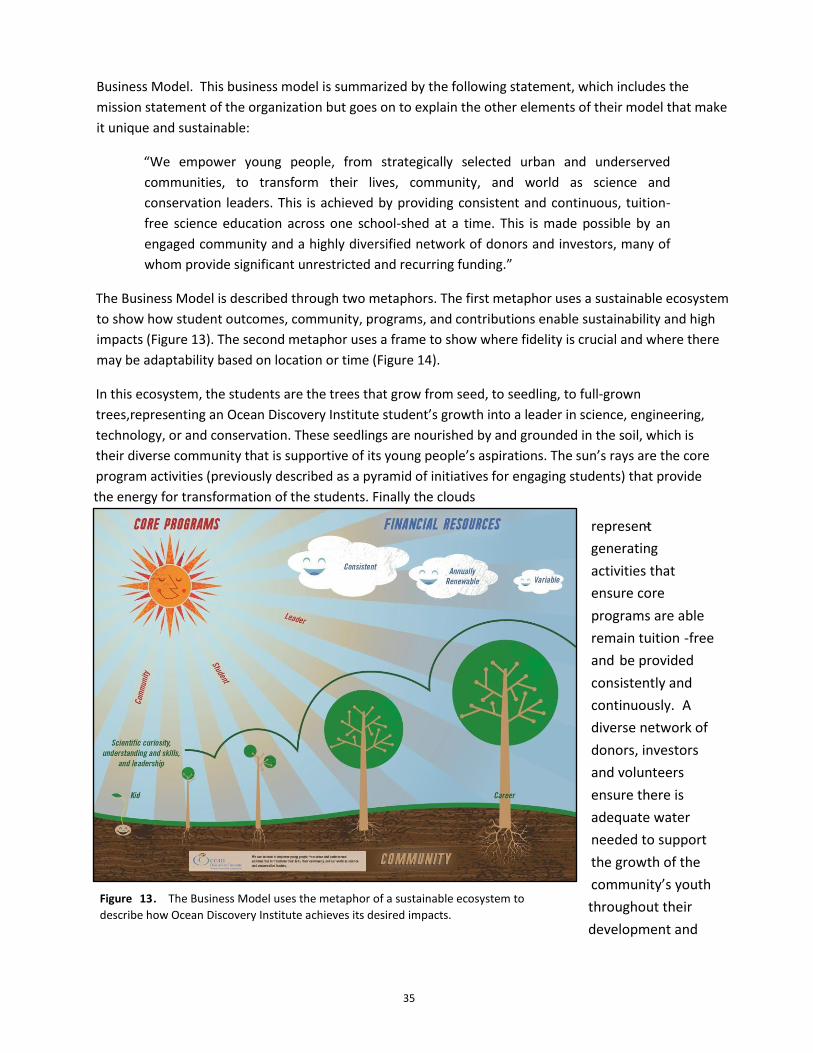
35
Business Model. This business model is summarized by the following statement, which includes the
mission statement of the organization but goes on to explain the other elements of their model that make
it unique and sustainable:
“We empower young people, from strategically selected urban and underserved
communities, to transform their lives, community, and world as science and
conservation leaders. This is achieved by providing consistent and continuous, tuition-
free science education across one school-shed at a time. This is made possible by an
engaged community and a highly diversified network of donors and investors, many of
whom provide significant unrestricted and recurring funding.”
The Business Model is described through two metaphors. The first metaphor uses a sustainable ecosystem
to show how student outcomes, community, programs, and contributions enable sustainability and high
impacts (Figure 13). The second metaphor uses a frame to show where fidelity is crucial and where there
may be adaptability based on location or time (Figure 14).
In this ecosystem, the students are the trees that grow from seed, to seedling, to full-grown
trees,representing an Ocean Discovery Institute student’s growth into a leader in science, engineering,
technology, or and conservation. These seedlings are nourished by and grounded in the soil, which is
their diverse community that is supportive of its young people’s aspirations. The sun’s rays are the core
program activities (previously described as a pyramid of initiatives for engaging students) that provide
the energy for transformation of the students. Finally the clouds
represent
revenue
-
generating
activities that
ensure core
programs are able
remain tuition - free
and be provided
consistently and
continuously. A
diverse network of
donors, investors
and volunteers
ensure there is
adequate water
needed to support
the growth of the
community’s youth
throughout their
development and
Figure 13 . The Business Model uses the metaphor of a sustainable ecosystem to describe how Ocean Discovery Institute achieves its desired impacts.
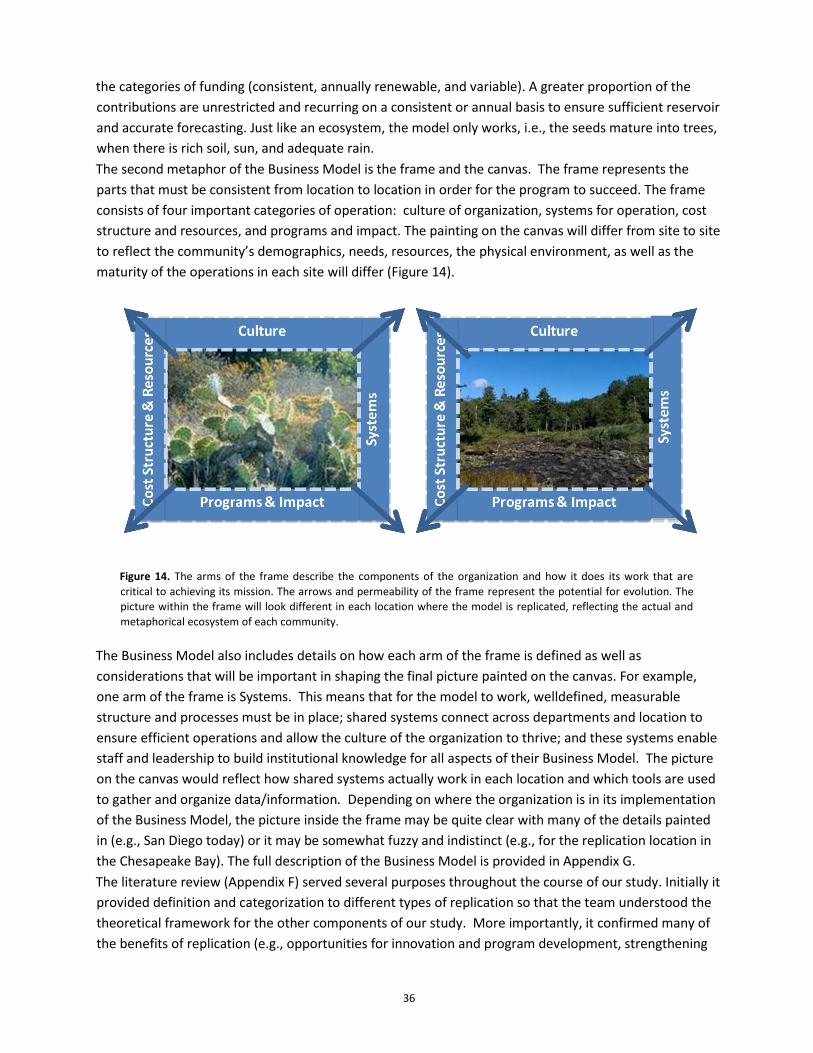
36
the categories of funding (consistent, annually renewable, and variable). A greater proportion of the
contributions are unrestricted and recurring on a consistent or annual basis to ensure sufficient reservoir
and accurate forecasting. Just like an ecosystem, the model only works, i.e., the seeds mature into trees,
when there is rich soil, sun, and adequate rain.
The second metaphor of the Business Model is the frame and the canvas. The frame represents the
parts that must be consistent from location to location in order for the program to succeed. The frame
consists of four important categories of operation: culture of organization, systems for operation, cost
structure and resources, and programs and impact. The painting on the canvas will differ from site to site
to reflect the community’s demographics, needs, resources, the physical environment, as well as the
maturity of the operations in each site will differ (Figure 14).
Figure 14. The arms of the frame describe the components of the organization and how it does its work that are
critical to achieving its mission. The arrows and permeability of the frame represent the potential for evolution. The
picture within the frame will look different in each location where the model is replicated, reflecting the actual and
metaphorical ecosystem of each community.
The Business Model also includes details on how each arm of the frame is defined as well as
considerations that will be important in shaping the final picture painted on the canvas. For example,
one arm of the frame is Systems. This means that for the model to work, welldefined, measurable
structure and processes must be in place; shared systems connect across departments and location to
ensure efficient operations and allow the culture of the organization to thrive; and these systems enable
staff and leadership to build institutional knowledge for all aspects of their Business Model. The picture
on the canvas would reflect how shared systems actually work in each location and which tools are used
to gather and organize data/information. Depending on where the organization is in its implementation
of the Business Model, the picture inside the frame may be quite clear with many of the details painted
in (e.g., San Diego today) or it may be somewhat fuzzy and indistinct (e.g., for the replication location in
the Chesapeake Bay). The full description of the Business Model is provided in Appendix G.
The literature review (Appendix F) served several purposes throughout the course of our study. Initially it
provided definition and categorization to different types of replication so that the team understood the
theoretical framework for the other components of our study. More importantly, it confirmed many of
the benefits of replication (e.g., opportunities for innovation and program development, strengthening
37
management of programs, diversifying financial resources, providing economies of scale, etc.) regardless
of path to replication. Finally, as the idea of replication switched from one of partnership with another
organization (i.e., having the replication happen by adoption/adaptation rather than by direct replication)
the literature review in combination with the active models research provided helpful insights into how
the future organization might be structured and related pros and cons to varying levels of control over
local operations relative to the local circumstances (cultural, environmental, financial) in which
replication will occur (Figure 15).
Figure 15. Different models of replication and related characteristics/factors to be considered in their employment.
Source: Realizing the Potential for Social Replication. Research for Big Lottery Fund by the International Center for
Social Franchising. Dan Berelowitz, Mark Richardson and Matt Towner. September 2013
With Ocean Discovery Institute’s more fully defined Business Model, the pros and cons of each potential
replication strategy was assessed to ensure funding opportunities are maximized while risk is minimized,
fidelity to the business model and impacts is assured while local autonomy is maintained, and future
replication locations could be supported. The best option for meeting those goals is a flexible franchise
structure, where a new “parent” organization is established with local affiliates, one of which is the
existing organization in San Diego (Figure 16).
With a franchise structure, the parent organization provides assistance, support, and services to the
affiliate organizations while ensuring adherence to the standards and guidelines of the Business Model
(i.e., the frame in Ocean Discovery’s Business Model). Often these organizational structures rely on top-
down management and communication with affiliates and can be inflexible. However, the replication
team wants to develop a framework for operations within this structure that will allow for as much
autonomy at the local level to be successful within the local context while adhering to Ocean Discovery’s
Business Model.
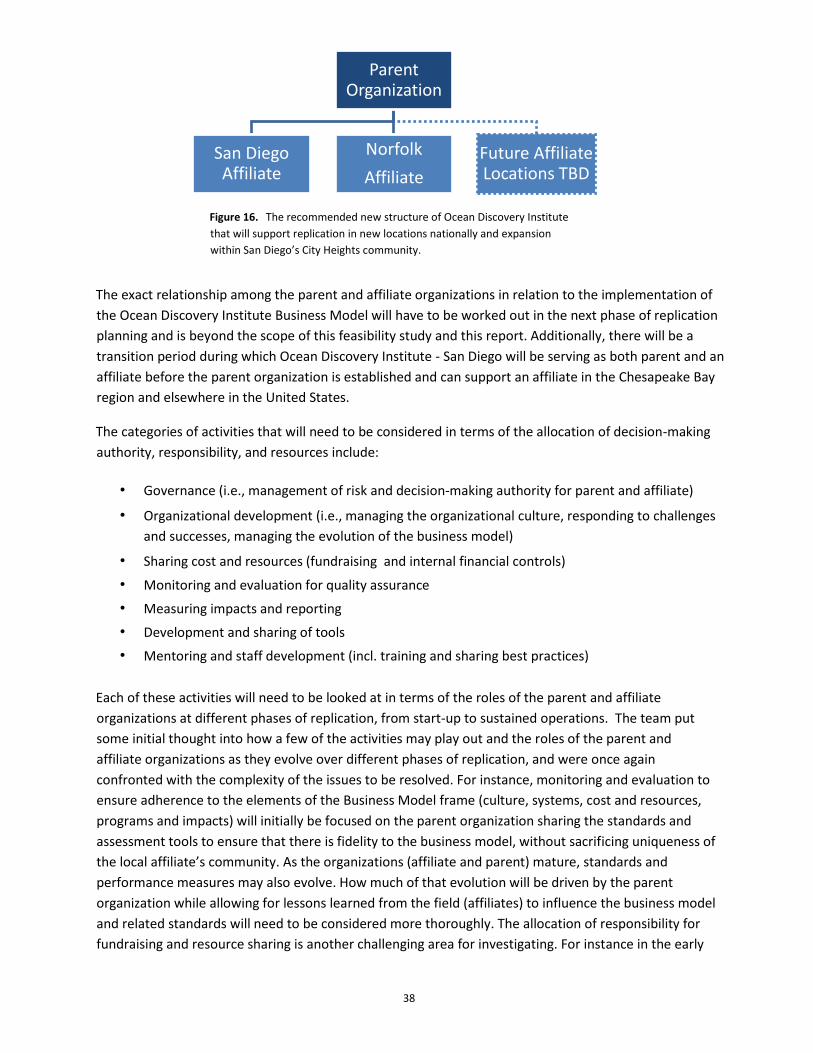
38
The exact relationship among the parent and affiliate organizations in relation to the implementation of
the Ocean Discovery Institute Business Model will have to be worked out in the next phase of replication
planning and is beyond the scope of this feasibility study and this report. Additionally, there will be a
transition period during which Ocean Discovery Institute - San Diego will be serving as both parent and an
affiliate before the parent organization is established and can support an affiliate in the Chesapeake Bay
region and elsewhere in the United States.
The categories of activities that will need to be considered in terms of the allocation of decision-making
authority, responsibility, and resources include:
• Governance (i.e., management of risk and decision-making authority for parent and affiliate)
• Organizational development (i.e., managing the organizational culture, responding to challenges
and successes, managing the evolution of the business model)
• Sharing cost and resources (fundraising and internal financial controls)
• Monitoring and evaluation for quality assurance
• Measuring impacts and reporting
• Development and sharing of tools
• Mentoring and staff development (incl. training and sharing best practices)
Each of these activities will need to be looked at in terms of the roles of the parent and affiliate
organizations at different phases of replication, from start-up to sustained operations. The team put
some initial thought into how a few of the activities may play out and the roles of the parent and
affiliate organizations as they evolve over different phases of replication, and were once again
confronted with the complexity of the issues to be resolved. For instance, monitoring and evaluation to
ensure adherence to the elements of the Business Model frame (culture, systems, cost and resources,
programs and impacts) will initially be focused on the parent organization sharing the standards and
assessment tools to ensure that there is fidelity to the business model, without sacrificing uniqueness of
the local affiliate’s community. As the organizations (affiliate and parent) mature, standards and
performance measures may also evolve. How much of that evolution will be driven by the parent
organization while allowing for lessons learned from the field (affiliates) to influence the business model
and related standards will need to be considered more thoroughly. The allocation of responsibility for
fundraising and resource sharing is another challenging area for investigating. For instance in the early
Parent Organization
San Diego Affiliate
Norfolk
Affiliate
Future Affiliate Locations TBD
Figure 16. The recommended new structure of Ocean Discovery Institute
that will support replication in new locations nationally and expansion
within San Diego’s City Heights community.
39
phases of replication, the parent would need to raise all the funds for itself (to provide services to the
affiliates as they start-up and mature) and the affiliates would need to raise funds to support their local
operations. Once established the affiliate organization would not only need to raise funds to support its
sustained operations, but they may also need to pay a fee on a sliding scale that would increase as they
mature to some fixed percentage. This fee would repay the parent organization for the investment of
time, tools, professional development etc., that the parent would be providing to the affiliate
organization to implement the Ocean Discovery Institute Business Model. The challenge will be figuring
out what that percentage would be and ensuring that affiliates continue to see value in Ocean Discovery
Institute’s brand and the services. Additionally, there may be opportunities for the parent organization
to secure funding for special initiatives that take place at the affiliate locations, but it is unclear at this
point how this revenue sharing would function. These are just three examples of the issues related to
roles, responsibility, and authority that will evolve as replication begins.
Medium Level Assessment of How Well the Locations Fit Ocean Discovery
Institute’s Model and the Capacity of the Region to Support the Model
Finding #7: As a region, Hampton Roads has the capacity to sustain an organization locally.
Using 990s, online information about foundations and local non-profit service organizations in the area,
the consultant on the team identified a number of potential leads16 to interview either to understand
their likely interest in and ability to financially support replication of Ocean Discovery in Norfolk or to
understand the capacity of the region to support non-profit organizations similar to Ocean Discovery in
size, mission and operating costs. Once again, the optimism of people who were contacted in this
component of the research was consistent with the team members’ earlier experiences. The individuals
interviewed were welcoming (even when this effort could have been seen as competition) and
connected Ocean Discovery’s Director of Philanthropy and the team’s consultant to other individuals
from the region who might be able to provide necessary insights.
We learned that geographical location of activities and resulting program impact within the Hampton
Roads region determines the availability of support from some potential donors. For instance, some
donors only support work conducted on the peninsula (region including Hampton) while others only
focus on Portsmouth or Norfolk on the “south side”. However, that nuance is not a driver for deciding
where replication should occur within the region because the overall capacity of the region appears
sufficient to start, as well as sustain, a new organization. It simply meant that additional information
would have to be gathered to understand which potential donors had an interest in supporting
replication for whichever city in the region was chosen.
16
Foundations contacted included: Bank of America corporate foundation, Hampton Roads Community Foundation, Beazley
Foundation, etc. Local non-profit organizations that provided insights into local fundraising capacity included Nauticus, Horizons
Hampton Roads, Access College, Inc., etc. Additionally, the Hampton Roads Economic Alliance was helpful in understanding the
local corporate culture regarding philanthropy.
40
It also became clear that expanding Ocean Discovery’s reach beyond San Diego could provide access to
new sources of funding from nationally focused philanthropic organizations and corporations with
interests in both locations.
Finding #8: Different funding strategies will be needed for the start-up phase of replication compared
with sustaining operations in Norfolk.
With guidance from its Board of Directors and staff, the replication team realized that replication under
the new approach would require creation of a Start-up to Sustainability Plan. This plan is intended to
enable the establishment of a new site in Hampton Roads without destabilizing funding and
infrastructure in San Diego and create a template for additional replication. The capacity of funders in
Norfolk to sustain a new organization should not be relied on for start-up of the new organization
because the donor base in Norfolk is more likely interested in funding operations once they are up and
running. Therefore, the strategy for garnering start-up funding will have to be sourced from nationally
focused philanthropic organizations and corporations that may be interested in funding expansion of a
successful model and/or have interests in supporting underserved communities in both San Diego and
Norfolk.
Finding #9: Evidence of a STEM-based economy looks different in Norfolk than in San Diego
One of the key components of Ocean Discovery Institute’s model is the presence of a vibrant STEM-based
economy in the region in which the school-shed is located. This is important as a source of mentors and
other volunteers as well as future employers. During early site visits to the region, team members met
with representatives of Norfolk Redevelopment and Housing Authority, Hampton Roads Community
Foundation, Hampton Roads Economic Alliance, Hampton University, Old Dominion University, and
Access College, to understand the STEM industry and related resources in the region as well as the
relationship among the cities that compose Hampton Roads.
Despite data on numbers and types of employers in Hampton Roads (Appendix E), the San Diego
members of the replication team were not convinced there was adequate STEM industry in the area
during their site visit, because they were looking for outward manifestations of wealth associated with
STEM economy similar to that of San Diego. Meanwhile, the East Coast team members, who were more
familiar with this region in Virginia, were convinced there would be plenty of opportunities for providing
authentic STEM research experiences and career paths because of the presence of the US Navy (and
related businesses), NASA, NOAA, several local universities, Norfolk Southern, and the port authority.
But these opportunities would look different than those afforded the City Heights students because
there was less of a focus on biotech and fisheries and more of a focus on physical oceanography,
engineering, modeling, and simulation. During a later visit by the replication team, it became clear that
the cultural evidence of a wealthy STEM-based economy is different in Hampton Roads than in San
Diego.
41
That was a big part of the reason why the San Diego team members instincts conflicted with the
quantitative data from online sources and qualitative data garnered through conversations with local
professionals.
At this stage, the team was convinced that all the key criteria for success of the model (school and
community characteristics, funding capacity, adequacy of the local STEM resources) could be met within
Hampton Roads region. Further the team was leaning toward Norfolk, but wanted to be sure that other
communities in the region were revisited in light of their community’s demographics as well as the
school-sheds comparison with Hoover High School in City Heights.
Finding #10: Census and school district data confirm that communities on the “south side” of
Hampton Roads are the best fit to the model, but the school-shed is still an open question.
Early in the feasibility study, the school data collected for coarse level analysis indicated Booker T.
Washington was a close fit to the benchmark school-shed for City Heights (Table 5), but at this stage of
the study, the team had concerns about it being a magnet school with a focus on the visual and
performing arts. At that same time we learned that the Lake Taylor school-shed was getting a new K-8
STEM learning facility and there was an existing Aquatic Center in Compostella, making that option
attractive. Therefore we focused our final site visit to the region on really gaining a better
understanding of the neighborhoods served by Norfolk Redevelopment and Housing Authority (NRHA)
and their associated school-sheds. Before our trip, we gathered additional on-line data for all schools
within five Hampton Roads communities (previously we had not included Portsmouth and Chesapeake).
After running a Multi-dimensional Scaling plot on these schools (Figure 17), Booker T. Washington and
Lake
Taylor High Schools demonstrated the best fit to model. Also during a previous visit the San
Diego members of the replication team walked the area around Booker T. Washington (Young Terrace)
and realized it met the model. We used these findings, in addition to neighborhood information from
NRHA to guide the next site visit. Additionally, the team decided to stay in Portsmouth (during previous
visits we had stayed in Norfolk) so we could get a feel for that community as well.
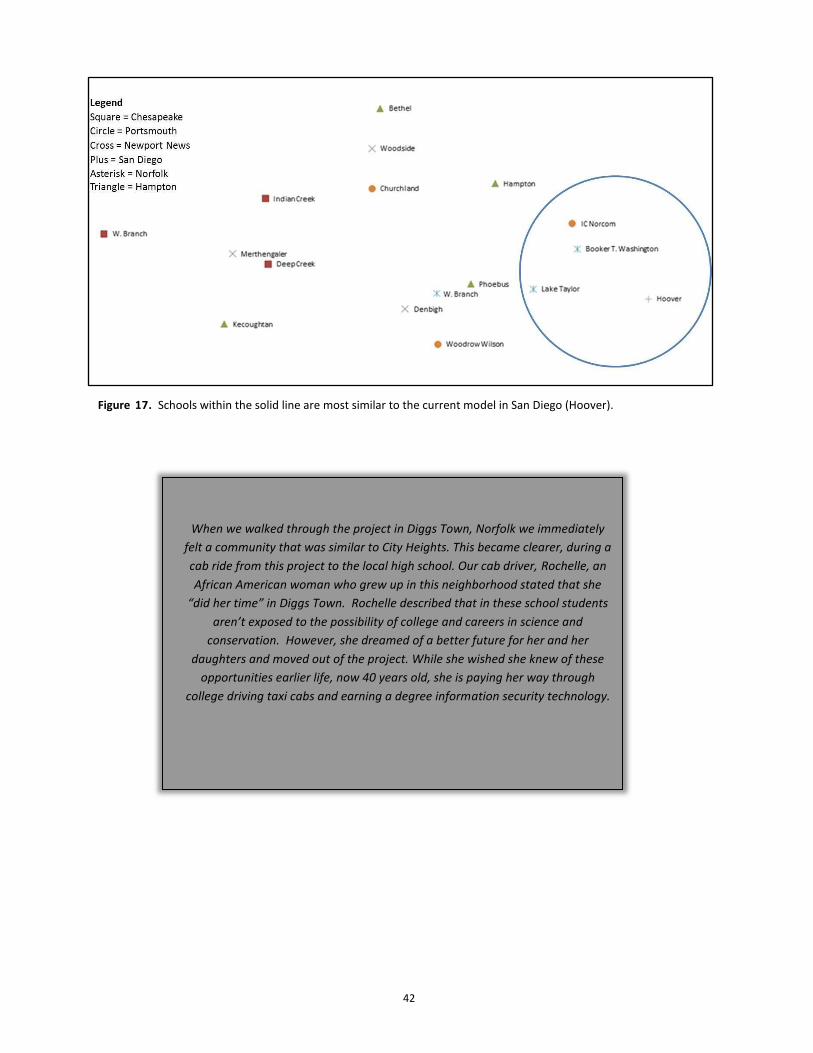
42
When we walked through the project in Diggs Town, Norfolk we immediately
felt a community that was similar to City Heights. This became clearer, during a
cab ride from this project to the local high school. Our cab driver, Rochelle, an
African American woman who grew up in this neighborhood stated that she
“did her time” in Diggs Town. Rochelle described that in these school students
aren’t exposed to the possibility of college and careers in science and
conservation. However, she dreamed of a better future for her and her
daughters and moved out of the project. While she wished she knew of these
opportunities earlier life, now 40 years old, she is paying her way through
college driving taxi cabs and earning a degree information security technology.
Figure 1 7 . Schools within the solid line are most similar to the current model in San Diego (Hoover).
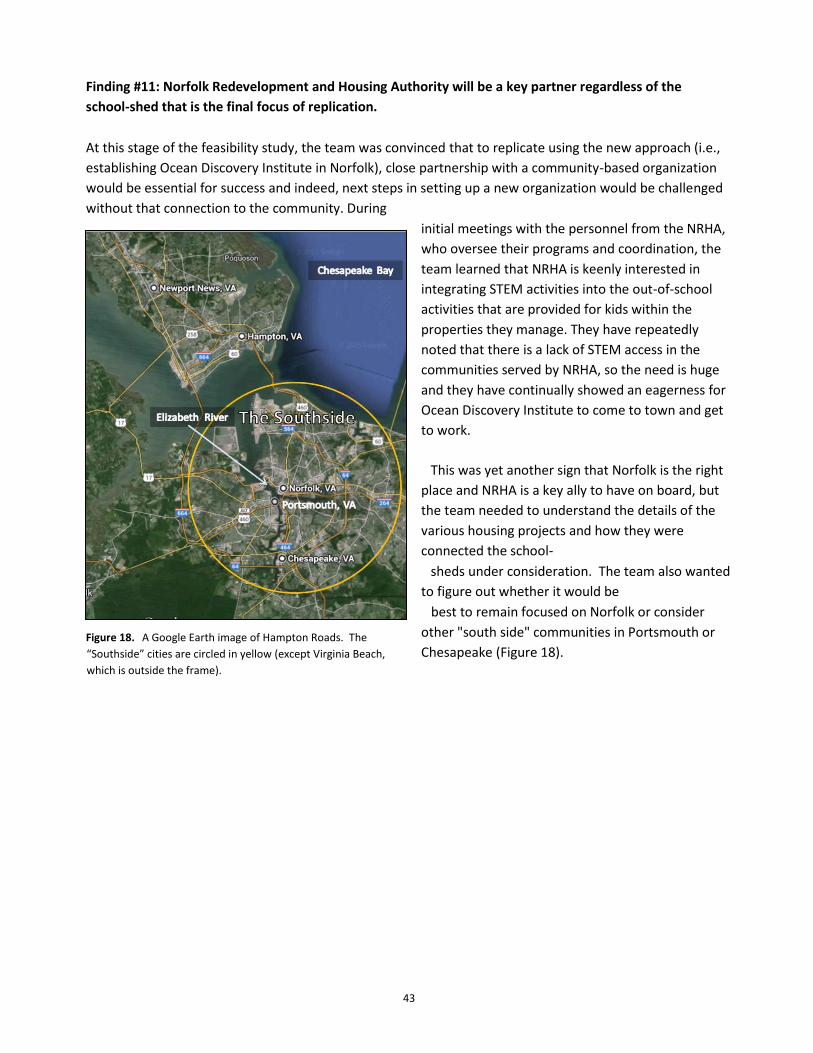
43
Finding #11: Norfolk Redevelopment and Housing Authority will be a key partner regardless of the
school-shed that is the final focus of replication.
At this stage of the feasibility study, the team was convinced that to replicate using the new approach (i.e.,
establishing Ocean Discovery Institute in Norfolk), close partnership with a community-based organization
would be essential for success and indeed, next steps in setting up a new organization would be challenged
without that connection to the community. During
initial meetings with the personnel from the NRHA,
who oversee their programs and coordination, the
team learned that NRHA is keenly interested in
integrating STEM activities into the out-of-school
activities that are provided for kids within the
properties they manage. They have repeatedly
noted that there is a lack of STEM access in the
communities served by NRHA, so the need is huge
and they have continually showed an eagerness for
Ocean Discovery Institute to come to town and get
to work.
This was yet another sign that Norfolk is the right
place and NRHA is a key ally to have on board, but
the team needed to understand the details of the
various housing projects and how they were
connected the school-
sheds under consideration. The team also wanted
to figure out whether it would be
best to remain focused on Norfolk or consider
other "south side" communities in Portsmouth or
Chesapeake (Figure 18).
.
Figure 18. A Google Earth image of Hampton Roads. The
“Southside” cities are circled in yellow (except Virginia Beach,
which is outside the frame).
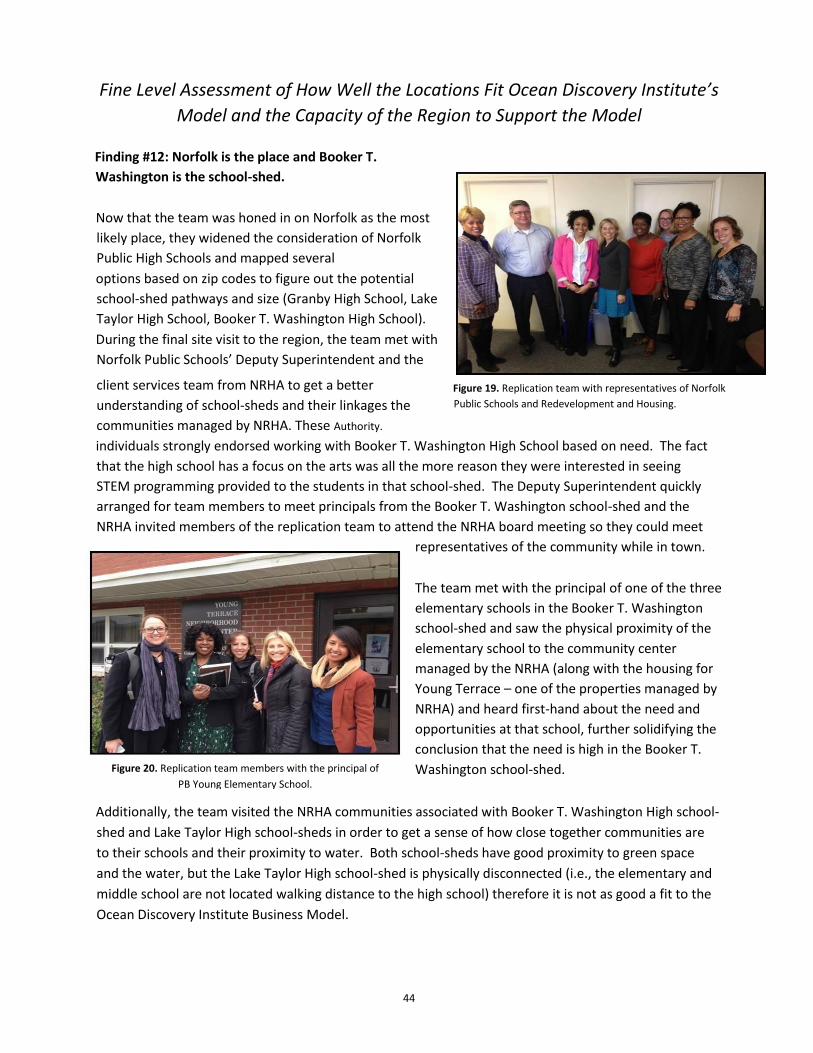
44
Figure 19. Replication team with representatives of Norfolk
Public Schools and Redevelopment and Housing.
Figure 19. Replication team with representatives of Norfolk
Public Schools and Redevelopment and Housing.
Fine Level Assessment of How Well the Locations Fit Ocean Discovery Institute’s
Model and the Capacity of the Region to Support the Model
Finding #12: Norfolk is the place and Booker T.
Washington is the school-shed.
Now that the team was honed in on Norfolk as the most
likely place, they widened the consideration of Norfolk
Public High Schools and mapped several
options based on zip codes to figure out the potential
school-shed pathways and size (Granby High School, Lake
Taylor High School, Booker T. Washington High School).
During the final site visit to the region, the team met with
Norfolk Public Schools’ Deputy Superintendent and the
client services team from NRHA to get a better
understanding of school-sheds and their linkages the
communities managed by NRHA. These Authority. individuals strongly endorsed working with Booker T. Washington High School based on need. The fact
that the high school has a focus on the arts was all the more reason they were interested in seeing
STEM programming provided to the students in that school-shed. The Deputy Superintendent quickly
arranged for team members to meet principals from the Booker T. Washington school-shed and the
NRHA invited members of the replication team to attend the NRHA board meeting so they could meet
representatives of the community while in town.
The team met with the principal of one of the three
elementary schools in the Booker T. Washington
school-shed and saw the physical proximity of the
elementary school to the community center
managed by the NRHA (along with the housing for
Young Terrace – one of the properties managed by
NRHA) and heard first-hand about the need and
opportunities at that school, further solidifying the
conclusion that the need is high in the Booker T.
Washington school-shed.
Additionally, the team visited the NRHA communities associated with Booker T. Washington High school-
shed and Lake Taylor High school-sheds in order to get a sense of how close together communities are
to their schools and their proximity to water. Both school-sheds have good proximity to green space
and the water, but the Lake Taylor High school-shed is physically disconnected (i.e., the elementary and
middle school are not located walking distance to the high school) therefore it is not as good a fit to the
Ocean Discovery Institute Business Model.
Figure 20. Replication team members with the principal of
PB Young Elementary School.
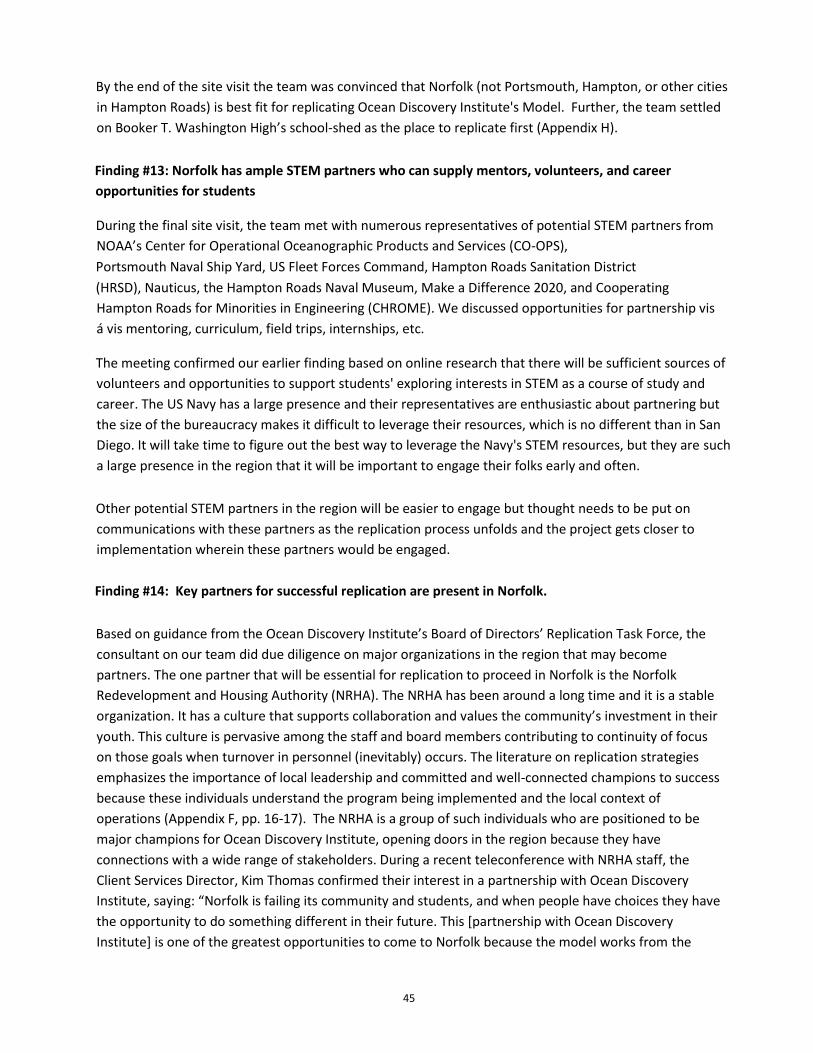
45
By the end of the site visit the team was convinced that Norfolk (not Portsmouth, Hampton, or other cities
in Hampton Roads) is best fit for replicating Ocean Discovery Institute's Model. Further, the team settled
on Booker T. Washington High’s school-shed as the place to replicate first (Appendix H).
Finding #13: Norfolk has ample STEM partners who can supply mentors, volunteers, and career
opportunities for students
During the final site visit, the team met with numerous representatives of potential STEM partners from
NOAA’s Center for Operational Oceanographic Products and Services (CO-OPS),
Portsmouth Naval Ship Yard, US Fleet Forces Command, Hampton Roads Sanitation District
(HRSD), Nauticus, the Hampton Roads Naval Museum, Make a Difference 2020, and Cooperating
Hampton Roads for Minorities in Engineering (CHROME). We discussed opportunities for partnership vis
á vis mentoring, curriculum, field trips, internships, etc.
The meeting confirmed our earlier finding based on online research that there will be sufficient sources of
volunteers and opportunities to support students' exploring interests in STEM as a course of study and
career. The US Navy has a large presence and their representatives are enthusiastic about partnering but
the size of the bureaucracy makes it difficult to leverage their resources, which is no different than in San
Diego. It will take time to figure out the best way to leverage the Navy's STEM resources, but they are such
a large presence in the region that it will be important to engage their folks early and often.
Other potential STEM partners in the region will be easier to engage but thought needs to be put on
communications with these partners as the replication process unfolds and the project gets closer to
implementation wherein these partners would be engaged.
Finding #14: Key partners for successful replication are present in Norfolk.
Based on guidance from the Ocean Discovery Institute’s Board of Directors’ Replication Task Force, the
consultant on our team did due diligence on major organizations in the region that may become
partners. The one partner that will be essential for replication to proceed in Norfolk is the Norfolk
Redevelopment and Housing Authority (NRHA). The NRHA has been around a long time and it is a stable
organization. It has a culture that supports collaboration and values the community’s investment in their
youth. This culture is pervasive among the staff and board members contributing to continuity of focus
on those goals when turnover in personnel (inevitably) occurs. The literature on replication strategies
emphasizes the importance of local leadership and committed and well-connected champions to success
because these individuals understand the program being implemented and the local context of
operations (Appendix F, pp. 16-17). The NRHA is a group of such individuals who are positioned to be
major champions for Ocean Discovery Institute, opening doors in the region because they have
connections with a wide range of stakeholders. During a recent teleconference with NRHA staff, the
Client Services Director, Kim Thomas confirmed their interest in a partnership with Ocean Discovery
Institute, saying: “Norfolk is failing its community and students, and when people have choices they have
the opportunity to do something different in their future. This [partnership with Ocean Discovery
Institute] is one of the greatest opportunities to come to Norfolk because the model works from the
46
inside out and not around the perimeter and this is exactly the type of work we want to do in our
communities.”
While partnerships with STEM industry will become important as implementation occurs, at this stage it is
sufficient to have connected with many of them in the region and there will be no shortage of
opportunities to deepen these relationships and develop others in the future.
Norfolk Public Schools has experienced a lot of turmoil recently (and we received indications that more is
to come soon). However, this is not a deterrent for replicating in Norfolk because Ocean Discovery
Institute’s model is designed to work with the challenges and opportunities that are presented by the
local school system at any time. The problems being experienced in the Norfolk Public School system
currently are not atypical of many urban public school systems that are underperforming (including San
Diego Unified School District).
To further solidify relationships, letters of support will be sought after the consideration of the
recommendations of this report by the Ocean Discovery Institute Board in May 2015.
Finding #15: For replication to move forward, a business model for a new parent organization,
including defining the relationship with affiliate organizations, will be needed. Then, strategic business
plans for the parent and Norfolk affiliate will be needed to guide growth and development.
In order to develop these business plans, we needed to articulate the phasing of next steps with respect
to establishing a new organizational structure, hiring personnel, figuring out programming, etc. Then
costs were associated with each of these steps in each phase and those determined the total funding that
would need to be raised before each phase can begin. These analyses are captured in the Replication
Strategy Matrix (Appendix I) and Replication Strategy Budget (Appendix I), which not only identify steps
that will be critical to moving forward, but also the cost basis and timing associated with each step along
the way. This represents Ocean Discovery Institute’s best thinking to date and is based on the following
assumptions:
1. When seeking funding, contributions will be required to support three key outcomes: (1)
expanding the San Diego affiliate’s operations to the maximum capacity of the school-shed, (2)
the establishment of a parent organization that will enable replication, and (3) the establishment
of the first replicated affiliate in Norfolk.
2. Some costs incurred during the first replication (represented in Replication Strategy Matrix) will
be one-time start-up costs that will support replication now and in future locations (e.g.
establishment of the parent organization).
3. Substantial time and resources by Ocean Discovery Institute - San Diego will be needed to
establish the parent organization and the first affiliate organization in Norfolk.
4. Movement beyond thresholds is reliant upon the objectives being met and therefore the project
timeline may shift.
47
5. The parent organization will require approximately three full-time staff members and an annual
operating budget of approximately $300,000.
6. The Norfolk affiliate will begin with an annual operating budget of approximately $575,000
(which will support core programs across the school-shed) and will grow modestly to a sustaining
budget of approximately $850,000 (which will support all students within the school-shed from
“seed to tree”).
7. The Norfolk affiliate will receive funds from the parent in order to prepare for pilot
implementation, but will not receive support once the pilot is underway.
8. Because the parent is not yet established, Ocean Discovery Institute - San Diego will have
fundraising responsibilities for replication through establishment of the parent and Norfolk
affiliate organizations in preparation for pilot implementation.
In total, success from today through a three-year pilot period is predicated upon Ocean Discovery Institute
San Diego raising roughly $1.4 million, the parent raising roughly $1.25 million, and the Norfolk affiliate
raising roughly $2.25 million.
Finding #16: The carrying capacity of Norfolk to sustain a new affiliate of Ocean Discovery Institute is
$850,000 annually. This amount will enable the new affiliate to serve the entire Booker T.
Washington High School school-shed after start-up is completed.
Our research indicates that the Norfolk affiliate has a carrying capacity to financially support an annual
operating budget of $850,000. This figure was gleaned from data gathered on potential funders and
similarly sized non-profit organizations operating in Norfolk (Finding #7). Using the numbers of students in
the school-shed (Figure 21), cost per student in San Diego adjusted for Norfolk cost of living, and projected
fundraising capacity as a guide, the team confirmed that a new entity operating in Norfolk could sustain
operations at this level of income and reach the entire Booker T. Washington School-shed. It should be
noted that $850,000 is the annual operating budget once the Norfolk Affiliate has completed pilot
implementation in Year 3; the budget is estimated to be smaller during the start-up phase17.
17
By comparison, Ocean Discovery Institute’s projected budget for operations once the Living Lab is open is $2.1 million.
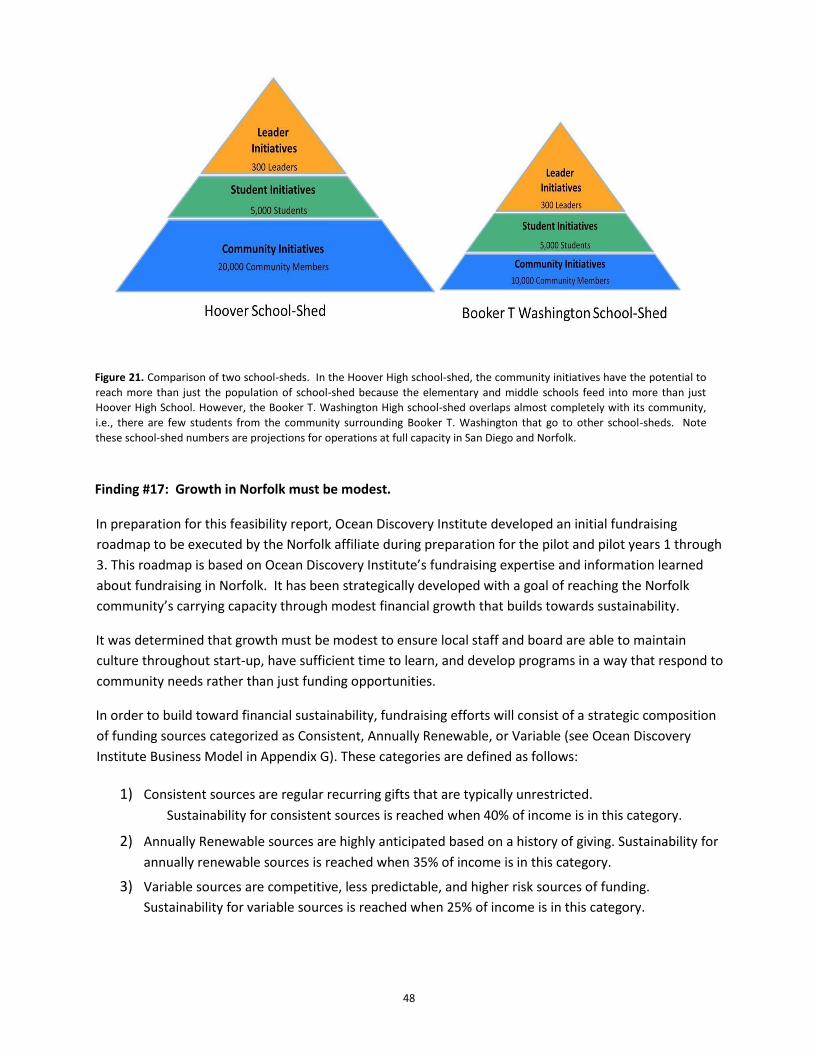
48
Figure 21. Comparison of two school-sheds. In the Hoover High school-shed, the community initiatives have the potential to
reach more than just the population of school-shed because the elementary and middle schools feed into more than just
Hoover High School. However, the Booker T. Washington High school-shed overlaps almost completely with its community,
i.e., there are few students from the community surrounding Booker T. Washington that go to other school-sheds. Note
these school-shed numbers are projections for operations at full capacity in San Diego and Norfolk.
Finding #17: Growth in Norfolk must be modest.
In preparation for this feasibility report, Ocean Discovery Institute developed an initial fundraising
roadmap to be executed by the Norfolk affiliate during preparation for the pilot and pilot years 1 through
3. This roadmap is based on Ocean Discovery Institute’s fundraising expertise and information learned
about fundraising in Norfolk. It has been strategically developed with a goal of reaching the Norfolk
community’s carrying capacity through modest financial growth that builds towards sustainability.
It was determined that growth must be modest to ensure local staff and board are able to maintain
culture throughout start-up, have sufficient time to learn, and develop programs in a way that respond to
community needs rather than just funding opportunities.
In order to build toward financial sustainability, fundraising efforts will consist of a strategic composition
of funding sources categorized as Consistent, Annually Renewable, or Variable (see Ocean Discovery
Institute Business Model in Appendix G). These categories are defined as follows:
1) Consistent sources are regular recurring gifts that are typically unrestricted.
Sustainability for consistent sources is reached when 40% of income is in this category.
2) Annually Renewable sources are highly anticipated based on a history of giving. Sustainability for
annually renewable sources is reached when 35% of income is in this category.
3) Variable sources are competitive, less predictable, and higher risk sources of funding.
Sustainability for variable sources is reached when 25% of income is in this category.
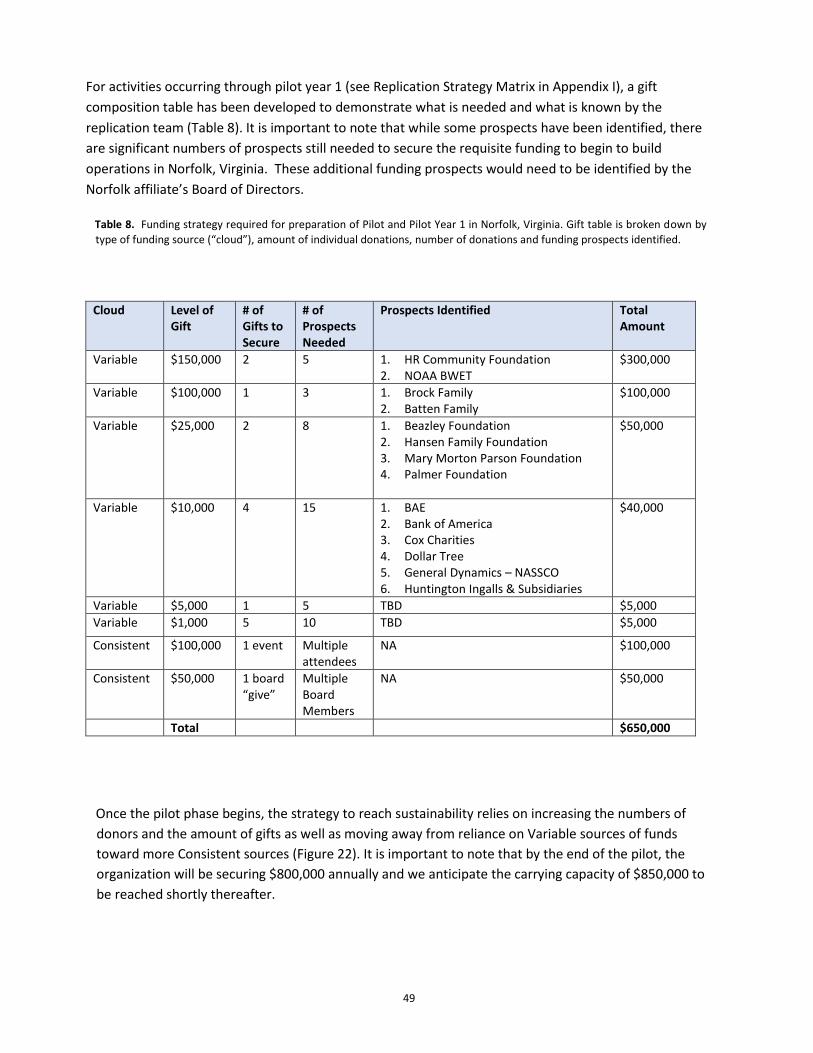
49
For activities occurring through pilot year 1 (see Replication Strategy Matrix in Appendix I), a gift
composition table has been developed to demonstrate what is needed and what is known by the
replication team (Table 8). It is important to note that while some prospects have been identified, there
are significant numbers of prospects still needed to secure the requisite funding to begin to build
operations in Norfolk, Virginia. These additional funding prospects would need to be identified by the
Norfolk affiliate’s Board of Directors.
Table 8. Funding strategy required for preparation of Pilot and Pilot Year 1 in Norfolk, Virginia. Gift table is broken down by
type of funding source (“cloud”), amount of individual donations, number of donations and funding prospects identified.
Cloud Level of Gift
# of Gifts to Secure
# of Prospects Needed
Prospects Identified Total Amount
Variable $150,000 2 5 1. HR Community Foundation 2. NOAA BWET
$300,000
Variable $100,000 1 3 1. Brock Family 2. Batten Family
$100,000
Variable $25,000 2 8 1. Beazley Foundation 2. Hansen Family Foundation 3. Mary Morton Parson Foundation 4. Palmer Foundation
$50,000
Variable $10,000 4 15 1. BAE 2. Bank of America 3. Cox Charities 4. Dollar Tree 5. General Dynamics – NASSCO 6. Huntington Ingalls & Subsidiaries
$40,000
Variable $5,000 1 5 TBD $5,000
Variable $1,000 5 10 TBD $5,000
Consistent $100,000 1 event Multiple attendees
NA $100,000
Consistent $50,000 1 board “give”
Multiple Board Members
NA $50,000
Total $650,000
Once the pilot phase begins, the strategy to reach sustainability relies on increasing the numbers of
donors and the amount of gifts as well as moving away from reliance on Variable sources of funds
toward more Consistent sources (Figure 22). It is important to note that by the end of the pilot, the
organization will be securing $800,000 annually and we anticipate the carrying capacity of $850,000 to
be reached shortly thereafter.
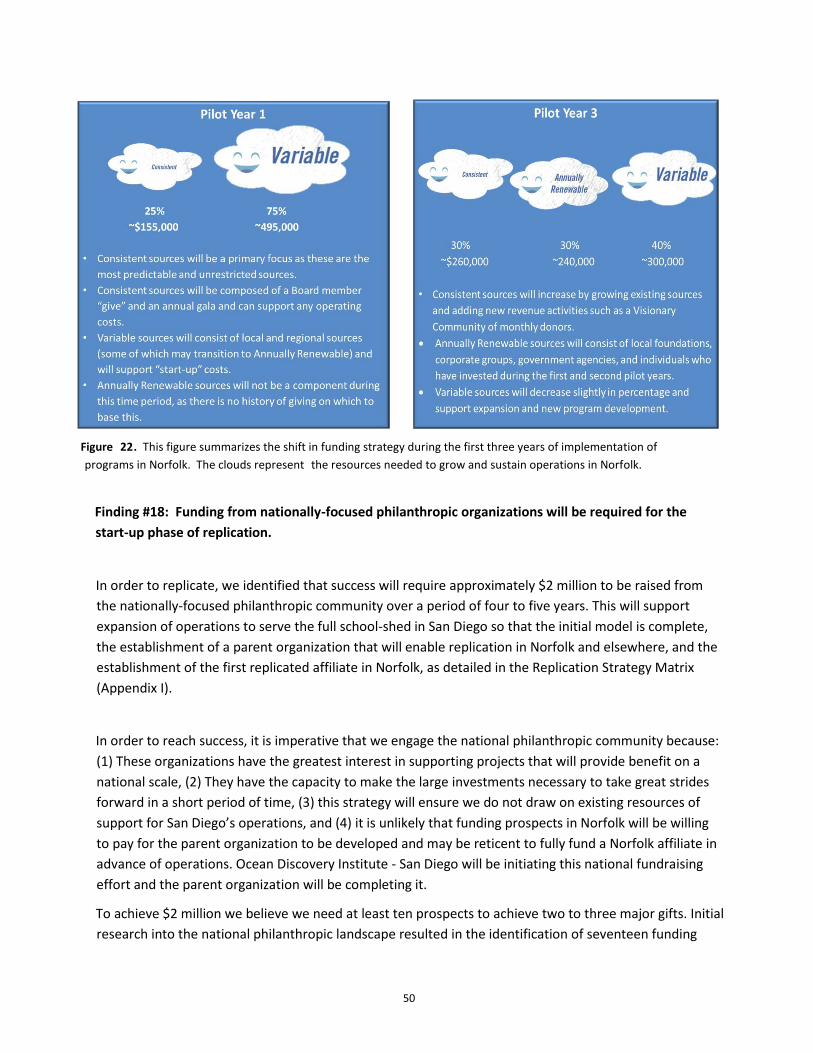
50
Finding #18: Funding from nationally-focused philanthropic organizations will be required for the
start-up phase of replication.
In order to replicate, we identified that success will require approximately $2 million to be raised from
the nationally-focused philanthropic community over a period of four to five years. This will support
expansion of operations to serve the full school-shed in San Diego so that the initial model is complete,
the establishment of a parent organization that will enable replication in Norfolk and elsewhere, and the
establishment of the first replicated affiliate in Norfolk, as detailed in the Replication Strategy Matrix
(Appendix I).
In order to reach success, it is imperative that we engage the national philanthropic community because:
(1) These organizations have the greatest interest in supporting projects that will provide benefit on a
national scale, (2) They have the capacity to make the large investments necessary to take great strides
forward in a short period of time, (3) this strategy will ensure we do not draw on existing resources of
support for San Diego’s operations, and (4) it is unlikely that funding prospects in Norfolk will be willing
to pay for the parent organization to be developed and may be reticent to fully fund a Norfolk affiliate in
advance of operations. Ocean Discovery Institute - San Diego will be initiating this national fundraising
effort and the parent organization will be completing it.
To achieve $2 million we believe we need at least ten prospects to achieve two to three major gifts. Initial
research into the national philanthropic landscape resulted in the identification of seventeen funding
Figure 22 . This figure summarizes the shift in funding strategy during the first three years of implementation of programs in Norfolk. The clouds represent the resources needed to grow and sustain operations in Norfolk.
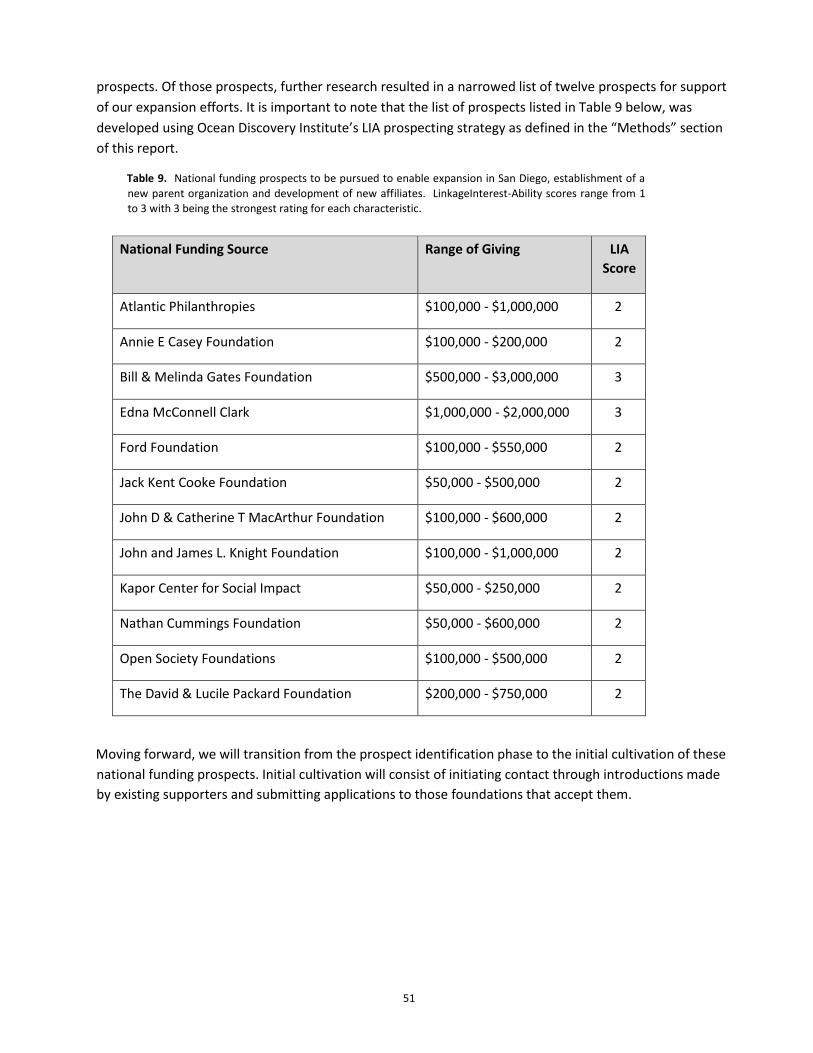
51
prospects. Of those prospects, further research resulted in a narrowed list of twelve prospects for support
of our expansion efforts. It is important to note that the list of prospects listed in Table 9 below, was
developed using Ocean Discovery Institute’s LIA prospecting strategy as defined in the “Methods” section
of this report.
Table 9. National funding prospects to be pursued to enable expansion in San Diego, establishment of a
new parent organization and development of new affiliates. LinkageInterest-Ability scores range from 1
to 3 with 3 being the strongest rating for each characteristic.
National Funding Source Range of Giving LIA
Score
Atlantic Philanthropies $100,000 - $1,000,000 2
Annie E Casey Foundation $100,000 - $200,000 2
Bill & Melinda Gates Foundation $500,000 - $3,000,000 3
Edna McConnell Clark $1,000,000 - $2,000,000 3
Ford Foundation $100,000 - $550,000 2
Jack Kent Cooke Foundation $50,000 - $500,000 2
John D & Catherine T MacArthur Foundation $100,000 - $600,000 2
John and James L. Knight Foundation $100,000 - $1,000,000 2
Kapor Center for Social Impact $50,000 - $250,000 2
Nathan Cummings Foundation $50,000 - $600,000 2
Open Society Foundations $100,000 - $500,000 2
The David & Lucile Packard Foundation $200,000 - $750,000 2
Moving forward, we will transition from the prospect identification phase to the initial cultivation of these
national funding prospects. Initial cultivation will consist of initiating contact through introductions made
by existing supporters and submitting applications to those foundations that accept them.
52
---End of Fine Level Assessment---
The following summarize a handful of lessons learned in the process of conducting this feasibility study.
While they do not directly address the main research question or the specific lines of inquiry identified at
the start of our research, they are of note.
1. The relationship with NOAA being that of both the funder and an invested partner ensured the
feasibility assessment could evolve as needed to ensure the success of the ultimate goal. Having
NOAA’s commitment to the larger goal of replication and a clear understanding of the inherent
challenges that this feasibility study entailed meant that the federal program officer and the
project liaison were willing to work with the recipient so that the work plan deliverables and
timeline could be revised to meet the project goal and agency’s mission. Additionally, beyond the
funding, the resources and expertise of the agency (i.e., Sarah Schoedinger’s authorship of this
report) were pivotal to the overall accomplishments of the project.
2. While substantial investments are needed to get the initial second site up and running, as well as
establish the parent organization, it is anticipated that costs for establishing additional sites will
be lower.
3. The investments made in this process demonstrate value not just for the ultimate outcome of
replication, but also for operations at Ocean Discovery Institute San Diego. For example, the need
to clearly define the Ocean Discovery Institute Business Model, is already driving different
strategies and decision making to better achieve sustainability and student success.
4. It is essential to identify the time and expertise outside of the bailiwick of existing staff that will
be needed to ensure project success. Non-profit organizations often operate with very minimal
resources. Consequently, their staff members do not always acknowledge what is required to
achieve success and, instead, attempt to get the job done with the fewest resources possible.
However, such efforts to save funds, may end up costing the organization in staff time and delays
in the project. In this project, Ocean Discovery Institute leadership searched their local
professional networks to identify unpaid interns who could help with specific aspects of the
research (discussed in Methods). Given the complexity and dynamic nature of this study, hiring a
paid consultant with the requisite experience and expertise was more efficient because less staff
time was needed to guide them toward the desired output and the project was able to evolve as
needed.
53
Plans are nothing.
Planning is everything.
~Dwight D. Eisenhower
Conclusions and Recommendations
The feasibility study asked: (1) “Which replication strategy will be most
Plans are nothing. successful?” and (2) “Which location, if any, would enable
implementation of the model to succeed?” Our conclusions are as follows:
With respect to strategy:
1. The clearly defined Ocean Discovery Institute Business Model will allow replication to occur.
2. In order for replication to occur, the organizational structure of Ocean Discovery Institute must
transition to one with a parent organization and local affiliates. Once this occurs, the existing San
Diego-based organization will become an affiliate, Norfolk may be established as the second
affiliate, and other sites may follow.
With respect to location:
1. Replication is feasible in Norfolk and elsewhere in the United States, assuming certain conditions
are met.
2. In the Chesapeake Bay region, Norfolk, Virginia is the location that best fits the Business Model.
a. The Booker T. Washington High School feeder pattern has been identified as the
school-shed, which includes the housing projects of Young Terrace and Tidewater
Gardens.
b. The community, academic, STEM industry, and funding partners have the capacity and
interest to support this model. The Norfolk Redevelopment and Housing Authority has
been identified as one of the key partners.
c. The region has the funding capacity to sustain operations of a Norfolk affiliate once it is
established. It is projected that this affiliate can be self-sufficient during the pilot years,
but this must be verified by the Norfolk Board of Directors once in place.
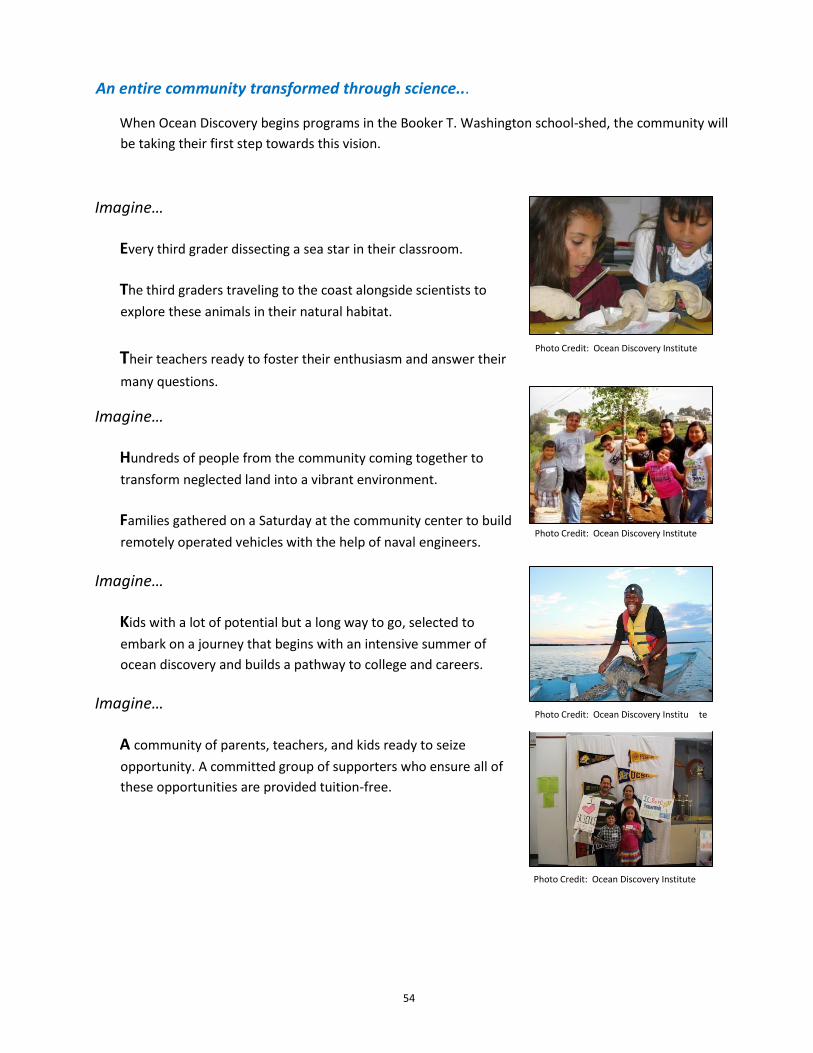
54
An entire community transformed through science...
When Ocean Discovery begins programs in the Booker T. Washington school-shed, the community will
be taking their first step towards this vision.
Imagine…
Every third grader dissecting a sea star in their classroom.
The third graders traveling to the coast alongside scientists to
explore these animals in their natural habitat.
Their teachers ready to foster their enthusiasm and answer their
many questions.
Imagine…
Hundreds of people from the community coming together to
transform neglected land into a vibrant environment.
Families gathered on a Saturday at the community center to build
remotely operated vehicles with the help of naval engineers.
Imagine…
Kids with a lot of potential but a long way to go, selected to
embark on a journey that begins with an intensive summer of
ocean discovery and builds a pathway to college and careers.
Imagine…
A community of parents, teachers, and kids ready to seize
opportunity. A committed group of supporters who ensure all of
these opportunities are provided tuition-free.
Photo Credit: Ocean Discovery Institute
Photo Credit: Ocean Discovery Institute
Photo Credit: Ocean Discovery Institu te
Photo Credit: Ocean Discovery Institute
55
Recommendations
The primary recommendation is to move forward via the plan outlined in the report
(summarized in the Replication Strategy Gantt Chart, Appendix I). Objectives outlined in the Replication
Strategy Matrix have to be met in order to progress beyond each threshold. The following considerations
should guide how the objectives of Ocean Discovery Institute’s replication strategy are enacted in the
coming year.
1. The Replication Task Force of Ocean Discovery Institute’s Board of Directors should remain in
place to ensure that thresholds are not crossed without measurable objectives being met. The
full board should be kept informed of progress, particularly as each threshold is crossed.
Leverage relationship with NOAA (codified in a memorandum of understanding signed in January
2015) to ensure that NOAA’s assets and capabilities are appropriately integrated as replication
unfolds.
2. Additional advisors (e.g., leaders from local organizations that have already replicated
successfully) should be integrated as needed to provide expertise not present among staff and
Replication Task Force.
3. A consultant must be identified to lead the development of the Parent Business Model to ensure
sufficient capacity, time, and expertise are available.
4. When parent materials are developed, outside advisors should be drawn upon to ensure that
these are highly transferable.
5. A strong communications plan should be developed to ensure existing relationships with
partners and potential partners in Norfolk continue to be fostered.
6. Norfolk relationships should be the primary mechanism for identifying potential board members.
7. Start-up funding must rely on national funders to support Ocean Discovery Institute - San Diego
growing to reach its entire school-shed, the establishment of a parent organization, and the
establishment of the Norfolk affiliate so that it is ready to begin operations.
8. Securing funding for each threshold will likely be the primary driver of the rate of
implementation, and, therefore, embarking upon the national funding strategy should be an
immediate priority.
9. Ultimately, fidelity to the model is more important than meeting the estimated timeline. Success
in San Diego, Norfolk, and any future sites, will depend upon this.
56
Literature Cited 18
Creech, H. 2008. Scale Up and Replication for social and environmental enterprises. The SEED Initiative
City Heights Partnership for Children, 2014. City Heights Starting Point – Baseline Report.
http://issuu.com/uw_sandiego/docs/city_heights_baseline_report_digita
The Pell Institute, 2008. Moving Beyond Access: College success for low-income, first-generation students.
http://www.pellinstitute.org/downloads/publicationsMoving_Beyond_Access_2008.pdf
Appendices
A. Feasibility Study’s Design
B. List of Questions Asked During Site Visits
C. Coarse, Medium and Fine Level Data on Schools and Community
D. Replication of Ocean Discovery Institute Model: Coarse Level Site Assessment
E. STEM Industry Research for the Hampton Roads Region of Virginia: Chesapeake, Hampton,
Newport News, Norfolk, and Portsmouth
F. “Replication of Ocean Discovery Institute: An Urban STEM Model that Will Empower Decision
Makers and Leadership for the Chesapeake Bay Region”: Replication Strategy Assessment:
Literature Review
G. Detailed version of the Ocean Discovery Institute Business Model
H. Norfolk Public Schools – relevant school-shed feeder pattern
I. Replication Strategy Gantt Chart, Matrix, and Budget
________________________ 18
Literature cited in any appendix is not listed here unless it was directly cited in the report text. The literature review contains an
extensive list of citations. See Appendix F for more details.
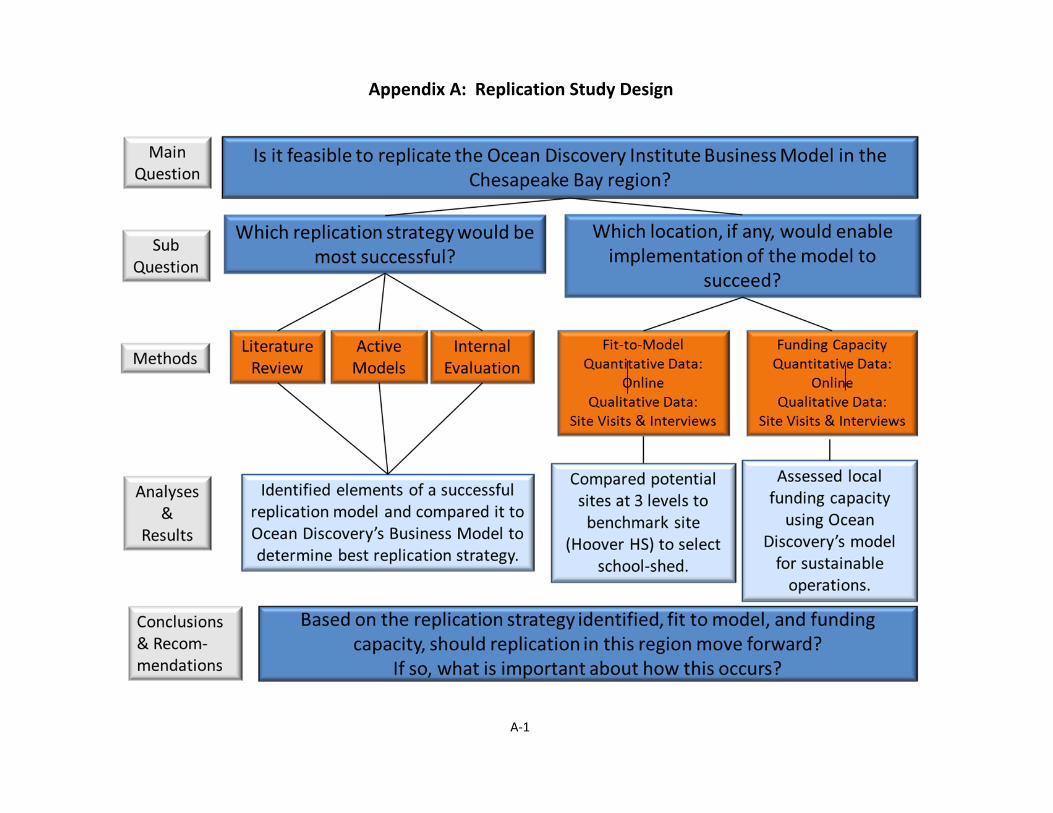
A-1
Appendix A: Replication Study Design
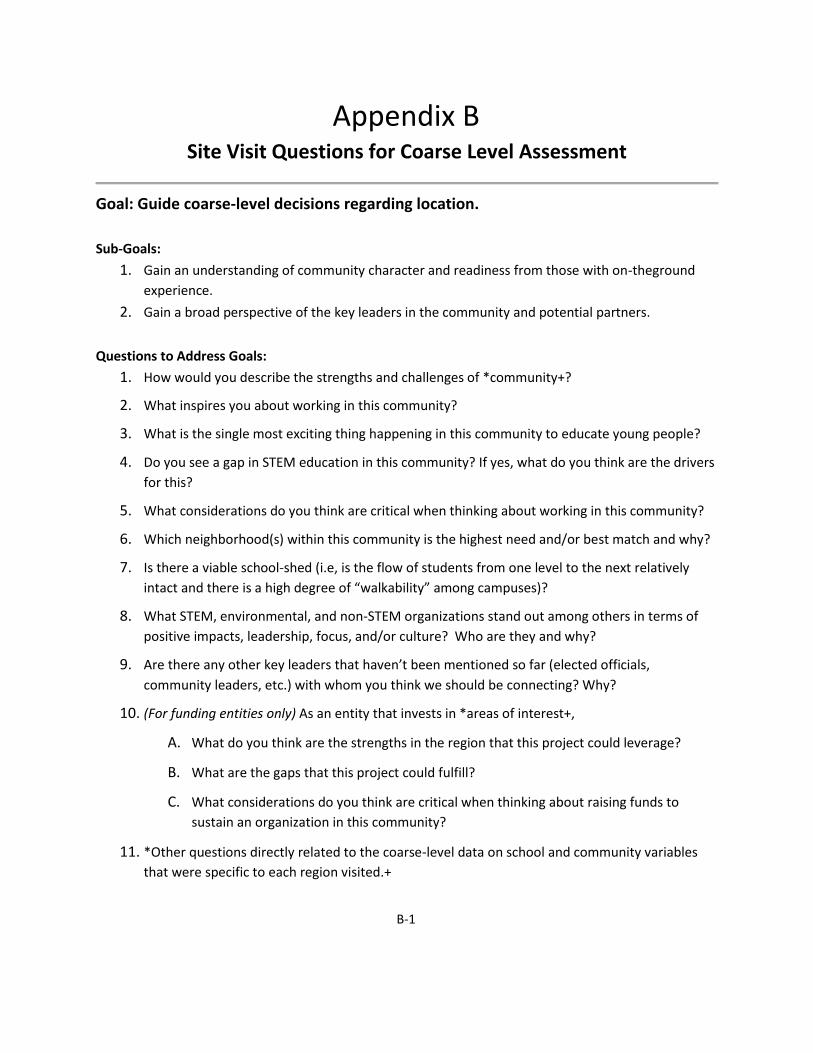
B-1
Appendix B
Site Visit Questions for Coarse Level Assessment
Goal: Guide coarse-level decisions regarding location.
Sub-Goals:
1. Gain an understanding of community character and readiness from those with on-theground
experience.
2. Gain a broad perspective of the key leaders in the community and potential partners.
Questions to Address Goals:
1. How would you describe the strengths and challenges of *community+?
2. What inspires you about working in this community?
3. What is the single most exciting thing happening in this community to educate young people?
4. Do you see a gap in STEM education in this community? If yes, what do you think are the drivers
for this?
5. What considerations do you think are critical when thinking about working in this community?
6. Which neighborhood(s) within this community is the highest need and/or best match and why?
7. Is there a viable school-shed (i.e, is the flow of students from one level to the next relatively
intact and there is a high degree of “walkability” among campuses)?
8. What STEM, environmental, and non-STEM organizations stand out among others in terms of
positive impacts, leadership, focus, and/or culture? Who are they and why?
9. Are there any other key leaders that haven’t been mentioned so far (elected officials,
community leaders, etc.) with whom you think we should be connecting? Why?
10. (For funding entities only) As an entity that invests in *areas of interest+,
A. What do you think are the strengths in the region that this project could leverage?
B. What are the gaps that this project could fulfill?
C. What considerations do you think are critical when thinking about raising funds to
sustain an organization in this community?
11. *Other questions directly related to the coarse-level data on school and community variables
that were specific to each region visited.+
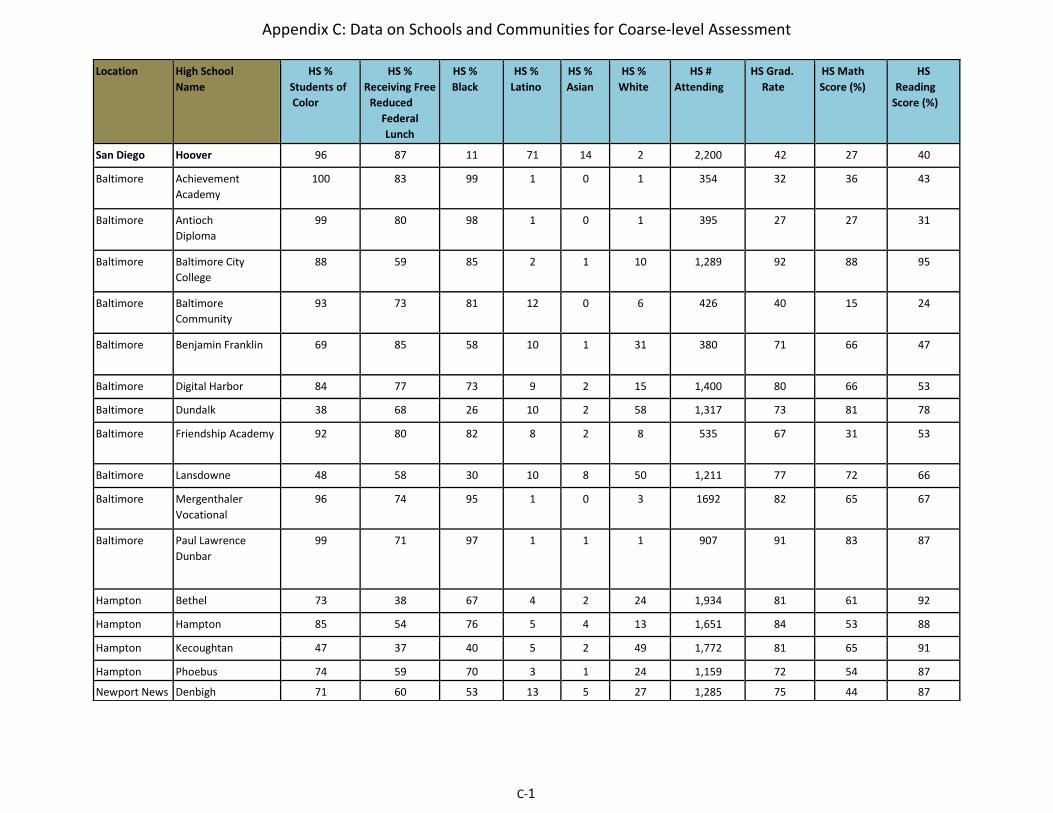
Appendix C: Data on Schools and Communities for Coarse‐level Assessment
C‐1
Location High School Name
HS % Students of
Color
HS % Receiving Free
Reduced Federal Lunch
HS %
Black HS %
Latino HS %
Asian HS %
White HS #
Attending HS Grad.
Rate HS Math
Score (%) HS
Reading Score (%)
San Diego Hoover 96 87 11 71 14 2 2,200 42 27 40
Baltimore Achievement
Academy 100 83 99 1 0 1 354 32 36 43
Baltimore Antioch Diploma
99 80 98 1 0 1 395 27 27 31
Baltimore Baltimore City
College 88 59 85 2 1 10 1,289 92 88 95
Baltimore Baltimore Community
93 73 81 12 0 6 426 40 15 24
Baltimore Benjamin Franklin 69 85 58 10 1 31 380 71 66 47
Baltimore Digital Harbor 84 77 73 9 2 15 1,400 80 66 53
Baltimore Dundalk 38 68 26 10 2 58 1,317 73 81 78
Baltimore Friendship Academy 92 80 82 8 2 8 535 67 31 53
Baltimore Lansdowne 48 58 30 10 8 50 1,211 77 72 66
Baltimore Mergenthaler
Vocational 96 74 95 1 0 3 1692 82 65 67
Baltimore Paul Lawrence
Dunbar 99 71 97 1 1 1 907 91 83 87
Hampton Bethel 73 38 67 4 2 24 1,934 81 61 92
Hampton Hampton 85 54 76 5 4 13 1,651 84 53 88
Hampton Kecoughtan 47 37 40 5 2 49 1,772 81 65 91
Hampton Phoebus 74 59 70 3 1 24 1,159 72 54 87
Newport News Denbigh 71 60 53 13 5 27 1,285 75 44 87
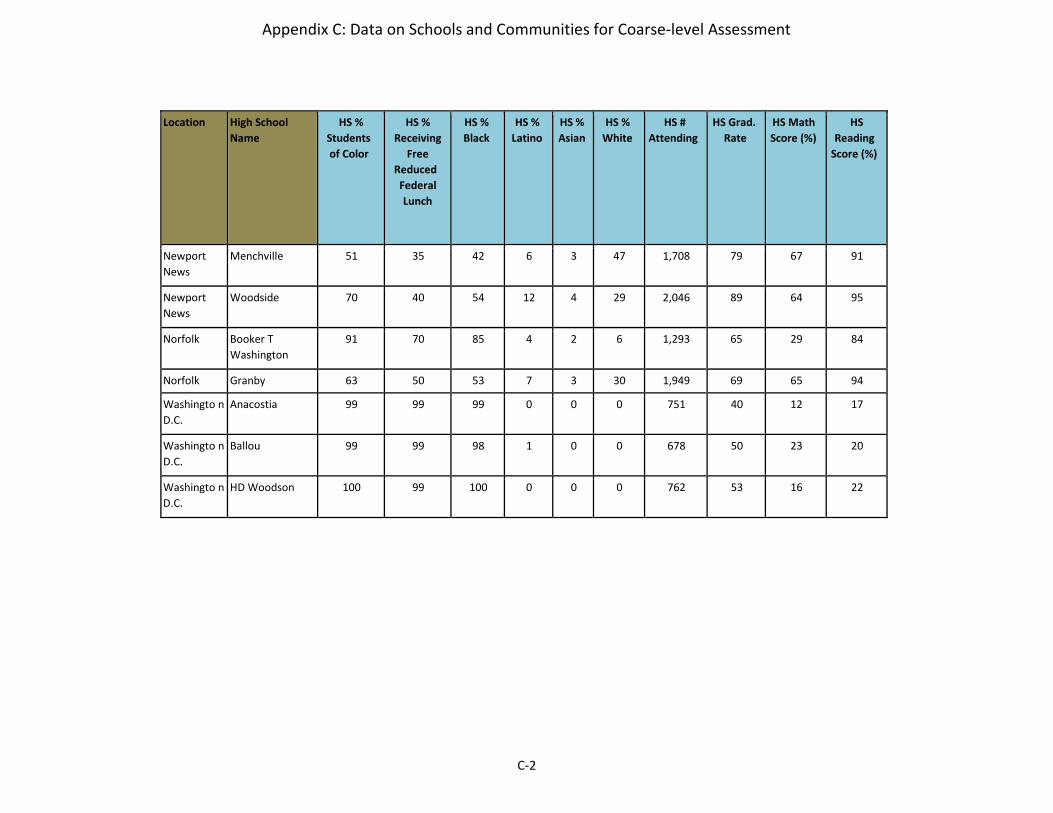
Appendix C: Data on Schools and Communities for Coarse‐level Assessment
C-2
Location High School Name
HS % Students
of Color
HS % Receiving
Free Reduced
Federal Lunch
HS %
Black HS %
Latino HS %
Asian HS %
White HS #
Attending HS Grad.
Rate HS Math
Score (%) HS
Reading Score (%)
Newport News
Menchville 51 35 42 6 3 47 1,708 79 67 91
Newport News
Woodside 70 40 54 12 4 29 2,046 89 64 95
Norfolk Booker T Washington
91 70 85 4 2 6 1,293 65 29 84
Norfolk Granby 63 50 53 7 3 30 1,949 69 65 94
Washingto n
D.C. Anacostia 99 99 99 0 0 0 751 40 12 17
Washingto n
D.C. Ballou 99 99 98 1 0 0 678 50 23 20
Washingto n
D.C. HD Woodson 100 99 100 0 0 0 762 53 16 22
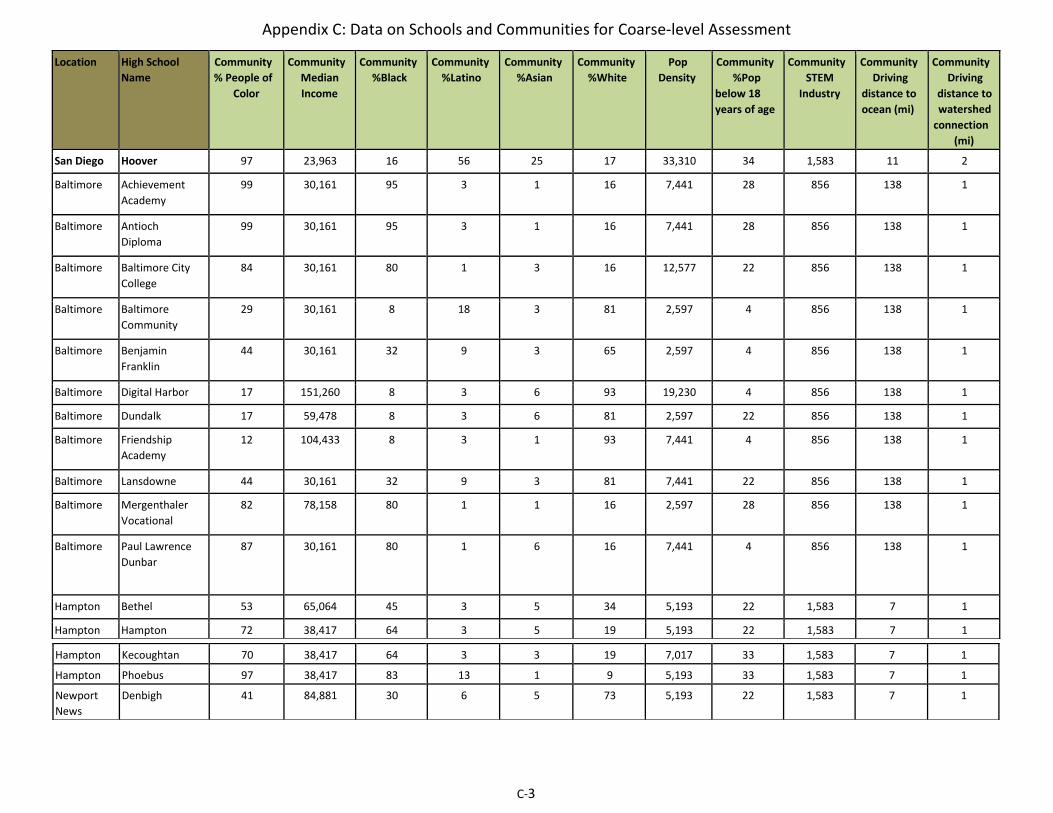
Appendix C: Data on Schools and Communities for Coarse‐level Assessment
C‐3
Location High School Name
Community % People of
Color
Community Median Income
Community
%Black Community
%Latino Community
%Asian Community
%White Pop
Density Community
%Pop
below 18
years of age
Community STEM
Industry
Community Driving
distance to
ocean (mi)
Community Driving
distance to
watershed connection
(mi)
San Diego Hoover 97 23,963 16 56 25 17 33,310 34 1,583 11 2
Baltimore Achievement
Academy 99 30,161 95 3 1 16 7,441 28 856 138 1
Baltimore Antioch Diploma
99 30,161 95 3 1 16 7,441 28 856 138 1
Baltimore Baltimore City
College 84 30,161 80 1 3 16 12,577 22 856 138 1
Baltimore Baltimore Community
29 30,161 8 18 3 81 2,597 4 856 138 1
Baltimore Benjamin
Franklin 44 30,161 32 9 3 65 2,597 4 856 138 1
Baltimore Digital Harbor 17 151,260 8 3 6 93 19,230 4 856 138 1
Baltimore Dundalk 17 59,478 8 3 6 81 2,597 22 856 138 1
Baltimore Friendship
Academy 12 104,433 8 3 1 93 7,441 4 856 138 1
Baltimore Lansdowne 44 30,161 32 9 3 81 7,441 22 856 138 1
Baltimore Mergenthaler
Vocational 82 78,158 80 1 1 16 2,597 28 856 138 1
Baltimore Paul Lawrence
Dunbar 87 30,161 80 1 6 16 7,441 4 856 138 1
Hampton Bethel 53 65,064 45 3 5 34 5,193 22 1,583 7 1
Hampton Hampton 72 38,417 64 3 5 19 5,193 22 1,583 7 1
Hampton Kecoughtan 70 38,417 64 3 3 19 7,017 33 1,583 7 1
Hampton Phoebus 97 38,417 83 13 1 9 5,193 33 1,583 7 1
Newport News
Denbigh 41 84,881 30 6 5 73 5,193 22 1,583 7 1
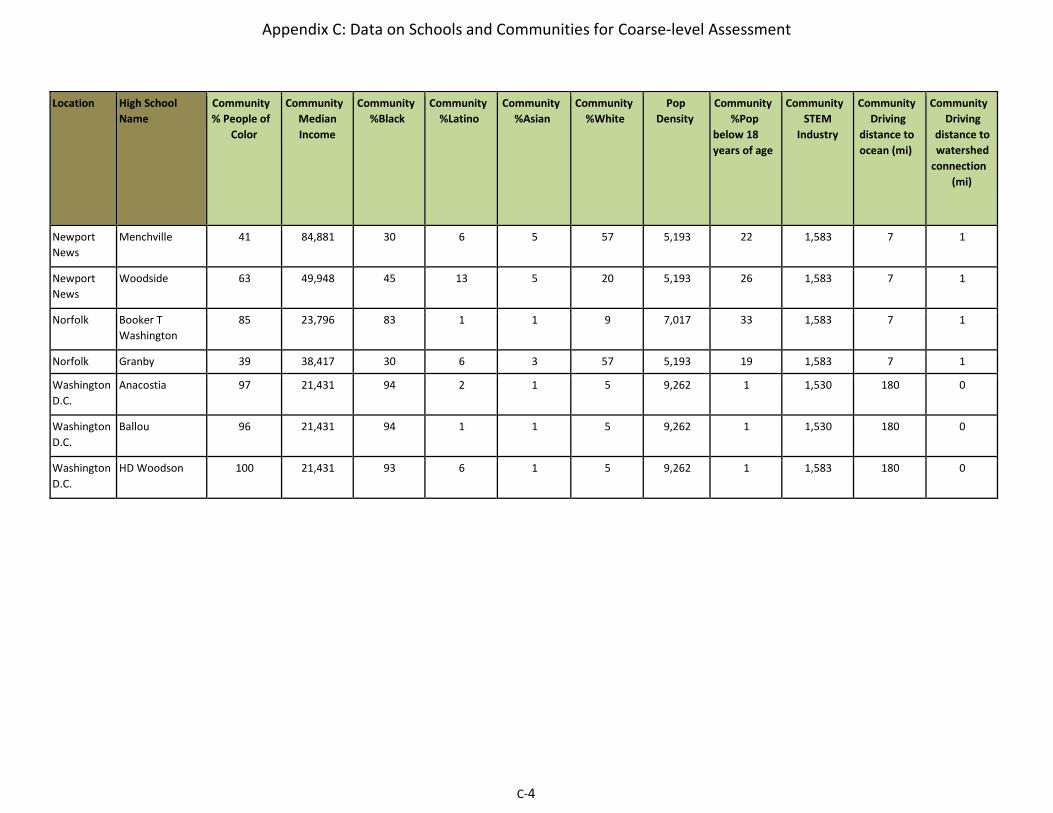
Appendix C: Data on Schools and Communities for Coarse‐level Assessment
C‐4
Location High School Name
Community % People of
Color
Community Median Income
Community
%Black Community
%Latino Community
%Asian Community
%White Pop
Density Community
%Pop
below 18
years of age
Community STEM
Industry
Community Driving
distance to
ocean (mi)
Community Driving
distance to
watershed connection
(mi)
Newport News
Menchville 41 84,881 30 6 5 57 5,193 22 1,583 7 1
Newport News
Woodside 63 49,948 45 13 5 20 5,193 26 1,583 7 1
Norfolk Booker T Washington
85 23,796 83 1 1 9 7,017 33 1,583 7 1
Norfolk Granby 39 38,417 30 6 3 57 5,193 19 1,583 7 1
Washington
D.C. Anacostia 97 21,431 94 2 1 5 9,262 1 1,530 180 0
Washington
D.C. Ballou 96 21,431 94 1 1 5 9,262 1 1,530 180 0
Washington
D.C. HD Woodson 100 21,431 93 6 1 5 9,262 1 1,583 180 0
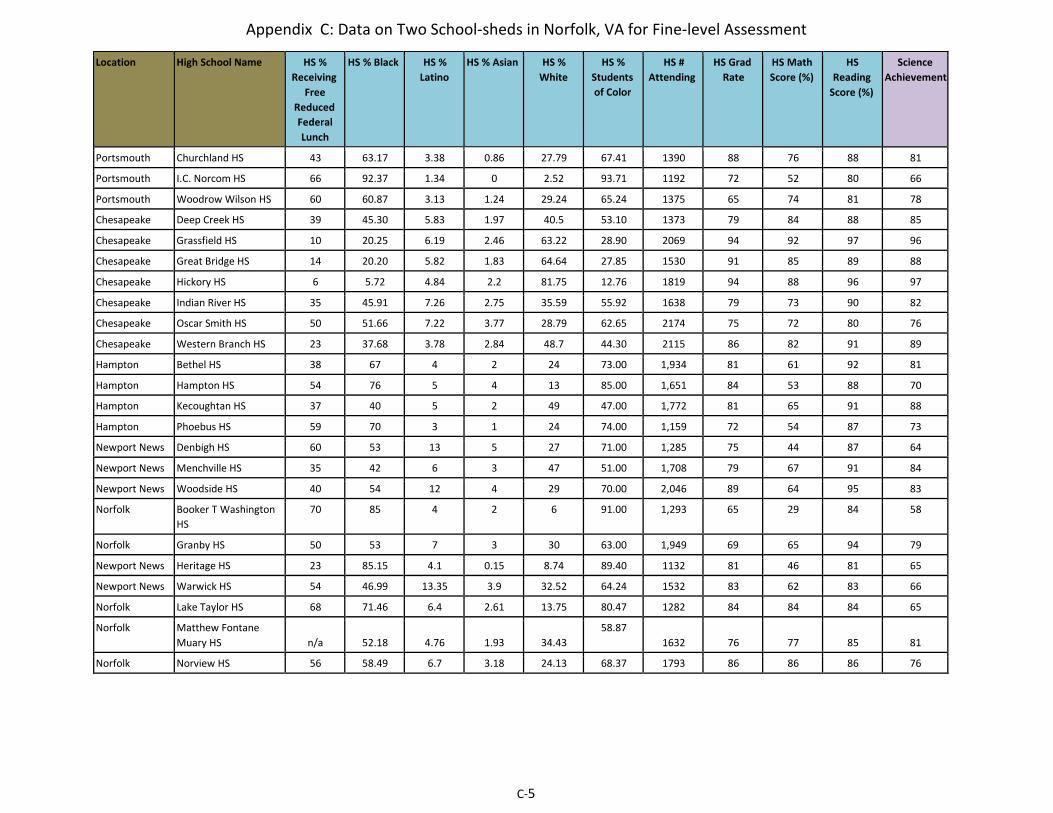
Appendix C: Data on Two School‐sheds in Norfolk, VA for Fine‐level Assessment
C‐5
Location High School Name HS % Receiving
Free Reduced Federal Lunch
HS % Black HS %
Latino HS % Asian HS %
White HS %
Students
of Color
HS #
Attending HS Grad
Rate HS Math
Score (%) HS
Reading Score (%)
Science Achievement
Portsmouth Churchland HS 43 63.17 3.38 0.86 27.79 67.41 1390 88 76 88 81
Portsmouth I.C. Norcom HS 66 92.37 1.34 0 2.52 93.71 1192 72 52 80 66
Portsmouth Woodrow Wilson HS 60 60.87 3.13 1.24 29.24 65.24 1375 65 74 81 78
Chesapeake Deep Creek HS 39 45.30 5.83 1.97 40.5 53.10 1373 79 84 88 85
Chesapeake Grassfield HS 10 20.25 6.19 2.46 63.22 28.90 2069 94 92 97 96
Chesapeake Great Bridge HS 14 20.20 5.82 1.83 64.64 27.85 1530 91 85 89 88
Chesapeake Hickory HS 6 5.72 4.84 2.2 81.75 12.76 1819 94 88 96 97
Chesapeake Indian River HS 35 45.91 7.26 2.75 35.59 55.92 1638 79 73 90 82
Chesapeake Oscar Smith HS 50 51.66 7.22 3.77 28.79 62.65 2174 75 72 80 76
Chesapeake Western Branch HS 23 37.68 3.78 2.84 48.7 44.30 2115 86 82 91 89
Hampton Bethel HS 38 67 4 2 24 73.00 1,934 81 61 92 81
Hampton Hampton HS 54 76 5 4 13 85.00 1,651 84 53 88 70
Hampton Kecoughtan HS 37 40 5 2 49 47.00 1,772 81 65 91 88
Hampton Phoebus HS 59 70 3 1 24 74.00 1,159 72 54 87 73
Newport News Denbigh HS 60 53 13 5 27 71.00 1,285 75 44 87 64
Newport News Menchville HS 35 42 6 3 47 51.00 1,708 79 67 91 84
Newport News Woodside HS 40 54 12 4 29 70.00 2,046 89 64 95 83
Norfolk Booker T Washington
HS 70 85 4 2 6 91.00 1,293 65 29 84 58
Norfolk Granby HS 50 53 7 3 30 63.00 1,949 69 65 94 79
Newport News Heritage HS 23 85.15 4.1 0.15 8.74 89.40 1132 81 46 81 65
Newport News Warwick HS 54 46.99 13.35 3.9 32.52 64.24 1532 83 62 83 66
Norfolk Lake Taylor HS 68 71.46 6.4 2.61 13.75 80.47 1282 84 84 84 65
Norfolk Matthew Fontane Muary HS n/a 52.18 4.76 1.93 34.43
58.87 1632 76 77 85 81
Norfolk Norview HS 56 58.49 6.7 3.18 24.13 68.37 1793 86 86 86 76
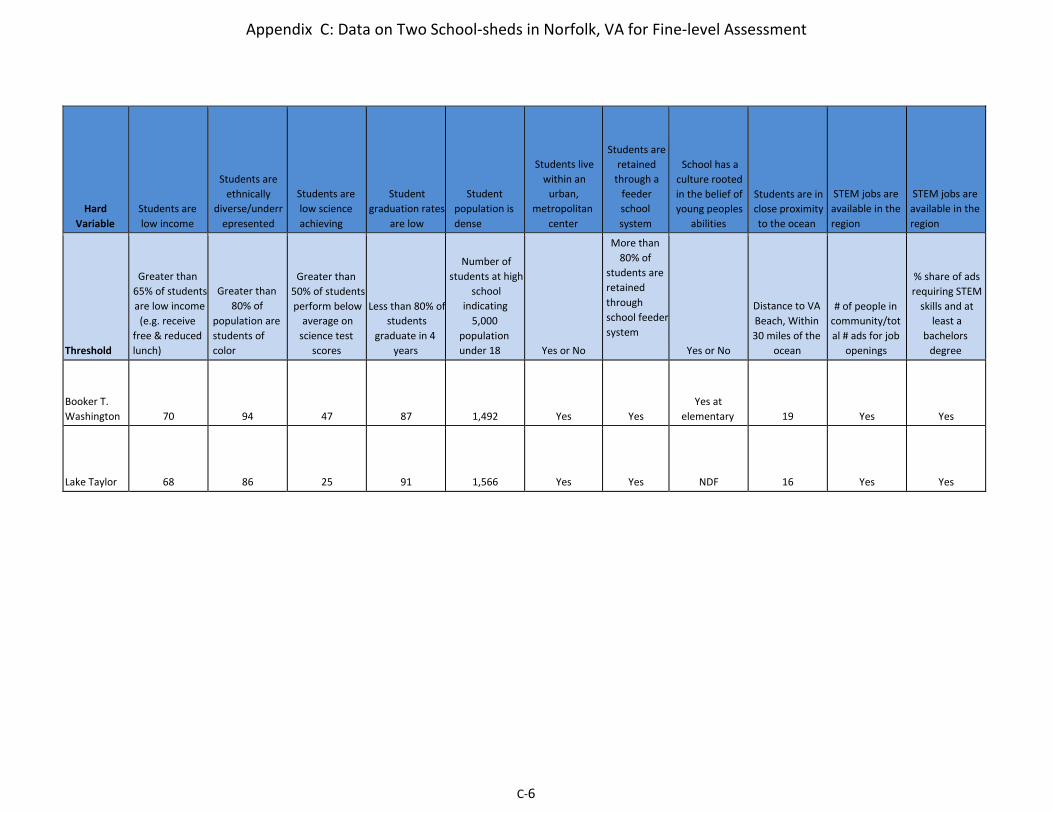
Appendix C: Data on Two School‐sheds in Norfolk, VA for Fine‐level Assessment
C‐6
Hard
Variable Students are
low income
Students are
ethnically diverse/underr
epresented
Students are
low science
achieving
Student
graduation rates
are low
Student
population is
dense
Students live
within an urban,
metropolitan
center
Students are
retained through a
feeder school
system
School has a
culture rooted
in the belief of
young peoples abilities
Students are in
close proximity to the ocean
STEM jobs are
available in the
region
STEM jobs are
available in the
region
Threshold
Greater than 65% of students
are low income (e.g. receive
free & reduced
lunch)
Greater than 80% of
population are
students of
color
Greater than 50% of students perform below
average on science test
scores
Less than 80% of
students graduate in 4
years
Number of
students at high
school indicating
5,000
population
under 18 Yes or No
More than 80% of
students are
retained
through
school feeder
system Yes or No
Distance to VA Beach, Within 30 miles of the
ocean
# of people in
community/tot al # ads for job
openings
% share of ads
requiring STEM
skills and at
least a bachelors
degree
Booker T. Washington 70 94 47 87 1,492 Yes Yes
Yes at
elementary 19 Yes Yes
Lake Taylor 68 86 25 91 1,566 Yes Yes NDF 16 Yes Yes
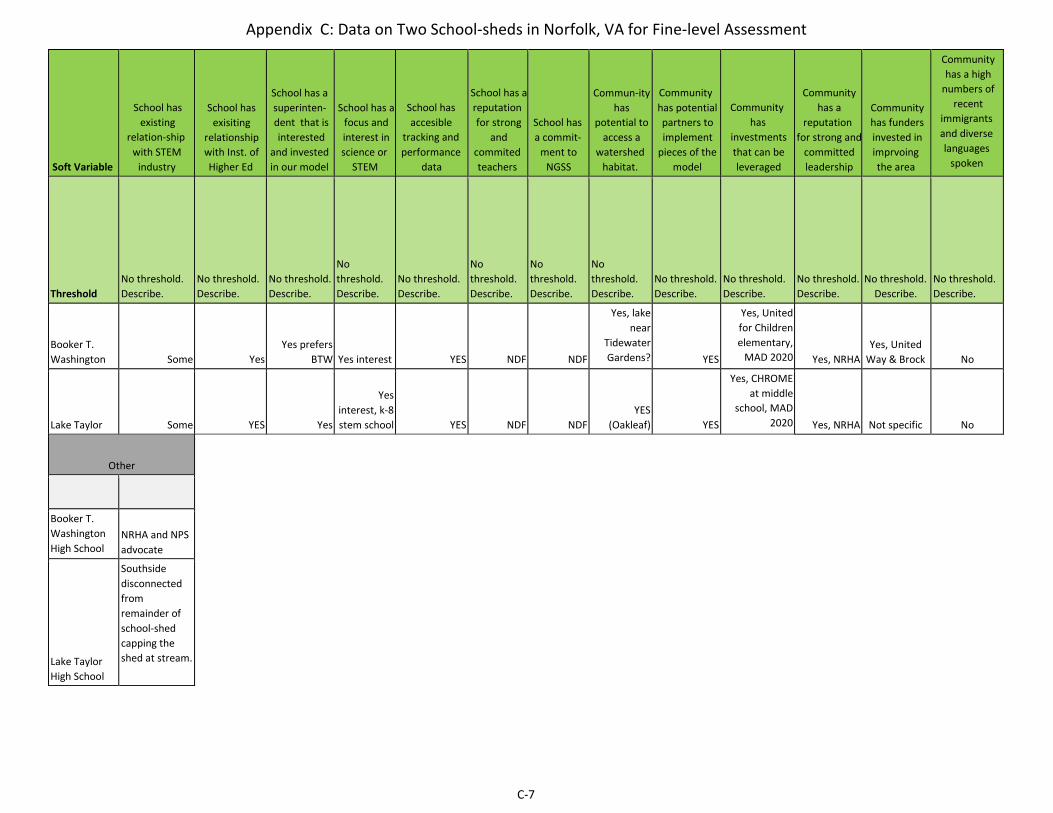
Appendix C: Data on Two School‐sheds in Norfolk, VA for Fine‐level Assessment
C‐7
Soft Variable
School has
existing relation‐ship
with STEM industry
School has
exisiting relationship
with Inst. of Higher Ed
School has a
superinten‐ dent that is
interested and invested
in our model
School has a
focus and
interest in science or
STEM
School has
accesible tracking and performance
data
School has a reputation for strong
and commited
teachers
School has
a commit‐ ment to
NGSS
Commun‐ity
has potential to
access a watershed
habitat.
Community has potential
partners to
implement pieces of the
model
Community has
investments
that can be
leveraged
Community
has a reputation
for strong and committed
leadership
Community
has funders
invested in imprvoing
the area
Community
has a high numbers of
recent immigrants and diverse languages
spoken
Threshold No threshold.
Describe. No threshold.
Describe. No threshold.
Describe.
No
threshold.
Describe. No threshold.
Describe.
No
threshold.
Describe.
No
threshold.
Describe.
No
threshold.
Describe. No threshold.
Describe. No threshold.
Describe. No threshold.
Describe. No threshold.
Describe. No threshold.
Describe.
Booker T. Washington Some Yes
Yes prefers BTW Yes interest YES NDF NDF
Yes, lake
near
Tidewater
Gardens? YES
Yes, United
for Children
elementary, MAD 2020 Yes, NRHA
Yes, United Way & Brock No
Lake Taylor Some YES Yes
Yes interest, k‐8
stem school YES NDF NDF YES
(Oakleaf) YES
Yes, CHROME
at middle
school, MAD 2020 Yes, NRHA Not specific No
Other
Booker T. Washington High School
NRHA and NPS
advocate
Lake Taylor High School
Southside
disconnected
from
remainder of
school‐shed
capping the
shed at stream.
D-1
Appendix D
Replication of
Ocean Discovery Institute’s Model: Coarse Level Site Assessment
By Bemmy Maharramov
D-2
Introduction
Effective replication of successful community-based initiatives remains a challenge across disciplines.
For the purposes of this report, replication is defined as, “the transfer to a different location of test
concept, a pilot project, a small enterprise, and so forth, in order to repeat success elsewhere”, and is
also sometimes referred to as “scale-out” (Creech 2008). Replication is a challenge for a host of reasons,
including lack of robust monitoring and evaluation frameworks, timelines that do not align with the
amount of time it realistically takes for implementation in a community, lack of funding and political will
required for sustainability, and inadequate understanding of the context and needs of a new location
(Summerville and Raley 2009). At the same time, replication across scales and locations is a powerful
tool in leveraging models and approaches that have been found to work, as well as sharing lessons
learned and knowledge.
This project focuses on the replication effort of a successful non-profit, Ocean Discovery Institute, and in
particular the site assessment to select the location and potential partners to support the model in the
Chesapeake Bay region in a project entitled, “Reaching Students in the Chesapeake Bay Region”. A
mixed methods approach will be used throughout the site assessment, including analysis of publicly
available on-line data, literature review, field data collection, surveys, and interviews as well as the use
of Geographic Information Systems (GIS).
Background
San Diego-based non-profit, Ocean Discovery Institute (henceforth called “Ocean Discovery”), uses
ocean science to empower young people from underserved urban communities to transform their lives,
their community, and the world as scientific and environmental leaders. By providing programs and
services that develop the knowledge and skills necessary to become tomorrow’s decision makers and
work force, Ocean Discovery ensures young people understand how the world works and how they can
make a difference. In 2011, Ocean Discovery was awarded the Presidential Award for Excellence in
Science, Mathematics, and Engineering Mentoring, the highest honor bestowed by the U.S. government
for efforts that advance these fields.
Ocean Discovery’s model integrates education, scientific research, and environmental stewardship
(Figure 1) and focuses its efforts in a single geographic area. An innovation of the Ocean Discovery
model is their integrative focus on a selected geographic area, utilizing a unique three-tiered pyramid
model for focused engagement at the community, school, and individual scales (Figure 2). The model is
focused on a single “school-shed”, where the majority of students flow from the elementary to middle
to high school, to order to realize transformative impacts over time.

D-3
Figure 1: Ocean Discovery’s three major spheres of focus: education, environmental
stewardship and scientific research
Figure 2: Ocean Discovery’s three-tiered pyramid approach for engagement, from the
community to individual level in the school-shed
Ocean Discovery has applied this model with great success in the community of City Heights in San
Diego. While this community boasts significant cultural and linguistic richness, it also has great need,
with environmental, social, and educational challenges closely intertwined. One of the most diverse
neighborhoods in the nation, City Heights is a densely urbanized community that exhibits the highest
poverty in the region.
The following model criteria have been critical elements to Ocean Discovery’s success.
1. Singular vision that focuses the scope of work including: 100% focus on young people
underrepresented in the sciences (low income, first-generation, people of color, and English second
language learners) and a single community focus.
D-4
2. Proximity to the ocean and the use of the ocean as a platform to teach Science, Technology,
Engineering and Math (STEM).
3. Situated within a STEM and knowledge-based economy to provide mentors, internship and career
opportunities, and funding.
4. Mechanism to maintain student continuity in an urban and densely populated community (e.g.
through feeder school system, a “school-shed”).
5. Strong relationships with schools teachers and districts.
6. Incorporation of community-based and best practice approaches to develop and enhance
programming and organizational systems.
7. Continual program enhancement process based on evaluation and outside resources.
8. Innovative and intentional planning for all program and organizational activities.
9. Strong and committed leadership with high accountability (including a mechanism to transition
leadership to student leaders as they mature through the programs).
10. Powerful culture that is rooted in the belief of young peoples’ abilities.
11. Ability to secure diverse, sustainable financial support.
12. Programming that is based in the following guiding principles:
a. In order to build and sustain interest in the sciences, young people must be provided
with early life experiences in the sciences and continue to be engaged in progressively
rigorous experiences throughout their education.
b. Discovery provides the spark that makes young people want to learn.
c. The most potent and empowering education provides authentic experiences such as
scientific research and actions that benefit the environment.
d. The best strategies for teaching science and building an environmental ethic incorporate
experience in nature.
e. The most effective environments for learning draw upon students’ assets, talents, and
strengths.
f. Educational initiatives must eliminate the unique barriers faced by urban, diverse young
people as they study science and pursue higher education.
As the model criteria reflect, building leadership requires mentoring between peers as well as between
working professionals and young people.
NOAA’s Office of Education and Ocean Discovery have a history of partnership with the goal of
increasing the impact of the organization and extending the reach of NOAA’s mission. In
January 2012, NOAA’s Office of Education and NOAA’s
Chesapeake Bay Office gathered a group of leaders that represent some of the most impactful
education, environmental, and career-development organizations in the region, to explore extending
the reach of Ocean Discovery to the Chesapeake Bay region. The group determined that this model
(particularly the focus on a single community, the provision of progressive opportunities, and the
robust leadership initiative that supports students on their pathway to science careers) would be
desired, beneficial, and fill an existing need.
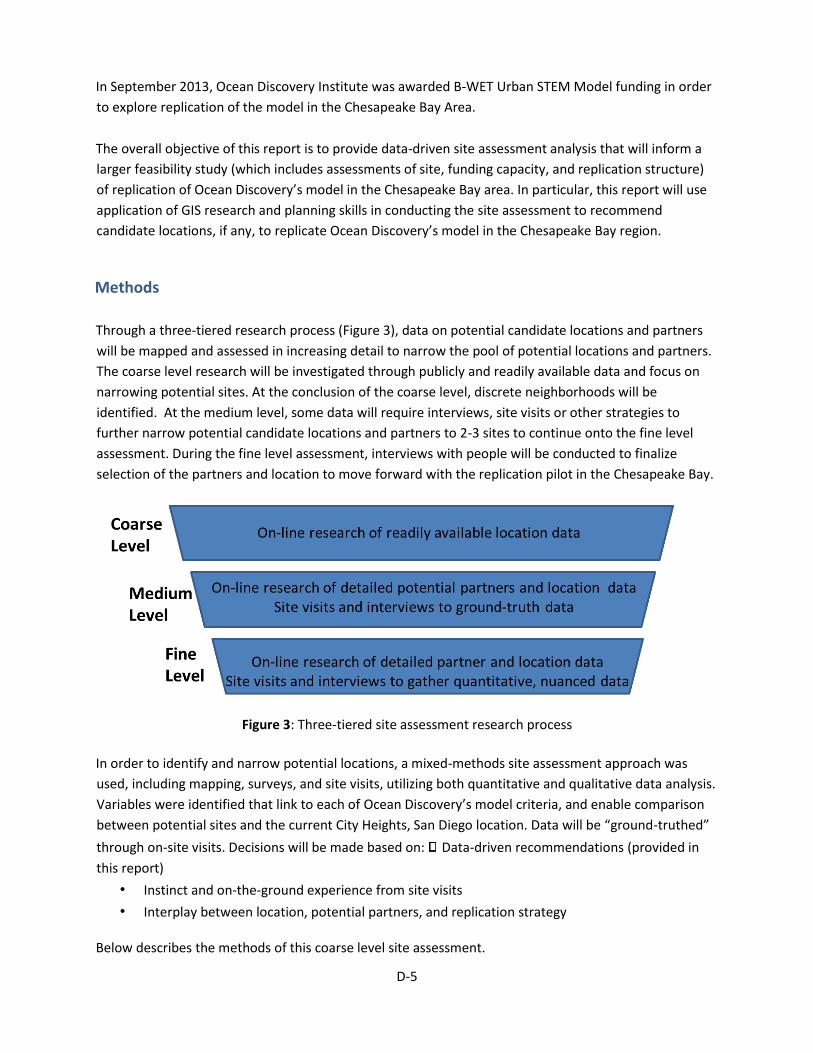
D-5
In September 2013, Ocean Discovery Institute was awarded B-WET Urban STEM Model funding in order
to explore replication of the model in the Chesapeake Bay Area.
The overall objective of this report is to provide data-driven site assessment analysis that will inform a
larger feasibility study (which includes assessments of site, funding capacity, and replication structure)
of replication of Ocean Discovery’s model in the Chesapeake Bay area. In particular, this report will use
application of GIS research and planning skills in conducting the site assessment to recommend
candidate locations, if any, to replicate Ocean Discovery’s model in the Chesapeake Bay region.
Methods
Through a three-tiered research process (Figure 3), data on potential candidate locations and partners
will be mapped and assessed in increasing detail to narrow the pool of potential locations and partners.
The coarse level research will be investigated through publicly and readily available data and focus on
narrowing potential sites. At the conclusion of the coarse level, discrete neighborhoods will be
identified. At the medium level, some data will require interviews, site visits or other strategies to
further narrow potential candidate locations and partners to 2-3 sites to continue onto the fine level
assessment. During the fine level assessment, interviews with people will be conducted to finalize
selection of the partners and location to move forward with the replication pilot in the Chesapeake Bay.
Figure 3: Three-tiered site assessment research process
In order to identify and narrow potential locations, a mixed-methods site assessment approach was
used, including mapping, surveys, and site visits, utilizing both quantitative and qualitative data analysis.
Variables were identified that link to each of Ocean Discovery’s model criteria, and enable comparison
between potential sites and the current City Heights, San Diego location. Data will be “ground-truthed”
through on-site visits. Decisions will be made based on: Data-driven recommendations (provided in
this report)
• Instinct and on-the-ground experience from site visits
• Interplay between location, potential partners, and replication strategy
Below describes the methods of this coarse level site assessment.
D-6
GIS Mapping and Online Research
Variables were identified and mapped per each of the identified geographic focus areas, and compared
to the home site, City Heights in San Diego, which were also similarly mapped. The seven identified
geographic focus areas for the project are: Ward 7 - Washington, DC, Ward 8 – Washington, DC,
Southeast Baltimore, Southwest Baltimore, Newport News, VA, Norfolk, VA, and Hampton Roads, VA.
These target geographies were chosen as a result of an initial October 2013 field visit; advising from
NOAA personnel; and input from local experts with knowledge of the region’s challenges, assets,
socioeconomic situation, and demographics. Based on this, four geographic areas were mapped, from
which eight maps for analysis were developed. The four
mapping areas were: City Heights, San Diego, Washington, DC, Baltimore, and the Hampton/Newport
News/Norfolk region of Virginia.
The coarse level analysis focused largely identifying locations with similar characteristics to the
benchmark location, City Heights, San Diego. The variables for the coarse level analysis fall into one of
the following major categories: demographics, distance to ecosystems, capacity and resources and
academic achievement. The demographics and academic achievement variables were linked to model
criteria one, “singular vision that limits scope of work including 100% focus on young people
underrepresented in the sciences and a single community focus”. The variable focused on distance to
ecosystems was linked to model criteria two, “proximity to the ocean and the use of the ocean as a
platform to teach STEM”. And the capacity and resources variable was linked to model criteria three,
“situated within a STEM and knowledge-based economy to provide mentors, internship and career
opportunities and funding”.
The variables that were mapped using ArcGIS software were population density, median income,
percent of the population below age 18, ethnic diversity, high school location, and high school
graduation rate, high school math achievement, high school reading achievement and high school
science achievement.1
The US Census 2010 Tiger/Line shape files were used for the county (San Diego, Washington, DC,
Baltimore County) and city (Baltimore City, Hampton, Newport News and Norfolk) tracts, road and
water data layers. The 2010 American Community Survey (ACS) was used for all of the demographic
data layers for all of the counties (San Diego, Washington, DC, Baltimore County) and cities (Baltimore
City, Hampton, Newport News and Norfolk). In particular datasets S1701, S1903 and DP05 were used to
obtain the following information at the tract level per city or county: total population, percent of the
population below the age of 18, median income, and percent Black, percent Hispanic or Latino, percent
Asian and percent White. From these datasets, original data layers were created, such as population
density (total population was divided by square miles of land, after being converted from square meters
to miles) and percent of population below age 18 (total population below age 18 was divided by the
total population).
A high school layer was created by geocoding each high school per target geographic region. In addition,
each high school data point contains within its attribute table data on academic achievement
D-7
(2011/2012 graduation rate, math achievement, reading achievement and science achievement2) and
student demographics (number of students, % students of color, % receiving free or reduced federal
lunch, and % Black, Latino, Asian or White). The high school information was obtained from each of the
California, Baltimore, Virginia and Washington, DC’s Department of Education websites (referred to as
the Office of the State Superintendent of Education in the case of Washington, DC).
In order to depict as many layers as possible in a meaningful way and limit the number of maps
produced (8), two maps with multiple layers were produced per region. The first map produced per
each of the four mapped areas depicts race and ethnicity with four corresponding layers (% Black,
Hispanic/Latino, Asian and White). The darker the tract indicates an aggregately higher percent of %
Black, Hispanic/Latino and Asian in that particular location. The second map produced per each of the
four mapped areas depicts socioeconomic status, population density and age demographics with three
corresponding layers (median income, people per square mile and percent of the age structure 18 and
below). The darker the tract indicates aggregately a lower income, higher population density and higher
percent below the age of 18.
In order to gain an approximation of STEM resources and capacities across each region, online search
was conducted on yellowpages.com using the search terms “Science”, “Engineering” and “Environment”
per region (San Diego, Washington, DC, Baltimore, Hampton, Newport News and Norfolk) and
aggregating the three neighboring Virginia cities. It should be noted there is likely redundancy of
organizations across these search terms (i.e. a company that comes up under both a “science” and
“engineering” search); however, nonetheless this gives an approximation of the presence of these
entities per region.
Analysis by Geographic Region
In order to compare coarsely across geographic regions, the maps were analyzed in terms of the
variables mapped by category (race and ethnicity and population demographics and income). The
census tracts of each geocoded high school was assessed and compared to the benchmark site of City
Heights and the location metric criteria. To facilitate a more granular analysis of the variables, a matrix
was created to examine the breakdown of race and ethnicity, income, population demographics and
school academic achievement and demographics per high school, and also compare for similarity
against the control site and location metric criteria.
Across Geographic Region
As referred to above, a matrix was produced to provide a tool to compare the results across
communities. On one axis of this matrix was a list of the high schools examined in the coarse level
analysis, and on the other axis was a list of the variables. These variables were: tract level variables
(population density, % population below 18, median income, % Black, % Latino, % Asian, % White); high
school specific variables (% HS students of color, % HS receiving free reduced federal lunch, % HS Black,
% HS Latino, % HS Asian, % HS White, HS graduation rate, HS math score, and % HS reading score),
estimated STEM capacity/resources, and driving distance to ecosystems (Chesapeake/ocean).
D-8
In order to assess the level of similarity/dissimilarity of each high school to the control site of Hoover
High School in City Heights, San Diego, the data were visualized using multidimensional scaling (MDS). In
the MDS plot, a point in multidimensional space represents each school, and the schools are arranged
within the space so that the distance between schools (points on the plot) represents the relative level
of similarity. In other words, points that are closer together represent schools that are similar, and
points that are farther apart represent schools that are dissimilar. In cases where values were a range
(e.g., median income), the midpoint within the range was selected for comparison for use in the MDS
plot.
Developing recommendations
Considering the coarse level data analysis both by and across geographic areas, initial recommendations
were developed regarding which high schools (and their surrounding communities) to focus on for
consideration and special focus during the site visits. In addition, specific questions and variables to
ground-truth were identified to facilitate a bridge between the coarse and medium level analysis.
Results
By Geographic Area
GIS Mapping
San Diego, CA: City Heights (Benchmark site)
The first maps are of the benchmark site, the City Heights neighborhood of San Diego, CA (Map 1 and 2).
There is one high school in City Heights, Hoover High School. Since this map is at the community scale of
City Heights, this represents the school-shed for the high school, or the area upon which the high school
draws the majority of its students. Table 1 provides information about the academic achievement of
this high school. Map 1 illustrates that the location of this high school is within an area with a high
minority and traditionally underserved population. Map 2 depicts that the high school is in the census
tract with high population density, low median income and high percent population under the age of
18.
In terms of STEM capacity and resources in the larger San Diego region, there are 1583 estimated
science, engineering or environmental related entities (Table 2). In addition, the high school is very close
to both the watershed connection (1.8 miles) as well as driving distance to the ocean (11 miles) (Table
3).
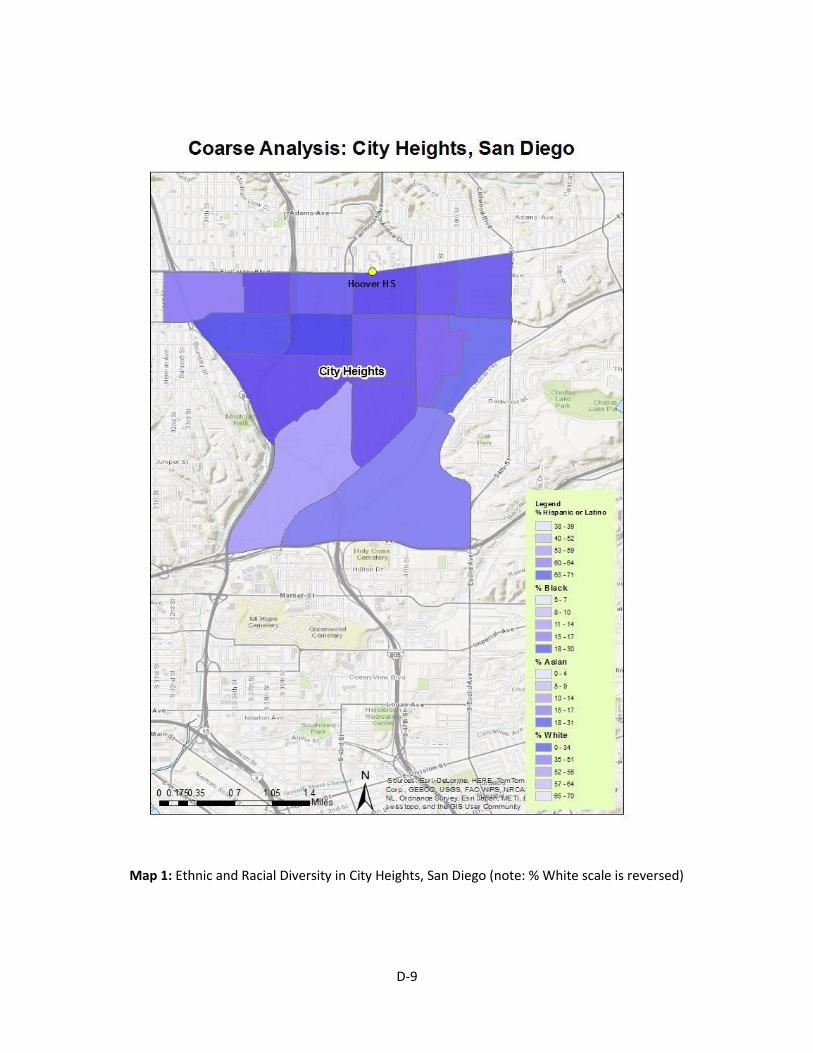
D-9
Map 1: Ethnic and Racial Diversity in City Heights, San Diego (note: % White scale is reversed)
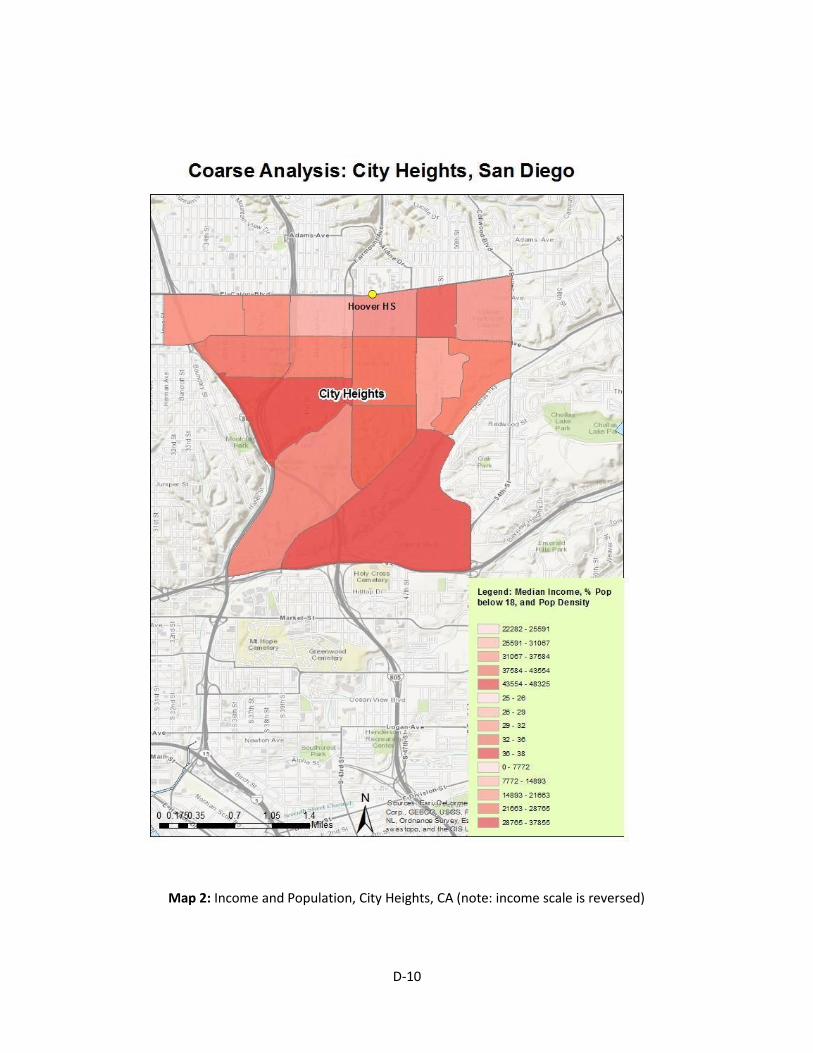
D-10
Map 2: Income and Population, City Heights, CA (note: income scale is reversed)
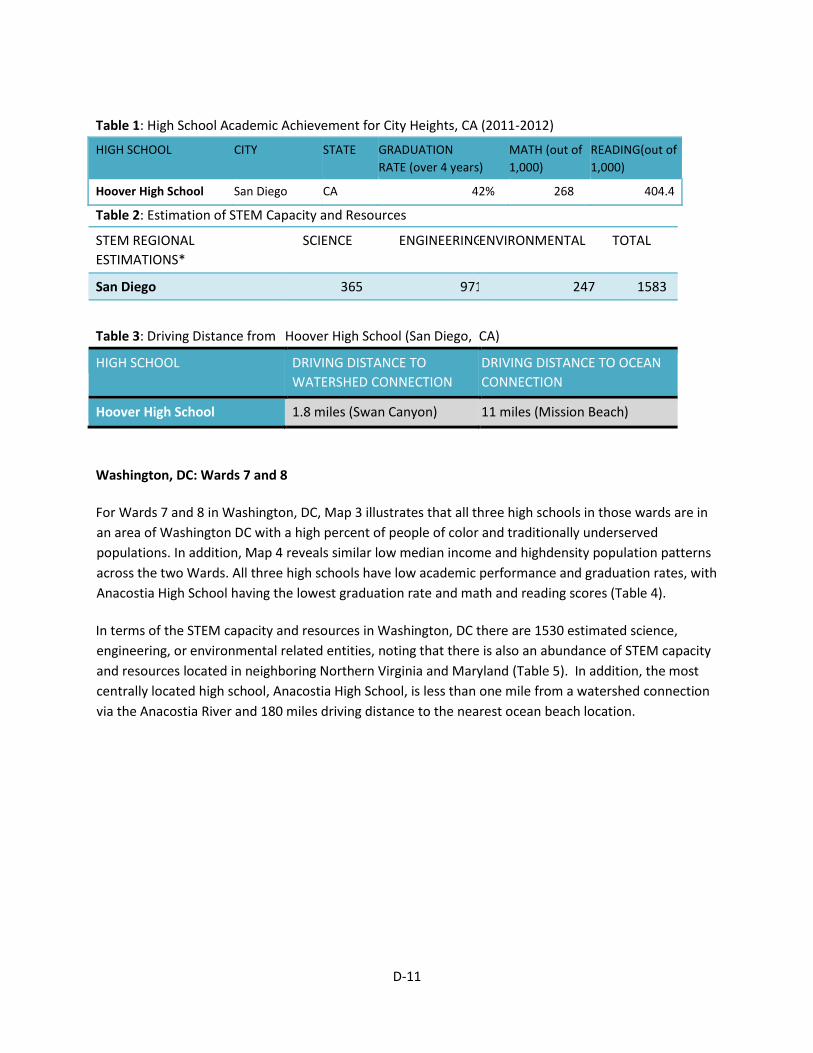
D-11
Table 1: High School Academic Achievement for City Heights, CA (2011-2012)
HIGH SCHOOL CITY STATE GRADUATION RATE (over 4 years)
MATH (out of
1,000) READING(out of
1,000)
Hoover High School San Diego CA 42% 268 404.4
Table 2: Estimation of STEM Capacity and Resources
STEM REGIONAL
ESTIMATIONS*
SCIENCE ENGINEERING ENVIRONMENTAL TOTAL
San Diego 365 971 247 1583
Table 3: Driving Distance from Hoover High School (San Diego, CA)
HIGH SCHOOL DRIVING DISTANCE TO
WATERSHED CONNECTION
DRIVING DISTANCE TO OCEAN
CONNECTION
Hoover High School 1.8 miles (Swan Canyon) 11 miles (Mission Beach)
Washington, DC: Wards 7 and 8
For Wards 7 and 8 in Washington, DC, Map 3 illustrates that all three high schools in those wards are in
an area of Washington DC with a high percent of people of color and traditionally underserved
populations. In addition, Map 4 reveals similar low median income and highdensity population patterns
across the two Wards. All three high schools have low academic performance and graduation rates, with
Anacostia High School having the lowest graduation rate and math and reading scores (Table 4).
In terms of the STEM capacity and resources in Washington, DC there are 1530 estimated science,
engineering, or environmental related entities, noting that there is also an abundance of STEM capacity
and resources located in neighboring Northern Virginia and Maryland (Table 5). In addition, the most
centrally located high school, Anacostia High School, is less than one mile from a watershed connection
via the Anacostia River and 180 miles driving distance to the nearest ocean beach location.
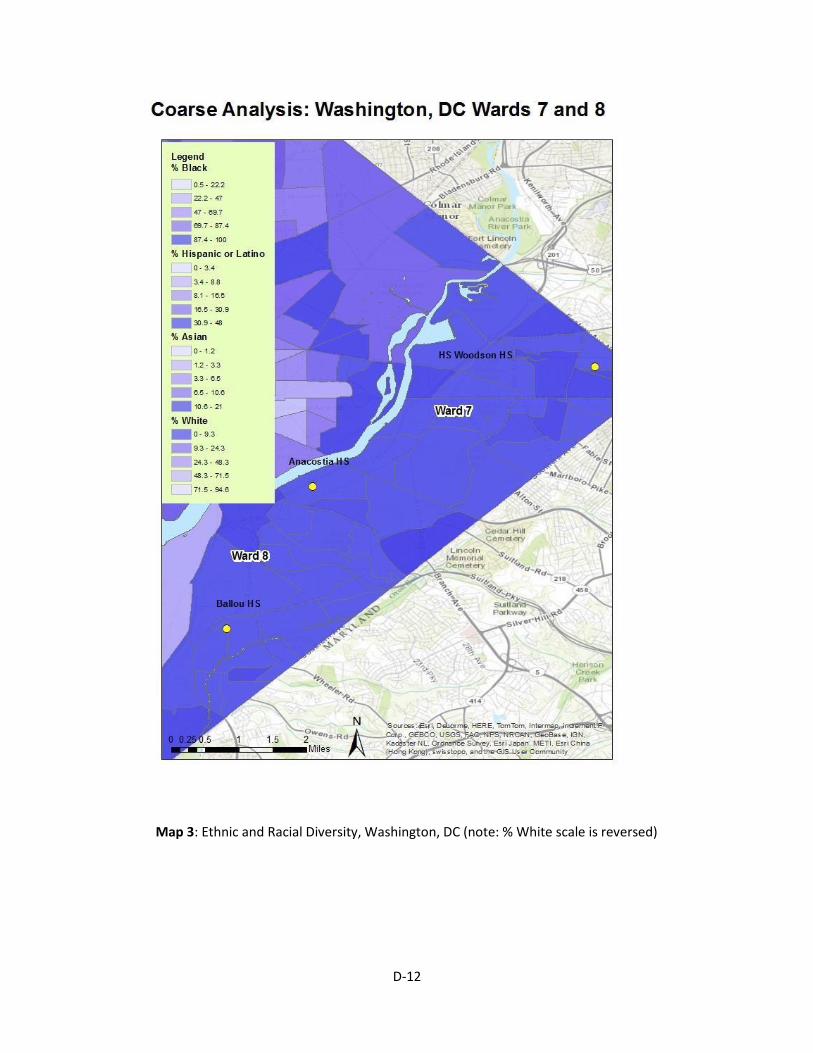
D-12
Map 3: Ethnic and Racial Diversity, Washington, DC (note: % White scale is reversed)
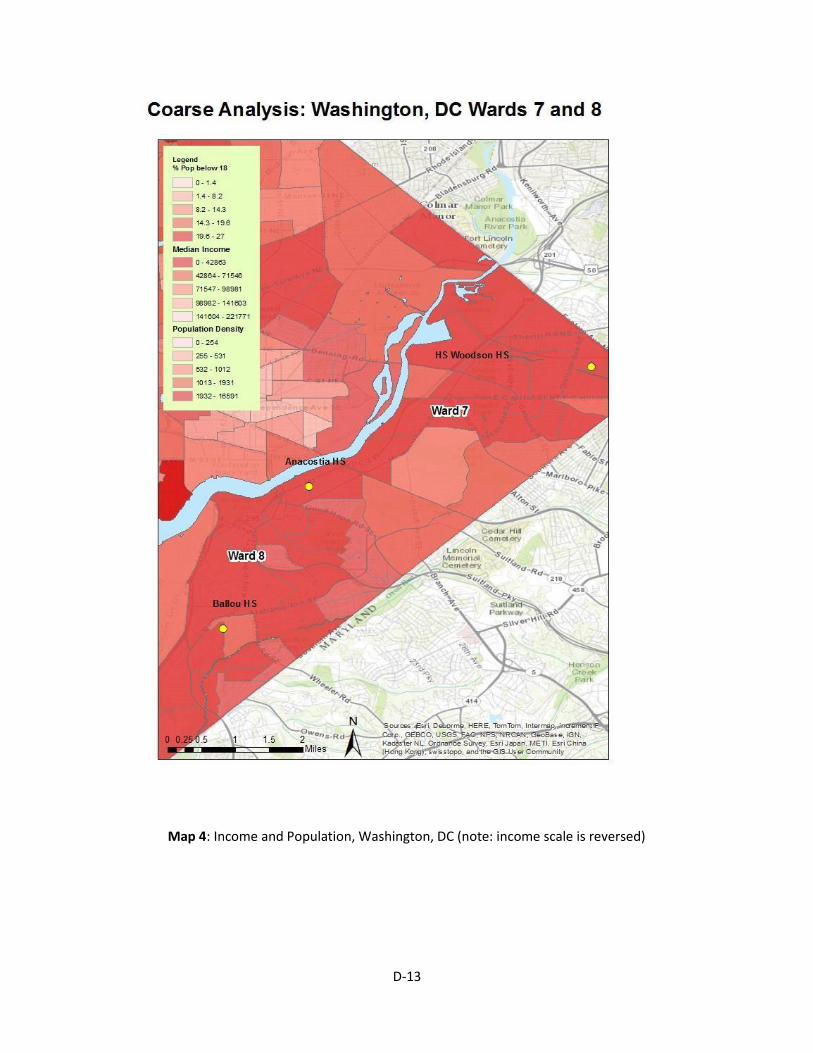
D-13
Map 4: Income and Population, Washington, DC (note: income scale is reversed)
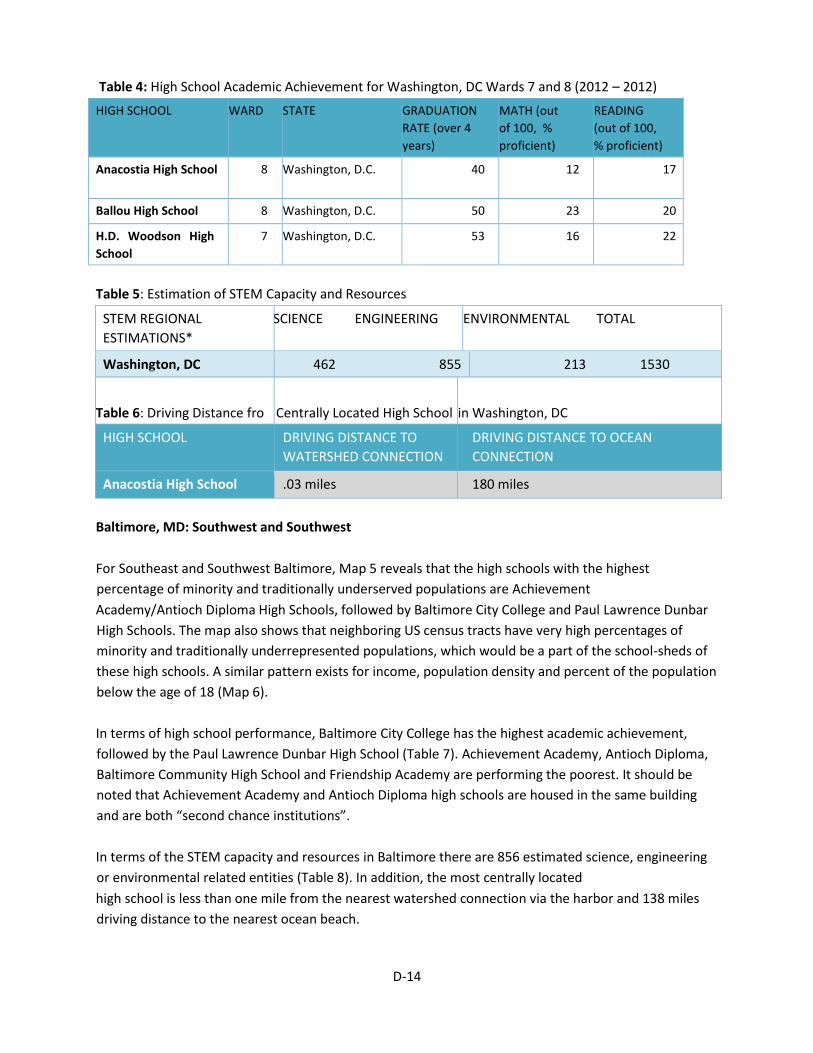
D-14
Table 4: High School Academic Achievement for Washington, DC Wards 7 and 8 (2012 – 2012)
HIGH SCHOOL WARD STATE GRADUATION RATE (over 4
years)
MATH (out of 100, %
proficient)
READING (out of 100, % proficient)
Anacostia High School 8 Washington, D.C. 40 12 17
Ballou High School 8 Washington, D.C. 50 23 20
H.D. Woodson High
School 7 Washington, D.C. 53 16 22
Table 5: Estimation of STEM Capacity and Resources
STEM REGIONAL
ESTIMATIONS*
SCIENCE ENGINEERING ENVIRONMENTAL TOTAL
Washington, DC 462 855 213 1530
Table 6: Driving Distance fro Centrally Located High School in Washington, DC
HIGH SCHOOL DRIVING DISTANCE TO
WATERSHED CONNECTION
DRIVING DISTANCE TO OCEAN
CONNECTION
Anacostia High School .03 miles 180 miles
Baltimore, MD: Southwest and Southwest
For Southeast and Southwest Baltimore, Map 5 reveals that the high schools with the highest
percentage of minority and traditionally underserved populations are Achievement
Academy/Antioch Diploma High Schools, followed by Baltimore City College and Paul Lawrence Dunbar
High Schools. The map also shows that neighboring US census tracts have very high percentages of
minority and traditionally underrepresented populations, which would be a part of the school-sheds of
these high schools. A similar pattern exists for income, population density and percent of the population
below the age of 18 (Map 6).
In terms of high school performance, Baltimore City College has the highest academic achievement,
followed by the Paul Lawrence Dunbar High School (Table 7). Achievement Academy, Antioch Diploma,
Baltimore Community High School and Friendship Academy are performing the poorest. It should be
noted that Achievement Academy and Antioch Diploma high schools are housed in the same building
and are both “second chance institutions”.
In terms of the STEM capacity and resources in Baltimore there are 856 estimated science, engineering
or environmental related entities (Table 8). In addition, the most centrally located
high school is less than one mile from the nearest watershed connection via the harbor and 138 miles
driving distance to the nearest ocean beach.
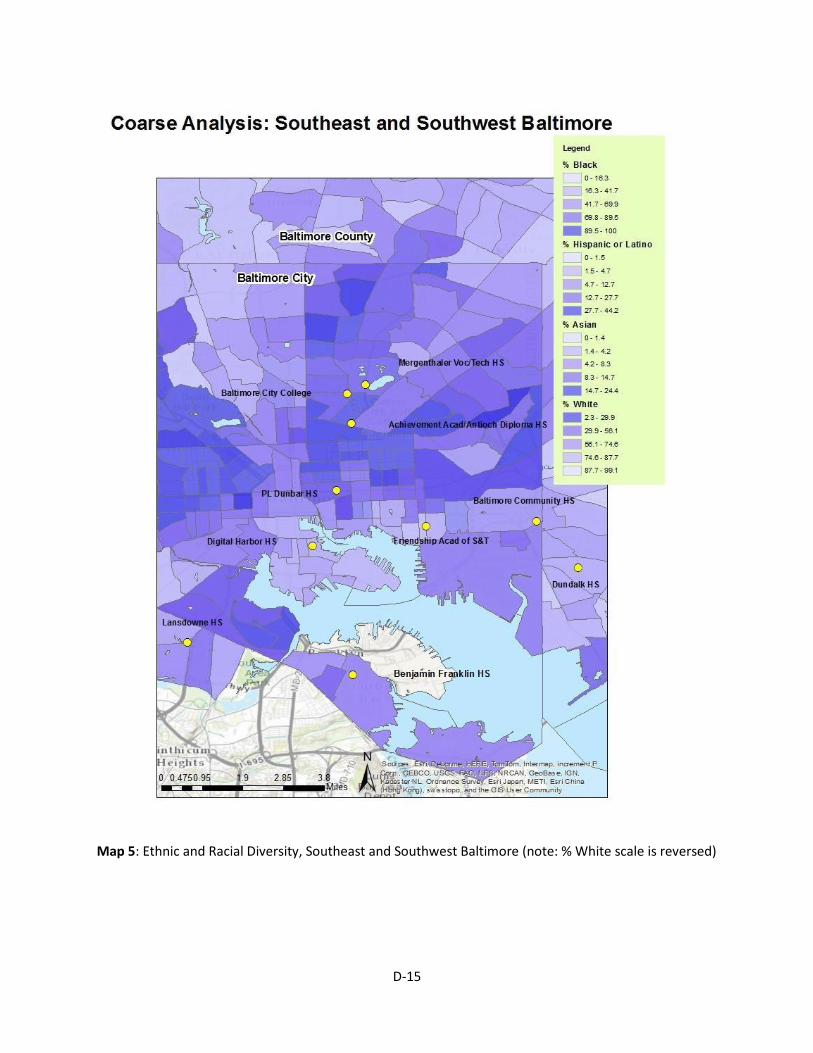
D-15
Map 5: Ethnic and Racial Diversity, Southeast and Southwest Baltimore (note: % White scale is reversed)
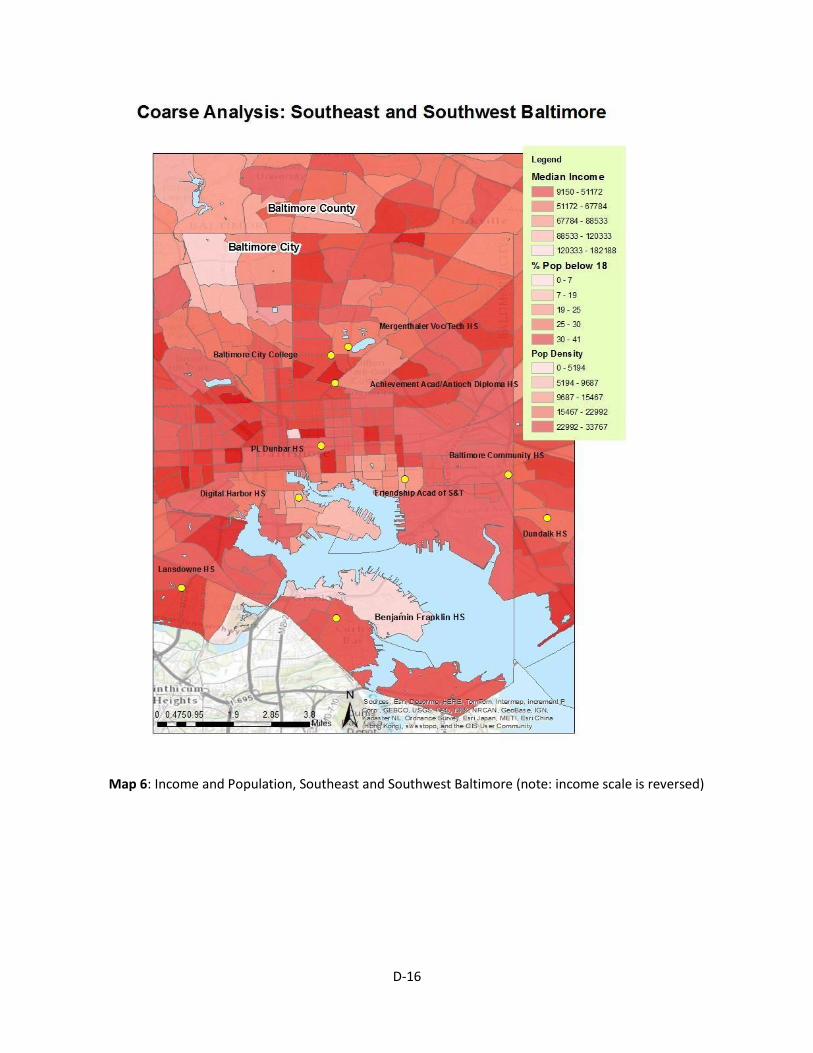
D-16
Map 6: Income and Population, Southeast and Southwest Baltimore (note: income scale is reversed)
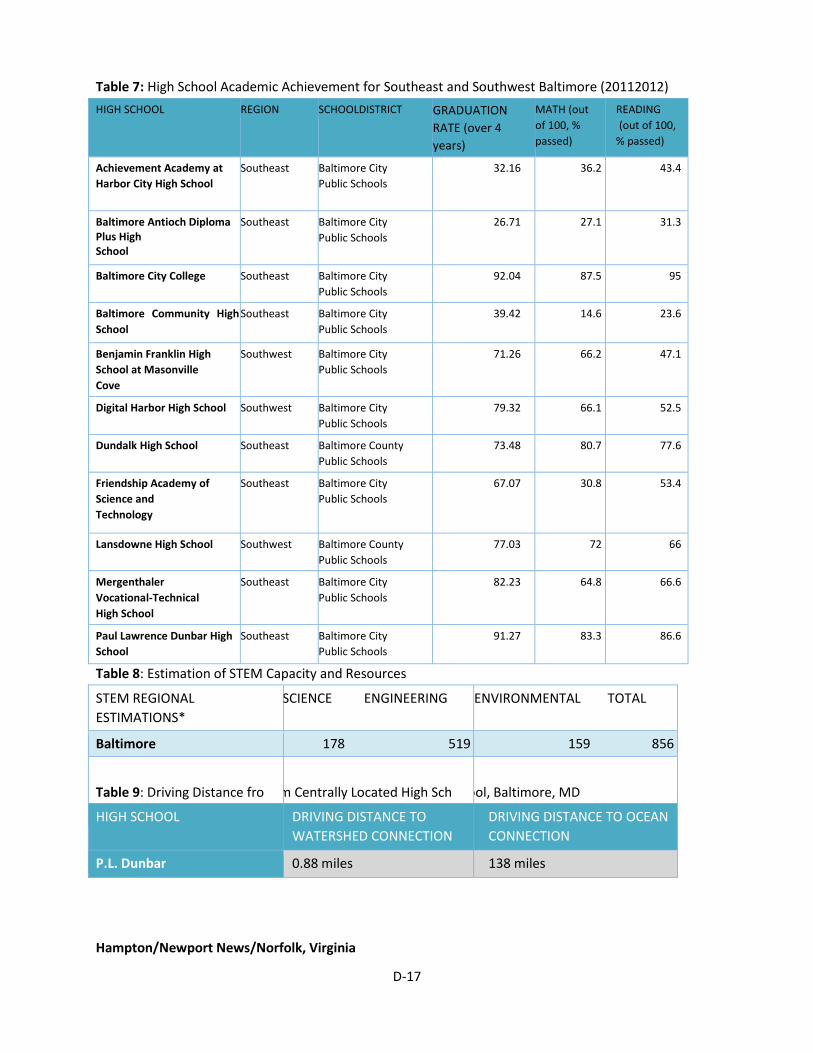
D-17
Table 7: High School Academic Achievement for Southeast and Southwest Baltimore (20112012)
HIGH SCHOOL REGION SCHOOLDISTRICT GRADUATION RATE (over 4
years)
MATH (out
of 100, %
passed)
READING (out of 100,
% passed)
Achievement Academy at
Harbor City High School Southeast Baltimore City
Public Schools 32.16 36.2 43.4
Baltimore Antioch Diploma Plus High School
Southeast Baltimore City Public Schools
26.71 27.1 31.3
Baltimore City College Southeast Baltimore City Public Schools
92.04 87.5 95
Baltimore Community High
School Southeast Baltimore City
Public Schools 39.42 14.6 23.6
Benjamin Franklin High School at Masonville Cove
Southwest Baltimore City Public Schools
71.26 66.2 47.1
Digital Harbor High School Southwest Baltimore City Public Schools
79.32 66.1 52.5
Dundalk High School Southeast Baltimore County
Public Schools 73.48 80.7 77.6
Friendship Academy of Science and Technology
Southeast Baltimore City Public Schools
67.07 30.8 53.4
Lansdowne High School Southwest Baltimore County
Public Schools 77.03 72 66
Mergenthaler Vocational-Technical High School
Southeast Baltimore City Public Schools
82.23 64.8 66.6
Paul Lawrence Dunbar High
School Southeast Baltimore City
Public Schools 91.27 83.3 86.6
Table 8: Estimation of STEM Capacity and Resources
STEM REGIONAL
ESTIMATIONS*
SCIENCE ENGINEERING ENVIRONMENTAL TOTAL
Baltimore 178 519 159 856
Table 9: Driving Distance fro m Centrally Located High Sch ool, Baltimore, MD
HIGH SCHOOL DRIVING DISTANCE TO
WATERSHED CONNECTION
DRIVING DISTANCE TO OCEAN
CONNECTION
P.L. Dunbar 0.88 miles 138 miles
Hampton/Newport News/Norfolk, Virginia
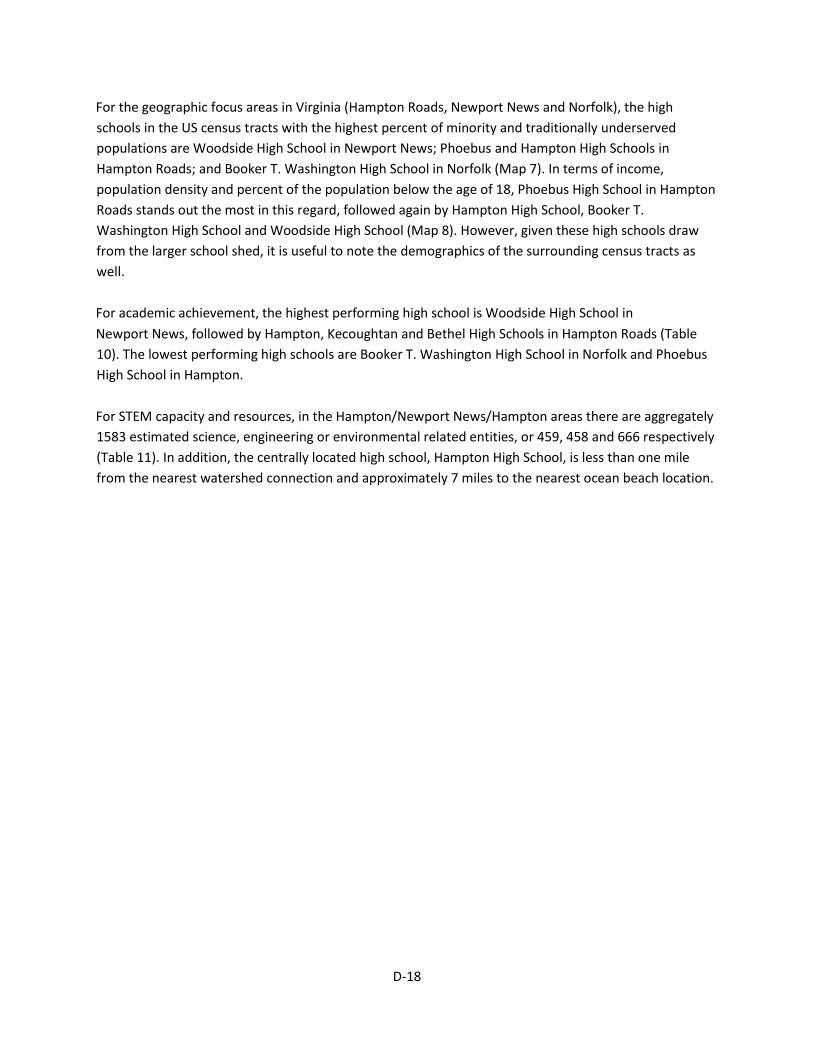
D-18
For the geographic focus areas in Virginia (Hampton Roads, Newport News and Norfolk), the high
schools in the US census tracts with the highest percent of minority and traditionally underserved
populations are Woodside High School in Newport News; Phoebus and Hampton High Schools in
Hampton Roads; and Booker T. Washington High School in Norfolk (Map 7). In terms of income,
population density and percent of the population below the age of 18, Phoebus High School in Hampton
Roads stands out the most in this regard, followed again by Hampton High School, Booker T.
Washington High School and Woodside High School (Map 8). However, given these high schools draw
from the larger school shed, it is useful to note the demographics of the surrounding census tracts as
well.
For academic achievement, the highest performing high school is Woodside High School in
Newport News, followed by Hampton, Kecoughtan and Bethel High Schools in Hampton Roads (Table
10). The lowest performing high schools are Booker T. Washington High School in Norfolk and Phoebus
High School in Hampton.
For STEM capacity and resources, in the Hampton/Newport News/Hampton areas there are aggregately
1583 estimated science, engineering or environmental related entities, or 459, 458 and 666 respectively
(Table 11). In addition, the centrally located high school, Hampton High School, is less than one mile
from the nearest watershed connection and approximately 7 miles to the nearest ocean beach location.
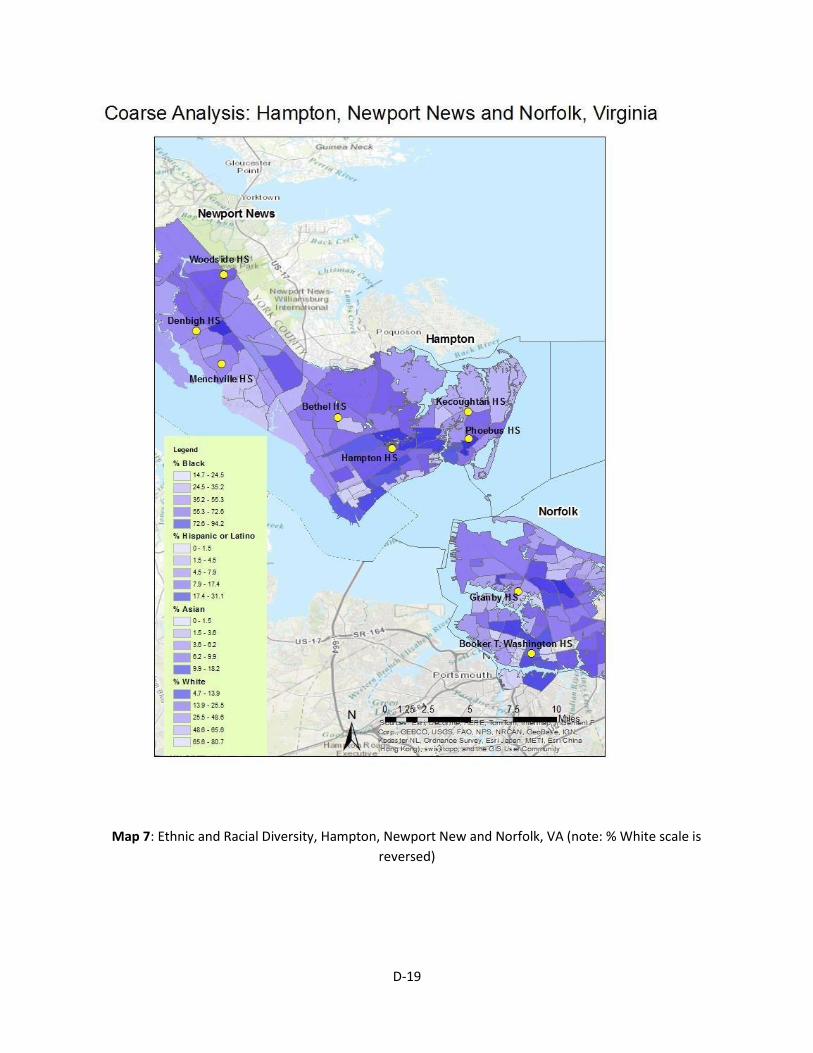
D-19
Map 7: Ethnic and Racial Diversity, Hampton, Newport New and Norfolk, VA (note: % White scale is
reversed)
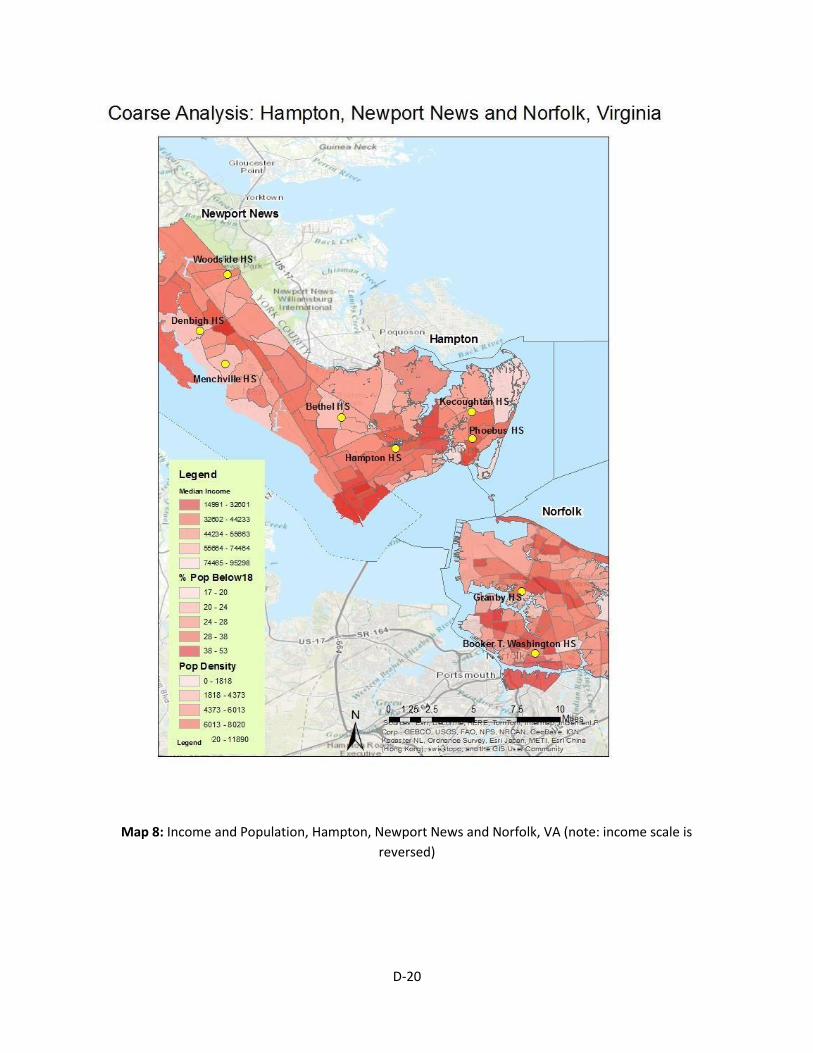
D-20
Map 8: Income and Population, Hampton, Newport News and Norfolk, VA (note: income scale is
reversed)
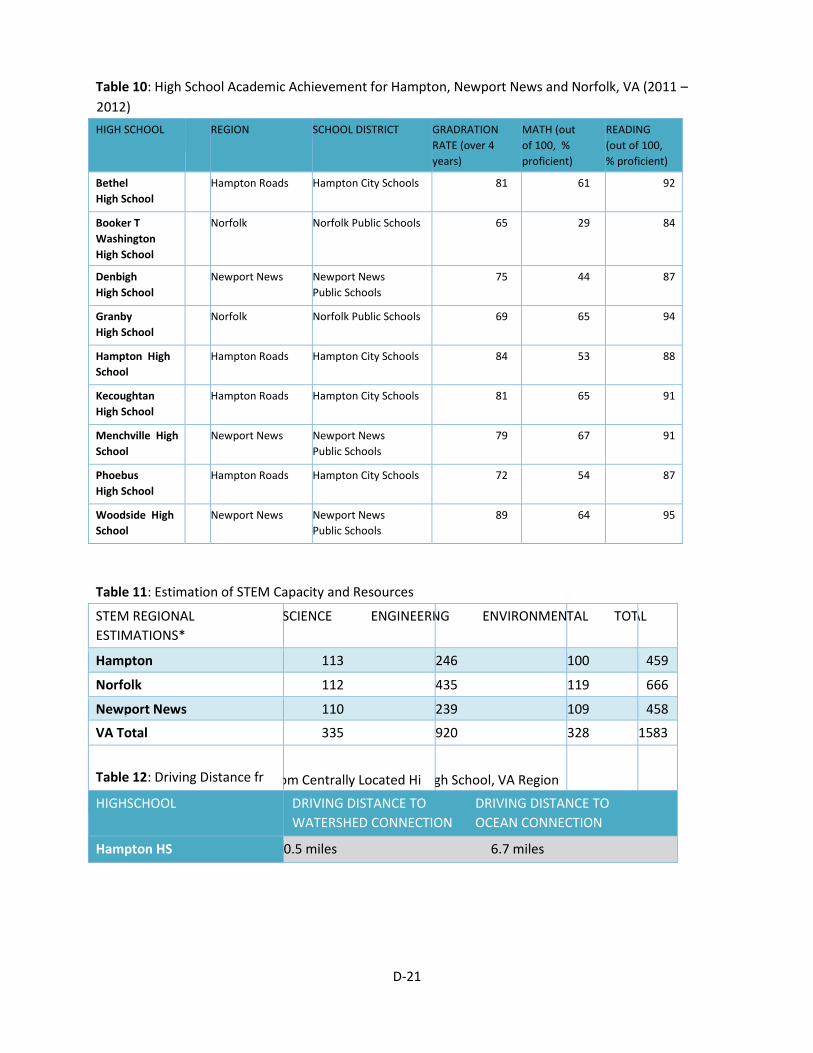
D-21
Table 10: High School Academic Achievement for Hampton, Newport News and Norfolk, VA (2011 –
2012)
HIGH SCHOOL REGION SCHOOL DISTRICT GRADRATION RATE (over 4
years)
MATH (out of 100, %
proficient)
READING (out of 100, % proficient)
Bethel High School
Hampton Roads Hampton City Schools 81 61 92
Booker T Washington High School
Norfolk Norfolk Public Schools 65 29 84
Denbigh High School
Newport News Newport News Public Schools
75 44 87
Granby High School
Norfolk Norfolk Public Schools 69 65 94
Hampton High
School Hampton Roads Hampton City Schools 84 53 88
Kecoughtan
High School Hampton Roads Hampton City Schools 81 65 91
Menchville High
School Newport News Newport News
Public Schools 79 67 91
Phoebus High School
Hampton Roads Hampton City Schools 72 54 87
Woodside High
School Newport News Newport News
Public Schools 89 64 95
Table 11: Estimation of STEM Capacity and Resources
STEM REGIONAL
ESTIMATIONS*
SCIENCE ENGINEERI NG ENVIRONMEN TAL TOT AL
Hampton 113 246 100 459
Norfolk 112 435 119 666
Newport News 110 239 109 458
VA Total 335 920 328 1583
Table 12: Driving Distance fr om Centrally Located Hi gh School, VA Region
HIGHSCHOOL DRIVING DISTANCE TO DRIVING DISTANCE TO
WATERSHED CONNECTION OCEAN CONNECTION
Hampton HS 0.5 miles 6.7 miles
D-22
Across Geographic Areas
Matrix
The matrix (Table 13) shows in more detail the breakdown of the variables per each US census tract that
a high school is located in (community data) and variables of the student population per high school
(high School data). It is important to note that in cases where values were a range (e.g., median
income), the median within the range was selected for comparison use in the matrix.
In terms of diversity, US census tract data demonstrate that Ocean Discovery’s City Heights community
is the most diverse, with more distributive representation of all measured ethnic/racial groups (17%
White, 25% Asian, 56% Latino and 16% Black). In contrast, in Washington, DC the populations are mostly
Black (94%). In Baltimore, some areas are largely White and some are largely Black, with small amounts
of Latino and Asian populations. For example, Baltimore City College, Mergenthaler, and Paul Lawrence
Dunbar high schools are in areas with a population that is largely Black (80%), while Digital Harbor and
Friendship Academy are in areas with a population that is largely White (93%). The Virginia cities exhibit
a similar pattern as Baltimore. Phoebus and Booker T. Washington high schools are in areas that are
largely Black, while Denbigh high school is in an area largely White.
In addition to looking at demographics per US census tract, an initial examination of demographics of
the student population attending each high school indicate that the benchmark site, Hoover High School
is 96% students of color, of which it is 71% Latino. In the Washington, DC high schools, all three were 99-
100% students of color, with 98-100% Black. In Baltimore, the schools ranged from 38-100% students of
color (the former Dundalk and the latter Achievement Academy), with Blacks being the highest
representation. Some US census tracts that are largely White have high school student populations that
are largely students of color. For example, Digital Harbor and Friendship Academy are 84% and 92%
students of color respectively, but there US census tracts are majority White. In Virginia, the range was
between 47-91% students of color (the former being Kecoughtan and the latter being Booker T.
Washington), with Blacks being the highest representation. The matrix table can be referred to for
more specific details per high school.
In terms of the community’s population density, percent under the age of 18, and median income, City
Heights is in an area of very high density and percent of the population below the age of 18 relative to
the East coast regions. The median income is comparable to some of the East coast geographic regions,
in particular Washington, DC and some parts of Baltimore. In Washington, DC there is consistently low
income across the high schools ($21,431 median annual income), low percent population below the age
of 18 (1%), and a similarly higher population density (9,262 people per square mile).
In terms of the socioeconomic status of students in the high school, the percent of students receiving
free or reduced lunch were significant across all geographic locations, with 87% of Hoover High School
D-23
students receiving free or reduced lunch. In Washington DC, 99% of all students received free or
reduced lunch. In Baltimore the number was also very high, ranging from 58-85%, the former being
Lansdowne and the latter being Benjamin Franklin. In Virginia, the number of students receiving free or
reduced lunch ranged from 35-70%, the former being Menchville and the latter being Booker T.
Washington.
In Baltimore and the Virginia communities there is more variation across the high school locations. In
Baltimore, the high schools in the areas with the lowest income in the US census tracts were
Achievement Academy/Antioch Diploma, Baltimore City College, Baltimore Community College,
Benjamin Franklin, Lansdowne and Paul Lawrence Dunbar. The areas with the highest population
density were Digital Harbor and Baltimore City College (19,230 and 12,577 people per square mile,
respectively). The areas with the highest percent population below the age of 18 were Achievement
Academy/Antioch Diploma and Mergenthaler high schools (28%). In the Virginia communities, the high
school in the area with the lowest income was Booker T. Washington in Norfolk ($23,796 median annual
income). The high schools in the areas with the highest population density were Kecoughtan and Booker
T. Washington (7,017 people per square mile), and the high schools in the areas with the highest
percent population below the age of 18 were Phoebus and Booker T. Washington (33%).
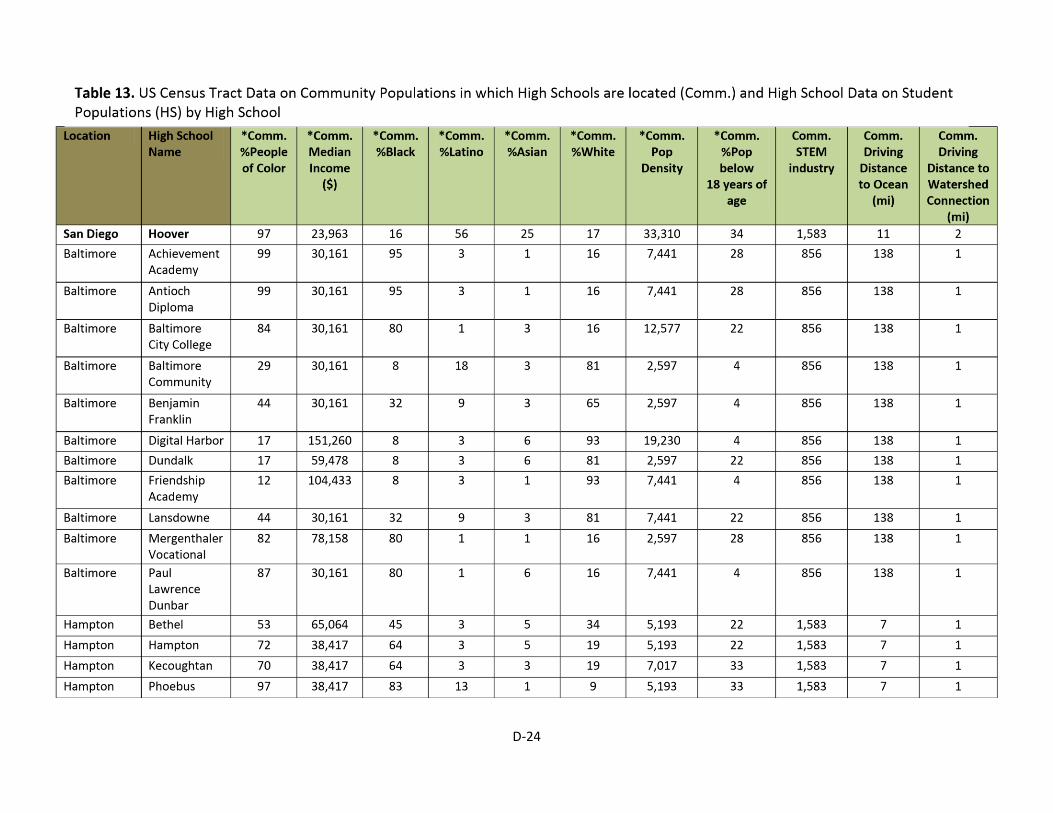
D-24
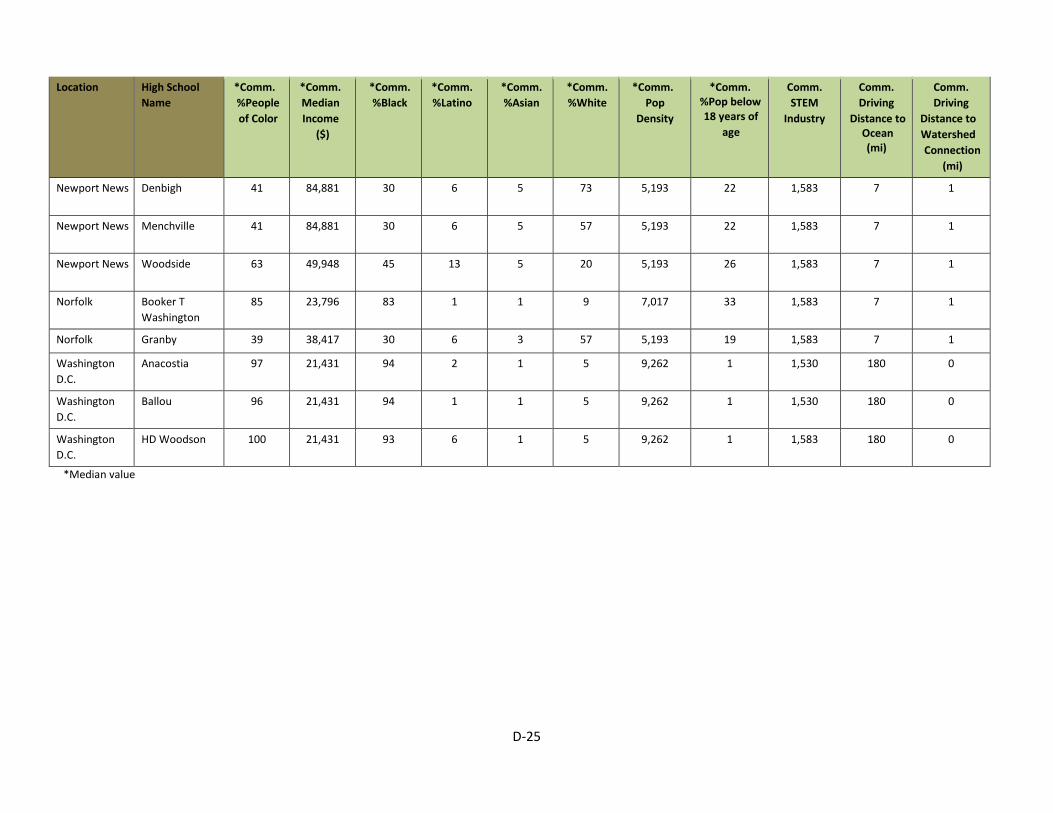
D-25
Location High School Name
*Comm. %People
of Color
*Comm. Median Income
($)
*Comm.
%Black *Comm. %Latino
*Comm.
%Asian *Comm.
%White *Comm.
Pop Density
*Comm. %Pop below 18 years of
age
Comm. STEM
Industry
Comm. Driving
Distance to Ocean (mi)
Comm. Driving
Distance to Watershed Connection
(mi)
Newport News Denbigh 41 84,881 30 6 5 73 5,193 22 1,583 7 1
Newport News Menchville 41 84,881 30 6 5 57 5,193 22 1,583 7 1
Newport News Woodside 63 49,948 45 13 5 20 5,193 26 1,583 7 1
Norfolk Booker T Washington
85 23,796 83 1 1 9 7,017 33 1,583 7 1
Norfolk Granby 39 38,417 30 6 3 57 5,193 19 1,583 7 1
Washington
D.C. Anacostia 97 21,431 94 2 1 5 9,262 1 1,530 180 0
Washington
D.C. Ballou 96 21,431 94 1 1 5 9,262 1 1,530 180 0
Washington
D.C. HD Woodson 100 21,431 93 6 1 5 9,262 1 1,583 180 0
*Median value
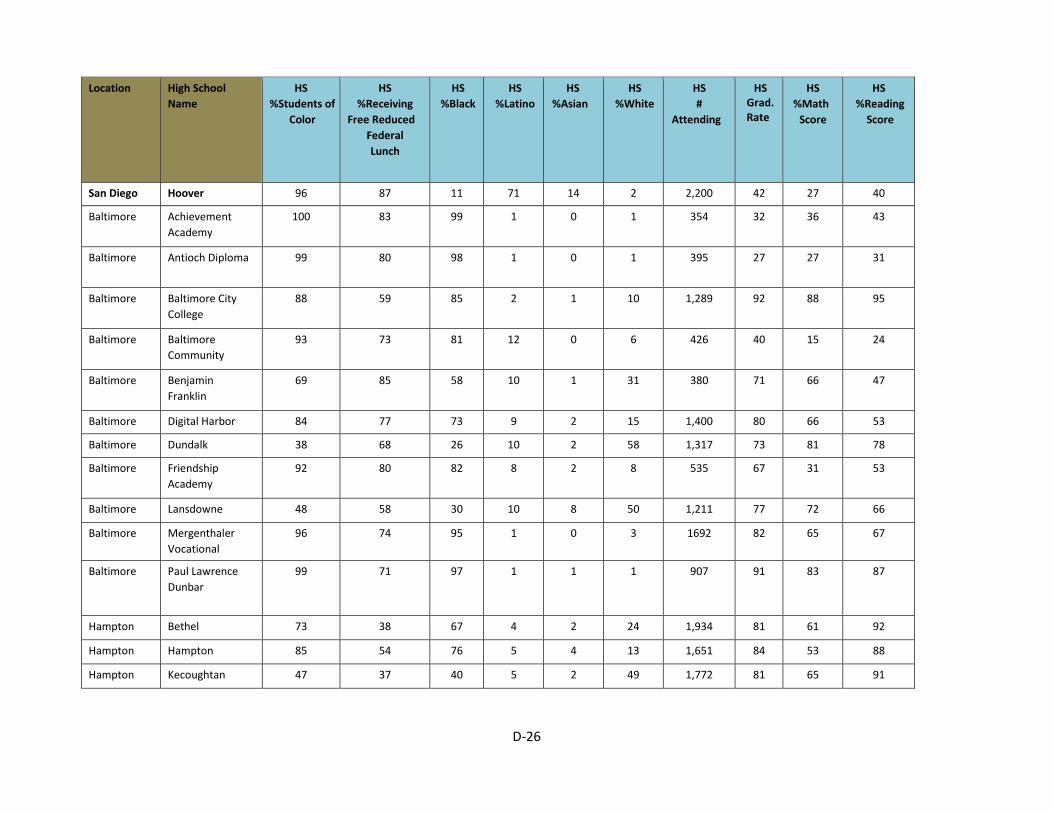
D-26
Location High School Name
HS %Students of
Color
HS %Receiving
Free Reduced Federal Lunch
HS
%Black HS
%Latino HS
%Asian HS
%White HS #
Attending
HS Grad. Rate
HS %Math
Score
HS %Reading
Score
San Diego Hoover 96 87 11 71 14 2 2,200 42 27 40
Baltimore Achievement
Academy 100 83 99 1 0 1 354 32 36 43
Baltimore Antioch Diploma 99 80 98 1 0 1 395 27 27 31
Baltimore Baltimore City
College 88 59 85 2 1 10 1,289 92 88 95
Baltimore Baltimore
Community 93 73 81 12 0 6 426 40 15 24
Baltimore Benjamin Franklin
69 85 58 10 1 31 380 71 66 47
Baltimore Digital Harbor 84 77 73 9 2 15 1,400 80 66 53
Baltimore Dundalk 38 68 26 10 2 58 1,317 73 81 78
Baltimore Friendship Academy
92 80 82 8 2 8 535 67 31 53
Baltimore Lansdowne 48 58 30 10 8 50 1,211 77 72 66
Baltimore Mergenthaler
Vocational 96 74 95 1 0 3 1692 82 65 67
Baltimore Paul Lawrence
Dunbar 99 71 97 1 1 1 907 91 83 87
Hampton Bethel 73 38 67 4 2 24 1,934 81 61 92
Hampton Hampton 85 54 76 5 4 13 1,651 84 53 88
Hampton Kecoughtan 47 37 40 5 2 49 1,772 81 65 91
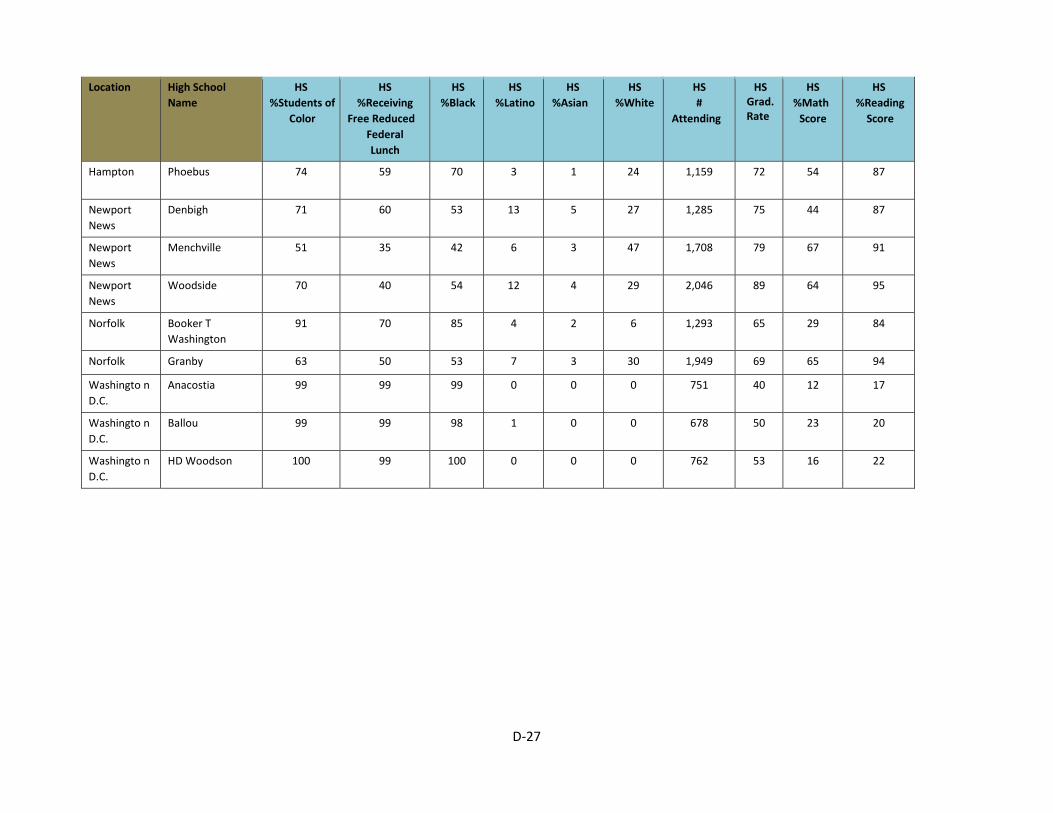
D-27
Location High School Name
HS %Students of
Color
HS %Receiving
Free Reduced Federal Lunch
HS
%Black HS
%Latino HS
%Asian HS
%White HS #
Attending
HS Grad. Rate
HS %Math
Score
HS %Reading
Score
Hampton Phoebus 74 59 70 3 1 24 1,159 72 54 87
Newport
News Denbigh 71 60 53 13 5 27 1,285 75 44 87
Newport
News Menchville 51 35 42 6 3 47 1,708 79 67 91
Newport
News Woodside 70 40 54 12 4 29 2,046 89 64 95
Norfolk Booker T Washington
91 70 85 4 2 6 1,293 65 29 84
Norfolk Granby 63 50 53 7 3 30 1,949 69 65 94
Washingto n
D.C. Anacostia 99 99 99 0 0 0 751 40 12 17
Washingto n
D.C. Ballou 99 99 98 1 0 0 678 50 23 20
Washingto n
D.C. HD Woodson 100 99 100 0 0 0 762 53 16 22
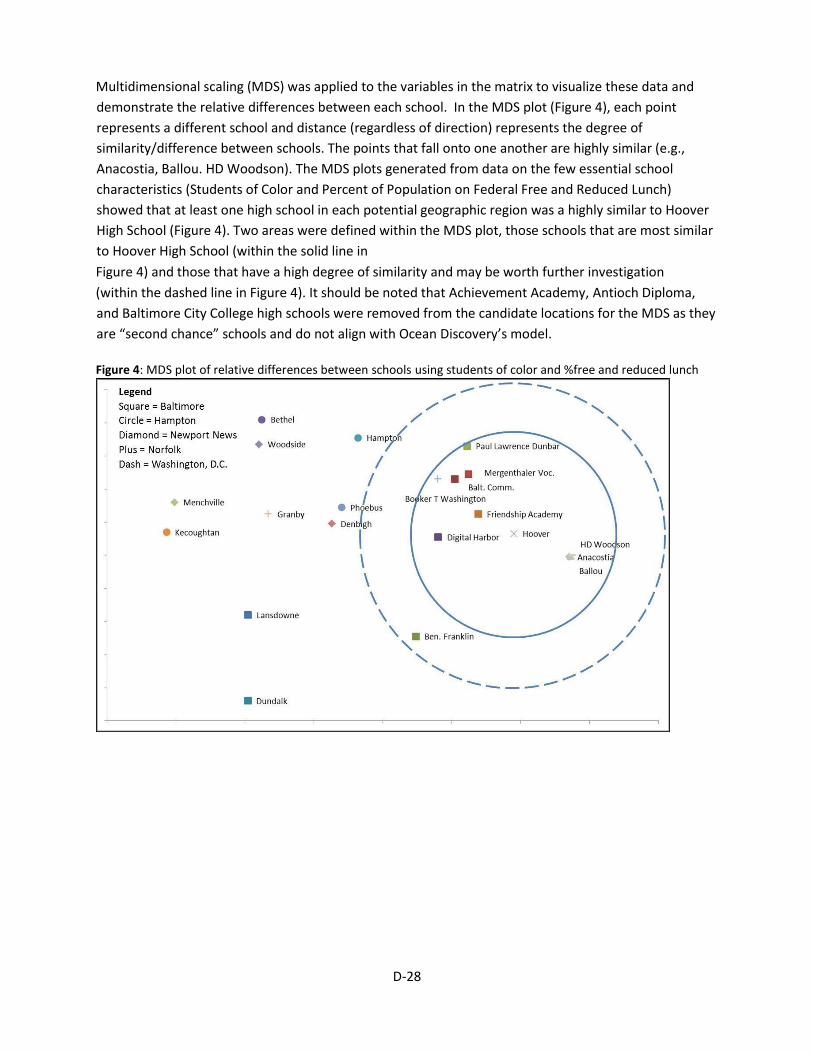
D-28
Multidimensional scaling (MDS) was applied to the variables in the matrix to visualize these data and
demonstrate the relative differences between each school. In the MDS plot (Figure 4), each point
represents a different school and distance (regardless of direction) represents the degree of
similarity/difference between schools. The points that fall onto one another are highly similar (e.g.,
Anacostia, Ballou. HD Woodson). The MDS plots generated from data on the few essential school
characteristics (Students of Color and Percent of Population on Federal Free and Reduced Lunch)
showed that at least one high school in each potential geographic region was a highly similar to Hoover
High School (Figure 4). Two areas were defined within the MDS plot, those schools that are most similar
to Hoover High School (within the solid line in
Figure 4) and those that have a high degree of similarity and may be worth further investigation
(within the dashed line in Figure 4). It should be noted that Achievement Academy, Antioch Diploma,
and Baltimore City College high schools were removed from the candidate locations for the MDS as they
are “second chance” schools and do not align with Ocean Discovery’s model.
Figure 4: MDS plot of relative differences between schools using students of color and %free and reduced lunch
D-29
Discussion
Across Geographic Areas
Based on a review of these results from the coarse level analysis, it is shown that all three of the
potential geographic regions (Washington, DC, Baltimore and the Hampton/Newport News/Norfolk
region of Virginia) are characterized by areas with high concentrations of minority and traditionally
underserved populations, low median income and high population densities.
Results of the MDS plot (Figure 4) reveal schools that are most similar to the benchmark Hoover
High School, where the model is currently being implemented. The three high schools in Washington,
DC are all most similar to Hoover and are strong candidates for further consideration. The overall
pattern of schools shows that the cluster of schools shown in Figure 1 that are within the dashed line
have a student population that is both similar to one another and the model, which suggests that they
may be good candidates both for best supporting the pilot of model and providing insights that would
be relevant for future replication efforts at additional sites. Schools outside of the dashed line were
eliminated from consideration.
Mapping results demonstrate regional patterns where Washington, DC and Baltimore are characterized
by large swaths of area with similar demographics, in contrast to the more patchy demographic
landscape of the Virginia region.
The high schools in Wards 7 and 8 in Washington, DC all have low academic achievement. In contrast,
there is more diversity in performance across the high schools examined in Baltimore and Virginia, some
performing well and some performing poorly. Evaluating just by demographics alone is not sufficient as
some very high performing public schools are located in census tracts with low income and traditionally
underserved populations. This may be an indicator of alternative public education structures, like
magnet or charter schools. In addition, some of this may also be a reflection of the different scales of
the three geographic areas studied for this coarse analysis – DC wards, two large sections of Baltimore,
and three cities in Virginia.
In terms of location to the Chesapeake Bay and ocean ecosystems, the Virginia geographic region is the
closest to both the Chesapeake Bay ecosystem and the Atlantic Ocean. Baltimore is in close proximity to
the Chesapeake Bay ecosystem, by not as close to the Atlantic Ocean. And the Washington, DC region is
the least close to the Chesapeake Bay and ocean ecosystems.
All geographies were rich in STEM capacity and resources, with San Diego in the lead, followed by
Washington, DC, Baltimore and the Virginia cities. However, if the Virginia cities are aggregated, as they
are situated next to each other, then Virginia and San Diego have the same amount of estimated STEM
capacity and resources. The STEM resources and capacity for Washington, DC is likely more than its
estimated number given the high amount of public and private sector knowledge capital in close
proximity (neighboring Virginia and Maryland).
D-30
By Geographic Area
For Washington, DC, the difference between academic performance and demographics between the
high schools in Wards 7 and 8 is marginal. Both the maps and the matrix demonstrate the similarity
across the Wards. In this case, more information is needed at the medium level to determine which
Ward, if any, to focus on.
In Baltimore, high students of color and low-income populations characterize many areas of the city.
Some high schools are performing very well in areas of low income and high traditionally underserved
populations, while other high schools are performing poorly in similar neighborhoods. For example,
Baltimore City College and Paul Lawrence Dunbar High Schools are both high academic achievement
high schools. This indicates that there may be magnet or charter schools in Baltimore drawing from
various neighborhoods, which is an element to consider when interpreting these maps. Based on U.S.
census tract demographic characteristics, and high school specific demographics, the communities that
could be examined more at the medium level are those surrounding Benjamin Franklin and Lansdowne
high schools.
For Virginia, the data and maps indicate that there are pockets of areas that exhibit low academic
achievement, low income as well as high population density. Similar to Baltimore, evaluating
demographics alone is not sufficient as there are very achieving public schools in areas of low income
and traditionally underserved populations, such as Woodside, Hampton, Kecoughtan, and Bethel High
Schools. There are two areas that stand out in particular in terms of poor academic achievement, high
minority and traditionally underserved populations and low income. These are the Hampton Roads area
surrounding Phoebus High School, as well as the area surrounding Booker T. Washington High School in
Norfolk.
Recommendations
Considering the results both by and across geographic areas, initial recommendations regarding which
high schools (and their surrounding communities) can be proposed for consideration and special focus
during the site visits and consideration in the medium level of analysis (Table 14).
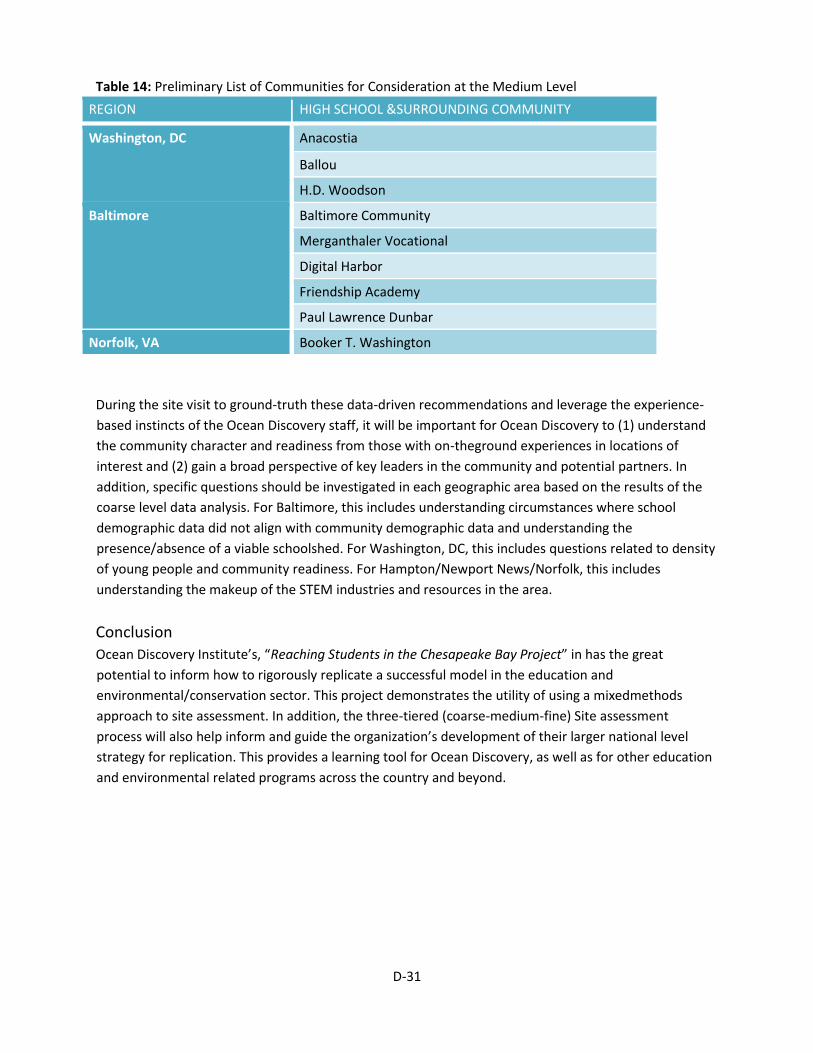
D-31
Table 14: Preliminary List of Communities for Consideration at the Medium Level
REGION HIGH SCHOOL &SURROUNDING COMMUNITY
Washington, DC Anacostia
Ballou
H.D. Woodson
Baltimore Baltimore Community
Merganthaler Vocational
Digital Harbor
Friendship Academy
Paul Lawrence Dunbar
Norfolk, VA Booker T. Washington
During the site visit to ground-truth these data-driven recommendations and leverage the experience-
based instincts of the Ocean Discovery staff, it will be important for Ocean Discovery to (1) understand
the community character and readiness from those with on-theground experiences in locations of
interest and (2) gain a broad perspective of key leaders in the community and potential partners. In
addition, specific questions should be investigated in each geographic area based on the results of the
coarse level data analysis. For Baltimore, this includes understanding circumstances where school
demographic data did not align with community demographic data and understanding the
presence/absence of a viable schoolshed. For Washington, DC, this includes questions related to density
of young people and community readiness. For Hampton/Newport News/Norfolk, this includes
understanding the makeup of the STEM industries and resources in the area.
Conclusion
Ocean Discovery Institute’s, “Reaching Students in the Chesapeake Bay Project” in has the great
potential to inform how to rigorously replicate a successful model in the education and
environmental/conservation sector. This project demonstrates the utility of using a mixedmethods
approach to site assessment. In addition, the three-tiered (coarse-medium-fine) Site assessment
process will also help inform and guide the organization’s development of their larger national level
strategy for replication. This provides a learning tool for Ocean Discovery, as well as for other education
and environmental related programs across the country and beyond.
D-32
Literature Cited
Creech, Heather. (2008). Scale up and replication for social and environmental enterprises.
International Institute for Sustainable Development. Retrieved from:
http://www.iisd.org/pdf/2008/seed_scale_enterprises.pdf.
Summerville, G. and B. Raley. (2009). Laying a Solid Foundation Strategies for effective program
replication. Public/Private Ventures. Retrieved from:
http://ppv.issuelab.org/resource/laying_a_solid_foundation_strategies_for_effe
ctive_program_replication.
E-1
Appendix E
STEM Industry Research for the Hampton
Roads Region of Virginia:
Chesapeake, Hampton, Newport News, Norfolk,
and Portsmouth
By Bemmy Maharramov
E-2
Introduction
In terms of the presence of Science, Technology, Engineering and Math (STEM) industry, the
Hampton Roads region of Virginia has a lot of complementarity and parallels to Ocean
Discovery Institute’s home office site of San Diego, California. For one, there is a strong military and
defense presence; Navy, Marines, and Coastguard; in both regions. Both San Diego and Virginia’s
Hampton Roads region have important and strategic ports with the shipping industry playing a key
functional and employment role. Another feature of both regions is the strong presence of an
engineering sector, in part providing a strong supportive role of the government and stimulating further
private sector growth. In addition, both regions are in close proximity to the ocean and coastal
ecosystems, which serves as the basis for Ocean Discovery Institute’s model of utilizing the ocean as a
platform for education, science research, and environmental stewardship.
Relative to other states and from a business perspective, Virginia is one of the leaders and in 2013
Forbes named Virginia the “Top State for Business”. In order to get an overall understanding of the
economic development in the region, and evaluate this in terms of STEM, the Hampton Roads Economic
Development Alliance (HREDA, 2014) was utilized for the data and analysis described below.
Highlighted Features of the region: Port of Virginia, Military and Manufacturing • Port of Virginia: fastest growing port on the East Coast • Military: 100,000 activity duty military personnel from all branches of the army, with over
6,000 who exit the service every year and establish homes in the region • Manufacturing: In the past decade, over 43 manufacturing companies have established
operations in the region, creating 2,800 new jobs and investing $900 million
*Source: HREDA
Overview of top industries and employers in the region
By industry, the top industries in the Hampton Roads region (which encompasses Chesapeake,
Hampton, Newport News, Norfolk, and Portsmouth) are: trade, transportation, and utilities;
professional and business services; and government. The prominent industries in the region have strong
STEM components, ranging from engineering to shipping (building and repair) to healthcare. The largest
employers in the region, including the Department of Defense, SeaWorld, and various healthcare
centers, all place high importance on STEM values and competencies. Table 1 and 2 below illustrate the
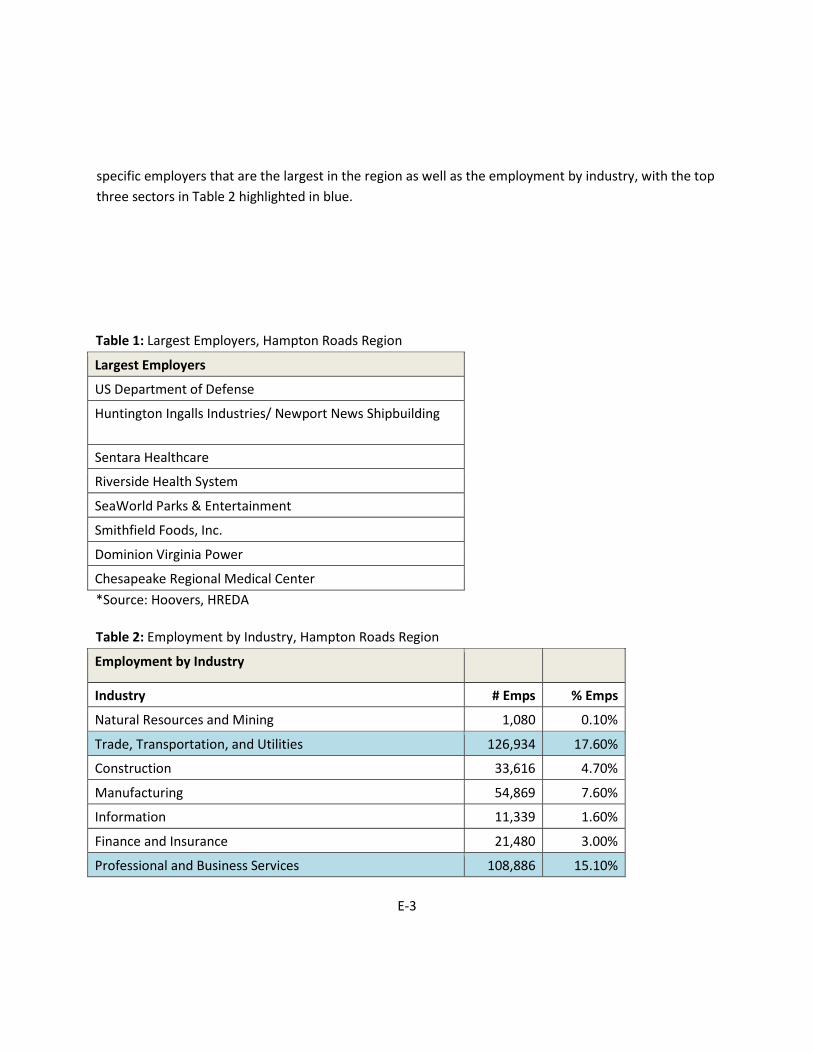
E-3
specific employers that are the largest in the region as well as the employment by industry, with the top
three sectors in Table 2 highlighted in blue.
Table 1: Largest Employers, Hampton Roads Region
Largest Employers
US Department of Defense
Huntington Ingalls Industries/ Newport News Shipbuilding
Sentara Healthcare
Riverside Health System
SeaWorld Parks & Entertainment
Smithfield Foods, Inc.
Dominion Virginia Power
Chesapeake Regional Medical Center
*Source: Hoovers, HREDA
Table 2: Employment by Industry, Hampton Roads Region
Employment by Industry
Industry # Emps % Emps
Natural Resources and Mining 1,080 0.10%
Trade, Transportation, and Utilities 126,934 17.60%
Construction 33,616 4.70%
Manufacturing 54,869 7.60%
Information 11,339 1.60%
Finance and Insurance 21,480 3.00%
Professional and Business Services 108,886 15.10%
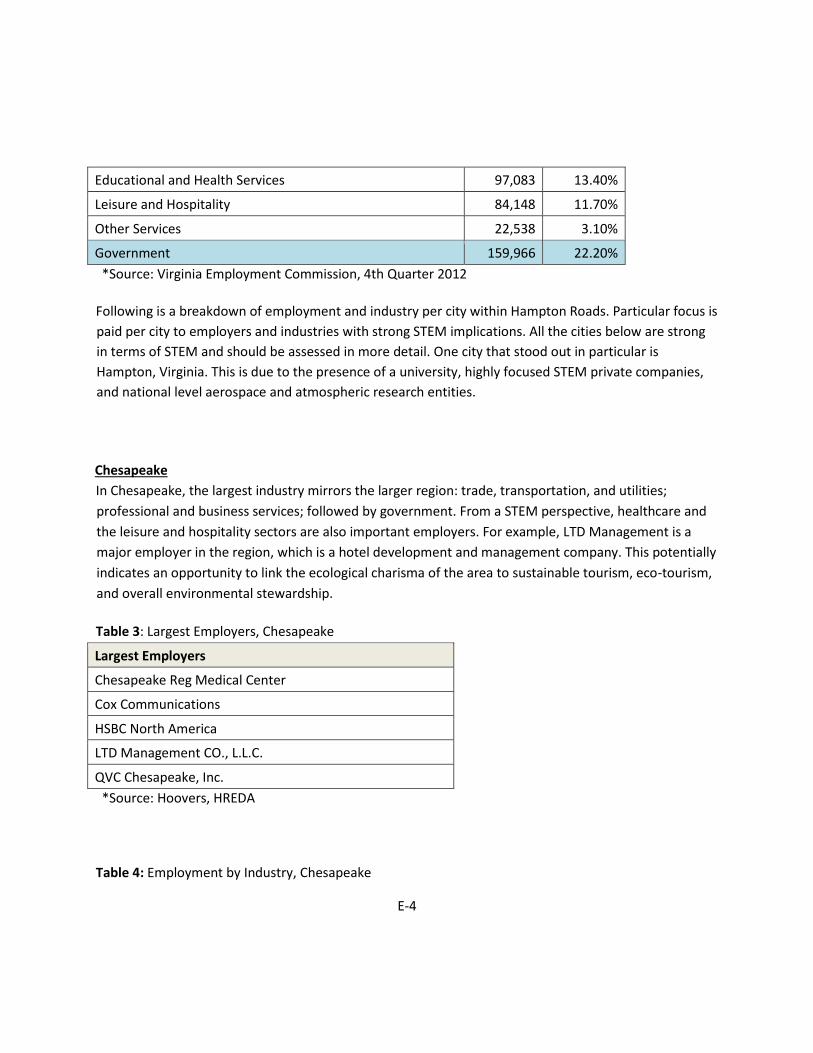
E-4
Educational and Health Services 97,083 13.40%
Leisure and Hospitality 84,148 11.70%
Other Services 22,538 3.10%
Government 159,966 22.20%
*Source: Virginia Employment Commission, 4th Quarter 2012
Following is a breakdown of employment and industry per city within Hampton Roads. Particular focus is
paid per city to employers and industries with strong STEM implications. All the cities below are strong
in terms of STEM and should be assessed in more detail. One city that stood out in particular is
Hampton, Virginia. This is due to the presence of a university, highly focused STEM private companies,
and national level aerospace and atmospheric research entities.
Chesapeake
In Chesapeake, the largest industry mirrors the larger region: trade, transportation, and utilities;
professional and business services; followed by government. From a STEM perspective, healthcare and
the leisure and hospitality sectors are also important employers. For example, LTD Management is a
major employer in the region, which is a hotel development and management company. This potentially
indicates an opportunity to link the ecological charisma of the area to sustainable tourism, eco-tourism,
and overall environmental stewardship.
Table 3: Largest Employers, Chesapeake
Largest Employers
Chesapeake Reg Medical Center
Cox Communications
HSBC North America
LTD Management CO., L.L.C.
QVC Chesapeake, Inc.
*Source: Hoovers, HREDA
Table 4: Employment by Industry, Chesapeake
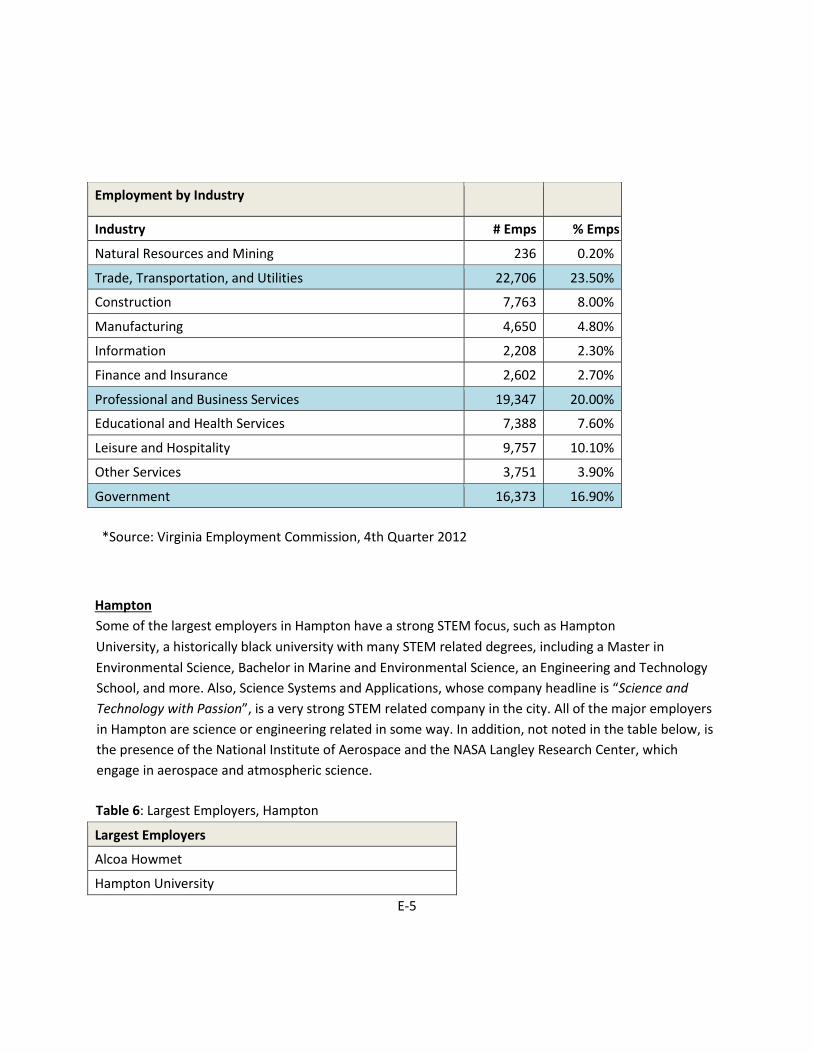
E-5
*Source: Virginia Employment Commission, 4th Quarter 2012
Hampton
Some of the largest employers in Hampton have a strong STEM focus, such as Hampton
University, a historically black university with many STEM related degrees, including a Master in
Environmental Science, Bachelor in Marine and Environmental Science, an Engineering and Technology
School, and more. Also, Science Systems and Applications, whose company headline is “Science and
Technology with Passion”, is a very strong STEM related company in the city. All of the major employers
in Hampton are science or engineering related in some way. In addition, not noted in the table below, is
the presence of the National Institute of Aerospace and the NASA Langley Research Center, which
engage in aerospace and atmospheric science.
Table 6: Largest Employers, Hampton
Largest Employers
Alcoa Howmet
Hampton University
Employment by Industry
Industry # Emps % Emps
Natural Resources and Mining 236 0.20%
Trade, Transportation, and Utilities 22,706 23.50%
Construction 7,763 8.00%
Manufacturing 4,650 4.80%
Information 2,208 2.30%
Finance and Insurance 2,602 2.70%
Professional and Business Services 19,347 20.00%
Educational and Health Services 7,388 7.60%
Leisure and Hospitality 9,757 10.10%
Other Services 3,751 3.90%
Government 16,373 16.90%
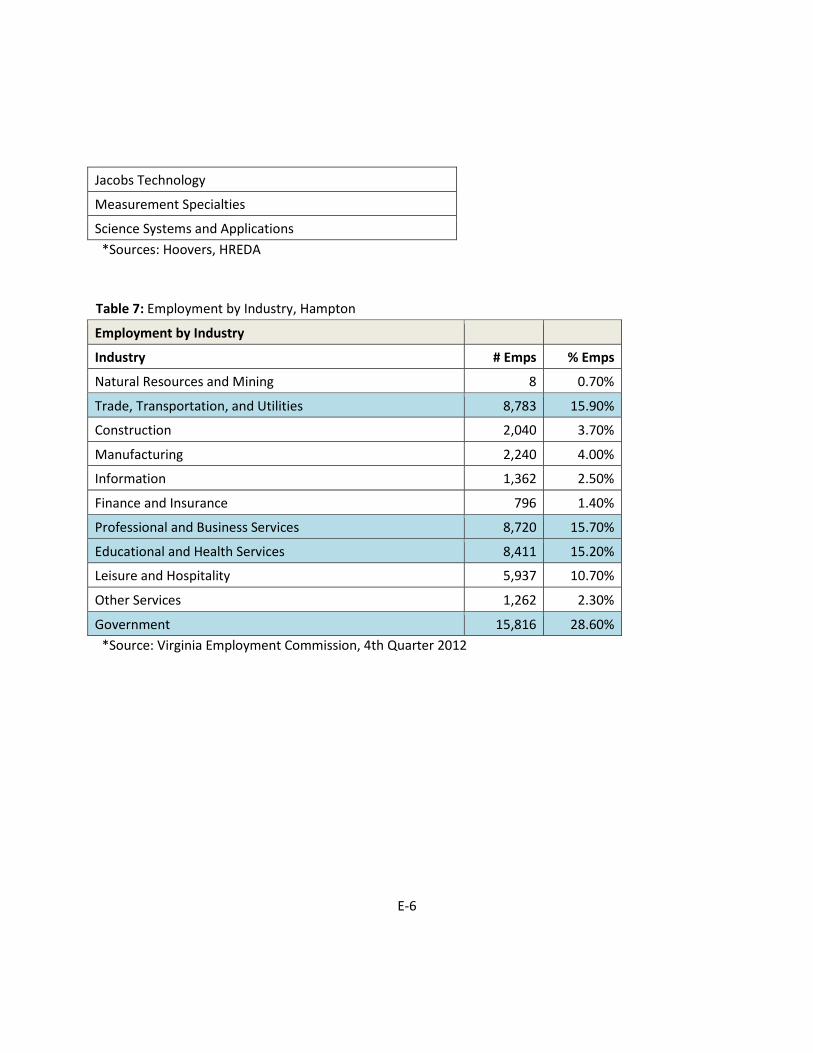
E-6
Jacobs Technology
Measurement Specialties
Science Systems and Applications
*Sources: Hoovers, HREDA
Table 7: Employment by Industry, Hampton
Employment by Industry
Industry # Emps % Emps
Natural Resources and Mining 8 0.70%
Trade, Transportation, and Utilities 8,783 15.90%
Construction 2,040 3.70%
Manufacturing 2,240 4.00%
Information 1,362 2.50%
Finance and Insurance 796 1.40%
Professional and Business Services 8,720 15.70%
Educational and Health Services 8,411 15.20%
Leisure and Hospitality 5,937 10.70%
Other Services 1,262 2.30%
Government 15,816 28.60%
*Source: Virginia Employment Commission, 4th Quarter 2012
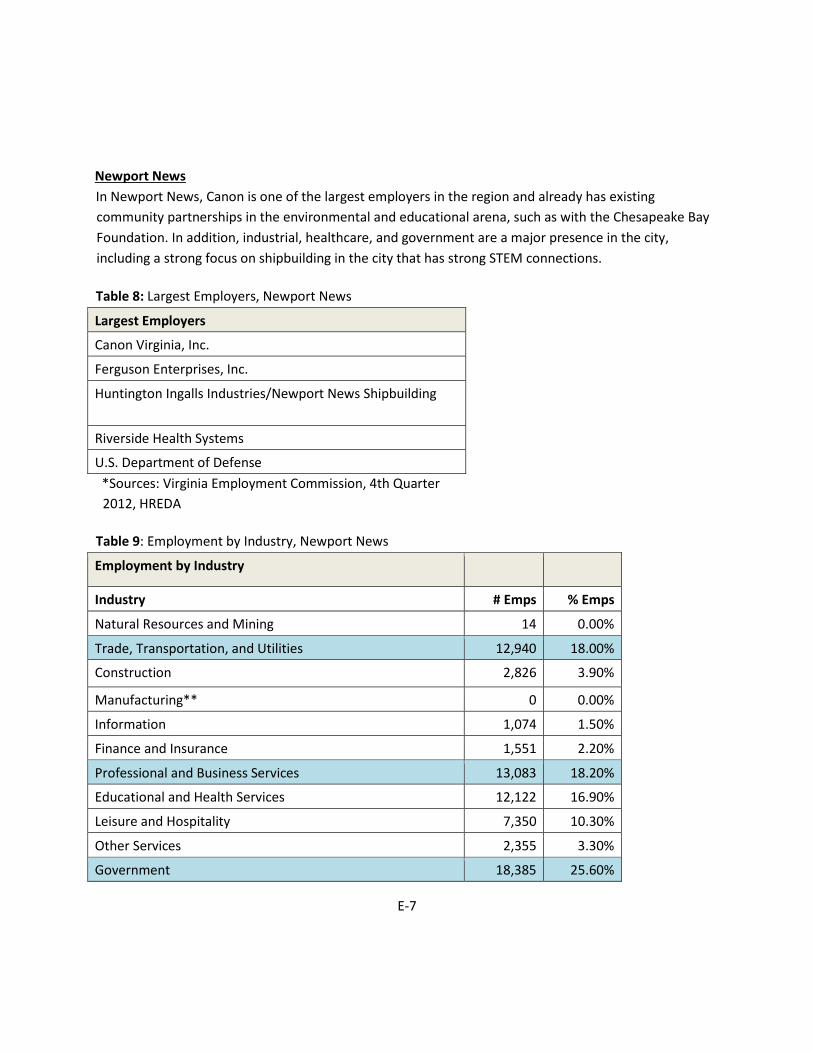
E-7
Newport News
In Newport News, Canon is one of the largest employers in the region and already has existing
community partnerships in the environmental and educational arena, such as with the Chesapeake Bay
Foundation. In addition, industrial, healthcare, and government are a major presence in the city,
including a strong focus on shipbuilding in the city that has strong STEM connections.
Table 8: Largest Employers, Newport News
Largest Employers
Canon Virginia, Inc.
Ferguson Enterprises, Inc.
Huntington Ingalls Industries/Newport News Shipbuilding
Riverside Health Systems
U.S. Department of Defense
*Sources: Virginia Employment Commission, 4th Quarter
2012, HREDA
Table 9: Employment by Industry, Newport News
Employment by Industry
Industry # Emps % Emps
Natural Resources and Mining 14 0.00%
Trade, Transportation, and Utilities 12,940 18.00%
Construction 2,826 3.90%
Manufacturing** 0 0.00%
Information 1,074 1.50%
Finance and Insurance 1,551 2.20%
Professional and Business Services 13,083 18.20%
Educational and Health Services 12,122 16.90%
Leisure and Hospitality 7,350 10.30%
Other Services 2,355 3.30%
Government 18,385 25.60%
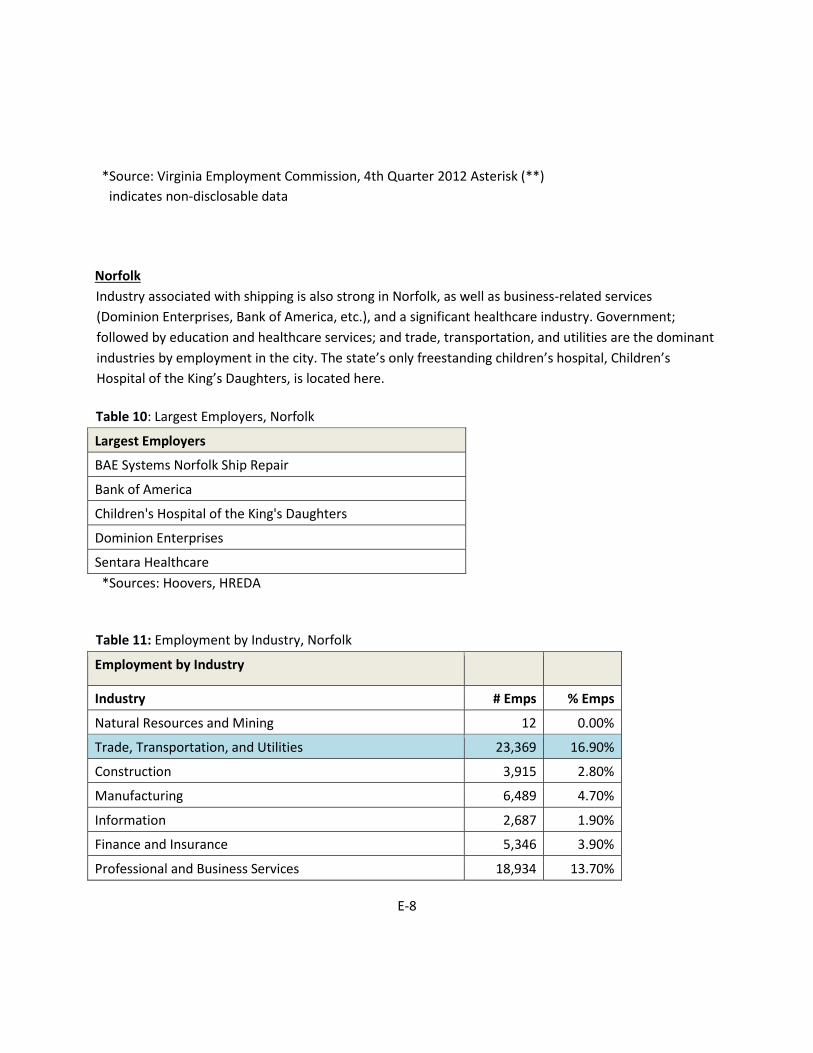
E-8
*Source: Virginia Employment Commission, 4th Quarter 2012 Asterisk (**)
indicates non-disclosable data
Norfolk
Industry associated with shipping is also strong in Norfolk, as well as business-related services
(Dominion Enterprises, Bank of America, etc.), and a significant healthcare industry. Government;
followed by education and healthcare services; and trade, transportation, and utilities are the dominant
industries by employment in the city. The state’s only freestanding children’s hospital, Children’s
Hospital of the King’s Daughters, is located here.
Table 10: Largest Employers, Norfolk
Largest Employers
BAE Systems Norfolk Ship Repair
Bank of America
Children's Hospital of the King's Daughters
Dominion Enterprises
Sentara Healthcare
*Sources: Hoovers, HREDA
Table 11: Employment by Industry, Norfolk
Employment by Industry
Industry # Emps % Emps
Natural Resources and Mining 12 0.00%
Trade, Transportation, and Utilities 23,369 16.90%
Construction 3,915 2.80%
Manufacturing 6,489 4.70%
Information 2,687 1.90%
Finance and Insurance 5,346 3.90%
Professional and Business Services 18,934 13.70%
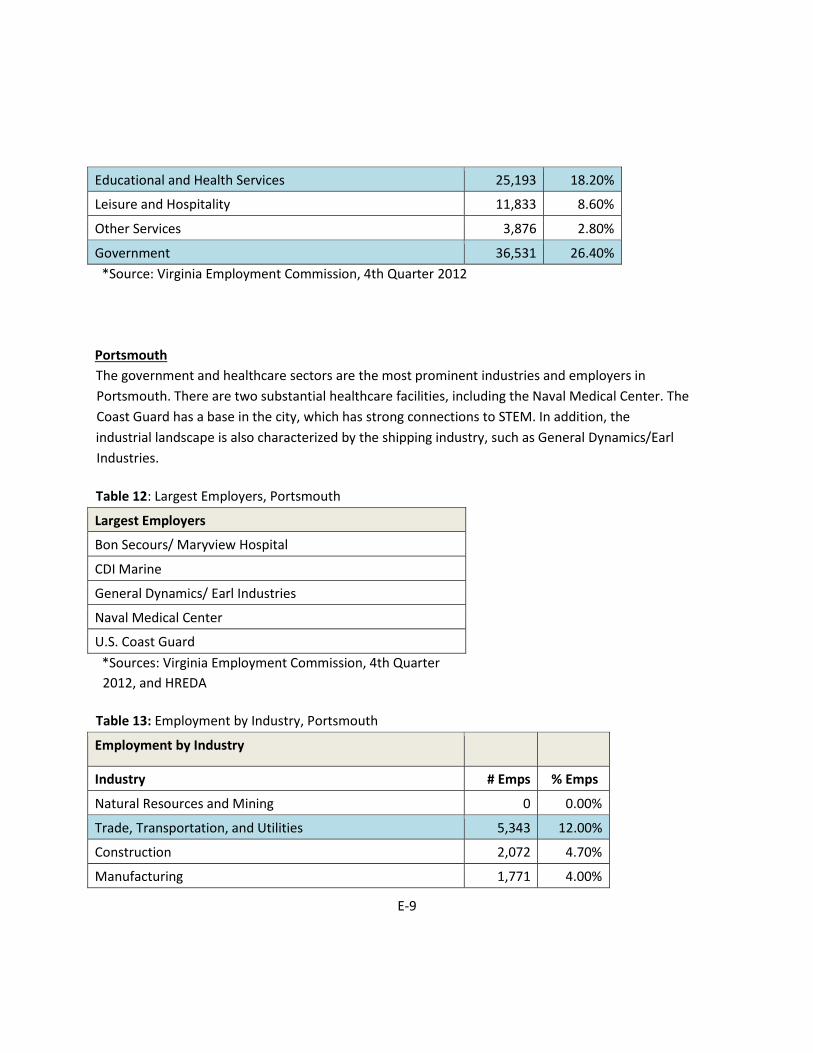
E-9
Educational and Health Services 25,193 18.20%
Leisure and Hospitality 11,833 8.60%
Other Services 3,876 2.80%
Government 36,531 26.40%
*Source: Virginia Employment Commission, 4th Quarter 2012
Portsmouth
The government and healthcare sectors are the most prominent industries and employers in
Portsmouth. There are two substantial healthcare facilities, including the Naval Medical Center. The
Coast Guard has a base in the city, which has strong connections to STEM. In addition, the
industrial landscape is also characterized by the shipping industry, such as General Dynamics/Earl
Industries.
Table 12: Largest Employers, Portsmouth
Largest Employers
Bon Secours/ Maryview Hospital
CDI Marine
General Dynamics/ Earl Industries
Naval Medical Center
U.S. Coast Guard
*Sources: Virginia Employment Commission, 4th Quarter
2012, and HREDA
Table 13: Employment by Industry, Portsmouth
Employment by Industry
Industry # Emps % Emps
Natural Resources and Mining 0 0.00%
Trade, Transportation, and Utilities 5,343 12.00%
Construction 2,072 4.70%
Manufacturing 1,771 4.00%
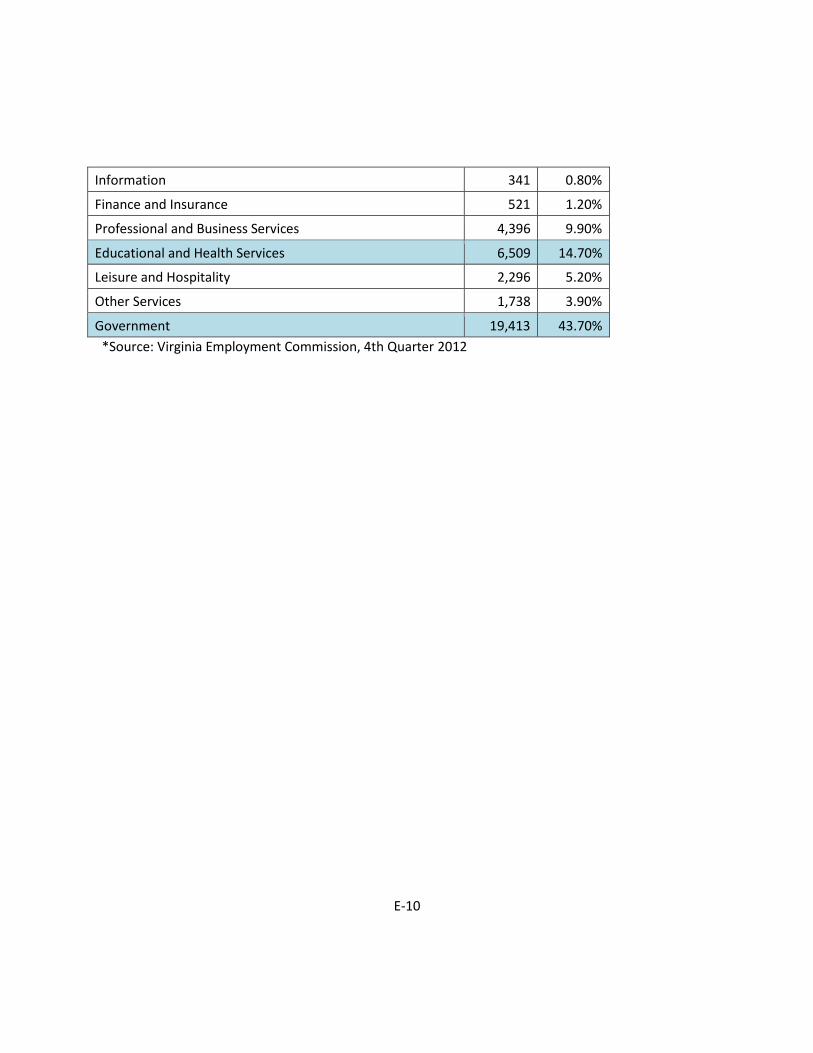
E-10
Information 341 0.80%
Finance and Insurance 521 1.20%
Professional and Business Services 4,396 9.90%
Educational and Health Services 6,509 14.70%
Leisure and Hospitality 2,296 5.20%
Other Services 1,738 3.90%
Government 19,413 43.70%
*Source: Virginia Employment Commission, 4th Quarter 2012
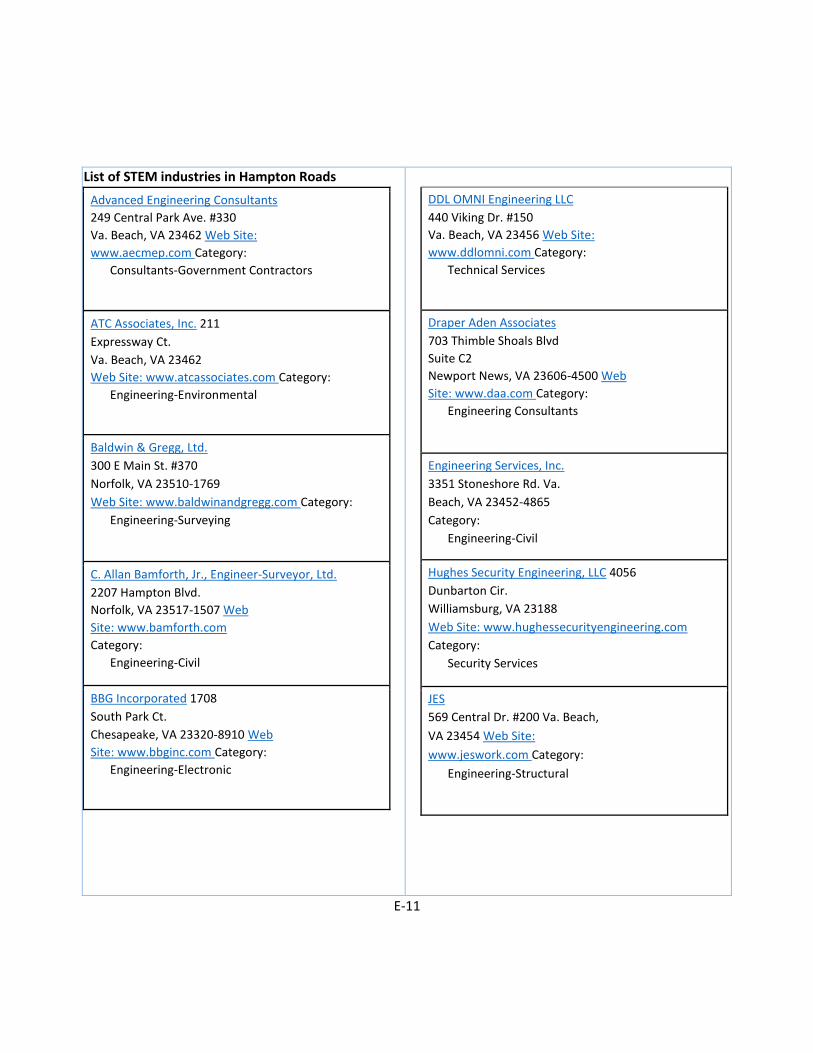
E-11
L List of STEM industries in Hampton Roads
Advanced Engineering Consultants 249 Central Park Ave. #330 Va. Beach, VA 23462 Web Site:
www.aecmep.com Category: Consultants-Government Contractors
ATC Associates, Inc. 211
Expressway Ct. Va. Beach, VA 23462 Web Site: www.atcassociates.com Category:
Engineering-Environmental
Baldwin & Gregg, Ltd. 300 E Main St. #370 Norfolk, VA 23510-1769 Web Site: www.baldwinandgregg.com Category:
Engineering-Surveying
C. Allan Bamforth, Jr., Engineer-Surveyor, Ltd. 2207 Hampton Blvd. Norfolk, VA 23517-1507 Web
Site: www.bamforth.com
Category: Engineering-Civil
BBG Incorporated 1708
South Park Ct. Chesapeake, VA 23320-8910 Web
Site: www.bbginc.com Category: Engineering-Electronic
DDL OMNI Engineering LLC 440 Viking Dr. #150 Va. Beach, VA 23456 Web Site:
www.ddlomni.com Category: Technical Services
Draper Aden Associates 703 Thimble Shoals Blvd Suite C2 Newport News, VA 23606-4500 Web
Site: www.daa.com Category: Engineering Consultants
Engineering Services, Inc.
3351 Stoneshore Rd. Va.
Beach, VA 23452-4865
Category: Engineering-Civil
Hughes Security Engineering, LLC 4056
Dunbarton Cir. Williamsburg, VA 23188
Web Site: www.hughessecurityengineering.com
Category: Security Services
JES 569 Central Dr. #200 Va. Beach,
VA 23454 Web Site:
www.jeswork.com Category:
Engineering-Structural
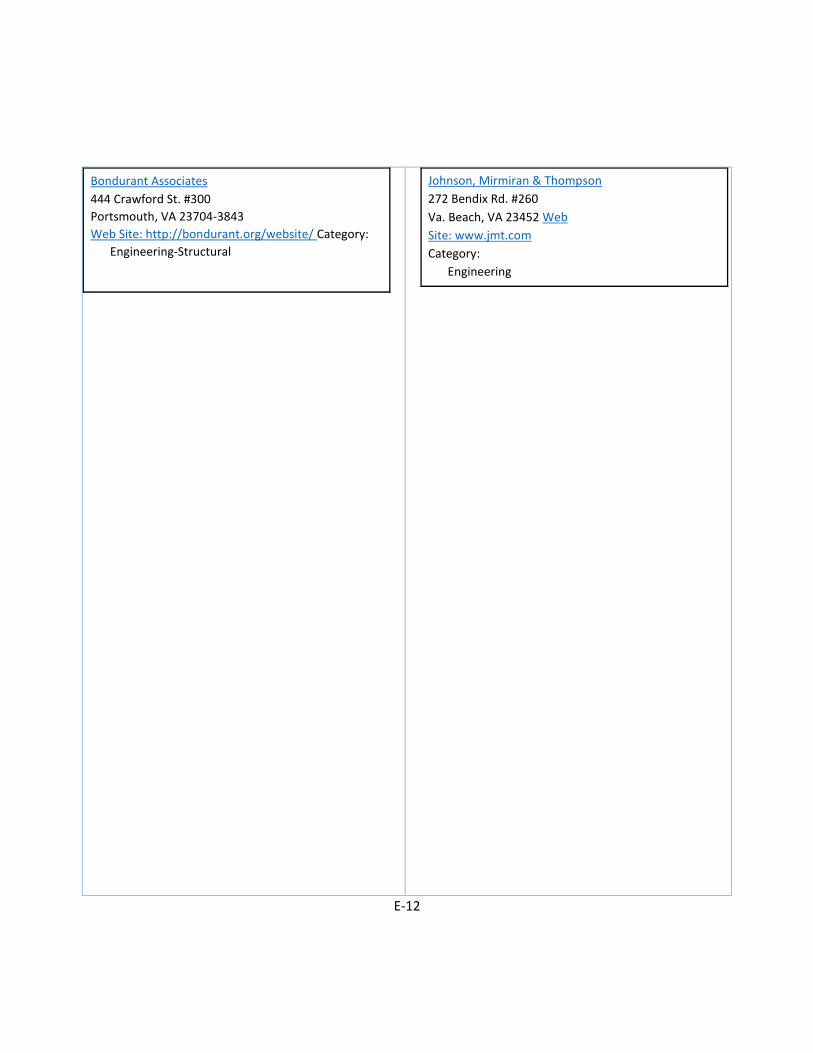
E-12
Bondurant Associates 444 Crawford St. #300 Portsmouth, VA 23704-3843 Web Site: http://bondurant.org/website/ Category:
Engineering-Structural
Johnson, Mirmiran & Thompson 272 Bendix Rd. #260 Va. Beach, VA 23452 Web
Site: www.jmt.com
Category: Engineering
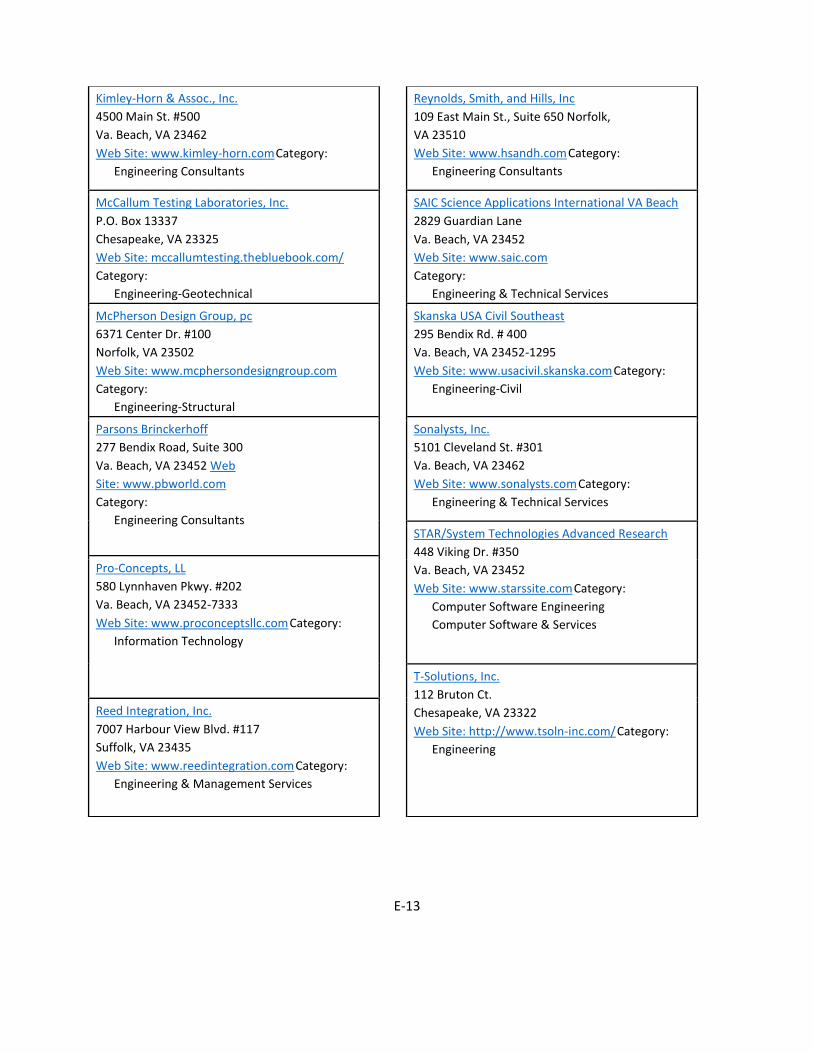
E-13
Kimley-Horn & Assoc., Inc. 4500 Main St. #500 Va. Beach, VA 23462
Web Site: www.kimley-horn.com Category: Engineering Consultants
Reynolds, Smith, and Hills, Inc
109 East Main St., Suite 650 Norfolk,
VA 23510 Web Site: www.hsandh.com Category: Engineering Consultants
McCallum Testing Laboratories, Inc.
P.O. Box 13337 Chesapeake, VA 23325 Web Site: mccallumtesting.thebluebook.com/
Category: Engineering-Geotechnical
SAIC Science Applications International VA Beach
2829 Guardian Lane Va. Beach, VA 23452
Web Site: www.saic.com
Category: Engineering & Technical Services
McPherson Design Group, pc 6371 Center Dr. #100 Norfolk, VA 23502 Web Site: www.mcphersondesigngroup.com
Category: Engineering-Structural
Skanska USA Civil Southeast 295 Bendix Rd. # 400 Va. Beach, VA 23452-1295 Web Site: www.usacivil.skanska.com Category: Engineering-Civil
Parsons Brinckerhoff 277 Bendix Road, Suite 300
Va. Beach, VA 23452 Web
Site: www.pbworld.com
Category: Engineering Consultants
Sonalysts, Inc. 5101 Cleveland St. #301 Va. Beach, VA 23462
Web Site: www.sonalysts.com Category: Engineering & Technical Services
STAR/System Technologies Advanced Research 448 Viking Dr. #350 Va. Beach, VA 23452
Web Site: www.starssite.com Category: Computer Software Engineering Computer Software & Services
Pro-Concepts, LL 580 Lynnhaven Pkwy. #202 Va. Beach, VA 23452-7333
Web Site: www.proconceptsllc.com Category: Information Technology
T-Solutions, Inc. 112 Bruton Ct. Chesapeake, VA 23322
Web Site: http://www.tsoln-inc.com/ Category: Engineering
Reed Integration, Inc. 7007 Harbour View Blvd. #117 Suffolk, VA 23435 Web Site: www.reedintegration.com Category: Engineering & Management Services

E-14
Sources of Data:
Hampton Roads Economic Development Alliance:
http://hreda.com/
Hoovers: http://www.hoovers.com/
Virginia Employment Commission,
4th Quarter 2012:
http://www.vec.virginia.gov/
Hampton Roads Chamber of Commerce:
http://www.hamptonroadschamber.com/
*Source: Hampton Roads Chamber of Commerce
A. Morton Thomas & Associates, Inc
1530 Breezeport Way #300
Suffolk, VA 23435
Web Site: www.amtengineering.com
Category:
Engineering Consultants
UrsaNav, Inc.
616 Innovation Dr.
Chesapeake, VA 23320
Web Site: www.ursanav.com
Category:
Engineering
Vansant & Gusler, Inc.
6330 Newtown Rd. #400
Norfolk, VA 23502-4890
Web Site: www.vansantgusler.com
Category:
Engineering Consultants
Virginia Aquarium & Marine Science Center
717 General Booth Blvd.
Va. Beach, VA 23451-4811
Web Site: www.VirginiaAquarium.com
Category:
Museums
Woolpert, Inc.
676 Independence Pkwy. #100
Chesapeake, VA 23320
Web Site: www.woolpert.com
Category:
Engineering
XDIN, Inc.
308 35th St. #201
Va. Beach, VA 23451
Web Site: www.xdin.com/usa
Category:
Engineering Consultants
F-1
Appendix F
“Replication of Ocean Discovery Institute: An Urban
STEM Model that Will Empower Decision Makers and
Leadership for the Chesapeake Bay Region”
Replication Strategy Assessment:
Literature Review
By Sarvat Maharramli
F-2
A. Methodology
This literature review highlights key available resources for the replication of social and educational
programs, especially focusing on key trends, lessons learned, and good practices of organizations of
similar size with the Ocean Discovery Institute. The reviewed literature includes a wide range of
resources including, academic articles, books, white papers, case studies, essays, magazine articles,
workshop presentation materials, toolkits, guidebooks and manuals for organizations to replicate their
programs. Although the majority of the literature on this topic covers experiences of similar non-profit
organizations, educational institutions and funding institutions in the U.S., selected relevant examples
from other countries, including UK, Canada and other European countries have been also reviewed and
cited. The authors mainly used open-source Internet and certain online libraries to collect and analyze
existing literature under search terms of “replication”, “scaling up”, “social innovation”, “expansion of
NGOs” and other relevant concepts. Although precise definitions of these concepts are arguably
different (which will be discussed under the Results Section of the literature review); methods, strategies
and approaches used under these concepts provide valuable information that Ocean Discovery can
utilize for the development of a sustainable replication strategy of its program in new regions.
The structure of the literature review is based on the discussion of key questions that the Assessment is
aiming to answer, specifically around the definition, rationale, strategies and approaches to sustainable
replication, with a special emphasis on the success factors discussed by different practitioners and
academicians. The literature review also identifies key questions that should be answered as a part of
the replication process. These questions were derived through different assessment methods, namely,
interviews with the Ocean Discovery staff members and representatives of similar organizations that
initiated successful national replication and expansion of their programs.
B. Results
For the purpose of this assignment, the key findings from the literature are structured under three key
categories:
1. Definition and rationale for replication: this section clarifies the definition of the replication, key
concepts and discusses different authors’ views on key drivers of replication.
F-3
2. Strategies, approaches and methods of replication: this section outlines key strategies,
approaches, paths and methods of replication discussed by different academicians and
practitioners.
3. Key success factors for the sustainable replication: this section looks into various success
factors, lessons learned and best practices proposed for sustainable program replications.
1. Definition and Rationale for Replication
Definition: Clarification of the definition of the “replication” and its difference from similar concepts
such as “expansion”, “scaling up” is an important distinction widely discussed in the literature. The
following key characteristics have been emphasized by different authors in discussing the definition of
replication (Fleischer, et al. 2008; Creech 2008; RPS, 1994; Jowet and Dyer 2012; Dees and Anderson,
2003):
• Piloting, implementing successful and tested programs, concepts, ideas, innovation in different
locations;
• Reaching larger groups of beneficiaries and achieving greater impact;
• Remaining sensitive to local context;
• Adapting to new regions and communities
Replications and Program Strategies (RPS, 1994) identifies replication as “the process of moving a tested
prototype program to additional sites in keeping with the hard (invariable) and soft (variable) aspects of
that particular program’s components while remaining sensitive to the local context of each additional
site” (RPS, 1994, p.1). Hard or invariable features are characteristics of the original model considered
essential for replication, whereas soft/variable features do not have to be a part of the replication
process and can be dropped depending on the new replication sites (RSP, 1994, Lowet and Dyer 2012,).
It is also noteworthy to mention that replication does not mean “copying” or “duplicating” any concept
without taking into consideration the local context (Fleisch et al. 2008; Jowet and Dyer 2012; RPS, 1994).
Bradach (2003) calls the replication “a process of planned evolution” for an organization.
F-4
It is also important to differentiate between “replication” and “scaling”, as replication is considered just
one way of scaling programs (Creech 2008; Grantmakers for Effective
Organizations. 2011). According to Hartmann and Linn, scaling is something different - “expanding,
adapting and sustaining successful policies, programs or projects in different places and over time to
reach a greater number of people” (Hartmann and Linn, 2008, p.7). Although several authors present
“replication” as one of the mechanisms of the “scaling”, there is not sufficient discussion in the
literature on how it differs from other mechanisms and many academicians and practitioners
interchangeably use these terms.
2. Rationale for replication
One of the key questions discussed in the literature is the rationale underlying why an organizations
needs/wants to replicate its program. Different authors extensively discuss the (1) driving forces; (2)
preconditions; and (3) benefits of the replications on social and educational sectors. Organizations need
to analyze these aspects of the rationale for replication and include those factors into their replication
strategy.
Driving forces: Key driving forces of the replication can be divided into two categories: internal and
external factors. Internal factors include ideas, vision, strategic approach and leadership of an
organization (Hartmann and Linn, 2008) to expand its social impact and reach larger beneficiaries.
External factors include new opportunities, resources (Bridgespan Group, 2005) and demand (Bradach
2003) that organizations are trying to capture. A study conducted among 20 youth-serving organizations
by Bridgespan Group (2005) discovered that expansion and replication was “more often a response to
opportunity than the result of strategic choices”. In terms of demand, an organization should conduct
extensive research (survey, field visits, etc.) to identify demand for the proposed program. For example,
to identify demands in the potential target regions, the STRIVE program reviewed statistics from the 50
largest cities across the United States before initiating its expansion program (Bradach 2003).
Preconditions: Identifying and establishing preconditions for replication is an important factor for
initiating any replication. The program needs to meet several key preconditions in order to be replicated
F-5
in a new community. First of all, it needs to address priority social and public needs or problems
(Summerville and Raley 2009; Racine 2004). Secondly, the program should have a strong theory of
change and clear, effective and replicable elements (Bradach 2003; Summerville and Raley 2009). As
Bradach (2003) indicates, replicating the entire organization and its culture might be complex and
unrealistic; thus, it is imperative to understand replicable core elements of the program. Racine (2008)
proposes responding to the following four dimensions of the replication: “(1) What the program tries to
achieve (product); (2) How it tries to achieve (production process); (3) How the product will be shaped by
the reactions of the market; and (4) How the process will be shared by the reaction of the market when
the program is disseminated.” The final precondition for the program replication is the institutional
readiness, which requires an organization to have the necessary systems and procedures in place to
initiate, measure, and achieve positive results within the realistic timeframe (Dees, et al. 2002; Racine
2004; Bradach 2003; Bridgespan Group 2005). According to Bradach (2003), organizations should
answer to the following three questions before moving forward with the replication of their program:
“(1) where and how to grow; (2) what kind of network to build and
(3) what the role of the “center” needs to be.”
Benefits: Replicating a tested and successful social program in new communities has social, economic,
financial and programmatic benefits to both the (1) replicating organizations and (2) new communities
and partner organizations in those communities. Key benefits of replication to the replicating
organizations can be described as follows:
• Programmatic and political benefits: National recognition, dissemination of values, vision and
organizational culture and reaching new beneficiaries are high level benefits discussed by different
authors (Steele et al., 2008; Creech, 2008; Fleisch 2008). In addition, the replication process creates
opportunities for innovation, mutual learning and program development through testing a program
in a new environment and context (Berelowitz et al. 2013; Oudenhoven and Wazir 1998).
• Organizational benefits: Properly designed and implemented replication program (1) strengthens
program management, especially data collection and measurements systems of an organization;
and (2) improves skills and knowledge of the existing staff members and attracts new workforce
(Berelowitz et al. 2013).
F-6
• Economic and financial benefits: Diversification of financial resources and availability of alternative
donors in new communities (Fleisch 2008; Jowet 2010; Oudenhoven and Wazir 1998). In addition,
by establishing new replication sites and standardized systems and services, organizations benefit
from the economies of scales (Berelowitz et al. 2013).
Benefits of replication to a new community, including local organizations/partners vary depending on
the path of the replications (wholly-owned branch office, franchise, partnership or dissemination)
selected by the replicating organization in introducing a new program. However, there are a few
benefits that are applicable to all replication pathways. First of all, the community will benefit from the
resolution of societal problems applying the tested successful models without high risks and costs
(Fleisch et al. 2008). In terms of the local partner organizations, the local replicators benefits from (1)
access to the tested model, experienced staff, templates and examples of the successful program
materials and resources (Winter and
Szulanski 2001); (2) low start-up costs and support in diversifying funding sources (Fleisch 2008; Jowet
2010; Oudenhoven and Wazir 1998; Berelowitz et al. 2013); and (3) access to the larger network of
organizations involved in the replication process (Bradach 2003).
3. Replication Strategies, Models, Approaches and Phases
Replication Strategies and Models: The contemporary literature on replication models and strategies
provide a series of categorizations on replication models and strategies. Review of these strategies and
models revealed that some of these categorizations are repetitive and there is some inconsistency
among academicians and practitioners about the categorization of replication models. Thus, this paper
focuses on key categorizations and models that can provide value to Ocean Discovery in designing its
replication strategies.
The first categorization of the replication strategies are four paths presented by RPS (1994, p.4) and
further developed and discussed by other academicians and practitioners (RPS, 1994;
Oudenhoven and Wazir, 1998; Jowett and Dyer, 2012; Hartman and Linn, 2008; Zhonghua, 2008; Fleisch
et al., 2008). These replication paths are (1) Mandated, (2) Franchise, (3) Staged and (4) Concept. RPS’
categorization was further developed/interpreted by different authors who presented either new paths,
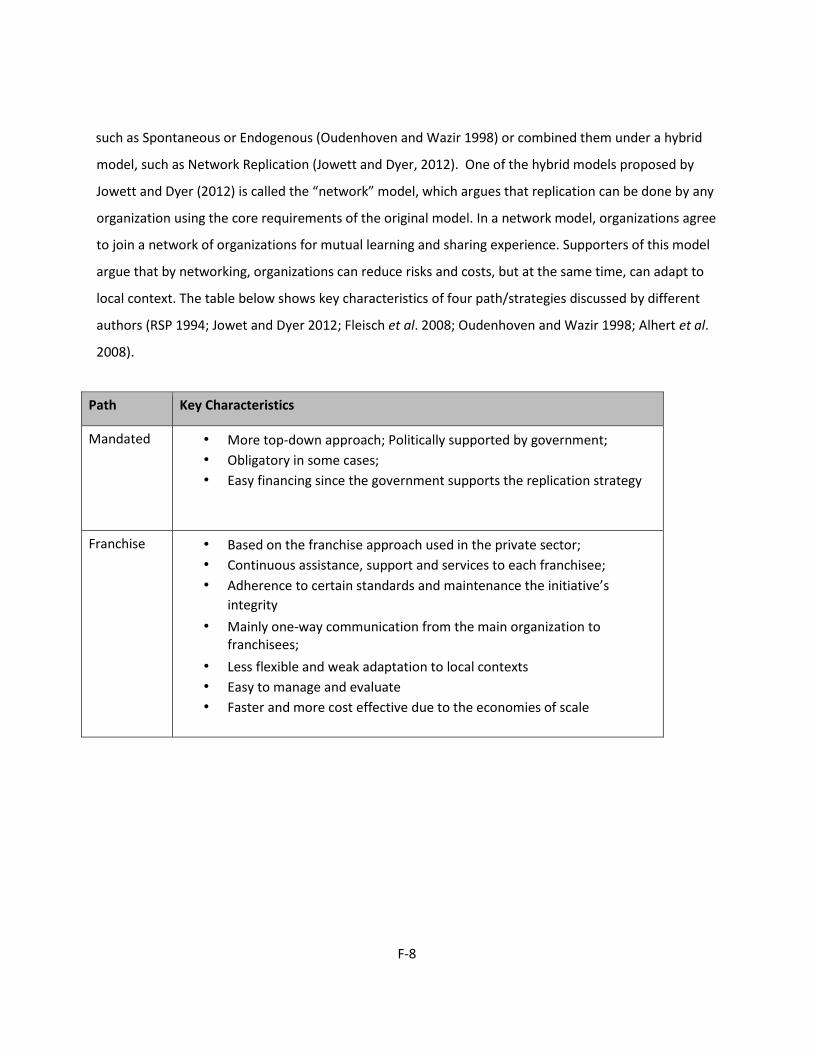
F-8
such as Spontaneous or Endogenous (Oudenhoven and Wazir 1998) or combined them under a hybrid
model, such as Network Replication (Jowett and Dyer, 2012). One of the hybrid models proposed by
Jowett and Dyer (2012) is called the “network” model, which argues that replication can be done by any
organization using the core requirements of the original model. In a network model, organizations agree
to join a network of organizations for mutual learning and sharing experience. Supporters of this model
argue that by networking, organizations can reduce risks and costs, but at the same time, can adapt to
local context. The table below shows key characteristics of four path/strategies discussed by different
authors (RSP 1994; Jowet and Dyer 2012; Fleisch et al. 2008; Oudenhoven and Wazir 1998; Alhert et al.
2008).
Path Key Characteristics
Mandated • More top-down approach; Politically supported by government;
• Obligatory in some cases;
• Easy financing since the government supports the replication strategy
Franchise • Based on the franchise approach used in the private sector;
• Continuous assistance, support and services to each franchisee;
• Adherence to certain standards and maintenance the initiative’s
integrity
• Mainly one-way communication from the main organization to franchisees;
• Less flexible and weak adaptation to local contexts
• Easy to manage and evaluate
• Faster and more cost effective due to the economies of scale
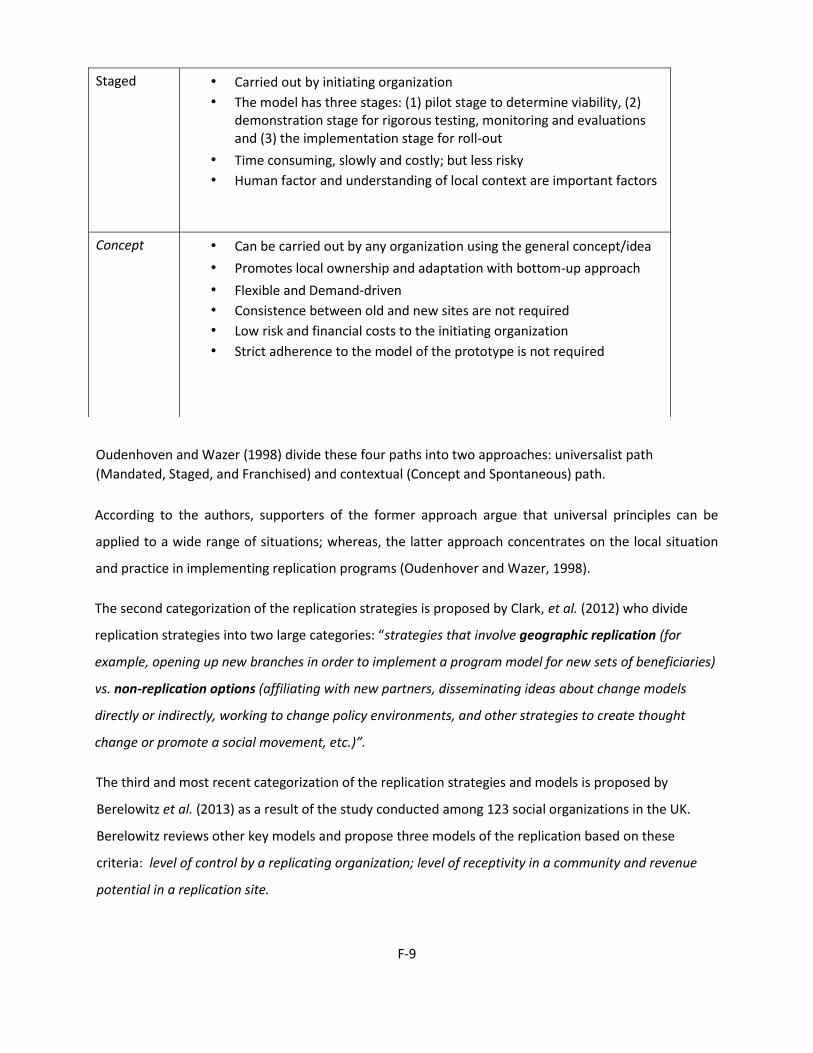
F-9
Oudenhoven and Wazer (1998) divide these four paths into two approaches: universalist path
(Mandated, Staged, and Franchised) and contextual (Concept and Spontaneous) path.
According to the authors, supporters of the former approach argue that universal principles can be
applied to a wide range of situations; whereas, the latter approach concentrates on the local situation
and practice in implementing replication programs (Oudenhover and Wazer, 1998).
The second categorization of the replication strategies is proposed by Clark, et al. (2012) who divide
replication strategies into two large categories: “strategies that involve geographic replication (for
example, opening up new branches in order to implement a program model for new sets of beneficiaries)
vs. non-replication options (affiliating with new partners, disseminating ideas about change models
directly or indirectly, working to change policy environments, and other strategies to create thought
change or promote a social movement, etc.)”.
The third and most recent categorization of the replication strategies and models is proposed by
Berelowitz et al. (2013) as a result of the study conducted among 123 social organizations in the UK.
Berelowitz reviews other key models and propose three models of the replication based on these
criteria: level of control by a replicating organization; level of receptivity in a community and revenue
potential in a replication site.
Staged • Carried out by initiating organization
• The model has three stages: (1) pilot stage to determine viability, (2) demonstration stage for rigorous testing, monitoring and evaluations and (3) the implementation stage for roll-out
• Time consuming, slowly and costly; but less risky
• Human factor and understanding of local context are important factors
Concept • Can be carried out by any organization using the general concept/idea
• Promotes local ownership and adaptation with bottom-up approach
• Flexible and Demand-driven
• Consistence between old and new sites are not required
• Low risk and financial costs to the initiating organization
• Strict adherence to the model of the prototype is not required
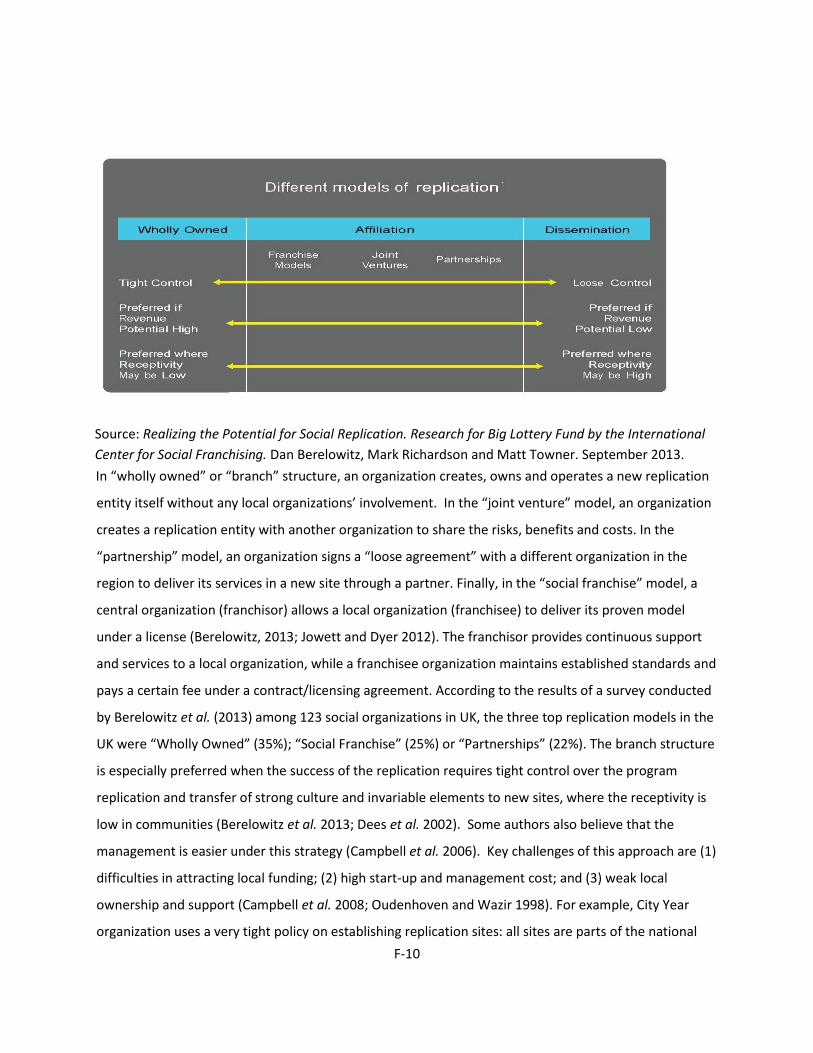
F-10
Source: Realizing the Potential for Social Replication. Research for Big Lottery Fund by the International
Center for Social Franchising. Dan Berelowitz, Mark Richardson and Matt Towner. September 2013.
In “wholly owned” or “branch” structure, an organization creates, owns and operates a new replication
entity itself without any local organizations’ involvement. In the “joint venture” model, an organization
creates a replication entity with another organization to share the risks, benefits and costs. In the
“partnership” model, an organization signs a “loose agreement” with a different organization in the
region to deliver its services in a new site through a partner. Finally, in the “social franchise” model, a
central organization (franchisor) allows a local organization (franchisee) to deliver its proven model
under a license (Berelowitz, 2013; Jowett and Dyer 2012). The franchisor provides continuous support
and services to a local organization, while a franchisee organization maintains established standards and
pays a certain fee under a contract/licensing agreement. According to the results of a survey conducted
by Berelowitz et al. (2013) among 123 social organizations in UK, the three top replication models in the
UK were “Wholly Owned” (35%); “Social Franchise” (25%) or “Partnerships” (22%). The branch structure
is especially preferred when the success of the replication requires tight control over the program
replication and transfer of strong culture and invariable elements to new sites, where the receptivity is
low in communities (Berelowitz et al. 2013; Dees et al. 2002). Some authors also believe that the
management is easier under this strategy (Campbell et al. 2006). Key challenges of this approach are (1)
difficulties in attracting local funding; (2) high start-up and management cost; and (3) weak local
ownership and support (Campbell et al. 2008; Oudenhoven and Wazir 1998). For example, City Year
organization uses a very tight policy on establishing replication sites: all sites are parts of the national

F-11
organizations; local employees are hired by City Year directly; regular trainings, field visits and
standardized trainings are organized for all sites (Bradach 2003; Dees et al. 2002).
Approaches and Phases of Program Replications: Organizations use different approaches and processes
to initiate the replication of their programs depending on the motivation; local context, strategies and
preconditions existing within the organization and/or new sites. The majority of these approaches fit
into the circular process of the four steps discussed by different academicians (Clark et al. 2012;
Berelowitz et al. 2013):
Phase One -Assessment: Organizations define the business module, its essential elements and social
impact; reviews institutional readiness (including administrative, human and organizational systems);
identifies potential pilot sites for replication; and determines the replication strategy/models
(Berelowitz et al. 2013; Clark et al. 2012; MSI 2012). Summerville and Relay call it the “determination of
the desirability and feasibility of the replication” (Summerville and Relay 2009).
Phase Two-Business Model Development: Organizations prepare a business strategy and funding
proposals; creates legal documents and other administrative and operations systems for the replication
(including branding); identifies internal team and local champions for the implementation of the
replication and finalizes site selection process (Clark et al. 2012; Berelowitz et al. 2013; MSI 2012).
Phase three-Implementation: Organizations pilot replication in 3-6 varied locations; establish local
presence; conduct initial and on-going trainings for the local staff; and monitor the implementation and
2 . Business Model
Development
3 . Implementation and Roll - out
4 . Evaluation and On - going Implementation
1 . Assessment
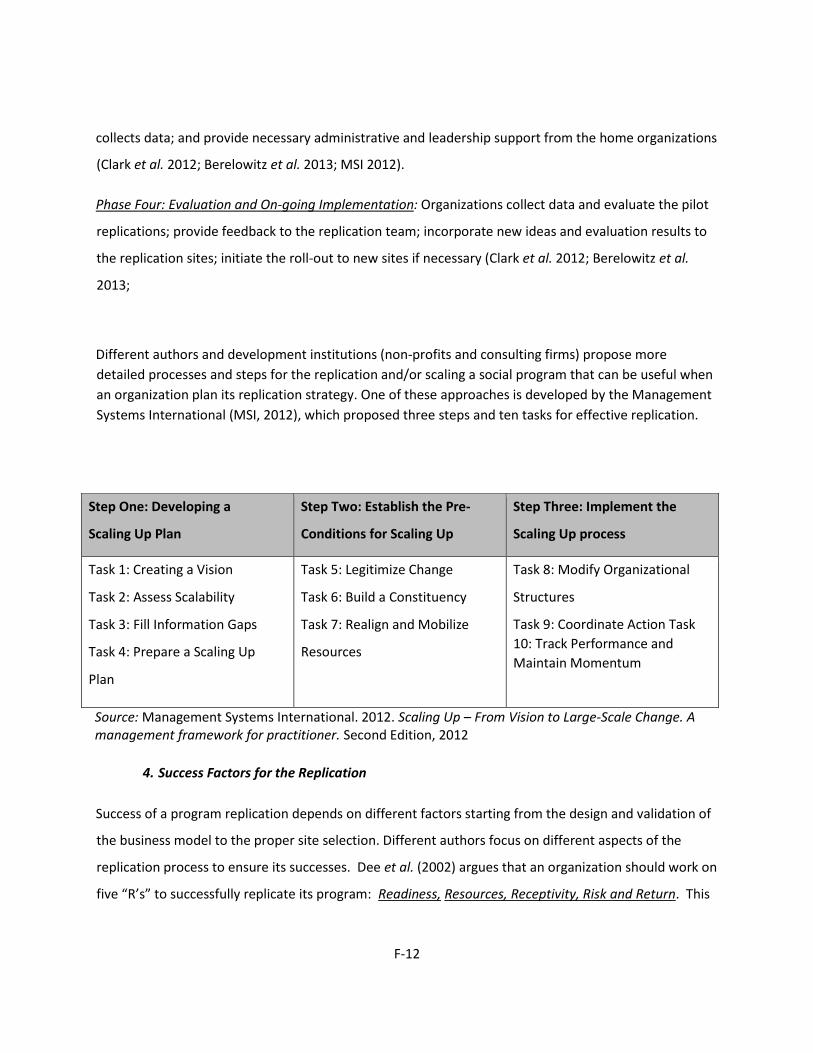
F-12
collects data; and provide necessary administrative and leadership support from the home organizations
(Clark et al. 2012; Berelowitz et al. 2013; MSI 2012).
Phase Four: Evaluation and On-going Implementation: Organizations collect data and evaluate the pilot
replications; provide feedback to the replication team; incorporate new ideas and evaluation results to
the replication sites; initiate the roll-out to new sites if necessary (Clark et al. 2012; Berelowitz et al.
2013;
Different authors and development institutions (non-profits and consulting firms) propose more
detailed processes and steps for the replication and/or scaling a social program that can be useful when
an organization plan its replication strategy. One of these approaches is developed by the Management
Systems International (MSI, 2012), which proposed three steps and ten tasks for effective replication.
Step One: Developing a
Scaling Up Plan
Step Two: Establish the Pre-
Conditions for Scaling Up
Step Three: Implement the
Scaling Up process
Task 1: Creating a Vision
Task 2: Assess Scalability
Task 3: Fill Information Gaps
Task 4: Prepare a Scaling Up
Plan
Task 5: Legitimize Change
Task 6: Build a Constituency
Task 7: Realign and Mobilize
Resources
Task 8: Modify Organizational
Structures
Task 9: Coordinate Action Task
10: Track Performance and
Maintain Momentum
Source: Management Systems International. 2012. Scaling Up – From Vision to Large-Scale Change. A management framework for practitioner. Second Edition, 2012
4. Success Factors for the Replication
Success of a program replication depends on different factors starting from the design and validation of
the business model to the proper site selection. Different authors focus on different aspects of the
replication process to ensure its successes. Dee et al. (2002) argues that an organization should work on
five “R’s” to successfully replicate its program: Readiness, Resources, Receptivity, Risk and Return. This
F-13
part of the paper summarizes discussions on good practices utilized by different organizations for the
replication and/or scaling of their programs.
a. Validated Business Model and Institutional Readiness of the Home Organization. An
organization needs to clearly define core elements of the program to be replicated, understand
the difference between variable and invariable elements of the program and ensure that the
proposed model will still produce a successful program in the new site (Bradach 2003;
Summerville and Raley 2009). In addition to the validated business model, an organization
should ensure that all administrative, legal and operational systems and procedures are in place
before initiating the replication (Racine 2004; Dees
et al. 2002; Bridgespan Group 2005). Based on the defined business model and institutional
readiness, an organization should identify the best replication models and strategy that will
yield a successful replication in new sites.
b. Home Organization’s Role and Responsibilities: This topic extensively discussed in the literature,
especially for the “branch”, “wholly-owned”, “social franchise” models of the replication. The
Home Organization’s (HO) responsibilities include:
I. Back-office support and management: including advice on management and
government and other operational issues (Campbell et al. 2008; Detgen and Alfred
2011). Summerville and Raley (2009) believe that an organization needs at least three
full-time employees to successfully implementation a replication program. These
positions are “(1) an expert who is dedicated to beginning partnership and positioning
the program; (2) a staff person assigned to training and technical assistance; and (3) a
data analyst who helps program collect and interpret data.”
II. Fundraising: raising funds for local activities, providing initial seed funding; identifying
an efficient way for the flow of funds between the home organization and new sites
(Campbell et al. 2008). A study conducted by Berelowitz et al. (2013) using data from
63 organizations reported that 50% of organizations considered access to finance as an
issue for replicating their program.
F-14
III. Technical and program support: developing and providing program materials, including
manuals and case studies; ensuring the proper data collection, monitoring and
evaluation (Curtis 2001).
IV. Staff Development: Identifying, hiring and training new staff members; introducing
mentorship program between the staff members of the home organization and new
sites/branch or local partners (Summerville and Raley 2009; Curtis 2001).
V. Leadership Support and Commitment: HO’s leadership, including Board should allocate
sufficient time and resources to demonstrate leadership support for the program
replication, especially during the initial stage of the new site selection and launch
(Yoder and James, 2006; Summerville and Raley 2009; Berelowitz et al. 2013). Thus, it is
important to engage and educate the leadership, especially the Board about its role
and responsibilities from the outset. As Campbell et al. (2008) argues “the demand for
resources and leadership attention associated with getting new sites up and running
smoothly can put extraordinary pressure on the existing organization and threaten
quality at the home site.” Experience of several organizations indicates that founding
leaders and staff members might have difficulties leading the transition and expansion
of an organization (Berelowitz et al. 2013; Racine 2003). The role of board and
leadership in replication process and the impact of the replication to the quality of the
programs in original sites need further research to provide sufficient data about the (1)
new and changing role of leadership, especially in relation to the new
“branches” and “communities” and (2) quality of the program in the original sites.
c. Flexibility and Adaptability of the Replication Model: It is important to understand that the HO
might need to modify its replication model to accommodate the local reality and meet the
needs of the local communities and/or partners (Detgen and Alfred 2001; Racine 2004). Being
too rigid with the selection criteria and trying to completely copy the home organization model
can potentially create damage the replication process. If this flexibility and modifications do not
jeopardize the integrity and invariable/hard elements of the program, home organization should
demonstrate flexibility in the replication model (RPS 1994). This need for flexibility is widely
F-15
discussed in the literature under two concepts: replication vs. adaptation duality (Racine 2003)
and exploration vs. exploitation dilemma (March 1991; Winter and Szulanski 2001). Racine
(2001) argues that building balance of “local adaptation with the presentation of key standards
and essence of the proposed program” is crucial for any replication program.
Explorationexploitation dilemma (March 1991 cited in the Winter and Szulanski 2001) examines
the balance between the advantages of “precision” and “learning and adaptation”.
d. Fundraising: Establishing reliable financial sources for the replication activities, including local
funding and securing adequate funding over sufficient time (ideally a minimum of 36 months)
are key factors under this category (Bradach 2003; Curtis 2001). One of the key success factors
for the “After School Matters” program was its strategy to diversify the funding sources to avoid
program’s dependence from the government funds (Bridgespan Corporation 2005). In working
on the fundraising strategies for replication sites, it is important to understand that some
funding institutions prefer not to finance non-programmatic expenses of the home
organizations (Bradach 2003).
e. Data Tracking, Quality Control and Evaluation: Introducing a system to collect performance data
from the early stage; allocating sufficient human resources for the quality assurance, data
collection and monitoring work; instituting a site monitoring tools; evaluating the replication
program at the pilot sites can increase credibility of the replication program in leveraging new
resources and further expansion nationally (Bridgespan Group, 2005; Curtis 2001; Campbell et
al.2008).
f. Communication Strategies and Network: Establishing effective communication strategies and
network among the HO and new sites for mutual learning, support and capacity building is
important for the success of the replication program at the early stage (Summerville and Raley
2009). The role of effective communication between the home organization and stakeholders in
new sites and networking among replication sites requires further research to understand
effective communication tools for successful replication
F-16
g. Site Selection: Selecting the right sites and regions for the program replication is the key for the
success of the replication. This section of the paper focuses on literature related
to three interrelated components of the site selection process, which can also impact the
business model, fundraising strategy and general home organization’s role in the process. It is
essential to establish comprehensive and effective selection criteria for the identification of a
location and avoid choosing purely on the basis of (1) analysis; or (2) donor direction; or (3)
requests of other organizations in the sites (Campbell et al. 2008). In addition, the HO should
ensure that there is a certain level of receptivity in the local community. Understanding cultural
diversity and local needs of the community will positively contribute to the receptivity of the
community (Oudenhoven and Wazir 1998). Dees et al. (2002) emphasizes three important
elements for the receptivity of the local community:
“demand – willingness of key stakeholders to invest in bringing an innovation to their
communities; comparability - degree to which target communities offer operating
conditions similar to those that contributed to success in the original community; and
openness - willingness of individuals and institutions in the target communities to accept
people and ideas from the outside.”
I. Geographic Location. Selecting a geographic location for the replication requires in-
depth analysis of the demographics, school system and local governance structure to
ensure that the new region has similar physical and social environment with the
original site. However, the HO should be careful not to be too rigid about these criteria
as this can results in excluding some potentially successful locations (Campbell et al.
2008).
II. Local Leaders and Champions: The literature on the replication strategies emphasizes
local leadership and identification of a committed and wellconnected champion who
understands the program and local context as one of the most important factor the
success of the replication in new sites
F-17
(Summerville and Raley 2008; Campbell et al. 2009; Curtis 2001; Bridgespan Group
2004; Bradach 2003). Some non-profit organizations that successfully replicated their
program (Citizens Schools Program) placed leadership as the number one criteria for
expansion (Bridgespan Group 2004). These organizations would not open a new site
(Youth Villages programs) if they could not find an experienced leader who worked in
one of existing projects/programs of the organization (Campbell et al. 2008). Other
good practices used by different organizations (Manchester Bidwell Corporation, Boys
Town, etc.) included (1) bringing the leaders from new sites to the HO to spend quality
time with the experienced staff members and understand the organizational culture
(Bridgespan Group 2004) and (2) empowering staff members and leadership with
systematic and on-going training programs and technical assistance (Summerville and
Raley 1998; Bradach 2003; Curtis 2001; Oudenhoven and Wazir 1998).
III. Local Partner Organizations: Organizations might take different approaches to local
partnership depending on replication model/strategy (branch office, social franchise,
partnership, concept, dissemination, etc.) they are planning to pursue in new sites.
Identifying local community organizations and/or networks that can support the
replication process with resources, technical advice and information can play a central
role in facilitating the replication work (Bradach 2003;
Bridgespan Group 2005; Summerville and Raley 1998). For example, Citizens School and
Jumpstart used existing networks (YMCA and university presidents respectively) to
quickly reach a larger group of beneficiaries (Bradach 2003). This kinds of collaborative
work can also lower the cost of replication (Clark et al. 2012). However, finding a right
local partner with similar visions and commitment to work on replication in the
community is considered a challenge by many organizations (Berelowitz et al. 2013;
Summerville and Raley 1998). It is also crucial to clarify the decision-making related role
and responsibilities of a home organization and new sites (Campbell et al. 2008) to
avoid any potential conflict during the implementation of the program. A study of 20
youth-serving organizations by Bridgespan Group (2005) discovered that “finding the
right balance between local autonomy and central control was a recurring challenge”
F-18
for many replicating organizations. In addition to local partner organizations, successful
partnership with local schools, parents, and local government institutions is considered
an important factor for the success of the replication program (Oudenhoven and Wazir
1998). However, the current literature on youth-serving educational programs is lacking
data on parents and local governments’ engagement and attitude to the new programs
and replicating organizations in their communities. Better understanding the ways and
roles local governments and parents can be engaged into the process as key
stakeholders and as a supportive role might help to build better local ownership for the
replication program in a new site.
Bibliography
1. Racine D. 1998. Replicating Programs in Social Markets. Replication and Program Strategies, Inc.
2. Jowett A. and Dyer C. 2012. Scaling-up successfully: Pathways to replication for educational NGOs.
International Journal of Educational Development. 2012 Elsevier Ltd.
3. Nine steps for developing a scaling-up strategy. World Health Organization. ExpandNet.
2010.
4. Summerville G. and Raley B.. 2009. Laying a Solid Foundation. Strategies for Effective Program
Replication. Public/Private Ventures 2009.
5. Fleisch H., Ahlert D., Ahlert M., Hai Van Doung Dinh, Heußler T. , Kilee L., Meuter J. 2008.
Social Franchising: a way of systematic replication to increase social impact, Berlin: Bundesverband
Deuscher Stiftung
6. Jowett A. 2010. Paths to Scaling-up through Replication: An Educational Perspective. POLIS Journal
Vol.4, Winter 2010
7. Hartmann A. and Linn J.F. 2008. Scaling Up: A framework and lessons for development effectiveness
from literature and practice.; Wolfensohn Center for Development; Working
Paper 5/October 2008
F-19
8. Oudenhoven N. and Wazir R. 1998.Replicating Social Programmes Approaches, Strategies and
Conceptual Issues. 1998. UNESCO Discussion Paper Series – No.18 (Management of Social
Transformations).
9. Bridgespan Group. 2005. After School Matters: Managing local rapid expansion as a young
organization.
10. Bridgespan Group. 2005. The Steppingstone Foundation: Expanding to new geographies while
maintaining high-quality results.
11. Bridgespan Group. 2004. Citizens School. Creating a strong program locally as a basis for national
expansion.
12. Edwards M. and Hulm D.. 1992. Scaling up NGO impact on development: learning from experience.
13. Bradach J. 2003. Going to Scale: the challenge of replicating social programs... Stanford Social
Innovation Review, Spring 2003
14. Management Systems International. 2012. Scaling Up – From Vision to Large-Scale Change.
A management framework for practitioner. Management Systems International. Second Edition,
2012
15. Grantmakers for Effective Organizations. 2011. Scaling What Works. What do we mean by scaling?
Briefing Paper 1.
16. Curtis L. 2001. Lessons from the Street: Capacity Building and Replication. Journal of Nonprofit
Management. Volume 5. Number 1. Summer 2001.
17. Creech H. 2008. Scale Up and Replication for social and environmental enterprises. The SEED
Initiative.
18. Berelowitz D., Richardson M. and Towner M. 2013. Realizing the Potential for Social Replication.
Research for Big Lottery Fund by the International Center for Social Franchising.
September 2013.
19. Davies A. & Simon J. 2013. How to grow social innovation: A review and critique of scaling and
diffusion for understanding the growth of social innovation. Paper prepared for the 5th International
Social Innovation Research Conference, 2-4 September 2013, Oxford, The Young Foundation.
F-20
20. Racine D. 2003. Dissolving Dualities: The case of commonsense replication. Nonprofit and Voluntary
Sector Quarterly 2003 32: 307
21. Sidney G. Winter, Gabriel Szulanski. 2001. Replication as Strategy. Organization Science 12(6):730-
743.
22. Clark C.H. Massarskly C.W. Raben T. S. Worsham E. 2012. Scaling Social Impact. A literature toolkit
for funders. Growth Philanthropy Network and Duke University
23. Dees G., Anderson B. and Wei-Shillern J. 2002. Pathways to Social Impact: Strategies for Scaling Out
Success Social Innovations. CASE, Duke University August 2002.
24. Racine D. 2000. Investing in What Works. Replication and Program Strategies. November 2000.
25. Racine D. 2004. Capturing the Essential Elements. Public/Private Ventures.
26. Detgen A. Alfred C. 2011. Replication of a career academy model: the Georgia Central Educational
Center and four replication sites. Amy Detgen and Corinne Alfred. Institute of Educational Sciences.
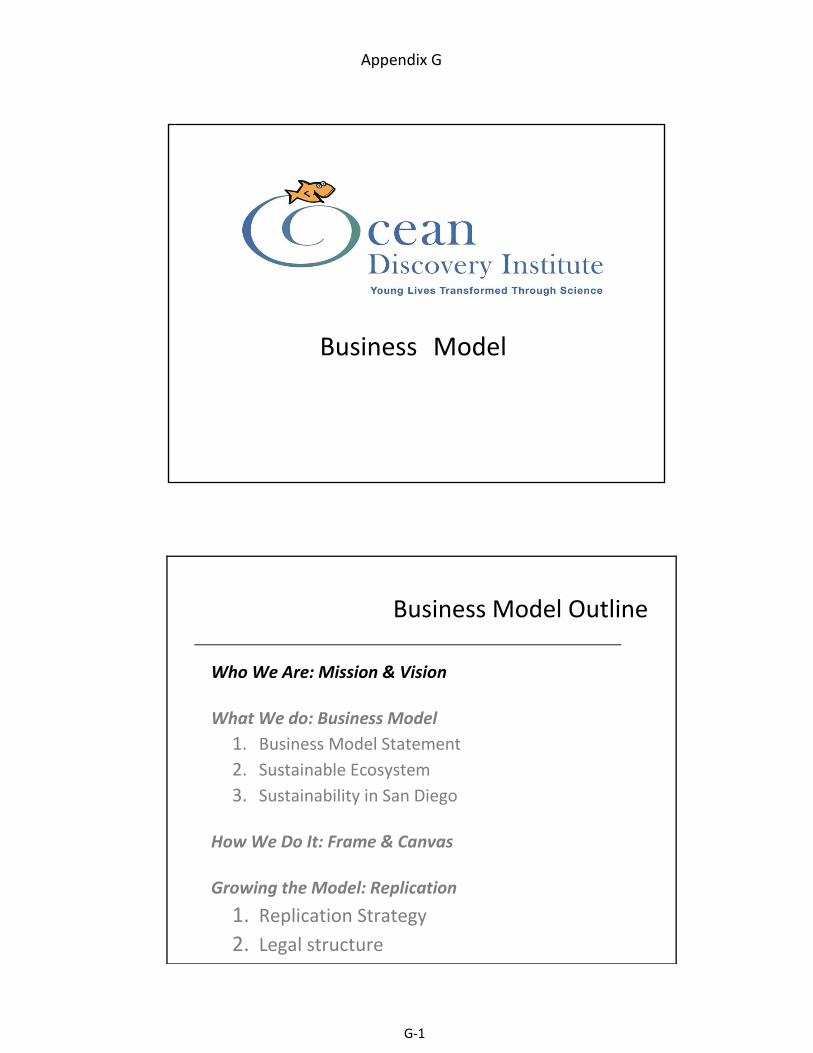
G‐1
Appendix G
Business Model Outline
Who We Are: Mission & Vision
What We do: Business Model
1. Business Model Statement
2. Sustainable Ecosystem
3. Sustainability in San Diego
How We Do It: Frame & Canvas
Growing the Model: Replication
1. Replication Strategy
2. Legal structure
Business
Model
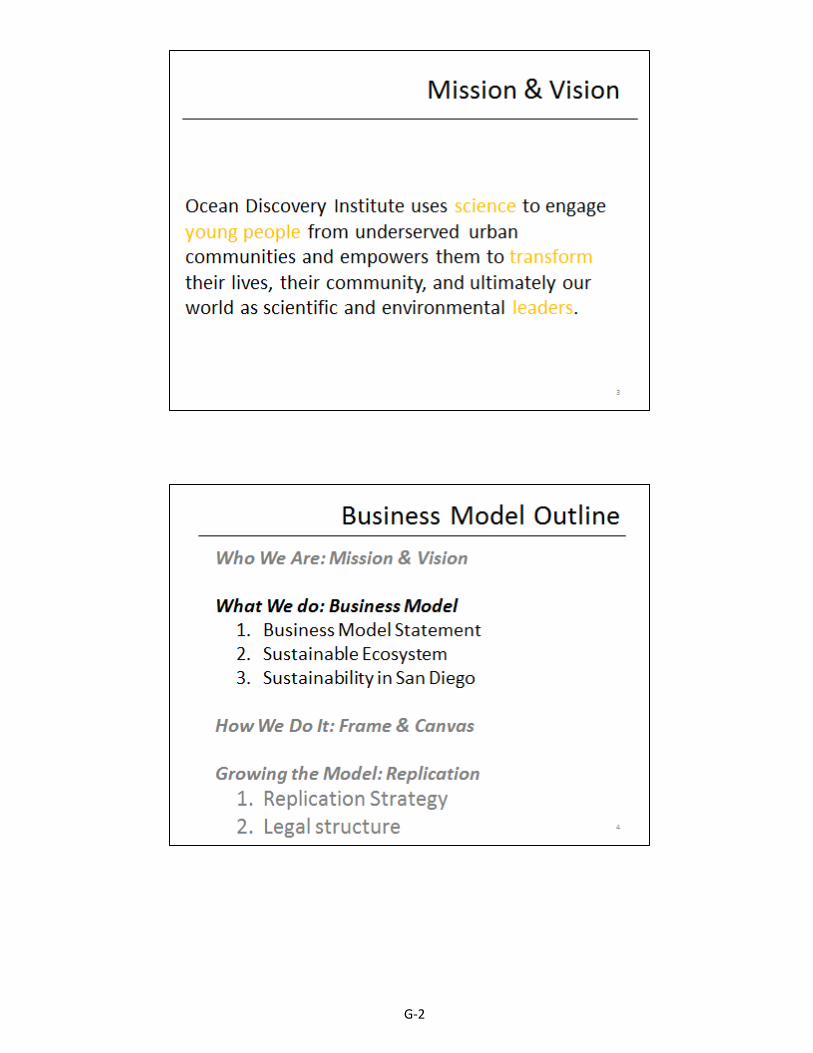
G‐2

G‐3
Business Model:
Business Model Statement
We empower young people, from strategically selected underserved urban communities, to transform their lives,
community, and world as science and conservation leaders. This
is achieved through providing consistent and continuous, tuitionfree science education across one school‐shed* at a time. This is
made possible by an engaged community and a highly diversified network of donors and investors, many of whom provide significant
unrestricted and recurring funding.
Figure: The figure on the next slide demonstrates this business model as a “sustainable ecosystem” where resources are sufficient to support growth and evolution.
*A school‐shed is defined as the area in which all of the young people “flow” into a
single high school.
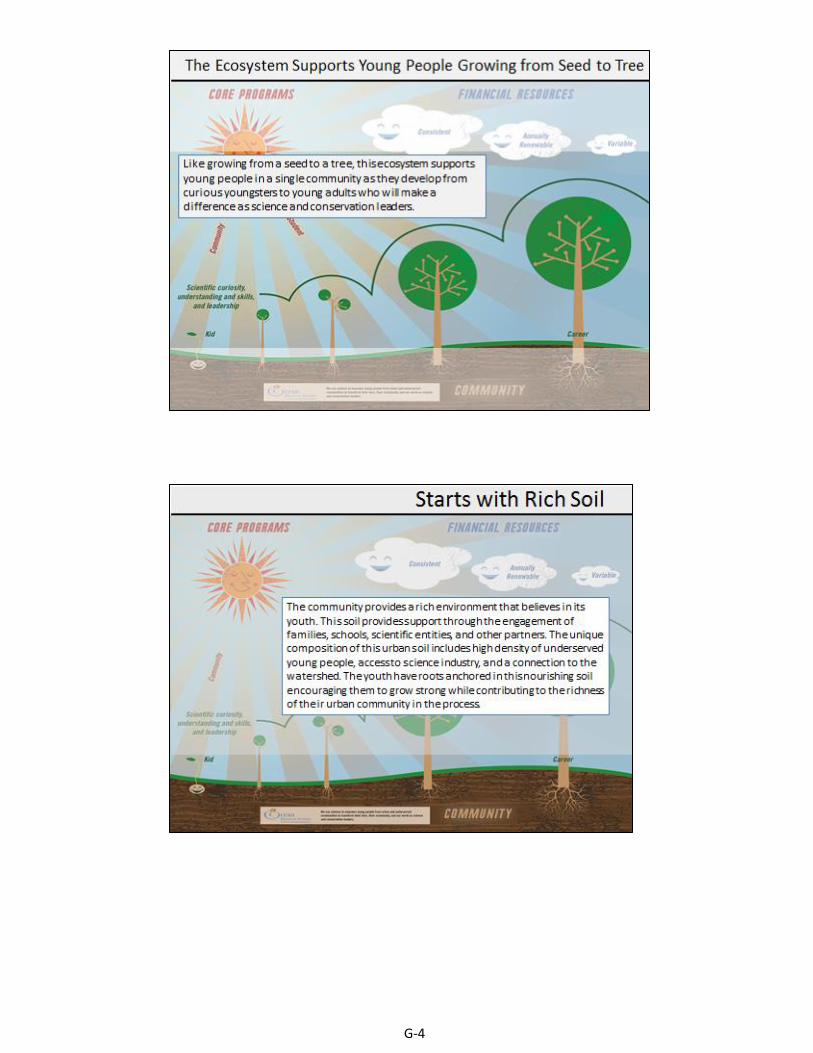
G‐4

G‐5
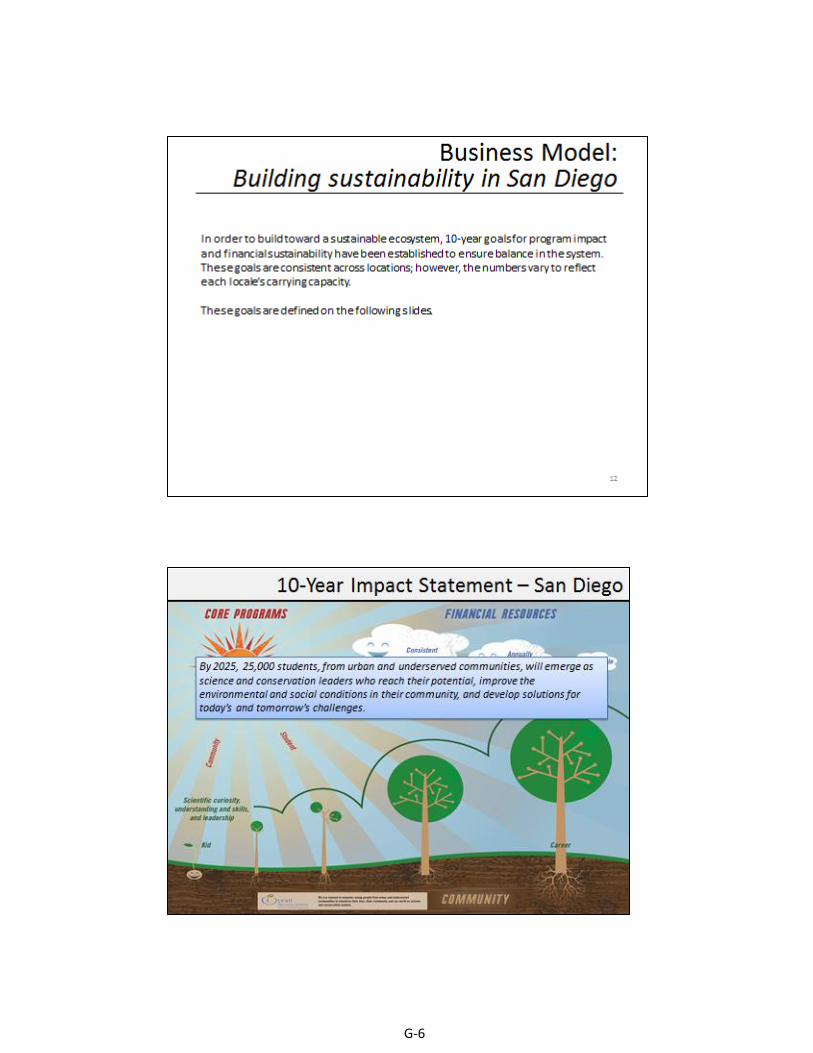
G‐6
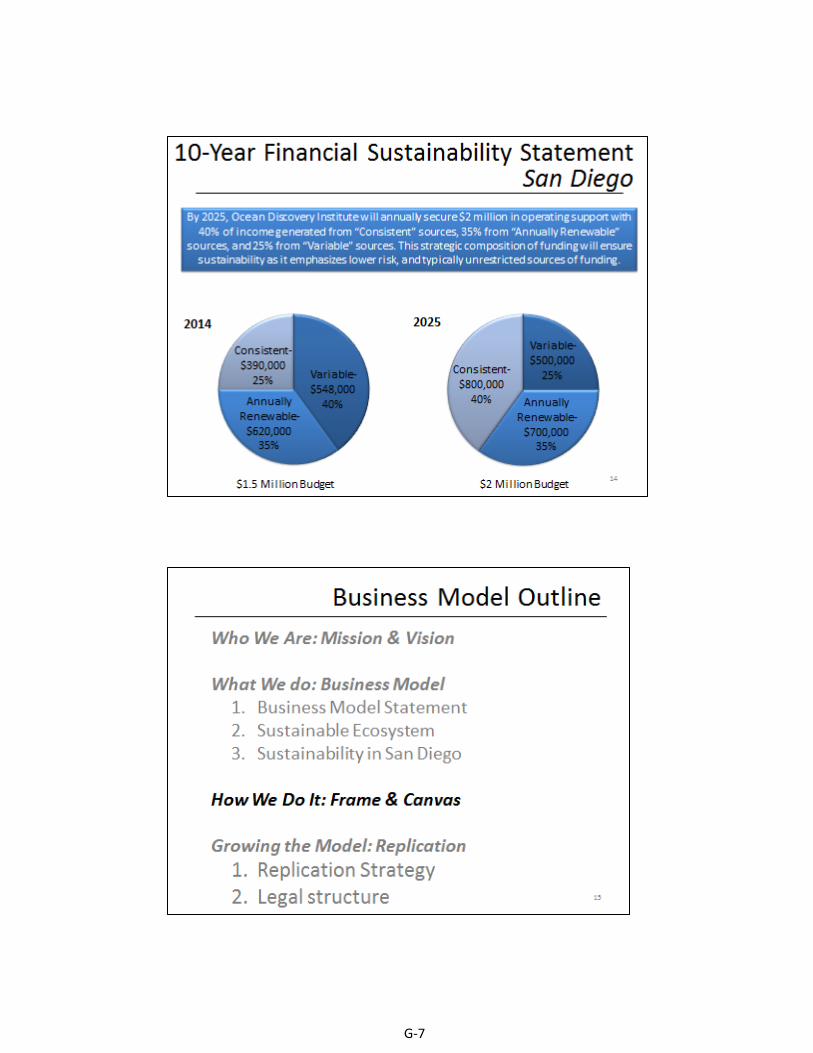
G‐7
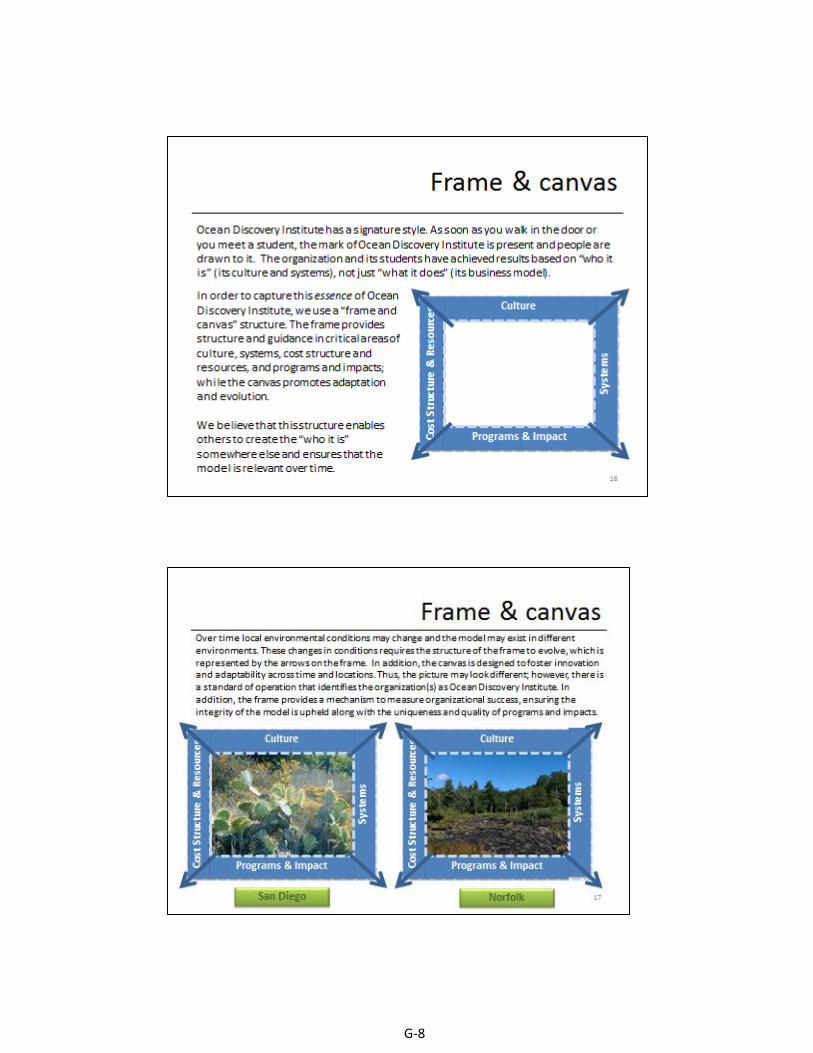
G‐8
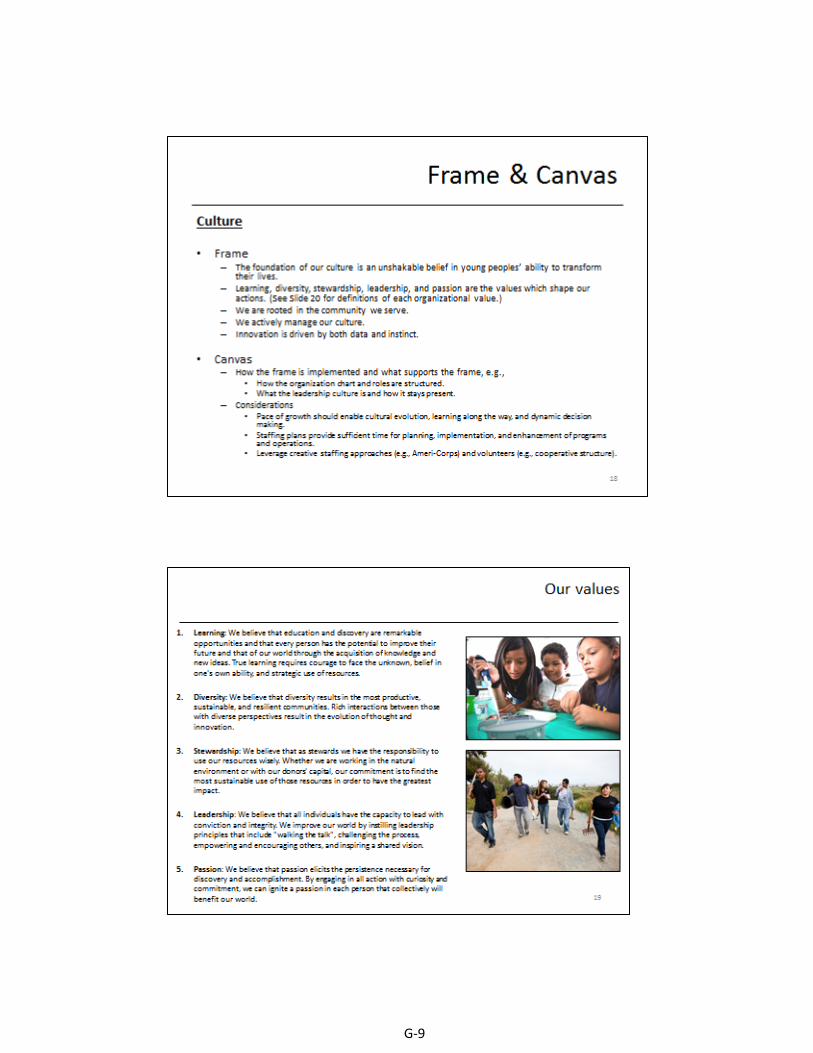
G‐9
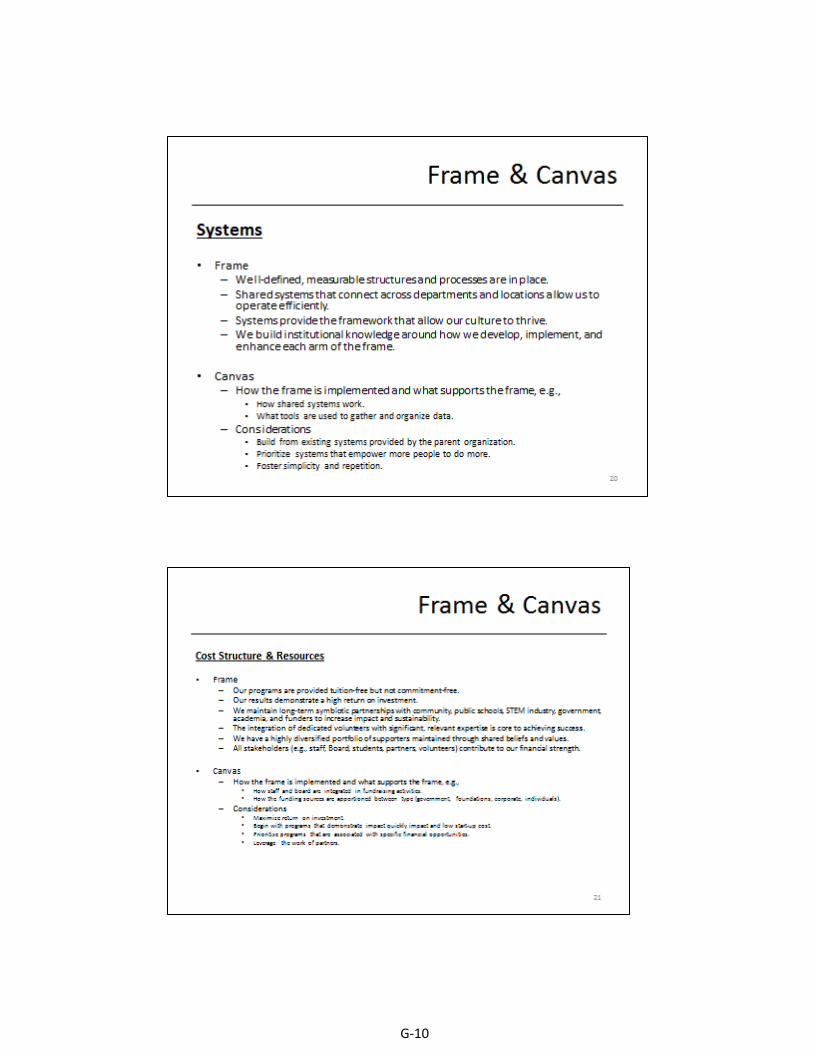
G‐10
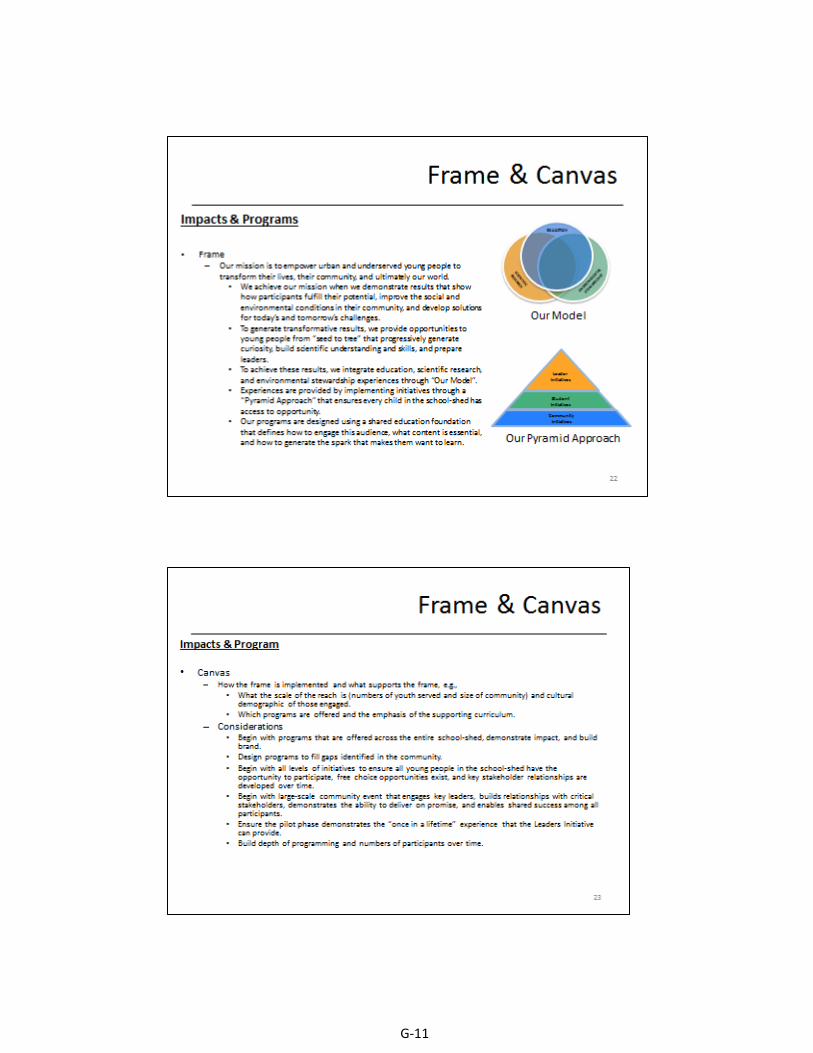
G‐11
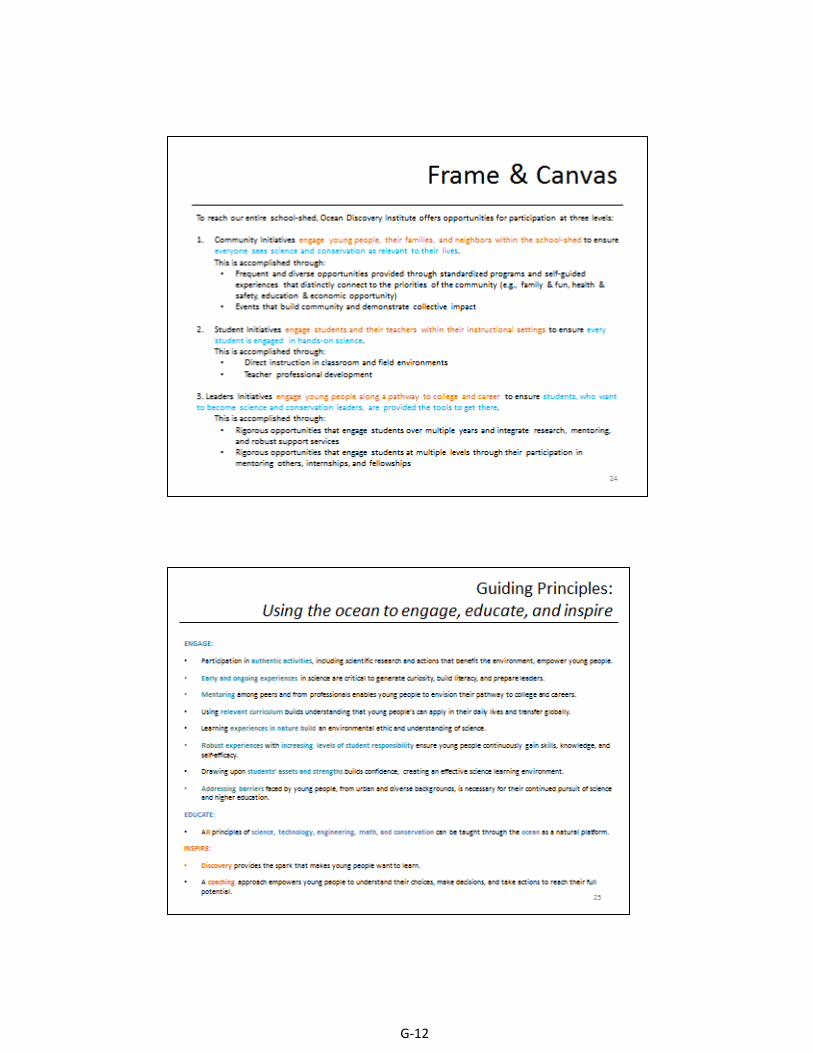
G‐12
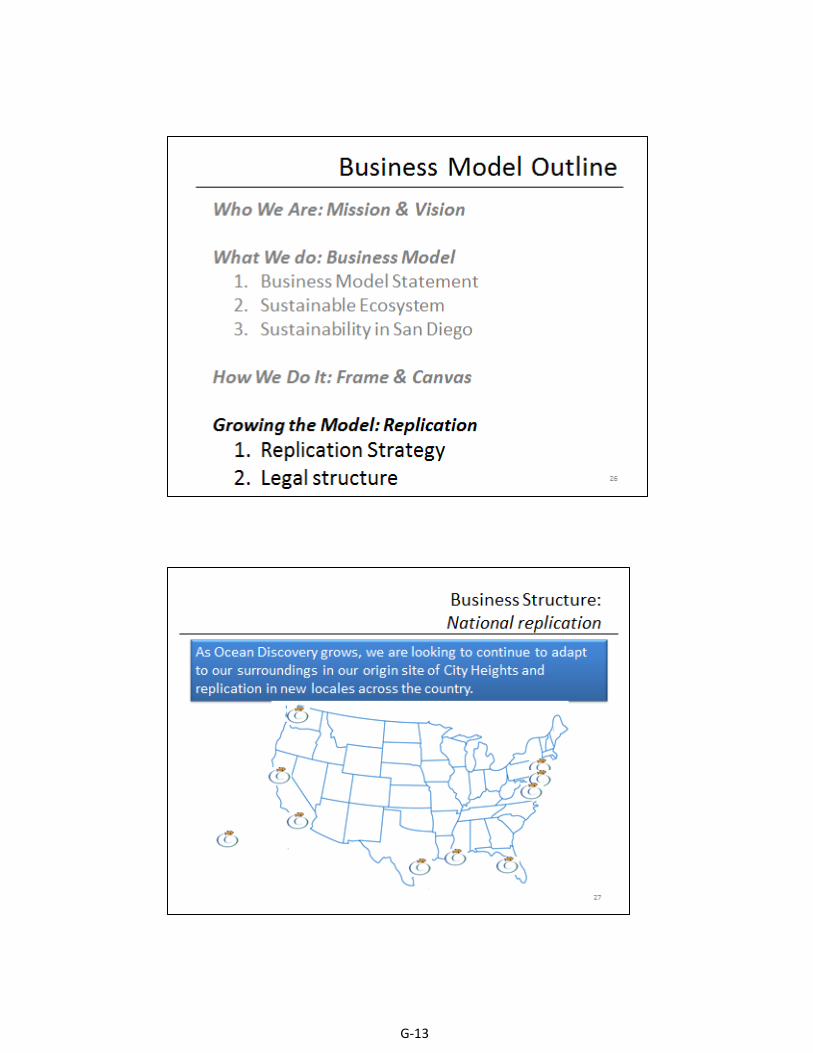
G‐13
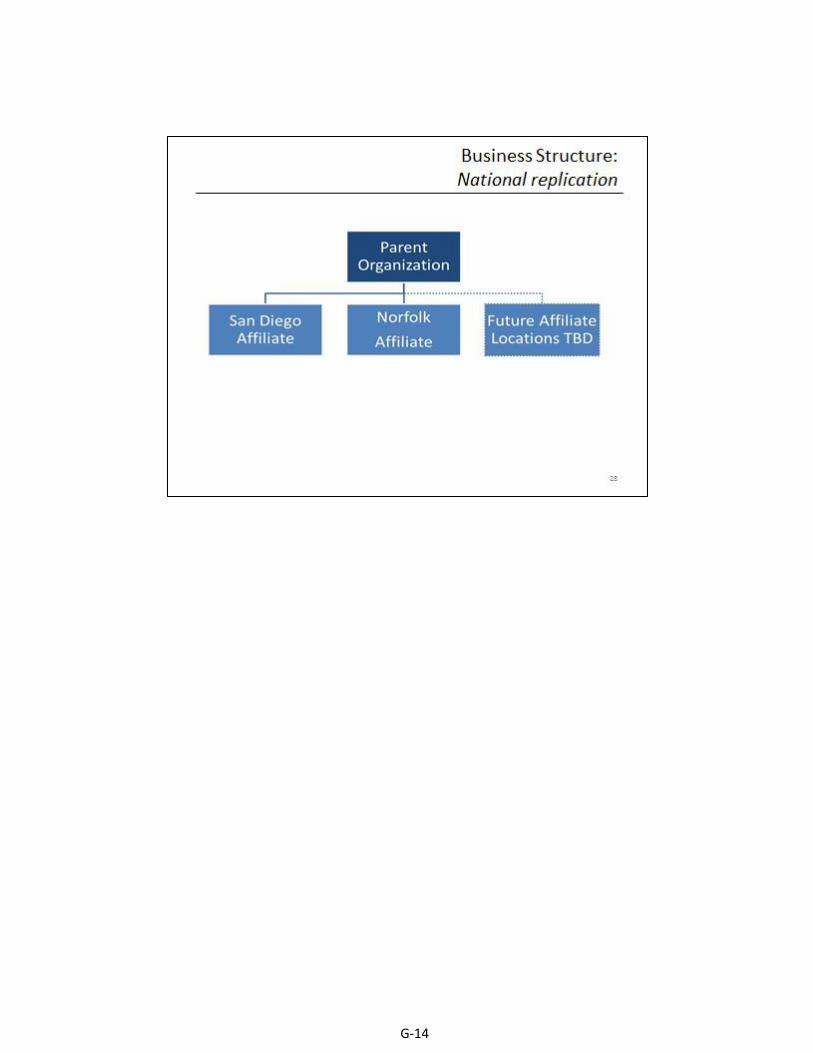
G‐14
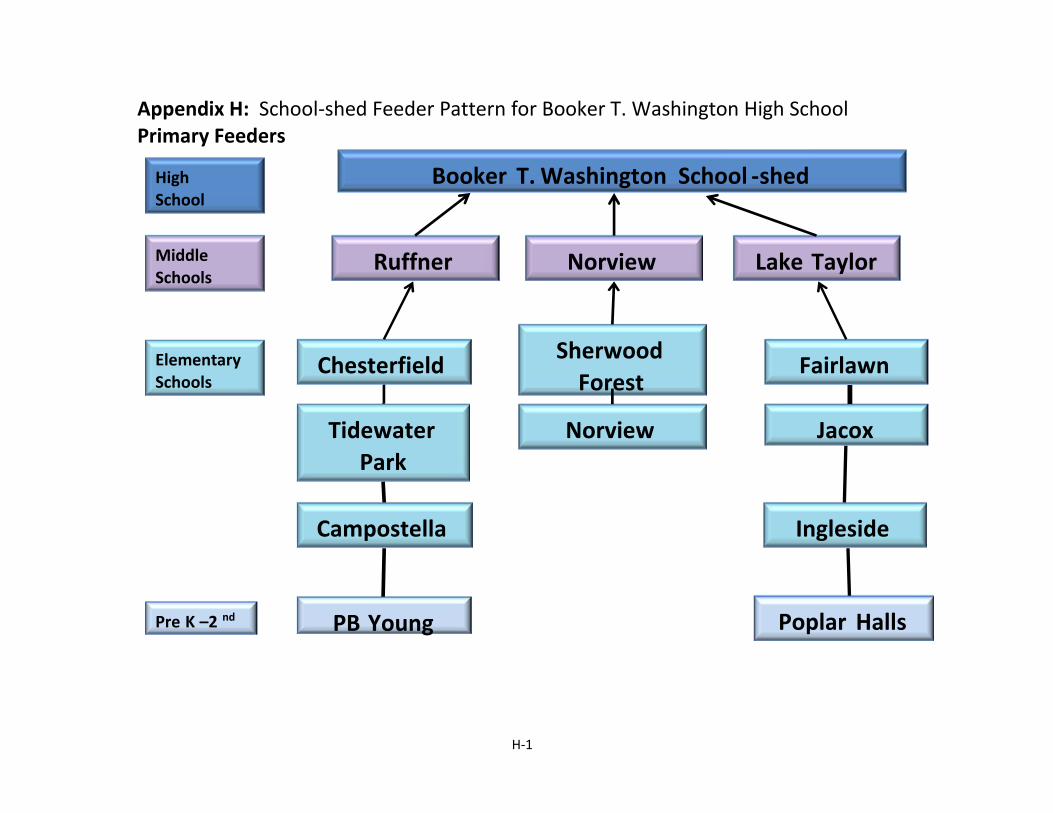
H-1
Appendix H: School‐shed Feeder Pattern for Booker T. Washington High School Primary Feeders
High
School
Middle
Schools
Elementary
Schools
Booker
T.
Washington
School ‐ shed
Ruffner Norview Lake
Taylor
Chesterfield
Tidewater
Park
Fairlawn
Jacox
Sherwood
Forest
Ingleside
PB
Young Poplar
Halls Pre K –2 nd
Norview
Campostella
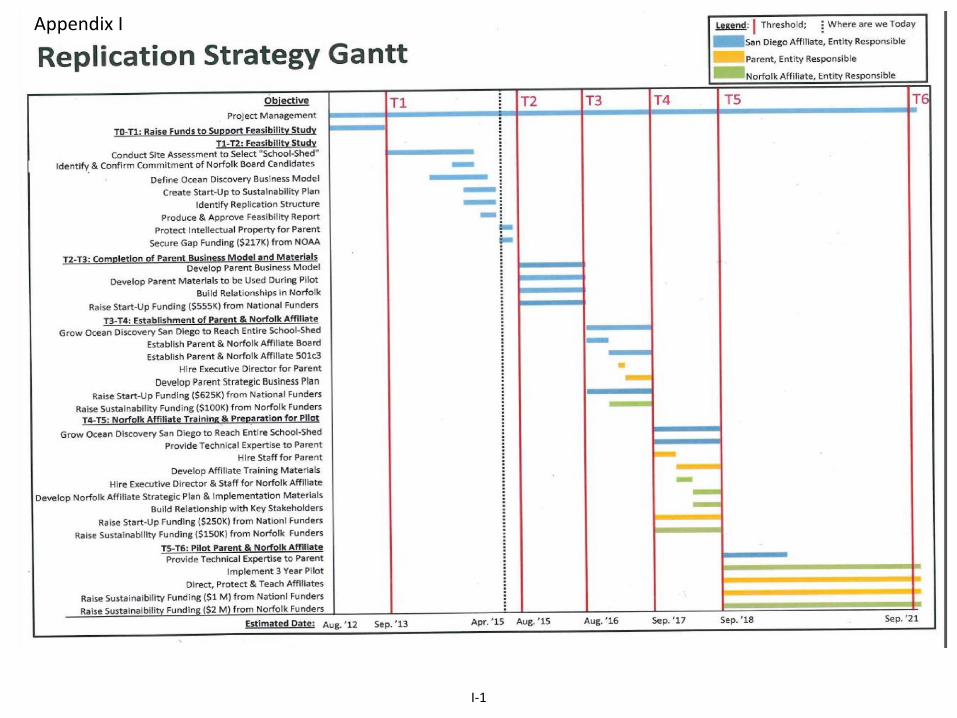
I-1
Appendix I
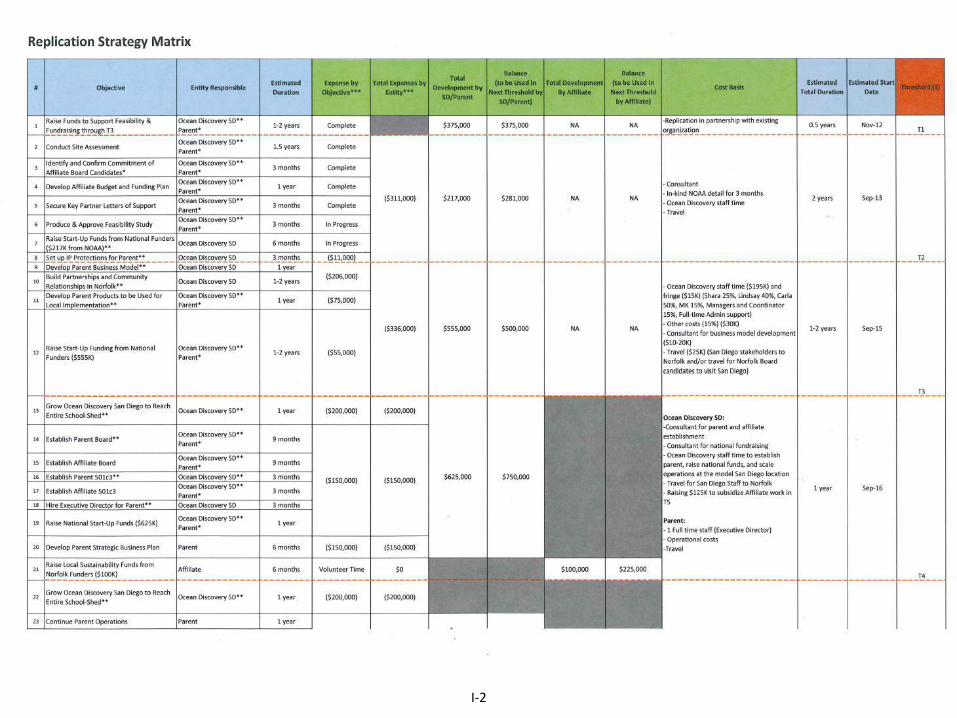
I-2
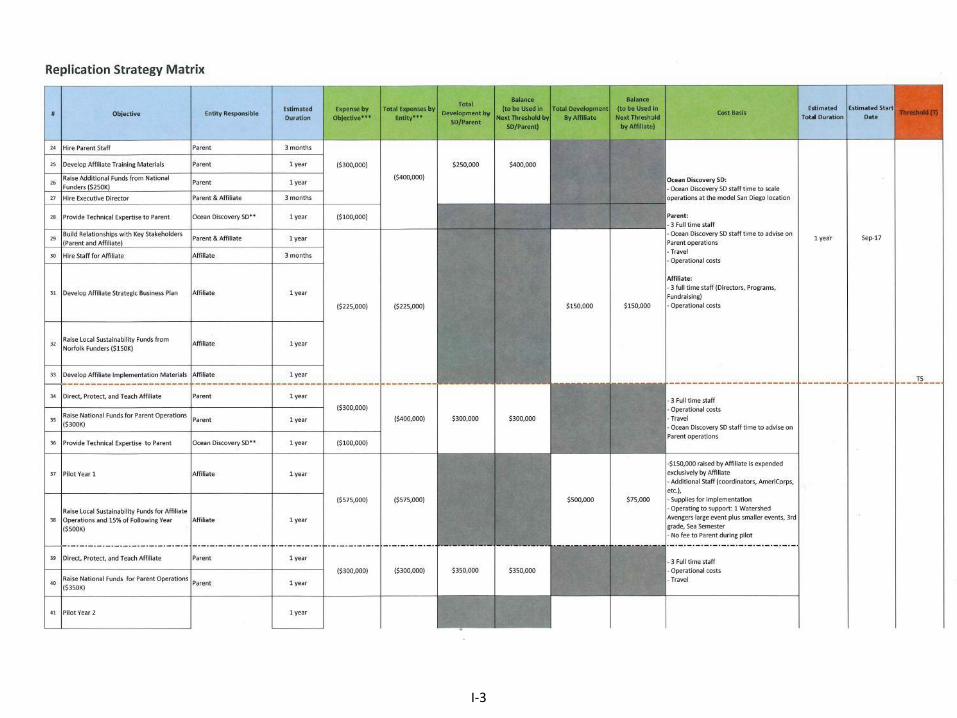
I-3
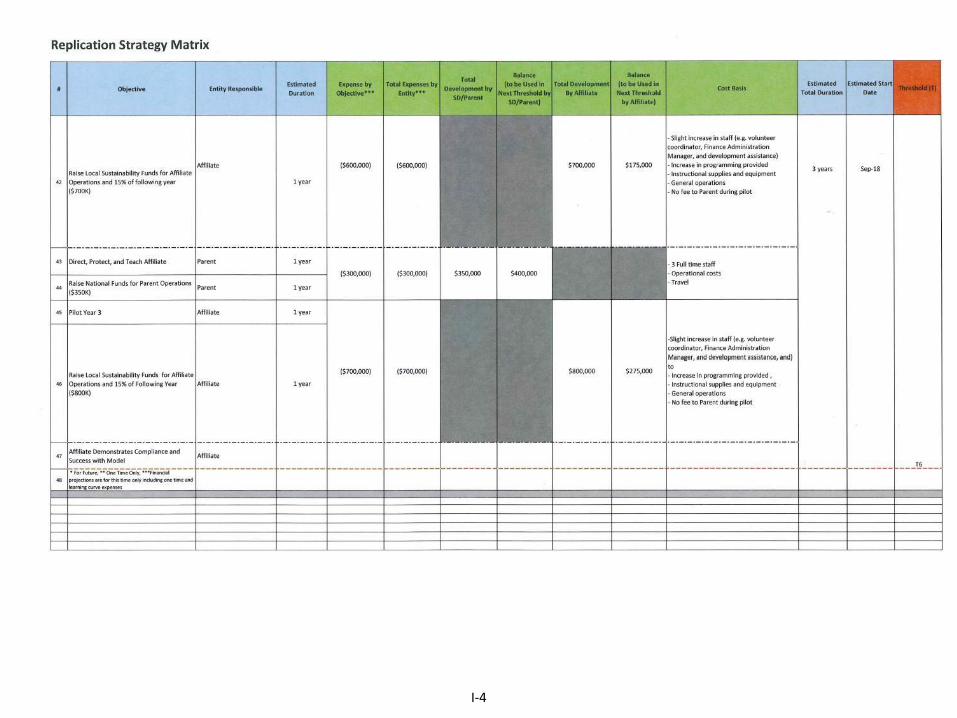
I-4
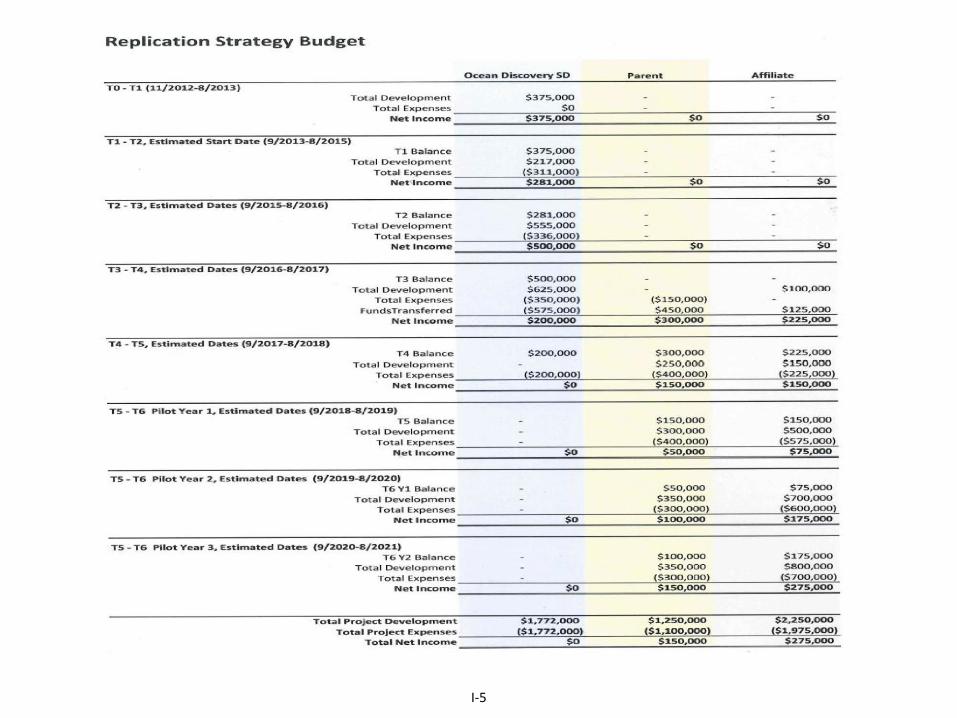
I-5

“REACHING STUDENTS IN THE CHESAPEAKE BAY REGION:
A Study on the Feasibility of Replicating Ocean Discovery Institute’s Model”
report completed in partnership between the NOAA Chesapeake Bay Watershed
Education and Training Program and Ocean Discovery Institute.
End