rea group annual report 2009
TRANSCRIPT

realestate.com.au Ltd
REA
Gro
up
An
nu
al Rep
ort 2009
ORGANICALLY GR WNREA GROUP ANNUAL REPORT 2009

Des
igne
d an
d pr
oduc
ed b
y H
aym
an D
esig
n
NOTES
Cert no. XXX-XXX-XXXX
Chairman’s letter 1CEO & MD’s letter 2Highlights 5Revenue & Operations 6
Australian Business Summary 9Overseas Business Summary 10REA People 15Financial Statements 16Corporate Information 80
CONTENTS
www.rea-group.com 1
CHAIRMAN’S LETTER
REA GROUP DELIVERS STRONG ORGANIC GROWTH IN FY09
Our strong balance sheet and operating cash fl ow have enabled the Company to pay shareholders a dividend of 10 cents per share on 16 October 2009 out of retained profi ts, as previously announced.
The dividend will be combined with a Dividend Reinvestment Plan (DRP), giving you the option to reinvest the dividend in return for new shares. These new REA shares will be issued at a 2.5% discount to the relevant volume weighted average market price to provide additional value to those shareholders who elect to participate.
In his fi rst year as REA Group CEO, Greg Ellis has built an experienced and world class executive team with a clear strategy for business growth and innovation which is fully supported by the Board.
On behalf of the Board I would like to thank Greg and the executive team at REA Group for their dedication and passion during the past year. The results of their exceptional work are detailed in this Annual Report.
Finally, I thank you for your ongoing support and commitment to the success of REA Group. We look forward to building on this success in 2010.
Richard J FreudensteinChairman
Dear shareholders,
This year has seen REA Group continue its great tradition of delivering strong fi nancial and operating results. Despite being a tumultuous economic period across the globe, REA Group has achieved very good growth in revenue, EBITDA and operating cash fl ow.
With challenges come opportunities and REA Group has seized upon the economic environment to increase its leadership in Australia and in key markets overseas where online property advertising is capturing a growing share of real estate marketing spend.
In 2009, core priorities for the Board and executive team were maintaining market leadership and growing and protecting shareholder value.
In line with this prudent approach to REA Group’s operations and growth, we have taken steps to exit unprofi table and non-core businesses. While the associated impairment costs signifi cantly impacted 2009 NPAT, these are one-off costs which will help drive long-term shareholder value by focusing the Company on core businesses.
On behalf of the Board of Directors, Executive and the REA Group team, I am proud to share with you our key achievements:
Revenue from continuing operations up 26% to $167.8 million•
EBITDA increased by 34% to $62.3 million•
Cash from operations increased by 100% to $31.8 million.•

2 REA Group Annual Report 2009
CEO & MANAGING DIRECTOR’S LETTER
Dear shareholders,
I am pleased to share with you the fi rst Annual Report during my tenure as CEO and Managing Director of REA Group.
Since joining the company in September 2008 I have undertaken a strategic review of the business and made extensive structural changes to help us realise our goal of profi table growth in markets where our position is strong and the market size and market dynamics are attractive.
This has resulted in greater focus on organic growth in our core Australian market and the highly attractive Italian market. It has also meant taking decisive action to divest under performing businesses in Australia and overseas.
Our 2009 results have seen very strong growth in Australia and Italy despite a turbulent economy and property industry. Today an estimated 95% of Australian real estate agents subscribe to our sites and our Italian business, casa.it, now outranks realestate.com.au in both the total number of real estate agent subscribers and the number of active listings.
The continued and increasing patronage of our sites by real estate agents and advertisers, as well as the millions of consumers around the world who visit our sites every month to fulfi ll their property needs, is testimony to the value we deliver.
While the online environment is a highly competitive one, REA Group has a clear innovation and growth strategy to ensure we continue to raise the bar and deliver valuable services to our target markets.
Our business is now focused on the future of online property advertising and I am confi dent we have the right team and the right strategy in place to continue our market leadership and growth.
I would like to thank our customers for the opportunity to work to enhance the value of both our businesses and our users for their continued support of our sites globally.
Finally my sincere thanks to the entire team at REA Group for their hard work, pride and enthusiasm for what we can achieve in the years ahead.
Greg EllisCEO & Managing Director
STRONG STRUCTURESUPPORTSSTRONG GROWTH

www.rea-group.com 3

4 REA Group Annual Report 2009

www.rea-group.com 5
Revenue from continuing operations up 26% to $167.8 million.•
EBITDA increased by 34% to $62.3 million.•
Cash from operations increased by 100% to $31.8 million.•
Company’s fi rst dividend of 10 cents per share to be paid on • 16 October 2009.
Commercial property business revenue in Australia grew • by 58% to $15.0 million.
Traffi c (unique browsers) to realestate.com.au increased • to 4.5 million (Nielsen) – more than double the traffi c of its nearest competitor.
Approximately 95% of Australian real estate agents now • subscribe to REA Group sites.
Italian site casa.it now has over 8,000 paying agents and • another 2,600 on trial subscriptions.
Businesses in the United Kingdom and United Arab Emirates were • divested during FY09 in order to focus on the Australian market and international markets where our market position is strong and the market size and market dynamics are attractive.
REA GROUP DEMONSTRATES THE POWER OF ORGANIC GROWTH IN CORE MARKETS.
HIGHLIGHTS
$167.8
REVENUE ($millions)
FY 05 06 07 08 09
33.4
54.9
89.4
133.6
$62.3
6.5
FY 05 06 07 08 09
EBITDA ($millions)
16
30.3
46.6
OPERATING CASH FLOW ($millions)
FY 05 06 07 08 09
$31.8
6.8
10.8
21.1
15.9

6 REA Group Annual Report 2009
REVENUE & OPERATIONS
FY2005 FY2006 FY2007 FY2008 FY2009 Growth
Revenues from Services * 33,416 54,921 89,402 133,562 167,795 26%
Operating Expenses (26,951) (38,910) (59,081) (86,929) (105,495) 21%
EBITDA 6,465 16,011 30,321 46,633 62,300 34%
EBITDA Margin 19% 29% 34% 35% 37%
Depreciation and Amortisation (1,051) (1,766) (4,230) (6,404) (7,348) 15%
Impairment of goodwill – – – – (6,141)
Impairment of intangibles – – – – (1,854)
EBIT 5,414 14,245 26,091 40,229 46,957 17%
Net Interest (Expense) / Income 206 (403) 461 (21) 344
Earnings Before Tax 5,620 13,842 26,552 40,208 47,301 18%
Income Tax (Expense) 2,472 (4,039) (7,535) (14,720) (18,598) 26%
Loss of discontinuing operations – (3,162) (8,028) (9,725) (63,341) 551%
Minority Interest (net of taxes) – 1,581 4,076 6,581 35,584 441%
Profi t attributed to members of parent 8,092 8,222 15,065 22,344 946 (96)%
Employees (FTE) excluding UK 159 238 409 537 526 (2)%
Employees (FTE) in UK – 56 70 130 79 (39)%
Subscribing Paying Agents excluding UK 6,414 7,806 12,961 16,341 18,879 16%
Subscribing Paying Agents in UK – 2,907 4,050 6,137 5,519 (10)%
* Excludes Interest Income
FIVE YEAR OVERVIEWFINANCIAL COMPARATIVE DATA IN $’000
WHO IS REA GROUP?REA Group owns and operates the leading real estate and commercial property advertising sites in Australia, including its fl agship site realestate.com.au, as well as international real estate property advertising sites such as the market-leading Italian site, casa.it.
Headquartered in Melbourne, Australia, REA Group aims to deliver effective online advertising solutions through its stable of sites to help real estate agents sell or rent properties and win new listings.
REA Group’s Australian businesses represent 90% of total Company revenue. These businesses continue to experience strong growth, despite economic and property sector volatility.
REA Group’s Italian business, casa.it, offers substantial growth potential as the Italian market for internet advertising is still at a relatively early stage.
REA Group’s business goal is profi table growth in markets where its position is strong and the market size and market dynamics are attractive. Continuous innovation and the delivery of a great user experience – for real estate agents, commercial clients, and house hunters alike – are the keys to achieving this goal.

www.rea-group.com 7

8 REA Group Annual Report 2009

www.rea-group.com 9
REA Group’s core business is in Australia where it operates the leading residential and commercial property advertising sites.
realestate.com.au continues its leadership in the Australian market with traffi c (unique browsers) to realestate.com.au increasing to 4.7 million (Nielsen) in June 2009, up from 4.1 million unique browsers in June 2008. The gap between realestate.com.au and its nearest competitor domain.com.au (#2 residential site in Australia) widened to 2.4 million, positioning realestate.com.au with more than twice the volume of traffi c to domain.com.au.
During FY09 realestate.com.au launched a mobile version of the site. By June 2009 the mobile version had over 163,000 unique browsers (Omniture), a 23% increase in traffi c since going live in April 2009. realestate.com.au also introduced new research features for consumers including comprehensive sale and auction data and online selling guides.
Developer advertising (home and land packages) on realestate.com.au increased by 43% or $6.0 million in 2009, due primarily to the popular First Home Owners Grant.
In recognition of the diffi cult economic times and subsequent impact on real estate agents REA Group froze residential subscriptions for 12 months from February 2009. This represented a signifi cant investment by the Company to assist the industry during diffi cult economic times.
realcommercial.com.au is Australia’s leading commercial property advertising site, with just under 300,000 unique browsers (Nielsen) and over 300,000 property listings in June 2009. Revenue grew by a record 58% to $15.0 million in FY09.
realholidays.com.au is REA Group’s holiday rental site which welcomed over 175,000 unique browsers (Nielsen) in June 2009. Aimed at the domestic short term holiday market, realholidays.com.au leverages the high volume of traffi c that passes through the realestate.com.au and realcommercial.com.au sites.
Media advertisingIncreased usage of our sites by consumers delivers greater reach and an enhanced value proposition for advertisers such as media companies or developers. In the 2009 fi nancial year, total media advertising revenue in Australia grew 16% to $36.2 million.
This year also saw the launch of reagroupmedia.com.au, a media centre site which has proven to be an insightful and valuable tool for those working in the media buying industry.
AUSTRALIAN BUSINESS SUMMARY
FROM STRENGTH TO STRENGTH
PAYING AGENTS IN AUSTRALIA
1m
2m
3m
4m
5m
6m
JUN 04 JUN 05 JUN 06 JUN 07 JUN 08 JUN 09
5.23m
JUN 04 JUN 05 JUN 06 JUN 07 JUN 08 JUN 09
$
200
400
600
800
1,000
1,200
$1,040
JUN 04 JUN 05 JUN 06 JUN 07 JUN 08 JUN 094,000
6,000
8,000
10,000
9,000
7,000
5,000
9,332
JUN 04 JUN 05 JUN 06 JUN 07 JUN 08 JUN 09
000s
300
400
500
600572,000
UNIQUE BROWSERS IN AUSTRALIA
AVERAGE MONTHLY REVENUE PER AGENT FOR AUSTRALIA LISTINGS IN AUSTRALIA

10 REA Group Annual Report 2009
OVERSEAS BUSINESS SUMMARY
ITALY RECORD RESULTSIN 2009
With a potential market of around 32,000 real estate agents in Italy, casa.it has succeeded in signing up 25% of agents to date.
In light of its focus on high potential international markets, casa.it has become the centerpiece of REA Group’s profi table growth strategy overseas and will benefi t from signifi cant enhancements including:
improved consumer experience and site features•
improved product offers for customers such as two classes of • subscriptions (standard and platinum) and three price points (small, regular, and unlimited listings); plus
automated monthly billing for customers.•
In July 2009, casa.it signed a strategic partnership with the Italian Real Estate Federation (FIAIP).
FIAIP is the leading real estate federation in Italy with more than 12,000 associated members. The partnership between casa.it and FIAIP has been developed to increase internet usage and awareness among associated real estate agents. The partnership will include training for real estate agents conducted by casa.it, workshops, and casa.it branding on all internet and web-marketing material associated with FIAIP.
casa.it set a new REA Group record with its 2009 growth results. It continued to lead the market in number of unique browsers and increased paying agents by 46% to 8,053, with an additional 2,682 agents on trial subscriptions. Historically, agents convert to paid subscriptions after a three month trial.
UNIQUE BROWSERS (millions)
JUN JUN JUN 07 08 09
JUN JUN JUN 07 08 09
1.4
0.80.7
JUN JUN JUN 07 08 09
8,053
3,511
5,514
PAYING AGENTS (number)
530
213
299
ACTIVE LISTINGS (000’s)

www.rea-group.com 11

12 REA Group Annual Report 2009
OVERSEAS BUSINESS SUMMARY (CONTINUED)
LUXEMBOURG AND OTHER COUNTRIES – CONTINUING TO BUILD SUCCESS
The Luxembourg business is profi table, with EBITDA margin increasing from 30% to 33% in FY09. REA Group site athome.lu continues to be the market leader in Luxembourg.
Elsewhere across Europe and Australasia REA Group continues to invest for growth.
From its base in Luxembourg, the atHome team also operates atHomeLorraine.fr and atHomeAlsace.fr in France, both strong players in their regions, and atHome.de in the Moselle region of Germany.
In Hong Kong, REA Group publishes the squarefoot.com.hk and Inside Discovery Bay magazines, leaders in their market niche, as well as a residential website targeting English speaking users which continues to attract increasing numbers of customers and consumers.
In New Zealand, REA Group operates the largest commercial property advertising site, realcommercial.co.nz.
REVIEW OF INTERNATIONAL PORTFOLIOFollowing a strategic review of its international portfolio of businesses, REA Group has divested a number of under performing businesses in order to focus on its market-leading businesses in Australia and Italy.
In the UK, three print publications were closed in May 2009, and in August 2009 REA Group successfully completed a share sale of the UK online business it jointly owned with News International Ltd.
In July 2009 REA Group entered an agreement to sell its 51% stake in its UAE business, propertyfi nder.ae. The sale was approved by local UAE regulatory authorities in September 2009.
Other smaller businesses that were sold or exited during this period are the Altowin business and Belgium presence, the residential business in New Zealand, and the Clarke Computers business (Trust accounting).
NURTURING OUR OTHEROVERSEAS BUSINESSES

www.rea-group.com 13

14 REA Group Annual Report 2009

www.rea-group.com 15
REA TEAM – RECOGNISED INDUSTRY EXPERTSREA staff are highly sought after as conference speakers and lecturers across Australia. In the past year, members of the team have spoken at many events including:
IT and Online MediaDubai Cityscape Conference presentation ‘Online Advertising – • The Power of the Internet to Reach Global Buyers’ (Scott Holmes, Group Display Advertising Manager)
Australian Direct Marketing Association • Search Marketing Seminar(Max Sim, Senior SEO Advisor)
Small Business Conference on “Use of the internet to Promote • your Business”(Henry Ruiz, GM Consumer Marketing)
Swinburne University Masters of IT, ‘Careers in IT’• (Daniel Oertli, CIO)
Swinburne University Masters of IT, hosted site visit to REA Group• (Andy Kelk, Lead Software Developer)
Real EstateCentury 21 Conference; and•
Adelaide Advertiser Real Estate Seminar• (Greg Ellis, CEO)
Laing and Simmons National Conference;•
L.J.Hooker Admirals National Conference;•
Northern England Agents Real Estate Seminar UK;•
Century 21 Account Managers Conference; and•
Young Agents Association NSW Seminar• (Bill Russell, Manager Industry Development)
Investor and FinanceCFO Magazine Master Class on Procurement• (Chris Dau, Financial Controller)
Macquarie Bank Investor Conference;•
Lodge Partners Growth Company conference; and•
ABN Morgan Conference• (Georg Chmiel, CFO)
Melbourne Business School, Executive MBA Class • on Mergers and Acquisitions(Andy Sheats, GM Strategy & Corporate Development
VOLUNTEERING AND CHARITABLE DONATIONSREA Group supports the involvement of staff in community work and offers all staff one volunteer day per year.
REA Group staff actively support the REACH Foundation, with 30 staff around Australia taking part in the REACH Heroes days and Leadership days. These days are part of REACH Foundation’s secondary school program which aims to make a positive difference in the lives of young people in our community. Team members have also provided professional assistance to REACH via event management, public relations, and program development support.
In 2009 REA Group staff also raised funds for the Cancer Council and the Red Cross, with donations matched dollar for dollar by the Company.
REA PEOPLE
GREAT RESULTS DON’T HAPPEN ALL BY THEMSELVES – IT TAKES A TEAM OF GREAT PEOPLE!
REA Group actively recruits smart, innovative and high performing people who have the passion to build and support its market leading products and sites.
16 REA Group Annual Report 2009
CONTENTS
Directors’ report 17
Auditor’s Independence Declaration 29
Corporate governance statement 30
Financial report
Income statements 36
Balance sheets 37
Statements of changes in equity 38
Cash fl ow statements 39
Notes to the fi nancial statements 40
Directors’ declaration 76
Independent auditor’s report 77
Shareholder information 79
Corporate information 80
FINANCIAL STATEMENTSFor the year ended 30 June 2009

www.rea-group.com 17
DIRECTORS’ REPORT
Your directors present their report on the consolidated entity (referred to hereafter as the Group) consisting of REA Group Limited and the entities it controlled at the end of, or during, the year ended 30 June 2009.
DirectorsThe following persons were directors of REA Group Limited during the fi nancial year and up to the date of this report:
Mr Richard J FreudensteinMr Roger AmosMs Kathleen ConlonMr Greg Ellis (appointed 23 September 2008)Mr John D McGrathMr Alasdair MacLeodMr Jeremy Philips (appointed 4 March 2009)Mr Stephen P RueMr Sam R WhiteMr Simon T Baker (Managing Director/CEO until 4 August 2008)
Principal activitiesThe Group’s principal activity during the year was the provision of online advertising services, which include:
(a) Online advertising of residential properties for sale and rent in multiple countries
(b) Online advertising of commercial properties for sale and lease in multiple countries
(c) Provision of online display advertising space for advertisers in various industries
(d) Provision of website development services to the real estate industry
(e) Software licensing of estate agent back offi ce solutions(f) Print publications to advertise properties for sale and rent(g) Other services
Dividends – REA Group LimitedSince the end of the fi nancial year the directors have recommended the payment of a fi nal ordinary dividend of $12.7 million (10 cents per fully paid share) to be paid on 16 October 2009 out of retained profi ts at 30 June 2009. The directors have also introduced a Dividend Reinvestment Plan which will allow shareholders to elect to re invest the dividend and receive fully paid ordinary REA shares at a 2.5% discount to the weighted average market price calculated over a nominated period.
Review of operationsDuring the year the Group successfully continued its organic growth in online real estate advertising. As at 30 June 2009, the Group operated 21 websites in ten countries, with most of the sites being ranked either fi rst or second in their respective markets.
The key priorities for the Group are:
(a) Execution of a clear strategy which centers around the focus on being the number 1 or number 2 player in every area of operations. As a result some businesses were closed or sold during FY09
(b) Increase in product and innovation rate across the businesses(c) Continued uplift of the skill base of staff(d) Investment in new information technology to further improve
user experience and agent satisfaction(e) Profi table growth
Performance IndicatorsManagement and the Board monitor the Group’s overall performance, from the implementation of its mission statement and strategic plan through to the performance of the company against operating plans and fi nancial budgets and forecasts. The Board, together with management, have identifi ed key performance indicators (KPI’s) that are used regularly to monitor performance.
Dynamics of the BusinessREA Group Limited primarily operates in the online real estate classifi ed advertising market for residential and commercial property.
The three key drivers of advertising revenue for the Group are:
The number of real estate offi ces within any particular market, • which determines the number of subscriptions purchased
The number of listings within any particular market, which • primarily determines the take up of additional advertising products
The number of visitors to the site, which determines the • effectiveness of the classifi ed advertising and determines the take up of display advertising revenue by developer and third party advertisers.
The underlying housing market is infl uenced by certain macro economic factors such as population growth, the unemployment rate, interest rates, international migration, regional population growth, GDP growth, annual house sales growth, and other factors.
Discontinued Operations – United KingdomIn November 2005, REA acquired a 50% stake in propertyfi nder.com, the then number four site in the United Kingdom. Since its acquisition, the combination of propertyfi nder and subsequently acquired sites have evolved to be in equal number two or three market position depending on the metrics used. Facing adverse market conditions, the group closed its print operations in April 2009. In May 2009, the Group commenced a review its UK operations which lead to the sale of the online operations on 7 August 2009. The UK operations are disclosed as discontinued operations in these accounts. Refer to note 9 for detailed disclosure.
www.rea-group.com 17

18 REA Group Annual Report 2009
DIRECTORS’ REPORT CONTINUED
Financial PerformanceOverall, FY09 was the best year in the history of the Group on a Revenue, EBITDA, and EBITDA margin basis. While in the past, growth was based on a combination of organic and acquisition, FY09 was based on organic growth only.
The Group’s core business of online advertising has shown strong resilience to the current global economic crisis. The relative robustness of the online business is a result of the product structure
(subscriptions with additional upgrade products) and the price and convenience of online advertising over print advertising.
During FY09, a number of businesses were reviewed and exited, such as the New Zealand residential business, the Belgium operations, and Clarke Computers (trust accounting software). The decision to review and exit the UK market has resulted in a separate disclosure of the UK business in the fi nancials for FY09 and the previous years.
Financial Comparative Datain $’000 FY 2005 FY 2006 FY 2007 FY 2008 FY 2009
Growth FY08
to FY09
Revenues from Services* 33,416 54,921 89,402 133,562) 167,795 26%
Operating Expenses (26,951) (38,910) (59,081) (86,929) (105,495) 21%
EBITDA 6,465 16,011 30,321 46,633 62,300 34%
EBITDA Margin 19% 29% 34% 35% 37%
Depreciation and Amortisation (1,051) (1,766) (4,230) (6,404) (7,348) 15%
Impairment of goodwil – – – – (6,141)
Impairment of intangibles – – – – (1,854)
EBIT 5,414 14,245 26,091 40,229 46,957 17%
Net Interest (Expense) / Income 206 (403) 461 (21) 344
Earnings Before Tax 5,620 13,842 26,552 40,208 47,301 18%
Income Tax benefi t / (Expense) 2,472 (4,039) (7,535) (14,720) (18,598) 26%
Loss from discontinuing operations – (3,162) (8,028) (9,725) (63,341) 551%
Minority Interest (net of taxes) – 1,581 4,076 6,581 35,584 441%
Profi t attrib. to members of parent 8,092 8,222 15,065 22,344 946 (96)%
Employees (FTE) excluding UK 159 238 409 537 526 (2)%
Employees (FTE) in UK – 56 70 130 79 (39)%
Subscribing Paying Agents excluding UK 6,414 7,806 12,961 16,341 18,879 16%
Subscribing Paying Agents in UK – 2,907 4,050 6,137 5,519 (10)%
*Excludes Interest Income
Key Financial HighlightsThe key fi nancial highlights for FY09 included:
Revenue from continuing operations of $167.8 million, up by 26 • per cent over the last fi nancial year.
Operating expenses from continuing operations of $105.5 million, • up by 21 per cent over the last fi nancial year. The key drivers of the increase in operating expenses are employee costs, consultants, technology costs and bad debt provisions. Due to the current economic climate, a review was undertaken to assess current and future business strategies. As a result of this review, staff numbers decreased from 667 as at June 2008 to 605 as at June 2009.
EBITDA from continuing operations of $62.3 million, up by 34 per •
cent over the last fi nancial year. The Group has increased its EBITDA margin from 35 per cent to 37 per cent. The Group’s cost base does not grow linearly during the year due to ‘one off’ transactions, the impact of changes to foreign exchange rates, and seasonality. This usually leads to a lower profi tability in the fi rst half year compared to the preceding second half year of the previous fi nancial year.
Property Listings across all sites increased to 1,609,573 listings as • at June 2009, up by 151,520 listings compared to June 2008.
Subscribing Paying Agents increased from 22,478 as at 30 June • 2008 to 24,398 as at 30 June 2009 mainly due to a strong increase in agent numbers in Italy.

www.rea-group.com 19
AustraliaThe Australian business is the key driver of value creation within the Group. It consists of 3 major business units. The leading residential advertising business (realestate.com.au), the leading commercial advertising business (realcommercial.com.au) and a strong display advertising business focusing on developers and third parties. The Australian business also encompasses a holiday rentals site (realholidays.com.au), a backoffi ce software business for realestate agents (HubOnline), a web design services business, and a majority share in the lead generation business (homeguru.com.au and ozhomevalue.com.au).
Australia
Online Advertising
Residential properties
realestate.com.auproperty.com.aurealholidays.com.auhomeguru.com.auozhomevalue.com.au
Commercial properties
realcommercial.com.au
Agent Solutions
Real estate agents
Hub OnlineWeb Design Services
The key highlights of the Australian business are:
The number of paying subscribing agents across all portals • increased to 9,332 as at 30 June 2009, up from 9,190 as at 30 June 2008 resulting in an estimated market penetration of approximately 95 percent of all agents. The agent numbers refl ect subscriptions of agents to one or more of the three portals within the Australian business (realestate.com.au, realcommercial.com.au, or realholidays.com.au).
Over FY09, all three portals experienced strong growth. The • commercial segment in particular saw revenues increase by 58% to $15,056k (2008: increase by 52% to $9,519k).
Additional advertising revenue represents 37 percent (compared • with 38 percent in FY08) of the overall revenue from residential agents. Additional advertising revenues represent mainly the sale of Agent banners, Feature properties, Guaranteed Top Spot (GTS), and eBrochures. These sales have increased by approximately 24 percent compared to the previous year. Subscription revenues have grown even faster by 25 percent, which marginally increased their share of the overall revenues from 62 percent to 63 percent. While a price freeze for residential subscriptions was announced during FY09, revenues grew through an increase in market penetration.
The competitive environment remains dynamic. The Group’s • strategy will continue to evolve to meet any challenges.
The Group operates across a number of countries. Key operational highlights on a country basis are as follows:
Country Revenue EBITDA Marginin $’000
FY 2009
Australia 149,651 83,484 56%
Italy 8,540 (3,691) (43)%
Luxembourg 4,304 1,441 33%
Other countries 5,300 (6,905) (130)%
Unallocated overhead – (12,029) -%
Total continued operations 167,795 62,300 37%
FY 2008
Australia 120,719 61,946 51%
Italy 5,401 (2,819) (52)%
Luxembourg 3,532 1,054 30%
Other countries 3,910 (3,601) (92)%
Loss of associate (homeguru.com.au) – (185) -%
Unallocated overhead – (9,762) -%
Total continued operations 133,562 46,633 35%

20 REA Group Annual Report 2009
DIRECTORS’ REPORT CONTINUED
Overseas Businesses
Overseas
Italy Online Advertising Residential Properties casa.it
Luxembourg Online Advertising Residential PropertiesCommercial Properties
athome.luatoffi ce.lu
Print Advertising Residential Properties athome magazineathome new homes
Other countries Online Advertising Residential Properties athomeAlsace.fr (France)athomeLorraine.fr (France)athome.be (Belgium)athome.de (Germany)squarefoot.com.hk (Hong Kong)propertyfi nder.ae (UAE)allglobalproperties.com
Commercial Properties realcommercial.co.nz
Print Advertising Residential Properties Squarefoot (Hong Kong) Inside Discovery Bay (Hong Kong)
Discontinued Operations United Kingdom
Online Advertising Residential Properties propertyfi nder.comhotproperty.co.ukukpropertyshop.co.uk
Print Advertising (until April 2009)
ItalySince February 2007, REA has acquired approximately 69 percent of casa.it with the remaining 31 percent owned by SKY Italia. casa.it is the leading residential real estate site in the Italian market. During the last year, REA has consolidated casa.it’s strong market position by further investing in sales and marketing.
casa.it has seen a signifi cant increase in agent numbers and now has the second highest number of subscribing agents in the group up from 5,514 paying agents in June 2008 to 8,053 in June 2009. In addition, 2,682 trial agents are now also using the site. In total, 10,735 agents were using the site in June 2009. Together with private listers, the agents have uploaded more active listings than are to be found on realestate.com.au. In June 2009, casa.it attracted 1.4 million unique visitors to the site (June 2008: 0.7 million), the highest traffi c number in the history of casa.it (Source: Omniture).
LuxembourgIn February 2007, REA acquired the atHome Group. The atHome Group comprised the number one sites in Luxembourg, athome.lu and atoffi ce.lu. The Luxembourg business has improved its EBITDA margins from 30 percent to 33 percent while further strengthening its dominant market position.
All other countriesIn addition to Luxembourg, the atHome Group has operations in the neighbouring countries and a strong position in North Eastern France (Alsace and Lorraine Region). Overall, the number of paying agents in the atHome Group increased from 957 (June 2008) to 1,230 (June 2009).
The Hong Kong business also grew its revenues in the online and print advertising space. Given the uncertainty of the economic environment, the Group has reviewed the ongoing business plan for
the business and as a result has recorded an impairment charge against its acquired intangibles during FY09.
The current economic climate in UAE has lead to a worsening of the real estate market in the UAE for the foreseeable future. As a result, the Group’s share in the business was sold for US$310k (AUD$380k) on 31 July 2009 and an appropriate impairment and write off of its intangible assets was taken at 30 June 2009. The sale is subject to approval by UAE authorities.
Unallocated OverheadThe Group allocates costs related to its back offi ce functions consisting of the IT development activities for the online portals and agent solutions business, delivering online advertising and agent solution products, as well as certain central head offi ce functions. Unallocated costs include one off costs for corporate affairs, the group fi nance function, the corporate development function, certain IT development costs, and costs of the Board and the Company Secretarial function.
Traffi c on WebsitesMany of the 21 websites of the Group continue to be leaders in online real estate advertising in their regions / countries. According to independent rating auditors Nielsen/NetRatings and Omniture (UK), the monthly readership (measured in Unique Visitors) of all websites increased by 22 per cent from 8.2 million in June 2008 to 10.0 million in June 2009.
The Australian residential website realestate.com.au had 4.5 million Unique Visitors and the gap to the second placed website domain.com.au increased to a record 2.4 million visitors. Also according to Nielsen/NetRating and Omniture, the overall number of pages of information (page impressions) viewed by readers of the Group’s websites increased by 4 per cent from 592 million in June 2008 to 615 million in June 2009.

www.rea-group.com 21
Cash FlowOperating cash fl ow has increased from $15.9m in FY08 to $31.8m in FY09.
Investment for Future PerformanceThe company will continue to strengthen and grow its businesses in both online advertising and in other related sectors of the real estate industry.
Signifi cant changes in the state of affairsSignifi cant changes in the state of affairs of the Group during the fi nancial year were as follows:
Review of UK business leading to closure of print and sale of • online interest in the business.
Sale or closure of smaller non market leading investments.•
The company changed its name from realestate.com.au Limited • to REA Group Limited.
Matters subsequent to the end of the fi nancial yearAs at the date of this report, other than as disclosed in note 35, the directors are not aware of any circumstance that have arisen since 30 June 2009 that has signifi cantly affected, or may signifi cantly affect:
(a) the Group’s operations in future fi nancial years, or(b) the results of those operations in future fi nancial years, or(c) the Group’s state of affairs in future fi nancial years.
Environmental regulationThe company is complying with all environmental regulations and is not subject to any particular environmental requirements.
Information on Directors
Mr Richard J Freudenstein BEc, LLB (Hons). Non executive chairman. Age 44.
Experience and expertiseMr Freudenstein is the Chief Executive Offi cer of News Digital Media (the digital division of News Limited), which includes digital properties, news.com.au, truelocal.com.au, CARSguide.com.au and moshtix.com.au and related activities involving News Limited newspaper and magazine websites, including vogue.com.au and taste.com.au. Mr Freudenstein is non executive Chairman of CareerOne.com.au and sits on the board of News Limited, FOXTEL and The Bell Shakespeare Company. Mr Freudenstein returned to Australia in August 2006 after seven years at British Sky Broadcasting, the last six as Chief Operating Offi cer. Mr Freudenstein has worked for News Corporation and related companies since 1994.
Special responsibilitiesChair of the Board.Member of remuneration and nomination committee.
Mr Roger Amos FCA, MAICD. Non executive Director. Age 61.
Experience and expertiseMr Amos is an independent Director of Austar United Communications Limited, where he is Chair of the Audit Committee and a member of the Remuneration Committee. He is Chairman of Tyrian Diganostics Limited. He also has a non executive
role as Chairman for Ineum Consulting Group Plc and is a member of both the Audit Committee and the Remuneration Committee. Mr Amos had a long and distinguished career with international accounting fi rm KPMG, retiring in June 2006 after 25 years as a partner in the Assurance and Risk Advisory Services Division. In addition to his portfolio of clients, focused on the Information, Communications and Entertainment Industry (ICE), Mr Amos held various roles in the KPMG Global ICE industry groups, including Global Chairman of the Communications Industry Group. Mr Amos also serves as a Director of the Opera Foundation of Australia which supports the development of emerging opera talent through awards and scholarships.
Special responsibilitiesChair of audit risk and compliance committee.Member of remuneration and nomination committee.Interests in shares and options2,363 ordinary shares in REA Group Ltd.
Ms Kathleen Conlon BA(ECON)(DIST), MBA, MAICD. Non executive Director. Age 45.
Experience and expertiseMs Conlon is a professional non executive Director. She is a non executive Director of CSR Limited (since 2004), where she serves on the Safety Health and Environment and Audit committees. She is also a non executive director of DLA Phillips Fox and a member of Chief Executive Women. She is also a NSW Council Member of the Australian Institute of Company Directors. Ms Conlon brings over 20 years of professional consulting experience to her boards. She is a recognised thought leader in strategy and business improvement, and has advised leading companies across a range of industries and countries. In her seven years as a partner and director of the Boston Consulting Group (BCG), Ms Conlon led BCG’s Asia Pacifi c Operations Practice Area and, previously, the Sydney Offi ce. In 2003, Ms Conlon was awarded a Centenary Medal for service to business.
Special responsibilitiesMember of audit risk and compliance committee.Chair of remuneration and nomination committee.
Mr Greg Ellis BBus. Managing Director/CEO. Age 47.
Experience and expertiseMr Ellis has over 20 years business experience, 14 of which have been in senior line management positions. He has worked in Australia, Asia and Europe. Prior to joining the REA Group he was Marketing Director Asia Online Services for Microsoft. He has been Managing Director of Online and Search at World Directories in the Netherlands. Mr Ellis also spent fi ve years at Sensis and 11 years at Telstra. At Sensis, he was most recently General Manager of Sensis Interactive. At Telstra, his most recent role was National General Manager, Marketing Strategy & Planning. He was appointed Managing Director on 23 September 2008.

22 REA Group Annual Report 2009
DIRECTORS’ REPORT CONTINUED
Mr John D McGrath Qualifi cations. Non executive Director. Age 45.
Experience and expertiseMr McGrath founded McGrath Estate Agents in 1988. He has grown the company to be one of Australia’s most successful property services groups, selling over $3.25 billion in residential property in Sydney in FY09. The company became the fi rst real estate company to be ranked on BRW’s Australia’s Fastest Growing Private Companies List and is a 3 time recipient of BRW’s Fast 100. McGrath Estate Agents also owns Oxygen Home Loans, its mortgage broking business, as well as Total Real Estate Training that provides training programs and seminars for the real estate industry. Mr McGrath is a Director of McGrath Group of Companies and the Rawson Group. In 2003, he was awarded a Centenary Medal for service to business. In 2008, he was honoured by the Real Estate Institute of NSW with the Woodrow Weight OBE Award, a lifetime achievement award for his outstanding contribution to the real estate industry.
Special responsibilitiesMember of remuneration and nomination committee.2,139,086 ordinary shares in REA Group Ltd.
Mr Alasdair MacLeod Qualifi cations. Non executive Director. Age 48.
Experience and expertiseMr MacLeod is the Managing Director of News Limited’s NSW publishing company, Nationwide News, and sits on the Board of News Limited. Nationwide News publishes The Daily Telegraph, Sunday Telegraph, The Australian, Weekend Australian, mX and Sportsman. Mr MacLeod joined News Limited in 2002 as Managing Director of the company’s community newspapers division which publishes over 120 titles throughout Australia. He relocated to Australia after thirteen years with News International in the UK where he held a number of senior positions including Managing Director of online division News Network and General Manager of Times Newspapers, the publisher of The Times and The Sunday Times. Prior to joining the News Group, Mr MacLeod worked with Citibank Limited in Sydney and in Hong Kong.
Interests in shares and options18,880 options over Class A News Corporation Limited shares4,000 Class A News Corporation shares
Mr Jeremy Philips BA, LLB, MPA. Non executive Director. Age 37.
Experience and expertiseMr Philips is Executive Vice President, Offi ce of the Chairman, at News Corporation. He is a member of News Corp’s Executive Management Committee, and is based in New York. He focuses on strategy and digital acquisitions across the company. He was Vice Chairman and co founder of ecorp Limited, a holding company for leading Internet businesses in Australia, including ebay Australia, ninemsn and Ticketek. Prior to that, he was a consultant at McKinsey & Company. Jeremy is a graduate of the University of New South Wales (Arts and Law) and the Harvard Kennedy School of Government. He is a member of the board of One Laptop Per Child. Mr Philips was appointed a director on 4 March 2009.
Interests in shares and options24,318 Class A News Corporation shares
Mr Stephen P Rue CA, BBS, DPA. Non executive Director. Age 43.
Experience and expertiseMr Rue is the Chief Financial Offi cer of News Limited, the Australian arm of News Corporation. He was appointed to his current role in May 2003, and previously was the company’s Group Finance Manager. Mr Rue fi rst joined News Limited in 1996 and moved into the role of Treasurer and Special Projects Manager prior to being appointed Group Finance Manager. Mr Rue’s experience includes 8 years at Arthur Andersen where he held the position of Senior Manager in their Audit and Business Advisory division. Mr Rue is Chairman of Community Newspaper Group Limited and a Director of News Limited and Australian Associated Press Pty Limited. Mr Rue is a Chartered Accountant and holds a Bachelor of Business Studies and a Diploma in Professional Accounting.
Special responsibilitiesMember of audit risk and compliance committee.Interests in shares and options49,000 options over Class A News Corporation Limited shares
Mr Sam R White B.Com, LLB. Non executive Director. Age 38.
Experience and expertiseMr White joined Ray White Real Estate in 1991 and was appointed to its Board in 1998. Mr White is also Chairman of the Loan Market Group, a leading mortgage and insurance broking group. Mr White has a Bachelor of Commerce and a Bachelor of Law from the University of Queensland.
Special responsibilitiesMember of remuneration and nomination committee.
Interests in shares and options564,211 ordinary shares in REA Group Ltd.
Mr Simon T Baker BSc, MBA Managing Director/CEO. Age 42.
Experience and expertiseMr Baker was the Managing Director and Chief Executive Offi cer of REA Group until 4 August 2008.
Company Secretary
Ms Moana Weir BA, LLB(Hons), MAICDMs Weir has 8 years senior management experience in public companies with international operations in the online IT and advertising industries. Prior to this she worked as an in house lawyer at Coles Myer Ltd, and practised as an IP/IT lawyer at leading Australian law fi rms, most recently Allens Arthur Robinson. She holds a BA and Bachelor of Laws Degree (Honours), and is admitted to practice as a barrister and solicitor in the Supreme Court of Victoria, Australia. She is a member of the Australian Institute of Company Directors. Ms Weir was appointed company secretary on 15 December 2008.

www.rea-group.com 23
Meetings of directorsThe numbers of meetings of the company’s board of directors and of each board committee held during the year ended 30 June 2009, and the numbers of meetings attended by each director were:
Meetings of committees
Full meetings of directorsAudit Risk and
Compliance MeetingsRemuneration and
Nomination Committee Meetings
A B A B A B
Mr Richard J Freudenstein 7 7 – – 2 2
Mr Roger Amos 7 7 5 5 2 2
Ms Kathleen Conlon 7 6 5 5 2 2
Mr Greg Ellis (appointed 23 September 2008) 5 5 – – – –
Mr John D McGrath 7 7 – – 2 1
Mr Alasdair MacLeod 7 7 – – – –
Mr Jeremy Philips (appointed 4 March 2009) 2 2 – – – –
Mr Stephen P Rue 7 6 5 5 – –
Mr Sam R White 7 6 – – 2 2
Mr Simon T Baker (until 4 August 2008) – – – – – –
A Number of meetings held during the time the director held offi ce or was a member of the committee during the yearB Number of meetings attended
REMUNERATION REPORT (AUDITED)This report outlines the remuneration arrangements in place for directors and executives of REA Group Limited ‘the company’ and the Group is in accordance with the requirements of the Corporations Act 2001 and its regulations.
Remuneration philosophyThe performance of the company depends upon the quality of its directors and executives. To prosper, the company must attract, motivate and retain highly skilled directors and executives. To this end, the company embodies the following principles in its remuneration framework:
Provide competitive rewards to attract high calibre executives•
Signifi cant portion of executive remuneration ‘at risk’, dependent • upon meeting pre determined performance benchmarks
Establish appropriate, demanding performance hurdles in relation • to variable executive remuneration
Remuneration and Nomination CommitteeThe Remuneration and Nomination Committee of the Board of Directors of the company is responsible for determining and reviewing compensation arrangements for the directors, the Chief Executive Offi cer (CEO) and the senior management team. The committee assesses the appropriateness of the nature and amount of remuneration of directors and senior managers on a periodic basis by reference to relevant employment market conditions with the overall objective of ensuring maximum shareholder benefi t from the retention of a high quality board and executive team.
Remuneration structureIn accordance with best practice corporate governance, the structure of non executive director and senior manager remuneration is separate and distinct.
Non executive director remunerationObjectiveThe Board seeks to set aggregate remuneration at a level which provides the company with the ability to attract and retain directors of the highest calibre, whilst incurring a cost which is acceptable to shareholders.
StructureThe Constitution and the ASX Listing Rules specify that the aggregate remuneration of non executive directors shall be determined from time to time by a general meeting. An amount not exceeding the amount determined is then divided between the directors as agreed. The latest determination was at the Annual General Meeting held in November 2006 when shareholders approved an aggregate remuneration of $350,000 per year. The amount of the aggregate remuneration sought to be approved by shareholders and the manner in which it is apportioned amongst directors is reviewed annually. The remuneration of non executive directors for the period ending 30 June 2009 is detailed in the table on page 25 of this report.
Senior manager and executive director remunerationObjectiveThe company aims to reward executives with a level/mix of remuneration commensurate with their position and responsibilities within the company and so as to:
Reward executives for performance against targets set by • reference to appropriate benchmarks;
Align the interests of executives with those of shareholders;•
Link reward with the strategic goals and performance of the • company; and
Ensure total remuneration is competitive by market standards.•
24 REA Group Annual Report 2009
DIRECTORS’ REPORT CONTINUED
StructureRemuneration costs consist of the following key elements:
Fixed remuneration•
Variable remuneration•
The table on page 26 of this report gives details the variable component of the fi ve most highly remunerated senior managers.
Fixed RemunerationObjectiveThe level of fi xed remuneration is set so as to provide a base level of remuneration which is both appropriate to the position and is competitive in the market. Fixed remuneration is reviewed annually. All contracts for new senior management have to be approved by the Remuneration and Nomination Committee. In addition, deviations from the budgeted salary increases also require approval.
StructureSenior managers are given the opportunity to receive part of their fi xed (primary) remuneration in fringe benefi ts such as motor vehicles and education expense payment plans. It is intended that the manner of payment chosen will be optimal for the recipient without creating undue cost for the company. This fi xed remuneration component of the fi ve most highly remunerated senior managers is detailed in the table on page 26 of this report.
Variable Remuneration – Short Term Incentives = STIObjectiveThe objective of the STI program is to link the achievement of the company’s operational targets with the remuneration received by the executives charged with meeting those targets. The total potential STI available is set at a level so as to provide suffi cient incentive to the senior manager to achieve the operational targets and such that the cost to the company is reasonable in the circumstances.
StructureActual STI payments granted to each senior manager depends on the extent to which specifi c operating targets set at the beginning of the fi nancial year are met. The operational targets consist of a number of Key Performance Indicators (KPI’s) covering both fi nancial and non fi nancial measures of performance. Typically included are measures such as contribution to revenues, profi tability, customer service, risk management, product management, and leadership/team contribution. The company has approved predetermined benchmarks which must be met in order to trigger payments under the short term incentive scheme. Payments made are usually delivered as a cash bonus.
STI bonus for FY08 and FY09For FY08, STI cash bonuses of $372,786 as previously accrued in that period vested to executives and were paid in the 2008 fi nancial year. There were no forfeitures. The maximum STI cash bonus for the 2009 fi nancial year of $502,749 has been accrued on the basis that it is probable that all executives will meet their respective KPI’s for the period. Any adjustments between the actual amounts and the amounts accrued will be adjusted in FY10. The minimum amount of the STI cash bonus assuming that no executives meet their respective KPIs for the 2009 fi nancial year is nil.
Variable Remuneration – Long Term Incentives = LTIObjectiveThe objective of the LTI plan is to link the achievement of the company’s long term targets with the remuneration received by the executives charged with meeting those targets. The total potential LTI available is set at a level so as to provide suffi cient incentive to the senior manager to achieve the long term targets and such that the cost to the company is reasonable in the circumstances.
StructurePlanned LTI payments granted to each senior manager depends on the extent to which specifi c targets set at the beginning of plan are met. The targets are revenue and profi tability related targets in the third year after the initiation of the plan. Payments made are usually delivered as rights to company shares. The company does not encourage entering into arrangements to protect the value of unvested LTI awards. This includes entering into contracts to hedge the exposure to options of shares granted as part of their remuneration package.
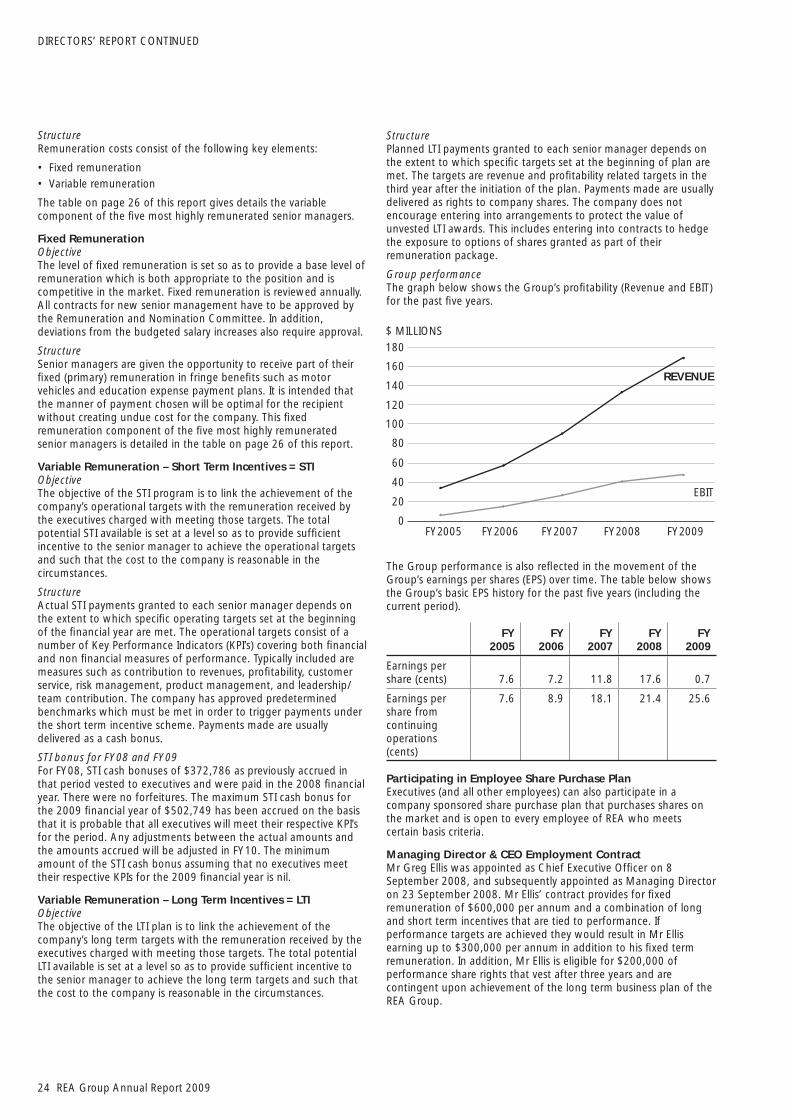
Group performanceThe graph below shows the Group’s profi tability (Revenue and EBIT) for the past fi ve years.
The Group performance is also refl ected in the movement of the Group’s earnings per shares (EPS) over time. The table below shows the Group’s basic EPS history for the past fi ve years (including the current period).
FY2005
FY2006
FY2007
FY2008
FY2009
Earnings per share (cents) 7.6 7.2 11.8 17.6 0.7
Earnings per share from continuing operations (cents)
7.6 8.9 18.1 21.4 25.6
Participating in Employee Share Purchase PlanExecutives (and all other employees) can also participate in a company sponsored share purchase plan that purchases shares on the market and is open to every employee of REA who meets certain basis criteria.
Managing Director & CEO Employment ContractMr Greg Ellis was appointed as Chief Executive Offi cer on 8 September 2008, and subsequently appointed as Managing Director on 23 September 2008. Mr Ellis’ contract provides for fi xed remuneration of $600,000 per annum and a combination of long and short term incentives that are tied to performance. If performance targets are achieved they would result in Mr Ellis earning up to $300,000 per annum in addition to his fi xed term remuneration. In addition, Mr Ellis is eligible for $200,000 of performance share rights that vest after three years and are contingent upon achievement of the long term business plan of the REA Group.
180
160
140
120
100
$ MILLIONS
REVENUE
EBIT
80
60
40
20
0FY2005 FY2006 FY2007 FY2008 FY2009

www.rea-group.com 25
DirectorsWith the exception of the changes noted below, the following persons held offi ce as directors of REA Group Limited during the whole of the fi nancial year and up to the date of this report.
Mr Richard J Freudenstein (Chairman)Mr Roger Amos (Non executive Director)Ms Kathleen Conlon (Non executive Director)Mr Greg Ellis (Managing Director/CEO appointed 23 September 2008)Mr John D McGrath (Non executive Director)Mr Alasdair MacLeod (Non executive Director)Mr Jeremy Philips (Non executive Director appointed 4 March 2009)Mr Stephen P Rue (Non executive Director)Mr Sam R White (Non executive Director)Mr Simon T Baker (Managing Director and Chief Executive Offi cer until 4 August 2008)
Director remuneration
DirectorsShort term
employee benefi tsShare based
payments Total
(% of total
performance related)
Salary & Fees
Cash Bonus
Super-annuation
Long Service Leave LTIP*
Roger Amos
2009 76,453 – 6,873 – – 83,326 0%
2008 77,982 – 7,018 – – 85,000 0%
Kathleen Conlon
2009 67,278 – 6,070 – – 73,348 0%
2008 64,220 – 5,780 – – 70,000 0%
John McGrath
2009 64,220 – 5,780 – – 70,000 0%
2008 94,037 – 8,463 – – 102,500 0%
Greg Ellis
2009 448,836 239,808 40,395 – 66,667 795,706 39%
2008 – – – – – –
Simon Baker
2009 775,009 70,459 103,092 (42,689) 84,929 990,800 16%
2008 530,001 300,000 47,700 42,689 15,071 935,461 34%
*Long Term Incentive Plan.Directors’ fees are paid only to independent or executive directors. All other directors, not being independent, did not receive any directors’ fees during the fi nancial period.
ExecutivesThe key management personnel and the names of the 5 executives who receive the highest remuneration for the year ended 30 June 2009 were:
Mr Georg Chmiel Chief Financial Offi cerMr Daniel Oertli Chief Information Offi cer (since 17 February 2009)Mr Daniele Mancini Country Manager Italy (since 1 April 2009)Mr Jamie Pride General Manager Australia (until 2 March 2009)Ms Gillian Kent General Manager United Kingdom Mr Shaun Di Gregorio General Manager International

26 REA Group Annual Report 2009
DIRECTORS’ REPORT CONTINUED
Executives remuneration
Executives Short termShare based
payments Total
(% of total performance
related)
Salary & Fees
Cash Bonus Other
Super-annuation
Long Service Leave LTIP*
Georg Chmiel
2009 330,000 59,000 – 36,000 6,595 153,145 584,740 36%
2008 310,000 55,000 – 30,401 5,583 11,304 412,288 16%
Shaun Di Gregorio
2009 320,000 78,666 – 36,900 12,419 122,516 570,501 35%
2008 263,333 80,000 – 30,308 21,930 9,043 404,614 22%
Daniele Mancini
2009 168,455 22,818 – 3,251 – – 194,524 12%
2008 – – – – – – – –
Daniel Oertli
2009 121,218 29,278 – 10,910 – – 161,406 18%
2008 – – – – – – – –
Jamie Pride
2009 212,209 53,333 12,000 16,154 – (3,090) 290,606 17%
2008 70,770 36,889 – 6,369 – 3,090 117,118 34%
Gillian Kent
2009 325,239 73,179 – 53,008 – 72,484 523,910 28%
2008 154,399 49,669 – 39,597 – 4,291 247,956 22%
*Long Term Incentive Plan (see note 38).
Rights granted and vested during the year
Terms and Conditions for each right Vested
30 June 2009Granted Number Grant date
Fair value per right at grant date
Exercise price per
rightExpiry
dateFirst
exercise dateLast
exercise date No. %
Mr Greg Ellis 42,009 1 July 2008 4.40 0 n/a 1 July 201130 September
2011 – 0.0
Mr Georg Chmiel 34,091 1 July 2008 4.40 0 n/a 1 July 201130 September
2011 – 0.0
Mr Shaun Di Gregorio 27,273 1 July 2008 4.40 0 n/a 1 July 2011
30 September 2011 – 0.0
TOTAL 103, 373 –
The terms ‘director’ and ‘offi cer’ have been treated as mutually exclusive for the purposes of this disclosure. The elements of emoluments have been determined on the basis of the cost to the company and the consolidated entity.
Options granted as part of remunerationOther than as part of the Long Term Incentive Plan, there were no other options granted as part of remuneration for the year ended 30 June 2009.

www.rea-group.com 27
INDEMNIFICATION AND INSURANCE OF DIRECTORS AND OFFICERSFor FY09, the company paid premiums totalling $1,609 in respect of contracts insuring all the directors of REA Group Limited against costs incurred in defending proceedings for conduct involving:
1. a wilful breach of duty; or
2. a contravention of Sections 182 or 183 of the Corporations Act (2001), as permitted by section 199B of that Act.
REA Group Limited has entered into a standard form deed of indemnity, insurance and access with the independent directors against liabilities they may incur in the performance of their duties as directors of REA Group Limited, except liabilities to REA Group Limited or a related body corporate, liability for a pecuniary penalty or compensation order under the Corporations Act, and liabilities arising from conduct involving a lack of good faith. REA Group Limited is obliged to maintain an insurance policy in favour of independent directors for liabilities they incur as directors of REA Group Limited and to grant them a right of access to certain company records. In addition, each Director is indemnifi ed, as authorised by the Constitution, on a full indemnity basis and to the full extent permitted by law, for all losses or liabilities incurred by the Director as a director of a member of the Group. The indemnity operates only to the extent that the loss or liability is not covered by insurance.
Up to 11 November 2005 (when News Limited increased its share in REA Group Limited to a controlling shareholding) the company held a Directors’ and Offi cer’s Liability Insurance Policy on behalf of current directors and offi cers of REA Group Limited and its controlled entities. On 11 November 2005, this policy was converted into a seven year run off cover. REA Group Limited is now covered by a D&O insurance for the News Corporation Group of companies. This cover excludes claims brought by major shareholders (News Limited).
Non audit servicesThe company may decide to employ the auditor on assignments additional to their statutory audit duties where the auditor’s expertise and experience with the company and/or the Group are important.
Details of the amounts paid or payable to the auditor (Ernst & Young) for audit and non audit services provided during the year are set out below.
The Board of directors has considered the position and, in accordance with advice received from the audit committee, is satisfi ed that the provision of the non audit services is compatible with the general standard of independence for auditors imposed by the Corporations Act 2001. The directors are satisfi ed that the provision of non audit services by the auditor, as set out below, did not compromise the auditor independence requirements of the Corporations Act 2001 for the following reasons:
all non audit services have been reviewed by the audit committee • to ensure they do not impact the impartiality and objectivity of the auditor
none of the services undermine the general principles relating to • auditor independence as set out in APES 110 Code of Ethics for Professional Accountants.
During the year the following fees were paid or payable for audit and non audit services provided by the a uditor of the parent entity, its related practices and non related audit fi rms:
Consolidated
2009$
2008$
Audit and review of fi nancial reports 484,000 492,000
Assurance related services 46,370 36,000
Total remuneration for audit services 530,370 528,000
Due diligence services 21,683 198,000
Total remuneration for other assurance services 21,683 198,000
28 REA Group Annual Report 2009
DIRECTORS’ REPORT CONTINUED
Review of Financial Condition
Capital structureAt the end of the year, 127,255,057 (2008: 127,255,057) ordinary shares were outstanding. The Group is equity fi nanced as at the date of this report with an undrawn credit line of $14 million for short term fi nancing needs, which will expire in September 2009 ($4 million) and October 2010 ($10 million).
Treasury policyExcess funds are currently invested in an overnight professional funds account.
Cash from OperationsDuring the fi nancial year, the Group delivered $31.8 million (2008: $15.9 million) in operating cash fl ows.
Liquidity and FundingThe company has suffi cient funds to fi nance its operations.
Risk ManagementThe Group takes a proactive approach to risk management. The Board is responsible for ensuring that risk and opportunities are identifi ed on a timely basis and that the Group’s objectives and activities are aligned with the risks and opportunities identifi ed by the Board. The mechanisms for risk management include approval of a strategic plan by the Board, the approval of operating budgets and their regular review against actual fi nancial data. (Refer also note 3.)
Auditor’s independence declarationA copy of the auditor’s independence declaration as required under section 307C of the Corporations Act 2001 is set out on page 29.
Rounding of amountsThe company is of a kind referred to in Class Order 98/100, issued by the Australian Securities and Investments Commission, relating to the ‘’rounding off’’ of amounts in the directors’ report. Amounts in the directors’ report have been rounded off in accordance with that Class Order to the nearest thousand dollars, or in certain cases, to the nearest dollar.
AuditorErnst & Young continues in offi ce in accordance with section 327 of the Corporations Act 2001.
This report is made in accordance with a resolution of directors.
Mr Richard J FreudensteinDirectorMelbourne, 20 August 2009

www.rea-group.com 29
Auditor’s Independence Declaration to the Directors of REA Group LimitedIn relation to our audit of the fi nancial report of REA Group Limited for the fi nancial year ended 30 June 2009, to the best of my knowledge and belief, there have been no contraventions of the auditor independence requirements of the Corporations Act 2001 or any applicable code of professional conduct.
Ernst & Young
David McGregorPartner
20 August 2009Melbourne, Australia
Ernst & Young Building8 Exhibition StreetMelbourne VIC 300 AustraliaGPO Box 67 Melbourne VIC 3001
Tel: +61 3 9288 8000Fax: +61 3 8650 7777www.ey.com/au
AUDITOR’S INDEPENDENCE DECLARATION
Liability limited by a scheme approved under Professional Standards Legislation

30 REA Group Annual Report 2009
CORPORATE GOVERNANCE STATEMENT
The Corporate Governance arrangements for the Group (REA) are set by the Board having regard to the particular circumstances of the Group and the best interests of shareholders. REA is committed to best practice in corporate governance where these practices are appropriate and add value to REA. The Board and management of REA maintain a constant interest in governance, including assessing the guidelines of regulatory and investor bodies and considering other national and international practices. This leads to the governance arrangements being reviewed regularly to ensure compliance with legal requirements, to meet the expectations of shareholders and to best address the circumstances of REA. During 2009, all existing Board and Committee Charters were reviewed and revised by the Board as deemed necessary.
The information on the following pages shows compliance by REA Group Limited against the revised Corporate Governance Principles and Recommendations of the ASX Corporate Governance Council in accordance with Listing Rule 4.10.
This statement also provides information on other governance practices adopted by REA Group Limited. This statement is current as at the date of the 2009 Directors’ Report and, unless otherwise indicated, the information was true for the whole of the fi nancial year commencing on 1 July 2008. The information provided below contains references to the REA web site (www.investor.rea-group.com). This statement should be read in conjunction with this web site and with the Directors’ Report.
Recommendation Compliance
Section 1
1.1 Companies should establish the functions reserved to the board and those delegated to senior executives and disclose those functions.
The Board has adopted a Charter that details the functions and responsibilities of the Board, which is available on the REA Group web site. Management of REA’s day-to-day operations is undertaken by the Managing Director and Chief Executive Offi cer, subject to specifi ed delegations of authority approved by the Board.
The Board has also adopted the practice of formal letters of appointment for all new directors. The letter sets out the key terms and conditions of the director’s appointment.
✔
1.2 Companies should disclose the process for evaluating the performance of senior executives
The Remuneration Committee oversees the performance and determines performance assessment of senior executives. For all line managers and staff, a formal performance review framework is in place to monitor outcomes, set KPI’s and review achievements against set goals.
✔
Section 2
2.1 A majority of the Board should be independent directors.
A majority of the Board are not independent directors. Due to the size of the company, and the strategic relationships, the directors have determined that it is inappropriate to increase the number of directors to a size where there can be a majority of independent directors. This decision does not however limit the size of the Board, nor preclude the appointment of additional directors.
The matters and thresholds considered by the Board in assessing the independence of directors are set out in the Board’s Charter, which is available on REA’s web site. The defi nition of independent director does not depart from that recommended by the ASX Corporate Governance Council. Materiality thresholds have been determined by the Board.
The Board makes an assessment of the independence of each director upon appointment and in August of each year. Directors are required on an ongoing basis to disclose to the Board relevant personal interests and confl icts of interest. Upon any such disclosure, a director’s independence is reassessed.
✕
2.2 The Chairperson should be an independent director.
The current chairperson, Richard J Freudenstein, is not assessed as independent. His appointment is seen as a refl ection of his signifi cant experience and industry knowledge.
✕
2.3 The roles of the Chairperson and Chief Executive Offi cer should not be exercised by the same individual ✔
2.4 The Board should establish a nomination committee.
The Board has a Remuneration and Nomination Committee.
The Nomination Committee should be structured so that it:
Consists of a majority of independent directors•
Is chaired by an independent director•
Has at least 3 members•
The Board has adopted a Charter for the Committee, a copy of which is available on REA’s website. •
✔(from 30 June
2009)
2.5 Companies should disclose the process for evaluating the performance of the Board, its committees and individual directors.
The Board of Directors initiated a formal review of the individual Director’s and the performance of the Board and its committees during 2009.
✔

www.rea-group.com 31
Recommendation Compliance
Section 3
3.1 Companies should establish a code of conduct and disclose the code or a summary of the code.
REA has adopted a Code of Conduct to guide the standards of ethical behaviour expected of REA directors and employees in the performance of their work. A copy of the REA Code of Conduct is available on REA’s website.
✔
3.2 Companies should establish a policy concerning trading in company securities by directors, senior executives and employees and disclose the policy or a summary of that policy.
The REA Share Trading Policy is available on the REA website.
✔
Section 4
4.1 The Board should establish an audit committee.
The Board has established an Audit Risk and Compliance Committee that operates under a charter approved by the Board.
✔
4.2 The audit committee should be structured so that it:
Consists of only non-executive directors•
Consists of a majority of independent directors•
Is chaired by an independent chair, who is not chair of the Board•
Has at least three members•
✔
4.3 The Audit Committee should have a formal charter.
A copy of the Charter of the Audit Committee is available on the REA website.
✔
Section 5
5.1 Establish written policies and procedures designed to ensure compliance with ASX Listing Rule disclosure requirements and to ensure accountability at a senior management level for that compliance and disclose those policies or a summary of those policies.
The Board has adopted the REA Market Disclosure Policy, which sets out the key obligations of the Board and senior management to ensure that REA complies with its disclosure obligations under the ASX Listing Rules and the Corporations Act 2001 (Cth). A copy of the REA Market Disclosure Policy is available on the REA website.
✔
Section 6
6.1 Companies should design a communications policy for promoting effective communication with shareholders and encouraging participation at general meetings and disclose their policy or a summary of that policy.
The Board has adopted a REA Shareholder Communications Policy, a copy of which is posted on the REA website.
✔
Section 7
7.1 Companies should establish policies for oversight and management of material business risks and disclose a summary of those policies.
The Audit Risk and Compliance Committee has included within its terms of reference, a section dealing with the monitoring and establishment of policies regarding risk management and overseeing.
✔
7.2 The Board should require management to design and implement the risk management and internal control system to manage the company’s material business risks and report to it on whether those risks are being managed effectively. The Board should disclose that management has reported to it as to the effectiveness of the company’s management of its material business risks.
REA has adopted a risk management framework throughout its operations to proactively and systematically identify, assess and address events that could potentially impact upon business objectives. Under the Risk Management Policy, which supports the risk management framework, there is regular reporting to the Board and the Audit Risk and Compliance Committee. REA has an internal audit function which reports to the Audit Risk and Compliance Committee and the Managing Director and Chief Executive Offi cer. The Audit Risk and Compliance Committee oversees the internal audit function and the appointment of the Internal Audit Manager. The Internal Audit Manager meets with both the Chairman of the Audit Committee and the Audit Committee as a whole in the absence of management. This function has full access to personnel and information and is independent of the external auditor.
✔
7.3 The Board should disclose whether it has received assurance from the chief executive offi cer (or equivalent) and the chief fi nancial offi cer (or equivalent) that the declaration provided in accordance with section 295A of the Corporations Act is founded on a sound system of risk management and internal control and that the system is operating effectively in all material respects in relation to fi nancial reporting risks.
The Board receives a written declaration prior to the acceptance of the annual fi nancial statements.
✔
32 REA Group Annual Report 2009
CORPORATE GOVERNANCE STATEMENT CONTINUED
Recommendation Compliance
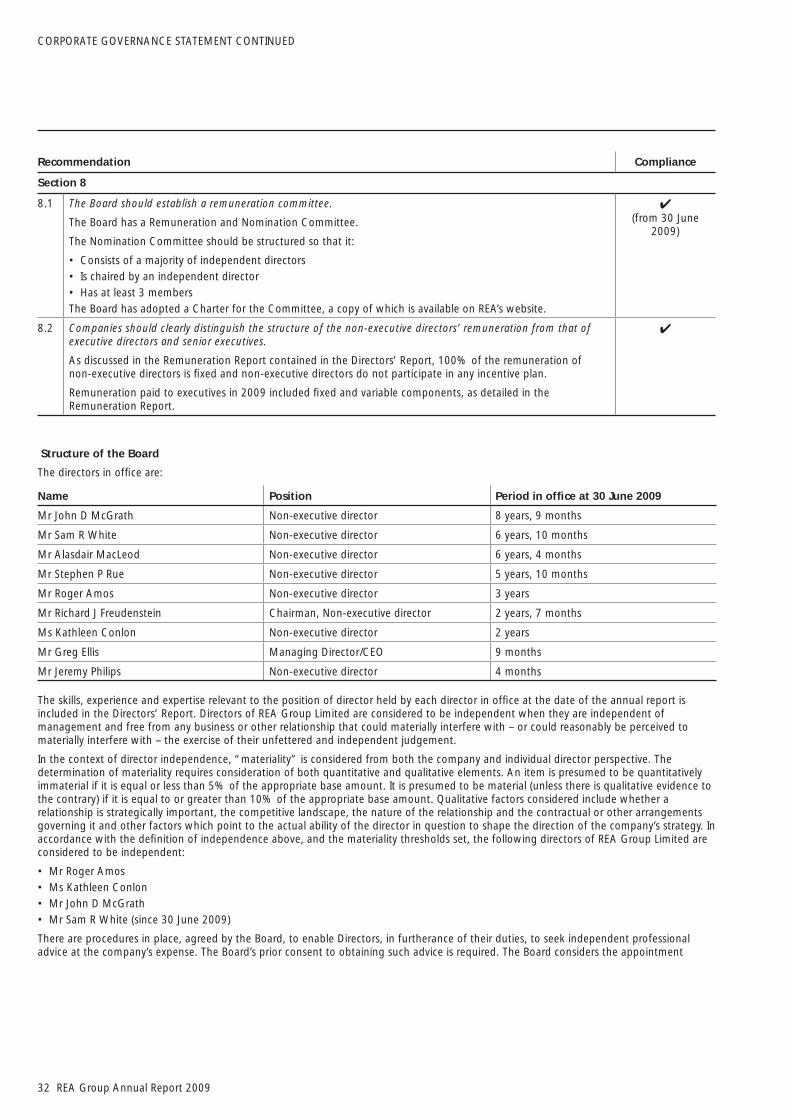
Section 8
8.1 The Board should establish a remuneration committee.
The Board has a Remuneration and Nomination Committee.
The Nomination Committee should be structured so that it:
Consists of a majority of independent directors•
Is chaired by an independent director•
Has at least 3 members•
The Board has adopted a Charter for the Committee, a copy of which is available on REA’s website.
✔(from 30 June
2009)
8.2 Companies should clearly distinguish the structure of the non-executive directors’ remuneration from that of executive directors and senior executives.
As discussed in the Remuneration Report contained in the Directors’ Report, 100% of the remuneration of non-executive directors is fi xed and non-executive directors do not participate in any incentive plan.
Remuneration paid to executives in 2009 included fi xed and variable components, as detailed in the Remuneration Report.
✔
Structure of the Board
The directors in offi ce are:
Name Position Period in offi ce at 30 June 2009
Mr John D McGrath Non-executive director 8 years, 9 months
Mr Sam R White Non-executive director 6 years, 10 months
Mr Alasdair MacLeod Non-executive director 6 years, 4 months
Mr Stephen P Rue Non-executive director 5 years, 10 months
Mr Roger Amos Non-executive director 3 years
Mr Richard J Freudenstein Chairman, Non-executive director 2 years, 7 months
Ms Kathleen Conlon Non-executive director 2 years
Mr Greg Ellis Managing Director/CEO 9 months
Mr Jeremy Philips Non-executive director 4 months
The skills, experience and expertise relevant to the position of director held by each director in offi ce at the date of the annual report is included in the Directors’ Report. Directors of REA Group Limited are considered to be independent when they are independent of management and free from any business or other relationship that could materially interfere with – or could reasonably be perceived to materially interfere with – the exercise of their unfettered and independent judgement.
In the context of director independence, “materiality” is considered from both the company and individual director perspective. The determination of materiality requires consideration of both quantitative and qualitative elements. An item is presumed to be quantitatively immaterial if it is equal or less than 5% of the appropriate base amount. It is presumed to be material (unless there is qualitative evidence to the contrary) if it is equal to or greater than 10% of the appropriate base amount. Qualitative factors considered include whether a relationship is strategically important, the competitive landscape, the nature of the relationship and the contractual or other arrangements governing it and other factors which point to the actual ability of the director in question to shape the direction of the company’s strategy. In accordance with the defi nition of independence above, and the materiality thresholds set, the following directors of REA Group Limited are considered to be independent:
Mr Roger Amos•
Ms Kathleen Conlon•
Mr John D McGrath•
Mr Sam R White (since 30 June 2009)•
There are procedures in place, agreed by the Board, to enable Directors, in furtherance of their duties, to seek independent professional advice at the company’s expense. The Board’s prior consent to obtaining such advice is required. The Board considers the appointment

www.rea-group.com 33
or retirement of directors, where appropriate, and with regard to the size of the company. The director concerned does not participate in the decision.
Board FunctionsThe Board seeks to identify the expectations of the shareholders, as well as other regulatory and ethical expectations and obligations. In addition, the Board is responsible for identifying areas of signifi cant business risk and ensuring arrangements are in place to adequately manage those risks.
To ensure that the Board is well equipped to discharge its responsibilities it has established guidelines for the nomination and selection of directors and for the operation of the Board.
The responsibility for the operation and administration of the Company is delegated, by the Board, to the CEO and the executive management team. The Board ensures that this team is appropriately qualifi ed and experienced to discharge their responsibilities and has in place procedures to assess the performance of the CEO and the executive management team.
Whilst at all times the Board retains full responsibility for guiding and monitoring the Company, in discharging its stewardship it makes use of sub-committees. Specialist committees are able to focus on a particular responsibility and provide informed feedback to the Board.
To this end the Board has established the following committees:
Audit Risk and Compliance •
Nomination and Remuneration•
The roles and responsibilities of these committees are discussed throughout this Corporate Governance Statement.
The Board is responsible for ensuring that management’s objectives and activities are aligned with the expectations and risk identifi ed by the Board. The Board has a number of mechanisms in place to ensure this is achieved including:
Board approval of a strategic plan designed to meet stakeholders’ needs and manage business risk;•
Ongoing development of the strategic plan and approving initiatives and strategies designed to ensure the continued growth and success • of the entity; and
Implementation of budgets by management and monitoring progress against budget – via the establishment and reporting of both • fi nancial and non fi nancial key performance indicators.
Other functions reserved to the Board include:
Approval of the annual and half-yearly fi nancial reports;•
Approving and monitoring the progress of major capital expenditure, capital management, and acquisitions and divestitures;•
Ensuring that any signifi cant risks that arise are identifi ed, assessed, appropriately managed and monitored;•
Reporting to shareholders.•
Audit Risk and Compliance CommitteeThe Board has established an Audit Risk and Compliance Committee that operates under a charter approved by the Board. It is the Board’s responsibility to ensure that an effective internal control framework exists within the entity. This includes internal controls to deal with both the effectiveness and effi ciency of signifi cant business processes, the safeguarding of assets, the maintenance of proper accounting records and the reliability of fi nancial information as well as non-fi nancial considerations such as benchmarking of operational key performance indicators.
The Board has delegated the responsibility for the establishment and maintenance of a framework of internal control and ethical standards for the management of the consolidated entity to the Audit Risk and Compliance Committee.
The committee also provides the Board with additional assurance regarding the reliability of fi nancial information for inclusion in all fi nancial reports. All members of the Audit Risk and Com pliance Committee are non-executive directors.
The members of the Audit Risk and Compliance Committee during the year and up to the date of this statement were:
Mr Roger Amos (Chairman)•
Ms Kathleen Conlon •
Mr Stephen P Rue•
Qualifi cations of Audit Risk and Compliance Committee membersMr Roger Amos was a senior partner in the KPMG Information, Communication, and Entertainment Group of Assurance and Risk Advisory • Services and was a partner with KPMG for 25 years.
Ms Kathleen Conlon is a recognised thought leader in strategy and business improvement, and has advised leading companies across a • range of industries and countries.
Mr Stephen P Rue, the Chief Financial Offi cer of News Limited, has extensive fi nancial experience in fi nancial aspects of the media industry • and the accounting profession.
For details of the number of meetings of the Audit Risk and Compliance Committee held during the year, and the attendees at those meetings, refer to Directors’ Meetings in the Directors’ Report. The committee meets at least twice a year with the external auditors to

34 REA Group Annual Report 2009
CORPORATE GOVERNANCE STATEMENT CONTINUED
discuss the results of their work, fee arrangements and other work performed. To ensure that the auditor remains independent at all times, all non audit work is authorised by the Audit Risk and Compliance Committee.
Remuneration and Nomination CommitteeThe Board has established a Remuneration and Nomination Committee, which meets at least once annually, to ensure that the Board continues to operate within the established guidelines, including when necessary, selecting candidates for the position of director. The Remuneration and Nomination Committee comprises non-executive directors.
This Committee comprised the following members:
Ms Kathleen Conlon (Chairperson)•
Mr Roger Amos•
Mr John D McGrath •
Mr Sam R White•
Mr Richard J Freudenstein •
For details on the amount of remuneration and all monetary and non-monetary components for each of the fi ve highest paid executives during the year and for the directors, refer to the Remuneration report in the Directors’ Report. In relation to the payment of bonuses, options and other incentive payments, discretion is exercised by the Board, having regard to the overall performance of the company and the performance of the individual during the period. There is no scheme to provide retirement benefi ts, other than statutory superannuation, to non-executive directors. The Remuneration and Nomination Committee is responsible for establishing and maintaining an appropriate framework for remuneration issues within the company. This function includes the determination of remuneration policies and of executives’ remuneration based on individual performances and the fi nancial and operating performance of the company.
For details on the number of meetings of the Remuneration and Nomination Committee held during the year and the attendees at those meetings, refer to Directors’ Meetings in the Directors’ Report.
RiskThe Board determines the Group’s risk profi le and is responsible for overseeing and approving risk management strategy and policies, internal compliance and internal control. The Group’s process of risk management and internal compliance and control includes:
establishing the Group’s goals and objectives, and implementing and monitoring strategies and policies to achieve these goals • and objectives;
continuously identifying and measuring risks that might impact upon the achievement of the Group’s goals and objectives, • and monitoring the environment for emerging factors and trends that affect these risks;
formulating risk management strategies to manage identifi ed risks, and designing and implementing appropriate risk management • policies and internal controls;
monitoring the performance of, and continuously improving the effectiveness of, risk management systems and internal compliance • and controls, including an annual assessment of the effectiveness of risk management and internal compliance and control.
To this end, comprehensive practices are in place that are directed towards achieving the following objectives:
effectiveness and effi ciency in the use of the Group’s resources;•
compliance with applicable laws and regulations;•
preparation of reliable published fi nancial information.•
The Board oversees an annual assessment of the effectiveness of risk management and internal compliance and control. The responsibility for undertaking and assessing risk management and internal control effectiveness is delegated to management. Management is required by the Board to assess risk management and associated internal compliance and control procedures and report back on the effi ciency and effectiveness of risk management by benchmarking the Group’s performance to the Australia/New Zealand Standard on Risk Management (AS/NZ 4360).
CEO and CFO Certifi cationThe Chief Executive Offi cer and the Chief Financial Offi cer have provided a written statement to the Board that their view provided on the Group’s fi nancial report is founded on a sound system of risk management and internal compliance and control which implements the fi nancial policies adopted by the Board; and that the Group’s risk management and internal compliance and control system is operating effectively in all material respects.

www.rea-group.com 35
PerformanceThe performance of the Board and key executives is reviewed regularly against both measurable and qualitative indicators. During the reporting period, the Nomination Committee conducted performance evaluations that involved an assessment of each key executive’s performance against specifi c and measurable qualitative and quantitative performance criteria. The performance criteria against which the executives are assessed are aligned with the fi nancial and non-fi nancial objectives of REA Group Limited. Directors whose performance is consistently unsatisfactory may be asked to retire.
Ethical StandardsThe Directors and other employees are expected to act lawfully, in a professional manner, and with the utmost integrity and objectivity in their dealings with clients, contractors, candidates and competitors, the community and each other, striving at all times to enhance the reputation and performance of the company.
ShareholdersThe Board of Directors of the company aims to ensure that the shareholders are informed of all major developments affecting the company’s state of affairs. Information is communicated to shareholders as follows:
The Annual Report is distributed to all shareholders and includes relevant information about the operations of the company during the • year, changes in the state of affairs of the company and details of future developments, in addition to other disclosures required by the Corporations Law;
Announcements are made to the Australian Stock Exchange in respect of annual and half-yearly results and on other occasions when • the company becomes aware of information that might materially affect the price of its units; and
The website www.rea-group.com is used to publish releases by the company.•
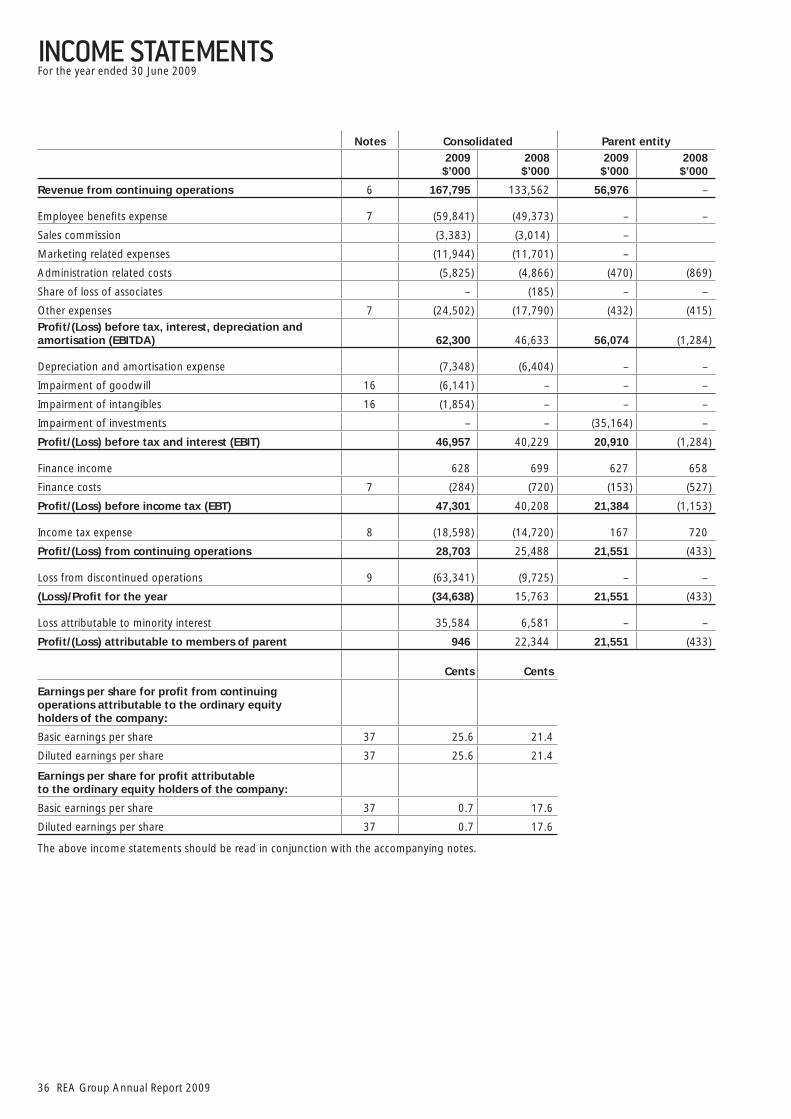
36 REA Group Annual Report 2009
INCOME STATEMENTSFor the year ended 30 June 2009
Notes Consolidated Parent entity2009
$’0002008
$’0002009
$’0002008
$’000
Revenue from continuing operations 6 167,795 133,562 56,976 –
Employee benefi ts expense 7 (59,841) (49,373) – –
Sales commission (3,383) (3,014) –
Marketing related expenses (11,944) (11,701) –
Administration related costs (5,825) (4,866) (470) (869)
Share of loss of associates – (185) – –
Other expenses 7 (24,502) (17,790) (432) (415)
Profi t/(Loss) before tax, interest, depreciation and amortisation (EBITDA) 62,300 46,633 56,074 (1,284)
Depreciation and amortisation expense (7,348) (6,404) – –
Impairment of goodwill 16 (6,141) – – –
Impairment of intangibles 16 (1,854) – – –
Impairment of investments – – (35,164) –
Profi t/(Loss) before tax and interest (EBIT) 46,957 40,229 20,910 (1,284)
Finance income 628 699 627 658
Finance costs 7 (284) (720) (153) (527)
Profi t/(Loss) before income tax (EBT) 47,301 40,208 21,384 (1,153)
Income tax expense 8 (18,598) (14,720) 167 720
Profi t/(Loss) from continuing operations 28,703 25,488 21,551 (433)
Loss from discontinued operations 9 (63,341) (9,725) – –
(Loss)/Profi t for the year (34,638) 15,763 21,551 (433)
Loss attributable to minority interest 35,584 6,581 – –
Profi t/(Loss) attributable to members of parent 946 22,344 21,551 (433)
Cents Cents
Earnings per share for profi t from continuing operations attributable to the ordinary equity holders of the company:
Basic earnings per share 37 25.6 21.4
Diluted earnings per share 37 25.6 21.4
Earnings per share for profi t attributable to the ordinary equity holders of the company:
Basic earnings per share 37 0.7 17.6
Diluted earnings per share 37 0.7 17.6
The above income statements should be read in conjunction with the accompanying notes.

www.rea-group.com 37
BALANCE SHEETSAs at 30 June 2009
Notes Consolidated Parent entity2009
$’0002008
$’0002009
$’0002008$’000
ASSETS
Current assets
Cash and cash equivalents 10 41,588 8,882 307 159
Trade and other receivables 11 27,871 27,763 10,717 1,072
Other current assets 12 3,603 2,972 44 215
Assets of disposal group classifi ed as held for sale 9 7,119 – – –
Total current assets 80,181 39,617 11,068 1,446
Non-current assets
Investments in subsidiaries 13 – – 72,674 97,962
Plant and equipment 14 5,503 5,052 – –
Deferred tax assets 15 2,560 1,599 234 270
Intangible assets 16 54,920 112,178 – –
Total non-current assets 62,983 118,829 72,908 98,232
Total assets 143,164 158,446 83,976 99,678
LIABILITIES
Current liabilities
Trade and other payables 17 19,831 19,660 77 41,922
Interest bearing loans and borrowings 18 488 1,193 – –
Current tax liabilities 10,064 6,218 9,863 5,887
Provisions 19 2,385 2,317 – –
Other current liabilities 20 11,100 9,817 – –
Liabilities of disposal group classifi ed as held for sale 9 3,227 – – –
Total current liabilities 47,095 39,205 9,940 47,809
Non-current liabilities
Interest bearing loans and borrowings 21 32 367 – –
Deferred tax liabilities 22 1,666 3,368 – 59
Provisions 23 860 682 – –
Total non-current liabilities 2,558 4,417 – 59
TOTAL LIABILITIES 49,653 43,622 9,940 47,868
NET ASSETS 93,511 114,824 74,036 51,810
EQUITY
Contributed equity 24 56,002 56,002 56,002 56,002
Reserves 25(a) (344) (4,041) 675 –
Retained earnings/(Accumulated losses) 25(b) 36,429 35,483 17,359 (4,192)
Parent interest 92,087 87,444 74,036 51,810
Minority interest 26 1,424 27,380 – –
TOTAL EQUITY 93,511 114,824 74,036 51,810
The above income statements should be read in conjunction with the accompanying notes.

38 REA Group Annual Report 2009
STATEMENTS OF CHANGES IN EQUITYFor the year ended 30 June 2009
Notes Attributable to owners of the parent
CONSOLIDATEDContributed
equity ReservesRetained earnings Total
Minority interest
Total equity
$’000 $’000 $’000 $’000 $’000 $’000
Balance at 1 July 2007 56,002 (2,913) 13,139 66,228 18,824 85,052
Profi t for the year – – 22,344 22,344 (6,581) 15,763
Business Combination Reserve 25 – 568 – 568 – 568
De recognition of put option due to step up 25 – 1,703 – 1,703 – 1,703
Buyout of 10% minority interest in casa.it 25 – – – – (184) (184)
Exchange differences on translation of foreign operations 25 – (3,399) – (3,399) (1,893) (5,292)
Contributions of equity, net of transaction costs 24 – – – – 9,664 9,664
Minority interest on acquisition of subsidiary 26 – – – – 7,550 7,550
Balance at 30 June 2008 56,002 (4,041) 35,483 87,444 27,380 114,824
Balance at 1 July 2008 56,002 (4,041) 35,483 87,444 27,380 114,824
Profi t for the year – – 946 946 (35,584) (34,638)
Exchange differences on translation of foreign operations 25 – 3,022 – 3,022 2,031 5,053
Contributions of equity, net of transaction costs 24 – – – – 7,017 7,017
Minority interest on acquisition of subsidiary 26 – – – – 580 580
Share based payments – 675 – 675 – 675
Balance at 30 June 2009 56,002 (344) 36,429 92,087 1,424 93,511
Parent entity NotesOrdinary
shares ReservesRetained earnings
Total equity
$’000 $’000 $’000 $’000
Balance at 1 July 2007 56,002 – (3,759) 52,243
Profi t for the year – – (433) (433)
Balance at 30 June 2008 56,002 – (4,192) 51,810
Balance at 1 July 2008 56,002 – (4,192) 51,810
Profi t for the year – – 21,551 21,551
Share based payments 25 – 675 – 675
Balance at 30 June 2009 56,002 675 17,359 74,036
The above statements of changes in equity should be read in conjunction with the accompanying notes.

www.rea-group.com 39
CASH FLOW STATEMENTSFor the year ended 30 June 2009
Notes Consolidated Parent entity2009
$’0002008
$’0002009
$’0002008$’000
Cash fl ows from operating activities
Receipts from customers (inclusive of goods and services tax) 205,379 163,469 – –
Payments to suppliers and employees (inclusive of goods and services tax) (157,428) (130,754) (865) (494)
47,951 32,715 (865) (494)
Interest received 644 759 504 374
Interest paid 7 (285) (726) (153) (527)
Income taxes paid (16,513) (16,877) (16,386) (16,586)
Net cash infl ow/(outfl ow) from operating activities 36 31,797 15,871 (16,900) (17,233)
Cash fl ows from investing activities
Payment for purchase of subsidiary, net of cash acquired 33 (1,183) (23,390) – (22,500)
Payments for plant and equipment 14 (4,155) (2,992) – –
Purchase of intangible assets 16 (1,010) (2,749) – –
Loans to related parties – – (888) (1,001)
Investment in subsidiaries – – – –
Proceeds from sale of plant and equipment 453 46 – –
Dividends received – – 17,936 –
Net cash (outfl ow)/infl ow from investing activities (5,895) (29,085) 17,048 (23,501)
Cash fl ows from fi nancing activities
Proceeds from issues of ordinary shares in subsidiary 7,582 13,771 – –
Proceeds from borrowings – – – 39,847
Finance lease payments (1,040) (1,298) – –
Net cash infl ow/(outfl ow) from fi nancing activities 6,542 12,473 – 39,847
Net increase/(decrease) in cash and cash equivalents 32,444 (741) 148 (887)
Cash and cash equivalents at the beginning of the fi nancial year 8,882 9,824 159 1,046
Effects of exchange rate changes on cash and cash equivalents 262 (201) – –
Cash and cash equivalents at end of year 10 41,588 8,882 307 159
Financing arrangements 21
The above cash fl ow statements should be read in conjunction with the accompanying notes.

40 REA Group Annual Report 2009
NOTES TO THE FINANCIAL STATEMENTS
1 Corporate informationThe fi nancial report of REA Group Limited for the year ended 30 June 2009 was authorised for issue in accordance with a resolution of the directors on 20 August 2009. REA Group Limited is a company limited by shares incorporated in Australia whose shares are publicly traded on the Australian Securities Exchange. During the year the Group changed its name from realestate.com.au Limited to REA Group Limited. For information pertaining to the nature of operations refer to the Directors’ Report.
2 Summary of signifi cant accounting policies
(a) Basis of preparationCompliance with IFRSThe fi nancial report is a general purpose fi nancial report, which has been prepared in accordance with the requirements of the Corporations Act 2001, Australian Accounting Standards and other authoritative pronouncements of the Australian Accounting Standards board. The fi nancial report has also been prepared on a historical cost basis, except for asset and liabilities of disposal group, which have been measured at fair value.
(b) Principles of consolidationThe consolidated fi nancial statements incorporate the assets and liabilities of all subsidiaries of REA Group Limited (‘’company’’ or ‘’parent’’) as at 30 June 2009 and the results of all subsidiaries for the year then ended. REA Group Limited and its subsidiaries together are referred to in this fi nancial report as the Group or the consolidated entity.
Subsidiaries are all those entities over which the Group has the power to govern the fi nancial and operating policies, generally accompanying a shareholding of more than one half of the voting rights. The existence and effect of potential voting rights that are currently exercisable or convertible are considered when assessing whether the Group controls another entity.
Subsidiaries are fully consolidated from the date on which control is obtained by the Group. They are de-consolidated from the date that control ceases.
The purchase method of accounting is used to account for the acquisition of subsidiaries by the Group (refer to note 2(h)).
The Group applies a policy of treating transactions with minority interests as transactions with parties external to the Group. Disposals to minority interests result in gains and losses for the Group that are recorded in the income statements. Purchases from minority interests result in goodwill, being the difference between any consideration paid and the relevant share acquired of the carrying value of identifi able net assets of the subsidiary.
Intercompany transactions, balances and unrealised gains on transactions between Group companies are eliminated. Unrealised losses are also eliminated unless the transaction provides evidence of the impairment of the asset transferred. Accounting policies of subsidiaries have been changed where necessary to ensure consistency with the policies adopted by the Group.
Minority interests in the results and equity of subsidiaries are shown separately in the consolidated income statements and balance sheets respectively.
Investments in subsidiaries are accounted for at cost in the individual fi nancial statements of REA Group Limited.
(c) Segment reportingA business segment is identifi ed for a group of assets and operations engaged in providing products or services that are subject to risks and returns that are different to those of other business segments. A geographical segment is identifi ed when products or services are provided within a particular economic environment subject to risks and returns that are different from those of segments operating in other economic environments.
(d) Foreign currency translation(i) Functional and presentation currencyItems included in the fi nancial statements of each of the Group’s entities are measured using the currency of the primary economic environment in which the entity operates (‘the functional currency’). The consolidated fi nancial statements are presented in Australian dollars, which is REA Group Limited’s functional and presentation currency.
(ii) Transactions and balancesForeign currency transactions are translated into the functional currency using the exchange rates prevailing at the dates of the transactions. Foreign exchange gains and losses resulting from the settlement of such transactions and from the translation at year end exchange rates of monetary assets and liabilities denominated in foreign currencies are recognised in the income statements, except when they are deferred in equity as qualifying cash fl ow hedges and qualifying net investment hedges or are attributable to part of the net investment in a foreign operation.
Translation differences on assets and liabilities carried at fair value are reported as part of the fair value gain or loss. Translation differences on non monetary assets and liabilities such as equities held at fair value through profi t or loss are recognised in profi t or loss as part of the fair value gain or loss. Translation differences on non monetary assets such as equities classifi ed as available for sale fi nancial assets are included in the fair value reserve in equity.

www.rea-group.com 41
2 Summary of signifi cant accounting policies (continued)(iii) Group companiesThe results and fi nancial position of all the Group entities (none of which has the currency of a hyperinfl ationary economy) that have a functional currency different from the presentation currency are translated into the presentation currency as follows:
Assets and liabilities for each balance sheets presented are translated at the closing rate at the date of that balance sheets•
Income and expenses for each income statements are translated at average exchange rates (unless this is not a reasonable approximation • of the cumulative effect of the rates prevailing on the transaction dates, in which case income and expenses are translated at the dates of the transactions), and
All resulting exchange differences are recognised as a separate component of equity.•
(e) Revenue recognitionRevenue is measured at the fair value of the consideration received or receivable. Amounts disclosed as revenue are net of returns, trade allowances, rebates and amounts collected on behalf of third parties.
The Group recognises revenue when the amount of revenue can be reliably measured, it is probable that future economic benefi ts will fl ow to the entity and specifi c criteria have been met for each of the Group’s activities as described below. The amount of revenue is not considered to be reliably measurable until all contingencies relating to the sale have been resolved. The Group bases its estimates on historical results, taking into consideration the type of customer, the type of transaction and the specifi cs of each arrangement.
Revenue is recognised for the major business activities as follows:
(i) Rendering of servicesRevenue is recognised where the contract outcome can be estimated reliably and control of the right to be compensated for their services and the stage of completion can be reliably measured. Advance billings are deferred and released in the appropriate period when the service is delivered. Prepayments are capitalised and released in the appropriate period when service is delivered.
(ii) Interest incomeInterest income is recognised where control of the right to receive interest payments can be reliably measured.
(f) Income taxThe income tax expense or revenue for the period is the tax payable on the current period’s taxable income based on the applicable income tax rate for each jurisdiction adjusted by changes in deferred tax assets and liabilities attributable to temporary differences and to unused tax losses.
Deferred income tax is provided in full, using the liability method, on temporary differences arising between the tax bases of assets and liabilities and their carrying amounts in the consolidated fi nancial statements. However, the deferred income tax is not accounted for if it arises from initial recognition of an asset or liability in a transaction other than a business combination that at the time of the transaction affects neither accounting nor taxable profi t or loss. Deferred income tax is determined using tax rates (and laws) that have been enacted or substantially enacted by the reporting date and are expected to apply when the related deferred income tax asset is realised or the deferred income tax liability is settled.
Deferred tax assets are recognised for deductible temporary differences and unused tax losses only if it is probable that future taxable amounts will be available to utilise those temporary differences and losses.
Deferred tax liabilities and assets are not recognised for temporary differences between the carrying amount and tax bases of investments in controlled entities where the parent entity is able to control the timing of the reversal of the temporary differences and it is probable that the differences will not reverse in the foreseeable future.
Deferred tax assets and liabilities are offset when there is a legally enforceable right to offset current tax assets and liabilities and when the deferred tax balances relate to the same taxation authority. Current tax assets and tax liabilities are offset where the entity has a legally enforceable right to offset and intends either to settle on a net basis, or to realise the asset and settle the liability simultaneously.
Current and deferred tax balances attributable to amounts recognised directly in equity are also recognised directly in equity.
Tax consolidation legislationREA Group Limited and its wholly owned Australian controlled entities have implemented the tax consolidation legislation.
The head entity, REA Group Limited, and the controlled entities in the tax consolidated group account for their own current and deferred tax amounts. These tax amounts are measured as if each entity in the tax consolidated group continues to be a stand alone taxpayer in its own right.
In addition to its own current and deferred tax amounts, REA Group Limited also recognises the current tax liabilities (or assets) and the deferred tax assets arising from unused tax losses and unused tax credits assumed from controlled entities in the tax consolidated group.
Assets or liabilities arising under tax funding agreements with the tax consolidated entities are recognised as amounts receivable from or payable to other entities in the Group. Details about the tax funding agreement are disclosed in note 8.
42 REA Group Annual Report 2009
NOTES TO THE FINANCIAL STATEMENTS CONTINUED
2 Summary of signifi cant accounting policies (continued)
(g) LeasesLeases of property, plant and equipment where the Group, as lessee, has substantially all the risks and rewards of ownership are classifi ed as fi nance leases (note 14). Finance leases are capitalised at the lease’s inception at the fair value of the leased property or, if lower, the present value of the minimum lease payments. The corresponding rental obligations, net of fi nance charges, are included in other short term and long term payables. Each lease payment is allocated between the liability and fi nance cost. The fi nance cost is charged to the income statements over the lease period so as to produce a constant periodic rate of interest on the remaining balance of the liability for each period. The property, plant and equipment acquired under fi nance leases is depreciated over the asset’s useful life or over the shorter of the asset’s useful life and the lease term if there is no reasonable certainty that the Group will obtain ownership at the end of the lease term.
Leases in which a signifi cant portion of the risks and rewards of ownership are not transferred to the Group as lessee are classifi ed as operating leases (note 31). Payments made under operating leases (net of any incentives received from the lessor) are charged to the income statements on a straight line basis over the period of the lease.
(h) Business combinationsThe purchase method of accounting is used to account for all business combinations, including business combinations involving entities or businesses under common control, regardless of whether equity instruments or other assets are acquired. Cost is measured as the fair value of the assets given, equity instruments issued or liabilities incurred or assumed at the date of exchange plus costs directly attributable to the acquisition.
Identifi able assets acquired and liabilities and contingent liabilities assumed in a business combination are measured initially at their fair values at the acquisition date, irrespective of the extent of any minority interest. The excess of the cost of acquisition over the fair value of the Group’s share of the identifi able net assets acquired is recorded as goodwill (refer to note 2(n)). If the cost of acquisition is less than the Group’s share of the fair value of the identifi able net assets of the subsidiary acquired, the difference is recognised directly in the income statement, but only after a reassessment of the identifi cation and measurement of the net assets acquired.
Where settlement of any part of cash consideration is deferred, the amounts payable in the future are discounted to their present value as at the date of exchange. The discount rate used is the entity’s incremental borrowing rate, being the rate at which a similar borrowing could be obtained from an independent fi nancier under comparable terms and conditions.
(i) Impairment of assetsGoodwill and intangible assets that have an indefi nite useful life are not subject to amortisation and are tested annually for impairment, or more frequently if events or changes in circumstances indicate that they might be impaired. Other assets are tested for impairment whenever events or changes in circumstances indicate that the carrying amount may not be recoverable. An impairment loss is recognised for the amount by which the asset’s carrying amount exceeds its recoverable amount. The recoverable amount is the higher of an asset’s fair value less costs to sell and value in use. For the purposes of assessing impairment, assets are grouped at the lowest levels for which there are separately identifi able cash infl ows which are largely independent of the cash infl ows from other assets or groups of assets (cash generating units). Non fi nancial assets other than goodwill that suffered an impairment are reviewed for possible reversal of the impairment at each reporting date.
(j) Cash and cash equivalentsFor cash fl ow statements presentation purposes, cash and cash equivalents includes cash on hand, deposits held at call with fi nancial institutions, other short term, highly liquid investments with original maturities of three months or less that are readily convertible to known amounts of cash and which are subject to an insignifi cant risk of changes in value, and bank overdrafts. Bank overdrafts are shown within borrowings in current liabilities on the balance sheets.
(k) Trade receivablesTrade receivables are recognised initially at fair value and subsequently measured at amortised cost using the effective interest method, less provision for impairment. Trade receivables are generally due for settlement within 2 weeks.
Collectibility of trade receivables is reviewed on an ongoing basis. Debts which are known to be uncollectible are written off by reducing the carrying amount directly. An allowance account (provision for impairment of trade receivables) is used when there is objective evidence that the Group will not be able to collect all amounts due according to the original terms of the receivables. Signifi cant fi nancial diffi culties of the debtor, probability that the debtor will enter bankruptcy or fi nancial reorganisation, and default or delinquency in payments (more than 30 days overdue) are considered indicators that the trade receivable is impaired. The amount of the impairment allowance is the difference between the asset’s carrying amount and the present value of estimated future cash fl ows, discounted at the original effective interest rate. Cash fl ows relating to short term receivables are not discounted if the effect of discounting is immaterial.
The amount of the impairment loss is recognised in the income statements within other expenses. When a trade receivable for which an impairment allowance had been recognised becomes uncollectible in a subsequent period, it is written off against the allowance account. Subsequent recoveries of amounts previously written off are credited against other expenses in the income statements.
The carrying amount of the asset is reduced through the use of an allowance account and the amount of the loss is recognised in the income statements within ‘other expenses’. When a trade receivable is uncollectible, it is written off against the allowance account for trade receivables. Subsequent recoveries of amounts previously written off are credited against other expense in the income statements.

www.rea-group.com 43
2 Summary of signifi cant accounting policies (continued)
(l) Investments and other fi nancial assetsA fi nancial asset or, where applicable, a part of a fi nancial asset or part of a group of similar fi nancial assets is derecognised when:
The rights to receive cash fl ows from the asset have expired;•
The group retains the right to receive cash fl ows from the asset, but has assumed an obligation to pay them in full without material delay • to a third party under a ‘pass through’ arrangement; or
The group has transferred its rights to receive cash fl ows from the asset and either (a) has transferred substantially all the risks and rewards • of the asset, or (b) has neither transferred nor retained substantially all the risks and rewards of the asset, but has transferred control of the asset.
(m) Plant and equipmentPlant and equipment is stated at cost less accumulated depreciation and any accumulated impairment losses. Such cost includes the cost of replacing parts that are eligible for capitalisation when the cost of replacing the parts is incurred.
Depreciation is calculated on a straight line basis over the estimated useful life of the asset as follows:
Leasehold improvements the lease term•
Plant and equipment – over 2 to 10 years •
The assets’ residual values, useful lives and amortisation methods are reviewed, and adjusted if appropriate, at each fi nancial year end.
An asset’s carrying amount is written down immediately to its recoverable amount if the asset’s carrying amount is greater than its estimated recoverable amount (note 2(i)).
Gains and losses on disposals are determined by comparing proceeds with carrying amount. These are included in the income statements. When revalued assets are sold, it is Group policy to transfer any amounts included in other reserves in respect of those assets to retained earnings.
(n) Intangible assets(i) GoodwillGoodwill represents the excess of the cost of an acquisition over the fair value of the Group’s share of the net identifi able assets of the acquired subsidiary/associate at the date of acquisition. Goodwill on acquisitions of subsidiaries is included in intangible assets. Goodwill on acquisitions of associates is included in investments in associates. Goodwill is not amortised. Instead, goodwill is tested for impairment annually, or more frequently if events or changes in circumstances indicate that it might be impaired, and is carried at cost less accumulated impairment losses. Gains and losses on the disposal of an entity include the carrying amount of goodwill relating to the entity sold.
Goodwill is allocated to cash generating units for the purpose of impairment testing. Each of those cash generating units represents the Group’s investment in each country of operation by each primary reporting segment (note 5).
(ii) IT development and softwareCosts incurred in developing products or systems and costs incurred in acquiring software and licenses that will contribute to future period fi nancial benefi ts through revenue generation and/or cost reduction are capitalised to software and systems. Costs capitalised include external direct costs of materials and service and direct payroll and payroll related costs of employees’ time spent on the project. Amortisation is calculated on a straight line basis generally over 3 years.
IT development costs include only those costs directly attributable to the development phase and are only recognised following completion of technical feasibility and where the Group has an intention and ability to use the asset.
(iii) Customer lists / domain names / brand names / advertising relationshipsWhen these assets are acquired as part of a business combination they are recognised separately from goodwill. The assets are carried at their fair value at the date of acquisition less accumulated amortisation and impairment losses. Amortisation is calculated based on the timing of projected cash fl ows of the contracts over their estimated useful lives, which currently vary from 5 to 11 years.
Gains or losses arising from de recognition of an intangible asset are measured as the difference between the net disposal proceeds and the carrying amount of the asset and are recognised in profi t or loss when the asset is derecognised.
There are no intangible assets with indefi nite lives in the Group.
(o) Trade and other payablesTrade and other payables are carried at amortised cost due to their short term and are not discounted.
These amounts represent liabilities for goods and services provided to the Group prior to the end of fi nancial year which are unpaid. The amounts are unsecured and are usually paid within 60 days of recognition.
(p) BorrowingsBorrowings are initially recognised at fair value, net of transaction costs incurred. Borrowings are subsequently measured at amortised cost. Any difference between the proceeds (net of transaction costs) and the redemption amount is recognised in the income statements over the period of the borrowings using the effective interest method. Fees paid on the establishment of loan facilities are recognised as transaction costs of the loan to the extent that it is probable that some or all of the facility will be drawn down. In this case, the fee is deferred until the draw down occurs. To the extent there is no evidence that it is probable that some or all of the facility will be drawn down, the fee is capitalised as a prepayment for liquidity services and amortised over the period of the facility to which it relates.

44 REA Group Annual Report 2009
NOTES TO THE FINANCIAL STATEMENTS CONTINUED
2 Summary of signifi cant accounting policies (continued)
(q) Borrowing costsBorrowing costs are recognised as an expense when incurred.
(r) ProvisionsProvisions are measured at the present value of management’s best estimate of the expenditure required to settle the present obligation at the reporting date. The discount rate used to determine the present value refl ects current market assessments of the time value of money and the risks specifi c to the liability. The increase in the provision due to the passage of time is recognised as interest expense.
(s) Employee benefi ts(i) Wages and salaries, annual leave and sick leaveLiabilities for wages and salaries, including non monetary benefi ts, annual leave and accumulating sick leave due to be settled within 12 months of the reporting date are recognised in other payables in respect of employees’ services up to the reporting date and are measured at the amounts expected to be paid when the liabilities are settled.
(ii) Long service leaveThe liability for long service leave is recognised in the provision for employee benefi ts and measured as the present value of expected future payments to be made in respect of services provided by employees up to the reporting date using the projected unit credit method. Consideration is given to expected future wage and salary levels, experience of employee departures and periods of service. Expected future payments are discounted using market yields at the reporting date on national government bonds with terms to maturity and currency that match, as closely as possible, the estimated future cash outfl ows.
(iii) Share based paymentsThe Group provides benefi ts to its employees (including key management personnel) in the form of share based payments, whereby employees render services in exchange for shares or rights over shares (equity settled transactions). There is currently one plan in place, the Long Term Incentive Plan (LTIP), which provides benefi ts to executives identifi ed by the Board. The fair value of each performance right is estimated at grant date using a Monte Carlo simulation. The valuation was performed independently by KPMG.
The cost of equity settled transactions is recognised, together with a corresponding increase in equity, over the period in which the performance and/or service conditions are fulfi lled (the vesting period), ending on the date on which the relevant employees become fully entitled to the award (the vesting date). At each subsequent reporting date until vesting, the cumulative charge to the income statement is in accordance with the vesting conditions as set out under the Group’s Long Term Incentive Plan (note 38).
Equity settled awards granted by REA Group Limited to employees of subsidiaries are recognised in the subsidiaries’ separate fi nancial statements as an expense with a corresponding credit to equity. As a result, the expense recognised by the Group is the total expense associated with all such awards. Until an award has vested, any amounts recorded are contingent and will be adjusted if more or fewer awards vest than were originally anticipated.
The dilutive effect, if any, of outstanding rights is considered as immaterial for the current fi nancial year and consequently is not refl ected as additional share dilution in the computation of diluted earnings per share.
The Group currently does not provide benefi ts in the form of cash settled share based payments.
(t) Contributed equityOrdinary shares are classifi ed as equity.
(u) Earnings per share(i) Basic earnings per shareBasic earnings per share is calculated by dividing:
the profi t attributable to equity holders of the company, excluding any costs of servicing equity other than ordinary shares•
by the weighted average number of ordinary shares outstanding during the fi nancial year, adjusted for bonus elements in ordinary shares • issued during the year and excluding treasury shares (note 24).
(ii) Diluted earnings per shareDiluted earnings per share adjusts the fi gures used in the determination of basic earnings per share to take into account:
the after income tax effect of interest and other fi nancing costs associated with dilutive potential ordinary shares, and•
the weighted average number of additional ordinary shares that would have been outstanding assuming the conversion of all dilutive • potential ordinary shares.
(v) Goods and Services Tax (GST)Revenues, expenses and assets are recognised net of the amount of associated GST, unless the GST incurred is not recoverable from the taxation authority. In this case it is recognised as part of the cost of acquisition of the asset or as part of the expense.
Receivables and payables are stated inclusive of the amount of GST receivable or payable. The net amount of GST recoverable from, or payable to, the taxation authority is included with other receivables or payables in the balance sheets.
Cash fl ows are presented on a gross basis. The GST components of cash fl ows arising from investing or fi nancing activities which are recoverable from, or payable to the taxation authority, are presented as operating cash fl ows.

www.rea-group.com 45
2 Summary of signifi cant accounting policies (continued)
(w) Rounding of amountsThe company is of a kind referred to in Class Order 98/100, issued by the Australian Securities and Investments Commission, relating to the ‘’rounding off’’ of amounts in the fi nancial report. Amounts in the fi nancial report have been rounded off in accordance with that Class Order to the nearest thousand dollars, or in certain cases, the nearest dollar.
(x) Statement of complianceThe entity has had regard to the various amendments and has determined that with the exception of the items listed in the table below, they do not impact the accounting policies applied in the preparation of the Group’s fi nancial statements.
Reference Title Summary
Application date of standard Impact on Group fi nancial report
Application date for Group
AASB 101 (Revised) and AASB 2007-8
Presentation of Financial Statements and consequential amendments to other Australian Accounting Standards
Introduces a statement of comprehensive income.
Other revisions include impacts on the presentation of items in the statement of changes in equity, new presentation requirements for restatements or reclassifi cations of items in the fi nancial statements, changes in the presentation requirements for dividends and changes to the titles of the fi nancial statements.
1 January 2009
These amendments are only expected to affect the presentation of the Group’s fi nancial report and will not have a direct impact on the measurement and recognition of amounts disclosed in the fi nancial report.
1 July 2009
AASB 3 (Revised)
Business combinations
The revised standard introduces a number of changes to the accounting for business combinations, the most signifi cant of which allows entities a choice for each business combination entered into to measure a non controlling interest (formerly a minority interest) in the acquiree either at its fair value or at its proportionate interest in the acquiree’s net assets. This choice will effectively result in recognising goodwill relating to 100% of the business (applying the fair value option) or recognising goodwill relating to the percentage interest acquired. The changes apply prospectively.
1 July 2009 The Group may enter into some business combinations during the next fi nancial year. The main impact of the changes would include: expensing of transaction costs; contingent consideration and step acquisitions, if any, to be measured at fair value, with any subsequent changes recognised in profi t or loss; and reassessment of assets and liabilities. This is to be applied prospectively and therefore there will be no impact on prior periods in the Group’s 2010 fi nancial statements.
1 July 2009
AASB 127 (Revised)
Consolidated and Separate Financial Statements
Requires accounting for changes in ownership interests by the Group in a subsidiary, while maintaining control, to be recognised as an equity transaction. In addition the cost method was eliminated and the criteria for recognition of dividends as dividend income have been changed.
1 July 2009 If the Group loses control of a subsidiary, any interest retained in the former subsidiary will be measured at fair value with the gain or loss recognised in the profi t or loss.
All dividends from a subsidiary, jointly controlled entity or associate will have to be recognised in the profi t and loss in respective separate fi nancial statements. These amendments are not expected to have a signifi cant impact on the consolidated fi nancial statements.
1 July 2009
The fi nancial report complies with Australian Accounting Standards as issued by the Australian Accounting Standards Board and International Financial Reporting Standards (IFRS) as issued by the International Accounting Standards Board.
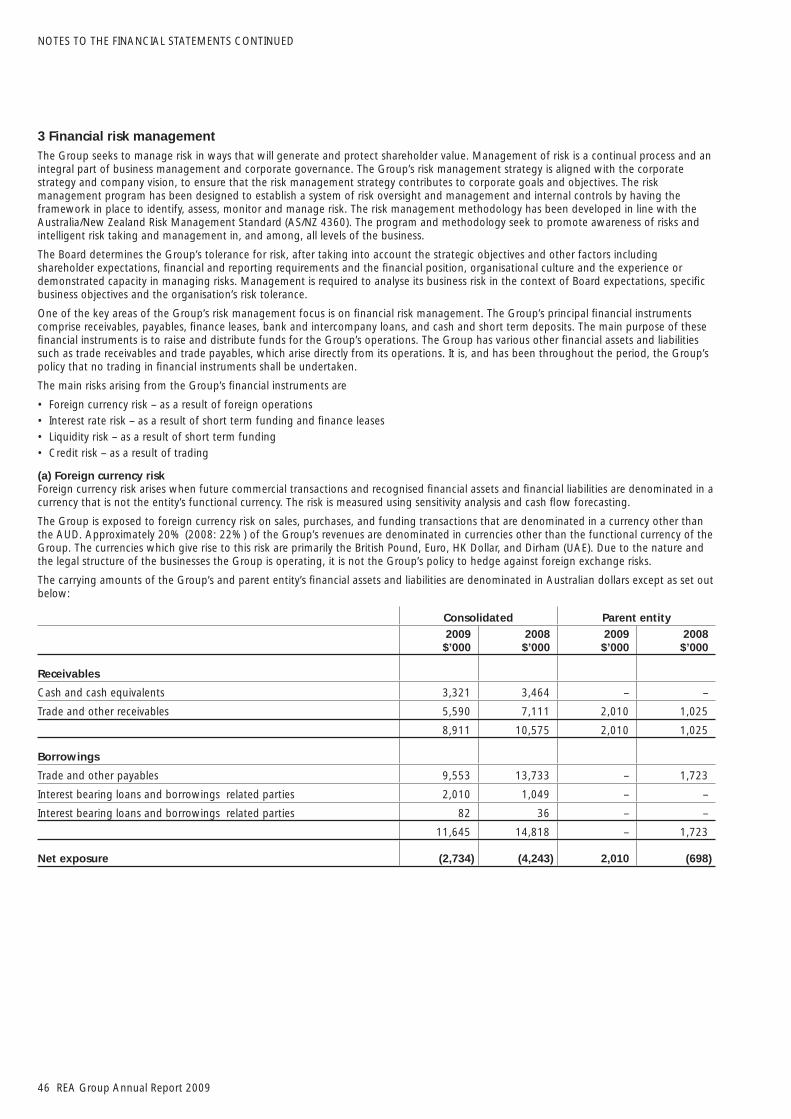
46 REA Group Annual Report 2009
NOTES TO THE FINANCIAL STATEMENTS CONTINUED
3 Financial risk managementThe Group seeks to manage risk in ways that will generate and protect shareholder value. Management of risk is a continual process and an integral part of business management and corporate governance. The Group’s risk management strategy is aligned with the corporate strategy and company vision, to ensure that the risk management strategy contributes to corporate goals and objectives. The risk management program has been designed to establish a system of risk oversight and management and internal controls by having the framework in place to identify, assess, monitor and manage risk. The risk management methodology has been developed in line with the Australia/New Zealand Risk Management Standard (AS/NZ 4360). The program and methodology seek to promote awareness of risks and intelligent risk taking and management in, and among, all levels of the business.
The Board determines the Group’s tolerance for risk, after taking into account the strategic objectives and other factors including shareholder expectations, fi nancial and reporting requirements and the fi nancial position, organisational culture and the experience or demonstrated capacity in managing risks. Management is required to analyse its business risk in the context of Board expectations, specifi c business objectives and the organisation’s risk tolerance.
One of the key areas of the Group’s risk management focus is on fi nancial risk management. The Group’s principal fi nancial instruments comprise receivables, payables, fi nance leases, bank and intercompany loans, and cash and short term deposits. The main purpose of these fi nancial instruments is to raise and distribute funds for the Group’s operations. The Group has various other fi nancial assets and liabilities such as trade receivables and trade payables, which arise directly from its operations. It is, and has been throughout the period, the Group’s policy that no trading in fi nancial instruments shall be undertaken.
The main risks arising from the Group’s fi nancial instruments are
Foreign currency risk – as a result of foreign operations•
Interest rate risk – as a result of short term funding and fi nance leases•
Liquidity risk – as a result of short term funding•
Credit risk – as a result of trading•
(a) Foreign currency riskForeign currency risk arises when future commercial transactions and recognised fi nancial assets and fi nancial liabilities are denominated in a currency that is not the entity’s functional currency. The risk is measured using sensitivity analysis and cash fl ow forecasting.
The Group is exposed to foreign currency risk on sales, purchases, and funding transactions that are denominated in a currency other than the AUD. Approximately 20% (2008: 22%) of the Group’s revenues are denominated in currencies other than the functional currency of the Group. The currencies which give rise to this risk are primarily the British Pound, Euro, HK Dollar, and Dirham (UAE). Due to the nature and the legal structure of the businesses the Group is operating, it is not the Group’s policy to hedge against foreign exchange risks.
The carrying amounts of the Group’s and parent entity’s fi nancial assets and liabilities are denominated in Australian dollars except as set out below:
Consolidated Parent entity2009
$’0002008
$’0002009
$’0002008
$’000
Receivables
Cash and cash equivalents 3,321 3,464 – –
Trade and other receivables 5,590 7,111 2,010 1,025
8,911 10,575 2,010 1,025
Borrowings
Trade and other payables 9,553 13,733 – 1,723
Interest bearing loans and borrowings related parties 2,010 1,049 – –
Interest bearing loans and borrowings related parties 82 36 – –
11,645 14,818 – 1,723
Net exposure (2,734) (4,243) 2,010 (698)

www.rea-group.com 47
3 Financial risk management (continued)The following sensitivity is based on the foreign currency risk exposure in existence at balance sheet date. 10% or 5% movements are key indicators of a signifi cant change in the impact of fi nancial risks for the UK, and all European locations and are based on available historic movements. For other locations (such as Hong Kong and Dubai) a higher tolerance was allowed to refl ect the higher volatility of these currencies. As at 30 June 2009, had the Australian Dollar moved, with all other variables held constant, post tax profi t and equity would have been affected as illustrated in the table below.
Management have assessed the closing net positions of each entity’s assets in the table below for movements in currency to highlight the potential impact on the net asset position. There were no material impacts identifi ed based on the parameters used.
Consolidated Parent entity2009
$’0002008
$’0002009
$’0002008$’000
Net Profi t After Tax Higher / (Lower)
AUD/GBP +10% (AUD depreciating) (7,160) (1,534) – –
AUD/GBP -5% (AUD appreciating) 3,580 767 – –
AUD/Euro +10% (AUD depreciating) (555) (329) 201 102
AUD/Euro -5% (AUD appreciating) 278 164 (100) (51)
AUD/HKD +20% (AUD depreciating) (1,003) (485) (1) (345)
AUD/HKD -10% (AUD appreciating) 501 242 – 172
AUD/AED +20% (AUD depreciating) (499) (137) – –
AUD/AED -10% (AUD appreciating) 244 69 – –
Equity Higher / (Lower)
AUD/GBP +10% (AUD depreciating) 1,626 6,584 – –
AUD/GBP -5% (AUD appreciating) (813) (3,292) – –
AUD/Euro +10% (AUD depreciating) 1,777 1,808 201 102
AUD/Euro -5% (AUD appreciating) (889) (904) (100) (51)
AUD/HKD +20% (AUD depreciating) (183) 261 (1) (345)
AUD/HKD -10% (AUD appreciating) 92 (130) – 172
AUD/AED +20% (AUD depreciating) (41) 309 – –
AUD/AED -10% (AUD appreciating) 21 (154) – –
Given the funding structure of the Group, the relative immaterial impact of FX movements, the Group policy does not specify a need for foreign currency hedging. Management believe the balance sheet date risk exposures are representative of the risk exposure inherent in the fi nancial instruments.
(b) Liquidity riskThe Group’s objective is to maintain a balance between continuity of funding and fl exibility through the use of bank overdrafts, bank and related party loans, and fi nance leases contracts.
All funding requirements are coordinated and established via corporate head offi ce in Australia for all Group operations, thereby enabling a centralised treasury management approach. The Group minimises liquidity risk by maintaining a suffi cient level of cash and equivalents, as well as ensuring the Group has access to short term credit facilities as required. Assuming all variables are equal, no long term facilities are required.
Maturity analysis of fi nancial assets and liabilitiesMost instruments mature in the short term. The Group is cash fl ow positive without any material long term cash commitments other than those disclosed under commitments and contingencies. As a result of this, external funding usually matures within one year, therefore the two maturity bands as shown below were chosen, which focus on the fi rst 12 months.
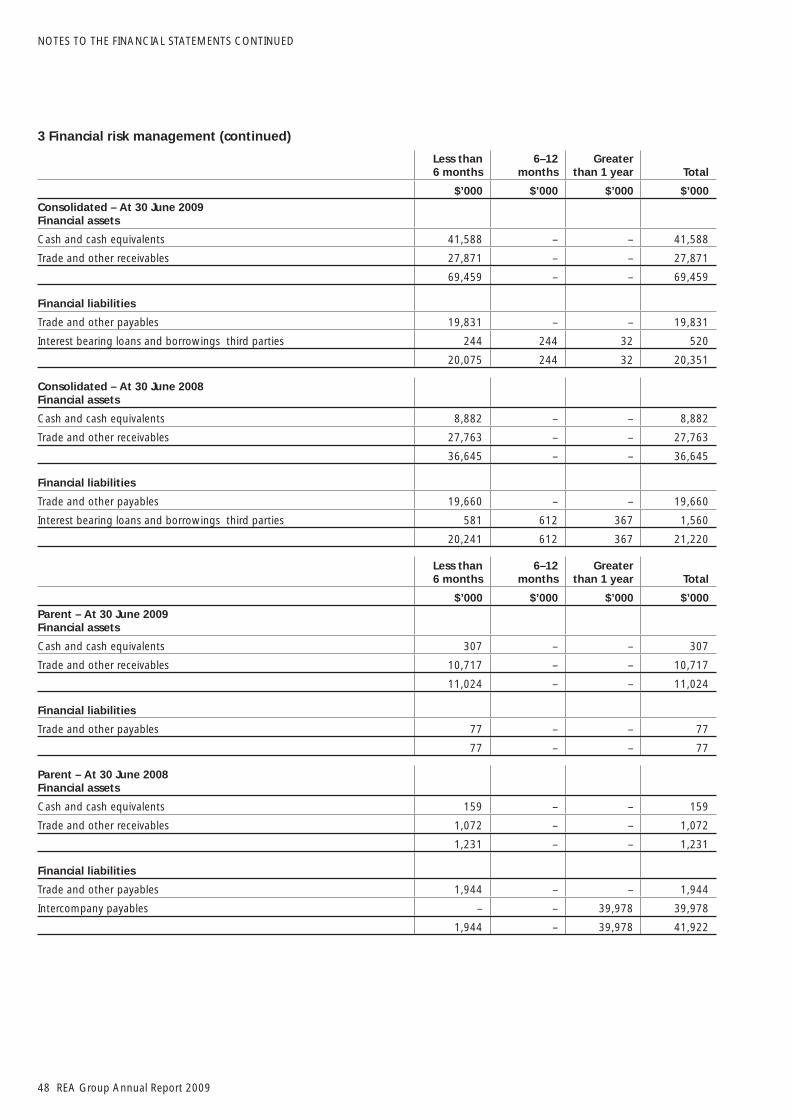
48 REA Group Annual Report 2009
NOTES TO THE FINANCIAL STATEMENTS CONTINUED
3 Financial risk management (continued)
Less than6 months
6–12 months
Greater than 1 year Total
$’000 $’000 $’000 $’000Consolidated – At 30 June 2009 Financial assets
Cash and cash equivalents 41,588 – – 41,588
Trade and other receivables 27,871 – – 27,871
69,459 – – 69,459
Financial liabilities
Trade and other payables 19,831 – – 19,831
Interest bearing loans and borrowings third parties 244 244 32 520
20,075 244 32 20,351
Consolidated – At 30 June 2008 Financial assets
Cash and cash equivalents 8,882 – – 8,882
Trade and other receivables 27,763 – – 27,763
36,645 – – 36,645
Financial liabilities
Trade and other payables 19,660 – – 19,660
Interest bearing loans and borrowings third parties 581 612 367 1,560
20,241 612 367 21,220
Less than6 months
6–12 months
Greater than 1 year Total
$’000 $’000 $’000 $’000Parent – At 30 June 2009 Financial assets
Cash and cash equivalents 307 – – 307
Trade and other receivables 10,717 – – 10,717
11,024 – – 11,024
Financial liabilities
Trade and other payables 77 – – 77
77 – – 77
Parent – At 30 June 2008 Financial assets
Cash and cash equivalents 159 – – 159
Trade and other receivables 1,072 – – 1,072
1,231 – – 1,231
Financial liabilities
Trade and other payables 1,944 – – 1,944
Intercompany payables – – 39,978 39,978
1,944 – 39,978 41,922

www.rea-group.com 49
3 Financial risk management (continued)
(c) Interest rate riskThe Group’s exposure to the risk of change in market interest rates relates primarily to the Group’s short term debt obligations of a fl oating interest rate loan as described in note 21. Domestic interest rate movements contribute to 100% (2008: 100%) of overall interest rate risk exposure, therefore no further analysis of the impact of foreign interest rate changes was necessary.
As at 30 June 2009, the Group had the following fi nancial assets and liabilities exposed to interest rate risk:
Consolidated Parent entity2009
$’0002008
$’0002009
$’0002008$’000
Financial assets
Cash and cash equivalents 41,588 8,882 307 159
Trade and other receivables – – 2,010 1,022
Total fi nancial assets 41,588 8,882 2,317 1,181
Interest bearing loans and borrowings third parties 520 1,560 – –
Total fi nancial liabilities 520 1,560 – –
Net exposure 41,068 7,322 2,317 1,181
The Group has managed its interest rate risk by the use of fi xed rate instrument (fi nance lease) and by maximising the interest earned from the funds balanced against the working capital needs.
The following sensitivity is based on the interest rate risk exposure in existence at balance sheet date and was based on historic movements in interest rates. As at 30 June 2009, with all other variables held constant, post tax profi t and equity would have been affected as illustrated in the table below.
Consolidated Parent entity2009
$’0002008
$’0002009
$’0002008$’000
Post Tax Profi t Higher / (Lower)
+1.0% (100 basis points) 59 89 71 2
-1.0% (100 basis points) (59) (89) (71) (2)
Management believes the risk exposure at balance sheet date is representative of the risk exposure inherent in the fi nancial instruments. There is uncertainty in the market if interest rates will rise further or drop in the near future. Management has consequentially chosen the above variation which is representative for the annual average interest rate increases of the last couple of years.
(d) Credit riskReceivable balances are monitored on an ongoing basis. The Group’s exposure to bad debts is not signifi cant. There are no signifi cant concentrations of credit risk with single counterparties within the Group. Since the Group trades only with recognised third parties, there is no requirement for collateral. The consolidated Group’s maximum exposures to credit risk at balance date in relation to each class of recognised fi nancial asset is the carrying amount of those assets as indicated in the balance sheet.
In the history of the Group, there have not been signifi cant write offs of trade debtors. Our policies determine on an individual debtor basis, the likelihood for default. The monthly analysis performed of the trade debtor portfolio does not suggest any material credit risk exposure. With respect to credit risk arising from the other fi nancial assets of the Group, which comprise cash and cash equivalents, the Group’s exposure to credit risk arises from default of the counter party, with a maximum exposure equal to the carrying amount of these instruments.
All assets and liabilities recognised in the balance sheet whether carried at cost or at fair value are recognised at amounts that represent a reasonable approximation of fair value unless otherwise stated.

50 REA Group Annual Report 2009
NOTES TO THE FINANCIAL STATEMENTS CONTINUED
4 Critical accounting estimates and judgementsEstimates and judgements are continually evaluated and are based on historical experience and other factors, including expectations of future events that may have a fi nancial impact on the entity and that are believed to be reasonable under the circumstances.
(a) Critical accounting estimates and assumptionsThe Group makes estimates and assumptions concerning the future. The resulting accounting estimates will, by defi nition, seldom equal the related actual results. The estimates and assumptions that have a signifi cant risk of causing a material adjustment to the carrying amounts of assets and liabilities within the next fi nancial year are discussed below.
(i) Estimated impairment of goodwillThe Group tests annually whether goodwill has suffered any impairment, in accordance with the accounting policy stated in note 2(n). The recoverable amounts of cash generating units have been determined based on value in use calculations. These calculations require the use of assumptions. Refer to note 16 for details of these assumptions and the potential impact of changes to the assumptions.
(ii) Income taxesThe Group is subject to income taxes in Australia and jurisdictions where it has foreign operations. Signifi cant judgement is required in determining the worldwide provision for income taxes. There are many transactions and calculations undertaken during the ordinary course of business for which the ultimate tax determination is uncertain. The Group estimates its tax liabilities based on the Group’s understanding of the tax law. Where the fi nal tax outcome of these matters is different from the amounts that were initially recorded, such differences will impact the current and deferred tax provisions in the period in which such determination is made.
In addition, the Group has recognised deferred tax assets relating to carried forward tax losses to the extent there are suffi cient taxable temporary differences (deferred tax liabilities) relating to the same taxation authority and the same subsidiary against which the unused tax losses can be utilised. However, utilisation of the tax losses also depends on the ability of the entity to satisfy certain tests at the time the losses are recouped.
(iii) Long Service Leave Provision The liability for long service leave provision is recognised and measured at the present value of the estimated future cash fl ows to be made in respect of all employees at balance sheet date. In determining the present value of the liability, attrition rates and pay increases through promotion and infl ation have been taken into account.
(iv) Estimation of useful lives of assets The estimation of useful lives of assets has been based on historic experience, lease terms, and turnover policies.
(b) Critical judgements in applying the entity’s accounting policiesImpairment of non fi nancial assets other than goodwill The Group assesses impairment of all assets at each reporting date by evaluating conditions specifi c to the Group and to the particular asset that may lead to impairment.
Share based payment transactionsThe Group measures the cost of equity settled transactions with employees by reference to the fair value of the equity instruments at the date at which they are granted. The fair value is determined with the assistance of an external valuer using a monte carlo model, with the assumptions detailed in note 38. The accounting estimates and assumptions relating to equity settled share based payments would have no impact on the carrying amounts of assets and liabilities within the next annual reporting period but may impact expenses and equity.
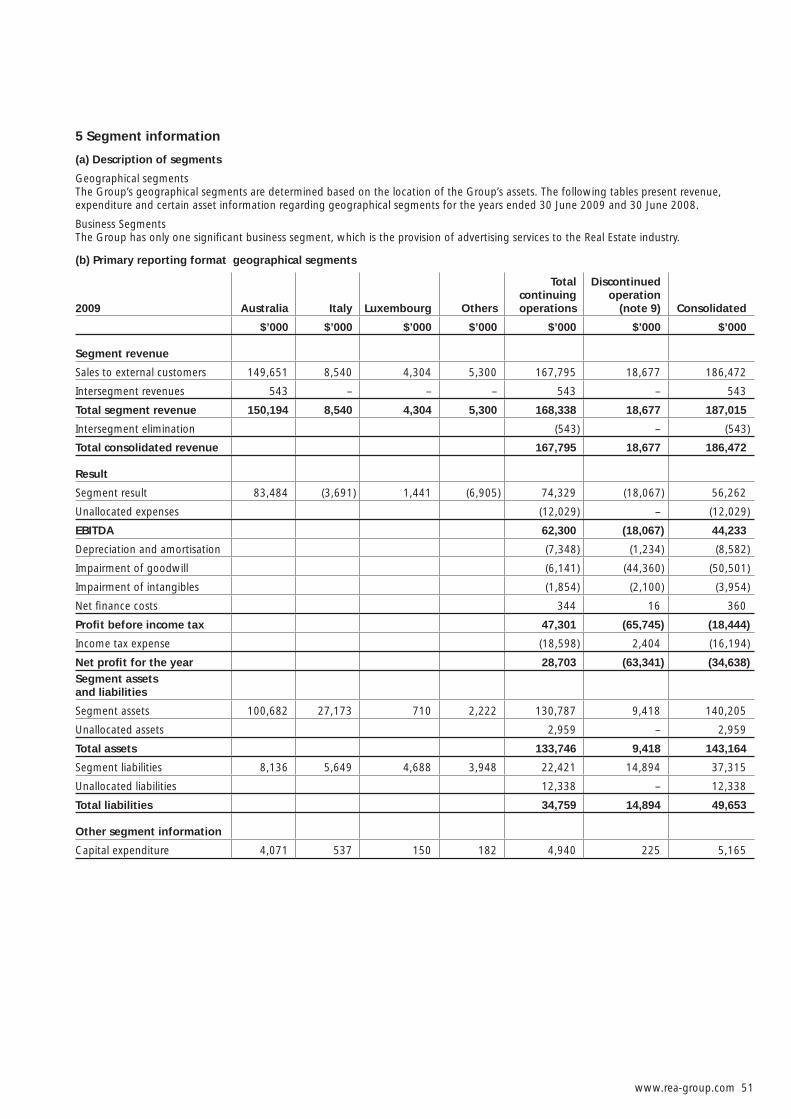
www.rea-group.com 51
5 Segment information
(a) Description of segments
Geographical segmentsThe Group’s geographical segments are determined based on the location of the Group’s assets. The following tables present revenue, expenditure and certain asset information regarding geographical segments for the years ended 30 June 2009 and 30 June 2008.
Business SegmentsThe Group has only one signifi cant business segment, which is the provision of advertising services to the Real Estate industry.
(b) Primary reporting format geographical segments
2009 Australia Italy Luxembourg Others
Total continuing operations
Discontinued operation
(note 9) Consolidated
$’000 $’000 $’000 $’000 $’000 $’000 $’000
Segment revenue
Sales to external customers 149,651 8,540 4,304 5,300 167,795 18,677 186,472
Intersegment revenues 543 – – – 543 – 543
Total segment revenue 150,194 8,540 4,304 5,300 168,338 18,677 187,015
Intersegment elimination (543) – (543)
Total consolidated revenue 167,795 18,677 186,472
Result
Segment result 83,484 (3,691) 1,441 (6,905) 74,329 (18,067) 56,262
Unallocated expenses (12,029) – (12,029)
EBITDA 62,300 (18,067) 44,233
Depreciation and amortisation (7,348) (1,234) (8,582)
Impairment of goodwill (6,141) (44,360) (50,501)
Impairment of intangibles (1,854) (2,100) (3,954)
Net fi nance costs 344 16 360
Profi t before income tax 47,301 (65,745) (18,444)
Income tax expense (18,598) 2,404 (16,194)
Net profi t for the year 28,703 (63,341) (34,638)Segment assets and liabilities
Segment assets 100,682 27,173 710 2,222 130,787 9,418 140,205
Unallocated assets 2,959 – 2,959
Total assets 133,746 9,418 143,164
Segment liabilities 8,136 5,649 4,688 3,948 22,421 14,894 37,315
Unallocated liabilities 12,338 – 12,338
Total liabilities 34,759 14,894 49,653
Other segment information
Capital expenditure 4,071 537 150 182 4,940 225 5,165
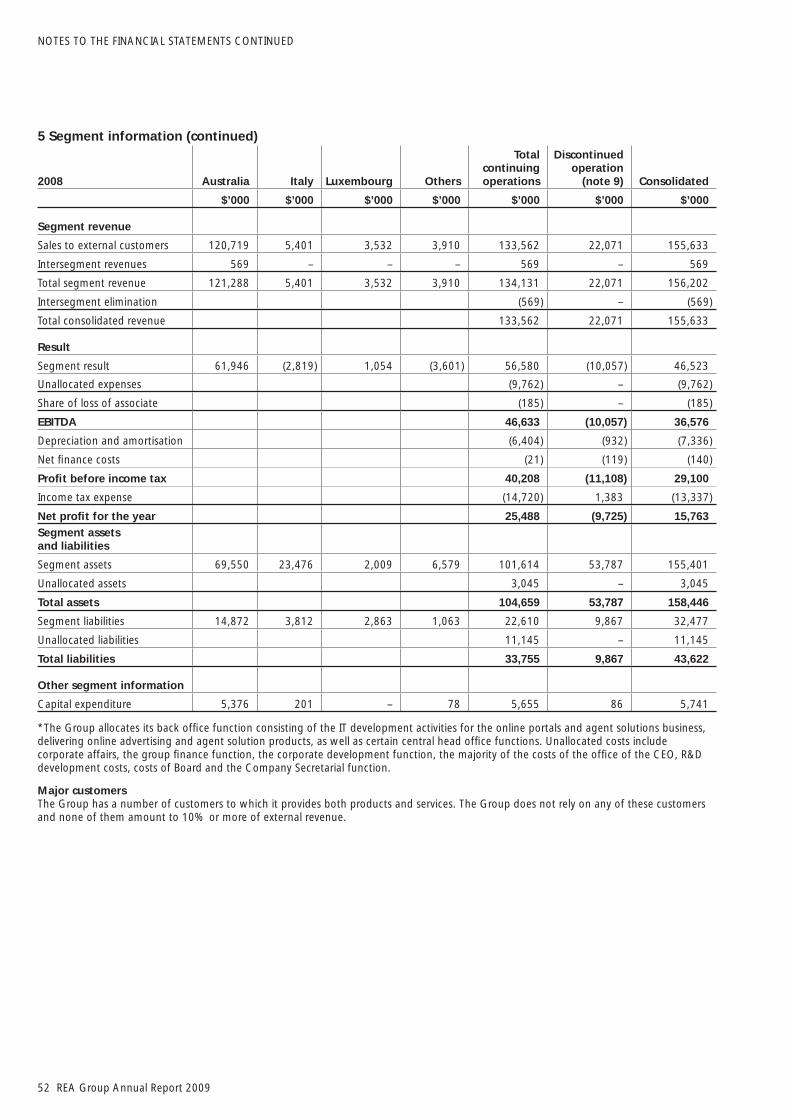
52 REA Group Annual Report 2009
NOTES TO THE FINANCIAL STATEMENTS CONTINUED
5 Segment information (continued)
2008 Australia Italy Luxembourg Others
Total continuing operations
Discontinued operation
(note 9) Consolidated
$’000 $’000 $’000 $’000 $’000 $’000 $’000
Segment revenue
Sales to external customers 120,719 5,401 3,532 3,910 133,562 22,071 155,633
Intersegment revenues 569 – – – 569 – 569
Total segment revenue 121,288 5,401 3,532 3,910 134,131 22,071 156,202
Intersegment elimination (569) – (569)
Total consolidated revenue 133,562 22,071 155,633
Result
Segment result 61,946 (2,819) 1,054 (3,601) 56,580 (10,057) 46,523
Unallocated expenses (9,762) – (9,762)
Share of loss of associate (185) – (185)
EBITDA 46,633 (10,057) 36,576
Depreciation and amortisation (6,404) (932) (7,336)
Net fi nance costs (21) (119) (140)
Profi t before income tax 40,208 (11,108) 29,100
Income tax expense (14,720) 1,383 (13,337)
Net profi t for the year 25,488 (9,725) 15,763Segment assets and liabilities
Segment assets 69,550 23,476 2,009 6,579 101,614 53,787 155,401
Unallocated assets 3,045 – 3,045
Total assets 104,659 53,787 158,446
Segment liabilities 14,872 3,812 2,863 1,063 22,610 9,867 32,477
Unallocated liabilities 11,145 – 11,145
Total liabilities 33,755 9,867 43,622
Other segment information
Capital expenditure 5,376 201 – 78 5,655 86 5,741
*The Group allocates its back offi ce function consisting of the IT development activities for the online portals and agent solutions business, delivering online advertising and agent solution products, as well as certain central head offi ce functions. Unallocated costs include corporate affairs, the group fi nance function, the corporate development function, the majority of the costs of the offi ce of the CEO, R&D development costs, costs of Board and the Company Secretarial function.
Major customersThe Group has a number of customers to which it provides both products and services. The Group does not rely on any of these customers and none of them amount to 10% or more of external revenue.
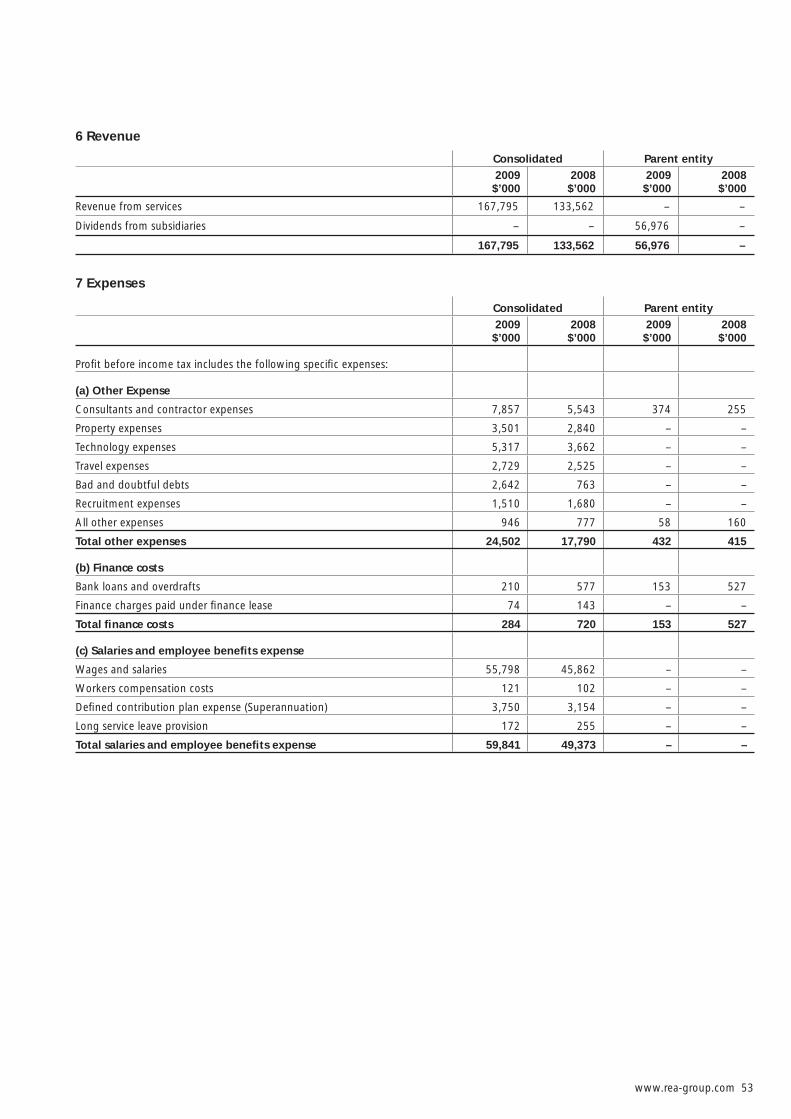
www.rea-group.com 53
6 Revenue
Consolidated Parent entity2009
$’0002008
$’0002009
$’0002008$’000
Revenue from services 167,795 133,562 – –
Dividends from subsidiaries – – 56,976 –
167,795 133,562 56,976 –
7 Expenses
Consolidated Parent entity2009
$’0002008
$’0002009
$’0002008$’000
Profi t before income tax includes the following specifi c expenses:
(a) Other Expense
Consultants and contractor expenses 7,857 5,543 374 255
Property expenses 3,501 2,840 – –
Technology expenses 5,317 3,662 – –
Travel expenses 2,729 2,525 – –
Bad and doubtful debts 2,642 763 – –
Recruitment expenses 1,510 1,680 – –
All other expenses 946 777 58 160
Total other expenses 24,502 17,790 432 415
(b) Finance costs
Bank loans and overdrafts 210 577 153 527
Finance charges paid under fi nance lease 74 143 – –
Total fi nance costs 284 720 153 527
(c) Salaries and employee benefi ts expense
Wages and salaries 55,798 45,862 – –
Workers compensation costs 121 102 – –
Defi ned contribution plan expense (Superannuation) 3,750 3,154 – –
Long service leave provision 172 255 – –
Total salaries and employee benefi ts expense 59,841 49,373 – –

54 REA Group Annual Report 2009
NOTES TO THE FINANCIAL STATEMENTS CONTINUED
8 Income tax expense
Consolidated Parent entity2009
$’0002008
$’0002009
$’0002008
$’000
(a) Income tax expense
Current tax 19,545 14,446 (10) (884)
Deferred tax (3,029) (1,109) (23) 164
Adjustments for current tax of prior periods (322) – (134) –
Aggregate income tax expense 16,194 13,337 (167) (720)
Income tax expense is attributable to:
Profi t/(loss) from continuing operations 18,598 14,720 (167) (720)
(Loss) from discontinued operations (2,404) (1,383) – –
Aggregate income tax expense 16,194 13,337 (167) (720)
Deferred income tax (revenue) expense included in income tax expense comprises:
Decrease/(increase) in deferred tax assets (note 15) (961) 208 36 216
(Decrease)/increase in deferred tax liabilities (note 22) (2,068) (1,317) (59) (52)
(3,029) (1,109) (23) 164
(b) Numerical reconciliation of income tax expense to prima facie tax payable
Profi t from continuing operations before income tax expense 47,301 40,208 21,384 (1,153)
Loss from discontinuing operations before income tax expense (65,745) (11,108) – –
(18,444) 29,100 21,384 (1,153)
Tax at the Australian tax rate of 30% (2008 30%) (5,533) 8,730 6,415 (346)
Tax effect of amounts which are not deductible (taxable) in calculating taxable income:
Effect of foreign tax rate 2,120 (174) – –
Foreign subsidiary losses not recognised in the Group (i) 6,208 5,001 – –
Foreign branch tax losses not recognised (New Zealand) 85 165 – 38
Effect of tax losses recognised – (885) – –
Non deductible amortisation and impairments 15,382 (19) 10,549 –
Research and Development deduction (319) (342) – (6)
Dividends received intercompany – – (17,093) –
Non deductible legal fees – 37 4 –
Other (620) 67 92 –
17,323 12,580 (33) (314)
Adjustments for current tax of prior periods – – (134) –
Timing differences not recognised in prior years (322) 757 – (406)
Adjustments for current tax or prior periods R & D (807) – – –
(1,129) 757 (134) (406)
Aggregate income tax expense 16,194 13,337 (167) (720)
(i) This fi gure includes unrecognised tax losses for the overseas operations during this fi scal year. It consists of tax losses, with a tax effect of $3,847k (2008: $3,235k) for REA UK Group, $154k (2008: nil) for REA Group Europe Limited, $1,533k (2008: $1,150k) for REA Italia Group, $674k (2008: $511k) for the Greater Luxembourg operations, and $nil (2008: $105k) for REA Group Hong Kong.
(ii) At 30 June 2009, there are no unrecognised temporary differences associated with the Group’s investments in subsidiaries as the Group has no liability for additional taxation should unremitted earnings be remitted (2008: $nil).

www.rea-group.com 55
8 Income tax expense (continued)
(c) Tax consolidation legislationREA Group Limited and its wholly owned Australian controlled entities have implemented the tax consolidation legislation. The accounting policy in relation to this legislation is set out in note 2(f).
On adoption of the tax consolidation legislation, the entities in the tax consolidated group entered into a tax sharing agreement which, in the opinion of the directors, limits the joint and several liability of the wholly owned entities in the case of a default by the head entity, REA Group Limited.
The entities have also entered into a tax funding agreement under which the wholly owned entities fully compensate REA Group Limited for any current tax payable assumed and are compensated by REA Group Limited for any current tax receivable and deferred tax assets relating to unused tax losses or unused tax credits that are transferred to REA Group Limited under the tax consolidation legislation. The funding amounts are determined by reference to the amounts recognised in the wholly owned entities’ fi nancial statements.
The amounts receivable/payable under the tax funding agreement are due upon receipt of the funding advice from the head entity, which is issued as soon as practicable after the end of each fi nancial year. The head entity may also require payment of interim funding amounts to assist with its obligations to pay tax instalments. The funding amounts are recognised as current intercompany receivables or payables (see note 32).
9 Discontinued operation
UK OperationsIt was announced on 28 May 2009 that REA Group Limited (“REA”) and News International Ltd (“News Int.”) would commence a review of their jointly owned UK online business which runs the propertyfi nder, hotproperty and UK propertyshop websites. The company operating the UK online business is treated as a consolidated subsidiary of the Group in accordance with its accounting policies set out in note 2(b), as the Group has a majority on its board or directors.
The review was to consider various options in relation to the future of the online business, including possible closure of all or part of the business.
On 26 June 2009 REA Group Ltd (through its UK subsidiary REA Group Europe Limited) and News International Ltd entered in to a non binding heads of agreement for the potential sale of all or part of their jointly owned UK online business, which runs the propertyfi nder, hotproperty and UK propertyshop websites. The process was subject to due diligence and the parties completing negotiations and signing binding contracts.
On 7 August 2009 the sale of the whole of the issued share capital of the UK business for a minimum guaranteed sale price of $3.9 million to Zoopla Limited was completed.
Financial information relating to the discontinued operation for the period to the date of disposal is set out below. Further information is set out in note 5 - segment information.
(a) Financial performance and cash fl ow informationThe fi nancial performance and cash fl ow information presented are for full 12 months.
2009$’000
2008$’000
Revenue (note 6) 18,693 22,071
Expenses (36,744) (32,247)
Depreciation & amortisation (1,234) (932)
Impairment of goodwill (44,360) –
Impairment of intangibles (2,100) –
Profi t before income tax (65,745) (11,108)
Income tax expense 2,404 1,383
Loss from discontinued operation (63,341) (9,725)
Net cash (outfl ow) from operating activities (11,393)
Net cash (outfl ow) from investing activities (1,408)
Net cash infl ow from fi nancing activities 12,718
Net increase in cash generated by the division (83)

56 REA Group Annual Report 2009
NOTES TO THE FINANCIAL STATEMENTS CONTINUED
9 Discontinued operation (continued)
(b) Carrying amounts of assets and liabilitiesThe carrying amounts of assets and liabilities as at 30 June were:
30 June 2009$’000
30 June 2008$’000
Property, plant and equipment 388 –
Intangibles 4,339 –
Trade and other receivables 1,339 –
Other assets 1,053 –
Total assets 7,119 –
Trade creditors and other payables (231) –
Provisions (495) –
Accruals (1,075) –
Deferred revenue (1,426) –
Total liabilities (3,227) –
Net assets 3,892 –
The carrying amount of the above net assets held for sale represents the minimum guaranteed sale proceeds that will be received.
10 Current assets – Cash and cash equivalents
Consolidated Parent entity2009
$’0002008
$’0002009
$’0002008
$’000
Cash at bank and in hand 41,389 8,857 307 159
Short term deposits 199 25 – –
41,588 8,882 307 159
11 Current assets – Trade and other receivables
Consolidated Parent entity2009
$’0002008
$’0002009
$’0002008
$’000
Net trade receivables
Trade receivables 29,876 29,841 – –
Provision for impairment of receivables (3,475) (2,756) – –
26,401 27,085 – –
Net related party receivables
Related party receivable 1,091 61 – –
Receivables from Australian subsidiaries – – 8,656 –
Receivables from foreign subsidiaries – – 2,014 1,025
1,091 61 10,670 1,025
Sundry Debtors 379 617 47 47
27,871 27,763 10,717 1,072
i) Trade debtors are non interest bearing and are on 14 to 75 day terms. An allowance for doubtful debts is made when there is objective evidence that a trade receivable is impaired. An allowance has been recognised as an expense for the current year for specifi c debtors for which such evidence exists. The amount of the allowance/impairment loss has been measured as the difference between the carrying amount of the trade receivables and the estimated future cash fl ows expected to be received from the relevant debtors.
ii) The 2009 consolidated related party receivable of $1,091k relates to UK tax losses sold to News International Limited. The 2009 REA Group Ltd receivables from foreign subsidiaries number of $2,014k includes $2,010k related to atHome Group S.A. and $4k related REA Group Hong Kong Limited. The REA Group Ltd receivable from Australian subsidiaries relates primarily to income tax payments transferred to the head entity.

www.rea-group.com 57
11 Current assets – Trade and other receivables (continued)
(a) Trade debtors – past due dateAs at 30 June, the ageing analysis of trade receivables is as follows:
Consolidated Parent entity2009
$’0002008
$’0002009
$’0002008$’000
Not due 18,869 17,445 – –
0 30 days 3,465 4,294 – –
31 60 days 1,365 2,049 – –
61+ days 2,702 3,297 – –
Considered impaired 3,475 2,756 – –
29,876 29,841 – –
Other receivables do not contain impaired assets and are not past due. It is expected that these other balances will be received when due. Details regarding foreign exchange and interest rate risk exposure are disclosed in note (3).
12 Current assets – Other current assets
Consolidated Parent entity2009
$’0002008
$’0002009
$’0002008$’000
Prepayments 3,285 2,480 44 215
Other current assets 318 492 – –
3,603 2,972 44 215
13 Non-current assets – Investments in subsidiaries
Consolidated Parent entity2009
$’0002008
$’0002009
$’0002008$’000
Investment in subsidiaries – See Note 34 – – 72,674 97,962
– – 72,674 97,962

58 REA Group Annual Report 2009
NOTES TO THE FINANCIAL STATEMENTS CONTINUED
14 Non-current assets – Plant and equipment
ConsolidatedPlant and
equipmentLeasehold
improvements Total
$’000 $’000 $’000
Year 30 June 2008
Opening net book amount 3,751 1,085 4,836
Exchange differences (52) (1) (53)
Additions 2,690 302 2,992
Disposals (net of accumulated depreciation) (83) – (83)
Acquisition of subsidiary – at cost 1,265 – 1,265
Acquisition of subsidiary – accumulated depreciation (1,137) – (1,137)
Depreciation charge (1,961) (580) (2,541)
Depreciation of assets now held-for-sale (220) (7) (227)
Closing net book amount 4,253 799 5,052
At 30 June 2008
Cost or fair value 12,067 2,000 14,067
Accumulated depreciation (7,814) (1,201) (9,015)
Net book amount 4,253 799 5,052
Year 30 June 2009
Opening net book amount 4,253 799 5,052
Exchange differences 87 10 97
Acquisition of subsidiary 3 – 3
Additions 3,981 174 4,155
Disposals (net of accumulated depreciation) (9) – (9)
Assets classifi ed as held-for-sale and other disposals (313) (75) (388)
Depreciation charge (2,837) (553) (3,390)
Depreciation charge – assets now held-for-sale (256) (9) (265)
Re-classifi cation from intangibles 248 – 248
Closing net book amount 5,157 346 5,503
At 30 June 2009
Cost or fair value 13,413 1,996 15,409
Accumulated depreciation (8,256) (1,650) (9,906)
Net book amount 5,157 346 5,503
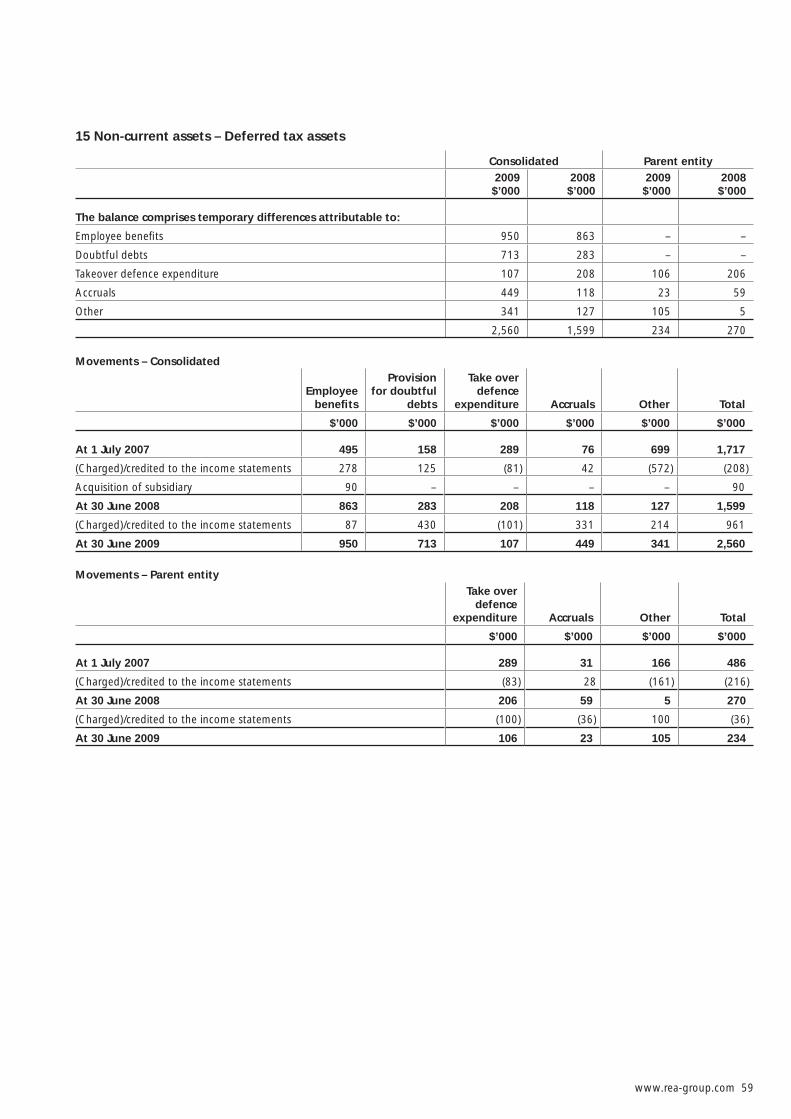
www.rea-group.com 59
15 Non-current assets – Deferred tax assets
Consolidated Parent entity2009
$’0002008
$’0002009
$’0002008$’000
The balance comprises temporary differences attributable to:
Employee benefi ts 950 863 – –
Doubtful debts 713 283 – –
Takeover defence expenditure 107 208 106 206
Accruals 449 118 23 59
Other 341 127 105 5
2,560 1,599 234 270
Movements – Consolidated
Employee benefi ts
Provision for doubtful
debts
Take over defence
expenditure Accruals Other Total
$’000 $’000 $’000 $’000 $’000 $’000
At 1 July 2007 495 158 289 76 699 1,717
(Charged)/credited to the income statements 278 125 (81) 42 (572) (208)
Acquisition of subsidiary 90 – – – – 90
At 30 June 2008 863 283 208 118 127 1,599
(Charged)/credited to the income statements 87 430 (101) 331 214 961
At 30 June 2009 950 713 107 449 341 2,560
Movements – Parent entityTake over
defence expenditure Accruals Other Total
$’000 $’000 $’000 $’000
At 1 July 2007 289 31 166 486
(Charged)/credited to the income statements (83) 28 (161) (216)
At 30 June 2008 206 59 5 270
(Charged)/credited to the income statements (100) (36) 100 (36)
At 30 June 2009 106 23 105 234
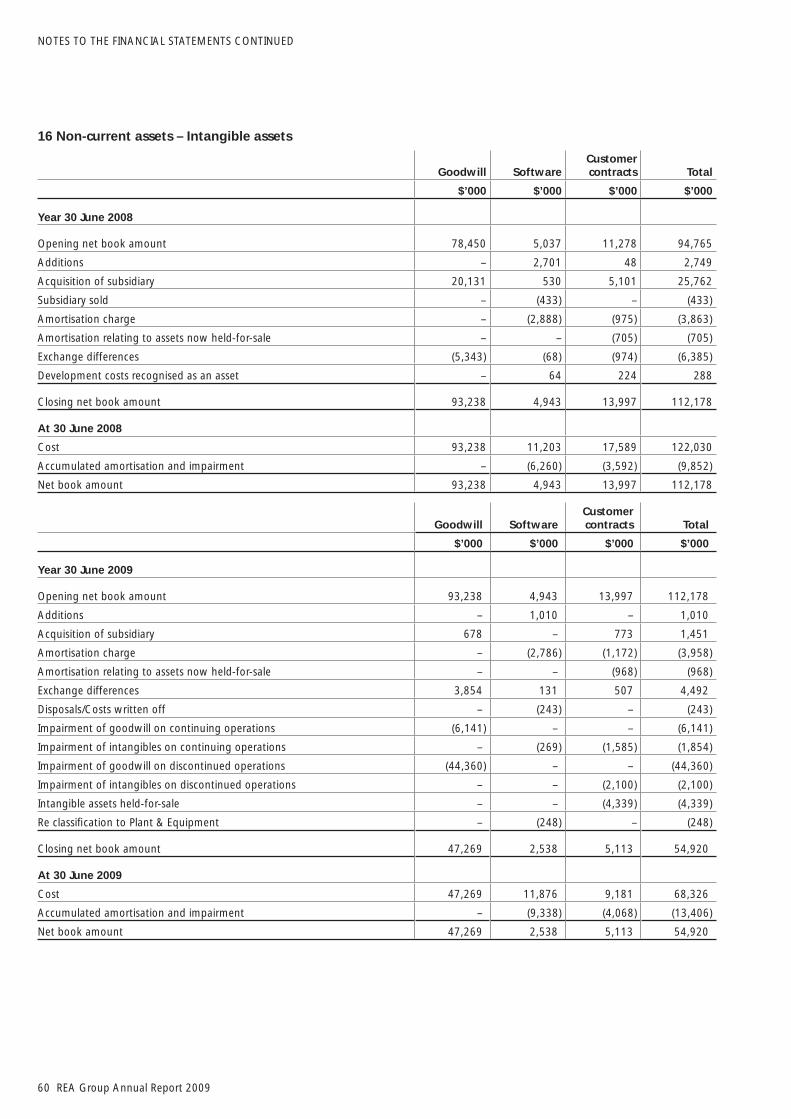
60 REA Group Annual Report 2009
NOTES TO THE FINANCIAL STATEMENTS CONTINUED
16 Non-current assets – Intangible assets
Goodwill SoftwareCustomer contracts Total
$’000 $’000 $’000 $’000
Year 30 June 2008
Opening net book amount 78,450 5,037 11,278 94,765
Additions – 2,701 48 2,749
Acquisition of subsidiary 20,131 530 5,101 25,762
Subsidiary sold – (433) – (433)
Amortisation charge – (2,888) (975) (3,863)
Amortisation relating to assets now held-for-sale – – (705) (705)
Exchange differences (5,343) (68) (974) (6,385)
Development costs recognised as an asset – 64 224 288
Closing net book amount 93,238 4,943 13,997 112,178
At 30 June 2008
Cost 93,238 11,203 17,589 122,030
Accumulated amortisation and impairment – (6,260) (3,592) (9,852)
Net book amount 93,238 4,943 13,997 112,178
Goodwill SoftwareCustomer contracts Total
$’000 $’000 $’000 $’000
Year 30 June 2009
Opening net book amount 93,238 4,943 13,997 112,178
Additions – 1,010 – 1,010
Acquisition of subsidiary 678 – 773 1,451
Amortisation charge – (2,786) (1,172) (3,958)
Amortisation relating to assets now held-for-sale – – (968) (968)
Exchange differences 3,854 131 507 4,492
Disposals/Costs written off – (243) – (243)
Impairment of goodwill on continuing operations (6,141) – – (6,141)
Impairment of intangibles on continuing operations – (269) (1,585) (1,854)
Impairment of goodwill on discontinued operations (44,360) – – (44,360)
Impairment of intangibles on discontinued operations – – (2,100) (2,100)
Intangible assets held-for-sale – – (4,339) (4,339)
Re classifi cation to Plant & Equipment – (248) – (248)
Closing net book amount 47,269 2,538 5,113 54,920
At 30 June 2009
Cost 47,269 11,876 9,181 68,326
Accumulated amortisation and impairment – (9,338) (4,068) (13,406)
Net book amount 47,269 2,538 5,113 54,920
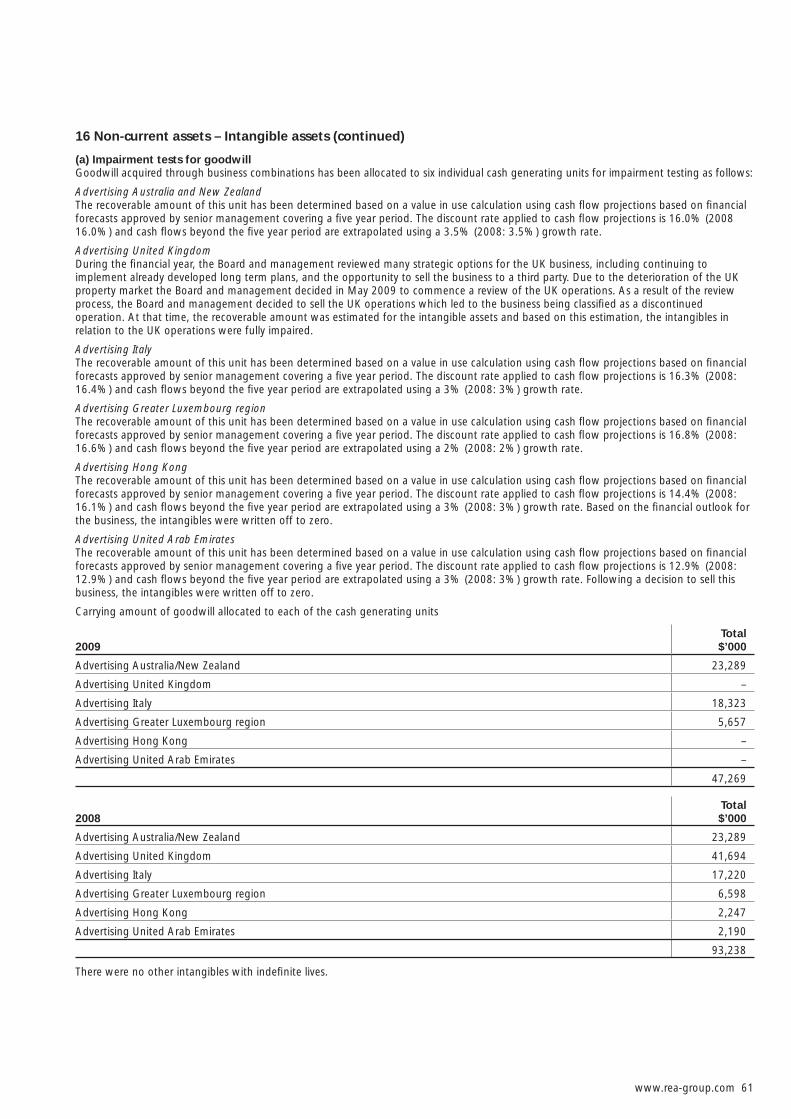
www.rea-group.com 61
16 Non-current assets – Intangible assets (continued)
(a) Impairment tests for goodwillGoodwill acquired through business combinations has been allocated to six individual cash generating units for impairment testing as follows:
Advertising Australia and New ZealandThe recoverable amount of this unit has been determined based on a value in use calculation using cash fl ow projections based on fi nancial forecasts approved by senior management covering a fi ve year period. The discount rate applied to cash fl ow projections is 16.0% (2008 16.0%) and cash fl ows beyond the fi ve year period are extrapolated using a 3.5% (2008: 3.5%) growth rate.
Advertising United KingdomDuring the fi nancial year, the Board and management reviewed many strategic options for the UK business, including continuing to implement already developed long term plans, and the opportunity to sell the business to a third party. Due to the deterioration of the UK property market the Board and management decided in May 2009 to commence a review of the UK operations. As a result of the review process, the Board and management decided to sell the UK operations which led to the business being classifi ed as a discontinued operation. At that time, the recoverable amount was estimated for the intangible assets and based on this estimation, the intangibles in relation to the UK operations were fully impaired.
Advertising ItalyThe recoverable amount of this unit has been determined based on a value in use calculation using cash fl ow projections based on fi nancial forecasts approved by senior management covering a fi ve year period. The discount rate applied to cash fl ow projections is 16.3% (2008: 16.4%) and cash fl ows beyond the fi ve year period are extrapolated using a 3% (2008: 3%) growth rate.
Advertising Greater Luxembourg regionThe recoverable amount of this unit has been determined based on a value in use calculation using cash fl ow projections based on fi nancial forecasts approved by senior management covering a fi ve year period. The discount rate applied to cash fl ow projections is 16.8% (2008: 16.6%) and cash fl ows beyond the fi ve year period are extrapolated using a 2% (2008: 2%) growth rate.
Advertising Hong KongThe recoverable amount of this unit has been determined based on a value in use calculation using cash fl ow projections based on fi nancial forecasts approved by senior management covering a fi ve year period. The discount rate applied to cash fl ow projections is 14.4% (2008: 16.1%) and cash fl ows beyond the fi ve year period are extrapolated using a 3% (2008: 3%) growth rate. Based on the fi nancial outlook for the business, the intangibles were written off to zero.
Advertising United Arab EmiratesThe recoverable amount of this unit has been determined based on a value in use calculation using cash fl ow projections based on fi nancial forecasts approved by senior management covering a fi ve year period. The discount rate applied to cash fl ow projections is 12.9% (2008: 12.9%) and cash fl ows beyond the fi ve year period are extrapolated using a 3% (2008: 3%) growth rate. Following a decision to sell this business, the intangibles were written off to zero.
Carrying amount of goodwill allocated to each of the cash generating units
2009Total$’000
Advertising Australia/New Zealand 23,289
Advertising United Kingdom –
Advertising Italy 18,323
Advertising Greater Luxembourg region 5,657
Advertising Hong Kong –
Advertising United Arab Emirates –
47,269
2008Total$’000
Advertising Australia/New Zealand 23,289
Advertising United Kingdom 41,694
Advertising Italy 17,220
Advertising Greater Luxembourg region 6,598
Advertising Hong Kong 2,247
Advertising United Arab Emirates 2,190
93,238
There were no other intangibles with indefi nite lives.

62 REA Group Annual Report 2009
NOTES TO THE FINANCIAL STATEMENTS CONTINUED
16 Non-current assets – Intangible assets (continued)
(b) Key assumptions used for value in use calculationsThe following describes each key assumption on which management has based its cash fl ow projections when determining the value in use of the cash generating unit.
Key assumptions used in “value in use” calculations for the Advertising Australia / New Zealand unitFor the purpose of this model, revenues are expected to grow at rates refl ecting the expected growth of revenue per agent in Australia and New Zealand and the expected increase in agent numbers. EBITDA Margin is expected to be at levels consistent with current months.
Key assumptions used in “fair value” calculations for the Advertising United Kingdom unitFor the purpose of this model, revenues are expected to grow at rates refl ecting the expected growth of revenue per agent in the UK and the expected increase in agent numbers.
Key assumptions used in “value in use” calculations for the Advertising Italy unitFor the purpose of this model, revenues are expected to grow at rates refl ecting the expected growth of revenue per agent in Italy and the expected increase in agent numbers
Key assumptions used in “value in use” calculations for the Advertising Great Luxembourg region unitFor the purpose of this model, revenues are expected to grow at rates refl ecting the expected growth of revenue per agent in the Greater Luxembourg region and the expected increase in agent numbers
Key assumptions used in “value in use” calculations for the Advertising Hong Kong unitFor the purpose of this model, revenues are expected to grow at rates refl ecting the expected growth of revenue per agent in Hong Kong and the expected increase in agent numbers
Key assumptions used in “fair value” calculations for the Advertising United Arab Emirates (UAE) unitFor the purpose of this model, revenues are expected to grow at rates refl ecting the expected growth of revenue per agent in the United Arab Emirates and the expected increase in agent numbers
17 Current liabilities – Trade and other payables
Consolidated Parent entity2009
$’0002008
$’0002009
$’0002008
$’000
Trade payables 4,554 5,554 – –
Accrued expenses 9,533 7,467 77 221
Payables to related parties (i) 3,085 1,718 – 1,723
Other payables 2,659 4,921 – –
Payables to subsidiaries (ii) – – – 39,978
19,831 19,660 77 41,922
(i) Includes trade payables of $3,085k (FY08: $1,381k) to News International and $Nil (FY08: $337k) to SKYItalia. For REA Group Limited the amount of $Nil (FY08: $1,723k) consist of the fi nal payment of $Nil (FY08: $1,491k) for the acquisitions of Prime Media Limited and Square Foot Limited valued at balance sheet foreign exchange rate and a funding commitment of $Nil (FY08: $232k) to REA Hong Kong Limited.
(ii) During the year dividends were paid by the wholly owned Australia subsidiaries of REA Group Limited. These dividend payments were used to repay the above Payables to subsidiaries liability.
Information regarding the effective interest rate and credit risk of current payables is set out in note 2.
18 Current liabilities – Interest bearing loans and borrowings
Consolidated Parent entity2009
$’0002008
$’0002009
$’0002008
$’000
Lease liabilities (note 31) 488 1,193 – –
Total current borrowings 488 1,193 – –

www.rea-group.com 63
19 Current liabilities – Provisions
Consolidated Parent entity2009
$’0002008
$’0002009
$’0002008$’000
Employee benefi ts – long service leave 247 191 – –
Annual leave 2,086 2,103 – –
Lease incentive 52 23 – –
2,385 2,317 – –
20 Current liabilities – Other current liabilities
Consolidated Parent entity2009
$’0002008
$’0002009
$’0002008$’000
Deferred revenue – see note 2(e) 8,578 8,504 – –
Prepaid revenues 2,522 1,313 – –
11,100 9,817 – –
21 Non-current liabilities – Interest bearing loans and borrowings
Consolidated Parent entity2009
$’0002008
$’0002009
$’0002008$’000
Secured
Lease liabilities (note 31) 32 367 – –
Total non-current borrowings 32 367 – –
(a) Financing arrangementsThe Group and the parent entity had access to the following undrawn borrowing facilities at the reporting date:
Consolidated Parent entity2009
$’0002008
$’0002009
$’0002008$’000
Bank loan facilities
Total facilities 14,000 21,000 14,000 21,000
Used at balance date – – – –
Unused at balance date 14,000 21,000 14,000 21,000
The Group has a combined bank loan/overdraft facility with the following expiry dates (September 2009 ($4 million) and October 2010 ($10 million)).
The facility is secured by a cross guarantee between REA Group Limited, realestate.com.au Pty Limited, Property Look Pty Limited, and Web Effect Pty Limited.

64 REA Group Annual Report 2009
NOTES TO THE FINANCIAL STATEMENTS CONTINUED
22 Non-current liabilities – Deferred tax liabilities
Consolidated Parent entity2009
$’0002008
$’0002009
$’0002008
$’000
The balance comprises temporary differences attributable to:
Intangible assets 1,593 3,070 – –
Accrued income – 118 – –
Plant and equipment – 114 – –
Unrealised foreign exchange gains 10 59 – 59
Other 63 7 – –
1,666 3,368 – 59
Movements – ConsolidatedIntangible
assetsAccrued income
Plant and equipment
Unrealised foreign
exchange gains Other Total
$’000 $’000 $’000 $’000 $’000 $’000
At 1 July 2007 3,047 132 447 4 145 3,775
Charged/(credited) to the income statements (887) (14) (333) 55 (138) (1,317)
Acquisition of subsidiary 910 – – – – 910
At 30 June 2008 3,070 118 114 59 7 3,368
Charged/(credited) to the income statements (1,844) (118) (114) (49) 56 (2,069)
Foreign exchange adjustments 151 – – – – 151
Acquisition of subsidiary 216 – – – – 216
At 30 June 2009 1,593 – – 10 63 1,666
Movements – Parent entityIntangible
assetsAccrued income
Plant and equipment
Unrealised foreign
exchange gains Other Total
$’000 $’000 $’000 $’000 $’000 $’000
At 1 July 2007 – 111 – – – 111
Charged/(credited) to the income statements – (111) – 59 – (52)
At 30 June 2008 – – – 59 – 59
At 30 June 2008 – – – 59 – 59
Charged/(credited) to the income statements – – – (59) – (59)
At 30 June 2009 – – – – – –

www.rea-group.com 65
23 Non-current liabilities – Provisions
Consolidated Parent entity2009
$’0002008
$’0002009
$’0002008$’000
Employee benefi ts – long service leave 493 464 – –
Employment severance indemnity 287 146 – –
Long Term Incentive Plan – 70 – –
Lease incentive 80 2 – –
860 682 – –
24 Contributed equity
Consolidated and Parent entity
Consolidated and Parent entity
2009Shares
2008Shares
2009$’000
2008$’000
(a) Share capital
Ordinary shares
Fully paid 127,255,057 127,255,057 56,002 56,002
127,255,057 127,255,057 56,002 56,002
Total consolidated contributed equity 56,002 56,002
(b) Capital risk managementWhen managing capital, management’s objective is to ensure the entity continues as a going concern as well as to maintain optimal returns to shareholders and benefi ts for other stakeholders.
The Group’s Dividend Policy provides scope for the Board to determine whether to pay a dividend, the timing of any dividend payment and the amount of any dividend payment. The Board bases its decision on existing fi nancial data, forecasts and existing growth projects.
Other than through the Group’s Dividend Reinvestment Plan (note 27), management has no current plans to issue further shares on the market.
Management monitors capital through the gearing ratio (net debt/total capital). At year end, the Group is not in a net debt position. The Group has a revolving cash advance facility of $14 million (2008: $21million) with the Group’s banker which enables management of the Group’s working capital needs or acquisition funding.
The gearing ratios based on continuing operations at 30 June 2009 and 2008 were as follows:
Consolidated Parent entity2009
$’0002008
$’0002009
$’0002008$’000
Total borrowings 520 1,560 – –
Less: cash and cash equivalents 41,587 8,882 – 159
Net debt Not existing Not existing Not existing Not existing
Total equity 86,973 114,824 78,085 51,810
Total capital 86,973 114,824 78,085 51,810
Gearing ratio 0% 0% 0% 0%
The Group is not subject to externally imposed capital requirements.

66 REA Group Annual Report 2009
NOTES TO THE FINANCIAL STATEMENTS CONTINUED
25 Reserves and retained profi ts
Consolidated Parent entity2009
$’0002008
$’0002009
$’0002008
$’000
(a) Reserves
Share based payments reserve 675 – 675 –
Foreign currency translation reserve (1,587) (4,609) – –
Business combination reserve 568 568 – –
(344) (4,041) 675 –
Share based payments reserve: This amount represents the value of the Long Term Incentives that have been granted as at balance date.
Currency Translation Reserve: The foreign currency translation reserve is used to record exchange differences arising from the translation of the fi nancial statements of its overseas subsidiaries.
Business Combination Reserve: This amount is the result of the change in Sky Italia’s minority interest from 34% to 30.6% (30 April 2008) as the group purchased the remaining 10% stake from the founder of casa.it. Sky Italia is a subsidiary of News Corporation.
(b) Retained profi tsMovements in retained profi ts were as follows:
Consolidated Parent entity2009
$’0002008
$’0002009
$’0002008
$’000
Opening retained earnings 35,483 13,139 (4,192) (3,759)
Net profi t for the year 946 22,344 21,551 (433)
Balance 30 June 36,429 35,483 17,359 (4,192)
26 Minority interest
Consolidated Parent entity2009
$’0002008
$’0002009
$’0002008
$’000
Interest in:
Share capital 49,245 39,617 – –
Retained profi ts (12,237) (5,656) – –
Current earnings (35,584) (6,581) – –
1,424 27,380 – –

www.rea-group.com 67
27 Dividends
(a) Dividends not recognised at year endSince year end the directors have recommended the payment of a fi nal dividend of 10 cents per fully paid ordinary share, (2008: Nil cents) fully franked based on tax paid at 30%. The Group has also introduced a Dividend Reinvestment Plan which will allow shareholders to elect to re invest the dividend and receive fully paid REA shares at a 2.5% discount to the weighted average market price calculated over a period of 5 business days. The aggregate amount of the proposed dividend expected to be paid on 16 October 2009 out of retained profi ts at 30 June 2009, but not recognised as a liability at year end, is $12.7 million (2008: Nil).
(b) Franked dividendsThe franked portions of the fi nal dividends recommended after 30 June 2009 will be franked out of existing franking credits or out of franking credits arising from the payment of income tax in the year ending 30 June 2010.
Consolidated Parent entity2009
$’0002008
$’0002009
$’0002008$’000
Franking credits available for subsequent fi nancial years based on a tax rate of 30% (2008: 30%) 40,527 25,212 40,527 25,212
40,527 25,212 40,527 25,212
The above amounts represent the balance of the franking account as at the end of the fi nancial year, adjusted for franking credits that will arise from the payment of the amount of the provision for income tax.
The consolidated amounts include franking credits that would be available to the parent entity if distributable profi ts of subsidiaries were paid as dividends.
The impact on the franking account of the dividend recommended by the directors since year end, but not recognised as a liability at year end, will be a reduction in the franking account of $5.4 million (2008: $Nil).
28 Key management personnel disclosures
(a) DirectorsThe following persons were directors of REA Group Limited during the fi nancial year:
(i) Chairman – non executiveMr Richard J Freudenstein
(ii) Executive directorsMr Greg Ellis, Managing Director & Chief Executive Offi cer (appointed 23 September 2008)Mr Simon T Baker, Managing Director & Chief Executive Offi cer (until 4 August 2008)
(iii) Non executive directorsMr Roger AmosMs Kathleen ConlonMr Alasdair MacLeodMr John D McGrathMr Jeremy Philips (appointed 4 March 2009)Mr Stephen P RueMr Sam R White
(b) Other key management personnelThe following persons also had authority and responsibility for planning, directing and controlling the activities of the Group, directly or indirectly, during the fi nancial year:
Mr Georg Chmiel Chief Financial Offi cerMr Daniel Oertli Chief Information Offi cer (since 17 February 2009)Mr Daniele Mancini General Manger Italy region (since 1 April 2009)Mr Jamie Pride General Manager Australia (until 2 March 2009)Ms Gillian Kent General Manager United Kingdom (since January 2008)Mr Shaun Di Gregorio General Manager International
All of the above persons were also key management persons during the year ended 30 June 2008, except for Mr Oertli and Mr Mancini who commenced employment with the Group during the year.
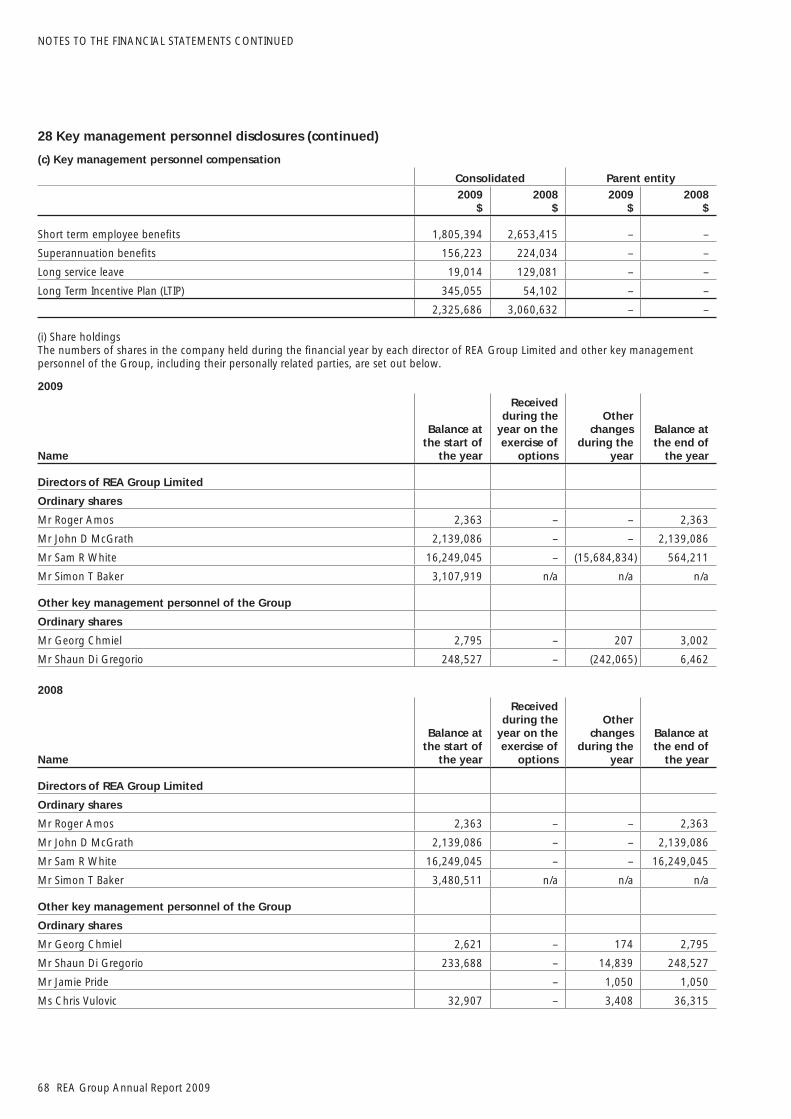
68 REA Group Annual Report 2009
NOTES TO THE FINANCIAL STATEMENTS CONTINUED
28 Key management personnel disclosures (continued)
(c) Key management personnel compensation
Consolidated Parent entity2009
$2008
$2009
$2008
$
Short term employee benefi ts 1,805,394 2,653,415 – –
Superannuation benefi ts 156,223 224,034 – –
Long service leave 19,014 129,081 – –
Long Term Incentive Plan (LTIP) 345,055 54,102 – –
2,325,686 3,060,632 – –
(i) Share holdingsThe numbers of shares in the company held during the fi nancial year by each director of REA Group Limited and other key management personnel of the Group, including their personally related parties, are set out below.
2009
Name
Balance at the start of
the year
Received during the
year on the exercise of
options
Other changes
during the year
Balance at the end of
the year
Directors of REA Group Limited
Ordinary shares
Mr Roger Amos 2,363 – – 2,363
Mr John D McGrath 2,139,086 – – 2,139,086
Mr Sam R White 16,249,045 – (15,684,834) 564,211
Mr Simon T Baker 3,107,919 n/a n/a n/a
Other key management personnel of the Group
Ordinary shares
Mr Georg Chmiel 2,795 – 207 3,002
Mr Shaun Di Gregorio 248,527 – (242,065) 6,462
2008
Name
Balance at the start of
the year
Received during the
year on the exercise of
options
Other changes
during the year
Balance at the end of
the year
Directors of REA Group Limited
Ordinary shares
Mr Roger Amos 2,363 – – 2,363
Mr John D McGrath 2,139,086 – – 2,139,086
Mr Sam R White 16,249,045 – – 16,249,045
Mr Simon T Baker 3,480,511 n/a n/a n/a
Other key management personnel of the Group
Ordinary shares
Mr Georg Chmiel 2,621 – 174 2,795
Mr Shaun Di Gregorio 233,688 – 14,839 248,527
Mr Jamie Pride – 1,050 1,050
Ms Chris Vulovic 32,907 – 3,408 36,315

www.rea-group.com 69
28 Key management personnel disclosures (continued)(d) Other transactions with key management personnel
Option holdings of Key Management (Consolidated)Other than due to the LTIP (Note 38), there are no other options or rights over shares held by key management.
29 Remuneration of auditorsDuring the year the following fees were paid or payable for services provided by the auditor of the parent entity, its related practices and non related audit fi rms:
Consolidated Parent entity2009
$2008
$2009
$2008
$
(a) Ernst & Young
Audit and other assurance services
Audit and review of fi nancial reports 484,000 492,000 – 235,000
Other assurance services
Assurance related services 46,370 36,000 – 36,000
(b) Related practices of Ernst & Young
Audit and other assurance services
Audit and review of fi nancial reports 21,683 198,000 – –
Total remuneration for audit and other assurance services 21,683 198,000 – –
30 Contingencies
(a) Contingent liabilitiesClaimsVarious claims arise in the ordinary course of business against REA Group Limited and its subsidiaries. The amount of the liability (if any) at 30 June 2009 cannot be ascertained, and the REA Group Limited entity believes that any resulting liability would not materially affect the fi nancial position of the Group.
GuaranteesThe loan facility is secured by a cross guarantee between REA Group Limited, realestate.com.au Pty Limited, Property Look Pty Limited, and Web Effect Pty Limited.
31 Commitments
(a) Capital commitments(i) Non cancellable operating leasesThe Group has entered into commercial leases for offi ce property and motor vehicles. These leases have remaining lives of up to 48 months. There are no restrictions placed upon the lessee by entering into these leases. Future minimum rentals payable under non cancellable operating leases as at 30 June are as follows:
Consolidated Parent entity2009
$’0002008
$’0002009
$’0002008$’000
Commitments for minimum lease payments in relation to non-cancellable operating leases are payable as follows:
Within one year 2,634 2,552 – –
Later than one year but not later than fi ve years 3,215 3,384 – –
5,849 5,936 – –

70 REA Group Annual Report 2009
NOTES TO THE FINANCIAL STATEMENTS CONTINUED
31 Commitments (continued)(ii) Finance leasesThe Group has fi nance leases and hire purchase contracts for various hardware and software components. Future minimum lease payments under fi nance leases together with the present value of the net minimum lease payments are as follows:
Consolidated Parent entity2009
$’0002008
$’0002009
$’0002008
$’000
Commitments in relation to fi nance leases are payable as follows:
Within one year 500 1,240 – –
Later than one year but not later than fi ve years 36 379 – –
Minimum lease payments 536 1,619 – –
Future fi nance charges (16) (59) – –
Recognised as a liability 520 1,560 – –
Representing lease liabilities:
Current (note 18) 488 1,193 – –
Non-current (note 21) 32 367 – –
520 1,560 – –
(b) Other commitmentsCapital and other commitments relating to contracts entered into by the Group are as follows.
Consolidated Parent entity2009
$’0002008
$’0002009
$’0002008
$’000
Within one year 2,375 – – –
Later than one year and not later than fi ve years 1,248 – – –
3,623 – – –
These commitments relate to contracts to upgrade and expand the functionality of the Group’s information technology platforms and systems.
(c) Remuneration commitmentsAmounts disclosed as remuneration commitments include commitments arising from the service contracts of directors and executives referred to in note 38 that are not recognised as liabilities and are not included in the directors’ or executives’ remuneration.
32 Related party transactions
(a) Parent entitiesThe parent entity within the Group is REA Group Limited. The ultimate parent entity is News Corporation, a resident of the United States of America.
(b) DirectorsThe names of persons who were directors of the company at any time during the fi nancial year are as follows: R J Freudenstein, R Amos, K Conlon, G Ellis, A MacLeod, J D McGrath, J Phillips, S P Rue, S R White and S T Baker.
(c) SubsidiariesInterests in subsidiaries are set out in note 34.
(d) Key management personnelDisclosure relating to key management personnel are set out in note 28.
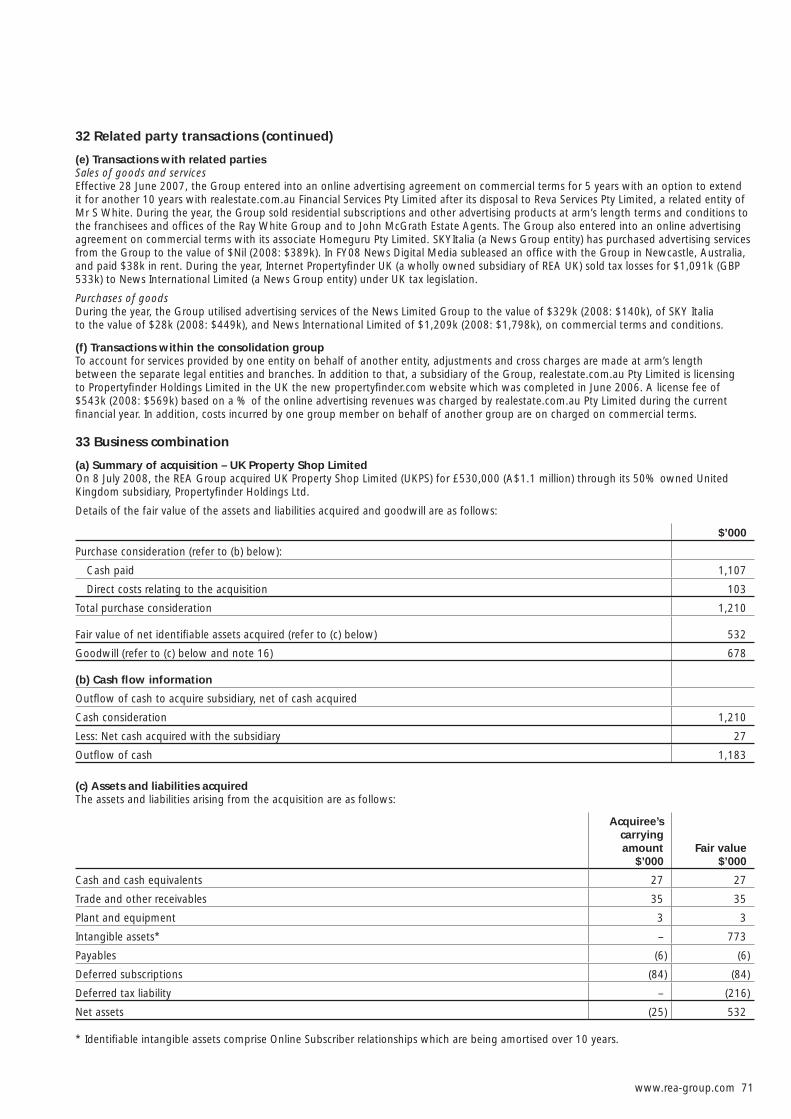
www.rea-group.com 71
32 Related party transactions (continued)
(e) Transactions with related partiesSales of goods and servicesEffective 28 June 2007, the Group entered into an online advertising agreement on commercial terms for 5 years with an option to extend it for another 10 years with realestate.com.au Financial Services Pty Limited after its disposal to Reva Services Pty Limited, a related entity of Mr S White. During the year, the Group sold residential subscriptions and other advertising products at arm’s length terms and conditions to the franchisees and offi ces of the Ray White Group and to John McGrath Estate Agents. The Group also entered into an online advertising agreement on commercial terms with its associate Homeguru Pty Limited. SKYItalia (a News Group entity) has purchased advertising services from the Group to the value of $Nil (2008: $389k). In FY08 News Digital Media subleased an offi ce with the Group in Newcastle, Australia, and paid $38k in rent. During the year, Internet Propertyfi nder UK (a wholly owned subsidiary of REA UK) sold tax losses for $1,091k (GBP 533k) to News International Limited (a News Group entity) under UK tax legislation.
Purchases of goods During the year, the Group utilised advertising services of the News Limited Group to the value of $329k (2008: $140k), of SKY Italia to the value of $28k (2008: $449k), and News International Limited of $1,209k (2008: $1,798k), on commercial terms and conditions.
(f) Transactions within the consolidation groupTo account for services provided by one entity on behalf of another entity, adjustments and cross charges are made at arm’s length between the separate legal entities and branches. In addition to that, a subsidiary of the Group, realestate.com.au Pty Limited is licensing to Propertyfi nder Holdings Limited in the UK the new propertyfi nder.com website which was completed in June 2006. A license fee of $543k (2008: $569k) based on a % of the online advertising revenues was charged by realestate.com.au Pty Limited during the current fi nancial year. In addition, costs incurred by one group member on behalf of another group are on charged on commercial terms.
33 Business combination
(a) Summary of acquisition – UK Property Shop LimitedOn 8 July 2008, the REA Group acquired UK Property Shop Limited (UKPS) for £530,000 (A$1.1 million) through its 50% owned United Kingdom subsidiary, Propertyfi nder Holdings Ltd.
Details of the fair value of the assets and liabilities acquired and goodwill are as follows:
$’000
Purchase consideration (refer to (b) below):
Cash paid 1,107
Direct costs relating to the acquisition 103
Total purchase consideration 1,210
Fair value of net identifi able assets acquired (refer to (c) below) 532
Goodwill (refer to (c) below and note 16) 678
(b) Cash fl ow information
Outfl ow of cash to acquire subsidiary, net of cash acquired
Cash consideration 1,210
Less: Net cash acquired with the subsidiary 27
Outfl ow of cash 1,183
(c) Assets and liabilities acquiredThe assets and liabilities arising from the acquisition are as follows:
Acquiree’s carrying amount
$’000Fair value
$’000
Cash and cash equivalents 27 27
Trade and other receivables 35 35
Plant and equipment 3 3
Intangible assets* – 773
Payables (6) (6)
Deferred subscriptions (84) (84)
Deferred tax liability – (216)
Net assets (25) 532
* Identifi able intangible assets comprise Online Subscriber relationships which are being amortised over 10 years.

72 REA Group Annual Report 2009
NOTES TO THE FINANCIAL STATEMENTS CONTINUED
34 SubsidiariesThe consolidated fi nancial statements incorporate the assets, liabilities and results of the following subsidiaries in accordance with the accounting policy described in note 2(b):
Name of entity Country of incorporation Equity holding Investment2009
%2008
%2009
$’0002008
$’000
property.com.au Pty Limited Australia 100 100 – –
realestate.com.au Pty Ltd* Australia 100 100 32,170 26,153
homeguru Pty Limited Australia 58.3 63 – –
• ozhomevalue Pty Limited Australia 100 100 – –
Property Look Pty Limited Australia 100 100 – –
Hub Online Global Group Australia 100 100 – 6,255
Web Effect International Pty Limited Australia 100 100 – –
NL/HIA JV Pty Limited Australia 100 100 – –
REA Group FZ LLC UAE 51 51 – 3,580
REA Group Hong Kong Limited Hong Kong 100 100 – 4,154
Square Foot Limited Hong Kong 100 100 – –
Prime Media Limited Hong Kong 100 100 – –
REA Group Europe Limited UK 100 100 40,504 57,820
REA UK Limited* UK 50 50 – –
• Propertyfi nder Holdings Limited UK 100 100 – –
– Sherlock Publications Limited UK 100 100 – –
– Asserta Home Limited UK 100 100 – –
– UK Property Shop Limited UK 100 – – –
– Propertyfi nder.co.uk Limited UK 100 100 – –
Internet Property Finder Limited UK 100 100 – –
• Propertyfi nder Publications Limited UK 100 100 – –
REA Italia Limited Italy 69.4 69.4 – –
• casa.it Srl Italy 100 100 – –
• atHome Group S.A Luxembourg 100 100 – –
atHome International S.A. Luxembourg 100 100 – –
• Altowin S.A Belgium 100 100 – –
• REA Group European Prod’n Centre S.A. Luxembourg 100 – – –
72,674 97,962
*Formerly named Netwide Solutions Pty Limited.
**REA Group Europe Limited controls all UK subsidiaries via a majority on the board and consequently has fully consolidated the fi nancial accounts since acquisition date.
During 2009 the business of Hub Online Global Group (Hub Online) was transferred to realestate.com.au Pty Ltd. This transfer has been accounted for as an equity distribution from Hub Online to REA Group Limited and corresponding equity contribution from REA Group Limited to Hub Online. The equity distribution/contribution has been measured based on the carrying amount of the investment in Hub Online such that the carrying amount of realestate.com.au Pty Ltd has been increased by the previous carrying amount of Hub Online. The equity distribution/contribution did not give rise to an impact on REA Group Limited’s profi t for the period.

www.rea-group.com 73
35 Events after the balance sheet dateOn 31 July 2009, the Group announced the sale of its 51% stake in its Dubai operation to the founder for USD$310k (AUD$380k), subject to approval from UAE authorities.
On 7 August 2009, the Group announced the completion of the sale of its 50% stake in the UK online operations to Zoopla Limited.
36 Reconciliation of profi t after income tax to net cash infl ow from operating activities
Consolidated Parent entity2009
$’0002008
$’0002009
$’0002008$’000
(Loss)/Profi t for the year (34,638) 15,763 21,551 (433)
Depreciation and amortisation cont. operations 7,348 6,404 – –
Impairment cont. operations 7,995 – – –
Depreciation and amortisation discont. operations 1,234 932 – –
Impairment discont. operations 46,460 – – –
Net (profi t)/loss on disposal of plant and equipment (451) 37 – –
Write down of investment – – 35,164 –
Less dividends (investing) – – (56,976) –
Long Term Incentive Plan expenses 675 – – –
Non cash adjustment 269 24 23 (437)
Share of losses of Associate – 185 – –
Change in assets and liabilities
(Increase) / decrease in trade and other receivables* 80 (7,761) (10,035) (21)
(Increase) / decrease in other current assets (631) (691) 171 (151)
(Increase) / decrease in assets held for sale (2,393) – – –
(Increase) decrease in deferred tax assets (961) 208 36 216
(Decrease) / increase in other current liabilities* 1,237 698 – 117
(Decrease) / increase in liabilities held for sale 3,227 – – –
Increase (decrease) in deferred tax liabilities* (1,918) (1,531) (59) (52)
(Decrease) / increase in current tax liabilities 3,846 (2,217) (4,366) (17,470)
(Decrease) / increase in trade and other payables 172 3,342 (144) 998
(Decrease) / increase in provisions 246 478 – –
(Decrease) / increase in non-current trade and other payables – – (2,265) –
Net cash infl ow (outfl ow) from operating activities 31,797 15,871 (16,900) (17,233)
*Net of adjustments for purchase of UK Property Shop and sale of Clarke Computers

74 REA Group Annual Report 2009
NOTES TO THE FINANCIAL STATEMENTS CONTINUED
37 Earnings per share
Consolidated2009
Cents2008
Cents
(a) Basic earnings per share
From continuing operations attributable to the ordinary equity holders of the company 25.6 21.4
From discontinued operation (24.9) (3.8)
Total basic earnings per share attributable to the ordinary equity holders of the company 0.7 17.6
(b) Diluted earnings per share
From continuing operations attributable to the ordinary equity holders of the company 25.6 21.4
From discontinued operation (24.9) (3.8)
Total diluted earnings per share attributable to the ordinary equity holders of the company 0.7 17.6
(c) Weighted average number of shares used as the denominator
Consolidated2009
Number2008
Number
Weighted average number of ordinary shares used as the denominator in calculating basic earnings per share 127,255,057 127,255,057
Effect of share options on issue during the fi nancial year – –
Weighted average number of ordinary shares and potential ordinary shares used as the denominator in calculating diluted earnings per share 127,255,057 127,255,057
There is no effect of the share options granted under the Long Term Incentive Plan (refer 38) on the weighted average number of ordinary shares as shares issued under this plan will be purchased on market.
38 Share based payments
(a) Long Term Incentive PlanIn the FY08 fi nancial year, the Group established and announced a long term incentive plan for executives identifi ed by the Board. The plan is based on the grant of performance rights that vest into shares on a 1 to 1 basis at no cost to the employee subject to performance hurdles. Settlement of the performance rights is made in ordinary shares.
The performance measures selected by the Remuneration and Nomination Committee are based upon Group revenues and EBITDA or EBIT for all executives responsible for the Group, and regional or country revenues and contribution margin (EBITDA before internal allocations) for all other executives. The actual performance is compared to the budgeted measures for the performance period.
The initial offer (Plans 1a and 1b) for employees who were employed before 1 July 2006 is a transitional arrangement. It is either based in equal parts on the performance in FY 2009 and on the performance in FY 2010, or for recent additions to the management team only on performance in FY 2010. The number of rights granted to the latter group is adjusted (pro rata) for the number of days in services compared to the total number of days between grant date and vesting date.
Plan 2 was offered on 1 July 2008 and has a vesting date of 1 July 2011. At this time 179,545 rights were granted at a value of $789,998.
Subsequently, it is planned that every year a new offer is made with a performance period as the third year after the grant date. If the executive leaves during or before the performance period due to illness, redundancy or death, any granted rights which the Board determines should not vest will lapse. If the executive leaves due to other reasons, the granted rights may be forfeited at the Board’s discretion. If the executive leaves for any reason, any rights not yet granted will also be forfeited.

www.rea-group.com 75
38 Share based payments (continued)
Plan Expiry date
Balance at start of
the year
Granted during
the year
Forfeited during
the year
Balance at end of the year
Number Number Number Number
Plan 1a 1 July 2009 69,767 – (14,534) 55,233
Plan 1b 1 July 2010 126,805 – (67,194) 59,611
Plan 2 1 July 2011 – 179,545 (23,900) 155,645
Total 196,572 179,545 (105,628) 270,489
Rights are vested after the performance period. In case of under or over performance the eligible rights will be adjusted as per below:
Payment Scale
Target achieved % LTIP to be paid
<80% None
80% – 100% 80% – 100% vesting
100% – 105% 100% vesting
>105% – 120% >105% – 120% vesting
>120% 120% vesting
As all the performance periods lie in the future, no rights are exercisable (or have been exercised) at balance date.
Grant DatePerformance
Period
Vesting date (and earliest
exercise date)Number of
Rights granted
Value of Rights as at grant date
$
Plan 1a – initial offer 22 May 2008 FY 2009 1 July 2009 69,767 360,000
Plan 1b – initial offer 22 May 2008 FY 2010 1 July 2010 126,805 654,315
Plan 2 1 July 2008 FY 2011 1 July 2011 179,545 789,998
The fair value of each performance right is estimated on the grant date using a Monte Carlo simulation. The valuation was performed independently by KPMG. So far no performance hurdles have been met as the performance period lies in the future.
Weighted average share price at
measurement date Exercise price Expected volatilityRisk-free
interest rateExpected life of
performance right
Plan 1a – initial offer $5.15 (22 May 2008) $0.00 40.5% 6.673% 13 months
Plan 1b – initial offer $5.15 (22 May 2008) $0.00 40.5% 6.673% 25 months
Plan 2 $4.40 (1 July 2008) $0.00 38.4% 5.785% 37 months
Simulated share price at
vesting date
Weighted average fair value per
right at grant date
Plan 1a – initial offer $5.54 $5.16
Plan 1b initial offer $5.92 $5.16
Plan 2 $5.23 $4.40
The dividend yield of 0.0% applied refl ects the fact that no dividend has been previously paid and that the expected life of the right is up to the vesting date. The expected volatility is based on the Group’s historic volatility and is designed to be indicative of future trends, which may also not be the actual future outcome.
The long term incentive plan resulted in share based compensation expense of $605,520 (2008: $69,546).

76 REA Group Annual Report 2009
DIRECTORS’ DECLARATION
In the directors’ opinion:
(a) the fi nancial statements and notes set out on pages 36 to 75 are in accordance with the Corporations Act 2001, including: (i) complying with Accounting Standards, the Corporations Regulations 2001 and other mandatory professional reporting requirements,
and (ii) giving a true and fair view of the company’s and consolidated entity’s fi nancial position as at 30 June 2009 and of their performance
for the fi nancial year ended on that date; and(b) there are reasonable grounds to believe that the company will be able to pay its debts as and when they become due and payable.
The directors have been given the declarations by the chief executive offi cer and chief fi nancial offi cer required by section 295A of the Corporations Act 2001.
This declaration is made in accordance with a resolution of the directors.
Mr Richard J FreudensteinDirector
Melbourne, 20 August 2009

www.rea-group.com 77
INDEPENDENT AUDITOR’S REPORT
Independent auditor’s report to the members of REA Group Limited
Report on the Financial ReportWe have audited the accompanying fi nancial report of REA Group Limited, which comprises the balance sheet as at 30 June 2009, and the income statement, statement of changes in equity and cash fl ow statement for the year ended on that date, a summary of signifi cant accounting policies, other explanatory notes and the directors’ declaration of the consolidated entity comprising the company and the entities it controlled at the year’s end or from time to time during the fi nancial year.
Directors’ Responsibility for the Financial ReportThe directors of the company are responsible for the preparation and fair presentation of the fi nancial report in accordance with the Australian Accounting Standards (including the Australian Accounting Interpretations) and the Corporations Act 2001. This responsibility includes establishing and maintaining internal controls relevant to the preparation and fair presentation of the fi nancial report that is free from material misstatement, whether due to fraud or error; selecting and applying appropriate accounting policies; and making accounting estimates that are reasonable in the circumstances. In Note 2, the directors also state that the fi nancial report, comprising the fi nancial statements and notes, complies with International Financial Reporting Standards as issued by the International Accounting Standards Board.
Auditor’s ResponsibilityOur responsibility is to express an opinion on the fi nancial report based on our audit. We conducted our audit in accordance with Australian Auditing Standards. These Auditing Standards require that we comply with relevant ethical requirements relating to audit engagements and plan and perform the audit to obtain reasonable assurance whether the fi nancial report is free from material misstatement.
An audit involves performing procedures to obtain audit evidence about the amounts and disclosures in the fi nancial report. The procedures selected depend on our judgment, including the assessment of the risks of material misstatement of the fi nancial report, whether due to fraud or error. In making those risk assessments, we consider internal controls relevant to the entity’s preparation and fair presentation of the fi nancial report in order to design audit procedures that are appropriate in the circumstances, but not for the purpose of expressing an opinion on the effectiveness of the entity’s internal controls. An audit also includes evaluating the appropriateness of accounting policies used and the reasonableness of accounting estimates made by the directors, as well as evaluating the overall presentation of the fi nancial report.
We believe that the audit evidence we have obtained is suffi cient and appropriate to provide a basis for our audit opinion.
IndependenceIn conducting our audit we have met the independence requirements of the Corporations Act 2001. We have given to the directors of the company a written Auditor’s Independence Declaration, a copy of which is included in the directors’ report. In addition to our audit of the fi nancial report, we were engaged to undertake the services disclosed in the notes to the fi nancial statements. The provision of these services has not impaired our independence.
Auditor’s OpinionIn our opinion: 1. the fi nancial report of REA Group Limited is in accordance with the Corporations Act 2001, including:
i giving a true and fair view of the fi nancial position of REA Group Limited and the consolidated entity at 30 June 2009 and of their performance for the year ended on that date; and
ii complying with Australian Accounting Standards (including the Australian Accounting Interpretations) and the Corporations Regulations 2001.
2. the fi nancial report also complies with International Financial Reporting Standards as issued by the International Accounting Standards Board.
Ernst & Young Building8 Exhibition StreetMelbourne VIC 300 AustraliaGPO Box 67 Melbourne VIC 3001
Tel: +61 3 9288 8000Fax: +61 3 8650 7777www.ey.com/au
Liability limited by a scheme approved under Professional Standards Legislation
78 REA Group Annual Report 2009
Report on the Remuneration ReportWe have audited the Remuneration Report included in pages 23 to 26 of the directors’ report for the year ended 30 June 2009. The directors of the company are responsible for the preparation and presentation of the Remuneration Report in accordance with section 300A of the Corporations Act 2001. Our responsibility is to express an opinion on the Remuneration Report, based on our audit conducted in accordance with Australian Auditing Standards.
Auditor’s OpinionIn our opinion the Remuneration Report of REA Group Limited for the year ended 30 June 2009, complies with section 300A of the Corporations Act 2001.
Ernst & Young
David McGregorPartner20 August 2009Melbourne, Australia
INDEPENDENT AUDITOR’S REPORT CONTINUED

www.rea-group.com 79
SHAREHOLDER INFORMATION
The shareholder information set out below was applicable as at 21 September 2009.
A. Distribution of equity securitiesAnalysis of numbers of equity security holders by size of holding:
Holding Shares
1 – 1,000 375,020
1,001 – 5,000 1,952,448
5,001 – 10,000 1,629,190
10,001 – 100,000 4,893,389
100,001 and over 118,405,010
127,255,057
There were 27 holders of less than a marketable parcel of ordinary shares.
B. Equity security holders
Twenty largest quoted equity security holdersThe names of the twenty largest holders of quoted equity securities are listed below:
Name Ordinary shares
Number held Percentage of issued shares
News Ltd 77,256,121 60.7%
National Nominees Limited 8,211,508 6.5%
J P Morgan Nominees Australia Limited 6,185,789 4.9%
UBS Nominees Pty Limited 5,797,682 4.6%
HSBC Custody Nominees (Australia) Limited 4,889,322 3.8%
Citicorp Nominees Pty Limited 2,822,565 2.2%
Cogent Nominees Pty Limited 2,120,969 1.7%
ANZ Nominees Limited 1,755,740 1.4%
Effi e Holdings Pty Limited 1,325,000 1.0%
RBC Dexia Investor Sevices Aust Nominees Pty Limited 911,789 0.7%
Classifi ed Ad Ventures Pty Limited 805,036 0.6%
M F Custodians Limited 705,626 0.6%
Meruma Pty Limited 564,000 0.4%
Holdex Nominees Pty Limited 549,002 0.4%
Mirrabooka Investments Limited 492,927 0.4%
Smallco Investment Manager Limited 414,927 0.3%
Harley Clarke Enterprises Pty Limited 400,000 0.3%
Amcil Limited 334,337 0.3%
Mr Vivian Faram Findlow 278,246 0.2%
Mr Simon Timothy Baker + Ms Melita Currie <ST&M SUPER/FUND A/C> 268,895 0.2%
116,089,431 91.2%
C. Substantial holdersSubstantial holders in the company are set out below:
Number held Percentage
Ordinary shares
News Ltd 77,256,121 60.7
National Nominees Limited 8,211,508 6.5
80 REA Group Annual Report 2009
Directors Mr Richard J Freudenstein BEc, LLB (Hons)Chairman
Mr Roger Amos FCA, MAICD
Ms Kathleen Conlon BA(ECON)(DIST), MBA, MAICD
Mr Greg Ellis (appointed 23 September 2008) BBus
Mr John D McGrath
Mr Alasdair MacLeod
Mr Jeremy Philips (appointed 4 March 2009) BA, LLB, MPA
Mr Stephen P Rue CA, BBS, DPA
Mr Sam R White BCom, LLB
SecretaryMs Moana Weir BA, LLB(Hons), MAICD
Notice of annual general meetingThe annual general meeting of REA Group Limited will be held at:
The Langham, MelbourneOne Southgate AvenueSOUTHBANK, VIC 3006
Time: 12pmDate: 25 November 2009
Principal registered offi ce in AustraliaLevel 1, 678 Victoria StreetRICHMOND, VIC 3121 AustraliaTel: +61 3 9897 1121 Fax: +61 3 9897 1114
Share registerComputershare Registry Services Pty LimitedYarra Falls452 Johnson StreetABBOTSFORD, VIC 3067 AustraliaTel: +61 3 9415 5000 Fax: +61 3 9473 2500
AuditorErnst & Young8 Exhibition StreetMELBOURNE, VIC 3000 Australia
SolicitorsMallesons Stephen JaquesLevel 50, Bourke Place600 Bourke StreetMELBOURNE, VIC 3000 Australia
BankersNational Australia Bank Limited
Stock exchange listingsREA Group Ltd shares are listed on the Australian Securities Exchange.
Internet addresswww.rea-group.com
CORPORATE INFORMATIONABN 54 068 349 066

Des
igne
d an
d pr
oduc
ed b
y H
aym
an D
esig
n
NOTES
Cert no. XXX-XXX-XXXX
Chairman’s letter 1CEO & MD’s letter 2Highlights 5Revenue & Operations 6
Australian Business Summary 9Overseas Business Summary 10REA People 15Financial Statements 16Corporate Information 80
CONTENTS

realestate.com.au Ltd
REA
Gro
up
An
nu
al Rep
ort 2009
ORGANICALLY GR WNREA GROUP ANNUAL REPORT 2009