re: morgan creek harbor corrosion assessment report isle
TRANSCRIPT

May 27, 2021
Mr. Christopher Moore, PE Project Engineer Jon Guerry Taylor & Associates, Inc. PO Box 1082 Mt. Pleasant, South Carolina 29465 (843) 884-6415 www.jgtinc.com Re: Morgan Creek Harbor Corrosion Assessment Report Isle of Palms, South Carolina Dear Mr. Moore,
In accordance Jon Guerry, Taylor and Associates (JGT) written authorization dated December 22, 2020 and our proposed scope of work dated November 11, 2020, Southern Cathodic Protection Company (SCPC) personnel conducted a condition assessment of approximately 6,000 feet of steel sheet pile installed1 at the subject harbor at Isle of Palms, South Carolina. The project objective was to identify deterioration processes affecting structure life. The assessment was therefore focused on the pile coating system effectiveness, electrochemical activity due to environmental exposure and stray current sources, and strength of the steel pile material. The following sections and attachments detail the inspection findings. The Figure 01 below shows the project site and key elements referenced frequently in the subsequent text and attachments. The report is outlined below.
Tests and Measurements
Results and Analysis
Conclusions
Recommendations
Exhibit 1: Metal Samples Destructive Testing
Exhibit 2: Ultrasonic Metal & Coating Thickness Measurements
Exhibit 3: Stray Current Test Results: Data Logger & Spot Measurements
Exhibit 4: Electrochemical Potential Measurements – Vertical Profiles
Exhibit 5: Steel Pile Electrical Continuity Testing
Exhibit 6: Electrochemical Properties of Soil & Water Samples
Exhibit 7: Microbiologically-Influenced Corrosion (MIC) Testing Results
Exhibit 8: Environmental Corrosivity Analysis
1 Station numbering marked on the piles includes a 100-foot gap. The east end of the south wall is marked 27+00 and the west end of the north wall starts at 26+00. Southern wall starting location should have been marked 26+00 also, not 27+00.

Corrosion Assessment Report, Morgan Creek Harbor, March - May, 2021 – (cont.)
Page 2 of 9
Figure 01: Morgan Creek Harbor showing start and end point station numbers as marked on the wall pile cap. The wall is comprised of 2 segments.
BACKGROUND
The steel sheet pile was reportedly constructed circa 1997 and was comprised of AZ13 and AZ18 steel sheet pile2 of grade 50 and 60 strengths in varying lengths. The sheets were capped with a continuously-welded and concrete-filled steel channel. The wall replaced an existing wooden sea wall and was not originally installed with a tie-back system. The anchors were installed several years later following observation of wall displacements. The wall is divided in two segments – one on each side of the Morgan Creek Harbor, as shown in Figure 01 above. Numerous housing units (single family and multi-story condominiums) and marine docks are located along the wall. According to record drawings and field observations, the sheets were originally coated only on the water side with coal tar epoxy. Numerous subsequent coatings were evidently applied in the course of maintaining the structure. Figure 02 below shows the typical coating system observed.
2 The material thickness used for the analysis herein was found in the ArcelorMittal “Piling Handbook,” 8th Edition, 2008. The stated value is 9.5 millimeters or 374 mils.
N

Corrosion Assessment Report, Morgan Creek Harbor, March - May, 2021 – (cont.)
Page 3 of 9
Figure 02: Illustration of typical coatings applied over time. The grinding process revealed the coating history. The middle surface was polished to bare metal.
TESTS & MEASUREMENTS
The following summarizes tests conducted to evaluate the wall condition. Visual Inspection: Upon arrival and throughout the field examination, a visual inspection was conducted to identify evidence of deterioration. In particular, the inspection was performed to identify locations where the wall was visibly corroded through. This portion

Corrosion Assessment Report, Morgan Creek Harbor, March - May, 2021 – (cont.)
Page 4 of 9
of the work was conducted from a small watercraft to access otherwise inaccessible segments of the wall. Mechanical Properties of the Steel: Six steel coupons were collected from sites identified during the corrosion evaluation and furnished to a metals testing laboratory, Applied Technical Services, Inc of Marietta, Georgia, for destructive testing. The tests performed include yield strength, tensile strength and chemical properties. The results may be used to conduct a structural integrity assessment of the wall. Structure Potential: Using a Fluke 87V high-input impedance digital multimeter and copper-copper sulfate reference electrode, measures of structure potential were recorded. The measurements are commonly stated in Volts and millivolts. This technique is utilized to evaluate the overall corrosion condition of the structure, identify personnel threats due to AC voltages and detect DC interference usually associated with aggressive corrosion. An M. C. Miller model Gx data logger was similarly employed to record structure potential measurements at a single location for a period of approximately 8 hours per site. Three locations were selected and the data recorded at 1-second intervals. Electrical Continuity Testing: The aforementioned digital multimeter and appropriate test reels were used to evaluate electrical continuity of the sheet pile structure. The test required firm, temporary electrical connection of the test meter positive (+) lead to the steel structure, while the negative lead was connected to adjacent sheets with an awl designed to penetrate to coating to bare metal beneath. The meter is set to measure millivolts DC, and the potential difference between the sheets and pile cap is recorded. A zero potential difference indicates electrical continuity. Two 100-foot sample segments were selected for evaluation and each pile pair was tested. Ultrasonic Thickness Measurements: a DeFelsko PosiTector UTG was utilized to measure thickness of the steel sheets. A similar instrument, the DeFelsko PosiTector 6000, was used to measure coating thickness. These instruments collected 10 measurements at each test site for statistical evaluation of the data quality. The measurements were used to determine corrosion loss rates and evaluate coating system functionality. Measurements were recorded at six selected locations on approximately 8-inch centers along the pile wall. Properties of the Electrolytes: Water, channel bottom silt and land-side soil samples were collected for determination of electrochemical properties of the materials. Measures of pH, resistivity and chlorides were conducted. These properties are key attributes of corrosivity for naturally-occurring bulk materials. Microbiologically Influenced Corrosion (MIC) Testing: Bacteria are commonly associated with aggressive corrosion of steel in a variety of environments. The key class of organism responsible for the phenomena are called sulfate-reducing bacteria. A Biosan Laboratories, Inc. model Sani-Check SRB test kit was utilized to sample and culture the bacterial colonies where present.

Corrosion Assessment Report, Morgan Creek Harbor, March - May, 2021 – (cont.)
Page 5 of 9
RESULTS AND ANALYSIS
The following sections summarize the evaluation findings. Data records and detailed analyses are attached as Exhibits 1 through 5.
Visual inspection of the structures found a significantly deteriorated coating system in the tidal and splash zones, particularly along the north wall segment. Large corrosion product scaling was observed with widespread inter-layer disbondment of the corroded metal. No through-wall penetrations were found; although, the wall was found leaking behind a jacking plate at Station 58+80 and a missing tie rod end was observed at Station 35+80. Figure 03 below illustrates typical coating and corrosion conditions observed.
Figure 03: Coating system failure with significant corrosion product scaling in the splash and tidal zones. Location was found on the north wall at Station 17+30.

Corrosion Assessment Report, Morgan Creek Harbor, March - May, 2021 – (cont.)
Page 6 of 9
The sheet pile metal samples were collected from sites where electrochemical testing indicated corrosion activity and wall loss were likely. Key findings include approximately 69% wall loss at Station 17+30 and a yield strength measurement below the steel grade specification for the indicated product utilized in the original installation. A wall structural analysis utilizing these data is scheduled to be performed by others. Figure 04 shows at the coupon collected at Station 17+30. The third-party examination results are included in Exhibit 1 below.
Figure 04: One of six coupons taken from the pile walls. Note the heavy corrosion product scale. The soil side of the coupon is shown. The water-side appearance was
very similar.

Corrosion Assessment Report, Morgan Creek Harbor, March - May, 2021 – (cont.)
Page 7 of 9
Structure potential measurements along each side of the walls were largely
consistent and typical for bare, unprotected steel in the respective electrolytes; however, a significant difference existed between the water and soil sides – approximately 250mV on average. This difference causes a small corrosion current to flow from the more active water side to the more noble soil side, accelerating corrosion of the water-immersed sheets. The cause of the potential difference is likely differential aeriation conditions and difference of electrolytes. The data were recorded in Exhibit 4.
Stray current testing found both structures free of stray or dynamic DC or AC voltages at the time of evaluation. All AC potentials were zero and all DC potentials were stable. The time series data recorded along each wall were largely flat. Minor fluctuation was observed in the range of a few millivolts, likely due to changing tide conditions. The data and time series plots are attached in Exhibit 3.
In the segments evaluated, the structure was found electrically continuous. All measurements of potential difference in the test areas were zero, indicating continuity. Inspection of the pile cap bottom side found numerous welds, likely placed during the original construction, thereby creating an electrical pathway. Continuity is important for functionality of a corrosion control system, should such measures be implemented.
Measurement of metal and coating thickness indicated significant corrosion activity and inadequate coating. Metal loss was most common in the splash zone and where the coating system was found most deteriorated. This result indicated the majority of corrosion has occurred on the water side. However, thickness losses observed in the top portions of the wall, most notably Station 44+80, occurred on the soil side. The pile coating systems were found in satisfactory condition on the visible water side at these elevations. Exhibit 2 contains the detailed analyses. Additional, Figure 05 below provides a visual reference of the corrosion losses.
Samples were collected from four sites and tested for sulfate-reducing bacteria activity. During the low-tide inspection, corrosion tubercles were observed largely at the tie-back jacking plates among significant biofouling (oyster colonies). These bacterial formations were sampled and cultured. The test results are shown in Table 1 below. All four sites tested positive for active colonies.

Corrosion Assessment Report, Morgan Creek Harbor, March - May, 2021 – (cont.)
Page 8 of 9
Table 1: MIC Testing for SRB
Station No.
Date of Collection
Time Distance
BTP Result
05+65 1/28/2021 16:25 60” Positive
30+10 1/28/2021 15:34 62” Positive
59+35 1/28/2021 14:15 89” Positive
61+00 1/28/2021 11:30 60” Positive
The corrosion rate analysis was performed considering environmental conditions and actual wall losses measured in situ. A statistical corrosion probability analysis was conducted based upon the environment samples. The model estimated approximately 33 years until probable corrosion failure of the wall. Similarly, if the largest average corrosion rate detected is used for a linear prediction3, 32 years is found. Figure 05 below shows the loss analysis graphically. Exhibit 5 contains the environmental sample test results.
Figure 05: Visual metal loss analysis from UT measurements. Thickness losses are due to corrosion on both sides of sheets. Elevations adjusted as necessary to account
for differences in measurement elevations site to site.
3 Using 11.7 mils lost per year as found at Station 35+89 Elevation 57” BTP and at nominal original wall thickness of 374 mils (9.5mm), through wall penetration will occur in 374mils/11.7mpy = 32 Years
BTP 0+60 17+30 23+00 35+89 44+80 60+90
AZ13 AZ18 AZ13 AZ18 AZ18 AZ13
9 1.2 2.2 -0.3 -0.2 8.5
17 2.4 1.2 0.0 0.1 3.4 7.6
25 4.7 1.8 -0.3 -0.1 0.8 1.7
33 5.7 4.9 0.2 1.2 3.2 6.1
41 5.6 5.9 0.3 3.4 2.2 5.2
49 6.5 4.2 0.5 5.5 1.3 2.8
57 4.7 3.4 0.1 11.7 1.5 3.2
65 2.1 2.2 0.3 1.9 0.9 4.3
73 1.7 0.6 0.3 0.5 0.9 0.3
81 0.3 0.4
89 0.2
Original Thickness, Nom.: 374 mils (9.5mm)Present Year: 2021
Installation Year: 1997
Station Number
Sheet Pile Shape
Corrosion Assessment Report, Morgan Creek Harbor, March - May, 2021 – (cont.)
Page 9 of 9
CONCLUSIONS
Based on the results of testing, the following conclusion was drawn.
Metal loss detected on the sheet pile surfaces were not likely related to interference currents. While it is possible interference currents may have existed in the past or could occur in the future, estimate of the free corrosion rate (in absence of outside forces) compared favorably with field results.
Deterioration of the sheet pile structure was an interaction of deferred water-side coating maintenance, no soil-side coating, a highly corrosive environment, and no electrochemical corrosion control system installed.
RECOMMENDATIONS
Based upon the tests conducted, the following recommendations are submitted.
Following a detailed structural condition analysis confirming sufficient remaining strength of the wall, the coating system must be restored and a cathodic protection system designed and installed promptly. Should a structural investigation find the wall strength inadequate, the new wall should be installed with a complete coating system on both water and soil sides; and a robust cathodic protection system designed, installed and properly maintained for the wall life.
Should you have any questions regarding our report or require additional information, please contact us at your earliest convenience. We appreciate the opportunity to be of service and look forward to future correspondence. Sincerely, Christopher R. McKinley, P.E. Chief Operating Officer Southern Cathodic Protection Company

EXHIBIT 1 Metal Samples Destructive Testing
Morgan Creek Harbor Corrosion Assessment Report Jon Guerry Taylor & Associates, Inc.
May 26, 2021


EXHIBIT 2 Ultrasonic Metal & Coating Thickness Measurements
Morgan Creek Harbor Corrosion Assessment Report Jon Guerry Taylor & Associates, Inc.
May 26, 2021

BTP # Mean St. Dev. Min. Max. Mean St. Dev. Min. Max.
9 1 346.0 2.4 349 342 28.96 2.21 32.7 25.517 2 315.7 1.9 318 313 30.11 2.94 36.7 26.725 3 260.2 7.7 268 250 31.51 2.48 35.0 27.933 4 238.4 0.8 240 237 58.03 5.01 67.8 50.041 5 239.2 2.9 245 236 49.94 4.38 55.1 42.549 6 218.7 2.9 221 214 65.41 3.09 68.9 61.057 7 260.8 2.0 264 257 59.27 2.33 63.5 56.565 8 322.6 1.0 324 321 34.06 2.54 38.2 28.873 9 334.4 1.6 338 333 29.07 3.00 33.6 26.2
Metal Thickness Coating Thickness
MATERIAL THICKNESS TEST REPORT - 0+60
0
10
20
30
40
50
60
70
80
0.0 200.0 400.0 600.0
Dis
tanc
e B
elow
Top
of
Pile
Cap
(B
TP
)(in
ches
)
Thickness (mils)
STA 00+60 Wall and Coating Thickness
Wall Thickness Wall + Coating Thickness

BTP # Mean St. Dev. Min. Max. Mean St. Dev. Min. Max.
9 1 321.5 1.1 323 319 28.67 1.19 30.2 26.917 2 345.4 3.7 349 337 32.21 1.87 35.0 30.025 3 329.7 1.1 331 328 33.95 2.61 36.5 27.633 4 256.3 1.5 260 255 43.75 2.56 47.1 39.641 5 232.0 4.5 240 225 57.23 3.39 64.1 50.849 6 272.5 0.7 273 271 55.30 2.79 59.0 50.857 7 291.6 6.9 303 283 74.10 1.29 76.3 72.265 8 320.4 2.1 324 317 27.02 2.13 30.0 24.673 9 360.1 3.5 365 353 24.04 2.13 27.8 20.8
Metal Thickness Coating Thickness
MATERIAL THICKNESS TEST REPORT - 17+30
0
10
20
30
40
50
60
70
80
0.0 200.0 400.0 600.0
Dis
tanc
e B
elow
Top
of P
ile C
ap (
BT
P)
(inch
es)
Thickness (mils)
STA 17+30 Wall and Coating Thickness
Wall Thickness Wall + Coating Thickness

BTP # Mean St. Dev. Min. Max. Mean St. Dev. Min. Max.
9 1 381.3 2.9 386 376 32.31 2.05 35.8 29.217 2 373.9 1.5 377 372 30.29 1.23 32.2 28.725 3 381.5 1.0 383 380 22.62 1.01 24.3 20.533 4 368.2 1.8 370 366 22.88 2.03 28.0 21.441 5 367.5 0.7 368 366 25.97 1.29 27.7 23.149 6 362.7 1.1 364 360 35.34 1.74 37.6 33.357 7 372.4 1.4 374 370 30.43 1.04 31.9 28.765 8 365.7 1.2 367 363 27.36 1.99 31.3 25.373 9 367.2 1.1 369 366 37.07 3.35 41.9 31.7
Metal Thickness Coating Thickness
MATERIAL THICKNESS TEST REPORT - 23+00
0
10
20
30
40
50
60
70
80
0.0 200.0 400.0 600.0
Dis
tanc
e B
elow
Top
of
Pile
Cap
(B
TP
) (in
ches
)
Thickness (mils)
STA 23+00 Wall and Coating Thickness
Wall Thickness Wall + Coating Thickness
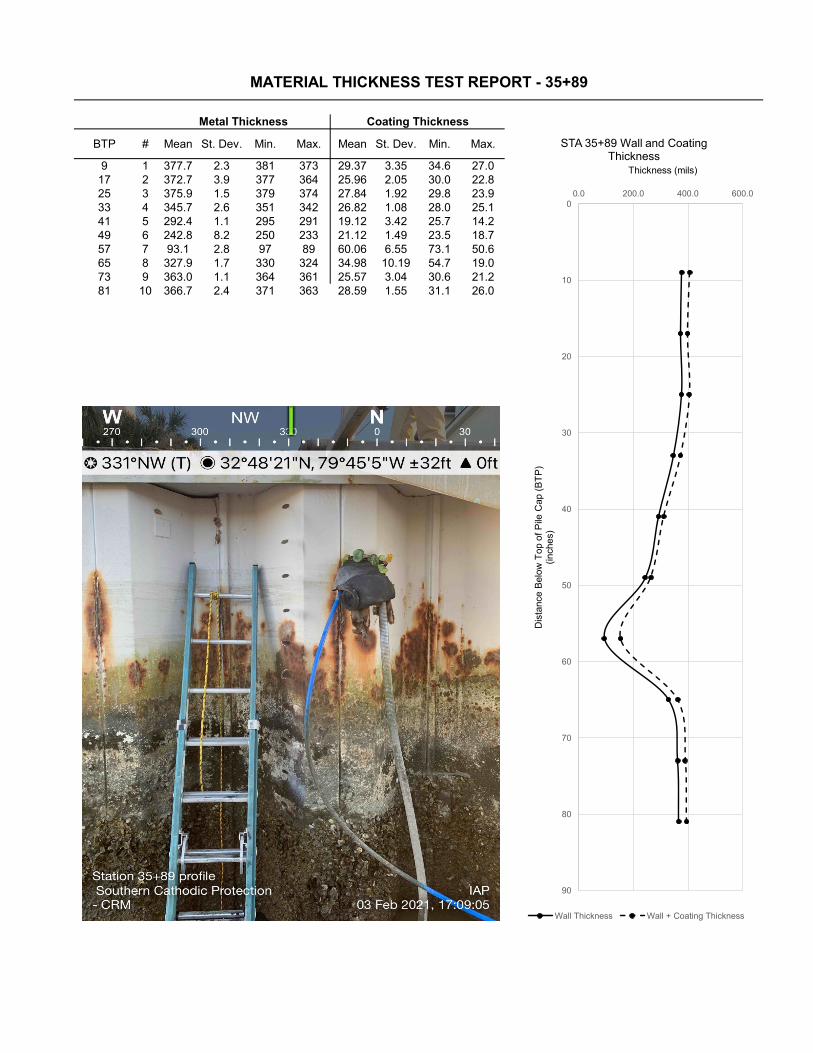
BTP # Mean St. Dev. Min. Max. Mean St. Dev. Min. Max.
9 1 377.7 2.3 381 373 29.37 3.35 34.6 27.017 2 372.7 3.9 377 364 25.96 2.05 30.0 22.825 3 375.9 1.5 379 374 27.84 1.92 29.8 23.933 4 345.7 2.6 351 342 26.82 1.08 28.0 25.141 5 292.4 1.1 295 291 19.12 3.42 25.7 14.249 6 242.8 8.2 250 233 21.12 1.49 23.5 18.757 7 93.1 2.8 97 89 60.06 6.55 73.1 50.665 8 327.9 1.7 330 324 34.98 10.19 54.7 19.073 9 363.0 1.1 364 361 25.57 3.04 30.6 21.281 10 366.7 2.4 371 363 28.59 1.55 31.1 26.0
Metal Thickness Coating Thickness
MATERIAL THICKNESS TEST REPORT - 35+89
0
10
20
30
40
50
60
70
80
90
0.0 200.0 400.0 600.0
Dis
tanc
e B
elow
Top
of
Pile
Cap
(B
TP
)(in
ches
)
Thickness (mils)
STA 35+89 Wall and Coating Thickness
Wall Thickness Wall + Coating Thickness

BTP # Mean St. Dev. Min. Max. Mean St. Dev. Min. Max.
12 1 168.9 1.4 167 171 30.58 1.04 29.1 32.320 2 291.3 2.2 286 293 26.64 1.07 24.8 28.828 3 354.9 1.7 351 357 30.64 3.10 26.5 37.336 4 296.4 2.0 294 300 37.91 2.93 33.8 42.244 5 321.4 1.0 319 322 44.68 1.93 41.2 57.452 6 343.7 0.5 343 344 49.34 2.84 44.8 55.060 7 339.1 1.3 337 341 43.18 2.67 38.2 46.568 8 351.5 1.0 350 353 37.86 3.01 32.0 42.476 9 351.3 0.7 351 353 33.14 1.77 30.6 35.9
Metal Thickness Coating Thickness
MATERIAL THICKNESS TEST REPORT - 44+80
0
10
20
30
40
50
60
70
80
0.0 200.0 400.0 600.0
Dis
tanc
e B
elow
Top
of
Pile
Cap
(B
TP
)(in
ches
)
Thickness (mils)
STA 44+80 Wall and Coating Thickness
Wall Thickness Wall + Coating Thickness

BTP # Mean St. Dev. Min. Max. Mean St. Dev. Min. Max.
18 1 191.4 1.1 189 192 46.05 1.76 43.2 48.726 2 333.8 3.3 328 340 14.04 2.56 11.4 20.134 3 227.0 9.5 209 236 29.82 1.67 47.9 52.842 4 248.8 1.0 247 250 29.05 2.68 25.8 32.650 5 307.3 1.4 304 309 46.79 1.82 43.5 48.858 6 296.7 1.3 295 299 33.79 4.81 27.2 40.466 7 271.9 5.3 264 281 22.35 2.14 19.4 25.974 8 367.2 1.4 364 369 19.45 2.36 14.6 22.082 9 365.1 0.6 364 366 20.81 2.48 17.0 23.790 10 368.4 1.8 366 371 26.38 4.67 19.6 32.5
Metal Thickness Coating Thickness
MATERIAL THICKNESS TEST REPORT - 60+90
0
10
20
30
40
50
60
70
80
90
100
0 200 400 600
Dis
tanc
e B
elow
Top
of
Pile
Cap
(B
TP
)(in
ches
)
Thickness (mils)
STA 61+00 Wall and Coating Thickness
Wall Thickness Wall + Coating Thickness

EXHIBIT 3 Stray Current Test Results: Data Logger & Spot Measurements
Morgan Creek Harbor Corrosion Assessment Report Jon Guerry Taylor & Associates, Inc.
May 26, 2021

Structure Tested Station No. Potential Potential Notes
millivolts DC Volts AC
On Pile Cap 2+50 -658 0.00
Dock Ramp 3+15 -1068 0.00 Ramp isolated from wall, potential source unknown
On Pile Cap 3+15 -608 0.00
Private Dock 4+15 -613 0.00
Private Dock 5+30 -607 0.00
Private Dock 6+50 -609 0.00
Ramp 7+70 -709 0.00
Private Dock 7+70 -612 0.00
Isolated Private Ramp 8+70 -598 0.00
Isolated Private Ramp 9+90 -610 0.00
Isolated Private Ramp 11+15 -595 0.00
Isolated Private Ramp 12+45 -593 0.00
Isolated Private Ramp 13+20 -712 0.00
Isolated Private Ramp 13+20 -595 0.00
Isolated Private Ramp 14+30 -600 0.00
Isolated Private Ramp 15+50 -571 0.00
Isolated Private Ramp 16+60 -593 0.00
Isolated Private Ramp 17+50 -599 0.00
Isolated Private Ramp 18+65 -592 0.00
Isolated Private Ramp 21+10 -608 0.00
Isolated Private Ramp 22+50 -605 0.00
Isolated Private Ramp 23+80 -608 0.00
Isolated Private Ramp 25+30 -606 0.00
Isolated Private Ramp 28+20 -635 0.00
Isolated Private Ramp 28+60 -637 0.00
Isolated Private Ramp 29+10 -637 0.00
Isolated Private Ramp 29+50 -626 0.00
Isolated Private Ramp 29+90 -620 0.00
Isolated Private Ramp 30+40 -633 0.00
Isolated Private Ramp 30+90 -643 0.00
Isolated Private Ramp 31+30 -641 0.00
Isolated Private Ramp 31+80 -629 0.00
Isolated Private Ramp 32+30 -646 0.00
Isolated Private Ramp 32+40 -646 0.00
Isolated Private Ramp 33+00 -638 0.00
Isolated Private Ramp 33+50 -640 0.00
Isolated Private Ramp 34+10 -649 0.00
Isolated Private Ramp 34+40 -646 0.00
Isolated Private Ramp 34+95 -647 0.00
Isolated Private Ramp 35+50 -634 0.00
On Pile Cap 35+90 -641 0.00
STRAY CURRENT POTENTIAL TESTING

Isolated Private Ramp 35+90 -856 0.00
Private Ramp 36+90 -694 0.00
Private Ramp 37+20 -641 0.00
Private Ramp 37+70 -653 0.00
Private Ramp 38+20 -644 0.00
Private Ramp 38+60 -657 0.00
Wood Ramp @ J Dock 44+75 -735 0.00
Aluminum Ramp @ H Dock 46+00 -656 0.00
Aluminum Ramp @ G Dock 48+00 -654 0.00
Aluminum Ramp @ F Dock 49+50 -664 0.00
Aluminum Ramp @ E Dock 51+10 -664 0.00
Aluminum Ramp @ D Dock 52+80 -664 0.00
Aluminum Ramp @ C Dock 55+00 -661 0.00
Private Ramp 56+40 -643 0.00
Aluminum Ramp @ B Dock 57+00 -670 0.00
Aluminum Ramp @ A Dock 59+00 -704 0.00
Wall @ Ramp A Dock 59+00 -662 0.00
Aluminum Ramp 60+00 -700 0.50

EXHIBIT 4 Electrochemical Potential Measurements – Vertical Profiles
Morgan Creek Harbor Corrosion Assessment Report Jon Guerry Taylor & Associates, Inc.
May 26, 2021

Station No. Water Surface Mid-Depth Mud LineTop of Pile
Soil Surface Notesmillivolts DC millivolts DC millivolts DC millivolts DC
0+00 N/A N/A -668 -455
1+00 -679 -679 -674 -414
2+00 -674 -676 -678 -518
3+00 -675 -649 -676 -398
4+00 -677 -679 -680 -399
5+00 -680 -681 -682 -409
6+00 -668 -675 -679 -435
7+00 -672 -675 -676 -441
8+00 -664 -668 -671 -431
9+00 -664 -668 -671 -388
10+00 -672 -675 -677 -453
11+00 -664 -667 -667 -457
12+00 -669 -671 -672 -462
13+00 -673 -675 -676 -334
14+00 -672 -675 -678 -452
15+00 -668 -671 -672 -489
16+00 -670 -673 -675 -519
17+00 -672 -676 -678 -486
18+00 -673 -675 -677 -405
19+00 -679 -679 -678 -496
20+00 -679 -683 -686 -422
21+00 -681 -683 -684 -383
22+00 -684 -685 -686 -428
23+00 -687 -689 -689 -416
24+00 -689 -690 -690 -426
25+00 -688 -688 -689 -435
26+00 -683 N/A -684 -532 End of wall, shallow water
27+00 N/A N/A N/A -558 At teeing ground, end of wall, no water
28+00 -669 -669 -669 -433
29+00 -678 -678 -678 -485
30+00 -671 -670 -670 -403
31+00 -680 -679 -680 -387
32+00 -645 -640 -642 -440
33+00 -662 -647 -649 -425
34+00 -628 -616 -620 -319
35+00 -669 -667 -669 -412
36+00 -674 -675 -677 -339
37+00 -668 -668 -669 -410
38+00 -668 -668 -668 -403
POTENTIAL PROFILE MEASUREMENTS
Potential Measurements

39+00 -670 -670 -671 -415
40+00 -677 -677 -677 -426
41+00 -679 -679 -680 -385
42+00 -637 -639 -642 -402
43+00 -645 -645 -643 -342
44+00 -673 -673 -673 -397
45+00 -658 -653 -653 -454
46+00 -650 -647 -647 -424
47+00 -638 -638 -638 -485
48+00 -662 -646 -642 -487
49+00 -670 -652 -650 -492
50+00 -658 -658 -651 -401
51+00 -651 -658 -651 -363
52+00 -656 -656 -657 -431
53+00 -670 -650 -650 -439
54+00 -669 -657 -657 -461
55+00 -671 -668 -669 -385
56+00 -671 -673 -672 -380
57+00 -681 -680 -679 -476
58+00 -656 -614 -610 -426
59+00 -656 -619 -615 -477
60+00 -660 -636 -634 -453
61+00 -665 -642 -661 -650

EXHIBIT 5 Electrochemical Properties of Soil & Water Samples
Morgan Creek Harbor Corrosion Assessment Report Jon Guerry Taylor & Associates, Inc.
May 26, 2021

1 - 14 ohm-cm mg/L mg/L + or - mV
100+60, 33"; 1405, 3/8/21
6 3,360 >614 - - -
217+30, 41"; 1248, 3/8/21
6 6,800 >614 - - -
321+18, 36", 1210, 3/8/21
6 10,800 <MDL - - -
434+00, 41"; 0745, 3/9/21
5 1,240 286 - - -
535+81, 57"; 1327, 3/8/21
7 128 >614 - - -
644+44, 12"; 0824, 3/9/21
6 11,200 <MDL - - -
723+00, 12"; 1415, 2/4/21
5 48,000 <MDL - - -
827+50, 6";
1605, 1/28/215 76 361 - - -
935+89, 20"; 17:00, 2/3/21
6 12,800 <MDL - - -
pH Resistivity Chloride
Sample Collection Location,
Depth1, Time, Date
Sam.No.
MORGAN CREEK HARBOR SOIL SAMPLES - LAB TESTINGProject Name: 14773 - Jon Guerry Taylor and Associates - Morgan Creek Harbor Sheet Pile Assessment
Sample Date: 1/28/21-2/4/21, 3/8/21-3/9/21
Sulfate Sulfides Redox
Moist, dark tan sand
Description
Moist, dark tan sand
Moist, dark grey sand
Large gravel
Gravel with dark brown liquid mud
Dark brown sand
Dark grey, fine sand
Dark, thick mud/clay
Dark grey, fine sand
Laboratory Temperature: Approx. 72 F
<MDL = less than method detection limit of 32 mg/L chlorides.
mg/L = milligrams per liter, equivilant to parts per million (ppm)
1. Depth = measured in inches below top of pile cap (BTP)

1 - 14 ohm-cm mg/L mg/L + or - mV
1Sta. 00+60;
17:006 29.2 - - - -
2Sta. 17+30;
12:016 32 - - - -
3Sta. 23+00;
10:336 31.6 - - - -
4Sta. 35+89;
18:096 32.4 - - - -
5Sta. 44+80;
14:586 33.2 - - - -
6Sta. 61+30;
11:006 37.2 - - - -
pH Resistivity ChlorideSam.No.
Sample Collection
Location, Time
MORGAN CREEK HARBOR WATER SAMPLES - LAB TESTINGProject Name: 14773 - Jon Guerry Taylor and Associates - Morgan Creek Harbor Sheet Pile Assessment
Sample Date: 2/3/21, 2/4/21
Sulfate Sulfides Redox
Clear water sample from harbor
Description
Clear water sample from harbor
Clear water sample from harbor
Clear water sample from harbor
Clear water sample from harbor
Clear water sample from harbor
Laboratory Temperature: Approx. 72 F
<MDL = less than method detection limit of 600 mg/L sulfates
mg/L = milligrams per liter, equivilant to parts per million (ppm)