re-envisioning chino: implementing the 2025 general...
TRANSCRIPT

Re-envisioning Chino:
Implementing the 2025 General Plan
Economic and Market Analysis
City of Chino, California | The Planning Center | June 30, 2010

Prepared For:
Prepared For:
City of Chino, California 13220 Central Avenue Chino CA 91710
Prepared By:
The Planning Center 1580 Metro Drive Costa Mesa, CA 92626 714.966.9220 | 714.966.9221 (f) www.planningcenter.com
With Funding Assistance From:
This is a project of the City of Chino with funding provided by the Southern California Association of Governments’ (SCAG) Compass Blueprint Demonstration Project Program. Compass Blueprint assists Southern California cities and other organizations in evaluating planning options and stimulating development consistent with the region’s goals.
The preparation of this report was funded in part through grants from the United States Department of Transportation (USDOT)—Federal Highway Administration and Federal Transit Administration, in accordance with the Metropolitan Planning Program, Section 104(f) of Title 23 of the U.S. Code.
The contents of this report reflect the views of the author who is responsible for the facts and accuracy of the data presented herein. The contents do not necessarily reflect the official views or policies of SCAG, USDOT or the State of California. This report does not constitute a standard, specification or regulation. SCAG shall not be responsible for the City’s future use or adaptation of the report.

Contents
EXECUTIVE SUMMARY III RETAIL MARKET DEMAND 13 For-sale Multi-family Residential Market Demand ........................ iii
Retail Market Analysis Methodology ................................................. 13 For-Rent Multi-family Residential Market Demand ....................... iii
Fundamentals of Retail Markets ...................................................... 14 Retail Market Demand .............................................................. iv Convenience, Comparison, and Experience ................................. 14 Opportunity Sites ...................................................................... v Trade Area ............................................................................. 15
Financial Feasibility of Redevelopment ........................................ v Household Spending ............................................................... 16 Recommendations .................................................................... vi Sales Efficiency ....................................................................... 16 Market Potential and Market Demand ....................................... 16
INTRODUCTION 1 Chino Overall Retail Market Demand ................................................ 16 Market Potential ..................................................................... 16 Purpose ......................................................................................... 1 Market Demand ...................................................................... 18 Project Area ................................................................................... 2
Study Area Retail Market Demand ................................................... 19 Central and Walnut Study Area .................................................. 2 Market Potential ..................................................................... 19 Riverside Drive East Corridor Study Area ..................................... 2 Existing Retail Development ..................................................... 19 Chino Avenue Corridor Study Area .............................................. 2 Market Demand ...................................................................... 21 Achieving Redevelopment ................................................................ 2
Why Excess Retail Space Matters .................................................... 22 Getting the Zoning Right .................................................................. 4 Short-Term Vacancies .............................................................. 22 Organization of the Economic Analysis .............................................. 4 Long-Term Vacancies .............................................................. 22
Retail Market Demand Analysis and Recommendations ..................... 23 RESIDENTIAL MARKET DEMAND 5 Central and Walnut Study Area ................................................. 24
Market Area ................................................................................... 5 East Riverside Drive Corridor Study Area .................................... 24 For-sale Housing Value .................................................................... 5 Chino Avenue Corridor Study Area ............................................. 24 For-sale Multi-family Housing Demand .............................................. 6 Multi-family Lease Rates .................................................................. 8 DEVELOPMENT SCENARIO FEASIBILITY ANALYSIS 25 Net Increase in Multi-family Renters .................................................. 8
Analyzing Development Feasibility ................................................... 25 Annual Multi-family market Potential .............................................. 10 What is a Development Pro Forma ............................................ 25 Multi-family Rental Market Demand ................................................ 10 Lease Rates ............................................................................ 25 Residential Market Demand: Analysis and Recommendations ........... 11 Return on Investment .............................................................. 25 For-sale Multi-family Recommendations ................................... 11 Residual Land Value ................................................................ 26 For-rent Multi-family Recommendations .................................... 12
Re-envisioning Chino: Implementing the 2025 General Plan |Economic and Market Analysis Page i

Opportunity Site 1A ....................................................................... 26 Opportunity Site 1B....................................................................... 28 Opportunity Site 2 ......................................................................... 29 Opportunity Site 3 ......................................................................... 31 Opportunity Site 4 ......................................................................... 32 Opportunity Site 5 ......................................................................... 33
IMPLICATIONS AND RECOMMENDATIONS 35
Excess Retail ................................................................................ 35 Lower Lease Rates ................................................................. 35 Disincentive to New Development ............................................ 35
Measure M ................................................................................... 36 Recommendations ........................................................................ 37
APPENDIX A. DATA TABLES A-1
List of Figures
Figure 1. New Multi-family Housing Sales (in thousands), Market Area, 2007 to 2009 ...................................................... 6
Figure 2. File-Mile Radius Trade Area and Location of Existing Shopping Centers. ...................................... 17
List of Maps
Map 1 Project Area Locations ........................................................... 3
List of Tables
Table 1. Market Demand for New Multi-family For-sale Housing, Chino CA, 2009 through 2014 ............................................................ 7
Table 2. Market Demand for Rental Multi-family Housing, Chino CA, 2009 through 2014................................................... 9
Table 3. Five-year For-sale Multi-family Recommendation .................. 12 Table 4. Five-year For-rent Multi-family Recommendations ................. 12 Table 5. Shopping Center Types ...................................................... 14 Table 6. Retail Market Potential (building sq. ft.) by Store Type,
five-mile Radius Trade Area, 2009 and 2014 ............................ 18 Table 7. Retail Building Space Market Demand (building sq. ft.),
five-mile Radius Trade Area, 2009 and 2014 ............................ 18 Table 8. Retail Market Potential (building sq. ft.) by Store Type,
Study-Area Trade Areas, 2009 and 2014 .................................. 20 Table 9. Retail Building Space Market Demand (building sq. ft.),
by Study Area, 2009 and 2014 ................................................ 21 Table 10. Site 1A: Development Program ......................................... 27 Table 11. Site 1A: Development Pro Forma Summary ....................... 27 Table 12. Site 1B: Development Program ......................................... 28 Table 13. Site 1B: Development Pro Forma Summary ....................... 29 Table 14. Site 2: Development Program ........................................... 30 Table 15. Site 2: Development Pro Forma Summary ......................... 30 Table 16. Site 3: Development Program ........................................... 31 Table 17. Site 3: Development Pro Forma Summary ......................... 32 Table 18. Site 4: Development Program ........................................... 32 Table 19. Site 4: Development Pro Forma Summary ......................... 33 Table 20. Site 5: Development Program ........................................... 33 Table 21. Site 5: Development Pro Forma Summary ......................... 34
Page ii June 30, 2010

Executive Summary
Executive Summary
Chino’s General Plan envisions mixed-use redevelopment in three areas of the city, as identified in the Plan’s future growth vision. Funded by a Southern California Association of Governments (SCAG) Compass Blueprint Demonstration grant, the Envision Chino: Implementing the 2025 General Plan project provides an understanding of what the mixed-use development could look and feel like and an assessment of the economic realities of redevelopment in the three focus areas.
This document projects market demand for residences and retail, estimate likely sales and lease values, and quantifies the feasibility of redeveloping six opportunity sites under the envisioned mixed-use development standards This SCAG-funded project has also produced a Development Scenarios Guidebook that illustrates and describes possible redevelopment of six opportunity sites. The two documents are intended to facilitate public discussion about mixed-use development in the General Plan’s future growth vision areas.
For-sale Multi-family Residential Market Demand
The report analyzes market trends in a residential trade area within a five-mile radius of the intersection of Central Avenue and Riverside Drive. The report finds a five-year market demand for 172 for-sale multi-family housing units (including single-family attached) across the three study areas:
Five-year For-sale Multi-family Residential Market Demand for the Three Focus Areas
Number of Units Unit Size Range
(sq. ft.) Sales Price Range
($)
48 600 to 1200 219,300 to 259,000
72 1200 to 2400 259,000 to 338,600
57 2400 and above 338,600 and above
The level of demand reflects one-third of Chino’s total capture of the market, based on the actual sales of new multi-family housing in the five-mile trade area and the city’s share of the demand over the past three years.
For-Rent Multi-family Residential Market Demand
Using the same data and criteria, the report finds that the market could support the development of up to 833 new for-rent multi-family housing units across the three focus areas. This finding reflects demand from the growth in the total number of rental households and the annual rate of turnover in rental households in the trade area.
Re-envisioning Chino: Implementing the 2025 General Plan | Economic and Market Analysis Page iii

Five-year For-rent Multi-family Residential Market Demand for the Three Focus Areas
Number of Units Unit Size Range
(sq. ft.) Monthly Rent Range
($)
236 1,389 to 2,083 1,073 to 1,609
178 2,083 to 2,778 1,609 to 2,145
399 2,778 and above 2,145 and above
Retail Market Demand
Report analyzes the level of regional market demand for new retail development, and then analyzes the retail demand for the trade area generally within one-half mile of the primary corridors in each focus area.
The analysis finds that the five-mile radius trade area currently has about 641,000 square feet more retail building space than consumer spending can support, even after allowing for a reasonable five percent vacancy rate. The report estimates that this is about 8.7 percent of the existing stock of retail building space. Continued population and housing growth could lower the amount of excess space to 264,000 square feet by 2014, but this will still be 3.6 percent excess on top of five percent vacancy.
Retail building space over and above the amount that can be supported by consumer spending creates structural vacancies that, over time, can lead to urban blight. The report recommends that the city address the supply imbalance, in part, through redeveloping older, less functional retail sites.
Within the city, the report finds that the Central & Walnut study area has the largest amount of excess retail building space (36.5 percent), followed by the Riverside Drive East Corridor study area (14.1 percent). The analysis suggests that Chino Avenue study area could support additional retail building space. However, residents in this area are already shopping at other locations. Providing new retail opportunities in this study area would dilute the spending support in those other locations and likely exacerbate vacancy and potential blight problems.
Excess Retail Building Space and Retail Development Opportunity (in building square feet) in the Three Focus Areas
2009 2014
Central and Walnut Study Area Supportable Retail Building Space 108,000 119,000
Existing Retail Building Space 170,200 170,200
Excess Retail Building Space (62,200) (51,200)
- Portion of Existing -36.5% -30.1%
Riverside Drive East Corridor Study Area Supportable Retail Building Space 169,890 186,490
Existing Retail Building Space 197,800 197,800
Excess Retail Building Space (27,910) (11,310)
- Portion of Existing -14.1% -5.7%
Chino Avenue Corridor Study Area Supportable Retail Building Space 119,220 130,940
Existing Retail Building Space 60,400 60,400
Retail Building Space Opportunity 58,820 70,540
- Existing Portion of Supportable 50.7% 46.1%
Page iv June 30, 2010

Re-envisioning Chino: Implementing the 2025 General Plan | Economic and Market Analysis Page v
Opportunity Sites
The project created development scenarios for six opportunity sites:
Opportunity Site 1A: Northwest Corner of Central and Walnut Avenues This development scenario explores replacing the 87,000 sq. ft. retail strip center with: 9 multi-family buildings with a total of 96 rental units; 1 mixed-use building with 4,000 sq. ft. of ground-floor retail, and one story above with 11 residential rental units; and two stand-alone retail buildings with a total of 14,319 sq. ft..
Opportunity Site 1B: Southwest Corner of Central and Walnut Avenues This development scenario explores replacing the 86,000 sq. ft. retail strip center with: 3 multi-family garden court buildings with 54 for-sale units; 2 mixed-use buildings, each with 4,000 sq. ft. of ground-floor retail, and one story above with 11 residential rental units; and one stand-alone 15,300 sq. ft. retail building.
Opportunity Site 2: North Side of riverside Drive, between Bensen and Oaks Avenues This development scenario explores replacing about 50,000 sq. ft. of existing retail buildings with: 7 motor court townhouse buildings, each with 15 for-sale townhouses; and one 13,692 sq. ft. stand-alone retail building.
Opportunity Site 3: Southwest Corner of Riverside Drive and Magnolia Avenue This development scenario explores developing this 5.3 acre site with 26 triplex buildings, for a total of 78 for-sale residences.
Opportunity Site 4: South Side of Riverside Drive, between 11th and 12th Streets This development scenario explores redeveloping the older single-family detached housing on this 1.6-acre site with 6 cottage clusters, each with 6 residential units.
Opportunity Site 5: Northwest Corner of Central Avenue and G Street This development scenario explores redeveloping this 4.8 acre light industrial/retail site with 20 industrial live-work lofts.
Financial Feasibility of Redevelopment
The report analyzes the financial feasibility of the six development scenarios. Because the first three sites have existing retail uses, the estimated market acquisition costs are relatively high. The pro forma finds that none of these sites can be redeveloped without some subsidy or incentive. Site 1A has the most challenging financial performance. Although not directly explored in this project, planning the site for greater heights and density might enable redevelopment without a subsidy. Sites 1B and 2 are less challenging, and the report identifies strategies that might allow these sites to be redeveloped with a small subsidy or none at all.
The report finds that the three non-retail sites could be redeveloped with no subsidy, provided that a developer could acquire the site at the estimated cost. The report also explores how the additional investment return provided by the development scenario might be necessary to attract a developer to not only assemble and redevelop the sites but also to initiate an election to obtain Measure M voter approval.

Financial Feasibility Summary
Recommendations:
Reflecting economic and market considerations, the report offers six specific recommendations:
1. For-sale Multi-family Housing. The city should plan for the three study areas to support the development of up to 77 for-sale multi-family housing units over the next five years. As projects are developed and the market absorbs these new units, the city should revisit the market analysis to better understand the long-term market potential of for-sale multi-family housing.
2. For-rent Multi-family Housing. The city can expect the three study areas to support the development of up to 813 for-rent multi-
family housing units over the next five years. These units could be a mix of affordable and market-rate units. As with the for-sale units, the city should revisit the market analysis to reflect absorption rates for the initial projects.
3. Excess Retail. To improve market conditions for retail development and the performance of retail businesses, the city should seek to transition 260,000 square feet of existing retail building space city wide to non retail uses. Specific to each study area, the city should plan to transition at least 51,000 to 62,000 square feet of retail building space in the Walnut & Central study area and 11,000 to 28,000 square feet in the Riverside Drive East Corridor study area to non-retail uses.
Site 1A Site 1B Site 2 Site 3 Site 4 Site 5
Estimated land cost $ 18,900,000 $ 14,500,000 $ 13,100,000 $ 4,410,000 $ 3,610,000 $ 3,670,000
Development cost 26,765,000 30,123,000 20,106,000 18,283,000 6,675,000 9,657,000
Required equity 6,900,000 7,030,000 6,090,000 7,030,000 2,370,000 2,100,000
Final sales value $31,000,000 42,900,000 23,000,000 21,700,000 7,380,000 10,600,000
IRR w/o subsidy n/a 17.8% 13.4 154% 44.8% 33.1%
Residual land value (@ 20% IRR)
$13,500,000 13,600,000 12,000,000 13,600,000 4,590,000 4,080,000
Feasibility surplus/(gap)
(5,400,000) (900,000) (1,100,000) 9,190,000 980,000 410,000
Page vi June 30, 2010

4. Mixed-Use Retail. In planning retail uses as part of mixed-use development in the three study areas, the city should focus on convenience goods and services retailers, restaurants and bars that primarily serve adjacent and nearby neighborhoods. In contrast, comparison goods retailers should be planned in more competitive locations with better access and visibility to community and regional residents.
5. Existing Shopping Center Sites. The relatively high estimated market acquisition costs of the existing shopping centers sites (1A, 1B, and 2) makes redevelopment financially infeasible without subsidy or incentive. However, by reducing the amount of excess retail building space, by providing the initial redevelopment that establishes a track record for future redevelopment projects, and by testing voter sentiment for increased residential density, these projects provide public benefits. The city will have to decide if these and other public benefits justify the necessary level of subsidy.
6. Non-Retail Sites. The pro forma analysis suggests that redevelopment of residential and industrial sites with housing could be financially feasible without subsidies. It is not clear, however, if these projects would provide a large enough return on investment to justify the risk for a developer to initiate a Measure-M election without some prior test of public sentiment.
Re-envisioning Chino: Implementing the 2025 General Plan | Economic and Market Analysis Page vii

Page viii June 30, 2010

Introduction
Introduction
PURPOSE
The City of Chino is updating its General Plan. The update includes a future growth vision for several areas where more intense development could be consistent with the city’s overall vision. These places, with healthy transportation options and a small-town feel, provide for residents’ daily needs. The vision addresses the General Plan’s overall theme of public health: mixing uses in an area makes walking and biking viable alternatives to driving for many daily activities and makes public transit a more competitive alternative for commuting. Getting people out of their cars reduces air pollution and increase physical activity.
To achieve these health benefits, however, mixed-use projects need to have housing as one component. In 1988, the voters of Chino adopted initiative Measure M. This measure requires voter approval for most zoning or general plan changes that would increase residential densities from the regulations in place in 1988 or that would allow residential uses where they were previously not permitted. Thus achieving mixed-use redevelopment in the three focus areas will require a public vote.
In 2009, the Southern California Association of Governments (SCAG) awarded the city a Compass Blueprint Demonstration grant for the Envision Chino: Implementing the 2025 General Plan project. The city
intends this project to provide an understanding of what the envisioned mixed-use development could look and feel like and to understand the economic realities of redevelopment in the focus areas.
This economic and market analysis is one part of the SCAG-funded demonstration project. The purpose of this analysis is to:
+ Project market demand for residences and retail + Estimate likely sales and lease values + Determine general redevelopment feasibility under current zoning
standards + Determine the redevelopment feasibility of six opportunity sites
under the envisioned mixed-use development standards
In addition to this economic and market analysis, the demonstration project has produced a Development Scenarios Guidebook that illustrates and describes possible redevelopment of the six opportunity sites. The project also provides an implementation tool kit with graphics, plans, and summary information that can be used to facilitate public discussion about the mixed-use development envisioned in the General Plan update.
Re-envisioning Chino: Implementing the 2025 General Plan | Economic and Market Analysis Page 1

PROJECT AREA
This economic analysis focuses on three of the areas identified in the updated General Plan’s future growth vision. Map 1 on the opposite page shows the location of the three project areas. General descriptions of each area are:
Central and Walnut Study Area
Located along Walnut and Central avenues, south of Central’s interchange with the SSR-60 freeway, this area contains several older strip shopping centers with large parking areas. The eastern part of the study area includes a post office and Chino Valley Medical Center. Adjacent to the project area’s northeast corner is a former Home Depot, which the city will repurpose for a new public safety complex. The General Plan update envisions this area transitioning to mixed-use development, with a focus on providing neighborhood-serving retail.
Riverside Drive East Corridor Study Area
Located along Riverside Drive east of Central Avenue, this area contains a variety of housing, some residential buildings that have been re-used for retail service businesses, stand-alone retail businesses, a strip retail center, and a few vacant parcels. Although there are some residential uses fronting on Riverside, the majority of the adjacent land uses are commercial. The General Plan update envisions this area transitioning to primarily multi-family housing with a limited amount of retail and office development.
Chino Avenue Corridor Study Area
This study area includes the downtown industrial area along Central Avenue, between Chino and Schaefer avenues. Immediately to the north of Chino Avenue are the civic center complex, future public uses, and the Chino Transit Center. The updated General Plan envisions this
area transitioning to higher-intensity, mixed-use development than is considered for other areas. The focus may be on transit-oriented development around transit center, potential connections to Metrolink, and additional civic uses such as a large performance space.
ACHIEVING REDEVELOPMENT
Realizing the updated General Plan’s future growth vision requires redevelopment (although there are some vacant parcels for which the term infill development is more appropriate). This topic of redevelopment, however, is much broader than just the types of projects typically undertaken by community redevelopment agencies in California. Redevelopment typically follows one of three basic approaches (although elements of all three may be present):
Public Improvements. In some redevelopment cases, existing market dynamics can support economic growth in an area, but inadequate public facilities and infrastructure or a lack of an inviting public realm depress commercial activity. In these cases, redevelopment activity most appropriately focuses resources on public improvements: infrastructure upgrades, streetscapes, parking, façade improvements, etc.
Catalyst Project. In other cases, the public has a sufficiently negative popular image of an area (especially in districts or major commercial nodes), and simply dressing the area up is inadequate. Countering negative public identity requires a relatively large development project, often accompanied by public improvements, to convince potential patrons that the area has changed and is now something new and different. In these cases, redevelopment most appropriately focuses on public-private partnerships to attract developers to redevelop prominent sites.
Page 2 June 30, 2010
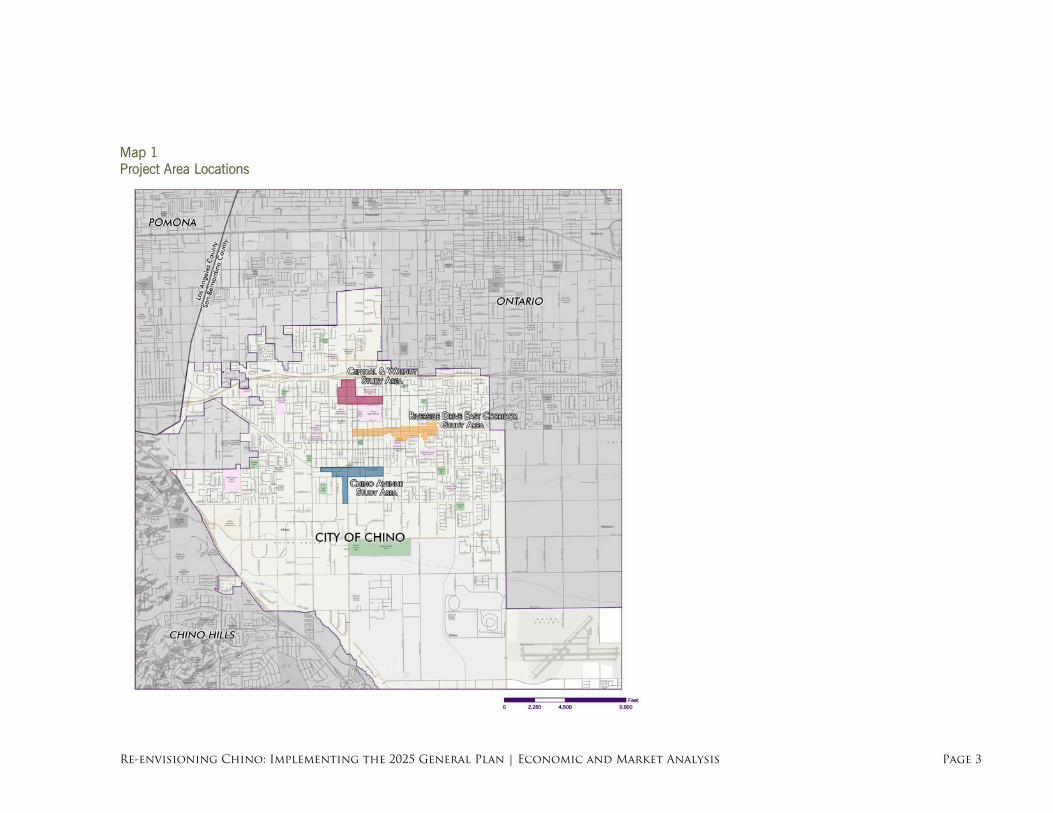
Map 1 Project Area Locations
Re-envisioning Chino: Implementing the 2025 General Plan | Economic and Market Analysis Page 3

Market-Based Redevelopment. In still other cases, an area needs redevelopment to phase out buildings and uses that no longer serve market demand. Such areas are often characterized by the onset of blight conditions – rising vacancies, lack of maintenance and reinvestment, marginal businesses and high turnover. In these areas, however, single catalyst projects are usually not sufficient on their own to turn the tide of economic stagnation and disinvestment, especially along corridors where a catalyst project’s ability to convey a changed image can extend only so far. In these cases, redevelopment most appropriately focuses on creating the market incentives necessary to entice developers to acquire and assemble property, demolish existing structures, and build new development that meets current and future market demand.
The city will mostly rely on market-based approaches to achieve the redevelopment envisioned in the updated General Plan. Rather than relying on city investments to spur private sector redevelopment, the transitions would occur over time, in response to market demand. The city’s need, and the purpose of this economic analysis, is to understand how the regulatory environment can provide those incentives. Mostly, these incentives require getting the zoning right.
GETTING THE ZONING RIGHT
Two elements determine the value of a particular property: the latent market demand for development and the intensity of development that zoning allows. Communities often times forget that they have a critical role to play in setting the value of land. Yet it is in this role of influencing land value that cities can most easily provide the incentive needed to attract development and redevelopment.
When developers approach potential projects, they add up the likely costs to develop and the likely revenues. The primary difference
between a green field site and a redevelopment site is the presence of existing buildings. When developers acquire a site they expect to pay the land value, but on a redevelopment site, they also have to pay the value of the existing buildings and then pay to demolish them. We call this “throw away money” because it is money that developers throw away. It does not add value to the final product. For redevelopment projects to be financially feasible, they must generate enough revenue to cover the throw away money as well as the land acquisition and construction costs.
This is where getting the zoning right really matters. If zoning fails to allow enough intensity to generate the revenues necessary to cover the throw away money, redevelopment fails to happen. At the same time, too much intensity can turn public opinion against redevelopment efforts.
ORGANIZATION OF THE ECONOMIC ANALYSIS
We have organized the remainder of this document into four sections.
Residential Market Demand: Quantifies the market demand for new housing by type and tenancy, with absorption rates and sales and lease rates.
Retail Market Demand: Quantifies the market demand for new building space for retail sales and services, with absorption rates and lease rates.
Existing Redevelopment Feasibility: Analyzes the feasibility of redevelopment in the three study areas under current zoning standards.
Development Scenario Feasibility: Analyzes the feasibility of redevelopment under the development standards outlined in the updated General Plan’s future growth vision.
Page 4 June 30, 2010

Residential Market Demand
Residential Market Demand
For residential uses, the economic analysis focuses on multi-family housing, which includes all attached housing products – townhouses, duplexes through quadplexes, condos, and apartments. The analysis does not address single-family detached housing because it typically does not generate enough residual land value to make redevelopment feasible and because the updated General Plan envisions the study areas as multi-family housing.
The economic analysis projects market demand for both for-sale housing and rental housing. Many multi-family housing products can be built for both, but the market demand and project revenue vary between for-sale and rental properties.
The residential-market-demand analysis uses data from a variety of sources. The US Census Bureau and the California Department of Finance provide basic demographic, economic, and housing data over time. Nielsen-Claritas, the leading national provider of market data, provides demographic, economic, and housing data for individual market areas and provides projections for the next five years. Finally, Dataquick provides information on all residential sales in the market area since 2007.
MARKET AREA
The first step in projecting market demand is to define the market area, the area that will generate and attract new households and the area in which the study areas will compete for those new households.
The potential market is defined not by the city boundaries buy by the market area from which new households might choose a place to live. Because the three study areas are located relatively close to each other, we define one common market area. We define this market area as the area within a five-mile radius of the Central Avenue and Riverside Drive intersection, roughly equal to the average work commute time of 30 minutes. Figure 2 on page 17 shows this file-mile radius market area.
FOR-SALE HOUSING VALUE
Before quantifying market demand for for-sale housing, one must first have a range of housing values because the price of housing relates to household income and thus to the number of households likely qualified to purchase new housing.
Using the Dataquick information on all multi-family new home sales since 2007, the economic analysis plotted the sales price and square footage. The data set included sales of 434 new multi-family housing units. Figure 1 below shows the data set and the best fit line.
Re-envisioning Chino: Implementing the 2025 General Plan | Economic and Market Analysis Page 5

Figure 1. New Multi-family Housing Sales (in thousands), Market Area, 2007 to 2009
Source: The Planning Center, 2010, using data housing sales data from Dataquick.
To reflect the likelihood of a slow recovery in housing prices, the sales-value model weights sales in 2009 more heavily and sales in 2007 less so. The weighted data suggest that the sales value for new multi-family housing would be $182,770 plus $86 per square foot. Using this formula, an 1,100 sq. ft. unit would likely sell for $278,000 and a 1,500 sq. ft. unit for $312,000.
With these price ranges, households with household income in the $75,000 to $99,999 range and above1 would likely qualify to buy new homes, and households with lower incomes would likely have to
1 The Census Bureau typically reports statistics on household income in ranges of less than $15,000, $15,000 – $24,999, $25,000 – $34,999, $35,000 – $49,000, $50,000 – $74,999, $75,000 – $99,999, $100,000 – $149,999, $150,000 – $249,999, and $250,000 and above.
rent. The market demand analysis for new housing therefore reflects only households with incomes above $75,000.
FOR-SALE MULTI-FAMILY HOUSING DEMAND
Table 1 on the opposite page derives the projected demand for new multi-family for-sale housing in Chino over the next five years. The analysis projects the total home sales over the next five years based on the increase in homeowner-households and purchases by existing homeowners. Home sales in the defined market area should total 29,395 through 2014.
Past trends suggest that multi-family units will account for 9.1 percent of the total sales and that new units will account for 29.3 percent of those multi-family sales. Thus the market area has the potential to absorb 784 new multi-family housing units over the next five years.
From 2007 through 2009, Chino captured 67.9 percent of the total new multi-family housing unit sales in the defined market area. Applying this capture rate in the future suggests that the market demand for new multi-family housing in Chino is 532 units through 2014.
$0
$100
$200
$300
$400
$500
$600
500 1,000 1,500 2,000 2,500
Sale
s Pr
ice
($1,
000)
Unit Size (sq. ft.)
Weighted Best-fit Line
Actual Sales
Page 6 June 30, 2010

Table 1. Market Demand for New Multi-family For-sale Housing, Chino CA, 2009 through 2014
Household Income: $75,000 - $99,999
$100,000 - $149,999
$150,000 - $249,999
Total
(1) Number of Households, 2009 15,698 15,961 9,850 41,509
(2) Number of Households, 2014 16,333 19,617 14,362 50,312
(3) 5-Year Increase in Households 635 3,656 4,512 8,803
(4) Homeownership Rate 79.2% 84.7% 82.0%
(5) 5-Year Increase in Homeowners 503 3,095 3,698 7,296
(6) Annual Turnover in Owner-Occupied Housing 11.7% 11.7% 11.7%
(7) Purchases by Existing Homeowners 7,440 8,837 5,822 22,099
(8) Total 5-Year Home Sales 7,942 11,933 9,520 29,395
(9) Multi-family as a Portion of All Homeownership 9.1% 9.1% 9.1%
(10) Total 5-Year Multi-family Home Sales 722 1,085 865 2,672
(11) New Homes as a Portion of Total Multi-family Home Sales 29.3% 29.3% 29.3%
(12) Total Market-Area 5-Year New Multi-family Home Sales 212 318 254 784
(13) Chino Capture of Regional New Multi-family Home Sales 67.9% 67.9% 67.9%
(14) Total Chino 5-Year New Multi-family Home Sales Market Demand 144 216 172 532 Source: The Planning Center, 2010, using data from the US Census Bureau, Nielsen-Claritas, and Dataquick.
Notes to Table 1:
1. The household income categories are the basic income categories reported by the US Census Bureau. The three categories used in this analysis represent The Planning Center’s assessment of households most likely to purchase and able to afford the value of housing considered in this analysis. The total column reflects the total for these three income categories only.
2. Number of households data (rows 1 and 2) are obtained from Claritas and represents the market area defined as that area within a five-mile radius of Riverside Drive and Central Avenue. The five year increase in households (row 3) is the difference between the projected number of households in 2014 (row 2) and the estimated number of households in 2009 (row 1).
Re-envisioning Chino: Implementing the 2025 General Plan | Economic and Market Analysis Page 7

Page 8 June 30, 2010
3. The homeownership-rate data (row 4) are derived from US Census Bureau data. The five-year increase in homeowners (row 5) is derived by multiplying the five-year increase in households (row 3) by the homeownership rate (row 4).
4. The annual turnover in owner-occupied housing data (row 6) are from the 2000 Census and represent those blocks for which the majority of the area is within the defined market area. Purchases by existing homeowners (row 7) are the number of households (the average of 2009 and 2014 data, rows 1 and 2), multiplied by the homeownership rate (row 4), multiplied by the annual turnover in owner-occupied housing (row 6), multiplied by 5 to get the total purchases over the five-year period from 2010 to 2014.
5. Total five-year home sales (row 8) are the sum of the five-year increase in homeowners (row 5) and the purchases by existing homeowners (row 7).
6. Multi-family as a portion of all homeownership data are Nielsen-Claritas estimates for the defined market area in 2009. Total five-year multi-family home sales (row 10) are obtained by multiplying the total five-year home sales (row 8) by multi-family’s share of all homeownership (row 9).
7. New multi-family homes as a portion of total multi-family home sales data (row 11) are derived from Dataquick information reflecting sales in the defined market area from 2007 through 2009. Total market area five-year new multi-family home sales (row 12) are derived by multiplying the total five-year multi-family home sales (row 10) by the portion of those sales that are for new homes (row 11).
8. Chino capture of regional new multi-family home sales (row 13) is derived from Dataquick information reflecting sales in the defined market area from 2007 through 2009. Total Chino 5-year new multi-family home sales market demand (row 13) is derived by multiplying the regional five-year new multi-family home sales (row 12) by Chino’s capture rate (row 12).
MULTI-FAMILY LEASE RATES
As with for-sale properties, multi-family rental market demand must be based on the set of households that can afford to rent new multi-family units. The economic analysis surveyed rental housing providers and public databases to determine the likely market-rate rents. The analysis assumes that rents for new units would fall at the 75th percentile of existing rents, which includes both new and old buildings.
The projected rental rates run from $1.60 per square foot for studios down to $1.16 per square foot for four-bedroom units. With the average size rental units, these rental rates would require a household income in the $50,000 to $74,999 range, or higher, to be affordable.
NET INCREASE IN MULTI-FAMILY RENTERS
Calculation of market demand for rental housing is different than that for for-sale housing demand. The first part of the market demand equation is the net increase in multi-family rental households.
Using a methodology similar to that used with for-sale housing, Table 2 on the opposite page shows that the trade area should generate 8,823 new households over the next five years (using four income categories instead of three). Of these, 1,513 would be renter households, and of the renters, 989 would likely locate in multi-family housing. Thus, the market area has a net demand of 989 multi-family units through 2014.

Table 2. Market Demand for Rental Multi-family Housing, Chino CA, 2009 through 2014
Household Income: $50,000 - $74,999
$75,000 - $99,999
$100,000 - $149,999
$150,000 - $249,999
Total
(1) Number of Households, 2009 21,977 15,698 15,961 9,850 63,486
(2) Number of Households, 2014 21,997 16,333 19,617 14,362 72,309
(3) 5-Year Increase in Households 20 635 3,656 4,512 8,823
(4) Rentership Rate 32.0% 20.8% 15.3% 18.0%
(5) 5-Year Increase in Renter Households 6 132 561 814 1,513
(6) Multi-family as a Portion of All Rentals 65.4% 65.4% 65.4% 65.4%
(7) 5-Year Market-Area Demand for New Multi-family Rentals 4 86 367 532 989 (8) Annual Turnover in Renter Occupied Housing 36.5% 36.5% 36.5% 36.5%
(9) Annual Turnover of Existing Renters 8,015 5,838 6,485 4,413 24,751
(10) Annual Market-Area Renter Potential 8,016 5,864 6,597 4,576 25,053 (11) Multi-family units as a Portion of All Rentals 65.4% 65.4% 65.4% 65.4%
(12) Annual Market-Area Multi-family Renter Potential 5,243 3,836 4,315 2,993 16,387
(13) Chino Share of Market-Area Multi-family Rental Units 8.9% 8.9% 8.9% 8.9%
(14) Chino Annual Multi-family Renter Potential 468 343 385 267 1,463 Source: The Planning Center, 2010, using data from the US Census Bureau and Nielsen-Claritas.
Notes to Table 2:
1. The household income categories are the basic income categories reported by the US Census Bureau. The four categories used in this analysis represent The Planning Center’s assessment of households most likely able to afford the rent of housing considered in this analysis. The total column reflects the total for these four income categories only.
2. Number of households data (rows 1 and 2) are obtained from Nielsen-Claritas and represents the market area defined as that area within a five-mile radius of Riverside Drive and Central Avenue. The five-year increase in households (row 3) is the difference between the projected number of households in 2014 (row 2) and the estimated number of households in 2009 (row 1).
Re-envisioning Chino: Implementing the 2025 General Plan | Economic and Market Analysis Page 9

Page 10 June 30, 2010
3. The rentership-rate data (row 4) reflect the portion of renters among the households in each income and are derived from US Census Bureau data. The five-year increase in renter households (row 5) is derived by multiplying the five-year increase in households (row 3) by the renter rate (row 4).
4. Multi-family as a portion of all rentals (row 6) represents multi-family dwellings’ share of all occupied housing units in the market area, based on data from the US Census Bureau.
5. The five-year market area demand for new multi-family rentals (row 7) represents the net demand for new multi-family units. The data are derived by multiplying the five-year increase in renter households (row 5) by multi-family housing’s share of total housing units (row 6).
6. The annual turnover in renter-occupied housing (row 8) is derived from US Census Bureau data. The annual turnover of existing renters (row 9) represents the typical number of renters who move to a different rental unit each year. The annual turnover of existing renters data are the number of households (average of the 2009 and 2014 data, rows 1 and 2) multiplied by the rentership rate (row 4), multiplied by the annual turnover in renter-occupied housing (row 8).
7. The annual market-area renter potential (row 10) is the expected number of renters available to move into existing and new rental housing in each year. The data are the sum of one-fifth of the five-year increase in renter households (row 5) and the annual turnover of existing renters (row 9).
8. Multi-family units as a portion of all rentals (row 11) is derived from US Census Bureau data. Annual market-area multi-family renter potential (row 12) is the number of renters available to rent new and existing multi-family rental units in the market area. The annual market-area multi-family renter potential data are obtained by multiplying the annual market-area renter potential (row 10) by multi-family’s share of all rental units (row 11).
9. Chino’s share of market-area multi-family rental units data (row 13) are derived from US Census Bureau data. Chino’s annual multi-family rental potential (row 14) is the expected number of renters available to move into new and existing multi-family rental units in Chino each year.
ANNUAL MULTI-FAMILY MARKET POTENTIAL
In addition to the net new demand, however, multi-family developers are also interested the annual turnover of renters. Each turnover represents an opportunity to capture a new resident for a multi-family housing project. The second half of Table 2 calculates the annual multi-family market potential as the sum of the increase in new renter households plus the annual turnover in rental households. The analysis estimates that Chino has the potential to capture up to 1,463 renters per year.
MULTI-FAMILY RENTAL MARKET DEMAND
The actual market demand to support construction of new multi-family rental housing lies between the net increase in multi-family renter households and the market potential from the annual turnover in multi-family renters. This analysis conservatively estimates the market demand for new multi-family residential construction at 10 percent of the market potential, or about 146 units per year. In other words, if new multi-family residential housing were constructed in Chino, these units could likely capture 146 new rental households each year from the regional growth.

RESIDENTIAL MARKET DEMAND:
ANALYSIS AND RECOMMENDATIONS
The preceding analysis shows that, even under the current challenging economic and market conditions, there is market demand for new for-sale and rental multi-family housing.
Success at The Preserve shows that there is a market for more dense housing types. New for-sale housing in the study areas will require competitive pricing to successfully compete with new units at The Preserve. The market demand analysis assumes about a 10 percent lower price per square foot than that at The Preserve. Also, with few community amenities, the homeowners’ dues for new housing projects in the three focus areas would be substantially lower. Nonetheless, these projects would likely need similar levels of architectural, urban design, and landscaping quality to attract buyers at the assumed price points.
Development in Chino has little track record for multi-family rental housing. However, multi-family development in the five-mile radius market area shows that there is regional demand for this type of housing.
Communities throughout Southern California experienced large-scale apartment construction in the 1970s and 1980s, driven by demand from baby boomers moving out on their own for the first time. Subsequently, however, many communities experienced the negative consequences of the slow deterioration of apartments as the demand leveled off over the last two decades. This has led to a generally negative public perception of multi-family housing.
Over the next 10 years at least, Southern California will once again see rising demand for multi-family housing, both for-sale and for-rent, as the millennial generation moves out on their own and as a portion of the baby boom generation seeks to downsize their housing during
retirement. Indeed, over the next 10 years, only 7 percent of California’s population growth will be in the age ranges of family housing. While most communities are planning housing for only that 7 percent of the population growth, the market for the other 93 percent will necessitate new multi-family housing construction.
The challenge for Chino, as for most municipalities, is how to accommodate the city’s fair share of multi-family housing demand in a manner that can best minimize the potential for negative consequences over time. This is primarily accomplished through allowing multi-family projects that are large enough to either generate sufficient homeowners association dues to maintain and reinvest (for-sale projects) or large enough to support on-site management (for-rent projects). While there are no hard and fast rules, somewhere between 50 and 100 units is typically the minimum necessary.
Another way to minimize the negative potential is to require higher quality architecture, urban design, and landscaping. Once again, larger projects can more easily provide quality development. Cheaply built projects are harder to maintain over time and invite cheap management. Active code enforcement on the city’s part will also help assure that multi-family projects are not allowed to deteriorate.
For-sale Multi-family Recommendations
Table 1 calculated the demand for new for-sale multi-family housing in Chino. This demand reflects all of Chino, and new development in the three study areas would not likely capture all of this demand. Indeed, it is reasonable to expect currently developing master-planned communities to capture a majority of this demand. Over time, however, the study areas will likely increase their capture of this housing market as new projects demonstrate the quality of housing that can be developed in these areas and as these projects create a track record that will attract more development interest.
Re-envisioning Chino: Implementing the 2025 General Plan | Economic and Market Analysis Page 11

Page 12 June 30, 2010
For planning purposes, the analysis recommends that over the next five years, the city plan for the focus areas to capture one-third of the demand for new for-sale multi-family housing. Table 3 summarizes this recommendation.
Table 3. Five-year For-sale Multi-family Recommendation
Number of Units Unit Size Range
(sq. ft.) Sales Price Range
($)
48 600 to 1200 219,300 to 259,000
72 1200 to 2400 259,000 to 338,600
57 2400 and above 338,600 and above Source: The Planning Center 2010.
Five years down the road, the city might plan for that capture rate to increase to 50 percent or more. However, the city should revisit the market demand after one or two projects are developed and sold.
For-rent Multi-family Recommendations
Unlike the for-sale market, there are no other new market rate multi-family rental housing projects in Chino that would compete with redevelopment projects in the study areas. The real unknown is what portion of the market area’s annual turnover in rental households would new developments in the study areas likely capture. The city boundary encompasses about 27 percent of the five-mile radius market area, even though it provides only about 8.9 percent of the multi-family rental units.
As a conservative approach, the analysis suggest that the city should plan to capture 8.9 percent of the increase in multi-family rental households, and, of the 8.9 percent of the annual turnover in market-
area rental households, the city should plan to capture about 10 percent. Table 4 summarizes this recommendation.
Table 4. Five-year For-rent Multi-family Recommendations
Number of Units Unit Size Range
(sq. ft.) Monthly Rent Range
($)
236 1,389 to 2,083 1,073 to 1,609
178 2,083 to 2,778 1,609 to 2,145
399 2,778 and above 2,145 and above Source: The Planning Center, 2010.
As with the for-sale recommendations, Table 4 data are a starting point for planning purposes over the next five years. As projects are developed and leased-up, the city should revisit these recommendations.

Retail Market Demand
Retail Market Demand
The amount of consumer spending in a trade area determines how much retail building space can be supported. The term “market potential” refers to the supportable amount of retail building space. Market demand is the difference between the market potential and the amount of existing retail building space. This section of the economic analysis quantifies the market potential and estimates the amount of existing building space for the Chino area in general, and more specifically applied to each of the three focus area. Unlike residential market demand, the demand for retail space is highly location specific and moving a half-mile away can change the level of demand.
This chapter of the economic analysis begins with a brief description of the methodology and an overview of the fundamentals of retail market demand. Subsequent sections then calculate current and future market demand for retail development.
RETAIL MARKET ANALYSIS METHODOLOGY
Four steps make up the basic retail market analysis methodology.
1. Define the Trade Area In general terms, the trade area is the geographic area from which the retail center will draw most of its customers. Several factors affect the size and boundaries of the trade area, including the type of shopping
center, location of competitive retail facilities, and visibility and access to major roads and highways.
Calculate Market Potential The market potential represents the total amount of retail building space that spending by trade-area residents can support. We estimate the total trade area spending by type of store (e.g., pharmacy, women’s clothing). We then divide the spending by the average sales per square foot—by store type—thus calculating the gross square footage of supportable retail building space.
Identify Competitive Facilities Competitive facilities are the trade area’s existing and planned retail centers that offer a similar scale of goods. Once again, we express the amount of competition in terms of gross square footage of retail building space.
Determine Market Demand Subtracting the square footage of competitive retail facilities from the total square footage of retail space that trade area spending can support determines the market demand. Market demand represents the additional retail building space that the market can support without generating new vacancies. We determine present market demand and then project demand for each year in which the proposed project plans to construct new retail building space.
Re-envisioning Chino: Implementing the 2025 General Plan | Economic and Market Analysis Page 13

FUNDAMENTALS OF RETAIL MARKETS
Convenience, Comparison, and Experience
An easy way to understand retail markets is to categorize retail into two groups based on the type of goods or service, the need for which instigates the shopping trip. These groups include convenience goods and services, and comparison goods. Table 5 describes the types of shopping centers that typically serve these two groups.
Generally, the goods and services that most people need on a regular basis (convenience goods and services) are close to where people live. For these regular purchases, most consumers have built up knowledge of where to go to get what they want, whether their discriminator is price and convenience or quality. Groceries, medicines, fast food restaurants, and hair care are typical convenience goods and services. Because convenience goods and services usually have low cost margins and high sales volumes, convenience retailers are located throughout an area, close to concentrations of households. These businesses typically locate in convenience centers and neighborhood shopping centers.
Consumers tend to compare goods across brands and across retailers for items they purchase infrequently or rarely. This habit of comparing induces retailers to locate near each other. It also promotes larger-scale retailers who can stock many different brands of similar products. Clothing, electronics, and furniture are quintessential comparison goods. Full-service restaurants, which consumers patronize infrequently, also fall into this group. Because comparison goods have higher cost margins and lower sales volumes, and because consumers purchase these goods infrequently, comparison goods retailers tend to locate close to major transportation corridors that give access to a greater number of consumers. These businesses typically locate in community, regional, and super-regional shopping centers.
Table 5. Shopping Center Types
Shopping Center Type
Building-Size Range (sq. ft.)
Trade Area
Size (radius in
miles) Population Range
Convenience < 30,000 ½ < 5,000
Neighborhood 30,000–100,000
1½ 3,000–40,000
Community 100,000–450,000 3–5
40,000–150,000
Regional 300,000–900,000 8 150,000 or more
Super-regional 500,000–2
million 12 300,000 or more
Source: Beyard, Michael D. et al., Shopping Center Development Handbook, 3rd ed., Washington D.C.: Urban Land Institute, 1999.
With both of these types of retail, quick easy access, a knowledge of individual retailers and their locations (formed through advertising, signage, and visibility during regular travels), and previous experience can influence where consumers shop. In communities where the automobile is the dominant mode of transportation, retailers respond by locating near and seeking visibility to auto traffic.
A third, hybrid type of retail is experiential shopping. In this type of shopping, the experience of the trip is of equal if not greater importance than the material need for a good or service. The
Page 14 June 30, 2010

experiential value may accrue from socialization with friends, from entertainment, or from the quality of the place. Downtowns, new town centers, lifestyle centers, and even shopping malls all attempt to enhance the shopping experience and provide a mix of businesses and amenities to create an enjoyable shopping experience. Because most consumers infrequently invest their time in experiential shopping, most are willing to travel further and forego quick and easy access for the value of the experience. Experiential shopping is a destination trip, and draws from a community, regional, or even super-regional size trade area, even if it does not offer the commiserate amount of retail square footage.
Focus Area Retail Types Generally, when planning corridors and small districts, communities should focus on serving local needs and capturing that local spending on convenience goods and services. Most of the commercial uses envisioned for the redevelopment of the three focus areas will provide convenience goods and services for the adjacent and nearby neighborhoods.
In contrast, nodes at the intersection of major transportation routes are more likely to attract businesses providing comparison goods. Such nodes make good locations because they provide a heavy traffic volume and proximity to a larger trade area. The shopping centers at Walnut and Central filled this role when originally developed. As other centers opened, including Chino Town Square and Chino Spectrum, the Walnut and Central shopping centers became less competitive in attracting comparison goods retailers. One objective of this economic analysis is to determine if there is sufficient market support for community-scale shopping centers at this location.
Finally, experiential shopping on corridors often occurs in the traditional downtown or Main Street setting. The portions of the Chino Avenue Corridor study area within walking distance of the civic center
could be well-positioned to play a greater experiential shopping role in conjunction with the public uses envisioned in the Civic Center Specific Plan. When planning such areas, communities and developers should place a high emphasis on the consumer experience, remembering that experiential shopping includes not only time spent in stores and in the district, but the trip to the district and how they get around once there.
Experiential shopping also has applicability to all levels of retail in any of the focus areas. Even minor sites, where the emphasis is convenience goods and services for the local neighborhoods, should provide a positive consumer experience. And even though past convenience retail has been very auto-focused (equating easy-in/easy-out sites and plentiful parking with a positive consumer experience), livable corridors should consider how non-vehicular access to the corridor can contribute to an equal if not superior experience for local residents while still providing convenience.
Trade Area
A trade area is the geographic area from which a retail center will draw the majority of its customers. Sophisticated market-analysis models for individual retailers often define primary, secondary, and even tertiary trade areas. It is generally sufficient, however, for overall retail analyses to define a single primary trade area.
Several factors affect the size and boundaries of the trade area, including the type of shopping center, location of competitive retail facilities, physical barriers, and visibility and access to major roads and highways. The radial definition of a trade area based on its scale (Table 5) provides the starting point for defining a trade area. As the Urban Land Institute cautions, however, “A trade area does not lend itself to concentric circles around a potential site.”
Re-envisioning Chino: Implementing the 2025 General Plan | Economic and Market Analysis Page 15

Page 16 June 30, 2010
This analysis first considers the overall retail market demand for the regional trade area, defined as a five-mile radius from the intersection of Riverside Drive and Central Avenue. The analysis the projects the retail market demand for a trade area defined as the area within one-half mile of the primary corridor(s) of each study area. Table A-3 in the Appendix provides detailed demographic estimates for each trade area. Figure 2 on the following page shows the five-mile radius trade area and the location of shopping centers. Table A-4 in the appendix identifies the shopping centers in this trade area.
Household Spending
The household is the basic economic unit at the center of retail analysis. The US Bureau of Labor Statistics publishes an annual report, the Consumer Expenditure Survey, detailing how Americans spend their annual income. Nielsen-Claritas, the preeminent marketing data firm, interprets that data for individual locations, based on the demographics and lifestyle characteristics of the households residing in that area. Nielsen-Claritas reports the data both for types of goods and services (e.g., bakery goods, household repairs, and reading materials) and for types of stores (e.g., grocery stores, men’s clothing stores, and full-service restaurants) using standard retail business categories from the North American Industrial Classification System. Table A-5 provides data for the average annual household expenditures for trade-area households by type of product or service.
Sales Efficiency
Sales efficiency is the average annual sales per square foot of retail businesses. Sales efficiency varies by store type, by individual business, and among different locations of an individual retail chain. Every two years the Urban Land Institute and the International Council of Shopping Centers conduct a survey of retail locations throughout the country. From that survey, they publish average sales efficiency data
by type of store in Dollars and Cents of Shopping Centers / The SCORE. The current edition was published for 2008. This analysis adjusts those national figures for the Inland Empire metropolitan area using data from the US Census Bureau’s Economic Census.
Market Potential and Market Demand
Dividing total spending by average sales efficiency determines the market potential—the total amount of retail building space that can be supported. For example, households in the region spend about $565,200,000 per year at grocery stores and supermarkets. Dividing that by the average sales efficiency for this type of store, $485.75 per square foot per year, indicates that the five-mile trade area can support about 825,900 square feet of supermarkets. Market demand is the difference between the market potential and the amount of existing building space used for those types of stores.
CHINO OVERALL RETAIL MARKET DEMAND
To assess retail in Chino generally, the analysis quantifies the market demand in the trade area within 5 miles of Riverside Drive and Central Avenue. This trade area extends beyond the city boundaries in order to account for the competitive retail centers that compete for retail spending by Chino households.
Market Potential
Table 6 estimates the total amount of building space that can be supported by the spending of trade-area households, listed by major store type. Table A-6 in the appendix provides more detailed data. These estimates suggest that spending by households living within 5 miles of Riverside Drive and Central Avenue should currently support about 6,402,190 square feet of retail building space.

Figure 2. File-Mile Radius Trade Area and Location of Existing Shopping Centers.
Source: The Planning Center, 2009, using data from Nielsen-Claritas, Inc., and field inspections.
Re-envisioning Chino: Implementing the 2025 General Plan | Economic and Market Analysis Page 17

Table 6. Retail Market Potential (building sq. ft.) by Store Type, Five-Mile Radius Trade Area, 2009 and 2014
2009 2014 Local/Neighborhood Retail
Food and Beverage Stores - Supermarkets, Grocery 743,400 785,100 - Convenience Stores 48,470 51,190 - Specialty Food Stores 61,230 64,660 - Beer, Wine and Liquor Stores 58,060 61,310 Health and Personal Care Stores 510,300 538,900 Gasoline Stations 367,600 388,300 Miscellaneous Store Retailers 350,000 369,700 Personal care services facilities 66,870 70,620 Drycleaning & laundry service facilities 10,030 10,590 Other personal services 13,050 13,780
Subtotal 2,229,010 2,354,150 Community/Regional Retail Furniture and Home Furnishings Stores 302,800 319,800 Electronics and Appliance Stores 193,200 204,000 Building Material, Garden Equip Stores 558,600 590,000 Clothing and Clothing Accessories Stores 632,400 667,900 Sporting Goods, Hobby, Book, Music 274,700 290,100 General Merchandise Stores 1,208,000 1,275,000
Subtotal 3,169,700 3,346,800 Restaurants and Bars
Full-Service Restaurants 407,000 429,800 Limited-Service Eating Places 511,100 539,800 Drinking Places -Alcoholic Beverages 85,380 90,170
Subtotal 1,003,480 1,059,770 TOTAL 6,402,190 6,760,720
Source: The Planning Center, 2010, using data from Neilsen-Claritas, Inc., and the Urban Land Institute.
Market Demand
With a current market potential of 6.4 million square feet, and assuming a reasonable vacancy rate of five percent, the five-mile radius trade area can support about 6.7 million square feet of retail building space.
Based on a review of assessing data, field inspections, and third party data source, the analysis estimates that the five-mile radius trade area currently has about 7,363,000 square feet of existing retail building space.
Applying these data, Table 7 calculates the market demand for this trade area.
Table 7. Retail Building Space Market Demand (building sq. ft.), Five-Mile Radius Trade Area, 2009 and 2014
2009 2014
Retail Building Space Market Potential 6,402,190 6,760,720 Vacancy Allowance @ 5% 320,100 338,000 Supportable Retail Building Space 6,722,290 7,098,720 Existing Retail Building Space 7,363,000 7,363,000 Excess Retail Building Space (640,710) (264,280) - Portion of Existing -8.7% -3.6%
Source: The Planning Center, 2010.
The analysis estimates that the five-mile radius trade area currently has about 640,710 square feet of excess retail building space, or 8.7 of the total existing retail. With projected household growth over the next four years, however, the excess retail building space would decline to 264,280 square feet, or 3.6 percent of the total.
Re-envisioning Chino: Implementing the 2025 General Plan | Economic and Market Analysis Page 18

Re-envisioning Chino: Implementing the 2025 General Plan | Economic and Market Analysis Page 19
STUDY AREA RETAIL MARKET DEMAND
To assess the demand for more or less retail building space in each study area, the analysis uses a primary trade area defined as the area within one-half mile of the main corridor in each study area. For the Central and Walnut study area, the analysis truncates the trade area at the CA-60 freeway to separate the trade area for Chino Town Square, Chino Promenade, and the other shopping centers on the north side of the freeway. This truncated boundary also represents the proclivity that most residents on the north side of the freeway would have to not cross over the freeway, especially for convenience goods and services. The trade area for Central and Walnut is also truncated to the south to represent competition along Riverside Avenue, but it extends eastward and westward along Walnut an extra half-mile to account for the lack of convenience goods and services competition for households in these areas. Based on past experience and knowledge of retail markets, this trade area would likely generate the majority of the retail sales occurring in each focus area.
Market Potential
Calculating the market potential in each study area follows the same methodology used to assess overall retail demand in Chino. However, for these study areas, which are not envisioned as community- or regional-scale retail destinations, the analysis assumes that the market area will capture 90 percent of trade area household spending for convenience goods and services, but only 11.5 percent of spending on comparison goods, and 35 percent of spending on restaurants and bars.
Table 8 estimates the supportable amount of retail building space in each trade and projects the supportable amount based on households growth through 2014. The analysis suggests that the Central and Walnut study area should have about 129,000 square feet of retail
building space, although household growth could increase the supportable amount of building space to 141,000 by 2014. The Riverside Drive East Corridor study area can currently support about 202,000 square feet, with household growth increasing that to 222,000 by 2014. Finally, the Chino Avenue Corridor study area can currently support about 142,000 square feet of retail, increasing to 156,000 by 2014.
Existing Retail Development
The analysis used data from the San Bernardino County assessor and information from field inspections to calculate the amount of existing retail building space in each study area.
The trade area defined for the Central and Walnut study area currently has about 170,200 square feet of existing retail building space. This does not, however, include the retail square footage located in the shopping centers on the north side of the CA-60 freeway. The East Riverside Drive Corridor study area has about 197,700 square feet of retail building space. Finally, the Chino Avenue Corridor study area has about 60,400 square feet of retail building space.
The inventory of existing retail building space does not include buildings that are used primarily for office-based businesses and buildings used for auto sales and services.

Table 8. Retail Market Potential (building sq. ft.) by Store Type, Study-Area Trade Areas, 2009 and 2014
Central and Walnut Study
Area Riverside Drive East Corridor Study Area
Chino Avenue Corridor Study Area
2009 2014 2009 2014 2009 2014
Local/Neighborhood Retail Food and Beverage Stores
- Supermarkets, Grocery (Ex Conv) Stores 29,900 32,900 47,200 51,800 33,200 36,500 - Convenience Stores 1,980 2,190 3,090 3,390 2,150 2,360 - Specialty Food Stores 2,460 2,710 3,880 4,260 2,740 3,010 - Beer, Wine and Liquor Stores 2,360 2,600 3,670 4,030 2,570 2,830 Health and Personal Care Stores 20,500 22,600 32,600 35,800 22,600 24,800 Gasoline Stations 15,000 16,500 23,200 25,400 16,100 17,700 Miscellaneous Store Retailers 13,500 14,800 21,200 23,200 14,800 16,300 Personal care services facilities 2,850 3,140 4,310 4,730 2,960 3,250 Drycleaning & laundrey service facilities 430 470 650 710 440 490 Other personal services 560 610 840 920 580 640
Subtotal 89,540 98,520 140,640 154,240 98,140 107,880 Community/Regional Retail Furniture and Home Furnishings Stores 1,880 2,070 3,050 3,350 2,170 2,380 Electronics and Appliance Stores 1,260 1,390 2,010 2,210 1,440 1,580 Building Material, Garden Equip Stores 3,500 3,850 5,700 6,250 3,790 4,170 Clothing and Clothing Accessories Stores 4,070 4,480 6,600 7,240 4,860 5,340 Sporting Goods, Hobby, Book, Music Stores 1,740 1,910 2,800 3,070 2,040 2,240 General Merchandise Stores 8,000 8,800 12,800 14,000 9,140 10,000
Subtotal 20,450 22,500 32,960 36,120 23,440 25,710 Restaurants and Bars
Full-Service Restaurants 7,540 8,310 11,600 12,800 8,210 9,030 Limited-Service Eating Places 9,560 10,500 14,700 16,200 10,400 11,400 Drinking Places -Alcoholic Beverages 1,530 1,680 2,360 2,590 1,690 1,850
Subtotal 18,630 20,490 28,660 31,590 20,300 22,280 TOTAL 128,620 141,510 202,260 221,950 141,880 155,870
Source: The Planning Center, 2010.
Re-envisioning Chino: Implementing the 2025 General Plan | Economic and Market Analysis Page 20

Market Demand
Table 9 calculates the market demand for retail building space in each study area. The Walnut and Central study area is the most over-retailed of the three, both in total square footage and as a percentage of the existing retail building space. The analysis suggests that converting and redeveloping existing retail buildings in this study area could reduce vacancy and downward price pressure on retail rents without necessarily affecting the total amount of retail sales. In other words, there would still be sufficient space to accommodate businesses serving the needs of trade area residents.
The Riverside Drive East Corridor study area also has an excess amount of retail building space. However, the excess is not as severe as that in the Central and Walnut area.
In contrast, spending by households residing in the Chino Avenue study area could support additional retail development. This finding, however, must be understood in the context of the overall excess retail building space in the five-mile radius trade area. Residents in this area are spending their disposable income in other areas of the city, and channeling this spending to new businesses in the Chino Avenue area would take spending from other areas. For example, it is likely that some of this spending is supporting businesses along Central Avenue, along Riverside Drive, and perhaps even in the Central and Walnut area.
Table 9. Retail Building Space Market Demand (building sq. ft.), by Study Area, 2009 and 2014
2009 2014 Central and Walnut Study Area Retail Building Space Market Potential 102,900 113,300 Vacancy Allowance @ 5% 5,100 5,700 Supportable Retail Building Space 108,000 119,000 Existing Retail Building Space 170,200 170,200 Excess Retail Building Space (62,200) (51,200) - Portion of Existing -36.5% -30.1% Riverside Drive East Corridor Study Area Retail Building Space Market Potential 161,790 177,590 Vacancy Allowance @ 5% 8,100 8,900 Supportable Retail Building Space 169,890 186,490 Existing Retail Building Space 197,800 197,800 Excess Retail Building Space (27,910) (11,310) - Portion of Existing -14.1% -5.7% Chino Avenue Corridor Study Area Retail Building Space Market Potential 113,520 124,740 Vacancy Allowance @ 5% 5,700 6,200 Supportable Retail Building Space 119,220 130,940 Existing Retail Building Space 60,400 60,400 Retail Building Space Opportunity 58,820 70,540 - Existing Portion of Supportable 50.7% 46.1%
Re-envisioning Chino: Implementing the 2025 General Plan | Economic and Market Analysis Page 21

WHY EXCESS RETAIL SPACE MATTERS
Excess retail building space leads to vacancies. With the onset of the recession, retail vacancy rates in the Inland Empire have been increasing since late 2007. According to market reports from CB Richard Ellis, by the first quarter of 2010, retail vacancies have climbed to 11.6 percent throughout the region, although San Bernardino County’s West End recorded an average 7.5 percent retail vacancy rate.
Business closings and bankruptcies among some national big-box chains have contributed to the rising vacancy rate. Many vacancies result from these and other businesses that had too much debt. With high debt service requirements, they were unable to cope with declines in consumer spending. In other cases, retailers were unable to secure financing to roll over existing debt, forcing them into bankruptcy.
Both national personal consumption expenditures and per capita disposable income have risen since the second quarter of 2009. As this trend continues with economic recovery, there will be less pressure on retailers that have managed to cut cost and survive the recession. A recent Fitch Ratings report indicates that improved liquidity across the retail sector will slow bankruptcies in 2010.
One can distinguish between two general types of retail vacancies: short-term vacancies and long-term structural vacancies.
Short-Term Vacancies
Short-term vacancies occur as individual retail businesses relocate, close branches, or fail. These cases, all part of the normal life-cycle of businesses and the normal business cycle, leave store spaces vacant. The owner of that vacant space has a financial incentive to find a new retail tenant.
During a recession, finding a new tenant is more difficult and may take longer, and different property owners can be more or less skilled in leasing retail space. Some owners will lower asking rents in order to fill vacancies quickly. Some owners will take risks on start-up businesses in order to fill vacancies. Still other owners will suffer the decrease in income for a longer period in order to lease to credit-worthy tenants that compliment the mix of businesses in their shopping centers. Finally, some owners re-invest in their centers, improving facades, parking, lighting, visibility, and signage to make their properties more competitive in attracting those businesses looking for a new location.
Regardless of individual property owner approaches to vacancies, when consumer spending in a trade area is sufficient to support the amount of retail building space in that trade area it is usually a matter of time to fill vacancies. Because short-term vacancies are a part of the normal retail business cycle – there are short-term vacancies in the best of times and worst of times – these vacancies do not constitute the long-term structural vacancies with the potential to lead to urban blight.
Long-Term Vacancies
When consumer spending in a trade area is insufficient to support the amount of retail building space in that trade area, long-term vacancies occur. Put simply, there just is not enough spending to support businesses to fill all of the space. In these circumstances, retail space can stay vacant for long periods and potentially lead to urban blight.
There are four basic options to deal with long-term structural vacancies. The first option is the do-little-to-nothing option. As with short-term vacancies, property owners have a financial incentive to find tenants for their vacant building space. The low level of consumer spending, however, makes finding new tenants difficult. Owners will often find that re-investing in their centers does not make sense because they cannot pass that cost on through rents to new tenants.
Page 22 June 30, 2010

Most owners are forced to lower asking rents, but this can lead to a downward spiral in the trade area, forcing other owners to also lower asking rents just to maintain their current tenants. The area-wide lowering of lease rates leads to lower operating income for property owners, which in turn usually leads to deferred maintenance and lack of re-investment. In time, this downward spiral will leave some property owners will little choice other than disinvestment, walking away from their properties and leaving vacant building shells.
Second is the repositioning option. Property owners with larger shopping centers strategically located near major transportation routes can seek to reposition their center to become more of a destination that will attract consumers from a larger trade area. Most successful downtown revitalizations in the US have taken this track. Because population centers have moved farther and farther from older developed areas of communities and because convenience goods and services retailers have moved to shopping centers close to new housing, populations in many older areas shrank and were unable to support the retail building space originally constructed to serve most city residents. Classic downtowns and older suburbs are examples of this urban development pattern. Major downtowns that have revitalized have transitioned to provide cultural attractions, entertainment, and experiential shopping rather than directly competing for consumer spending driven primarily by convenience and the need to immediately satisfy a material need.
The third option is to redevelop some excess retail building space into housing. Phasing out excess retail reduces the competition for retail businesses to a healthy and more sustainable level. New housing adds new spending to provide additional support for retail businesses. Many successful downtowns and older suburbs have used this approach along with repositioning. This approach is also gaining popularity for revitalization of aging commercial corridors.
The fourth option is to repurpose retail buildings for non-retail uses. Formerly vibrant regional shopping centers, now host a variety of non-retail uses including governmental agencies, education providers, and other services, in addition to some remaining retailers. One visible sign of a distressed retail environment is a preponderance of services and other non-retail businesses in commercial strip centers. While one can debate the overall community impact of repurposing, leasing or selling excess retail space can be an effective means to avoid the physical impact of urban blight.
Repositioning, redevelopment, and repurposing are all viable reactions to long-term structural retail vacancies that avoid the physical impact of urban decay. Absent a public commitment, however, an individual property owner in a trade area that suffers from excess retail building space really only has the choice of repurposing or the do-little-to-nothing option that can lead to urban decay.
RETAIL MARKET DEMAND ANALYSIS AND
RECOMMENDATIONS
Clearly the level of excess retail building space in the Central and Walnut study area suggests that individual property owners will face challenges in trying to retain and attract tenants at lease rates that will support continued maintenance and reinvestment. Over time, this area will likely to exhibit increasing signs of urban blight absent some public intervention.
The situation in the East Riverside Drive Corridor study area is not as severe as that in the Central and Walnut area, but this area will struggle to attract enough consumers and tenants to avoid a prolonged cycle of level to declining rents, with postponed maintenance and upkeep. Indeed, the analysis suggests that potential growth in trade-area consumer spending will be insufficient to overcome the amount of excess retail building space over the next five years.
Re-envisioning Chino: Implementing the 2025 General Plan | Economic and Market Analysis Page 23

Page 24 June 30, 2010
The analysis does indicate that the Chino Avenue Corridor study area does not suffer from excess retail building space and could actually support additional retail development. New retail development in this area, however, would siphon spending from other challenged retail areas in the city, likely hastening the potential spiral into urban blight.
The amount of excess retail building space in two of the three areas warrants the city’s consideration of policies and programs to encourage the redevelopment of retail building space.
Central and Walnut Study Area
The city should seek to redevelop at least 50,000 to 60,000 square feet of retail building space in this area. If new retail is desired to anchor mixed-use space in redevelopment projects, then an equal amount of retail over and above the current excess space should be removed the supply of retail buildings in this area.
East Riverside Drive Corridor Study Area
The city should seek to redevelop at least 11,000 to 30,000 square feet of retail building space in this area. As with the Central and Walnut area, additional retail building space should be redeveloped if the city desires new retail to anchor mixed-use areas.
Chino Avenue Corridor Study Area
The city can seek to attract additional retail businesses to this area. However, the city should carefully consider not promoting new retail until the excess retail building space in the other areas is on the way to being remedied.

Development Scenario Feasibility Analysis
Development Scenario Feasibility Analysis
This chapter of the Economic and Market Analysis assess the financial feasibility of development scenarios for six opportunity sites in the three study areas. The financial feasibility is assessed using a development pro forma. Table A-7 in the appendix provides the general assumptions used in all of the analyses.
This chapter is intended to be reviewed in conjunction with the Development Scenarios Guidebook, which provides graphic illustrations and more detailed descriptions of each development scenario. This chapter provides detail information that feeds into each pro forma and discusses the financial feasibility findings for each scenario.
ANALYZING DEVELOPMENT FEASIBILITY
What is a Development Pro Forma
A development pro forma is a spreadsheet that calculates the costs of development and the revenue flow, adjusting these for the time value of money and the costs to borrow money. The pro forma determines the amount of equity investment (i.e. actual cash) required of the developer and the rate of return on that investment. References to the financial feasibility of a development project simply mean whether or not the rate of return is sufficiently high to attract a developer to invest in that project.
Lease Rates
The rents paid by office and retail tenants are the income source that repays the development costs. Tenants are willing to pay some base level of rent just for the building space, and then some premium rent if the location will generate more revenues for their business.
During the course of this project, market conditions have continued to put downward pressure on retail and office lease rates in the Inland Empire. As the regional and national economies continue to slowly improve, it is possible that lease rates will start to rise. Construction costs, however, will also likely rise somewhat as economic growth returns and the real estate development industry recovers. Thus any benefits of rising lease rates would be offset by rising construction cost.
Return on Investment
In a typical development processes, the development firm puts up some amount of its own money, while bringing in an outside investor for the majority of the required equity investment. The developer obtains a construction loan, which might cover all of the development costs and perhaps half of the land acquisition costs (with the equity investment covering the remainder of the costs). Upon completion of the project, the developer takes out permanent financing and pays off the construction loan. Typically, the developer would then hold the property for a short period, maybe three to five years, and, with a
Re-envisioning Chino: Implementing the 2025 General Plan | Economic and Market Analysis Page 25

leasing track record, sell the property. Upon the sale of the property the developer pays off the permanent loan. What is left over after that final payment represents the developer’s final return on the initial investment.
Developers and investors most often use the internal rate of return (IRR) to measure the expected return on their investments and to decide whether or not to invest in a particular project. Under current market conditions – namely the economic recession and its slow recovery, the 2008 collapse of the financial services sector and its slow recovery, the loss of wealth from the stock market crash and the 25 to 30 percent decline in real estate values, and the increased investor aversion to risk brought on by these events – there is less money available for investment in development. Conversations with developers, brokers, and investors suggest that an IRR of 20 to 25 percent is needed to attract equity investment in development projects today. The pro forma analysis assumes a financial feasibility goal of a 20 percent IRR over the short term, as the economy and financial markets continue to recover slowly. This might decline to 15 percent in three to five years, if market conditions continue to improve, but the pro forma analysis uses the more conservative 20 percent IRR so as to not oversell the potential for redevelopment.
Residual Land Value
Residual land value is the amount the developer can afford to pay to acquire the land, given the IRR goal and the amount of development the site can accommodate with its size, shape, and zoning requirements.
Because the equity required for a development is directly related to the cost to acquire land and because this cost occurs at the beginning of the project, the residual land value is the one factor that most immediately influences the rate of return. For example, in the pro
forma analysis for Opportunity Site 1, a 10 percent reduction in the land acquisition costs increases the IRR by 48.4 percent.
With an IRR target of 20 percent, the pro forma analysis calculates the remaining variable, the residual land value. A feasibility gap – the difference between the residual land value and the estimated market value for each opportunity site – exists when the residual land value is less than the cost to acquire the site. A gap represents the level of subsidy required for redevelopment to occur under near-term market conditions. The feasibility gap percentage, the residual land value expressed as a percentage of the estimated market value, indicates how far off the proposed development is from being feasible under market conditions. In contrast, A feasibility surplus exists when the residual land value exceeds the cost to acquire the site. The surplus represents the additional return the developer can expect and/or the ability to provide additional investment in the project.
OPPORTUNITY SITE 1A
Northwest Corner of Central and Walnut Avenues
This site is approximately 7.6 acres in size. It has one of the first shopping centers developed in Chino. The site has about 87,000 square feet of buildings that would be demolished under this scenario. Based on a review of assessing records and third party data sources, the analysis estimates the site’s market acquisition cost at nearly $19 million. The proposed redevelopment would include 9 multi-family buildings with a mix of for-sale townhouses and flats. It would include 1 mixed-use building with ground floor retail and one story of residential flats above the retail. Because this would be a new building type in the area, it is modeled as a for-rent product to reflect potential difficulties with attracting buyers. Finally, the scenario includes 2 stand-alone single-use retail buildings.
Page 26 June 30, 2010

Table 10. Site 1A: Development Program
Main Street Walk 10-Unit Prototype 6 buildings 2-Bedroom units 6 units - size 1,160 sq. ft. - sales value 256,000
3-Bedroom units 4 units - size 1,270
- sales value 264,000 Main Street Walk 12-Unit Prototype 3 buildings 2-Bedroom units 7 units - size 1,160 sq. ft. - sales value $256,000
3-Bedroom units 5 units - size 1,270
- sales value $264,000 Mixed-Use Prototype 1 building 1-Bedroom unit 5 units - size 800 sq. ft. - monthly rent $990
2-Bedroom units 6 units - size 1,100 sq. ft. - monthly rent $1,360
Ground floor retail 1 units - size 4,000 sq. ft. - monthly rent $8,230
Stand-alone Retail 2 buildings - size 6,488 sq. ft. - sales value $2,000,000 - size 7,831 sq. ft. - sales value $2,420,000
Table 11. Site 1A: Development Pro Forma Summary
Existing Site Information Site area (sq. ft.) 331,056 Existing building size (sq. ft.), to be demolished 86,984 Estimated property value $18,900,000 Development Costs Summary
Land acquisition $13,900,000 Construction cost $11,200,000 - site development costs $1,940,000 - direct construction costs $9,260,000 Construction interest $1,120,000 Construction loan fee $545,000 Total Direct Costs $26,765,000 Construction loan amount $19,865,000 Total equity required $6,900,000 Percent of construction financed 74.2% Financing Costs
Amount financed - land $6,970,000 Amount financed - construction $11,200,000 Total amount financed $18,200,000 Construction loan fee $545,000 Total carried interest $1,120,000 Feasibility Summary
Estimated development sales value $31,100,000 IRR without subsidy n/a Residual land value @20% IRR $13,500,000 Feasibility gap ($5,400,000) - Portion of estimated land value -28.6%
Re-envisioning Chino: Implementing the 2025 General Plan | Economic and Market Analysis Page 27
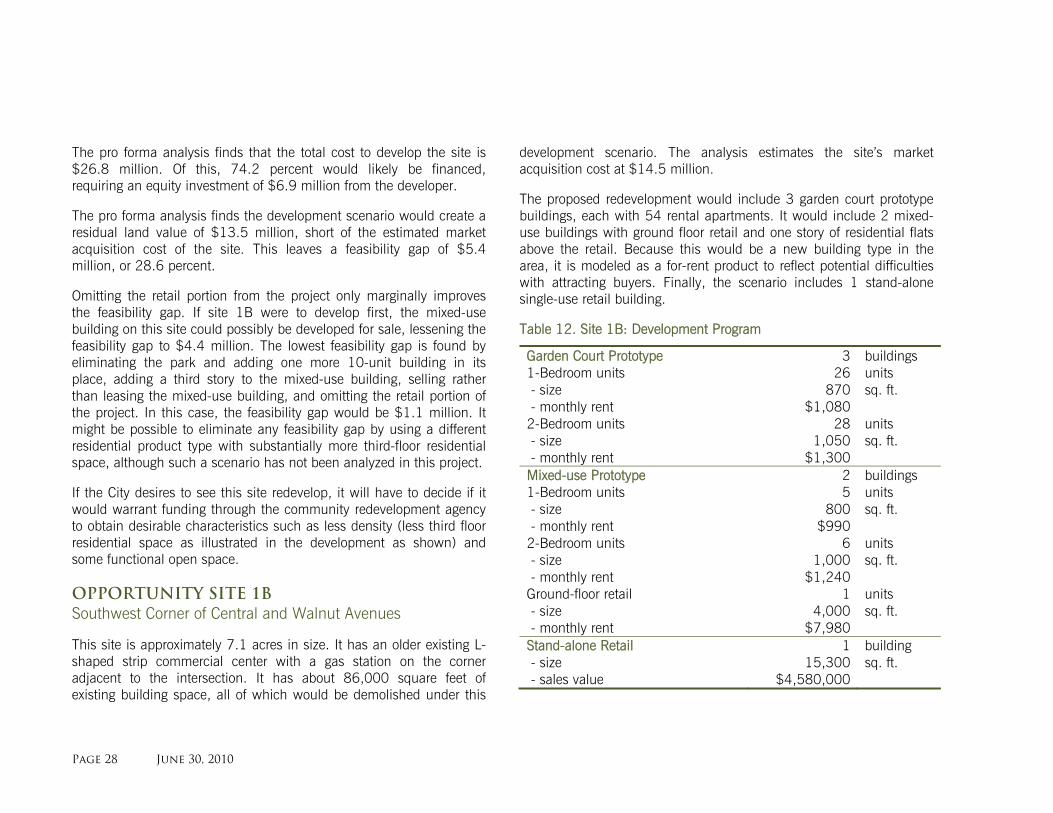
The pro forma analysis finds that the total cost to develop the site is $26.8 million. Of this, 74.2 percent would likely be financed, requiring an equity investment of $6.9 million from the developer.
The pro forma analysis finds the development scenario would create a residual land value of $13.5 million, short of the estimated market acquisition cost of the site. This leaves a feasibility gap of $5.4 million, or 28.6 percent.
Omitting the retail portion from the project only marginally improves the feasibility gap. If site 1B were to develop first, the mixed-use building on this site could possibly be developed for sale, lessening the feasibility gap to $4.4 million. The lowest feasibility gap is found by eliminating the park and adding one more 10-unit building in its place, adding a third story to the mixed-use building, selling rather than leasing the mixed-use building, and omitting the retail portion of the project. In this case, the feasibility gap would be $1.1 million. It might be possible to eliminate any feasibility gap by using a different residential product type with substantially more third-floor residential space, although such a scenario has not been analyzed in this project.
If the City desires to see this site redevelop, it will have to decide if it would warrant funding through the community redevelopment agency to obtain desirable characteristics such as less density (less third floor residential space as illustrated in the development as shown) and some functional open space.
OPPORTUNITY SITE 1B
Southwest Corner of Central and Walnut Avenues
This site is approximately 7.1 acres in size. It has an older existing L-shaped strip commercial center with a gas station on the corner adjacent to the intersection. It has about 86,000 square feet of existing building space, all of which would be demolished under this
development scenario. The analysis estimates the site’s market acquisition cost at $14.5 million.
The proposed redevelopment would include 3 garden court prototype buildings, each with 54 rental apartments. It would include 2 mixed-use buildings with ground floor retail and one story of residential flats above the retail. Because this would be a new building type in the area, it is modeled as a for-rent product to reflect potential difficulties with attracting buyers. Finally, the scenario includes 1 stand-alone single-use retail building.
Table 12. Site 1B: Development Program
Garden Court Prototype 3 buildings 1-Bedroom units 26 units - size 870 sq. ft. - monthly rent $1,080
2-Bedroom units 28 units - size 1,050 sq. ft. - monthly rent $1,300
Mixed-use Prototype 2 buildings 1-Bedroom units 5 units - size 800 sq. ft. - monthly rent $990
2-Bedroom units 6 units - size 1,000 sq. ft. - monthly rent $1,240 Ground-floor retail 1 units - size 4,000 sq. ft. - monthly rent $7,980
Stand-alone Retail 1 building - size 15,300 sq. ft. - sales value $4,580,000
Page 28 June 30, 2010

Table 13. Site 1B: Development Pro Forma Summary
Existing Site Information Site area (sq. ft.) 309,276 Existing building size (sq. ft.), to be demolished 86,371 Estimated property value $14,500,000 Development Costs Summary
Land acquisition $14,000,000 Construction cost $14,130,000 - site development costs $1,830,000 - direct construction costs $12,300,000 Construction interest $1,360,000 Construction loan fee $633,000
Total Direct Costs $30,123,000 Construction loan amount $23,093,000 Total equity required $7,030,000 Percent of construction financed 76.7% Financing Costs
Amount financed - land $7,020,000 Amount financed - construction $14,100,000 Total amount financed $21,100,000 Construction loan fee $633,000 Total carried interest $1,360,000 Feasibility Summary
Estimated site sales value $42,900,000 IRR without subsidy 17.8% Residual land value @20% IRR $13,600,000 Feasibility gap ($900,000) - Portion of estimated land value -6.2%
The development pro forma finds that the total development cost would be $30.1 million. Of this, 76.7 percent would likely be financed, requiring an equity investment of $7.0 million from the developer.
The pro forma analysis finds the development scenario would create a residual land value of $13,600,000, short of the estimated market acquisition cost of the site. This leaves a feasibility gap of $900,000, or 6.2 percent.
Thus, to develop the site as shown, under current market conditions, the City would have to provide a subsidy of just under $1 million. If site 1A were to develop first, then it might be possible for the two mixed-use buildings to develop for sale rather than for rent. In this case, the site could be redeveloped with no subsidy. If this site were to develop before site 1A, then the two mixed-use buildings would have to be three stories rather than two for the redevelopment to be financially feasible without a subsidy.
OPPORTUNITY SITE 2
North Side of Riverside Drive, between Benson and Oaks Avenues
This site is approximately 5.5 acres. It is currently used for a straight-line shopping center, anchored by Chino Rancho Market. The west side of the site has a stand-alone donut shop, car wash, and Del Taco fast food restaurant. It has about 50,000 square feet of existing buildings, all of which would be demolished under this scenario. The analysis estimates the site’s market acquisition cost at $13 million.
The proposed redevelopment would include 7 for-sale townhouse building clusters. Each building would have 10 townhouse units
Re-envisioning Chino: Implementing the 2025 General Plan | Economic and Market Analysis Page 29

ranging from 1,225 to 1,748 square feet in size. This scenario would also include a single stand-alone for-rent retail building at the western end of the site.
Table 14. Site 2: Development Program
Motorcourt Townhouse Prototype 7 buildings 2bed/2bath units 2 units - size 1,225 sq. ft. - sales value $261,000
3bed/3bath 5 units - size 1,460 sq. ft. - sales value $276,000 3bed/3.5bath 3 units - size 1,758 sq. ft. - sales value $296,000
Stand-alone Retail 1 building - size 13,692 sq. ft. - monthly rent $28,900
Table 15. Site 2: Development Pro Forma Summary
Existing Site Information Site area (sq. ft.) 239,580 Existing building size (sq. ft.), to be demolished 49,864 Estimated property value $13,100,000 Development Costs Summary
Land acquisition $12,300,000 Construction cost $6,690,000 - site development costs $1,450,000 - direct construction costs $5,240,000 Construction interest $730,000 Construction loan fee $386,000
Total Direct Costs $20,106,000 Construction loan amount $14,016,000 Total equity required $6,090,000 Percent of construction financed 69.7% Financing Costs
Amount financed - land $6,170,000 Amount financed - construction $6,680,000 Total amount financed $12,900,000 Construction loan fee $386,000 Total carried interest $730,000 Feasibility Summary
Estimated site sales value $23,000,000 IRR without subsidy 13.4% Residual land value @20% IRR $12,000,000 Feasibility gap ($1,100,000) - Portion of estimated land value -8.4%
Page 30 June 30, 2010

The development pro forma finds that the total development cost would be $20.1 million. Of this, 69.7 percent would likely be financed, requiring an equity investment of $6.1 million from the developer.
The pro forma analysis finds the development scenario would create a residual land value of $12 million, short of the estimated market acquisition cost of the site. This leaves a feasibility gap of $1.1 million, or 8.4 percent. If the IRR for capital investment declines to 15 percent in the future, the feasibility gap declines to $289,000.
The retail component of the development, however, under performs under current market conditions. If the residential portion of the site were to develop as shown, leaving the Donut Avenue and the carwash out of the project, the remaining development would generate a residual land value that exceeds the estimated acquisition cost by $1.4 million. Thus, if the City would like to see this site redevelop under current market conditions, it would have to either leave the western portion of the site out of the project or else contribute a $1.1 million subsidy.
OPPORTUNITY SITE 3
Southwest Corner of Riverside Drive and Magnolia Avenue
This 5.3-acre site is relatively undeveloped. It currently contains three residential units and ancillary out-buildings. Based on assessing data, the analysis estimates that the site has about 2,298 of habitable building space, all of which would be demolished under this scenario. The analysis estimates the site’s market acquisition cost at $4.4 million.
The proposed redevelopment would include 26 for-sale triplex buildings. Each building provides 1 carriage unit and 2 townhouse units. The site design evaluated for feasibility includes a small open
green area that could be passive open space or provide a tot lot facility.
Table 16. Site 3: Development Program
Meriwether Triplex Prototype 26 buildings Carriage unit 1 units - size 1,272 sq. ft. - sales value $264,000
Townhome units 2 units - size 1,922 sq. ft. - sales value $307,000
The development pro forma finds that the total development cost would be $18.2 million. Of this, 60.1 percent would likely be financed, requiring an equity investment of $7.3 million from the developer.
The pro forma analysis finds the development scenario would create a residual land value of $13.6 million, in excess of the estimate market acquisition cost by $9.2 million or 208.4 percent. While the $9.2 million difference might seem particularly lucrative, the fact that the site remains relatively undeveloped with just a handful of homes suggests that some level of financial incentive would be necessary to motivate the property owner to consider selling. If the site were acquired at the estimated market value, the development could be reduced to only 12 triplex buildings (a density of 6.9 units per acre) and still generate a 20 percent IRR.
Re-envisioning Chino: Implementing the 2025 General Plan | Economic and Market Analysis Page 31

Table 17. Site 3: Development Pro Forma Summary
Existing Site Information Site area (sq. ft.) 226,512 Existing building size (sq. ft.), to be demolished 2,298 Estimated property value $4,410,000 Development Costs Summary
Land acquisition $14,000,000 Construction cost $3,230,000 - site development costs $1,140,000 - direct construction costs $2,090,000 Construction interest $746,000 Construction loan fee $307,000
Total Direct Costs $18,283,000 Construction loan amount $11,253,000 Total equity required $7,030,000 Percent of construction financed 61.5% Financing Costs
Amount financed - land $6,990,000 Amount financed - construction $3,240,000 Total amount financed $10,200,000 Construction loan fee $307,000 Total carried interest $746,000 Feasibility Summary
Estimated site sales value $21,700,000 IRR without subsidy 154.0% Residual land value @20% IRR $13,600,000 Feasibility surplus $9,190,000 - Portion of estimated land value 208.4%
OPPORTUNITY SITE 4
South Side of Riverside Drive, between 11th and 12th Streets
This 1.6-acre site currently contains a number of single-family detached housing units and ancillary out-buildings. Based on assessing information, the analysis estimates that this site has about 12,000 square feet of existing building space, all of which would be demolished under this scenario. The analysis estimates the site’s market acquisition cost at $3.6 million.
The proposed redevelopment would include 6 for-sale The Cottages prototype buildings. Each building includes 6 units, ranging in size from 600-square-foot studios to a 950-square-foot 2-bedroom unit.
Table 18. Site 4: Development Program
The Cottages Prototype 6 buildings Studio units 2 units - size 600 sq. ft. - sales value $219,000 1-Bedroom units 2 units - size 700 sq. ft. - sales value $226,000 1-Bedroom w/den units 1 units - size 925 sq. ft. - sales value $241,000
2-Bedroom units 1 units - size 950 sq. ft. - sales value $242,000
Page 32 June 30, 2010

Table 19. Site 4: Development Pro Forma Summary
Existing Site Information Site area (sq. ft.) 70,065 Existing building size (sq. ft.), to be demolished 12,028 Estimated property value $3,610,000 Development Costs Summary
Land acquisition $4,730,000 Construction cost $1,570,000 - site development costs $410,000 - direct construction costs $1,160,000 Construction interest $257,000 Construction loan fee $118,000
Total Direct Costs $6,675,000 Construction loan amount $4,305,000 Total equity required $2,370,000 Percent of construction financed 64.5% Financing Costs
Amount financed - land $2,360,000 Amount financed - construction $1,570,000 Total amount financed $3,930,000 Construction loan fee $118,000 Total carried interest $257,000 Feasibility Summary
Estimated site sales value $7,830,000 IRR without subsidy 44.8% Residual land value @20% IRR $4,590,000 Feasibility surplus $980,000 - Portion of estimated land value 27.1%
The development pro forma finds that the total development cost would be $6.7 million. Of this, 64.5 percent would likely be financed, requiring an equity investment of $2.4 million from the developer.
The pro forma analysis finds the development scenario would create a residual land value of $4.6 million, in excess of the estimate market acquisition cost by nearly $1 million or 27.1 percent. The value in excess of the estimated acquisition cost may be the incentive necessary to induce the existing property owners to sell and enable a developer to assemble the site. If all of the parcels could be acquired for the estimated acquisition cost, the site could be developed with five sets of buildings instead of six and still provide a 20 percent IRR.
OPPORTUNITY SITE 5
Northwest Corner of Central Avenue and G Street
This 4.8-acre site currently has industrial, commercial, and outside storage uses. The site has about 33,500 square feet of building space that would be demolished under this scenario. The analysis estimates the site’s market acquisition cost at $3.7 million.
The proposed redevelopment would construct 4 for-sale industrial mixed-use loft buildings. Each building would have 5 units, and each unit would have a 1,875-square-foot work area on the ground floor and a 1,500-square-foot residential area on the second floor.
Table 20. Site 5: Development Program
Mixed-use Industrial Loft Prototype 4 buildings Live-work units 5 units Residential area 1,500 sq. ft. Work area 1,875 sq. ft. Sales value $560,000
Re-envisioning Chino: Implementing the 2025 General Plan | Economic and Market Analysis Page 33

Page 34 June 30, 2010
Table 21. Site 5: Development Pro Forma Summary
Existing Site Information Site area (sq. ft.) 209,088 Existing building size (sq. ft.), to be demolished 33,486 Estimated property value $3,670,000 Development Costs Summary
Land acquisition $4,200,000 Construction cost $4,950,000 - site development costs $1,210,000 - direct construction costs $3,740,000 Construction interest $295,000 Construction loan fee $212,000
Total Direct Costs $9,657,000 Construction loan amount $7,557,000 Total equity required $2,100,000 Percent of construction financed 78.3% Financing Costs
Amount financed - land $2,100,000 Amount financed - construction $4,950,000 Total amount financed $7,050,000 Construction loan fee $212,000 Total carried interest $295,000 Feasibility Summary
Estimated site sales value $10,600,000 IRR without subsidy 33.1% Residual land value @20% IRR $4,080,000 Feasibility surplus $410,000 - Portion of estimated land value 11.2%
The development pro forma finds that the total development cost would be $9.7 million. Of this, 78.3 percent would likely be financed, requiring an equity investment of $2.1 million from the developer.
The pro forma analysis finds the development scenario would create a residual land value of $4.1 million, in excess of the estimated market acquisition cost by $410,000 or 11.2 percent.
The unit sales value would be $560,000, or $166 per sq. ft. This value also equates to a work-area lease rate of $1 per square foot per month. Lowering the cost to reflect a work-area lease rate of $.90 per square foot per month results in a break-even feasibility at 20 percent IRR. If the IRR for capital investment declines to a 15 percent IRR in the future, the sales value of the units could be reduced to $523,000, or $155 per square foot.

Implications and Recommendations
Implications and Recommendations
This final chapter discusses the implications of the analyses of market demand and development feasibility on Chino’s future growth vision for redevelopment in the three study areas. This chapter concludes with recommendations for redevelopment.
EXCESS RETAIL
The market analysis finds that perhaps 8 to 9 percent of the retail building space in the regional trade area is excess, that is, more than can be supported by consumer spending, even after allowing for a reasonable level of vacancies. Even with improving market conditions and population growth, the region would still have 3 to 4 percent excess retail building space in five years.
Beyond the potential to cause long-term structural vacancies that could lead to urban blight, excess retail building space has two important implications for redevelopment potential in the three study areas.
Lower Lease Rates
When vacancies rise, especially when vacancies are long term and structural, retail property owners have to compete to attract and retain tenants. While some owners can re-invest in their properties to improve their ability to attract quality tenants, the typical area-wide outcome is decreasing lease rates.
At the margin, lower lease rates may decrease vacancies by enabling a few businesses that would not otherwise be able to afford to rent to locate in the trade area. When vacancies arise because there is too much retail space, however, such an increase in the number of businesses and tenants will likely be temporary. If one business moves to the trade area, attracted by lower lease rates, then that business will attract consumers that are currently supporting another business in the same field.
Vacancies and low lease rates are signs that a developer proposing new retail development will face challenges finding tenants. More importantly, though, lease rates are the revenue stream that pays off the debt used to finance new retail development. Lower lease rates mean less investment for development.
The pro forma analysis finds that the average lease rates expected for the study area will not support redevelopment for retail uses without a subsidy. Indeed, even new retail development on vacant sites would be a challenge, being feasible under current market conditions only when the land can be acquired at a modest to discount price.
Disincentive to New Development
Developers have to demonstrate market demand to support proposed development when they seek equity investors and financing. The current amount of excess retail building space will hinder if not
Re-envisioning Chino: Implementing the 2025 General Plan | Economic and Market Analysis Page 35

eliminate developer ability to attract money to redevelopment projects. Even if market conditions improve and lease rates rise over time, the amount of excess retail space will still continue to limit the potential for new retail in the three study areas.
The General Plan’s vision to redevelop shopping centers at Central and Walnut would change this situation. The conceptual plans for sites 1A and 1B would result in a net reduction of 144,000 square feet of retail building space. This would eliminate the excess retail in this study area and the Riverside Drive East Corridor study area. It would also lessen the larger area’s retail supply imbalance, which should help Chino Town Square and Chino Promenade, although this project did not separately analyze the market demand for the shopping centers on the north side of CA-60.
MEASURE M
Measure M would require voter approval of any General Plan or zoning change that would increase residential densities from those that existed upon its adoption in 1988, or to convert non-residential uses to housing. The city could initiate a Measure M election for all or part of the vision plan, or individual developers could initiate the election on a project by project basis.
The election process could take six months to a year. A developer would most likely have to buy an option on the site and pay the costs for the election and the campaign. The developer would risk all of this preliminary investment pending the outcome of the election. Thus, the project would have to provide an extremely lucrative return on investment to justify the risk to the.
Conversations with developers during this project suggest that it is unlikely that a developer would take this risk, especially when the redevelopment projects and the product types are untested in the immediate study areas. However, once a track record of voter approval
and market support for the product types is established, developers might be willing to initiate the process for sites and projects that offer a return commensurate with the risk.
Neither opportunity site 1A nor 1B is feasible to redevelop without some subsidy or incentive from the city. Redevelopment will thus require the active involvement of the city, most likely through the Community Redevelopment Agency. Because city involvement is necessary and because redevelopment of these sites provides public benefits, especially the reduction of excess retail building space, either of these sites could be a good first attempt at redevelopment and voter approval.
Opportunity site 2 could be feasible for redevelopment without a subsidy from the city. Even if the site could be acquired at the estimated market value, it is not clear that the return would justify the risk without some track record of voter approval and market support. With such a track record, this site might be feasible with a developer initiated election.
Opportunity sites 3, 4, and 5 would all provide an IRR greater than 20 percent, if the sites could be acquired for the estimated market acquisition cost, with site 3 providing the greatest return and site 5 the smallest return. These three sites are all planned and zoned for non-residential uses, so each would require voter approval for any residential development. The possibility that a developer would initiate an election without some track record of voter acceptance and market demand for the product types in these areas will depend on the actual acquisition price developers can negotiate with land owners. However, the return in excess of 20 percent IRR does suggest that, with such a track record established on other projects, developers might be enticed to pursue additional voter approvals on their own.
The pro forma analysis suggests two paths for Measure-M voter approval for General Plan and zoning changes to facilitate
Page 36 June 30, 2010

redevelopment in the future growth vision areas. To the degree that the city desires to actively pursue and facilitate redevelopment, the city should take the lead in initiating elections for initial redevelopment projects. To the degree that the city desires to be less actively involved in making redevelopment happen and prefers, instead, to encourage and support redevelopment, the city can wait for a developer to initiate the elections, although this is unlikely to happen in the near term.
RECOMMENDATIONS
There are, of course, political and other considerations influencing how and when the city gets involved in facilitating the redevelopment planned in the future growth vision. Based simply on the economic and market considerations, however, this report offers the following recommendations.
1. For-sale Multi-family Housing. The city should plan for the three study areas to support the development of up to 77 for-sale multi-family housing units over the next five years. As projects are developed and the market absorbs these new units, the city should revisit the market analysis to better understand the long-term market potential of for-sale multi-family housing.
2. For-rent Multi-family Housing. The city can expect the three study areas to support the development of up to 813 for-rent multi-family housing units over the next five years. These units could be a mix of affordable and market-rate units. As with the for-sale units, the city should revisit the market analysis to reflect absorption rates for the initial projects.
3. Excess Retail. To improve market conditions for retail development and the performance of retail businesses, the city should seek to transition 260,000 square feet of existing retail building space city wide to non retail uses. Specific to each study area, the city should plan to transition at least 51,000 to 62,000 square feet of retail
building space in the Walnut & Central study area and 11,000 to 28,000 square feet in the Riverside Drive East Corridor study area to non-retail uses.
4. Mixed-Use Retail. In planning retail uses as part of mixed-use development in the three study areas, the city should focus on convenience goods and services retailers, restaurants and bars that primarily serve adjacent and nearby neighborhoods. In contrast, comparison goods retailers should be planned in more competitive locations with better access and visibility to community and regional residents.
5. Existing Shopping Center Sites. The relatively high estimated market acquisition costs of the existing shopping centers sites (1A, 1B, and 2) makes redevelopment financially infeasible without subsidy or incentive. However, by reducing the amount of excess retail building space, by providing the initial redevelopment that establishes a track record for future redevelopment projects, and by testing voter sentiment for increased residential density, these projects provide public benefits. The city will have to decide if these and other public benefits justify the necessary level of subsidy.
6. Non-Retail Sites. The pro forma analysis suggests that redevelopment of residential and industrial sites with housing could be financially feasible without subsidies. It is not clear, however, if these projects would provide a large enough return on investment to justify the risk for a developer to initiate a Measure-M election without some prior test of public sentiment.
Re-envisioning Chino: Implementing the 2025 General Plan | Economic and Market Analysis Page 37

Page 38 June 30, 2010
Appendix A. Data Tables
Appendix A. Data Tables
Re-envisioning Chino: Implementing the 2025 General Plan | Economic and Market Analysis Page A-1

Table A-1. Population and Housing Trend, Chino CA, 1990 through 2009
Year
Population Housing Persons per household Total Household Group
Quarters Total Single-family Multi-family Mobile
home Occupied Vacancy Rate Detached Attached 2 to 4 5 or more
1990 59,682 51,181 8,501 16,137 11,966
3,594
577 15,636 3.10 3.27
1991 60,444 52,111 8,333 16,354 12,173
3,608
573 15,844 3.12 3.29
1992 60,319 53,194 7,125 16,579 12,388
3,623
568 16,057 3.15 3.31
1993 60,998 53,808 7,190 16,693 12,491
3,638
564 16,164 3.17 3.33
1994 61,706 54,203 7,503 16,896 12,684
3,653
559 16,358 3.18 3.31
1995 62,580 54,885 7,695 17,041 12,818
3,669
554 16,493 3.22 3.33
1996 63,252 55,241 8,011 17,112 12,879
3,684
549 16,558 3.24 3.34
1997 63,396 55,717 7,679 17,142 12,902
3,696
544 16,584 3.26 3.36
1998 64,846 56,598 8,248 17,364 13,010
3,815
539 16,795 3.28 3.37
1999 65,831 57,783 8,048 17,623 13,154
3,935
534 17,042 3.30 3.39
2000 67,168 59,352 7,816 17,898 12,462 952 786 3,170 528 17,304 3.32 3.43
2001 67,736 60,167 7,569 17,990 12,558 952 782 3,170 528 17,393 3.32 3.46
2002 69,152 61,629 7,523 18,106 12,674 952 782 3,170 528 17,505 3.32 3.52
2003 70,850 63,350 7,500 18,385 12,953 952 782 3,170 528 17,775 3.32 3.56
2004 75,865 64,898 10,967 18,630 13,190 952 790 3,170 528 18,012 3.32 3.60
2005 77,926 66,615 11,311 19,012 13,529 952 803 3,200 528 18,381 3.32 3.62
2006 79,795 68,204 11,591 19,528 13,987 952 809 3,252 528 18,880 3.32 3.61
2007 81,165 69,671 11,494 20,053 14,302 952 901 3,370 528 19,388 3.32 3.59
2008 82,481 71,562 10,919 20,652 14,739 952 1,063 3,370 528 19,967 3.32 3.58
2009 84,173 73,825 10,348 21,291 15,175 952 1,081 3,555 528 20,585 3.32 3.59
Source: CA Department of Finance, 2009.
Page A-2 June 30, 2010

Table A-2. Projected Number of Households and Housing by Type, Chino CA, 2010 through 2030
Year Households Total Housing Units
Single-family Detached
Multi-family Notes to Table A-2: 1. Data are linear projections based on estimates from CA Department
of Finance presented in Table A-1. 2. Multi-family includes all attached housing, such as townhouses,
condos, and apartments. 3. Projections assume that there will be no changes in the number of
mobile homes.
Mobile Home
2010 20,811 21,527 15,005 5,993 528
2011 21,037 21,762 15,211 6,023 528
2012 21,263 21,998 15,417 6,053 528
2013 21,489 22,234 15,622 6,084 528
2014 21,715 22,469 15,827 6,115 528
2015 21,941 22,705 16,031 6,146 528
2016 22,167 22,941 16,235 6,178 528
2017 22,393 23,176 16,439 6,210 528
2018 22,618 23,412 16,642 6,242 528
2019 22,844 23,648 16,845 6,275 528
2020 23,070 23,883 17,047 6,308 528
2021 23,296 24,119 17,250 6,341 528
2022 23,522 24,354 17,452 6,375 528
2023 23,748 24,590 17,654 6,408 528
2024 23,974 24,826 17,855 6,443 528
2025 24,200 25,061 18,057 6,477 528
2026 24,426 25,297 18,258 6,512 528
2027 24,652 25,533 18,458 6,546 528
2028 24,878 25,768 18,659 6,581 528
2029 25,104 26,004 18,859 6,617 528
2030 25,330 26,240 19,060 6,652 528
Source: The Planning Center, 2010.
Re-envisioning Chino: Implementing the 2025 General Plan | Economic and Market Analysis Page A-3

Table A-3. Demographic Estimates for Various Trade Areas, Chino CA, 2009
five-mile Radius Trade
Area
Walnut & Central Trade
Area
Riverside Drive East Corridor Trade Area
Chino Avenue Corridor Trade
Area
Population 16,247 2014 Projection 423,307 13,767 22,195 14,496 2009 Estimate 394,886 12,283 19,872
2000 Census 356,394 9,896 16,125 11,692
1990 Census 300,960 9,088 14,761 10,336
12.08% Growth 2009-2014 7.20% 12.08% 11.69% 23.98% Growth 2000-2009 10.80% 24.12% 23.24%
Growth 1990-2000 18.42% 8.89% 9.24% 13.12%
14,496 2009 Est. Population by Single Race Classification 394,886 12,283 19,872 5,990 White Alone 164,899 5,743 8,724
406 Black or African American Alone 21,887 380 509 260 American Indian and Alaska Native Alone 4,451 163 331 617 Asian Alone 37,302 599 711 25 Native Hawaiian and Other Pacific Islander Alone 921 32 38
6,462 Some Other Race Alone 144,867 4,596 8,348 736 Two or More Races 20,559 771 1,210
14,496 2009 Est. Population Hispanic or Latino by Origin 394,886 12,283 19,872 3,275 Not Hispanic or Latino 140,422 3,751 5,180
Hispanic or Latino: 254,464 8,532 14,692 11,221 9,673 Mexican 207,905 7,030 12,366
62 Puerto Rican 1,999 52 78 39 Cuban 1,592 56 58
All Other Hispanic or Latino 42,968 1,393 2,190 1,447
Page A-4 June 30, 2010

2009 Est. Hispanic or Latino by Single Race Class 254,464 8,532 14,692 11,221
4,011 White Alone 90,285 3,264 5,253 40 Black or African American Alone 1,251 23 48
181 American Indian and Alaska Native Alone 3,374 120 235
Asian Alone 686 8 14 19 8 Native Hawaiian and Other Pacific Islander Alone 210 3 6
6,451 Some Other Race Alone 144,436 4,583 8,324 511 Two or More Races 14,222 531 812 617 2009 Est. Pop. Asian Alone Race by Category 37,302 599 711 90 Chinese, except Taiwanese 6,930 58 77
233 Filipino 11,455 193 238 40 Japanese 1,574 42 53 59 Asian Indian 2,980 86 94 39 Korean 2,914 54 56 83 Vietnamese 5,438 84 98
2 Cambodian 1,073 1 6 0 Hmong 84 0 2 5 Laotian 338 1 2 4 Thai 632 4 10
40 Other Asian 2,789 65 49 22 Two or more Asian categories 1,095 10 25
14,496 2009 Est. Population by Ancestry 394,886 12,283 19,872 28 Pop, Arab 967 19 28 16 Pop, Czech 495 11 28 16 Pop, Danish 645 11 26
198 Pop, Dutch 3,854 378 487 295 Pop, English 11,014 401 555
Pop, French (except Basque) 3,424 85 202 183 17 Pop, French Canadian 935 52 49
609 Pop, German 16,587 656 893
Re-envisioning Chino: Implementing the 2025 General Plan | Economic and Market Analysis Page A-5

6 Pop, Greek 486 17 20 7 Pop, Hungarian 586 16 16
293 Pop, Irish 10,410 418 476 282 Pop, Italian 8,313 365 285
Pop, Lithuanian 224 2 0 11 400 Pop, United States or American 10,678 340 500 44 Pop, Norwegian 1,990 61 83 87 Pop, Polish 2,072 41 41
205 Pop, Portuguese 1,832 271 390 26 Pop, Russian 892 17 22 37 Pop, Scottish 1,860 61 83 38 Pop, Scotch-Irish 2,026 69 111
0 Pop, Slovak 57 0 0 42 Pop, Subsaharan African 2,074 74 72 83 Pop, Swedish 1,961 63 109
9 Pop, Swiss 377 15 23 8 Pop, Ukrainian 270 29 20
19 Pop, Welsh 545 20 11 3 Pop, West Indian (exc Hisp groups) 603 10 16
2009 Est. Population by Ancestry 9,791 Pop, Other ancestries 247,272 7,181 12,654 1,743 Pop, Ancestry Unclassified 62,437 1,600 2,674
13,109 2009 Est. Pop Age 5+ by Language Spoken At Home 360,119 11,197 18,058 5,046 Speak Only English at Home 173,758 5,355 7,515
311 Speak Asian/Pacific Islander Language at Home 22,089 357 396 330 Speak IndoEuropean Language at Home 7,292 491 660
7,378 Speak Spanish at Home 155,203 4,931 9,407 46 Speak Other Language at Home 1,777 63 80
14,496 2009 Est. Population by Sex 394,886 12,283 19,872 7,397 Male 203,079 6,166 10,011 7,099 Female 191,807 6,117 9,861
Page A-6 June 30, 2010

1.04 Male/Female Ratio 1.06 1.01 1.02 14,496 2009 Est. Population by Age 394,886 12,283 19,872 1,387 Age 0 - 4 34,767 1,086 1,814 1,250 Age 5 - 9 32,219 1,021 1,657 1,235 Age 10 - 14 32,893 1,017 1,622
717 Age 15 - 17 20,364 609 987 724 Age 18 - 20 19,999 589 993 886 Age 21 - 24 24,912 717 1,201
2,479 Age 25 - 34 62,940 2,082 3,330 2,239 Age 35 - 44 60,560 1,915 2,998
928 Age 45 - 49 27,024 768 1,239 754 Age 50 - 54 22,781 648 1,063 567 Age 55 - 59 17,937 536 897 443 Age 60 - 64 13,203 410 687 516 Age 65 - 74 15,002 530 813 272 Age 75 - 84 7,378 262 413
Age 85 and over 2,906 91 156 101
Age 16 and over 288,162 8,964 14,438 10,376 9,908 Age 18 and over 274,643 8,550 13,791 9,184 Age 21 and over 254,644 7,961 12,798
888 Age 65 and over 25,286 884 1,382 29.24 2009 Est. Median Age 30.13 30.29 29.99 30.95 2009 Est. Average Age 31.83 31.99 31.82 7,397 2009 Est. Male Population by Age 203,079 6,166 10,011
708 Age 0 - 4 17,371 557 930 621 Age 5 - 9 16,572 524 827 625 Age 10 - 14 16,882 529 833 368 Age 15 - 17 10,333 305 493 383 Age 18 - 20 11,096 297 508 460 Age 21 - 24 13,495 368 621
Re-envisioning Chino: Implementing the 2025 General Plan | Economic and Market Analysis Page A-7

1,300 Age 25 - 34 33,562 1,062 1,706
Age 35 - 44 32,072 997 1,569 1,185 487 Age 45 - 49 14,055 383 634 391 Age 50 - 54 11,491 314 534 278 Age 55 - 59 8,863 248 433 217 Age 60 - 64 6,483 202 335 243 Age 65 - 74 7,033 247 383 95 Age 75 - 84 2,854 104 157 34 Age 85 and over 918 29 50
29.10 2009 Est. Median Age, Male 29.71 29.74 29.66 30.47 2009 Est. Average Age, Male 31.25 31.20 31.21 7,099 2009 Est. Female Population by Age 191,807 6,117 9,861
678 Age 0 - 4 17,396 528 884 629 Age 5 - 9 15,647 497 830 609 Age 10 - 14 16,011 488 789 349 Age 15 - 17 10,031 304 494 340 Age 18 - 20 8,903 293 486 426 Age 21 - 24 11,417 349 580
1,179 Age 25 - 34 29,378 1,019 1,624
Age 35 - 44 28,488 919 1,428 1,054 440 Age 45 - 49 12,969 385 605 363 Age 50 - 54 11,290 335 530 289 Age 55 - 59 9,074 288 464 226 Age 60 - 64 6,720 208 353 272 Age 65 - 74 7,969 283 430 177 Age 75 - 84 4,524 159 257 67 Age 85 and over 1,989 62 106
29.39 2009 Est. Median Age, Female 30.62 30.88 30.34 31.45 2009 Est. Average Age, Female 32.45 32.77 32.44
2009 Est. Population Age 15+ by Marital Status 295,007 9,159 14,778 10,625
3,443 Total, Never Married 85,957 2,815 4,559
Page A-8 June 30, 2010

5,042 Married, Spouse present 144,919 4,509 7,242 849 Married, Spouse absent 29,823 640 1,163 467 Widowed 12,333 423 688 824 Divorced 21,976 772 1,126
2,143 Males, Never Married 48,835 1,541 2,643 417 Previously Married 12,059 441 648
1,300 Females, Never Married 37,122 1,274 1,917 874 Previously Married 22,249 754 1,166
8,298 2009 Est. Pop. Age 25+ by Educational Attainment 229,732 7,244 11,597 2,244 Less than 9th grade 42,189 1,328 2,878 1,765 Some High School, no diploma 40,023 1,362 2,293 1,582 High School Graduate (or GED) 49,977 1,901 2,570 1,602 Some College, no degree 49,523 1,695 2,435
281 Associate Degree 14,663 333 398 645 Bachelor's Degree 24,073 449 711 138 Master's Degree 6,505 123 230 41 Professional School Degree 2,021 47 78
0 Doctorate Degree 758 6 5
Households 3,933 2014 Projection 106,757 3,796 5,717 3,576 2009 Estimate 101,085 3,448 5,210 3,035 2000 Census 95,373 2,915 4,436 2,802 1990 Census 86,792 2,874 4,282
9.98% Growth 2009-2014 5.61% 10.09% 9.73% 17.83% Growth 2000-2009 5.99% 18.28% 17.45% 8.32% Growth 1990-2000 9.89% 1.43% 3.60% 3,576 2009 Est. Households by Household Type 101,085 3,448 5,210 2,906 Family Households 82,186 2,708 4,172
670 Nonfamily Households 18,899 740 1,038
2009 Households by Ethnicity, Hispanic/Latino 55,718 2,061 3,341 2,467
Re-envisioning Chino: Implementing the 2025 General Plan | Economic and Market Analysis Page A-9

3,576 2009 Est. Households by Household Income 101,085 3,448 5,210 366 Income Less than $15,000 9,350 322 524 369 Income $15,000 - $24,999 8,778 419 603 271 Income $25,000 - $34,999 8,999 274 373 474 Income $35,000 - $49,999 13,604 524 680 732 Income $50,000 - $74,999 20,197 856 1,179 530 Income $75,000 - $99,999 14,788 424 760 523 Income $100,000 - $149,999 15,407 461 782 257 Income $150,000 - $249,999 7,989 158 283 42 Income $250,000 - $499,999 1,601 10 20
Income $500,000 and more 371 1 4 11 $73,169 2009 Est. Average Household Income $77,213 $64,121 $67,525 $60,505 2009 Est. Median Household Income $62,144 $55,426 $58,994 $18,147 2009 Est. Per Capita Income $20,217 $18,102 $17,796
3,576 2009 Est. Household Type, Presence Own Children 101,085 3,448 5,210 201 Single Male Householder 5,997 239 309 270 Single Female Householder 7,370 297 449
1,306 Married-Couple Family, own children 38,515 1,097 1,790 716 Married-Couple Family, no own children 22,339 785 1,196 143 Male Householder, own children 3,658 125 184 140 Male Householder, no own children 3,218 124 183 343 Female Householder, own children 8,694 351 473 258 Female Householder, no own children 5,762 226 347 130 Nonfamily, Male Householder 3,450 118 175 70 Nonfamily, Female Householder 2,082 86 105
3,576 2009 Est. Households by Household Size 101,085 3,448 5,210 471 1-person household 13,367 536 758 607 2-person household 20,166 764 1,019 582 3-person household 16,773 592 828 627 4-person household 18,817 595 918 495 5-person household 13,812 442 701
Page A-10 June 30, 2010

338 6-person household 8,413 252 444 456 7 or more person household 9,736 267 542
4.05 2009 Est. Average Household Size 3.79 3.55 3.81 3,576 2009 Est. Households by Presence of People 101,085 3,448 5,210
Households with 1 or more People under Age 18: 1,450 Married-Couple Family 41,348 1,203 1,984
190 Other Family, Male Householder 4,578 155 239 450 Other Family, Female Householder 10,606 437 602 14 Nonfamily, Male Householder 376 13 21
6 Nonfamily, Female Householder 128 3 6
Households no People under Age 18: 572 Married-Couple Family 19,506 679 1,001 93 Other Family, Male Householder 2,298 94 127
151 Other Family, Female Householder 3,850 140 217 317 Nonfamily, Male Householder 9,070 345 463 333 Nonfamily, Female Householder 9,325 379 548
3,576 2009 Est. Households by Number of Vehicles 101,085 3,448 5,210 330 No Vehicles 7,939 316 505
1,122 1 Vehicle 29,131 1,126 1,578 1,247 2 Vehicles 39,818 1,361 1,915
505 3 Vehicles 16,043 376 682 270 4 Vehicles 5,597 158 311 103 5 or more Vehicles 2,555 111 219
1.91 2009 Est. Average Number of Vehicles 1.93 1.82 1.92
Family Households 3,194 2014 Projection 86,813 2,978 4,574 2,906 2009 Estimate 82,186 2,708 4,172 2,472 2000 Census 77,515 2,297 3,562 2,347 1990 Census 68,266 2,209 3,477
Growth 2009-2014 5.63% 9.97% 9.64% 9.91%
Re-envisioning Chino: Implementing the 2025 General Plan | Economic and Market Analysis Page A-11

17.56% Growth 2000-2009 6.03% 17.89% 17.13% 5.33% Growth 1990-2000 13.55% 3.98% 2.44% 2,906 2009 Est. Family Households by Household Income 82,186 2,708 4,172
201 Income Less than $15,000 5,841 160 273 256 Income $15,000 - $24,999 6,246 271 413 255 Income $25,000 - $34,999 6,958 200 301 392 Income $35,000 - $49,999 10,277 424 572 555 Income $50,000 - $74,999 16,436 679 915 487 Income $75,000 - $99,999 12,938 394 695 497 Income $100,000 - $149,999 14,347 427 742 221 Income $150,000 - $249,999 7,406 144 240
Income $250,000 - $499,999 1,419 9 17 31
Income $500,000 and more 317 1 4 10 $77,171 2009 Est. Average Family Household Income $82,707 $69,990 $72,535 $65,692 2009 Est. Median Family Household Income $67,903 $61,029 $64,397
2,906 2009 Est. Families by Poverty Status 82,186 2,708 4,172
Income At or Above Poverty Level: 1,238 Married-Couple Family, own children 36,700 1,054 1,677
626 Married-Couple Family, no own children 19,023 694 1,070 190 Male Householder, own children 3,670 146 220 65 Male Householder, no own children 1,918 78 104
329 Female Householder, own children 7,093 278 429 123 Female Householder, no own children 3,544 127 177
Income Below Poverty Level: 139 Married-Couple Family, own children 4,414 100 209 19 Married-Couple Family, no own children 717 34 29
0 Male Householder, own children 1,036 19 11
Male Householder, no own children 252 6 32 28 133 Female Householder, own children 3,453 167 198
Female Householder, no own children 367 6 15 15
2009 Est. Pop Age 16+ by Employment Status 288,162 8,964 14,438 10,376
Page A-12 June 30, 2010

0 In Armed Forces 213 2 0 5,948 Civilian - Employed 161,513 5,146 8,270
663 Civilian - Unemployed 13,907 391 731 3,765 Not in Labor Force 112,529 3,425 5,437 5,948 2009 Est. Civ Employed Pop 16+ Class of Worker 161,513 5,146 8,270 4,772 For-Profit Private Workers 122,503 4,046 6,444
223 Non-Profit Private Workers 6,947 194 328 451 Local Government Workers 13,343 389 641 133 State Government Workers 5,619 127 208
Federal Government Workers 2,562 84 173 109 260 Self-Emp Workers 10,008 306 455
0 Unpaid Family Workers 531 0 20 5,948 2009 Est. Civ Employed Pop 16+ by Occupation 161,513 5,146 8,270
483 Management, Business, and Financial Operations 18,967 644 778 734 Professional and Related Occupations 22,961 507 904 907 Service 23,708 894 1,425
1,378 Sales and Office 43,420 1,202 1,874
Farming, Fishing, and Forestry 1,615 50 137 130 693 Construction, Extraction and Maintenance 16,695 598 1,080
1,625 Production, Transportation and Material Moving 34,147 1,252 2,072 5,948 2009 Est. Pop 16+ by Occupation Classification 161,513 5,146 8,270 2,317 Blue Collar 50,841 1,849 3,151 2,552 White Collar 84,741 2,331 3,509
Service and Farm 25,931 966 1,610 1,079
5,781 2009 Est. Workers Age 16+, Transportation To Work 157,745 5,088 8,062 4,006 Drove Alone 112,280 3,483 5,735 1,082 Car Pooled 31,495 1,073 1,436
Public Transportation 4,308 97 142 111 214 Walked 2,766 201 302
Motorcycle 280 6 9 16
Re-envisioning Chino: Implementing the 2025 General Plan | Economic and Market Analysis Page A-13

165 Bicycle 1,202 104 227 54 Other Means 1,224 56 93
Worked at Home 4,190 68 117 133
5,648 2009 Est. Workers Age 16+ by Travel Time to Work 153,554 5,021 7,945 1,483 Less than 15 Minutes 32,113 1,391 2,098 1,882 15 - 29 Minutes 50,582 1,726 2,803
30 - 44 Minutes 30,853 950 1,445 1,016 468 45 - 59 Minutes 15,269 333 566 798 60 or more Minutes 24,737 621 1,034
31.79 2009 Est. Average Travel Time to Work in Minutes 34.59 30.19 30.79 3,576 2009 Est. Tenure of Occupied Housing Units 101,085 3,448 5,210 1,866 Owner Occupied 63,473 1,875 3,061 1,711 Renter Occupied 37,612 1,573 2,150
7.9 2009 Occ Housing Units, Avg Length of Residence 8.1 7.8 8.3 1,866 2009 Est. All Owner-Occupied Housing Values 63,473 1,875 3,061
Value Less than $20,000 642 2 14 24 4 Value $20,000 - $39,999 617 1 3 9 Value $40,000 - $59,999 824 0 33 0 Value $60,000 - $79,999 624 0 21 0 Value $80,000 - $99,999 329 5 14
43 Value $100,000 - $149,999 1,562 112 138 137 Value $150,000 - $199,999 3,267 203 283 714 Value $200,000 - $299,999 16,180 438 851 489 Value $300,000 - $399,999 19,782 822 1,137 224 Value $400,000 - $499,999 8,710 230 440
Value $500,000 - $749,999 8,422 51 114 200
Value $750,000 - $999,999 1,822 8 12 20 3 Value $1,000,000 or more 693 1 0
$300,612 2009 Est. Median All Owner-Occupied Housing Value $338,884 $321,385 $315,246 3,682 2009 Est. Housing Units by Units in Structure 104,490 3,553 5,375
304 1 Unit Attached 8,285 254 316
Page A-14 June 30, 2010

2,273 1 Unit Detached 67,566 1,890 3,312 90 2 Units 2,030 59 93
444 3 to 19 Units 13,000 600 624 162 20 to 49 Units 3,109 166 236 357 50 or More Units 5,970 567 656 52 Mobile Home or Trailer 4,414 16 139
0 Boat, RV, Van, etc. 116 0 0 3,682 2009 Est. Housing Units by Year Structure Built 104,490 3,553 5,375
649 Housing Units Built 1999 to 2009 10,261 586 894
Housing Unit Built 1995 to 1998 4,155 53 188 244 81 Housing Unit Built 1990 to 1994 6,733 105 157
812 Housing Unit Built 1980 to 1989 22,560 553 892 560 Housing Unit Built 1970 to 1979 20,732 894 1,338 450 Housing Unit Built 1960 to 1969 13,728 711 737 526 Housing Unit Built 1950 to 1959 16,013 436 770 219 Housing Unit Built 1940 to 1949 5,472 153 259
Housing Unit Built 1939 or Earlier 4,837 62 141 140 1979 2009 Est. Median Year Structure Built 1976 1975 1976
Source: Nielsen-Claritas, Inc., Demographic Snapshot Report, 2009.
Re-envisioning Chino: Implementing the 2025 General Plan | Economic and Market Analysis Page A-15

Table A-4. Inventory of Existing Shopping Centers, Five-Mile Trade Area
Center Name Year Open Address City, State Zip GLA Center Type Stores
Constr. Status
Dist.*
Dir.
Stater Bros Shopping Center 1975 1035-1105 W Philadelphia St Ontario, CA 91762 42100 Neighborhood 30 Existing 1.00 NE
Chino Valley Shopping Center 12490 Central Ave Chino, CA 91710 14392 Neighborhood 10 Existing 1.00 N
Mountain Village Plaza 1980 12801-12887 Mountain Ave Chino, CA 91710 84424 Neighborhood 27 Existing 1.00 E
Chino Shopping Center 1979 12130-12220 Central Ave Chino, CA 91710 86120 Neighborhood 11 Existing 1.00 N
Central Court Shopping Center 1985 5202-5250 Philadelphia St Chino, CA 91710 59666 Neighborhood 11 Existing 1.00 N
Gateway Village Shopping Center 2004 3560-3660 Grand Ave Chino Hills, CA 91709
96959 Neighborhood 30 Existing 2.00 SW
Payne Ranch Centre 1990 3255 Grand Ave Chino Hills, CA 91709
98877 Neighborhood 15 Existing 3.00 SW
Chino Hills Promenade 1983 14676-14688 Pipeline Ave Chino, CA 91710 54000 Neighborhood 17 Existing 3.00 SW
Rolling Ridge Plaza 1991 2959-2971 Chino Ave Chino Hills, CA 91709
85575 Neighborhood 9 Existing 3.00 W
Woodview Plaza 1991 4183-4197 Chino Hills Pky Chino Hills, CA 91709
73000 Neighborhood Unknown Existing 3.00 SW
Country Club Marketplace 1999 15970 Los Serranos Country Club Dr
Chino Hills, CA 91709
80409 Neighborhood 21 Existing 4.00 S
Central Plaza 1966 10254 Central Ave Montclair, CA 91763 25000 Neighborhood 20 Existing 3.00 N
Ramona Town Plaza 1990 4439 Mission Blvd Montclair, CA 91763 14244 Neighborhood 7 Existing 3.00 NW
Montclair Auto Center 1989 5436 Holt Blvd Montclair, CA 91763 24946 Neighborhood Unknown Existing 3.00 N
Garey/Arrow Shopping Center 1990 2218-2290 S Garey Ave Pomona, CA 91766 23105 Neighborhood 4 Existing 3.00 W
Stater Bros Shopping Center-South Pomona
1976 1555 S Garey Ave Pomona, CA 91766 34000 Neighborhood 7 Existing 4.00 NW
Montclair Center 9666-9678 Central Ave Montclair, CA 91763 30000 Neighborhood Unknown Existing 4.00 N
Ontario Village Shopping Center 2002 562-668 W Holt Blvd Ontario, CA 91762 97149 Neighborhood 28 Existing 4.00 NE
Rio Rancho Plaza 1999 2061-2085 S Garey Ave Pomona, CA 91766 47436 Neighborhood 12 Existing 4.00 W
Page A-16 June 30, 2010

Best Plaza 1977 8950 Central Ave Montclair, CA 91763 93311 Neighborhood 7 Existing 5.00 N
Montclair Promenade 1983 9015-9095 Central Ave Montclair, CA 91763 94370 Neighborhood 14 Existing 5.00 N
Montclair Shopping Center 1983 5055 Moreno St Montclair, CA 91763 30939 Neighborhood Unknown Existing 5.00 N
Country Fair Shopping Center 1974 11901-12059 Central Ave Chino, CA 91710 194670 Community 28 Existing 1.00 N
Chino Towne Center 1981 12155-12233 Central Ave Chino, CA 91710 116673 Community 30 Existing 1.00 N
Nec Central/ Walnut 1982 12415-12479 Central Ave Chino, CA 91710 142963 Community Unknown Existing 1.00 N
Chino Promenade 1991 5420-5480 Philadelphia St Chino, CA 91710 161717 Community Unknown Existing 1.00 N
Driftwood Village 1982 2238-2254 S Euclid Ave Ontario, CA 91762 106133 Community 9 Existing 2.00 NE
Euclid Plaza 2008 SWC Euclid Ave & Schaefer Ave Chino, CA 91710 107100 Community Unknown Existing 2.00 SE
Chino Hills Marketplace 1990 4200 Chino Hills Pky Chino, CA 91710 319999 Community 80 Existing 3.00 SW
Crossroads Entertainment Center 2006 3100 Chino Ave Chino Hills, CA 91709
109979 Community Unknown Existing 3.00 W
Pomona Market Place 1995 2707-2735 S Towne Ave Pomona, CA 91766 238624 Community Unknown Existing 3.00 W
Grove Plaza 1982 1151-1195 Walnut St Ontario, CA 91761 101756 Community Unknown Existing 3.00 E
Marketplace On Grove 2007 2200-2390 S Grove Ave Ontario, CA 91761 167703 Community Unknown Existing 4.00 E
Ontario Plaza 1982 920-1070 N Mountain Ave Ontario, CA 91762 131627 Community 27 Existing 4.00 N
Gordon Ranch Marketplace 1983 2545-2593 Chino Hills Pky Chino Hills, CA 91709
128082 Community 42 Existing 4.00 SW
Ontario Center 1964 1317-1337 N Mountain Ave Ontario, CA 91762 169508 Community 3 Existing 4.00 N
Montclair Town Center 1980 9710-9886 Central Ave Montclair, CA 91763 115000 Community Unknown Existing 4.00 N
Ontario Vineyard Pavilion 1999 Vineyard Ave Ontario, CA 91761 158769 Community Unknown Existing 4.00 E
Chino Hills Melange 2008 Highway 71 Chino Hills, CA 91709
253000 Community Unknown Existing 4.00 S
Pomona Ranch Plaza 1990 90 Rio Rancho Rd Pomona, CA 91766 240074 Community Unknown Existing 4.00 W
Vineyard Village 1988 2401-2421 S Vineyard Ave Ontario, CA 91761 126530 Community 30 Existing 5.00 E
Montclair Plaza East 1990 5391-5459 Moreno Dr Montclair, CA 91763 250739 Community Unknown Existing 5.00 N
Re-envisioning Chino: Implementing the 2025 General Plan | Economic and Market Analysis Page A-17

Upland Freeway Center 1986 1348-1438 W 7th St Upland, CA 91786 119031 Community 21 Existing 5.00 N
Clairemont Promenade 1981 865 S Indian Hill Blvd Claremont, CA 91711 161039 Community Unknown Existing 5.00 N
The Commons At Chino Hills 2008 4505-4785 Chino Hills Pky Chino, CA 91710 378593 Regional Unknown Existing 1.00 SW
Shoppes At Chino Hills 2008 Grand Ave @ Peyton Dr Chino Hills, CA 91709
397000 Regional Unknown Existing 3.00 SW
Phillips Village Center 1980 2-16 Village Loop Rd Pomona, CA 91766 367153 Regional 50 Existing 5.00 W
Chino Town Square Shopping 1987 5455-5537 Philadelphia St Chino, CA 91710 512765 Regional 55 Existing 1.00 N
Chino Spectrum Marketplace 1994 3808-3860 Grand Ave Chino, CA 91710 616436 Regional 69 Existing 2.00 SW
Chino Spectrum Towne Center 2002 3833-4093 Grand Ave Chino, CA 91710 781536 Super Regional
Unknown Existing 2.00 SW
Crossroads Marketplace 1998 12945-13225 Peyton Dr Chino Hills, CA 91709
543757 Regional 45 Existing 3.00 W
The District At Chino 2012 Euclid Ave Chino, CA 91708 978757 Super Regional
Unknown Proposed 5.00 SE
Montclair Plaza 1968 5060 Montclair Plaza Ln Montclair, CA 91763 1485407
Super Regional
199 Existing 5.00 N
Source: Nielsen-Claritas, Inc.
Page A-18 June 30, 2010
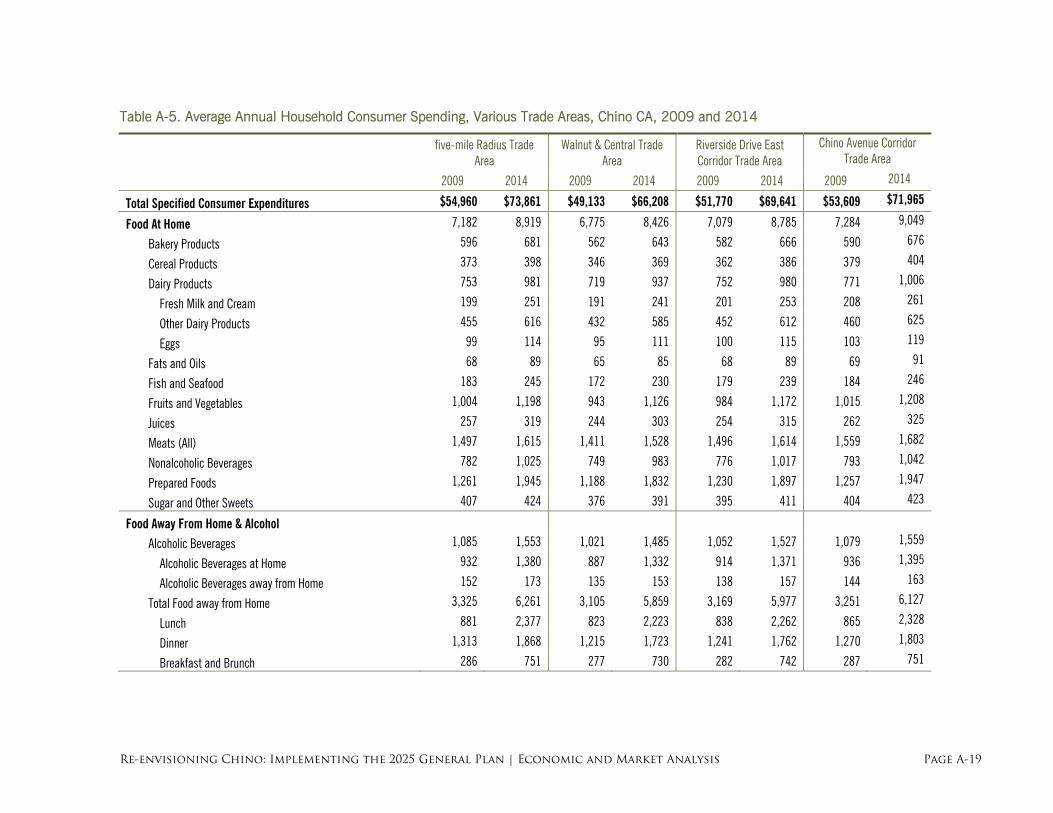
Table A-5. Average Annual Household Consumer Spending, Various Trade Areas, Chino CA, 2009 and 2014
five-mile Radius Trade Area
Walnut & Central Trade Area
Riverside Drive East Corridor Trade Area
Chino Avenue Corridor Trade Area
2009 2014 2009 2014 2009 2014 2009 2014
$71,965 Total Specified Consumer Expenditures $54,960 $73,861 $49,133 $66,208 $51,770 $69,641 $53,609
Food At Home 7,182 8,919 6,775 8,426 7,079 8,785 7,284 9,049
Bakery Products 596 681 562 643 582 666 590 676
Cereal Products 373 398 346 369 362 386 379 404
Dairy Products 753 981 719 937 752 980 771 1,006
Fresh Milk and Cream 199 251 191 241 201 253 208 261
Other Dairy Products 455 616 432 585 452 612 460 625
Eggs 99 114 95 111 100 115 103 119
Fats and Oils 68 89 65 85 68 89 69 91
Fish and Seafood 183 245 172 230 179 239 184 246
Fruits and Vegetables 1,004 1,198 943 1,126 984 1,172 1,015 1,208
Juices 257 319 244 303 254 315 262 325
Meats (All) 1,497 1,615 1,411 1,528 1,496 1,614 1,559 1,682
Nonalcoholic Beverages 782 1,025 749 983 776 1,017 793 1,042
Prepared Foods 1,261 1,945 1,188 1,832 1,230 1,897 1,257 1,947
Sugar and Other Sweets 407 424 376 391 395 411 404 423
Food Away From Home & Alcohol Alcoholic Beverages 1,085 1,553 1,021 1,485 1,052 1,527 1,079 1,559
Alcoholic Beverages at Home 932 1,380 887 1,332 914 1,371 936 1,395
Alcoholic Beverages away from Home 152 173 135 153 138 157 144 163
Total Food away from Home 3,325 6,261 3,105 5,859 3,169 5,977 3,251 6,127
Lunch 881 2,377 823 2,223 838 2,262 865 2,328
Dinner 1,313 1,868 1,215 1,723 1,241 1,762 1,270 1,803
Breakfast and Brunch 286 751 277 730 282 742 287 751
Re-envisioning Chino: Implementing the 2025 General Plan | Economic and Market Analysis Page A-19

Day Care, Education & Contributions All Day Care 524 549 450 477 498 525 547 570
Contributions (All) 1,345 1,834 998 1,377 1,071 1,487 1,187 1,630
Education 2,165 2,940 1,628 2,240 1,735 2,380 1,932 2,642
Room and Board 145 172 91 117 109 135 128 155
Tuition/School Supplies 2,019 2,767 1,536 2,123 1,626 2,246 1,804 2,487
Healthcare Medical Services 2,217 2,525 2,013 2,304 2,109 2,401 2,140 2,441
Prescription Drugs 2,198 3,375 2,098 3,207 2,226 3,394 2,205 3,366
Medical Supplies 219 248 199 226 213 241 219 248
Household Furnishings & Appliances Total Furniture 790 1,086 668 922 712 981 748 1,028
Bedroom Furniture 204 277 182 249 191 260 197 268
Living/Dining Room Furniture 359 458 302 385 322 411 340 432
Other Furniture 216 334 174 273 189 295 202 313
Total Household Textiles 591 729 508 624 539 663 554 682
Domestic Textiles 403 467 357 411 374 432 383 442
Window and Furniture Covers 187 263 151 213 165 231 171 240
Major Appliances 265 372 230 324 245 345 240 336
Misc Household Equipment 477 604 403 515 436 553 432 547
Small Appliance/Housewares 686 879 610 786 641 821 658 838
Housing Related & Personal Total Housing Expenses 4,306 5,892 4,014 5,492 4,137 5,653 4,154 5,678
Fuels and Utilities 2,214 3,026 2,032 2,769 2,118 2,891 2,098 2,870
Telephone Service 1,272 1,617 1,213 1,555 1,238 1,576 1,269 1,609
Household Repairs 490 631 408 519 447 571 423 539
Household Services 746 937 618 776 658 832 695 874
Housekeeping Supplies 412 429 388 404 406 422 416 434
Personal Expenses and Services 1,420 1,770 1,258 1,551 1,286 1,595 1,319 1,631
Page A-20 June 30, 2010

Personal Care & Smoking Products Personal Care Products and Services 1,221 1,374 1,128 1,265 1,170 1,314 1,203 1,352
Personal Care Services 523 680 467 605 491 638 504 658
Smoking Prods/Supplies 661 622 706 663 685 646 650 622
Pet Expenses 567 724 509 655 533 682 529 677
Sports & Entertainment Photographic Equipment 123 115 104 99 113 106 119 112
Reading Materials 406 340 352 293 366 305 361 305
Sports and Recreation 1,841 2,244 1,512 1,839 1,647 2,008 1,800 2,183
Sports Equipment 1,058 1,220 891 1,028 967 1,116 1,042 1,197
Travel 2,358 2,773 2,005 2,358 2,128 2,504 2,238 2,626
TV, Radio and Sound Equipment 969 1,260 883 1,144 920 1,193 967 1,253
Computers, Software & Accessories 624 775 554 694 585 729 614 763
Transportation & Auto Expenses Automotive Maintenance/Repair/Other 2,285 2,820 2,115 2,608 2,208 2,718 2,237 2,751
Gasoline 1,960 3,435 1,864 3,274 1,907 3,343 1,928 3,378
Diesel Fuel 15 20 14 18 15 20 15 20
Motor Oil 48 59 47 58 50 61 49 59
Vehicle Purchases & Leases 5,833 7,967 5,045 6,893 5,537 7,562 5,758 7,811
New Autos/Trucks/Vans 2,973 4,596 2,559 3,969 2,715 4,217 2,840 4,393
Used Vehicles 2,511 3,016 2,299 2,740 2,507 3,032 2,566 3,069
Boats and Recreational Vehicle Purchase 349 356 188 183 315 314 353 349
Rented Vehicles 252 300 193 232 206 248 225 268
Total Apparel 5,252 7,374 4,608 6,478 4,940 6,920 5,325 7,429
Women's Apparel 1,735 1,938 1,515 1,700 1,628 1,820 1,731 1,938
Men's Apparel 1,066 1,445 924 1,254 1,000 1,357 1,090 1,478
Girl's Apparel 438 515 384 457 417 494 459 542
Boy's Apparel 306 408 274 369 293 394 321 431
Infant's Apparel 160 160 146 148 157 159 168 170
Re-envisioning Chino: Implementing the 2025 General Plan | Economic and Market Analysis Page A-21

Footwear (excl. Infants) 702 788 629 706 672 755 724 815
Other Apparel Prods/Services 845 2,118 736 1,845 772 1,941 831 2,055
Source: Nielsen-Claritas, Inc., Consumer Spending Patterns, 2009.
Page A-22 June 30, 2010

Table A-6. Retail Market Potential, five-mile Radius Trade Area, Chino CA, 2009 and 2014
Store Type Consumer
Expenditures, 2009
Sales per sq. ft. Building Space Support 2009
(sq. ft.)
Building Space Support 2014
(sq. ft.)
Furniture and Home Furnishings Stores-442 Furniture Stores-4421 51,627,276 208.97 247,056 260,918
Home Furnishing Stores-4422 43,282,825 208.97 207,124 218,746
Electronics and Appliance Stores-443 Appliances, TVs, Electronics Stores-44311 85,645,503 394.43 217,137 229,321
63,741 Computer and Software Stores-44312 23,805,710 394.43 60,355 13,007 Camera and Photographic Equipment Stores-44313 4,857,945 394.43 12,316
Building Material, Garden Equip Stores -444 Building Material and Supply Dealers-4441
298,042
Home Centers-44411 171,477,212 607.63 282,207 16,303
Paint and Wallpaper Stores-44412 9,379,751 607.63 15,437
169,201
Hardware Stores-44413 36,179,285 225.82 160,211 339,123
Other Building Materials Dealers-44419 195,112,560 607.63 321,105
Lawn, Garden Equipment, Supplies Stores-4442 9,343
Outdoor Power Equipment Stores-44421 5,375,613 607.63 8,847
52,974
Nursery and Garden Centers-44422 30,478,128 607.63 50,159
Food and Beverage Stores-445 Grocery Stores-4451
872,290
Supermarkets, Grocery (Ex Conv) Stores-44511 565,223,754 684.34 825,945 56,880
Convenience Stores-44512 26,860,964 498.74 53,858
71,847 Specialty Food Stores-4452 18,459,992 271.35 68,029 68,127 Beer, Wine and Liquor Stores-4453 36,012,591 558.27 64,507
Health and Personal Care Stores-446 Pharmancies and Drug Stores-44611 191,113,639 432.69 441,682 466,466
27,440 Cosmetics, Beauty Supplies, Perfume Stores-44612 7,797,687 300.11 25,982 31,257 Optical Goods Stores-44613 10,755,146 363.39 29,596
Re-envisioning Chino: Implementing the 2025 General Plan | Economic and Market Analysis Page A-23

73,595 Other Health and Personal Care Stores-44619 14,451,154 207.38 69,685
Gasoline Stations-447 Gasoline Stations With Conv Stores-44711 370,786,082 973.62 380,832 402,201
29,209 Other Gasoline Stations-44719 124,451,673 4,499.75 27,657
Clothing and Clothing Accessories Stores-448 Clothing Stores-4481
40,048
Men's Clothing Stores-44811 11,153,264 294.12 37,920 199,978
Women's Clothing Stores-44812 44,741,480 236.29 189,354
47,916
Childrens, Infants Clothing Stores-44813 11,669,942 257.22 45,370 355,432
Family Clothing Stores-44814 96,771,709 287.54 336,548
21,261
Clothing Accessories Stores-44815 4,172,136 207.24 20,132 49,785
Other Clothing Stores-44819 11,652,400 247.19 47,140
Shoe Stores-4482 36,770,150 203.07 181,071 191,231
Jewelry, Luggage, Leather Goods Stores-4483 87,288
Jewelry Stores-44831 26,830,795 324.63 82,650
8,866
Luggage and Leather Goods Stores-44832 2,207,209 262.91 8,395
Sporting Goods, Hobby, Book, Music Stores-451 Sportng Goods, Hobby, Musical Inst Stores-4511
142,800
Sporting Goods Stores-45111 34,893,667 258.06 135,213 128,905
Hobby, Toys and Games Stores-45112 20,544,450 168.32 122,056
34,081
Sew/Needlework/Piece Goods Stores-45113 4,998,856 154.91 32,270 30,506
Musical Instrument and Supplies Stores-45114 6,940,273 240.27 28,885
Book, Periodical and Music Stores-4512
Book Stores and News Dealers-45121
66,268
- Book Stores-451211 18,036,700 287.45 62,747 2,123
- News Dealers and Newsstands-451212 907,068 451.15 2,011
30,422
Prerecorded Tapes, CDs, Record Stores-45122 9,851,474 342.00 28,805
General Merchandise Stores-452 Department Stores Excl Leased Depts-4521 318,240,900 297.84 1,068,489 1,128,443
Other General Merchandise Stores-4529 326,406,590 439.26 743,090 784,786
Page A-24 June 30, 2010

Miscellaneous Store Retailers-453 Office Supplies, Stationery, Gift Stores-4532
Office Supplies and Stationery Stores-45321 24,057,875 240.39 100,080 105,695
111,577
Gift, Novelty and Souvenir Stores-45322 19,039,677 180.22 105,649 45,132 Used Merchandise Stores-4533 10,439,767 244.30 42,734
Other Miscellaneous Store Retailers-4539 34,316,464 244.30 140,471 148,353
Foodservice and Drinking Places-722 Full-Service Restaurants-7221 211,255,809 387.57 545,083 575,669
Limited-Service Eating Places-7222 199,638,074 291.59 684,643 723,059
Drinking Places -Alcoholic Beverages-7224 21,642,779 189.26 114,358 120,774
8,950,429 TOTAL $3,530,313,998
8,474,893
Source: The Planning Center, 2010, using data from Nielsen-Claritas, Inc., and the Urban Land Institute.
Re-envisioning Chino: Implementing the 2025 General Plan | Economic and Market Analysis Page A-25

Table A-7. Development Pro Forma – General Assumptions
Hard Cost Commercial construction cost $80.00 per sq. ft. Demolition cost $5.00 per bldg. sq. ft. Open space/landscaping cost $2.50 per sq. ft. Office construction cost $105.00 per sq. ft. Parking construction cost $10.00 per sq. ft. Residential podium construction cost $250.00 per sq. ft. Residential SFA construction cost $90.00 per sq. ft. Residential SFD construction cost $60.00 per sq. ft. Residential wrap construction cost $200.00 per sq. ft. Site development cost $5.00 per sq. ft. Cost Factors Contingency 5.0% of hard costs Developer fee 5.0% of hard costs Indirect land cost 3.0% of estimated land value Selling costs 3.0% of sales value Soft cost 15.0% of hard costs Rental management fee 4.0% of effective gross income Growth rate - expenses 3.0% Revenue
Retail lease rate $28.20 per sq. ft. per year Retail operations and vacancy allowance 12.5% Office lease rate $21.00 per sq. ft. per year Office operations and vacancy allowance 12.5% Residential rental operations and vacancy allowance 15.0% Growth rate - revenues 4.0% Capitalization rate 8.0% Financing
Financing portion for land 50.0% Financing portion of improvement 100.0% Construction loan interest rate 8.0% General interest rate 10.0% Acceleration rate 20.0% Construction loan fee rate 3 basis points Sales commission 5.0%
Page A-26 June 30, 2010

Discount rate - unleveraged 10.0% annual rate Discount rate - leveraged 15.0% annual rate Commercial Loan-to-Cost ratio 75.0% Commercial loan DSCR 1.15 Debt service coverage ratio Commercial permanent loan term 25
Commercial permanent loan rate 6.5% Commercial permanent loan fee 1 basis points Commercial permanent loan LTV 75.0% Taxes
Depreciation - residential buildings 27.5 years Depreciation - non-residential buildings 39.0 years Income tax 35.0% Capital gains tax 15.0% Tax on depreciation 25.0% Growth rate - property value 2.0%
Source: The Planning Center, 2010.
Re-envisioning Chino: Implementing the 2025 General Plan | Economic and Market Analysis Page A-27

Table A-8. Site 1A: Development Costs
Grand Total For-sale For-rent
Land acquisition $13,933,453 $12,519,914 $1,413,539
Construction cost $11,199,667 $9,004,665 $2,195,002
- site development costs $1,937,740 $1,741,158 $196,582
- direct construction costs $9,261,927 $7,263,508 $1,998,420
Construction Interest $1,120,391 $950,878 $169,514
Const. loan fee $544,992 $457,939 $87,053
Total direct costs $26,798,503 $22,933,396 $3,865,107
Loan amount $19,373,838 $16,215,500 $3,158,338
Total equity required $7,424,665 $6,717,896 $706,769
Percent financed 72.3% 70.7% 81.7%
Amount financed - land $6,966,727 $6,259,957 $706,769
Amount financed - construction $11,199,667 $9,004,665 $2,195,002
Total amount financed $18,166,394 $15,264,622 $2,901,771
Construction loan fee $544,992 $457,939 $87,053
Total carried interest $1,120,391 $950,878 $169,514
Page A-28 June 30, 2010

Table A-9. Site 1A: After-Tax Cash Flow, Rental Project
Year 0 1 2 3 4 5 6
Net Operating Income
$147,243 $217,760 $227,226 $237,085 $247,355 $74,737
Debt Service
($136,086) ($181,448) ($181,448) ($181,448) ($181,448) ($45,362)
Cash Flow After Debt Service
$11,157 $36,311 $45,777 $55,637 $65,907 $29,375
Depreciation
$56,282 $56,282 $56,282 $56,282 $56,282
Interest Payments
($108,581) ($142,631) ($140,032) ($137,258) ($134,298) ($33,089)
Taxable Income
($17,620) $18,846 $30,912 $43,546 $56,775 $41,648
Taxes @ 35%
$6,596 $10,819 $15,241 $19,871 $14,577
Cash Flow After Debt Service and Taxes
$11,157 $29,715 $34,958 $40,396 $46,036 $14,798
Equity Investment ($793,822) ($918,924)
Net Sale Proceeds
$748,496
Net Cash Flow After Taxes and Debt Service ($793,822) ($907,767) $29,715 $34,958 $40,396 $46,036 $763,294
Re-envisioning Chino: Implementing the 2025 General Plan | Economic and Market Analysis Page A-29

Table A-10. Site 1A: Final Property Sales Proceeds, Rental Project
Capital Gain Calculation
Sales Price (after Sales Expenses) $3,099,858
Less: Purchase Price $1,413,539
Profit $1,686,319
Capital Gains Tax @ 15% $252,948
Tax on Depreciation
Accumulated Depreciation $281,411
Taxes on Accumulated Depreciation @ 25% $70,353
Net Sales Proceeds Calculations
Sales Price (after Sales Expenses) $3,099,858
Less: Cap Gains Tax $252,948
Less: Taxes on Accumulated Depreciation $70,353
Less: Outstanding Mortgage Balance $2,028,062
Net Sales Proceeds $748,496
Page A-30 June 30, 2010

Table A-11. Site 1A: Cash Flow, For-sale Project
Year 0 1 2
Total inflow $6,259,957 $7,188,788 $29,664,629
Total outflow $12,977,853 $7,364,070 $18,031,377
Net cash flow ($6,717,896) ($175,282) $11,633,252
Table A-12. Site 1A: Total Project Cash Flow and Return Analysis
Year 0 1 2 3 4 5 6
Total inflow $6,259,957 $7,199,946 $29,694,344 $34,958 $40,396 $46,036 $763,294
Total outflow -$13,771,675 -$8,282,994 -$18,031,377 $0 $0 $0 $0
Net cash flow -$7,511,718 -$1,083,049 $11,662,967 $34,958 $40,396 $46,036 $763,294
NPV Inflow $35,372,933
NPV Outflow -$34,608,591
NPV Total $764,342
Project IRR 20%
Re-envisioning Chino: Implementing the 2025 General Plan | Economic and Market Analysis Page A-31

Table A-13. Site 1B: Development Costs
Grand Total For-sale For-rent
Land acquisition $14,046,582 $2,633,734 $11,412,848
Construction cost $14,087,653 $2,492,330 $11,595,323
- site development costs $1,825,775 $342,333 $1,483,442
- direct construction costs $12,261,878 $2,149,997 $10,111,881
Construction Interest $1,363,762 $240,487 $1,123,276
Const. loan fee $633,328 $114,276 $519,052
Total direct costs $30,131,326 $5,480,826 $24,650,500
Loan amount $22,993,759 $4,049,683 $18,944,076
Total equity required $7,137,567 $1,431,143 $5,706,424
Percent financed 76.3% 73.9% 76.9%
Amount financed - land $7,023,291 $1,316,867 $5,706,424
Amount financed - construction $14,087,653 $2,492,330 $11,595,323
Total amount financed $21,110,944 $3,809,197 $17,301,747
Construction loan fee $633,328 $114,276 $519,052
Total carried interest $1,363,762 $240,487 $1,123,276
Page A-32 June 30, 2010

Table A-14. Site 1B: After-Tax Cash Flow, Rental Project
Year 0 1 2 3 4 5 6
Net Operating Income
$2,201,256 $2,588,214 $2,696,572 $2,809,362 $2,926,762 $827,594
Debt Service
($1,151,206) ($1,534,941) ($1,534,941) ($1,534,941) ($1,534,941) ($383,735)
Cash Flow After Debt Service
$1,050,050 $1,053,272 $1,161,631 $1,274,421 $1,391,821 $443,859
Depreciation
$393,168 $393,168 $393,168 $393,168 $393,168
Interest Payments
($918,528) ($1,206,573) ($1,184,581) ($1,161,117) ($1,136,081) ($279,914)
Taxable Income
$889,560 $988,473 $1,118,823 $1,255,077 $1,397,512 $547,680
Taxes @ 35%
$311,346 $345,965 $391,588 $439,277 $489,129 $191,688
Cash Flow After Debt Service and Taxes
$738,704 $707,307 $770,043 $835,144 $902,691 $252,171
Equity Investment ($6,225,477)
Net Sale Proceeds
$15,173,865
Net Cash Flow After Taxes and Debt Service ($6,225,477) $738,704 $707,307 $770,043 $835,144 $902,691 $15,426,036
Re-envisioning Chino: Implementing the 2025 General Plan | Economic and Market Analysis Page A-33
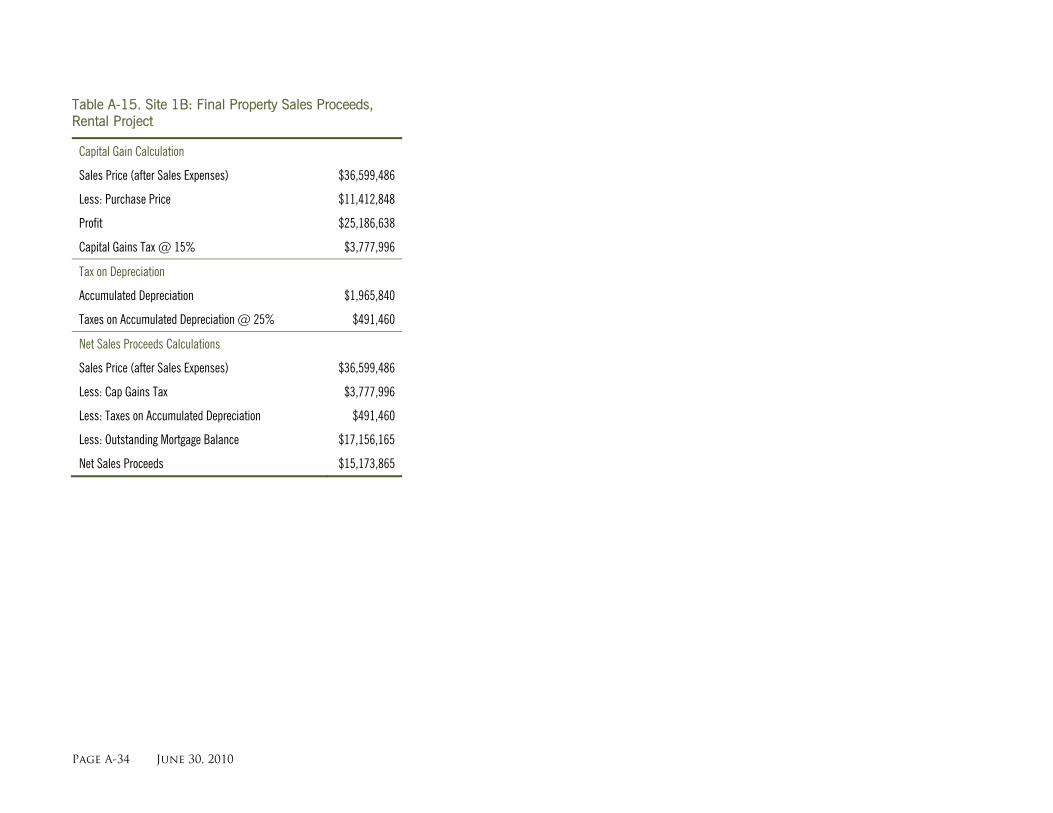
Table A-15. Site 1B: Final Property Sales Proceeds, Rental Project
Capital Gain Calculation
Sales Price (after Sales Expenses) $36,599,486
Less: Purchase Price $11,412,848
Profit $25,186,638
Capital Gains Tax @ 15% $3,777,996
Tax on Depreciation
Accumulated Depreciation $1,965,840
Taxes on Accumulated Depreciation @ 25% $491,460
Net Sales Proceeds Calculations
Sales Price (after Sales Expenses) $36,599,486
Less: Cap Gains Tax $3,777,996
Less: Taxes on Accumulated Depreciation $491,460
Less: Outstanding Mortgage Balance $17,156,165
Net Sales Proceeds $15,173,865
Page A-34 June 30, 2010

Table A-16. Site 1B: Cash Flow, For-sale Project
Year 0 1 2
Total inflow $1,316,867 $1,954,831 $4,887,098
Total outflow $2,748,010 $1,994,574 $4,587,183
Net cash flow ($1,431,143) ($39,744) $299,915
Table A-17. Site 1B: Total Project Cash Flow and Return Analysis
Year 0 1 2 3 4 5 6
Total inflow $1,316,867 $2,693,534 $5,594,405 $770,043 $835,144 $902,691 $15,426,036
Total outflow ($8,973,487) ($1,994,574) ($4,587,183) $0 $0 $0 $0
Net cash flow ($7,656,620) $698,960 $1,007,222 $770,043 $835,144 $902,691 $15,426,036
NPV Inflow $15,990,955
NPV Outflow ($14,176,468)
NPV Total $1,814,487
Project IRR 20%
Re-envisioning Chino: Implementing the 2025 General Plan | Economic and Market Analysis Page A-35

Table A-18. Site 2: Development Costs
Grand Total For-sale For-rent
Land acquisition $12,338,258 $9,870,606 $2,467,652
Construction cost $6,684,291 $4,543,437 $2,140,853
- site development costs $1,447,220 $1,157,776 $289,444
- direct construction costs $5,237,071 $3,385,661 $1,851,409
Construction Interest $730,396 $556,044 $174,351
Const. loan fee $385,603 $284,362 $101,240
Total direct costs $20,138,547 $15,254,451 $4,884,096
Loan amount $13,685,056 $10,034,785 $3,650,271
Total equity required $6,453,491 $5,219,665 $1,233,826
Percent financed 68.0% 65.8% 74.7%
Amount financed – land $6,169,129 $4,935,303 $1,233,826
Amount financed – construction $6,684,291 $4,543,437 $2,140,853
Total amount financed $12,853,420 $9,478,741 $3,374,679
Construction loan fee $385,603 $284,362 $101,240
Total carried interest $730,396 $556,044 $174,351
Page A-36 June 30, 2010

Table A-19. Site 2: After-Tax Cash Flow, Rental Project
Year 0 1 2 3 4 5 6
Net Operating Income
$229,684 $297,482 $310,351 $323,754 $337,713 $0
Debt Service
($197,395) ($197,395) ($197,395) ($197,395) ($197,395) $0
Cash Flow After Debt Service
$32,289 $100,088 $112,957 $126,360 $140,319 $0
Depreciation
$54,894 $54,894 $54,894 $54,894 $54,894
Interest Payments
($157,170) ($154,476) ($151,602) ($148,535) ($145,263) $0
Taxable Income
$17,620 $88,112 $103,856 $120,325 $137,557 $0
Taxes @ 35%
$6,167 $30,839 $36,349 $42,114 $48,145 $0
Cash Flow After Debt Service and Taxes
$26,122 $69,248 $76,607 $84,246 $92,174 $0
Equity Investment ($1,335,066) $0
Net Sale Proceeds
$1,650,765
Net Cash Flow After Taxes and Debt Service ($1,335,066) $26,122 $69,248 $76,607 $84,246 $92,174 $1,650,765
Re-envisioning Chino: Implementing the 2025 General Plan | Economic and Market Analysis Page A-37

Table A-20. Site 2: Final Property Sales Proceeds, Rental Project
Capital Gain Calculation
Sales Price (after Sales Expenses) $4,182,977
Less: Purchase Price $2,467,652
Profit $1,715,325
Capital Gains Tax @ 15% $257,299
Tax on Depreciation
Accumulated Depreciation $274,468
Taxes on Accumulated Depreciation @ 25% $68,617
Net Sales Proceeds Calculations
Sales Price (after Sales Expenses) $4,182,977
Less: Cap Gains Tax $257,299
Less: Taxes on Accumulated Depreciation $68,617
Less: Outstanding Mortgage Balance $2,206,296
Net Sales Proceeds $1,650,765
Page A-38 June 30, 2010

Table A-21. Site 2: Cash Flow, For-sale Project
Year 0 1 2
Total inflow $4,935,303 $10,729,703 $12,372,530
Total outflow $10,154,969 $10,859,682 $3,848,520
Net cash flow ($5,219,665) ($129,980) $8,524,010
Table A-22. Site 2: Total Project Cash Flow and Return Analysis
Year 0 1 2 3 4 5 6
Total inflow $4,935,303 $10,755,825 $12,441,778 $76,607 $84,246 $92,174 $1,650,765
Total outflow ($11,490,035) ($10,859,682) ($3,848,520) $0 $0 $0 $0
Net cash flow ($6,554,732) ($103,858) $8,593,258 $76,607 $84,246 $92,174 $1,650,765
NPV Inflow $24,554,003
NPV Outflow ($23,843,271)
NPV Total $710,731
Project IRR 20%
Re-envisioning Chino: Implementing the 2025 General Plan | Economic and Market Analysis Page A-39

Table A-23. Site 3: Development Costs
Grand Total
Land acquisition $13,980,617
Construction cost $3,238,419
- site development costs $1,144,050
- direct construction costs $2,094,369
Construction Interest $745,738
Const. loan fee $306,862
Total direct costs $18,271,635
Loan amount $10,974,465
Total equity required $7,297,170
Percent financed 60.1%
Amount financed – land $6,990,308
Amount financed – construction $3,238,419
Total amount financed $10,228,728
Construction loan fee $306,862
Total carried interest $745,738
Page A-40 June 30, 2010

Table A-24. Site 3: Total Project Cash Flow and Return Analysis
Year 0 1 2
Total inflow $6,990,308 $8,240,607 $16,673,960
Total outflow ($14,287,478) ($8,401,744) ($5,972,277)
Net cash flow ($7,297,170) ($161,137) $10,701,683
NPV Inflow $26,763,963
NPV Outflow ($26,109,243)
NPV Total $654,720
Project IRR 20%
Re-envisioning Chino: Implementing the 2025 General Plan | Economic and Market Analysis Page A-41
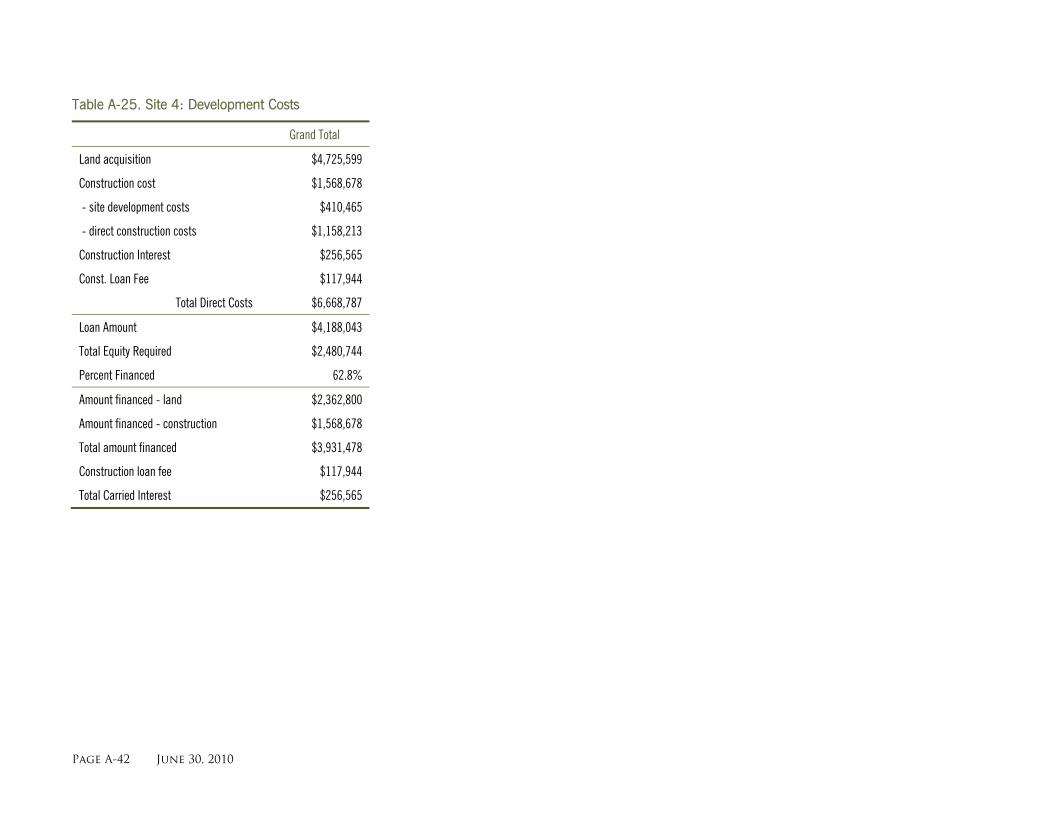
Table A-25. Site 4: Development Costs
Grand Total
Land acquisition $4,725,599
Construction cost $1,568,678
- site development costs $410,465
- direct construction costs $1,158,213
Construction Interest $256,565
Const. Loan Fee $117,944
Total Direct Costs $6,668,787
Loan Amount $4,188,043
Total Equity Required $2,480,744
Percent Financed 62.8%
Amount financed - land $2,362,800
Amount financed - construction $1,568,678
Total amount financed $3,931,478
Construction loan fee $117,944
Total Carried Interest $256,565
Page A-42 June 30, 2010

Table A-26. Site 4: Total Project Cash Flow and Return Analysis
Year 0 1 2
Total inflow $2,362,800 $4,178,718 $5,220,081
Total outflow ($4,843,544) ($4,236,424) ($1,578,002)
Net cash flow ($2,480,744) ($57,706) $3,642,078
NPV Inflow $9,943,599
NPV Outflow ($9,720,587)
NPV Total $223,012
Project IRR 20%
Re-envisioning Chino: Implementing the 2025 General Plan | Economic and Market Analysis Page A-43

Table A-27. Site 5: Development Costs
Grand Total
Land acquisition $4,204,765
Construction cost $4,948,163
- site development costs $1,212,870
- direct construction costs $3,735,293
Construction Interest $294,663
Const. Loan Fee $211,516
Total Direct Costs $9,659,108
Loan Amount $7,345,209
Total Equity Required $2,313,899
Percent Financed 76.0%
Amount financed - land $2,102,383
Amount financed - construction $4,948,163
Total amount financed $7,050,546
Construction loan fee $211,516
Total Carried Interest $294,663
Page A-44 June 30, 2010

Table A-28. Site 5: Total Project Cash Flow and Return Analysis
Year 0 1 2
Total inflow $2,102,383 $12,930,595 $2,660,810
Total outflow ($4,416,282) ($12,371,226) $0
Net cash flow ($2,313,899) $559,368 $2,660,810
NPV Inflow $15,358,333
NPV Outflow ($15,173,870)
NPV Total $184,463
Project IRR 20%
Re-envisioning Chino: Implementing the 2025 General Plan | Economic and Market Analysis Page A-45

Page A-46 June 30, 2010
