re-cap of the us stock market action for the week ending 1 april 2010
DESCRIPTION
Re-cap of the US Stock Market Action for the Week ending 1 April 2010TRANSCRIPT

The Red Roadmaster’s US Market Monthly Re-cap + Stock Talk ™
3 April 2010 Date Line: Hong Kong (SAR) China
You can now follow us on Twitter please go to http://twitter.com/EbelingHefferna and join in.
Red’s Bull Alert: Energy, materials and major manufacturers led the DJIA and S&P 500's gains as Thursday's data suggested improving Global demand for commodities, as the DJIA targets 11,000 now.
Re-cap of the US Stock Market Action for the Week ending 1 April 2010
DJIA, S&P 500 rise; RIM curbs NAS on Thursday
The US stock market was closed Friday, and the Jobs report augured some uncertainty, as many market players squared their bets, causing some selling and, in turn, the afternoon slide, which was heightened by the light trade, the NAS made the sharpest slide falling from a 1% gainer all the way into the Red. .A late flurry of buying helped stocks into the close, but it was unable to return to the improved 52 week highs that it set in the early part of the session, it still finished the week on a strong note with broad based gains, as all 10 major sectors finished in the Green.
On the Day: The DJIA rose 70.44 pts, or 0.65%, to close at 10,927.07, the S&P 500 gained 8.67 pts, or 0.74%, close at 1,178.10, and the leading NAS lagged, tallying up a + 4.62 pts, or 0.19%, to end the session at 2,402.58.
On the Week: The DJIA rose 0.7%, the S&P 500 gained 1%, and the NAS moved up 0.3%
Start of Q-2: Q-2 got off to a good start for the US stock market, with both the DJIA and the S&P 500 closing on 18-month highs. The DJIA rose 70.44 pts, or 0.65%, to close at 10,927.07, the S&P 500 gained 8.67 pts, or 0.74%, close at 1,178.10, and the leading NAS lagged, tallying up a + 4.62 pts, or 0.19%, to end the session at 2,402.58.
The DJIA and the S&P 500 rose Thursday on upbeat economic data, but the NAS fell following downbeat results for RIMM. Anxiety about Friday's March payrolls report held gains down.
An index of US manufacturing activity in March rose to its highest level in over 5-1/2 years, the Institute for Supply Management said. Earlier, a US Labor Department report showed initial weekly claims for jobless benefits fell more than expected. Overseas manufacturing reports, including one from China, also bolstered sentiment.
1

Energy, materials and major manufacturers led the Dow's and the S&P 500's gains as Thursday's data suggested improving Global demand for commodities. The S&P materials index rose 1.8%.
In the energy sector, US Crude Oil futures rose to an 18-month intra-day high above US$85 bbl after the data offered signs the US economy is improving.
The spike in Crude Oil prices propelled shares of energy companies higher, with Exxon Mobil up 0.9% at US$67.61, and rival Chevron Corp up 1.1% at US$76.69. The S&P energy index gained 1.6%.
Other standouts on the commodities front were mining and steel companies. Shares of gold producer Newmont Mining climbed 3.9% to US$52.91 as US Gold futures climbed to a 2 week high.
Materials gained the most made as they rose 1.8%. Support for the sector was helped by a 0.5% loss in the US Dollar Index.
The USD's decline lifted commodity prices, which hiked the CRB Commodity Index to a 1.1% gain.
Natural gas was the biggest gainer among commodities; contract prices had been down roughly 1% in the morning, but news of a smaller than expected inventory build sent prices up 5.7% to US$4.09 per MMBtu.
Advancing Sectors: Materials (+1.8%), Energy (+1.6%), Utilities (+1.3%), Telecom (+1.0%), Financials (+0.9%), Consumer Discretionary (+0.7%), Industrials (+0.6%), Health Care (+0.6%), Consumer Staples (+0.5%), Tech (+0.1%)
Declining Sectors: (None)
Volume and Breadth: About 7.78B/shrs traded on the NYSE, the AMEX and the NAS, below last year's estimated daily average of 9.65B/shrs. Advancers beat decliners on the NYSE by 3 to 1, and on the NAS, about 5 stocks rose for each 4 stocks that fell.
Market Indexes Technical Analysis
Date Symbol Price Technical Analysis Support Resistance
Apr-01-2010 QQQQ 48.16 Bullish (0.33) 46.66 48.19
Apr-01-2010 DIA 109.28 Neutral (0.16) 108.85 110.05
Apr-01-2010 SPY 117.8 Neutral (0.17) 117.23 118.95
Stocks to Watch on Monday
Boston Scientific Corporation (BSX), Caterpillar, Inc. (CAT), The Walt Disney Company (DIS), Estée Lauder Company (EL), and United States Steel Corporation (X).
2

Red Alert: The DJIA is nearing 11,000 and S&P 500 is approaching 1,200, these are two technically important milestones, and as such it will be interesting to see if stocks can cut through those levels, or if they stall, some analysts think the biggest problem facing the market is that it is not yet clear whether or not average investors are ever going to buy into the Tally. So stocks could run out of steam if a decent chunk of money remains in bond funds and other less risky investments. It is my belief that there is plenty of liquidity in the market to fuel it up and through the resistance in here. Further, it is worth noting that the VIX is currently not much lower now than what it was in the Summer of 2008.
Crude Oil and Gold Focus Report
Crude Oil rallied to a 17 month high of US$84.7 in Thursday's NY session as economic data show that the World economy is on the road to solid recovery
The front-month WTI contract extended its gains on Day One of Q-2 after surging +5.5% in Q-1 Y 2010.
PMIs in China, India and Europe beat market expectations. In China, manufacturing PMI advanced to a seasonally adjusted 55.1 in March from 52 only a month ago.
The stronger than expected reading indicates the manufacturing sector in China, the World's 3rd biggest economy continues expansion.
In India, PMI fell to 57.8 from 58.5 in February. A reading above 50 indicates expansions and the index suggests India's manufacturing activities have been growing for 12 months.
In the 16 nation EuroZone, similar reading improved to 56.6 in March from 54.2 in February. The market had anticipated an increase to 56.3.
The market focus Friday is US' ISM manufacturing index which probably expanded to 57 in March from 56.5 in the past month.
The Gold price is advancing in tandem with energy. The benchmark contract rose for a 2nd day to US$1125 oz. Other members in the Precious Metal Complex rose more strongly as they have more applications in industrial activities.
Silver rose +1.85% to US$17.86. For PGMS, platinum gained +1.28% to US$1667.9, and Palladium rallied +2.82% to US$493.5.
Gold is mainly used in jewelry and for investment purposed. Industrial application only takes up around 10% of the production annually, but industrial use represents over 70% in Silver, as investment only takes up about 5%.
In PGM, industrial applications, mainly as autocatalytic converters, take up over 50% in both Platinum and Palladium. Shares in investment demand were only single digit although this should increase this year I believe. Stay tuned….Paul A. Ebeling, Jnr. www.livetradingnews.com
3

Boston Scientific Corporation (BSX) Up-date 1 Last Look: April 20, 2009
April 3, 2010
Paul A. Ebeling, Jnr. Analyst
Today let’s look at Boston Scientific Corporation (BSX), prolific medical device maker, from a Technical POV. The overall analysis after Thursday’s (April 1) market action is Neutral: in the near term Neutral, mid-term Bearish, and long term Bearish. The recent Candle Stick analysis is: Very Bearish
**Chart by: http://www.stockta.com
Latest News and Opinion: Boston Sci's ICD recall may result in asset sale
http://www.reuters.com/article/idCNN0113666920100402?rpc=44
4
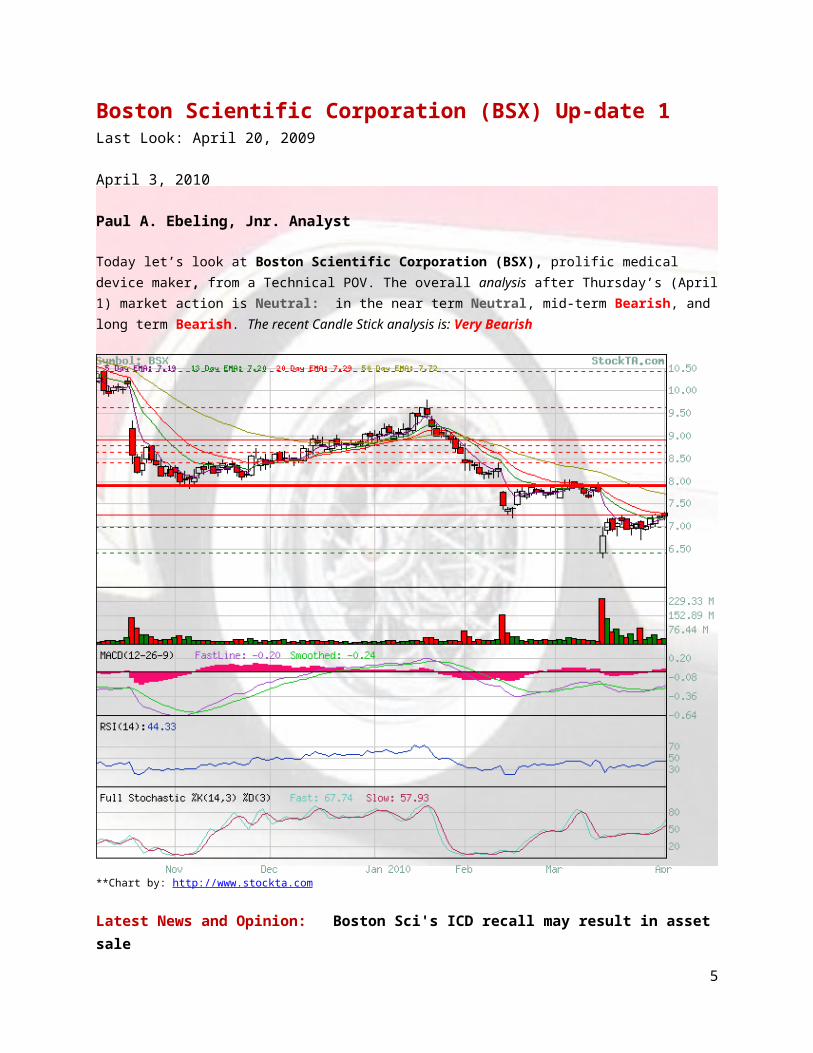
Thursday’s Market Action Close 7.23 +.01 Volume 27,779,700/shrs
There is a Bearish Harami on March 31 and three Gaps open down between October 20, 2009 and March 15, 2010 @ 10.09/6.98; the near term resistance is 7.26 support at 6.99, and the 50 day (EMA) exponential moving average is 7.72.
This is Boston Scientific Corporation (BSX): The Company makes medical supplies used in minimally invasive surgical procedures. Its devices are used to diagnose and treat conditions in a variety of medical fields, including cardiology (cardiovascular group), gynecology and urology (endosurgery group), pain management (neuromodulation), and heart failure and arrhythmia (cardiac rhythm management group). Its 13,000-plus products, made in about 25 factories, include defibrillators, catheters, coronary and urethral stents, pacemakers, biopsy forceps and needles, and urethral slings. Boston Scientific markets its wares in some 45 countries worldwide, primarily through its own direct sales staff.Competitive Landscape
Demand is driven by population demographics and advances in medical knowledge and technology. The profitability of individual companies depends on the ability to develop superior products. Large companies have economies of scale in manufacturing and R&D. Small companies can compete successfully by specializing in a particular market segment, or through technical innovation. Annual revenue per employee is about US$250,000.Medical Supplies and Devices Industry Forecast
The output of US medical instruments and supplies is forecast to grow at an annual compounded rate of 4% between 2008 and 2013. Data Sourced: December 2009
Boston Scientific Corporation (HQ)
Peter Michael Nicholas Jr. Co-Founder and Chairman
One Boston Scientific PlaceNatick, MA 01760-1537United States Phone: 508-650-8000Fax: 508-650-8923
http://www.bostonscientific.com
5

Caterpillar, Inc. (CAT) Up-date 20 Last Look: February 10, 2010
April 3, 2010
Paul A. Ebeling, Jnr. Analyst
Let’s have a look at Caterpillar, Inc. (CAT), the World's #1 maker of earthmoving machinery and a leading supplier of agri. equipment, from a Technical POV. The overall indications, after Thursday’s (April 1) market action, are Bullish: in the near term Very Bullish, mid-term Neutral, and long term Neutral. The recent Candle Stick analysis is: Bearish
**Chart by: http://www.stockta.com
Latest News and Opinion: Art Cashin: Why Bulls Continue to Lead Markets
http://www.cnbc.com/id/36132869?__source=yahoo|headline|quote|text|&par=yahoo
6

Thursday’s Market Action Close 63.99 + 1.41 Volume 7,829,800/shrs
There a Bearish Harami on March 3 and two Gaps open up between February 9 and March 1, 2010 at 52.15/57.25, the near term resistance 64.13 support at 35.15, and the 50 day (EMA) exponential moving average is 59.16.
This is Caterpillar, Inc (CAT): Caterpillar is the world's #1 maker of earthmoving machinery and a leading supplier of agricultural equipment. It makes construction, mining, and logging machinery; diesel and natural gas engines; industrial gas turbines; and electrical power-generation systems. Caterpillar has plants worldwide and sells its equipment globally via a network of 3,600 locations in 180 countries, offering rental services through more than 1,600 outlets worldwide, and it provides financing and insurance for its dealers and customers. Cat Power Ventures invests in power projects that use Caterpillar power generation equipment, and Caterpillar Logistics Services offers supply chain services
Industries Where Caterpillar Competes
Construction, Mining & Other Heavy Equipment ManufacturingAgricultural Machinery ManufacturingFinancial ServicesInsuranceTransportation Services
Caterpillar, Inc. (HQ)
Chairman and CEO James W. (Jim) Owens
100 NE Adams St. Peoria, IL 61629United States Phone: 309-675-1000Fax: 309-675-1182
http://www.cat.com
Caterpillar Subsidiaries
Caterpillar Logistics Services, Inc.Mitsubishi Caterpillar Forklift America Inc.Progress Rail Services Corporation
7

The Walt Disney Company (DIS) Up-date 9 Last Look: February 8, 2010
April 3, 2010
Paul A. Ebeling, Jnr. Analyst
Today let’s look at The Walt Disney Company (DIS), Mickey’s World, from a Technical POV. The overall indications, after Thursday’s (April 1) market action, are Very Bullish: in the near term Bullish, mid-term Very Bullish, and long term Very Bullish. The recent Candle Stick analysis is: Bearish
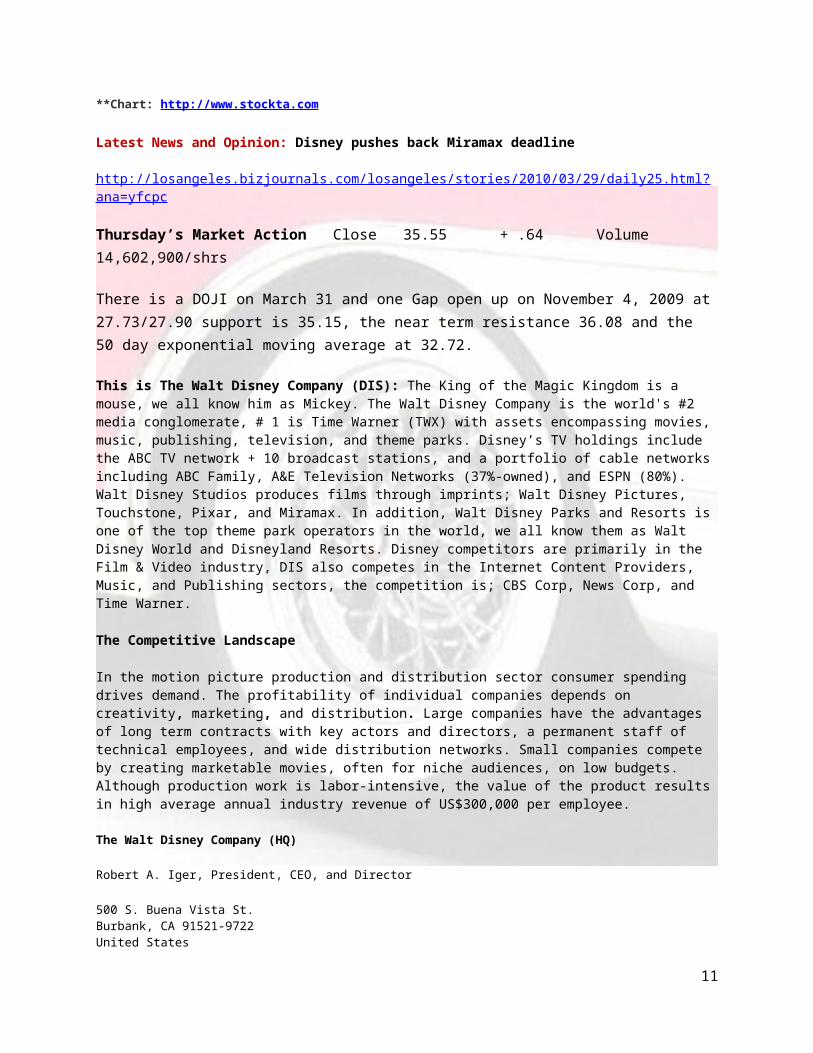
**Chart: http://www.stockta.com
Latest News and Opinion: Disney pushes back Miramax deadline
http://losangeles.bizjournals.com/losangeles/stories/2010/03/29/daily25.html?ana=yfcpc
8

Thursday’s Market Action Close 35.55 + .64 Volume 14,602,900/shrs
There is a DOJI on March 31 and one Gap open up on November 4, 2009 at 27.73/27.90 support is 35.15, the near term resistance 36.08 and the 50 day exponential moving average at 32.72.
This is The Walt Disney Company (DIS): The King of the Magic Kingdom is a mouse, we all know him as Mickey. The Walt Disney Company is the world's #2 media conglomerate, # 1 is Time Warner (TWX) with assets encompassing movies, music, publishing, television, and theme parks. Disney’s TV holdings include the ABC TV network + 10 broadcast stations, and a portfolio of cable networks including ABC Family, A&E Television Networks (37%-owned), and ESPN (80%). Walt Disney Studios produces films through imprints; Walt Disney Pictures, Touchstone, Pixar, and Miramax. In addition, Walt Disney Parks and Resorts is one of the top theme park operators in the world, we all know them as Walt Disney World and Disneyland Resorts. Disney competitors are primarily in the Film & Video industry, DIS also competes in the Internet Content Providers, Music, and Publishing sectors, the competition is; CBS Corp, News Corp, and Time Warner.
The Competitive Landscape
In the motion picture production and distribution sector consumer spending drives demand. The profitability of individual companies depends on creativity, marketing, and distribution. Large companies have the advantages of long term contracts with key actors and directors, a permanent staff of technical employees, and wide distribution networks. Small companies compete by creating marketable movies, often for niche audiences, on low budgets. Although production work is labor-intensive, the value of the product results in high average annual industry revenue of US$300,000 per employee.
The Walt Disney Company (HQ)
Robert A. Iger, President, CEO, and Director
500 S. Buena Vista St. Burbank, CA 91521-9722United States Phone: 818-560-1000Fax: 818-560-1930 http://disney.go.com/
9

Estée Lauder Company (EL) Up-date 6 Last Look: March 12, 2010
April 1, 2010
Paul A. Ebeling, Jnr. Analyst
Today, let’s look at Estée Lauder Company (EL), a seller of cosmetics, fragrances, and skin care products, from a Technical POV. The overall indications, after Thursday’s (April 1) market action, are Very Bullish: in the near term Bullish, mid-term Very Bullish, and long term Very Bullish. The recent Candle Stick analysis is: Neutral
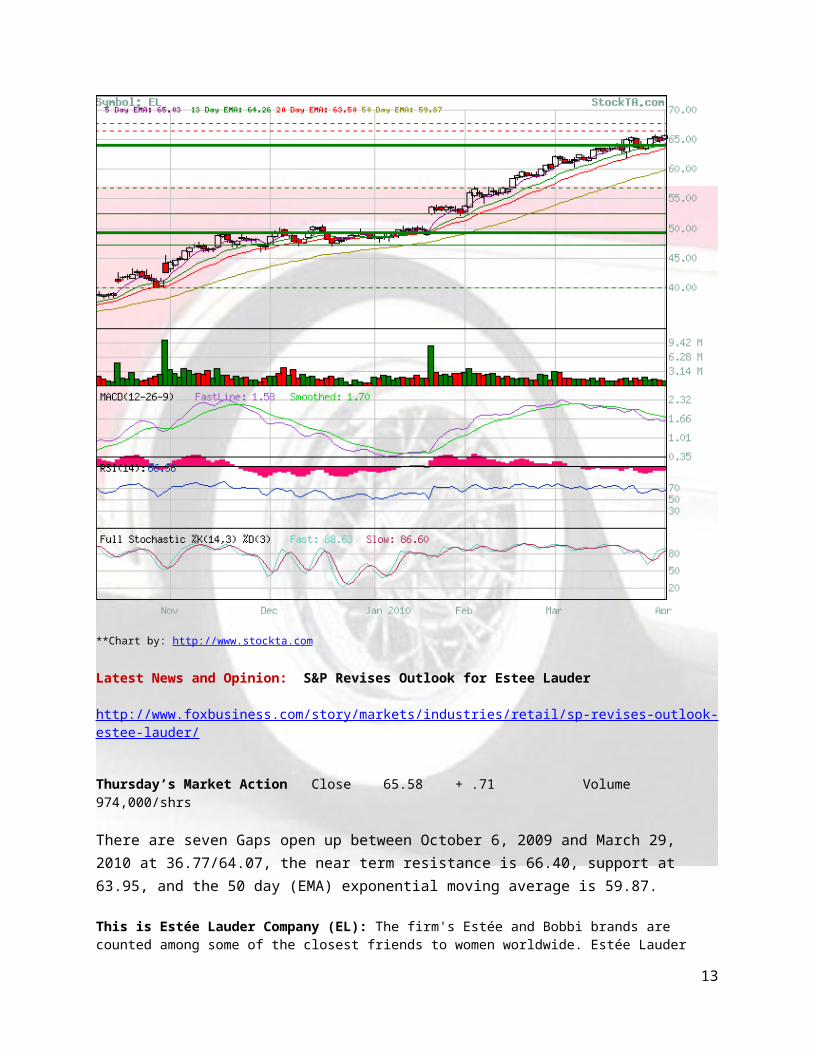
**Chart by: http://www.stockta.com
Latest News and Opinion: S&P Revises Outlook for Estee Lauder
http://www.foxbusiness.com/story/markets/industries/retail/sp-revises-outlook-estee-lauder/
10
Thursday’s Market Action Close 65.58 + .71 Volume 974,000/shrs
There are seven Gaps open up between October 6, 2009 and March 29, 2010 at 36.77/64.07, the near term resistance is 66.40, support at 63.95, and the 50 day (EMA) exponential moving average is 59.87.
This is Estée Lauder Company (EL): The firm's Estée and Bobbi brands are counted among some of the closest friends to women worldwide. Estée Lauder sells cosmetics, fragrances, and skin care products, with brands including upscale Estée Lauder and Clinique and professional Bobbi Brown essentials. Its lines are sold in department stores, company stores, and by specialty retailers, as well as online. The firm has expanded its chain of freestanding retail stores (primarily for its M.A.C, Origins, and Aveda brands). The founding Lauder family controls about 84% of its voting shares. Estée Lauder launched a Tom Ford collection in 2005 and in 2007 sold its Rodan + Fields line. CEO Fabrizio Freda, a veteran of Procter & Gamble, joined the firm in 2008.
Competitive Landscape
Demand is driven by population growth and consumer preferences. The profitability of individual companies depends on product innovation, effective sales and marketing, and efficient operations. Large companies have scale advantages in purchasing, manufacturing, distribution, and marketing. Small companies can compete effectively by offering specialized products. The industry is capital-intensive: average annual revenue per worker exceeds US$600,000.
Personal Care Products Manufacturing Industry ForecastThe output of US toiletries manufacturing is forecast to decline at an annual compounded rate of 1 percent between 2008 and 2013. Data Sourced: December 2009
Toiletries Production Growth Plummets Then Recovers
Estee Lauder Companies Inc. (HQ)
William P. Lauder, Exec. Chairman
767 Fifth AvenueNew York, NY 10153United StatesPhone: 212-572-4200Fax: 212-572-3941
http://www.elcompanies.com
11

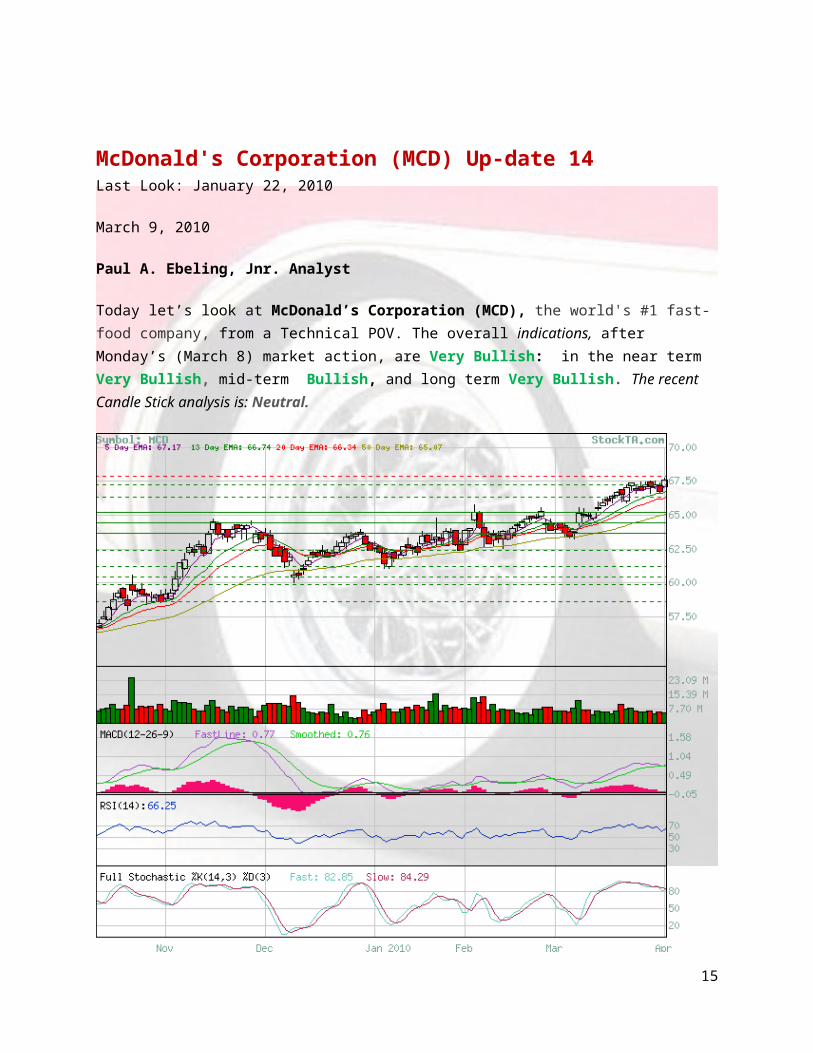
McDonald's Corporation (MCD) Up-date 14 Last Look: January 22, 2010
March 9, 2010
Paul A. Ebeling, Jnr. Analyst
Today let’s look at McDonald’s Corporation (MCD), the world's #1 fast-food company, from a Technical POV. The overall indications, after Monday’s (March 8) market action, are Very Bullish: in the near term Very Bullish, mid-term Bullish, and long term Very Bullish. The recent Candle Stick analysis is: Neutral.
**Chart by: http://www.stockta.com
Latest News and Opinion: Your First Move For Monday April 5th
http://www.cnbc.com/id/36141995?__source=yahoo|headline|quote|text|&par=yahoo
12
Thursday’s Market Action Close 67.58 +. 86 Volume 5, 474,700/shrs
There is a Bearish Engulfing Candle on March 29, and two Gaps open up on March 8 and 12 at 63.76/65.36, the near term resistance is 67.84, support at 67.26, and the 50 day (EMA) exponential moving average is 65.07.
This is McDonald’s Corporation (MCD): "McDonald's is the world's #1 fast-food company by sales, with more than 31,000 restaurants serving burgers and fries in 120 countries, with about 14,000 Golden Arches locations are in the USA. The popular chain is well-known for its Big Macs, Quarter Pounders, and Chicken McNuggets. Most of its outlets are free-standing units, but McDonald's also has many quick-service kiosk units located in airports and retail areas. Each unit gets its food and packaging from approved suppliers and uses standardized procedures to ensure that a Big Mac purchased in Pittsburgh tastes the same as one bought in Beijing, I lived in Beijing for 4 years and it’s true. More than 75% of its restaurants are run by franchisees or affiliates.
The Competitive Landscape
Demographics and personal income drive demand. The profitability of individual companies depends on efficient operations, effective marketing, and the ability to provide fast service. Large companies have advantages in purchasing, financing, and marketing. Small companies can compete by offering unique products or serving a local market. The industry is highly labor-intensive: average annual revenue per worker is just under US$40,000.
McDonald's Corporation (HQ)
Chairman; Andrew J. (Andy) McKenna Sr.
2111 McDonalds Dr. Oak Brook, IL 60523United States Phone: 630-623-3000Fax: 630-623-5004Toll Free: 800-244-6227
http://www.mcdonalds.com
McDonald's SubsidiariesMcDonald's Restaurants Limited Ronald McDonald House Charities, Inc.
13

United States Steel Corporation (X) Up-date 12 Last Look: March 7, 2010
April 3, 2010
Paul A. Ebeling, Jnr. Analyst
Today let’s look at United States Steel Corporation (X), one of the world’s steelmaking leaders, from a Technical POV. The overall indications, after Thursday’s (April 1) market action is Bullish: in the near term Bullish, mid-term Bullish, and long term Bullish. The recent Candle Stick analysis is; Bearish
**Chart by: http://www.stockta.com
Latest New and Opinion: Steel Prices Rise Amid Money Printing
http://www.minyanville.com/businessmarkets/articles/deflation-inflation-1933-financialtimes-higherprices-steel/4/1/2010/id/27573?camp=syndication&medium=portals&from=yahoo
14
Thursday’s Market Action Close 65.70 + 2.18 Volume 15,635,100/shrs
There is a Bearish Engulfing Candle on March 30, are three Gaps open up between November 11, 2009, and March 2, 2010 at 38.56/54.77, the near term resistance is at 66.20 support at 63.87, and the 50 day exponential moving average is 57.40.
This is United States Steel Corporation: Pittsburgh, PA based United States Steel is the US’s #2 integrated steelmaker behind Mittal Steel USA. US Steel operates mills throughout the US Mid-west, Ontario, Canada, and in Serbia and Slovakia. U.S. Steel produces sheet and semi-finished steel, tubular and plate steel, and tin products. Its customers are primarily in the automotive, construction, chemical and steel service center industries. Further, U.S. Steel offers services in mineral resource management, engineering and consulting. In 2007 the company acquired tubular goods maker Lone Star Technologies for US$2.1B and Stelco for US$1.1B. US Steel is ranked #146 in FORTUNE 500.
The Competitive LandscapeUnited States Steel's competition in the primary Metals Manufacturing sector is Mittal Steel USA. The industry is highly concentrated and the major companies control 90% of the market. The output of US primary ferrous and non-ferrous metals manufacturing is forecast to increase at an annual compounded rate of 4.4 % between 2008 and 2013.
United States Steel Corporation (HQ)
Chairman & CEO John P. Surma Jr.
EVP & COO John H. Goodish
600 Grant St. Pittsburgh, PA 15219-2800United States Phone: 412-433-1121Fax: 412-433-5733
http://www.ussteel.com
United States Steel Subsidiaries and Affiliates
Pro-Tec Coating CompanyTranstar, Inc. U.S. Steel Canada Inc
Disclaimer
DO NOT BASE ANY INVESTMENT DECISION UPON ANY MATERIALS FOUND ON THIS WEBSITE OR IN OUR NEWSLETTERS. Red Roadmaster is not registered as a securities broker-dealer or an investment advisor either within the US Securities and Exchange Commission (the “SEC”) or with any state securities regulatory authority. We are neither licensed nor qualified to provide investment advice. The information contained on our website or in any of our newsletters should be viewed as commercial advertisement and is not intended to be investment advice. Any information found on our website, or in any of our newsletters is not provided to any particular individual with a view toward their individual circumstances. The information contained on our website, and in any newsletter we distribute, is not an offer to buy or sell securities. We distribute opinions, comments, and information free of charge exclusively to individuals who wish to receive them.
15

Our newsletter and website have been prepared for informational purposes only and are not intended to be used as a complete source of information on any particular company. An individual should never invest in the securities of any of the companies’ profiled based solely on information contained in our report. Individuals should assume that all information contained on our website or in one of our newsletters about profiled companies is not trustworthy unless verified by their own independent research.
Any individual who chooses to invest in any securities should do so with caution. Investing in securities is speculative and carries a high degree of risk; you may lose some or all of the money that is invested. Always research your own investments and consult with a registered investment adviser or licensed stock broker before investing.
Information contained in the Redroadmaster Stock Talk report will contain “forward looking statements” as defined under section 27A of the Securities Act of 1933 and Section 21B of the Securities Exchange Act of 1934. Subscribers are cautioned not to place undue reliance upon these forward looking statements. These forward looking statements are subject to a number of known and unknown risks and uncertainties outside of our control that could cause actual operations or results to differ materially from those anticipated. Factors that could affect performance include, but are not limited to, those factors that are discussed in each profiled company’s most recent reports or registration statements filed with the SEC. You should consider these factors in evaluating the forward looking statements included in the report and not place undue reliance upon such statements.
Red Roadmaster is committed to providing factual information on the companies that are profiled. However, we do not provide any assurance as to the accuracy or completeness of the information provided, including information regarding a profiled company’s plans or ability to effect any planned or proposed actions. We have no first-hand knowledge of any profiled company’s operations and therefore cannot comment on their capabilities, intent, resources, nor experience and we make no attempt to do so. Statistical information, dollar amounts, and market size data was provided by the subject company and related sources which we believe to be reliable.
To the fullest extent of the law, we will not be liable to any person or entity for the quality, accuracy, completeness, reliability, or timeliness of the information provided in this report, or for any direct, indirect, consequential, incidental, special or punitive damages that may arise out of the use of information we provide to any person or entity (including, but not limited to, lost profits, loss opportunities, trading losses, and damages that may result from any inaccuracy or incompleteness of this information). We encourage you to invest carefully and read investment information available at the websites of the SEC at http://www.sec.gov and FINRA at http://www.finra.org
16