rd-r149 rn airborne infrared thermal scanning … · running from the wing stations to the cabin....
TRANSCRIPT

RD-R149 690 RN AIRBORNE INFRARED THERMAL SCANNING SYSTEM FOR EASY 1/1USE ON NAVY P-3 AIRCRAFT(U) WISCONSIN UNIV-MADISONMARINE STUDIES CENTER T GREEN III ET AL. 01 SEP 84
UNCLASSIFIED N000i4 79-C-8866 F/G 17/5 N

1111 I . __ II~1 iI.6
1.JI 25 -11 L.6
MICROCOPY RESOLUTION TEST CHARTNATIONAL BURLAU W~ SANDARD V~t,

0-
An Airborne Infrared Thermal Scanning SystemFor Easy Use on Navy P-3 Aircraft
(0
0) Theodore Green IllUMichael J. Green DTIC
Frank L. Scarpace ELECTEO JAN 3O 1985
B
Institute for Environmental StudiesMarine Studies Center
University of Wisconsin-Madison
Drr1BTmON STA17TEME47 A
Apmd1wluliamr*W. 84 11 01 08Mfixbufin Vui~ft 08

* I... ~ ~ U U E*...U~ .. ....- . -
AN AIRBORNE INFRARED THERMAL SCANNING SYSTEM
FOR EASY USE ON NAVY P-3 AIRCRAFT
Theodore Green III
Michael J. Green
Frank L. Scarpace
Marine Studies CenterUniversity of Wisconsin-Madison
Madison, Wisconsin 53706
Final Report for Office of Naval Research Contract No. NOOO14-79-C-0066.
September 1, 198~4

(i)
ABSTRACT
The University of Wisconsin-Madison Marine Studies Center has developed
an airborne infrared scanning system for use aboard almost any Navy P-3
aircraft. _'The sensing device is mounted in a wing pod, and the data are sent
optically to recording equipment located in the cabin. The system can be
installed on a P-3 in a few hours, and involves no airframe modifications. It
has been tested in flight, only minor changes are needed to make it fully
operational.
-. fl~ ht h. t t m

(ii)
TABLE OF CONTENTSPage
Number
ABSTRACT
LIST OF FIGURES iii
1. BACKGROUND 1
2. GENERAL DESIGN CRITERIA 6
3. THE SCANNING SYSTEM 8
a. Overview 8
b. The Scanner Wing Pod 10
c. The Thermal Infrared Scanner 18
d. The Optical Data Link 23(1) Power Supplies 23(2) Optical Transmitter 23(3) Signal Conditioning 23(4) Temperature Controller 26(5) Optical System 26(6) Optical Receiver 27(7) Scanner Sync 31(8) Temperature Data 31
e. Data Recording 31.(1) The Oscilloscope 31(2) The System Controller 32(3) The Video Terminal 37(4) The Tape Drive 37(5) Equipment Location 37
f. Support System 38(1) The Color Graphics Display 38(2) The Portable Vacuum Pump 39(3) The Alternate Dewar 42
4. SAFETY TESTS OF THE SYSTEM 44
5. OPERATIONAL CHECKOUT 48
* 6. USING THE SYSTEM: OPERATIONAL CONSIDERATIONS 52
" 7. USING THE SYSTEM: PHYSICAL OCEANOGRAPHY 55
8. SUMMARY 57
9. ACKNOWLEDGEMENTS 58
10. REFERENCES 59
-'':'.: L -',,, z',- .:' -'-'-"._.-: .,'.-,.'.-.: .,- _-/ .-_,' . ..- ,.. , .:'. . .. .-.. : "- v-. . ,". - -"." .,".".' ',.'.," .

(iii)
LIST OF FIGURES
Figure 1. Examples of thermal imagery taken near the southern shore of Lake
Superior.
(a) The time evolution of meanders in a coastal current.
(b) The details of the front bounding the meanders seen in (a).
Figure 2. An overview of the pod configuration on a P-3 aircraft.
Figure 3. The pod.
(a) The modified fuel tank.
(b) The tube containing the optical data link.
Figure 4. The thermal scanner, which is mounted in the pod.
Figure 5. The optical-data-link receiving unit, located in the P-3 cabin.
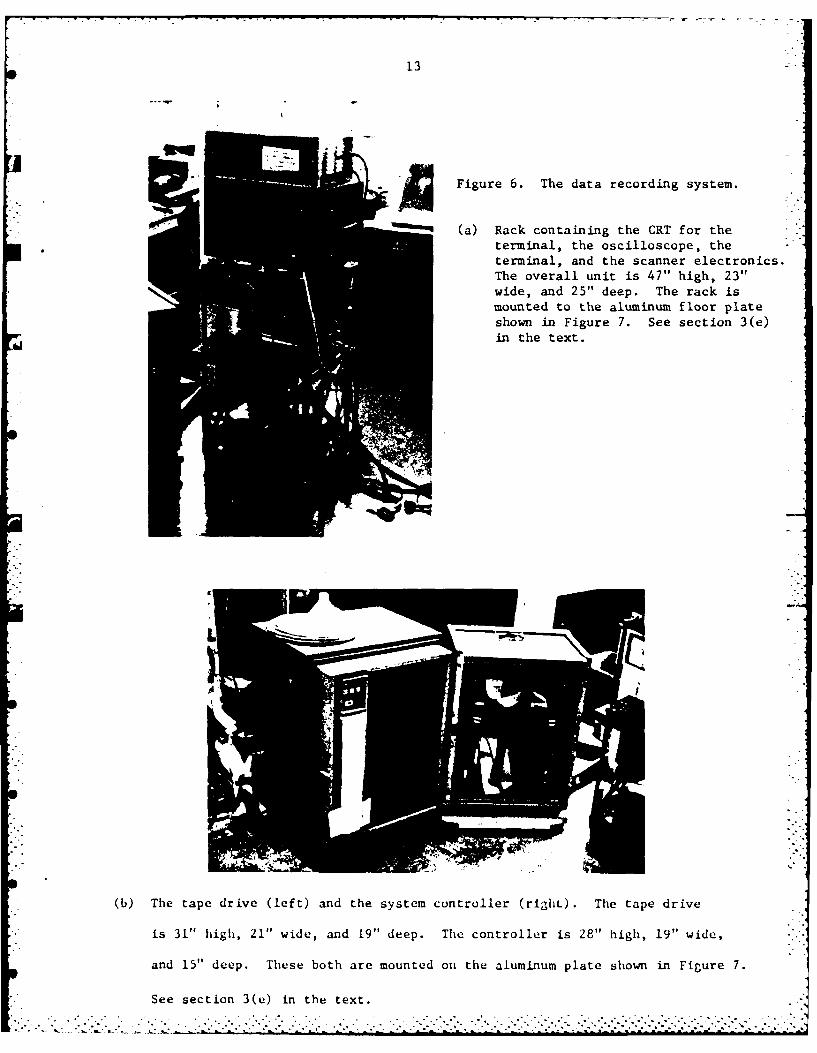
Figure 6. The data recording system.
(a) Rack containing the CRT for the terminal, the oscilloscope,
the terminal, and the scanner electronics.
(b) The tape drive and the system controller.S
Figure 7. The aluminum plate used to mount the electronics rack, tape drive,
and system controller shown in Figure 6.
Figure 8. The overall configuration of the pod.
Figure 9. Side detail showing the mounting of the scanner in the pod.
Figure 10. Front detail showing the mounting of the scanner in the pod.
Figure 11. The pod mounted on a P-3 wing.
Figure 12. A closeup of the transmitting part of the optical data link.
Figure 13. A block diagram of the total scanner system.
Figure 14. The output signals of the thermal scanner.
Figure 15. A block diagram of the optical data link.
... ...

(iv) 0
Figure 16. A block diagram showing the components of the optical data link
which are located in the pod. -
Figure 17. The mechanical layout of the optical receiver system.
Figure 18. The head of the optical receiver.
Figure 19. A block diagram of the optical receiver demodulator, and the 0
automatic gain control circuits.
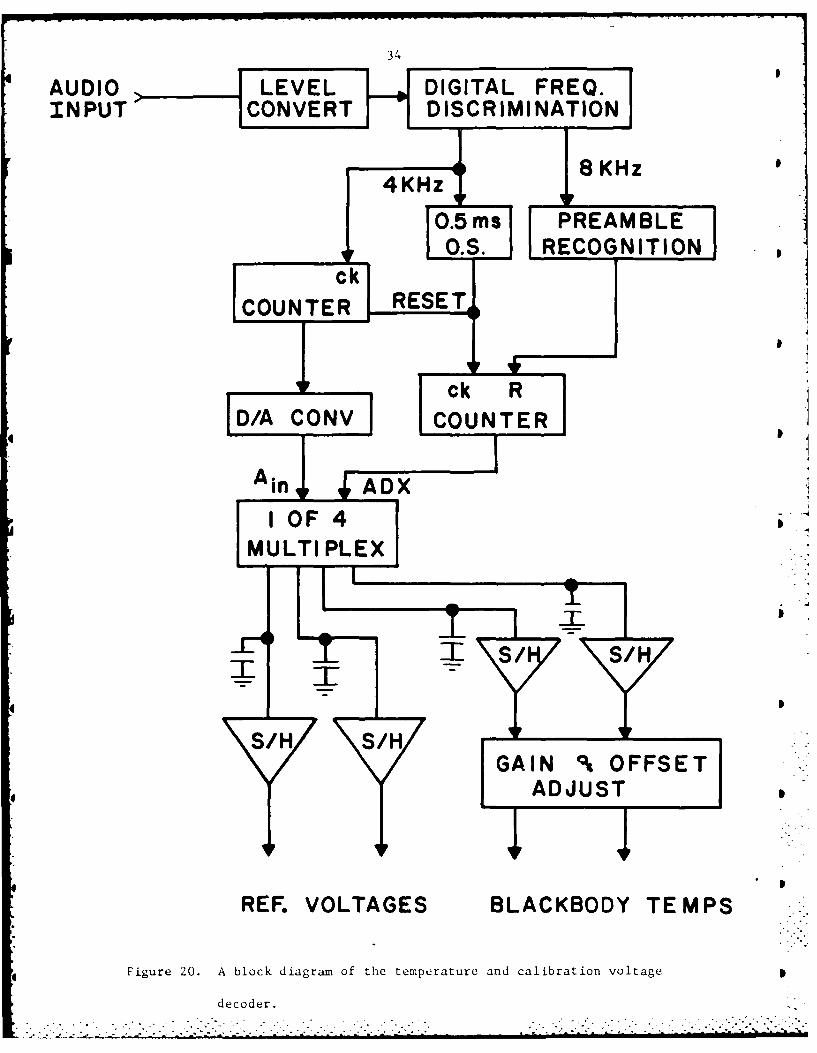
Figure 20. A block diagram of the temperature and calibration voltage
decoder.
Figure 21. A block diagram of the system controller.
Figure 22. A block diagram of the new color graphics display system.
Figure 23. The main components of the new color graphics display system: The 0
LSI 11/23 microprocessor, the keyboard control, and the SONY.
Figure 24. The portable pumping system.
Figure 25. The new Dewar which will be attached to the scanner. _•
Figure 26. Thermal imagery taken of the coastal zone of Lake Michigan during
the test flight of 26 August 1982.
Accession For
N~TIS 0RA&
DTI.CrTAV . "'• ..By-_ - - -%S
'IlI0.6vDii:"..
Lo-1

Ii
1. BACKGROUND
During the 1970's, the University of Wisconsin-Madison Marine Studies
Center undertook several experiments involving airborne infrared ("thermal")
scanning to obtain water-surface temperatures of the upper Great Lakes. In
each case, the time and space scales of the temperature variations were
appropriate for the use of such an instrument on a DC-3 aircraft, surface
temperatures were an important and useful indicator of the overall fluid
dynamical process, and the necessary equipment was either on hand, or readily
available nearby. Also, simultaneous measurements of surface and subsurface
water temperatures were taken from boats, in a coordinated fashion. These
experiments included measurements of the thermal effluent plumes associated
with coastal power plants, studies of the strong coastal currents occurring in
the summer in the Great Lakes, and wind-driven coastal upwelling. A large
program documenting the statistical behavior of the plumes associated with all
power plants along the Wisconsin shore of Lake Michigan was also undertaken.
Papers describing most of this work are listed in the references (#1-7).
Examples of the data obtained are shown in Figure 1.
This work was reasonably successful, and we attempted to expand it to
include the coastal ocean. A proposal to study coastal fronts was submitted,
but not funded. However, we were asked by the Office of Naval Research to - -
review all serious airborne thermal scanning efforts and the instruments used,
with an eye to adapting one for routine research use aboard the many Navy P-3
aircraft that were occasionally available for such use. (The Navy Reserve
aircraft were considered most seriously, but Fleet aircraft were also to be
taken into account.)
S - -............... .

2
. - .
Figure 1. Examples of thermal imagery taken near the southern shore of Lake
Superior.
(a) The time evolution of meanders in a coastal current. Light
tones denote warm surfaces water, dark tones cold. The warm
water is flowing to the right. The total water temperature
difference is about 10 degrees C. The images are about 2 krm
from top to bottom.
. . .,...
"' . . . . . . . -. . . . . . . . . . . . .

Figure 1. (b) The details of the front bounding the meanders seen in Figure 1 (a),
on another day. This image is about I. km on a side.
S* .%

4
After spending about a year on this effort, we came to the conclusion
that our rather simple scanning system was probably as suitable for such a
modification as any other system. Our reasoning was as follows: The
principal problem associated with using airborne thermal scanning in support
of other ONR-sponsored field research seemed to be one of flexibility: an
investigator usually has to schedule the aircraft work around the more
fundamental shipborne aspects of the work. The constraints of ship and
aircraft operations are rarely the same; this meant that the aircraft
~scheduling cannot be done far in advance of the operation, especially if
, concurrent measurements are to be made. Also, the most fruitful uses of such
remote sensing data often involve eliciting information on the time evolution
of surface-temperature patterns. (Such patterns are often much more important
than the accuracy of the temperatures themselves.) Thus, several repeated
flights over the same area are often necessary. This places a heavy demand on
any one aircraft, especially when the experiment is at a remote point.
Finally, the time aloft is often far more important than aircraft speed, and
aircraft positioning problems much more serious than those involving very
accurate temperatures (especially when far from shore). Thus, flexibility of
use and good navigation seem more critical than extremely good temperature
resolution.
For these reasons, a relatively simple scanning system, with acceptable
temperature accuracy, which could be mounted in a large number of fairly
readily available aircraft, and which could be easily moved from one aircraft
to another, seemed preferable to a very sophisticated and accurate system
which was constrained to use aboard one particular aircraft.
The ensuing work towards providing ONR with such a flexible aircraft
thermal scanning system is described below. It should be noted that this

5
system is not designed to measure large-scale temperature features, but rather
those on scales of 50 km and less. Thus, it is most useful in studying meso-
and small-scale oceanic features, and complements the satellite SST data
normally obtained in large, multi-investigator projects.
..................................
........................... . . .. . . . . . . . . . . . . . . . . . ... . . ... .

6
2. GENERAL DESIGN CRITERIA
I
Somewhat paradoxically, the general design constraints needed in order to
achieve the required flexibility were rather rigid. The scanning system had
to be compatible with almost any Fleet or Reserve P-3 aircraft. Also, it had
to be capable of being easily taken from one plane, and remounted on another
(say, in hours). Moreover, no modifications to structural components or power
system of the aircraft were allowed. Finally, the system had to be relatively
portable. These constraints were far different than any we had encountered
before.
Since no holes could be opened in the airframe for the scanner to "see"
through, or through which to pass wires, we were forced to consider a wing
mounting. (The traditional belly mounting was not compatible with the above
constraints.) On the other hand, it was crucial to be able to monitor the
data acquired, during the flight. Thus, the data had to be transmitted to the
aircraft cabin. The major problem with this lay in the lack of usable wiresp
running from the wing stations to the cabin. The best solution seemed to be
to mount the scanner in a pod attached at one of the external stores stations
located on the P-3 wing, and to transmit the data optically to the recording
equipment in the cabin through an existing window. Such an optical data
trans.uiission scheme is a recent development, and has been used with portable
television cameras. It seemed amenable to modification, to deal with the
marsive amount of data generated by the thermal scanner.
The pod construction, scanner modification, and optical data link
construction were the three major parts of the work. However, a large amount
of time was also spent mating all equipment to the P-3 aircraft, iacluding the
data recorders in the cabin. Obtaining the necessary Navy approvals for the
• , . . . • .. *..*• . .... ... .. . ) .... . . . . ... .( .-... .. . -.. ..... -.*.. ..*...-/ - . ; o ... - -.. . ,.. . ) (

7
resulting changes to the aircraft also proved surprisingly time consuming.
These tasks have all been accomplished, and the configuration has been
flight tested for both aircraft safety and operational reliability. Each part
of the work is described separately below.
i
p
S
. .. -•. •
. . . . . .

8
3. THE SCANNING SYSTEM
a. OVERVIEW
The overall aircraft configuration is shown schematically in Figure 2. ."-
The scanning system itself represented the product of our desire for a simple,
reliable system, with the above-mentioned design constraints. The primary
ingredients were a relatively small, off-the-shelf thermal infrared scanner
(Texas Instruments RS18A), an optical data transmission system (American Laser
Systems, Inc. Model 761) and a surplus Aero IC fuel tank.
Each of these ingredients was substantially modified. The pod was
adapted to carry the thermal scanning detector and the optical data link
transmitter. The scanner was partitioned with the sensor placed in the pod,
while the signal conditioning and data acquisition electronics were put in the
cabin. The receiving part of the data link was placed just inside the aft
observer's window in the cabin, along with the data recording system. As
noted above, a very large amount of data is generated with such a scanning
system.
Real-time data display is accomplished with an oscilloscope. This shows
only one scan line at a time, and so leaves something to be desired (see
below). However, it does show where the data become "interesting." We also
in the past have sometimes used a Honeywell Visicorder, which gives a complete
thermal image similar to the processed data shown later, seconds after the
data are taken. However, the quality of the display is often quite poor, and
the hardcopy data deteriorates rapidly when exposed to light. Consequently,
part of this project was the design and fabrication of a real-time color image
display system. This effort is about 90% complete, exclusive of software.
Unfortunately, this phase of the project was one of the more seriously
. *... . *-*.-.- -* . . . . . . .

90
THERMAL SCANNER
OBSERVERS WINDOW
Figure 2. An overview of the pod configuration on a P-3 aircraft.

10
affected by the protracted negotiations to get flight authorization.
J Photographs of all system components are shown in Figures 3 to 7. Each
major component will be discussed separately below.
b. THE SCANNER WING POD
The instrumentation pod which carries the thermal IR scanner head and
*optical data link assemblies is a modified Aero 1C 150 gallon fuel tank. The
Naval Weapons Test Center at China Lake, California obtained the tank,
provided the design for the modifications and performed the conversion.
The pod assembly weighs approximately 370 lbs., is 180.5 inches long, and
21.5 inches in diameter at its widest point. It is ballasted so that the
center of gravity is almost exactly between the two mounting lugs. It is
suspended at one of the three outboard external stores locations on a P-3
aircraft (typically station 16), using a standard 30-inch mining pylon. t
The overall layout of the inside of the pod is shown in Figure 8.
* Ballasting was accomplished by placing 35 pounds of lead shot in the pod nose
(in an epoxy matrix). Behind this was placed 60 pounds of high density foam.
The latter assures that the lead ballast will stay put, and also helps to
strengthen the pod structurally forward of the mounting strongback. NWTC
China Lake modified the original tank by installing a mounting box for the RS-
* 18A scanner head directly below the mounting lugs (diagrams of which are shown
in Figures 9 and 10), and fabricating a tube structure (approximately 6 ft.
long x 10 in. diameter) into which the optical data link transmitter was
installed (Figure 3b). Rotation of this tube provides one of the pointing
axes for aiming the data link beam.
Power requirements are supplied to the pod from the pylon by a specially
* fabricated cable (110 VAC at less than 5 amps is needed). We presently have

(a) The modified fuel tank, shown in
* *7 ~its shipping crate. (See also
Figure 11.)
(b) The tube containing the optical data
link. The white end protrudes from
the aft end of the pod. (See also
Figure 12.)
Figure 3. The pod. (See section 3(b) and 3(d) in text.)

12
kI
Figure 4. The thermal scanner, which is mounted in tne pcU. (See section
3(c) in text.)
Figue 5 Th optcaldat-lin reeivng uitlocted n te P3 cain.Theuni
50" igh 15 wie, nd 2" dep.It s muntd tothesea rals hic
50"mahigh 15"wie, and obs ee'. set. Se sonedton(i the teriltw.c
13
Figure 6. The data recording system.
S (a) Rack containing the CRT for theterminal, the oscilloscope, theterminal, and the scanner electronics.
The overall unit is 47" high, 23"wide, and 25" deep. The rack is
mounted to the aluminum floor plateshown in Figure 7. See section 3(e)
in the text.
(b) The tape drive (left) and the system controller (right). The tape drive
is 31" high, 21" wide, and 19" deep. The controller is 28" high, 19" wide,
and 15" deep. These both are mounted ou the aluminum plate shown in Figure 7.
See section 3(e) in the text.
. . . . . . .. . . . . . .... . . . . .

14
Figure 7. The aluminum plate used to mount the electronics rack, tape drive,
and system controller shown in Figure 6. It is 1/4" thick, 72"
long, and 30" wide, and is bolted to the aircraft floor. See
section 3(e) in the text.
i
I
-' -. -': , '-. -- ' -. --, .- .'i '.- .- i '. -.i' i- .-'i '-- .i' i- --'.- - - .-' ." ---, . --.' .' - . -. • .-., ., .-i . ... .-.. - .• - ' -. - - . --"2 '2 '2' o_'2 '2 ' '.r .: .-. ' ., -',' - '-.-,. -:' .°-' • . .. . . . . . . . . . . . . . . .. - _" - -.-. .. - -

I 15
IC
0
z -zD -4c
z0.. 00
I-xC,)
OF 4
C. - .

16
-o00.
0'-4
0
0
0
I0
I-0oLL~
A-I
0- '-4
0
-.4
A-A0
~0
*0".4
U
0~'
0
'-4
S

17
SCANNE
1 FOOT
Fiue1. Fotdti hwn h mutn ftesanri h o
(secion f pd atscaner)

* 18
one such cable, which uses the standard connector for a "Bulipup" missile.
ra The fabrication of one more cable for use with a pylon configured for a
* "Harpoon" missle would allow the scanner pod to be used with virtually all
standard B- and C-model P-3 aircraft. The pod side of the connector cable has
3 a mechanical break-away device so that it could be jettisoned in an emergency.
A plan view of the optical data path from the pod to the aft observer's
window is shown in Figure 2. A photograph of the mounted pod is shown in
Figure 11. A closeup of the sending unit is shown in Figure 12. This is
discussed in detail in section (d) below.
c. THE THERMAL INFRARED SCANNER
The scanner is a Texas Instruments Model RS-18A Airborne Infrared
Scanning Radiometer (Reference 08). It is composed of two principal
subsystems: the scanner head itself, which houses the rotating mirror and
detector with their associated control and amplifier circuitry, and a power
supply/signal conditioning chassis. These two units are normally connected by
a 39-conductor cable. The Navy application would allow for no belly mounting,
nor would holes in the fusilage be allowed for connecting the scanner
components. Therefore, an optical data link has been fabricated which can
replace the hard-wired connections between the scanner and power supply.
The scanner head is mounted in a pod below the starboard (right side)
wing. An optical transmitter, also located in the pod, sends a modulated beam
of light through the aft observer's window in the cabin. There, an optical
receiver reconstructs the scanner signals, which then go to the
power/conditioning unit.
The scanner system is shown schematically in Figure 13. Here, the
optical data link (discussed later) has been deleted, for clarity. Each

* 19
1$am
rA
= yr
- IL

_______ 71________________________ 20
I
II
IH 7:
~ I -~2 -~ I
- ~- ,-
C.-
34-
4 .- I-7:
-~ C.
E --.1:
7: -1-.
I
-4
I
4-
I
I
~jI
I

21
w w
O~4J0
OQ
CD~
w o IJJ
0 44CrC
I-'
C.)

22
component of the system will now be described briefly.
The scanner senses infrared (IR) radiation with wavelengths from 8 to 14
microns using a mercury-cadmium-telluride detector cooled to 77 degrees Kelvin
(-3210 F) in a liquid-nitrogen-filled Dewar. The apparent temperature of
surface water can be resolved to within 0.1 degrees C. The lateral coverage
of the scanner is a 100-degree arc perpendicular to the line of flight, with
compensation for up to plus-or-minus 15 degrees of aircraft roll. The spot
sensed by the scanner is approximately 2 milliradians wide (i.e., 20 feet wide
at an altitude of 10,000 feet). The scanner has been modified to scan at a
rate of 2,500 scan lines per minute from a rate of 5,000 lines per minute, in
order to lower the bandwidth required for the digitizer. The spot size
scanned and the percentage of overlap between scan lines are determined by the
altitude and ground speed of the aircraft. The scanner contains two
blackbodies, one at ambient temperature and one that can be heated to 10 -
degrees C above ambient, with embedded platinum thermometers with an accuracy
of 0.4 degrees C from -40 degrees C to +60 degrees C.
The outputs of the scanner are two analog voltage signals (Figure 14).
The first signal is the scanner video signal, the analog voltage of which is
directly related to the water apparent temperature, the blackbody
I|temperatures, and the blackbody thermometer outputs. The second signal is the
scanner sync signal, which indicates when the various components of the
scanner video signal are present. The scanner video amplifiers have
4controllable gain and offset, which allow the system operator to place the
apparent temperature signal within the +2 volt to -2 volt linear response of
the video amplifiers.
Much more detail about the scanner can be found in the scanner operating
manual (Reference #8).
*J
23
d. THE OPTICAL DATA LINK
j A block diagram of the optical data link is shown in Figure 15. The
various components are discussed separately below. Much of this material is
* from Reference #9.
(1) Power Supplies
The system provides six different DC voltages, which are derived from the
110 VAC 400Q cycle supply available in the pylon. These supplies must be
b heavily filtered to protect circuits from the notoriously noisy aircraft
supply. In addition, the mirror motor and blackbody heater supplies are
* sequenced to turn on only after their respective control circuitry has been
* energized. Lastly, this subsystem provides for a status display which is
* visible from inside the plane.
(2) Optical Transmitter
The heart of the data link, the optical transmitter and receiver units,
* are part of a commercially available communication system designed for the
- television industry (See Reference #10). The transmitter, which is only
slightly modified, uses a high-power light-emitting diode as a light source.
The system supports one video channel with a 10-MHz bandwidth, and two audio
channels, each having a 1O-KHz bandwidth. The latter are frequency
multiplexed onto the video (10.7-MHz carrier). Very little of the available
* bandwidth is used for our application; the system will actually support a
* video bandwidth in excess of 15 MHz.
(3) Signal Conditioning
Signals from the scanner head are converted to provide appropriate inputs
to the optical transmitter as follows:
(a) The scanner video, having a bandwidth of 100 KHz, is used to
frequency modulate a 1-MHz carrier. This FM signal is then sent, as
..-.-.. .. _1..

24
zz
00 Z)* Ici,>
OW l
ww
a)
0I
00
cr. 0o
- - -- w 'W .z
00
0W(j (M 0

25
OPTICAL FXMTR EO
SIGNL AUIO IOPTI CAL
AUDIO 2RCR
TEMP OPTICAL LINK
88NTROTO
88 TEMPS
SYNC1VIDEOI
I VIEPOWER
I CAL
POWER / CONDITIONINGRSI8A SCANNER
Figure 15. A block diagram of the optical data link.

26
the video input, to the transmitter.
(b) The scanner sync signal, a rectangular wave (25-ms period) which
provides mirror position information, is simply converted to voltage
levels appropriate for driving one of the transmitter audio inputs.
(c) Inside the scanner are two blackbody targets which provide
calibration information for the system. The temperatures of these
targets are independently measured by two platinum resistance
thermometers which provide analog output voltages proportional to
their respective temperatures. These voltages are converted once
per second into digital values, which are transmitted over the
second audio channel as bursts of sine waves. The numbers of cycles
in each burst equal the digitized values. In addition to the
temperature data, two reference voltages are also transmitted in the
same manner. This provides a check on the operation of the system -
from inside the airplane.
(4) Temperature Controller
When operating in its original configuration, the temperature of one of P
the blackbody targets is manually controlled from inside the airplane. Rather
than incur the additional complexity which retaining this system would require
(i.e., an additional data link from inside the aircraft to the pod), it was 0
decided that it would be acceptable if this target were maintained at a fixed
temperature difference above ambient. This is accomplished by a control
system on the signal conditioning board, which maintains a 100C separation
between the two target temperatures in the P-3 configuration.
(5) Optical System
This is a simple projection system consisting of two lenses and a mirror,
which is pivoted to provide the second degree of freedom required to aim the

27
beam. An image of the light-emitting diode ~4 ft. across is projected onto the
side of the aircraft, centered on the window where the receiver is located.
The large size of the projected image compensates for in-flight pointing error
* due to motion of the pod. A block diagram of all pod components is shown in
Figure 16.
(6) Optical Receiver
The optical receiving system is mounted on a pedestal which rides on the
seat rails normally occupied by the starboard aft-observer's seat. The
receiver has a view of the pod through the observer's window. The mechanical
layout of the receiver system is depicted in Figure 17. A picture is shown in
Figure 18. Its principal components are the optics, IR receiver, signal
conditioning electronics, and power supply.
The objective of the optics is twofold: limiting the illumination of the
receiver photodiode to only that which is provided by the transmitter; and
* gathering as much of the transmitted energy as possible. This latter
* objective is achieved by using an 11-in. Fresnel lens to define the entrance
aperture. Light passing through the Fresnel lens is focused onto the detector
* by a second lens mounted directly in front of it. These two components are
enclosed behind an IR filter which eliminates the unwanted visible radiation.
The receiver optical system includes a telescopic sight for aiming at the pod
(See Figure 18).
Substantial modifications to the optical receiver were necessary, since
the unit was specifically designed for the television industry. As such, the
demodulator and automatic gain control board operation depended on receiving
* real television video signals. A new demodulator board was designed using a
phase-lock loop FM demodulator with appropriate filtering. A second circuit
* board was fabricated using digital technology to provide the required

4 41
a.C
w w )01 0
> -2
-m 0-z w-a0 >-i
00
z0 w
.0 0
w aoo
o0 ILl
0 M
N0 C

Ic
wIrI-
w w
wLU z 0,
4r -4
zS 0
U) z
LA.2

* * . . . * p p * p*g -.--.~-~----..--. -
30
I
p I
cj
A
444
I
I
I
I
:4 I
S
*
* S"I-- S.
* t 44.yt4 0.).~
~ . ...4
-. . t flu Thpti:I. rL c: 2t'r.1 -

3t
automatic gain control signals. A block diagram of these circuits is given in
Figure 19. The audio channel demodulators were unmodified. The video data
from the demodulator is in the appropriate format for the scanner power/
processing module. The scanner sync and temperature signals required further
conditioning.
(7) Scanner Sync
This sinal is severely distorted by the band.idtn limittins of tne
audio channel. A differentiator circuit determines the transition points and
uses these to re,;enerate a rectangular wave having the ippropriat v . ag!
(' Temperature Data
Recall tnat the temperature an ,aL -r t in "otag.n nave neen *?;:,:
bursts of sine 4aves wni-;n are then transmitted over the secon 3 aui r.
A z [oc k di3gr3m of t ,- de,oder is shown in Figure 2'. , recept::n , ",-
s'gnal is first ... 'rc " bursts of logi: - en"; - 3r? -n.r
D unte, to rc. V , zeI va.es. .e.e are .... .
a-_ re sn i v . ine tca. ' - n -.r .c n e r. r T... " enr ar .r
a..r. gaan sct& -.;ti ~ r~ L:;t r r' p r:a D
:.n vcilos2ope
• ..:, ciloscope is a '7, tr::n. - :*,. - , : ,. " - "..-
n. tr'nen t. t provides a ji2p -y -
Copy avoilcble to DTIJC do" u3
". " """" " it ' IT sgible reprod"Ui

*32
rrFM DEMODULATOR
RCVD PLL S
SIGNAL (CD4046)
I~ 6POLEI100 KHz LP VIDEO
I FILTER I OUTPUT
IDIGITAL AGC
KS
COMP LATCH
AGC 17CONTROL D/A u/d COUNTER
VOLTAGES I__ _ _ _ _ I
Figure 19. A block diagram of the optical receiver demodulator, and the
automatic gain control circuits.

33
resolution compatible with the desired temperature range. It also gives the
operator a positive indication that the thermal scanner subsystem is
functioning properly.
(2) The System Controller
The system controller is a unique item built by the staff of the U.W.
Marine Studies Center. The system controller consists of two major elements,
the analog-to-digital conversion element and the microcomputer element (Figure
21). (This component is called computer controlled data acquisition in Figure
14.)
The analog-to-digital conversion element is made up of 5 sub-elements, a
low-pass filter, a sample-and-hold module, an analog-to-digital converter
module, a multiplexer, and a sequencer. The low-pass filter is a Datel
Systems Model FLT-LP4B50K Module, which is set for a cutoff frequency of 30
KHz. The output of the filter is down 3 DB at cutoff and falls off at a slope
of 24 DB per octave past the cutoff. Since this is a sampled data system, the
filter is required to prevent aliasing. This limits the lateral resolution of
the scanner to approximately 8.7 milliradians.
The sample-and-hold module is a Hybrid Systems Model SH25LH. The
sequencer commands the sample-and-hold module to track the low-pass filter
output for 1.2 microseconds and then hold that value for 8.6 microseconds,
while an analog-to-digital conversion is performed. The sample-and-hold is
triggered at 678 equally spaced intervals during the water scan, and is also
strobed while the heated and ambient blackbody video and thermometer signals
are present. Therefore, the sample-and-hold is strobed 682 times per scanner
revolution.
The analog-to-digital (A-to-D) converter is a Datel Systems Model ADC-
EHl2b2 12-bit successive approximation converter with a conversion time of
34
AUDIO >-LEVEL -,DIGITAL FREQ.INPUT CONVERT DISCRIMINATION]
SH
4Kz
RESET OFSE
I OF 4
REF.I VOLTES LCBD EP
* ~~~~~ ~S Fiue2.Abokdara/fteHmcauean airto otg
decoder.
GAI 9t ....... ET

35
less than 4 microseconds. The A-to-D converter has been connected and
j adjusted so that -5.0000 volts is output as [O00H] (Hexadecimal representation
of the 12 bit binary word), 0.0000 volts is output as [800H] and +4.9976 volts
is output as [FFFH]. (Note: As the scanner video is normally kept between
+2.0 and -2.0 volts, the scanner signal can be resolved to one part in 1600
over this range by the A-to-D converter.)
The multiplexer is custom built to take two 12-bit words from the A-to-D
converter and output them to the microcomputer element as three 8-bit bytes.
The first byte contains the 8 most significant bits of the first word, the
second byte contains the 8 most significant bits of the second word, and the
third contains the 4 least significant bits of the first word concatenated
with the 4 least significant bits of the second word.
The sequencer strobes the multiplexer to control the output timing of the
bytes. The last sub-element of the A-to-D conversion element is the custom
built sequencer. The sequencer monitors the scanner sync signal and uses
phase-locked loop circuitry to generate the correct number of strobes during
the water video and generates one set of strobes for each of the blackbody
negative-going sync signals. The sequencer also indicates to the
microcomputer when 8-bit data are available.
The second element of the system controller is the microcomputer, which
is based on the Intel Corporation Multibus Microcomputer Bus line of OEM
Products. The microcomputer consists of an Intel SBC-80/10 processor card, an
Intel SBC-016 16 kilobyte memory card, and parallel I/O and tape drive
controller direct-memory-access (DMA) cards designed by the U.W. Space Science
and Engineering Center. The processor, upon instructions from the operator,
through the video terminal, directs the I/O DMA to input scan lines to an
eight-kilobyte buffer that composes half of the memory card, while it directs
0

36
SCANNER VIDEO SCANNER SYNC
30 kHZLOWPASS FILTER
II
ANALOG TO DIGITAL SEQUENCERI
COONVERTERO
II
TAP CONVROLLER
SIECMEMORY ACCESS SO
TO APEDRIVE
Figure 21. A block diagram of the system controller.

37
the tape drive DMA to write to tape the other half of the memory card. The
j buffers are swapped back and forth between the two DMAs for maximum data
throughput. Each tape record contains 8 scan lines of data, with each line
having the following format: A byte of (OOH], 3 bytes with ambient blackbody
data, 3 bytes of heated blackbody data, and 1017 bytes of water temperature
data. The data are two 12-bit words packed into three 8-bit bytes as
described in the section on the multiplexer.
(3) The Video Terminal
The video terminal consists of an Ann Arbor Terminals Model 400C
terminal, an Ann Arbor Terminals Model KB400E keyboard, and an Electro-Home
* Limited Model EVM-111OR monitor. It is used by the operator to communicate
with the system controller through a serial RS-232C port operating at 9600
* baud. It should be noted that there is no video display with the system in
its present form. A remedy for this is discussed in section Mf.
(4I) The Tape Drive
The tape drive is a Pertec Computer Corporation Model FT86'40A-9 nine-
track, 1600 BPI, 145 IPS, formatted tape transport (Reference #11). The tapes
generated on this drive by the system controller can be read by and the data
analyzed on most mainframe and minicomputers that have nine-track tape drives
as peripherals. The transport is designed to be hinge-mounted in a standard
19-inch EIA rack. It operates directly from voltages of 95 to 250 VAC (single
phase), and 418 to 4100 Hz power.
(5) Equipment Location
All of the data-recording equipment, together with scanner power-
supply/signal-conditioning chassis, are located near the aft observer's window
in the cabin. They are fixed to aircraft seat rails, in turn attached to an
aluminum plate (Figure 7; 1/1" x 30" x 72"), which is attached at a convenient
............................................................
[ * - . . .< * * .;.. . -. -a

38
location (which depends on the particular P-3 involved). On the other hand,
the optical receiving unit takes the place of the aft observer's seat; the
base is configured the same as is the seat.
Mf SUPPORT SYSTEMS
(1) The Color Graphics Display System
As mentioned previously, our principal means for real-time verification
of data quality in the past has been to observe the analog scanner output on
* an oscilloscope. This had several disadvantages. For example, it is very
* difficult to get an idea of what the thermal image being obtained really looks
like from such a display. Therefore, if one is searching for particular
features, the data acquisition system is of virtually no help. Furthermore,
the only data being presented come from fairly early in the data path. A
display generated from the digitized data would provide higher confidence that
* good data were being collected. For these reasons, and also to provide the
* capability for some immediate post flight data verification and analysis, we
proposed to build a fairly powerful computer image processing system which
would be used both as an in-flight image display system as well as for
* analysis afterward.
A system to perform these functions has been about 90% completed. A
*block diagram of the new computer and how it will be integrated with the rest
of the data acquisition system is shown in Figure 22. Some of the components
are shown in Figure 23. The power supplies all require 110 VAC; either 60 Hz
or 400 Hz will work. The principal components are:
An LSI-11/23 microprocessor. This micro was chosen because it
offers most of the capabilities of its PDP-11 big brothers. Since
the U.W. Image Processing Laboratory has a PDP 11/45, it was

39
anticipated that there would be some degree of compatibility between
the two systems. Along with the processor, the computer has 160
Kbytes of RAM Memory, as well as two double-density, single-sided
floppy disk drives. The programming language to be used is PASCAL,
again for compatibility with the Image Processing Laboratory.
Two serial RS-232 input/output ports are provided for
communication with the operator and with the data acquisition
computer. A DMA parallel interface is available for data input from
the analog-to-digital converter.
A Matrox graphic display generator is used to produce a 256 X
256 pixel image in 16 colors. The image is displayed on a modified
SONY 9-inch television.
Physical mounting fixtures for installing the computer in an aircraft have not
yet been approved or fabricated. Test programs to demonstrate that the
computer system and associated graphics display are functional have been
written. However, no application software for the thermal scanner has been
generated.
(2) The Portable Vacuum Pump System
The mercury-cadmium-telluride detector which the thermal scanner uses
must be kept at a very low temperature. This is accomplished by using liquid
nitrogen (LN2) for cooling. The LN2 is stored in a Dewar to which the
detector is attached. In order to have the LN2 last for an acceptable length
of time, it is necessary that the Dewar be evacuated to a reasonably high
vacuum. Since neither Dewar now used with the scanner system will hold a high
vacuum indefinitely, it is necessary to pump them out just prior to use to
assure normal operation. This is not a problem when we are operating out of
Madison, as a number of such pumps are available at U.W. However, since it
•~ ~~ ~~~~~~~ .... .. ... .. .. . .. ... . .. . .. . ... . ... . ........ . ... . ... .. .

40
8 SBC Bus
CRT SBC-8D10I TAPE DR IVE DMA
TERMINAL ACOMPUTER CONTROL INTERFACE
8 BIT
SERIALVO PERTEK A/D
TAPE zDRVECONVERT z
ORIGINAL
NEWFLOPPYDISK
DRIVES
LAJz
KEY BOARD 0 0TERMINAL SERIAL I/O MATROX DMADS
*EMULATOR LSI-11 VIDEO ITR OTO
Figure 22. A block diagram of the new color graphics display system. New and
existing components are separated by a dashed line.

41
Figure 23. The main components of the new color graphics display system: the
LST 11/23 microprocessor (on the right; 19" by 28" by 5"), the
keyboard control, and the SONY. See section 3(f) in the text.
...................................................... . .7

42
was envisioned that this system should be useable on a world-wide basis, the
only way to assure the availability of such a pump is to have one as part of
the system. Consequently, we have designed and built a small, portable vacuum
system.
The system is a simple two-stage design using a GCA, Inc. DD-20
mechanical roughing pump, followed by a CVC Products 2-inch PMCS-2 diffusion
pump. The system includes both thermocouple and cold-cathode vacuum guages
for monitoring. Vacuums on the order of 10-6 Torr are readily achievable with
over-night pumping. The entire pump weighs approximately 35 lbs., and is
built in a shipping box which is 20" X 21" X 23". See Figure 24.
(3) The Alternate Dewar
The LN2 Dewar now used with the scanner has a life of about 5 hours (that
is, the LN2 evaporates in this time). While this is adequate for local use
aboard a DC-3, it is inadequate for use aboard a P-3, which can stay aloft for
12 hours.
A new Dewar, with a life of at least 24 hours, has been fabricated, with
a new mercury-cadmium-telluride detector mounted on it. This Dewar needs only
to be mounted on the scanner, and to have the optics aligned, to become
operational. See Figure 25.
*!
............- .- . -A -. .... ... 2.... ....

I 43
Figure 24. The portable pumping system.
See section 3(f) in the text.
ur r*
Figure 25. The new Dewar, which measures 13" by 12' by 6", and will be
attached to the scanner. See section 3(f) in the te%,,t.

44
4. SAFETY TESTS OF THE SYSTEM
I
All personnel on over-water flights are required to have had a Navy
survival course. In anticipation of over-water flights by U.W. personnel in
conjunction with safety of flight tests as well as data-gathering flights, L.
Seidl and M. Green participated in a one-day water survival school. This
training was received on 2 March 1982 at the Brunswick, Maine, Naval Air
Station.
In order to obtain flight approval from the Naval Air Safety Office, a
test flight of the system was required to determine a flight envelope within
which a P-3 can carry the U.W. scanner pod without compromising safety. This
test flight was flown from the Patuxent River Naval Air Station (PAX) in
March, 1982.
In preparation for the required testing, the scanner pod had been shipped P
to Patuxent River the preceding fall. Specifications for the tests, and all
of the coordination required was handled by Mr. Charles Noell, a civilian
working for the STRIKE Ordnance Group. Mr. Noell was suggested to us by Mr.
Harry Lehman (AIR 530C Naval Air Safety Office), who was ultimately
responsible for approving our system. The STRIKE group is continuously
testing new external stores for use on naval aircraft. They have their own
test aircraft which, unfortunately, did not include a P-3. Thus, part of the
coordination effort included borrowing someone else's airplane. In October,
1981, M. Green and L. Seidl drove from Madison to PAX with the entire scanner
system and related support equipment. The scanner was installed in the pod,
and the system was assembled in one of the STRIKE firing tunnels, and operated
using an aircraft ground power unit for power. At this time final problems
regarding how to power the system were resolved, and Mr. Noell certified the
I
. .. . .
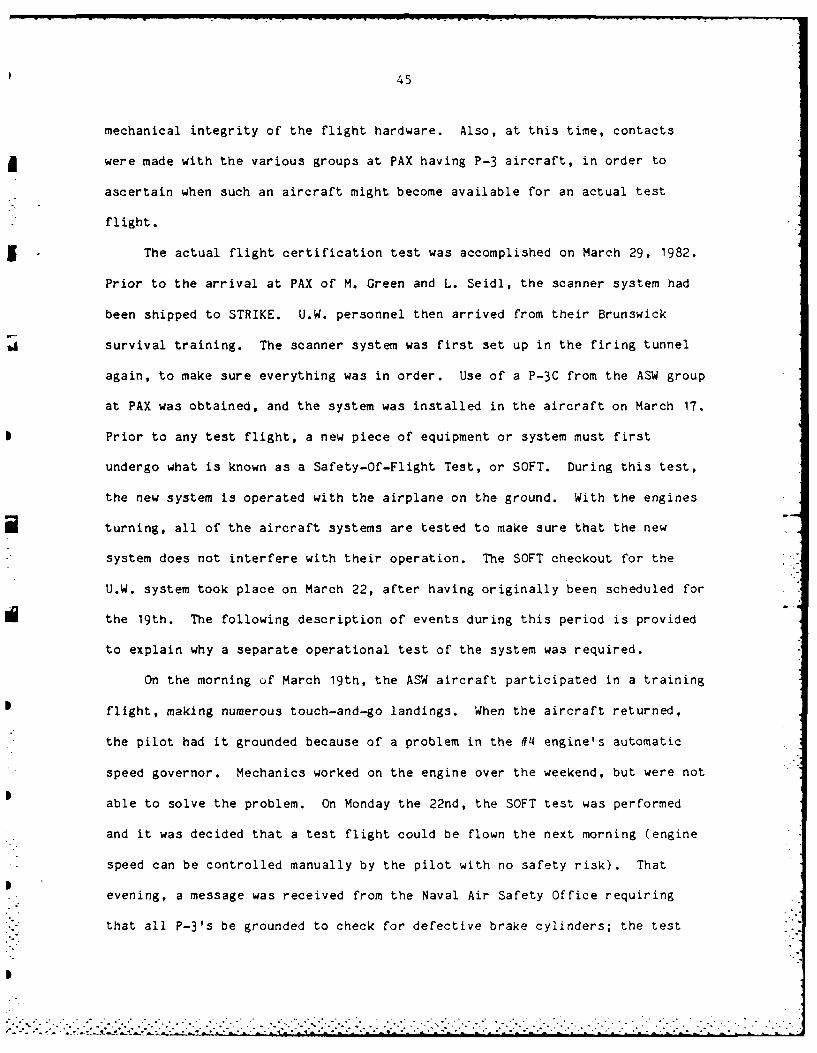
45
mechanical integrity of the flight hardware. Also, at this time, contacts
j were made with the various groups at PAX having P-3 aircraft, in order to
* ascertain when such an aircraft might become available for an actual test
- flight.
5 . The actual flight certification test was accomplished on March 29, 1982.
Prior to the arrival at PAX of M. Green and L. Seidl, the scanner system had
been shipped to STRIKE. U.W. personnel then arrived from their Brunswick
survival training. The scanner system was first set up in the firing tunnel
again, to make sure everything was in order. Use of a P-3C from the ASW group
at PAX was obtained, and the system was installed in the aircraft on March 17.
* Prior to any test flight, a new piece of equipment or system must first
undergo what is known as a Safety-Of-Flight Test, or SOFT. During this test,
the new system is operated with the airplane on the ground. With the engines
i turning, all of the aircraft systems are tested to make sure that the new
* system does not interfere with their operation. The SOFT checkout for the
U.W. system took place on March 22, after having originally been scheduled for
i the 19th. The following description of events during this period is provided
to explain why a separate operational test of the system was required.
On the morning uf March 19th, the ASW aircraft participated in a training
flight, making numerous touch-and-go landings. When the aircraft returned,
the pilot had it grounded because of a problem in the #~4 engine's automatic
speed governor. Mechanics worked on the engine over the weekend, but were not
I able to solve the problem. On Monday the 22nd, the SOFT test was performed
and it was decided that a test flight could be flown the next morning (engine
speed can be controlled manually by the pilot with no safety risk). That
evening, a message was received from the Naval Air Safety Office requiring
that all P-31s be grounded to check for defective brake cylinders; the test

46
aircraft was found to have one. Because the plane's safety equipment was
nearly due for it's 18-month check, it was decided to perform this task while I
the brake problem was fixed. We were told by Mr. Noell (all communication
with ASW came through STRIKE, which was responsible for the flight test) that
it would be at least 5 April before the flight could be rescheduled.
Therefore, M. Green returned on the 24th to Madison. On Monday the 29th, when
he called Mr. Noell to find out the rescheduled test flight date, he was
informed that the test was underway! Since, for the purposes of the test
flight, operation of the scanner system was not a requirement, and also
because ASW wanted free use of their aircraft back as soon as possible, the
test had been made as soon as the aircraft was airworthy. This had been
expeditiously accomplished by exchanging wheels with another aircraft.
Therefore, the U.W. scanning system was certifiable as airworthy without
having been operationally tested. These details are presented to illustrate a g
common problem. It seems that, despite good intentions on the part of all
concerned, interfacing with operational military aircraft is likely to be
somewhat frustrating. Without extremely competent liaison work, such
interfaces are at best fragile. Over the course of this project, our rate of
progress seemed to be directly proportional to the time spent by Navy officers
assisting us in dealing with the operational bureaucracy. Fruitful use of our
system in the future depends on such assistance.
The procedure for obtaining flight clearance for the P-3 wing-pod
scanning system in the future is as follows:
1) The funding agency (ONR, for example) will have to find some P-3
squadron willing to participate in their project.
2) The squadron will request permission from AIR 530C (Naval Air Systems 5
Command, Washington, D.C., 20361) to fly the system, citing the

47
flight test. We will have copies of the request used for the
operational test flight as an example.
3) AIR 530C will issue a "message" permitting the flights to occur. An
example of such a message is transcribed below. This message enabled
the equipment test discussed above to be undertaken.
ROUTINE
R 250148Z MAY 82
FM CUMNAVAIRSYSCOM WASHINGTON DC
TO NRL WASHINGTON DC
INFO NRLFLTSUPPDET PATUXENT RIVER MD NAVAIRTESTCEN PATUXENT RIVER MDONRDET BAY ST LOUIS MS CNR ARLINGTON VA
UNCLAS //N13034//
SUBJ: FLIGHT CLEARANCE FOR P-3 ACFT/THERMAL SCANNER POD
1. THIS MESSAGE PROVIDES INTERIM FLIGHT CLEARANCE FOR CONTINUINGEVALUATION OF THE UNIV. OF WISCONSIN THERMAL SCANNER POD (WTSP) ONNRL P-3 SERIES ACFT IAW THE FOLLOWING:
A. ACFT STATIONS: 16, 17, OR 18B. SUSPENSION: BRU-15 OR AERO-65 RACK W/AERO-1A ADAPTERC. CARRIAGE: AIRSPEED = 325 KIAS MAX
ACCELERATION = 0.0 TO PLUS 2.OGBANK ANGLE - 60 DEGREES MAX
D. JETTISON: NOT AUTHORIZED.E. LOADING: BOMB RACK SAFETY PIN SHALL BE INSTALLED IN RACK
LOADED W/WTSP TO PRECLUDE ACCIDENTAL JETTISON.F. INTERNAL INSTALLATION OF PHOTO DATA LINK AND RECORDER IS AUTH
G. USE OF NAVAIRTESTCEN PROVIDED ELECTRICAL WIRING ADAPTERREQUIRED. NAVAIRTESTCEN POC IS MR. C. NOELL.
2. P-3/WTSP FLT CLNC CANCELLED 1 OCT 82.
* BT
0a

44
5. OPERATIONAL CHECKOUT
Because of the scheduling difficulties involving the test aircraft, the
* flight safety testing of the scanner system was done without the scanner being
operated. Therefore, it was necessary to perform another flight in order to
demonstrate that the scanner system does, in fact, work with the optical data
link. This test was successfully undertaken using a P-3B from the Glenview
Naval Air Station, just north of Chicago, Illinois. The aircraft belongs to
the Naval Reserve Squadron VP9O, and we wish to acknowledge their enthusiastic
assistance. The primary lesson learned during this exercise is that it is
6 possible to fly the system in its optical-data-link configuration with minimal
down-time for the aircraft involved. This is at variance with what we had
been told by the people at PAX, and was due to the extremely cooperative
effort on the part of the people at VP9O.
The flight was conducted on 26 August, 1982. We took off at noon,
proceeding northeast toward the Lake Michigan shore. The original plan had
been to follow the shore northward to the Zion nuclear power plant. Upon
* flying over the lake, however, it was immediately apparent that we had
problems with the video data channel (the water "warmed" in an experimental
fashion towards the lake center). Consequently, the pilot flew a course
alternately over water then over land (where the data seemed to be of high
* quality), while we attempted to diagnose the problem. (We found that the
video low-pass cutoff was too high.) Our flight took us as far north as the
* Point Beach power plant, at which point we turned around and returned to
Glenview.
Two data files (of lengths 10 and 20 minutes) were recorded during the
* flight; one while passing the Zion plant, the other in the area of Point

49
Beach. The flight parameters were the same for both files, the altitude was
2,500 feet above the water, at an airspeed of 150 knots.
Data taken near Zion are shown in Figure 26. This figure was made by
dumping the original data tape onto a high-resolution color-graphics monitor
at the U.W. Image Processing Laboratory. Light-toned areas correspond to warm
surfaces with high emissivity, dark-toned areas to colder surfaces. A freeway
interchange and the shoreline of Lake Michigan are clearly visible, together
with many other land features. However, the warm surface water near the shore
is probably not real. Also, large, isothermal areas do not appear to be
isothermal in the data, apparently because of the above-mentioned mistake in
selecting the low-frequency cutoff for the video channel.
It should be noted that the time of year was not appropriate for
encountering marked temperature contrasts in the lake. Also, no thermal
plumes were found at the two power plants.
This test flight demonstrated that the data link between the scanner and
the data acquisition system actually works in fieid conditions. We have
produced acceptable images of terrestrial targets. The test was not a
complete success, however because:
a) The low frequency cut-off for the video channel was set too high, so
that large isothermal targets didn't appear as such. A solution for
this problem has been designed.
b) The calibration data channel would not synchronize reliably. We
haven't been able to reproduce the problem in the lab, but the
solution will probably require a new data encoding scheme. This is
regarded as a minor problem, as we usually rely on ship-gathered SST
data for calibration.
The system can readily be installed in a P-3 in a day. (In fact, the
4P. .s<-:. . .:.,

50
CC
cc
cu WCC Z
X Q)
ILI
copy ~~~ ~ ~ C -vLal oDTCde o
OKM"~~~ beiCCroada
51
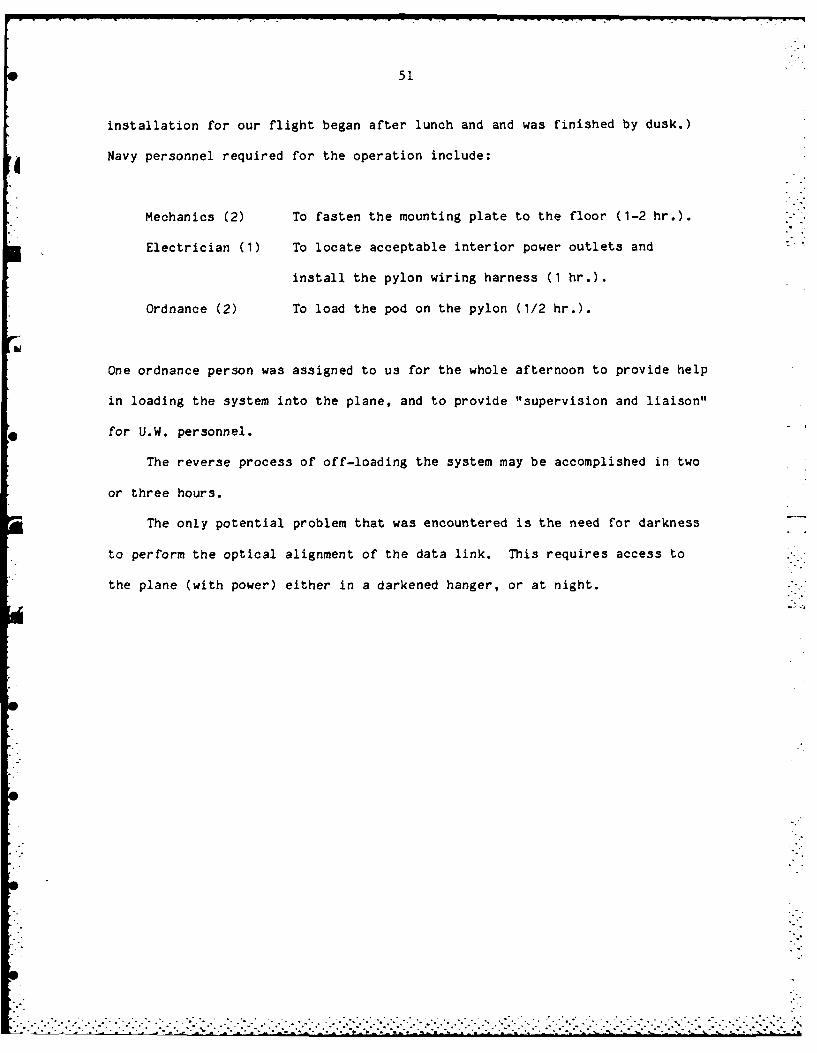
installation for our flight began after lunch and and was finished by dusk.)
Navy personnel required for the operation include:
Mechanics (2) To fasten the mounting plate to the floor (1-2 hr.).
Electrician (1) To locate acceptable interior power outlets and
install the pylon wiring harness (1 hr.).
Ordnance (2) To load the pod on the pylon (1/2 hr.).
One ordnance person was assigned to us for the whole afternoon to provide help
in loading the system into the plane, and to provide "supervision and liaison"
for U.W. personnel.
The reverse process of off-loading the system may be accomplished in two
or three hours.
The only potential problem that was encountered is the need for darkness
to perform the optical alignment of the data link. This requires access to
the plane (with power) either in a darkened hanger, or at night.

52
6. USING THE SYSTEM: OPERATIONAL CONSIDERATIONS
It is our understanding that the following steps will be required for
using the U.W. thermal scanner system with Navy P-3 aircraft:
1. Suitable research projects must be found for which the use of Navy
aircraft is appropriate. Presumably, some Navy funding agency will be
involved. It would seem most efficacious if the sponsor were to find a
source for the P-3 to be used. Alternatively, the reserve squadron at the
Glenview Naval Air Station has expressed some interest at becoming
involved in scanner projects, if funding and schedule considerations could
be worked out. This would seem to be a workable arrangement for projects
involving the Great Lakes or the Atlantic coast.
* 2. The "owner" of the aircraft (e.g. the Naval Reserve Squadron) would
request a clearance from the Naval Air Systems Command (AIR 530) to fly
with the U.W. system.
*3. AIR 530 would issue a message providing "interim flight clearance", for the
projected flights. This message specifies the period of time for the
authorization as well as the appropriate flight parameters. An example of
such a message is provided in section 5.
4~. The scanner system should be delivered to the aircraft staging area at
least several days ahead of the proposed flight. (Madison is probably
close enough to the Glenview NAS to be considered "there" in this regard.)
This should include all ancillary equipment which may be required to work
on the system. For example, liquid nitrogen should be delivered, if it is
not available on the base.
5. When the time arrives to load the system, the aircraft will be "grounded."
Installation of the system proceeds as follows:
53
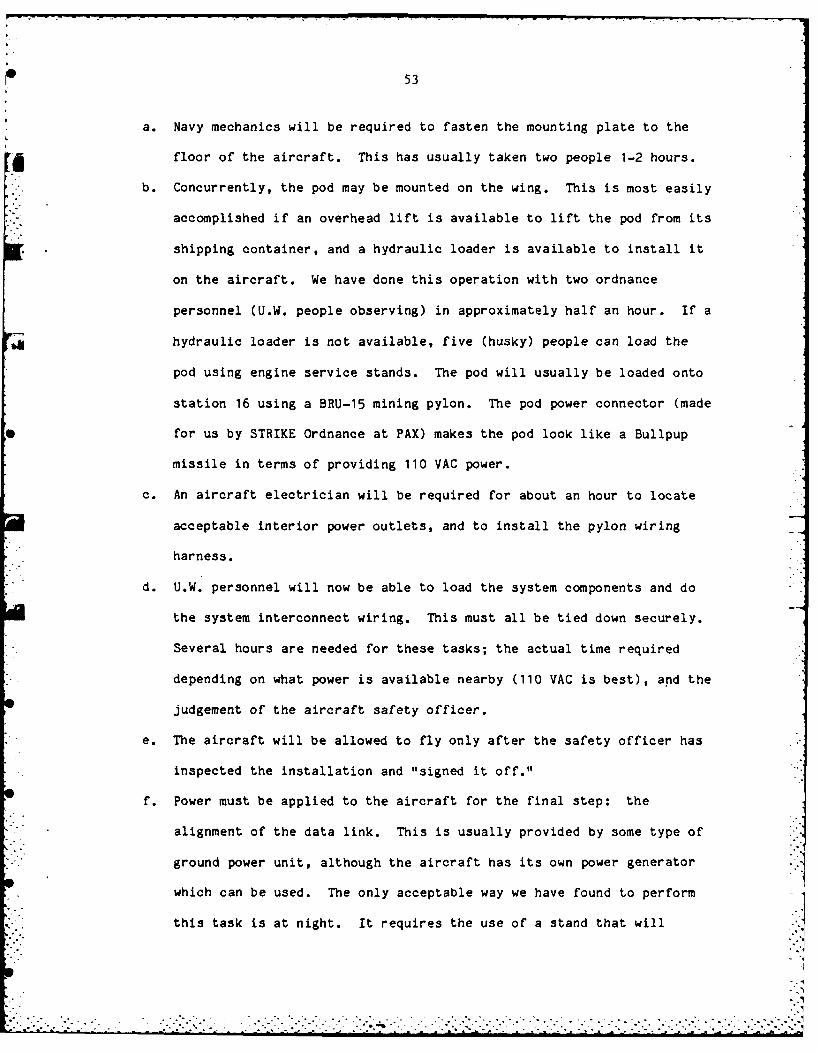
a. Navy mechanics will be required to fasten the mounting plate to the
floor of the aircraft. This has usually taken two people 1-2 hours.
b. Concurrently, the pod may be mounted on the wing. This is most easily
accomplished if an overhead lift is available to lift the pod from its
shipping container, and a hydraulic loader is available to install it
on the aircraft. We have done this operation with two ordnance
personnel CU.W. people observing) in approximately half an hour. If a
hydraulic loader is not available, five (husky) people can load the
pod using engine service stands. The pod will usually be loaded onto
station 16 using a BRU-15 mining pylon. The pod power connector (made
for us by STRIKE Ordnance at PAX) makes the pod look like a Bullpup
missile in terms of providing 110 VAC power.
c. An aircraft electrician will be required for about an hour to locate
acceptable interior power outlets, and to install the pylon wiring
harness.
d. U.W. personnel will now be able to load the system components and do
the system interconnect wiring. This must all be tied down securely.
Several hours are needed for these tasks; the actual time required
depending on what power is available nearby (110 VAC is best), and the
judgement of the aircraft safety officer.
e. The aircraft will be allowed to fly only after the safety officer has
inspected the installation and "signed it off."
f. Power must be applied to the aircraft for the final step: the
alignment of the data link. This is usually provided by some type of
ground power unit, although the aircraft has its own power generator
which can be used. The only acceptable way we have found to perform
this task is at night. It requires the use of a stand that will
. .. "..

54
permit access to the aircraft exterior at the height of the observer's
window. A portable IR radiometer is also required to determine the
location of the beam coming from the pod. A Tektronix model J16 with
a J6502 detector head (available from the U.W. Instrumentation Systems
Center) has been used in the past. Following alignment, the system is
essentially ready to fly.
At least an hour before the flight, the LN2 Dewar in the scanner pod
should be filled. It will be refilled at the last possible moment (congruent
with safety) to insure the longest possible data acquisition time. This
operation can be performed by one person, but is more efficient with two. The
4 scanner compartment cover must be installed after the final fill. This
operation should take about ten minutes.
Operation of the scanning system can proceed as the plane crew goes
through their checklists and the plane is taxiing for takeoff. During the
summer, tarred cracks in the pavement provide confirmation that the system is
operating.
Following the last flight, the system is off-loaded from the aircraft in
about the reverse order that it was installed: the data acquisition system is
unwired and dismantled; the mounting plate removed; and the pieces removed
from the aircraft. The pod is removed from the pylon and replaced in its
shipping box. This whole procedure is, of course, much quicker than the
installation, taking about two hours.I
lI
°
V ~ *.' *.'.* ". . .
55 0
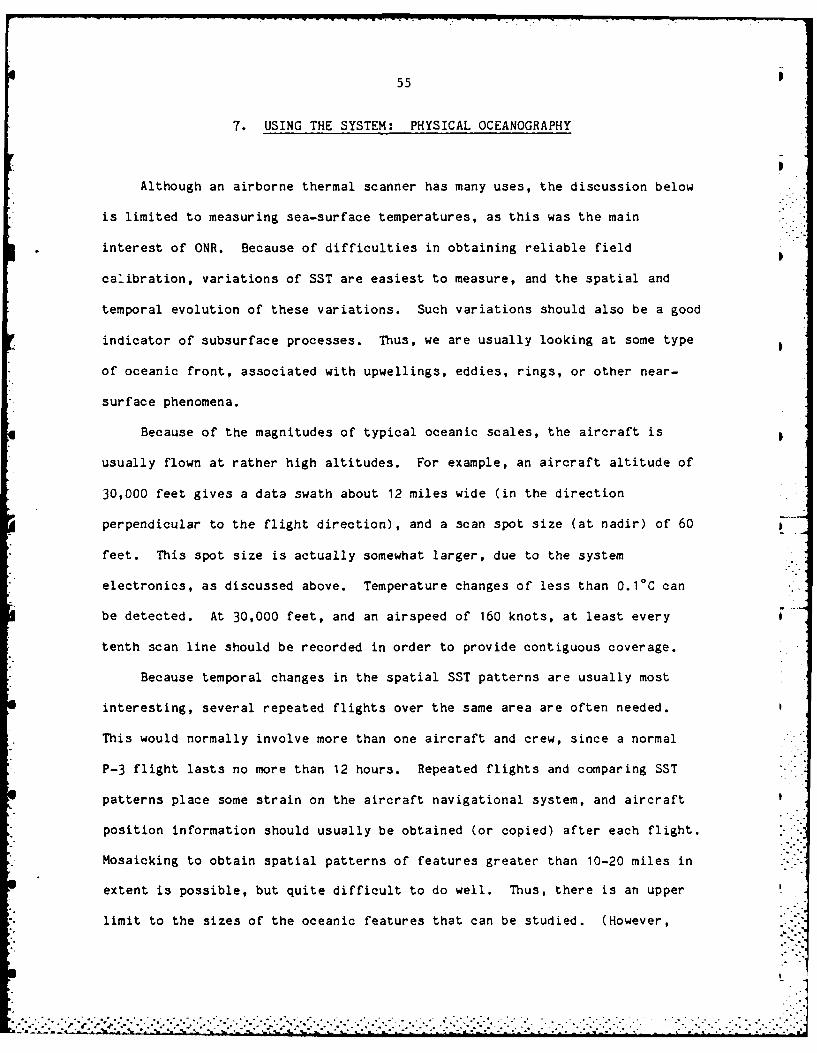
7. USING THE SYSTEM: PHYSICAL OCEANOGRAPHY
0Although an airborne thermal scanner has many uses, the discussion below
is limited to measuring sea-surface temperatures, as this was the main
interest of ONR. Because of difficulties in obtaining reliable field
calibration, variations of SST are easiest to measure, and the spatial and
temporal evolution of these variations. Such variations should also be a good
indicator of subsurface processes. Thus, we are usually looking at some type
of oceanic front, associated with upwellings, eddies, rings, or other near-
surface phenomena.
Because of the magnitudes of typical oceanic scales, the aircraft is
usually flown at rather high altitudes. For example, an aircraft altitude of
30,000 feet gives a data swath about 12 miles wide (in the direction
perpendicular to the flight direction), and a scan spot size (at nadir) of 60
feet. This spot size is actually somewhat larger, due to the system
electronics, as discussed above. Temperature changes of less than 0.1 C can
be detected. At 30,000 feet, and an airspeed of 160 knots, at least every
tenth scan line should be recorded in order to provide contiguous coverage.
Because temporal changes in the spatial SST patterns are usually most
interesting, several repeated flights over the same area are often needed.
This would normally involve more than one aircraft and crew, since a normal
P-3 flight lasts no more than 12 hours. Repeated flights and comparing SST
patterns place some strain on the aircraft navigational system, and aircraft
position information should usually be obtained (or copied) after each flight.
Mosaicking to obtain spatial patterns of features greater than 10-20 miles in
extent is possible, but quite difficult to do well. Thus, there is an upper
limit to the sizes of the oceanic features that can be studied. (However,
. .. ..

56
this limit is close to the lower limit of what can be done well using a
satellite, and the combination of aircraft and satellite SST data is usually
most useful.)
Airborne thermal scanning efforts rarely stand on their own. Indeed,
they seem most useful in providing information on the "large-scale" SST S
context in which smaller-scale processes being studied in situ are taking
place. Thus, surface calibration is essential, and should usually be provided
by a radiation thermometer operated aboard one of the research ships. This,
of course, involves a certain amount of plane/ship coordination, and requires
radio communication. (Flying over the same area at a series of altitudes can
also help in removing atmospheric effects from the temperature data.) One
typical problem that we have found in coordinating plane/ship work is that
good weather for scanning operations is quite often not good weather for ship
operations, and vice versa.
Another sort of coordination seems crucial to the success of such a "
scanning effort with a Navy P-3 aircraft. The assistance of a military
liaison officer as our interface between the P-3 squadron and the research
team is essential for a successful mission. In this regard, Navy Reserve P-3
squadrons seem far more flexible than Fleet squadrons, and it is recommended
that these be considered first, for any serious scanning efforts. 5
Finally, as noted in section 5, minor modifications of our system are
needed before a successful mission can be carried out. These changes should
take about 12 man-months, and cost about $50,000. It seems well worth the
time and cost to make these changes now, so as to be ready for a coordinated
effort in the near future. Of course, another test flight should then be
undertaken.
S

57
8. SUMMARY
An infrared scanning systemhas been described. This system allows
almost any Navy P-3 aircraft to be used to obtain maps of sea-surface
temperature, and can thus be readily used to provide SST data for many
oceanographic experiments. Although a few minor changes need to be made
(e.g., adjusting the low-pass filter of the video, and completing the real-
time data display software), the device is essentially ready to be put into
use.
This scanning system will probably be most helpful when operated as part
of a larger program, and in areas demanding either frequent coverage, or long
flight times. The scale of the phenomena under investigation should probably
be at most 50-100 km, and SST should, of course, be indicative of the dynamics
of the process. Such a system would seem to be almost essential to a research
program when the SST gradients are sharp, and changing rapidly in time. , .
.S
• .
p

58
9. ACKNOWLEDGEMENTS
This work would have been impossible without the able assistance of CDR
Kenneth Robinson of the U.S. Navy, Dr. Paul R. Twitchell of ONR, and Dr. W.
Stanley Wilson, then of ONR. We extend our gratitude to all these people.
Op
..
S-. . ., - ' - , -' -- ' .- -' .- .' .- . , ' -- ' . .. - -.. - - - - " . " ." .-' -" " .- -" --i '. -
S " : " ' ' ' ' ' h , , 1 3 ' ' l ' - . ."i - - ' - - - ' " " " " - " ' £ ' - ' - - - - - - ' "

59
10. REFERENCES
1. Scarpace, F.L., Madding, R.P., and Green, T., 1975, "Scanning Thermal
Plumes," Photogrammetric Engineering and Remote Sensing, pp. 1223-1231.
2. Green, T., Madding, R.P., and Scarpace, F.L., 1977, "Types of Thermal
Plumes in Coastal Waters," Water Research 11, pp. 123-125.
3. Madding, R.P., Scarpace, F.L., and Green, T., 1977, "Thermal Plumes along
the Wisconsin Shore of Lake Michigan," Transactions of the Wisconsin
Academy of Sciences, LXV, pp. 86-119.
4. Green, T., and Terrell, R.E., 1977, "The Surface Temperature Structure
Associated with the Keweenaw Current in Lake Superior," J. Geophysical
Research 83, pp. 419-426.
5. Scarpace, F.L. and Green, T., 1979, "The Spatial Variability of Coastal
Surface Water Temperature during Upwelling," J. Physical Oceanography
9(3), pp. 638-643.
6. Green, T., and Roffler, S., 1981, "Field Observations of Fronts and High-
Frequency Temperature Fluctuations in a Thermal Plume," Advances in Water
Resources Research 4, pp. 137-145.
7. Green, T., 1983, "Observations of Instabilities of a Great Lakes Coastal
Current," Coastal Oceanography (Plenum Press), pp. 321-335.
8. "Operation and Maintenance Manual for Airborne Infrared Scanning
Radiometer RS-18A," Texas Instruments, Inc., Equipment Group, 13500 North
Central Expressway, Dallas, TX 75222, Manual No. HB41-EG71 (1971).
9. Green, M.J., 1982, "Application of an Optical Data Link in an Airborne
Scanning System," Rev. Sci. Instruments 53(8), pp. 1278-1280.
10. "Model 761 Television Transmission Set Owner's Manual," American Laser
Systems, Inc., Goleta, CA 93017.
.. . . . . . . .. . . . . . . . . . . .

60
* 11. "Model FT8640A Formatted Tape Transport," Pertek Computer Corporation,
Pertek Division, 9600 Irondale Avenue, Chatsworth, CA 91311, Operating
and Service Manual No. 1041925 (1977).

DTIC
