rcp4.5: a pathway for stabilization of radiative … rcp4.5: a pathway for stabilization of...
TRANSCRIPT

1
RCP4.5: A Pathway for Stabilization of
Radiative Forcing by 2100
Allison M. Thomson*, Katherine V. Calvin, Steven J. Smith, G. Page Kyle, April Volke,
Pralit Patel, Sabrina Delgado-Arias, Ben Bond-Lamberty, Marshall A. Wise, Leon E. Clarke
and James A. Edmonds
Joint Global Change Research Institute, Pacific Northwest National Laboratory and the University of Maryland, 5825 University Research Court, College Park, MD 20740.
* Corresponding author: [email protected]; phone (301-314-6750); fax (301-314-6719).
ABSTRACT
Representative Concentration Pathway (RCP) 4.5 is a scenario that stabilizes radiative forcing at 4.5 Watts per meter squared in the year 2100 without ever exceeding that value. Simulated with the Global Change Assessment Model (GCAM), RCP4.5 includes long-term, global emissions of greenhouse gases, short-lived species, and land-use-land-cover in a global economic framework. RCP4.5 was updated from earlier GCAM scenarios to incorporate historical emissions and land cover information common to the RCP process and follows a cost-minimizing pathway to reach the target radiative forcing. The imperative to limit emissions in order to reach this target drives changes in the energy system, including shifts to electricity, to lower emissions energy technologies and to the deployment of carbon capture and geologic storage technology. In addition, the RCP4.5 emissions price also applies to land use emissions; as a result, forest lands expand from their present day extent. The simulated future emissions and land use were downscaled from the regional simulation to a grid to facilitate transfer to climate models. While there are many alternative pathways to achieve a radiative forcing level of 4.5 W m-2,
the application of the RCP4.5 provides a common platform for climate models to explore the climate system response to stabilizing the anthropogenic components of radiative forcing.
Keywords: climate change mitigation; Integrated Assessment; Global Change Assessment Model; Representative Concentration Pathway; scenario.
2
1. INTRODUCTION
Representative Concentration Pathway (RCP) 4.5 is a scenario of long-term,
global emissions of greenhouse gases, short-lived species, and land-use-land-
cover which stabilizes radiative forcing at 4.5 Watts per meter squared (W m-
2, approximately 650 ppm CO2-equivalent) in the year 2100 without ever
exceeding that value. The defining characteristics of this scenario are
enumerated in Moss et al. (2008, 2010). RCP 4.5 is based on the MiniCAM
Level 3 stabilization scenario reported in Clarke, et al. (2007) with additional
detail on the non-CO2 and pollution control assumptions in Smith and Wigley
(2006), and incorporating updated land use modeling and terrestrial carbon
emissions pricing assumptions as reported in Wise et al (2009a,b).
Unlike the scenarios developed by the IPCC and reported in Nakicenovic et al.
(2000), which examined possible global futures and associated greenhouse-
related emissions in the absence of measures designed to limit anthropogenic
climate change, RCP 4.5 is a stabilization scenario and assumes that climate
policies, in this instance the introduction of a set of global greenhouse gas
emissions prices, are invoked to achieve the goal of limiting emissions,
concentrations and radiative forcing.
While RCP 4.5 is based on the “MiniCAM Level 3” scenario reported in Clarke
et al. (2007), RCP 4.5 differs in several important regards. First, the Clarke et
al. (2007) scenario considered a slightly different definition of radiative
forcing than RCP 4.5. In Clarke et al. (2007), radiative forcing is defined in
terms of a suite of six greenhouse gases, carbon dioxide (CO2), methane
(CH4), nitrous oxide (N2O), hydrofluorocarbons (HFCs), perfluorocarbons
(PFCs) and sulfur hexafluoride (SF6). RCP 4.5 considered the influences of a
broader set of anthropogenic emissions including CO2, CH4, N2O, HFCs, PFCs,
and SF6, but also chemically active gases such as carbon monoxide (CO) and
volatile organic compounds (VOCs). Importantly, RCP 4.5 considers the
influence of sulfur aerosols, as well as black and organic carbon. The Clarke
et al. (2007) scenario stabilized radiative forcing at approximately 4.7 W m-2
while RCP stabilizes radiative forcing at 4.5 W m-2. For CO2, the most

3
important anthropogenically released greenhouse gas, year 2100
concentrations are somewhat higher in the Clarke et al. (2007) scenario,
approximately 550 ppm CO2, than in RCP 4.5, approximately 525 ppm CO2.
RCP 4.5 also employed updated historical data series, calibration to the year
2000 consensus emissions inventories from Lamarque et al. (2010), and a
new representation of residue biomass supply (Gregg and Smith 2010).
More importantly, RCP 4.5 employed a more sophisticated land-use and land-
cover model (Wise et al. 2009a,b) than was available for use in Clarke et al.
(2007). Perhaps the most important difference between Clarke et al. (2007)
and RCP 4.5 is the downscaling of emissions and land-use-land-cover from
the 14 geopolitical GCAM regions to a 0.5 degree grid for the RCPs in order to
enable use of the scenario in global climate models. Finally, RCP 4.5 takes
advantage of one technology that was not modeled in Clarke et al., namely
combining bioenergy production with CO2 capture and geologic storage
(CCS). This technology combination is capable of producing final energy such
as electricity with net-negative carbon emissions.
Because the RCPs are based on scenarios documented in the open literature,
each reflects a different set of underlying socioeconomic assumptions. RCP
4.5 is a stabilization scenario and thus assumes the imposition of emissions
mitigation policies. RCP 4.5 is derived from its own “reference”, or “no-
climate-policy”, scenario. This reference scenario is unique to RCP 4.5 and
differs from RCP 8.5 as well as from the reference scenarios associated with
RCP 6.0 and RCP 2.6.
In the remainder of this paper we will discuss the modeling environment
employed to develop RCP 4.5, the Global Change Assessment Model (GCAM),
which was used to transform the original MiniCAM Level 3 scenario (Clarke
et al., 2007) into RCP 4.5. We will then proceed to describe the underlying
socioeconomic assumptions that shape RCP 4.5 and its associated reference
scenario and discuss the characteristics of RCP 4.5, highlighting the global
energy, economic, land use, and land cover systems, as well as the
mechanisms employed to limit radiative forcing to 4.5 W m-2 and contrast
RCP 4.5 to its reference scenario.

4
2. METHODS
2.1 The Global Change Assessment Model
The GCAM is a global integrated assessment model and a direct descendent of
the MiniCAM model (Kim et al., 2006; Clarke et al., 2007; Brenkert et al.,
2003). It combines representations of the global economy, energy systems,
agriculture and land use, with representation of terrestrial and ocean carbon
cycles, a suite of coupled gas-cycle, climate, and ice-melt models. GCAM
tracks emissions and concentrations of greenhouse gases and short-lived
species including CO2, CH4, N2O, NOx, VOCs, CO, SO2, carbonaceous aerosols,
HFCs, PFCs, and SF6.
GCAM is a dynamic recursive economic model driven by assumptions about
population size, and labor productivity that determine potential gross
domestic product in each of 14 regions at 15 year time steps. GCAM
establishes market-clearing prices for all energy, agriculture and land
markets such that supplies and demands for all markets balance
simultaneously. The GCAM energy system includes primary energy
resources, production, energy transformation to final fuels, and the
employment of final energy forms to deliver energy services such as
passenger kilometers in transport or space conditioning for buildings. GCAM
contains detailed representations of technology options in all of the economic
components of the system with technology choice determined by market
competition.
The agriculture and land use component is fully integrated with the GCAM
economic and energy system components. Land is allocated between
alternative uses based on expected profitability, which in turn depends on
the productivity of the land-based product (e.g. mass of harvestable product
per ha), product price, and non-land costs of production (labor, fertilizer,
etc.). The productivity of land-based products is subject to change over time
based on future estimates of crop productivity change. We adopt
assumptions for the next 30 years based on those employed by the UN Food

5
and Agricultural Organization (Bruinsma, 2003). A full description of the
agriculture and land use modeling in GCAM as used for RCP4.5 can be found
in Wise et al. (2009a).
The GCAM physical atmosphere and climate are represented by the Model for
the Assessment of Greenhouse-Gas Induced Climate Change (MAGICC; Wigley
and Raper 1992, 2002; Raper et al., 1996). To construct the RCP4.5 scenario,
we use MAGICC version 5.3, which is initialized to the IPCC 4th Assessment
Report.1 The definition of total radiative forcing for the RCP4.5 does not
include albedo, nitrate, and mineral dust. These three forcing agents have a
fixed future forcing of -0.4 W m-2 in MAGICC version 5.3.
The RCP4.5 stabilization scenario is a cost-minimizing pathway. It assumes
that all nations of the world undertake emissions mitigation simultaneously
and effectively, and share a common global price that all emissions to the
atmosphere must pay with emissions of different gases priced according to
their hundred-year global warming potentials (Forster et al., 2007). All
sectors of the economy are covered, including agriculture and land use
emissions. That emissions price also rises over time so as to minimize the
present discounted cost of emissions mitigation. The policy also assumes
that deployment mechanisms and measurement and monitoring of both
fossil fuel and terrestrial carbon are not barriers to implementation of
emissions mitigation.
This cost-minimizing price path has two components. Prior to reaching the
target, 4.5 W m-2, cost minimization requires that the greenhouse gas
emissions price rise at the interest rate, adjusted by the rate of ocean uptake
(Edmonds et al., 2008; Clarke et al., 2007; Hotelling, 1931; Peck and Wan,
1996). An emissions price path with this property precludes all
opportunities for arbitrage because the marginal cost of abatement is
constant across time. The second component of the pathway occurs after the
target is reached. At this time, the emissions price is adjusted to ensure that

6
the radiative forcing level remains at its target. For the RCP4.5, stabilization
occurs in 2080; prior to 2080 the emissions price rises at 5% per year, and
after 2080 the emissions price is roughly constant.
2.2 Emissions Downscaling
Emissions from GCAM were downscaled using a two-step method, first
downscaling to the country level and then mapping to a spatial grid within
each country. Detailed emissions from GCAM were aggregated into the 12
RCP reporting sectors for the 14 GCAM regions at each 15-year model time
period. Emissions from each sector were downscaled to a country level for
231 countries using the methodology outlined in Van Vuuren et al. (2007).
Input data for this step includes the country-level population projection used
for the RCP4.5 scenario, a gridded base-year GDP data set from van Vuuren et
al. (2007), who combined World Bank GDP information with the GPW
gridded population data set (CIESIN & CIAT 2005), and year 2000 gridded
emissions data from Lamarque et al. (2010). Gridded GDP and emissions data
were used so that base-year GDP and emissions differences could
consistently be estimated for any set of countries or regions. A convergence
year of 2200 for GDP and emissions intensity calculations (slightly larger
than value used by Van Vuuren et al. 2007) was used for all anthropogenic
emissions sectors. The pattern of forest and grassland emissions within each
region was held constant by setting a high convergence year of 10,000.
The downscaled sectoral emissions for each country were mapped to a 0.5
degree grid using the base-year 2000 gridded emissions data from Lamarque
et al. (2010). The relative emissions distribution within each country was
held constant over time for each emissions sector. All downscaling
calculations were performed with each 0.5 degree grid cell subdivided into
231 countries using 2.5 minute GPW country boundary data (CIESIN & CIAT
2005). After downscaling on a sub-divided grid for each country and
1 Note that the final concentration pathway values for the RCP4.5 were produced in MAGICC
version 6 (see Meinhausen et al., this issue).

7
emissions sector, emissions were summed to a 0.5 degree resolution for the
final data product.
Emissions from international shipping and aircraft do not occur within
country boundaries and instead were aggregated to one global emissions
figure. Gridded shipping emissions were globally scaled from the RCP
consensus year 2000 emissions grid (Lamarque et al. 2010). Aircraft
emissions used a time changing pattern from the QUANTIFY B2i emissions
scenario (Lee et al. 2010), as the overall pathway for this scenario closely
matched the GCAM model output. The QUANTIFY three dimensional
emissions pattern was collapsed to two dimensions (latitude and longitude)
for 2000, 2025, 2050, and 2100. This pattern was interpolated to decadal
intervals and scaled globally to match the GCAM global aviation emissions
values.
2.3 Land Use Downscaling
The RCP scenario process is the first to explicitly provide land use projections
in addition to future emissions pathways for input to global climate models.
Because all four participating integrated assessment models, and all receiving
climate models, use different characterizations and definitions of land use
types and transitions, a harmonization step was necessary. The
harmonization was designed to provide a continuous, consistent set of land
use inputs for climate models from 1500 through 2100 with a smooth
transition between historical data (1500-2005) and future projections
(2005-2100) (see Hurtt et al., this volume).
In the GCAM model results, land use is simulated at the 14 region level and
land use changes and transitions are not spatially attributed. In this case, the
land use was first downscaled to the 0.5 degree harmonization grid, following
the algorithms of the the global land-use model (GLM) (Hurtt et al. 2006),
preserving GCAM regional land use area totals and generating smooth spatial
patterns in the transition from historical to future states. These downscaling
algorithms were developed and implemented by the land use harmonization
8
team at the University of New Hampshire (Hurtt et al., this volume) and are
fully described in Thomson et al. (2010).
3. RESULTS
3.1 GCAM Reference Scenario
Each of the RCPs was produced by a different integrated assessment model;
therefore, each has its own reference scenario. Thus, the reference scenario
for RCP 4.5 is not RCP8.5 but rather a GCAM reference scenario. The GCAM
reference scenario (Clarke et al., 2007) depicts a world in which global
population reaches a maximum of more than 9 billion in 2065 and then
declines to 8.7 billion in 2100 while global GDP grows by an order of
magnitude and global energy consumption triples. The reference scenario
includes no explicit policies to limit carbon emissions, and therefore fossil
fuels continue to dominate global energy consumption, despite substantial
growth in nuclear and renewable energy. Atmospheric CO2 concentrations
rise throughout the century and reach 792 ppmv by 2100, with total
radiative forcing approaching 7 W m-2 (Fig. 1). Forest land declines in the
reference scenario to accommodate increases in land use for food and
bioenergy crops. Even with the assumed agricultural productivity increases,
crop land increases in the first half of the century due to increases in
population and income, which drives an increase in land-intensive meat
consumption. After 2050 the rate of growth in food demand slows, in part
due to declining population. As a result the amount of cropland and also land
use change (LUC) emissions decline as agricultural crop productivity
continues to increase.
3.2 4.5 Stabilization Scenario
The RCP4.5 scenario is based on the same population and income drivers as
the GCAM reference scenario but applies greenhouse gas emissions valuation
policies to stabilize atmospheric radiative forcing at 4.5 W m-2 in 2100 (Fig.
1). This imperative to stabilize climate change drives anthropogenic CO2
emissions downward throughout the next century (Fig. 2). RCP4.5 results in

9
an atmospheric CO2 concentration of 526 ppm in 21002, compared to 792
ppm in the GCAM reference case. This stabilization is achieved in 2080. At
this point in time, total radiative forcing reaches 4.5 W m-2 and the emissions
price becomes roughly constant. CO2 emissions also become roughly
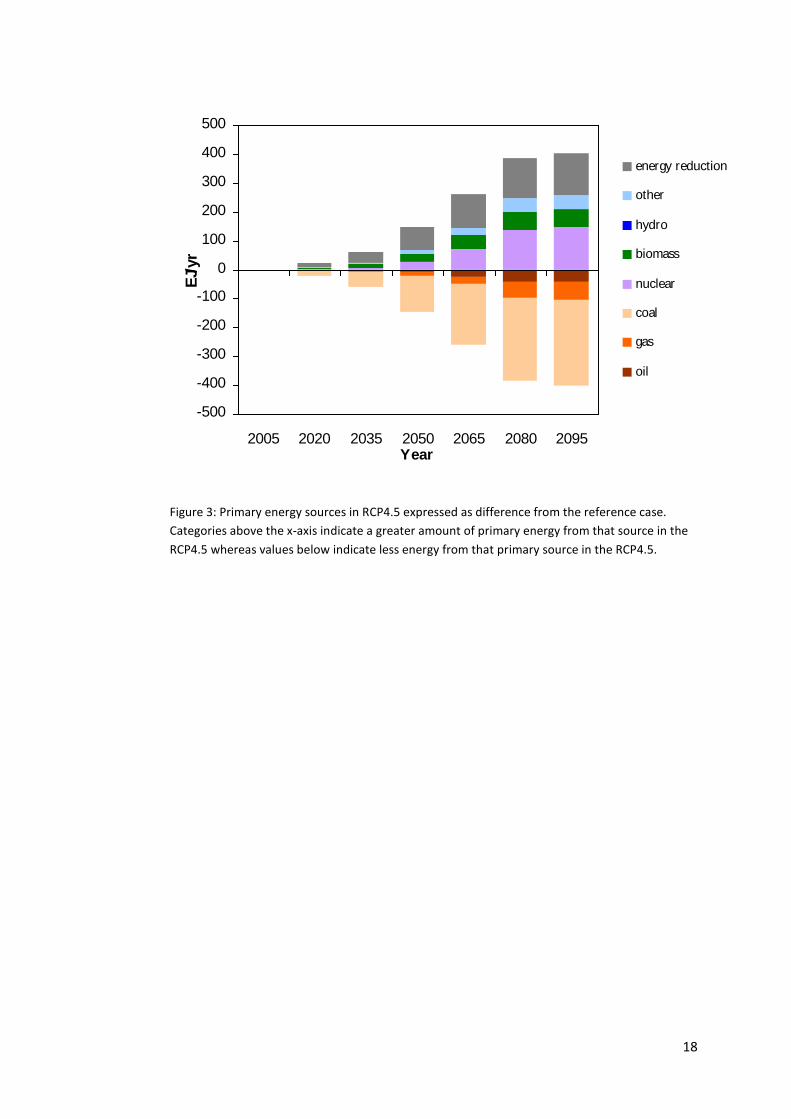
constant. RCP4.5 depicts declines in overall energy use, as well as declines in
fossil fuel use compared to the reference case, while substantial increases in
renewable energy forms and nuclear energy both occur (Fig. 3). The
proportion of total final energy that is supplied by electricity also increases
due to fuel switching in the end-use sectors. The emergence of large-scale
carbon dioxide capture and storage (CCS) (Fig. 4) allows continued use of
fossil fuels for electricity generation and cement manufacture, among other
uses, though total use is lower than in the reference scenario. Bioenergy with
CCS is used to produce electricity, providing an energy source that is carbon-
negative with respect to the atmosphere. The amount of bioenergy deployed
is limited by the availability of dedicated crop and crop residue feedstocks
from the land system.
One important feature influencing the availability of bioenergy feedstocks in
the RCP4.5 is the expansion of forests as part of the larger emissions
mitigation strategy. The extent of afforestation follows Wise et al., 2009b.
This idealized case assumes that all carbon from fossil fuel and land use
emissions are charged an equal penalty price, and thus reductions in LUC
emissions constitute an available strategy for global emissions mitigation.
The GCAM therefore simulates the preservation of large stocks of terrestrial
carbon in forests, with some crop and pasture lands converted to bioenergy
crops (Fig. 5). Under this policy environment, bioenergy crops still provide
an important source of fuel, >50 EJ/yr, to meet global energy demand in
2100. This is accomplished while still providing for the world’s dietary need
by shifting toward food products with a smaller carbon footprint.
2 526 ppmv is the CO2 concentration from GCAM before harmonization in MAGICC6 (see
Meinhausen et al., this issue. The harmonized RCP4.5 CO2 concentration in 2100 is 538 ppmv.

10
Carbon prices reach $85 per ton of CO2 by 2100 (Fig. 6) which transforms the
global economy. Electric power generation changes from the largest source
of emissions in the world to a system with net negative emissions—made
possible by increased reliance on nuclear and renewable energy forms such
as wind, solar and geothermal, and the application of CO2 capture and storage
technology to both fossil fuel sources and bioenergy (Figs. 3 and 4).
Buildings and industry largely de-carbonize by employing more efficient end-
use technologies and by electrifying. Annual land-use change emissions are
reduced to 0.13 GtCO2/yr (Fig. 2). Total anthropogenic CO2 emissions for the
RCP4.5 peak around 42 Gt CO2 per year (Fig. 2) around 2040 and decline to
2080 before leveling off around 15 Gt CO2 per year for the remainder of the
century. Other greenhouse gases respond to both the mitigation price
signals in the GCAM as well as to assumed pollution controls. Downscaling of
these emissions leads to additional insights about future non-CO2 emissions
that are important considerations in the global climate and atmospheric
chemistry models. For example, aggregate emissions and the associated
radiative forcing contribution of CH4 from all sectors are relatively constant
at the global level (Fig. 7); however, when downscaled they exhibit
geographical shifts (Fig. 8). CH4 emissions in South America and Africa
increase over the century while those from China, India the US and Western
Europe decline.
CO2 constitutes the largest contribution to total radiative forcing in the
RCP4.5, followed by CH4, halocarbons, tropospheric ozone, and N2O (Fig. 7).
The relative proportion of the non-CO2 components of positive radiative
forcing remains constant over time. Sulfate forcing is net negative throughout
the century but this influence declines over time largely due to assumed
increases in pollution control with income, although there are also indirect
sulfur dioxide emissions reductions due to the greenhouse gas mitigation
policy (Smith et al. 2005).

11
3.3 GCAM-Simulation of the Four Pathways
In order to facilitate model intercomparisons and further explore the
characteristics of the RCPs, the participating models simulated their assigned
RCP as well as the other three defined radiative forcing levels. The GCAM
was used to simulate a 2.6 W m-2 peak-and-decline scenario for use in the
evaluation of low radiative forcing targets during the planning stages of the
RCPs (Weyant et al, 2009) and is fully documented in Calvin et al (2009). The
GCAM6.0 was simulated as a stabilization following the same methods as the
GCAM4.5 but resulting in lower carbon prices and a longer time to
stabilization. All three of the mitigation cases with GCAM (2.6, 4.5 and 6.0 W
m-2) used the same technology, population and economic assumptions
described earlier in this paper and in Clarke et al. (2007). The GCAM
reference case with these assumptions and no climate mitigation policy
reaches around 7.0 W m-2 radiative forcing in 2100. Thus, to reach the RCP
level of 8.5 W m2 required altering some underlying assumptions. Several
modifications of underlying assumptions were tested; the case selected for
the GCAM8.5 follows the same population and economic drivers as the other
GCAM scenarios, but assumes no technological improvement in energy
technologies or agricultural productivity. In other words, the GCAM8.5 is the
GCAM reference case if all technological development is frozen after 2005.
This is a hypothetical experiment in exploring high levels of radiative forcing
which also allows exploration of the role of technological development in
scenarios.
The CO2 emissions from the four pathways simulated with GCAM are
illustrated in Fig. 9 along with the four official released RCPs. The GCAM2.6
results in even lower emissions of CO2 than the RCP2.6. Total radiative
forcing still declines to 2.6 W m-2 as a result of higher CH4 and N2O emissions
in GCAM than in the IMAGE for this scenario. Conversely, CO2 emissions for
the GCAM8.5 are higher than the RCP8.5 due, but the same radiative forcing
is reached due to lower CH4 and N2O emissions in the GCAM than in the
MESSAGE model for this scenario.

12
Differences in emissions by gas between the official RCPs and the GCAM
replication of the RCP forcing levels can be attributed to any number of
forces. First, GCAM employs different population and GDP assumptions than
the other three models. GCAM has the smallest population and the second
highest GDP of the four models (see van Vuuren et al., this issue). Second, the
four models have different assumptions about technological change and
resource availability. Third, the GCAM model uses a terrestrial carbon policy
that has a significant impact on land use and land-use change emissions.
While each of the models consider abatement opportunities in the terrestrial
system, the method of attaining these opportunities differs across the four
RCP models. The differences listed here are only a subset of differences
between the four models. However, they illustrate an important point;
namely, there are numerous ways that a given radiative forcing goal can be
achieved. The RCP4.5 is only one pathway to stabilize radiative forcing at 4.5
W/m2.
4. CONCLUSIONS
The RCP4.5 scenario is intended to inform research on the atmospheric
consequences of reducing greenhouse gas emissions in order to stabilize
radiative forcing in 2100. It is also a mitigation scenario – the
transformations in the energy system, land use, and the global economy
required to achieve this target are not possible without explicit action to
mitigate greenhouse gas emissions. However, there are many possible
pathways in GCAM and other integrated assessment models that would also
achieve a radiative forcing level of 4.5 Wm-2. For example, simulations with
GCAM can reach 4.5 Wm-2 even if some technology options, such as CCS or
nuclear power, are removed from consideration or even if not all countries
enter into an emissions mitigation agreement at the same time (Clarke et al.,
2009). Such alternate scenarios have different characteristics – higher
emissions prices and different energy system transformations, for example –
than the RCP4.5. The pathway discussed here and released as RCP4.5 is cost-
minimizing, and therefore invokes all available technology options that can
cost-effectively contribute to mitigation.

13
RCP4.5 aims to achieve stable radiative forcing in 2100; however, this does
not imply that greenhouse gas emissions, greenhouse gas concentrations, or
the climate system are stable. Radiative forcing is stable from 2080-2100 in
the RCP4.5, but emissions and concentrations of greenhouse gases continue
to vary in the underlying scenario. As a separate exercise, the greenhouse
gas emissions and concentrations of RCP4.5 were extended to 2300 using
MAGICC 6 (Meinhausen et al., this volume). This ECP4.5 is also defined as a
stabilization path, and therefore radiative forcing is held constant at 4.5 W m-
2 from 2100-2300. It is important to note that ECP4.5 does not imply an
extension of the socioeconomic, energy or land use assumptions underlying
RCP4.5 in GCAM. The application of RCP4.5 and ECP4.5 in climate models
provides a platform to explore the climate system response to stabilizing the
anthropogenic components of radiative forcing.
Acknowledgements: Funding was provided by the US Department of Energy, Office of Science
through the Integrated Assessment Research Program. The authors wish to thank the many
scientists and collaborators involved in the planning and development of the RCP process, and
especially the AIM, MESSAGE and IMAGE modeling teams for time devoted to scenario review
and coordination.

14
References
Brenkert A, Smith S, Kim S, Pitcher H (2003) Model Documentation for the MiniCAM. PNNL-
14337, Pacific Northwest National Laboratory, Richland, Washington.
Bruinsma J (2003) World Agriculture: Towards 2015/2030. An FAO perspective. UN Food
and Agriculture Organization, Rome. 444 pg
Calvin KV, Edmonds JA, Bond-Lamberty B, Clarke LE, Kim SH, Kyle GP, Smith SJ, Thomson
AM, Wise MA (2009) 2.6: Limiting Climate Change to 450 ppm CO2 Equivalent in the 21st
Century. Energy Economics 31(2): S107-S120.
CIESIN & CIAT 2005. Gridded population of the world version 3 (GPWv3): Population grids.
Center for International Earth Science Information Network and Centro Internacional de
Agricultura Tropical, Palisades, NY, 2005.
Clarke L, Edmonds J, Jacoby H, Pitcher H, Reilly J, Richels R (2007) CCSP Synthesis and
Assessment Product 2.1, Part A: Scenarios of Greenhouse Gas Emissions and Atmospheric
Concentrations. U.S. Government Printing Office. Washington, DC.
Clarke L, Edmonds J, Krey V, Richels R, Rose S, Tavoni M (2009) International climate policy
architectures: Overview of the EMF 22 International Scenarios. Energy Economics 31(2):
S64-S81.
Edmonds J, Clarke L, Lurz J, Wise M (2008) Stabilizing CO2 concentrations with incomplete
international cooperation. Climate Policy 8:355–376.
Forster P, Ramaswamy V, Artaxo P, Berntsen T, Betts R, Fahey DW, Haywood J, Lean J, Lowe
DC, Myhre G, Nganga J, Prinn R, Raga G, Schulz M, Van Dorland R (2007) Changes in
Atmospheric Constituents and in Radiative Forcing. In: Climate Change 2007: The Physical
Science Basis. Solomon, S et al. (eds.). Cambridge University Press, Cambridge, United
Kingdom and New York, NY, USA.
Gregg JS, Smith SJ (2010) Energy from Residue Biomass. Mit. Adap. Strat. for Global Change
DOI 10.1007/s11027-010-9215-4.
Hotelling H (1931) The Economics of Exhaustible Resources. J. of Political Economy 39:
137-175.
Hurtt GC, et al. (2006) The underpinnings of land- use history: three centuries of global
gridded land-use transitions, wood harvest activity, and resulting secondary lands. Global
Change Biol. 12:1208-1229.
Kim SH, Edmonds J, Lurz J, Smith S, Wise M (2006) The Object-oriented Energy Climate
Technology Systems (ObjECTS) Framework and Hybrid Modeling of Transportation in the
MiniCAM Long-Term, Global Integrated Assessment Model. The Energy Journal Special Issue:
Hybrid Modeling of Energy-Environment Policies: Reconciling Bottom-up and Top-down: 63-
91.
Lamarque JF, Bond TC, Eyring, V, Granier, C, Heil, A, Klimont, Z, Lee, DS, Liousse, C, Mieville, A,
Owen, B, Schultz, M, Shindell, D, Smith, SJ, Stehfest, E, van Aardenne, J, Cooper, O, Kainuma, M,
Mahowald, N, McConnell, J.R., Riahi, K, Van Vuuren, D (2010) Historical (1850-2000) gridded
anthropogenic and biomass burning emissions of reactive gases and aerosols: methodology
and application. Atmospheric Chemistry and Physics (in review).

15
Lee DS, Pitari G, Grewe V, Gierens K, Penner JE, Petzold A, Prather MJ, Schumann U, Bais A,
Berntsen T, Iachetti D, Lim LL, Sausen R (2010), Transport impacts on atmosphere and
climate: Aviation, Atmospheric Environment, In Press.
Moss R, et al. (2008) Towards New Scenarios for Analysis of Emissions, Climate Change,
Impacts, and Response Strategies. Intergovernmental Panel on Climate Change, Geneva, 132
pp.
Moss R, et al. (2010) The next generation of scenarios for climate change research and
assessment. Nature 463:747-756.
Nakicenovic N, et al. (2000) Special Report on Emissions Scenarios. Cambridge University
Press, Cambridge, United Kingdom.
Peck SC, Wan YH (1996) Analytic Solutions of Simple Greenhouse Gas Emission Models. In:
Van Erland EC, Gorka K (eds) Economics of Atmospheric Pollution. Springer Verlag, New
York.
Raper SCB, Wigley TML, Warrick RA (1996) Global sea level rise: Past and future. In:
Milliman JD, Haq BU (eds) Sea-Level Rise and Coastal Subsidence: Causes, Consequences and
Strategies. Kluwer Academic Publishers, Dordrecht, The Netherlands, pp. 11–45.
Smith SJ, Wigley TML (2006) Multi-Gas Forcing Stabilization with the MiniCAM. Energy
Journal SI3:373-391.
Smith SJ, Pitcher H, Wigley TML (2005) Future Sulfur Dioxide Emissions. Climatic Change
73(3):267-318.
Thomson AM, Calvin KV, Chini LP, Hurtt G, Edmonds JA, Bond-Lamberty B, Frolking S, Wise
MA, Janetos AC (2010) Climate mitigation and the future of tropical landscapes. Proceedings
of the National Academy of Sciences (in review)
Van Vuuren DP, Lucas P. Hilderink H (2007) Downscaling drivers of global environmental
change. Enabling use of global SRES scenarios at the national and grid levels. Global
Environmental Change 17:114-130.
Weyant J. et al. (2009) Report of 2.6 versus 2. 9 Watts/m2 RCP evaluation panel.
http://www.ipcc.ch/meetings/session30/inf6.pdf (31 March 2009).
Wigley TML, Raper SCB (1992) Implications for Climate And Sea-Level of Revised IPCC
Emissions Scenarios. Nature 357:293–300.
Wigley TML, Raper SCB (2002) Reasons for larger warming projections in the IPCC Third
Assessment Report. J. Climate 15:2945–2952.
Wise M, Calvin K, Thomson A, Clarke L, Sands R, Smith SJ, Janetos A, Edmonds J (2009a) The
Implications of Limiting CO2 Concentrations for Agriculture, Land-use Change Emissions,
and Bioenergy. Technical Report. [PNNL-17943].
Wise M, Calvin K, Thomson A, Clarke L, Sands R, Smith SJ, Janetos A, Edmonds J (2009b)
Implications of Limiting CO2 Concentrations for Land Use and Energy. Science 324:1183-
1186

16
0
2
4
6
8
2005 2020 2035 2050 2065 2080 2095
Year
W/m
2
Reference
RCP4.5
Figure 1: Radiative forcing ( W m-2
) of the GCAM reference and RCP4.5 scenarios over the model
simulation period

17
0
5
10
15
20
2005 2020 2035 2050 2065 2080 2095
Year
CO
2 E
mis
sio
ns
(GtC
/yr)
Reference - Energy/Industrial
RCP4.5 Energy/Industrial
Reference - Land Use
RCP4.5 - Land Use
Figure 2: CO2 emissions from energy and industrial sources and from land use/ land use change in
the GCAM reference and RCP4.5 scenarios
18
-500
-400
-300
-200
-100
0
100
200
300
400
500
2005 2020 2035 2050 2065 2080 2095Year
EJ/
yr
energy reduction
other
hydro
biomass
nuclear
coal
gas
oil
Figure 3: Primary energy sources in RCP4.5 expressed as difference from the reference case.
Categories above the x-axis indicate a greater amount of primary energy from that source in the
RCP4.5 whereas values below indicate less energy from that primary source in the RCP4.5.

19
-250
-200
-150
-100
-50
0
50
100
150
200
250
2005 2020 2035 2050 2065 2080 2095
Year
EJ/
yr
energy reduction
other
hydro
nuclear
biomass w/ccs
biomass
coal w/ccs
coal
gas w/ccs
gas
oil w/ccs
oil
Figure 4: Electricity generation technology in RCP4.5 expressed as difference from the reference
case. Categories above the x-axis indicate a greater amount of electricity generation from that
technology in the RCP4.5 whereas values below indicate less electricity generation from that
technology in the RCP4.5.

20
Figure 5: Global land cover over time in the RCP4.5 scenario expressed as a percentage of total
global land area.
0%
10%
20%
30%
40%
50%
60%
70%
80%
90%
100%
2005 2020 2035 2050 2065 2080 2095
Year
Perc
en
t o
f all lan
dRock/Ice/Desert
Tundra
Forest
Pasture
Grassland/Shrubland Biomass
Crops

21
0
15
30
45
60
75
90
2005 2020 2035 2050 2065 2080 2095
Year
2005$/t
CO
2Reference
RCP4.5
Figure 6: Price of CO2 per ton (2005$) in the RCP4.5 scenario over the simulation period.

22
-2
-1
0
1
2
3
4
5
6
2005 2020 2035 2050 2065 2080 2095Year
W/m
2
CO2 CH4 N2O Halocarbons Tropospheric Ozone Sulfur (Direct & Indirect) Other
Figure 7: Contributions of the different greenhouse gases to total radiative forcing in the RCP4.5
scenario.

23

24
Figure 8: Global CH4 emissions (in Tg per grid cell per year) downscaled from the GCAM RCP4.5
scenario for 2005, 2050 and 2100.

25
-20
0
20
40
60
80
100
120
140
160
2005 2020 2035 2050 2065 2080 2095
Year
GtC
O2/y
r
GCAM8.5 RCP8.5
GCAM6.0 RCP6.0
RCP4.5 GCAM2.6
RCP2.6
Figure 9: Annual CO2 emissions (GtCO2) from all anthropogenic sources for the four released RCPs
(RCP2.6, RCP4.5, RCP6.0, RCP8.5) and the corresponding pathways simulated with the GCAM
model (GCAM2.6, GCAM6.0, GCAM8.5).