rbc_june_2015_web
TRANSCRIPT

RBC Capital Markets’ Global Energy &
Power Executive Conference
Presenter: Tim Griffith, Sr. Vice President and CFO
June 2, 2015

Forward‐Looking Statements
This presentation contains forward-looking statements within the meaning of federal securities laws regarding both MPC and MPLX. These forward-looking statements relate to, among other
things, expectations, estimates and projections concerning the business and operations of MPC and MPLX. You can identify forward-looking statements by words such as “anticipate,”
“believe,” “estimate,” "objective," “expect,” “forecast,” "plan," “project,” "potential," “could,” “may,” “should,” “would,” “will” or other similar expressions that convey the uncertainty of future
events or outcomes. Such forward-looking statements are not guarantees of future performance and are subject to risks, uncertainties and other factors, some of which are beyond the
companies’ control and are difficult to predict. Factors that could cause MPC’s actual results to differ materially from those in the forward-looking statements include: our ability to successfully
integrate the acquired Hess retail operations and achieve the strategic and other expected objectives relating to the acquisition, including any expected synergies; changes to the expected
construction costs and timing of pipeline projects; volatility in and/or degradation of market and industry conditions; the availability and pricing of crude oil and other feedstocks; slower growth
in domestic and Canadian crude supply; an easing or lifting of the U.S. crude oil export ban; completion of pipeline capacity to areas outside the U.S. Midwest; consumer demand for refined
products; transportation logistics; the reliability of processing units and other equipment; our ability to successfully implement growth opportunities; modifications to MPLX earnings and
distribution growth objectives; impacts from our repurchases of shares of MPC common stock under our share repurchase authorizations, including the timing and amounts of any common
stock repurchases; federal and state environmental, economic, health and safety, energy and other policies and regulations, including the cost of compliance with the Renewable Fuel
Standard; changes to MPC's capital budget; other risk factors inherent to MPC’s industry; and the factors set forth under the heading "Risk Factors" in MPC's Annual Report on Form 10-K for
the year ended Dec. 31, 2014, filed with the Securities and Exchange Commission (SEC). Factors that could cause MPLX's actual results to differ materially from those in the forward-looking
statements include: the adequacy of MPLX capital resources and liquidity, including, but not limited to, availability of sufficient cash flow to pay distributions and execute business plans; the
timing and extent of changes in commodity prices and demand for crude oil, refined products, feedstocks or other hydrocarbon-based products; volatility in and/or degradation of market and
industry conditions; completion of pipeline capacity by competitors; disruptions due to equipment interruption or failure, including electrical shortages and power grid failures; the suspension,
reduction or termination of MPC's obligations under commercial agreements; the ability to successfully implement growth strategies, whether through organic growth or acquisitions; federal
and state environmental, economic, health and safety, energy and other policies and regulations; changes to MPLX's capital budget; other risk factors inherent to MPLX’s industry; and the
factors set forth under the heading "Risk Factors" in MPLX's Annual Report on Form 10-K for the year ended Dec. 31, 2014, filed with the SEC. In addition, the forward-looking statements
included herein could be affected by general domestic and international economic and political conditions. Unpredictable or unknown factors not discussed here, in MPC’s Form 10-K or in
MPLX’s Form 10-K could also have material adverse effects on forward-looking statements. Copies of MPC's Form 10-K are available on the SEC website, MPC's website at
http://ir.marathonpetroleum.com or by contacting MPC's Investor Relations Office. Copies of MPLX's Form 10-K are available on the SEC website, MPLX's website at http://ir.mplx.com or by
contacting MPLX's Investor Relations office.
Non-GAAP Financial Measures
EBITDA and adjusted free cash flow are non-GAAP financial measures provided in this presentation. EBITDA and adjusted free cash flow reconciliations to the nearest GAAP financial
measures are included in the Appendix to this presentation. EBITDA and adjusted free cash flow are not defined by GAAP and should not be considered in isolation or as an alternative to net
income attributable to MPC, net cash provided by (used in) operating, investing and financing activities or other financial measures prepared in accordance with GAAP. The EBITDA forecast
related to MPC’s marine assets was determined on an EBITDA-only basis. Accordingly, information related to the elements of net income, including tax, and interest, are not available and,
therefore, a reconciliation of this non-GAAP financial measure to the nearest GAAP financial measure has not been provided.
2

Highlights
Reported record first-quarter earnings of $891 million
Converted approximately 500 of the 1,245 retail sites to the Speedway brand
since acquisition
Authorized the sale of MPC’s marine assets to MPLX
Returned $345 million of capital to shareholders, including $209 million of share
repurchases during first quarter
Announced two-for-one stock split of MPC shares
Continued balanced investment in the business
3

Current Trends
Positive domestic outlook
Sustainable U.S. refining advantages
U.S. product exports growth
MPC performs well in volatile market
conditions
Significant infrastructure investments in U.S.
4
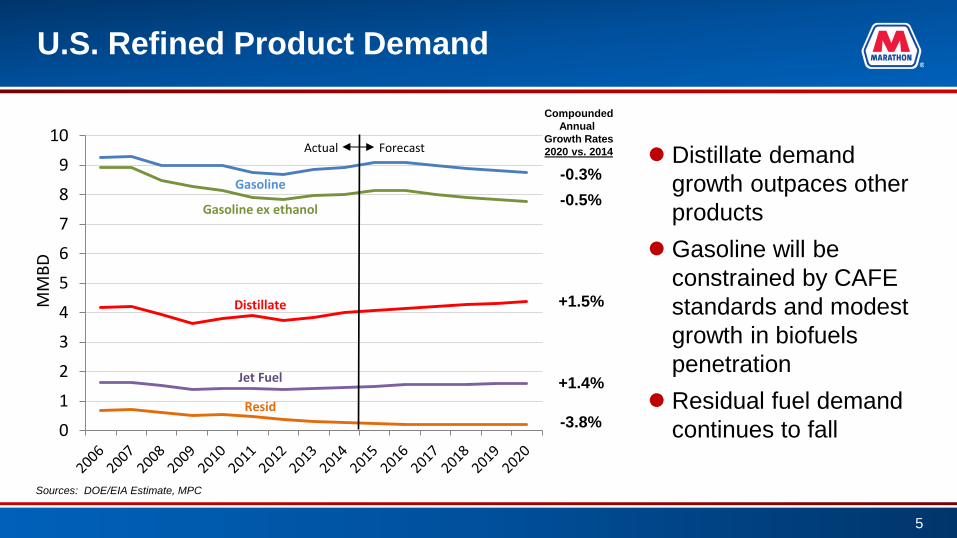
U.S. Refined Product Demand
Distillate demand
growth outpaces other
products
Gasoline will be
constrained by CAFE
standards and modest
growth in biofuels
penetration
Residual fuel demand
continues to fall
-0.3%
-0.5%
+1.5%
+1.4%
-3.8%
Compounded
Annual
Growth Rates
2020 vs. 2014
Sources: DOE/EIA Estimate, MPC
0
1
2
3
4
5
6
7
8
9
10
Gasoline
Gasoline ex ethanol
Distillate
Jet Fuel
Resid
Forecast Actual
MM
BD
5
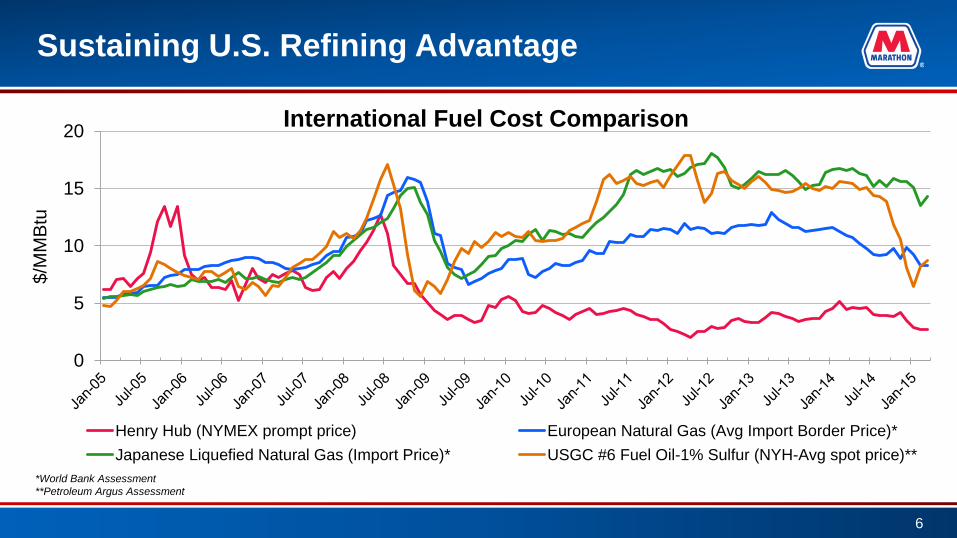
Sustaining U.S. Refining Advantage
*World Bank Assessment
**Petroleum Argus Assessment
0
5
10
15
20
$/M
MB
tu
International Fuel Cost Comparison
Henry Hub (NYMEX prompt price) European Natural Gas (Avg Import Border Price)*
Japanese Liquefied Natural Gas (Import Price)* USGC #6 Fuel Oil-1% Sulfur (NYH-Avg spot price)**
6

U.S. Gross Refined Product Exports Increasing
Source: U.S. Energy Information Administration
0.0
0.5
1.0
1.5
2.0
2.5
3.0
3.5
4.0
Gasolines
Kero-Jet
Diesels
Product Exports
MM
BD
7

MPC’s Value of Integration
Flexible refining system
Large retail presence
Extensive logistics with considerable optionality
1,000
1,200
1,400
1,600
1,800
2,000
2,200
2,400
2,600
2,800
1Q12 2Q12 3Q12 4Q12 1Q13 2Q13 3Q13 4Q13 1Q14 2Q14 3Q14 4Q14 1Q15
$M
M
Gross Margin Indicator Reported Gross Margin
Crude
Price
Decline
RIN $
Distortion
8

Our Priorities for Our Investors
$20
$30
$40
$50
$60
$70
$80
$90
$100
$110
Ju
l-1
1
Oct-
11
Ja
n-1
2
Ap
r-1
2
Ju
l-1
2
Oct-
12
Ja
n-1
3
Ap
r-1
3
Ju
l-1
3
Oct-
13
Ja
n-1
4
Ap
r-1
4
Ju
l-1
4
Oct-
14
Ja
n-1
5
Ap
r-1
5
Share Price Maintain top-tier safety and
environmental performance
Sustain our focus on
shareholder returns
Balance capital returns with
value-enhancing
investments
Grow higher valued and
stable cash-flow
businesses
Enhance the margins in our
refining operations
Spin-
off
Source: Thomson Reuters, on a pre-split basis
9

2.1% 2.9% 1.6% 2.4% 2.0%
4.5%
8.6%
1.8%
6.6% 5.2% 4.8%
0.0%
2.0%
4.0%
6.0%
8.0%
10.0%
12.0%
MPC HFC TSO PSX VLO
Dividend Yield Special Dividend Yield 2015 Share Repurchase/Share Yield
MPC Delivering Peer Leading Return of Capital Twelve months ended March 31, 2015
10.7%
9.2%
7.6% 8.2%
6.8%
Note: Total Capital Return Yield: Twelve months ended March 31, 2015 dividends per share, plus twelve months ended March 31, 2015 special dividends per share, plus twelve
months ended March 31, 2014 share repurchase per share, all divided by twelve month average share price from April 1, 2014 through March 31, 2015. Share repurchase cost for
Q1 2015 are estimated for Tesoro.
10

2015 Capital Investment Plan – $2.5 B
Refining & Marketing – $1,276 MM
– Includes $234 MM for
midstream investments
Speedway – $452 MM
Pipeline Transportation – $659 MM
Corporate & Other – $140 MM
27%
15%
35%
18% 5%
*Includes Pipeline Transportation segment and midstream investments included in the R&M segment.
Midstream*
Speedway
Refining Margin
Enhancement
Corporate
& Other
Refining
Sustaining
Capital
11

Substantial Acceleration of MPLX
Evolve MPLX into large-cap, diversified logistics MLP
~$450 MM of run-rate Adjusted EBITDA by end of 2015
Annual LP distribution growth rate to average mid-20% over next five years
– ~29% distribution growth for 2015
Executed first step of accelerated growth strategy
Announced sale of marine assets to MPLX
MPC has $1.6 B of MLP-eligible EBITDA*
111
166
257
450
0
100
200
300
400
500
$M
M
Adjusted EBITDA Attributable to MPLX
*Includes EBITDA attributable to marine assets
12

Marine Business Overview Fully-Integrated Marine Transportation and Service Provider
Marine Transportation
– Premier inland service provider with best-in-class assets
– 18 towboats and 203 tank barges moving light products, heavy oils,
crude oil, renewable fuels, chemicals and feedstocks
Marine Repair Facility
– State-of-the-art facility in Catlettsburg, Ky., maximizes asset
utilization and integrity
Fleeting Properties
– Strategically located properties in key markets allowing
for staging and flexibility
Fee-for-capacity contracts with MPC
Estimated annual EBITDA of ~$115 MM
Annual EBITDA ~$115 MM
Barges
203
Boats
18
13
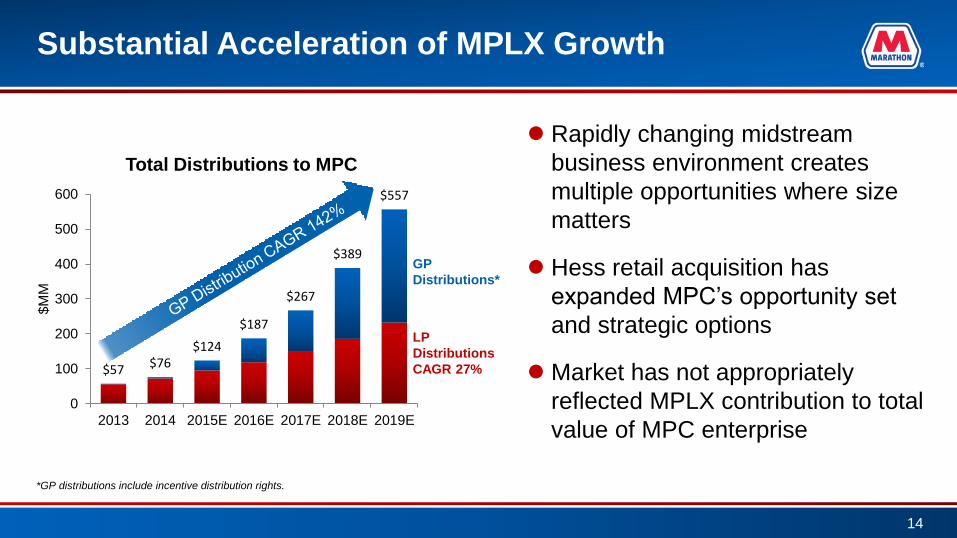
$57 $76 $124
$187
$267
$389
$557
0
100
200
300
400
500
600
2013 2014 2015E 2016E 2017E 2018E 2019E
Substantial Acceleration of MPLX Growth
Rapidly changing midstream
business environment creates
multiple opportunities where size
matters
Hess retail acquisition has
expanded MPC’s opportunity set
and strategic options
Market has not appropriately
reflected MPLX contribution to total
value of MPC enterprise
GP
Distributions*
LP
Distributions
CAGR 27%
Total Distributions to MPC
*GP distributions include incentive distribution rights.
$M
M
14

Investing in Significant Midstream Growth Projects
Southern Access Extension (SAX)
– MPC Investment: ~$305 MM
– MPC Equity: 35%
– Late 2015 completion
MPC Refinery Utica Gas Processing Facilities Terminal Facilities
Proposed Cornerstone Pipeline
MPLX Products Pipeline MPC Crude Pipeline
Future Build-out
Superior, WI
Canadian
Bakken
Flanagan, IL
Patoka, IL
SAX
Canton
Utica
Youngstown Canton
Ohio
Pa.
Wellsville Steubenville
MarkWest, Cadiz
M3, Leesville
M3, Scio
Midland
Cornerstone
Sandpiper ‒ MPC Investment: $1.0 B - $1.2 B
‒ MPC Equity: 27% - 30%
‒ 2017 completion
Cornerstone ‒ Industry solution, 16” diameter pipeline
‒ MPLX Investment: ~$250 MM
‒ ~$40 MM EBITDA
‒ Late 2016 completion
15

Conversion Plans for Former Hess Stores 2014-2017
Conversion to Speedway: $181 MM
Remodel Capital: $240 MM
~250 Stores
completed
by March 2015
~500 Stores
by Dec. 2015
~495 Stores by
Dec. 2016
16

404 381 424 487
553
143
0
200
400
600
800
2010 2011 2012 2013 2014
$M
M
Segment EBITDA*
Legacy Speedway Hess
696
Growing Speedway
*Non-GAAP disclosure, see appendix for reconciliation to Speedway segment income from operations
17

Refinery Margin-Enhancing Projects ~$835 MM capital investments, generating ~$650 MM annual EBITDA
Growing Gulf Coast Export Capabilities
– Adding export capacity at Garyville and Galveston Bay (+360 MBD)
– ~$120 MM investment, ~30-40% ROI
– 2013-2018 completion
Increasing Light Sweet Crude and Condensate Capacity
‒ Condensate splitters at Canton and Catlettsburg refineries (+60 MBD)
‒ Light crude processing project at Robinson (+30 MBD)
‒ ~$390 MM investment, >30% ROI
‒ 4Q 2014 – 2016 completion
Capitalizing on Global Growth in Diesel Demand ‒ Increasing distillate production at Garyville, Galveston Bay and Robinson (+49 MBD)
‒ ~$325 MM investment, ~30-50% ROI
‒ 2014-2016 completion
18

Galveston Bay Driving Value
Integration with Texas City refinery
Revamp crude and vacuum units
– Optimize for future crude availability
– Improve distillate recovery
Add hydrotreating capacity
– Move to 100% ULSD
Idle the smallest and oldest FCC
Expand export capabilities
Expand bottom upgrade capacity
19

2015 Value Drivers
Top-tier safety and environmental
performance
Accelerate growth of
Midstream/MPLX
Capital return to shareholders
– Strong and growing dividend
– Share repurchase program
Speedway – Hess integration
Increasing light crude processing
and export capabilities
Enhancing margins in our refining
operations
Integrated downstream system
As of March 31, 2015
See appendix for legend
20

Appendix
21

Fully Integrated Downstream System
Refining and Marketing
Seven-plant refining system with ~1.7 MMBPCD capacity
One biodiesel facility and interest in three ethanol facilities
One of the largest wholesale suppliers in our market area
One of the largest producers of asphalt in the U.S.
~5,500 Marathon Brand retail outlets across 19 states
~505 retail outlet contract assignments primarily in the
Southeast and select Northeast states
Owns/operates 62 light product terminals and 18 asphalt
terminals, while utilizing third-party terminals at 118 light
product and 10 asphalt locations
18 owned and one leased inland waterway towboats with
203 owned barges and 12 leased barges, 2,210
owned/leased railcars, 142 owned transport trucks
Speedway (Retail)
~2,750 locations in 22 states
Second largest U.S. owned/operated c-store chain
Pipeline Transportation
Owns, leases or has interest in ~8,300 miles of pipelines
One of the largest petroleum pipeline companies in U.S.
Part ownership in non-operated pipelines includes Explorer,
LOCAP, LOOP, Maumee and Wolverine
Marketing Area
MPC Refineries
Light Product Terminals
MPC owned and Part-owned
Third Party
Asphalt/Heavy Oil Terminals
MPC Owned
Third Party
Water Supplied Terminals
Coastal
Inland Pipelines
MPC Owned and Operated
MPC Interest: Operated by MPC MPC Interest: Operated by Others
Pipelines Used by MPC
Ethanol Facility
Biodiesel Facility
Tank Farms
Butane Cavern
Pipelines
Barge Dock As of March 31, 2015
22

Source: Company Reports
-5
0
5
10
15
20
1998 1999 2000 2001 2002 2003 2004 2005 2006 2007 2008 2009 2010 2011 2012 2013 2014 2015
$/B
BL
MPC’s Rank
Competitor Range
Companies
Ranked*
Operating Income Per Barrel of Crude Throughput**
*Current companies ranked: BP, CVX, HFC, MPC, PBF, PSX, TSO, VLO, XOM
**Adjusted domestic operating income per barrel of crude oil throughput
Performing Consistently in the Top Tier Engine behind MPC’s focus on capital returns
11 12 11 9 10 9 8 9 9 8 10 8 8 8 8 8 8 9
March
YTD
Preliminary
3 3 2
1
2 3
7
2
1
5
3
1 3
1
2
2
2
3
23

Grow Higher Valued and
Stable Cash-Flow Businesses
Speedway
Pipeline Transportation
R&M R&M
Speedway
Midstream
Historical Mid-Cycle EBITDA*
A More
Diversified
Portfolio
Future Mid-Cycle EBITDA
*2007-2014 average. Non-GAAP disclosure, see appendix for reconciliation to net income attributable to MPC
24

Leveraging Existing Capacity to
Run Light Sweet Crude
44% sweet crude oil throughput in 1Q 2015
versus 68% sweet crude oil capacity
Reformer capacity captures full
value of light crude processing
Additional value added through aromatics
production
0
5
10
15
20
25
30
MPC Midwest MPC USGC
% o
f C
rude
Ca
pa
city Reforming Capacity
Source: 2015 Oil & Gas Journal
Industry
Average
Sources: Argus DeWitt Aromatics Reports 2011-2012 and MPC internal data. Benzene, toluene, mixed xylenes, and cumene shown. Xylene revised.
0
40
80
120
MB
PC
D
U.S. Aromatics Capacity
25

Increasing Light Sweet Crude and Condensate Capacity
Condensate splitters
– Canton: 25 MBD
• Completed 4Q 2014
– Catlettsburg: 35 MBD
• 2Q 2015 completion
– $250 MM investment
– >30% ROI for each project
Light crude processing
– Robinson: +30 MBD light crude
– $140 MM investment
– ~30% ROI, 2016 completion
Condensate Processing Opportunity
Existing Crude Unit
New Fractionator
Light Naphtha to Gasoline Blending
Heavy Naphtha to Reforming
Heavier Components
To Downstream Process Units
Distillates to Hydrotreating
Ultra-Sweet Condensate
Conventional Crude
26

Rising MPC Finished Product Exports
0
50
100
150
200
250
300
2010 2011 2012 2013 2014 1Q2015
MB
D
27

Growing Gulf Coast Export Capabilities
Export investments totaling ~$120 MM
Added new 500,000 barrel export tank
at Garyville in 2013
Galveston Bay in 2015
– +30 MBD ULSD
– ~40% ROI
Garyville in 2015
– +20 MBD Gasoline
– ~30% ROI
Galveston Bay in 2016-2018
– +115 MBD Gasoline
– ~35% ROI
150
320 345
395
510
0
100
200
300
400
500
600
2012 2013 2014 2015E 2018+E
MB
D
Export Capacity
28

Capitalizing on Global Growth in Diesel Demand
Garyville +35 MBD ULSD in 2014-2016
– $232 MM investment
– ~45% ROI
Galveston Bay +9 MBD ULSD in 2015
– $16 MM investment
– ~50% ROI
Robinson +5 MBD ULSD in 2015
– $77 MM investment
– ~30% ROI
32
34
36
38
2012 2013 2014 2015E 2016E 2017E
% o
f C
rude T
hro
ughput Distillate Production
300
400
500
600
700
2012 2013 2014 2015E 2016E 2017E
MB
D
Distillate Production
29

MPC’s Currently Identified Eligible MLP EBITDA
Sources of ~$1.6 B
Retained by MPC
● 59 MMBBL storage (tanks and caverns)
● 25 rail loading racks and 24 truck loading racks ● 7 owned and 11 non-owned docks
● 2 condensate splitter investments
● 27 owned and 2,183 leased
● 794 general service; 1,171 high pressure; 245 open-top hoppers
● ~ 5,400 miles of additional crude and products pipelines – Owns, leases or has an ownership interest in these pipelines
– 0.5% of MPLX Pipe Line Holdings LP
● Southern Access Extension, Sandpiper and Utica investments
Railcars
Pipelines
● 62 light product; ~20 MMBBL storage; 189 loading lanes
● 18 asphalt; ~5 MMBBL storage; 65 loading lanes Terminals
● 203 owned and 12 leased inland barges; 5.3 MMBBL capacity
● 18 owned and one leased inland towboats Marine
Refineries
● 20 B gallons of fuels distribution volume – Existing MPC and Speedway volumes; ~17 B gallons refined products
– Acquisition of Hess’ retail operations adds ~3 B gallons refined products
Fuels
Distribution
30

MPLX/MPC Utica Build-Out Connectivity
31
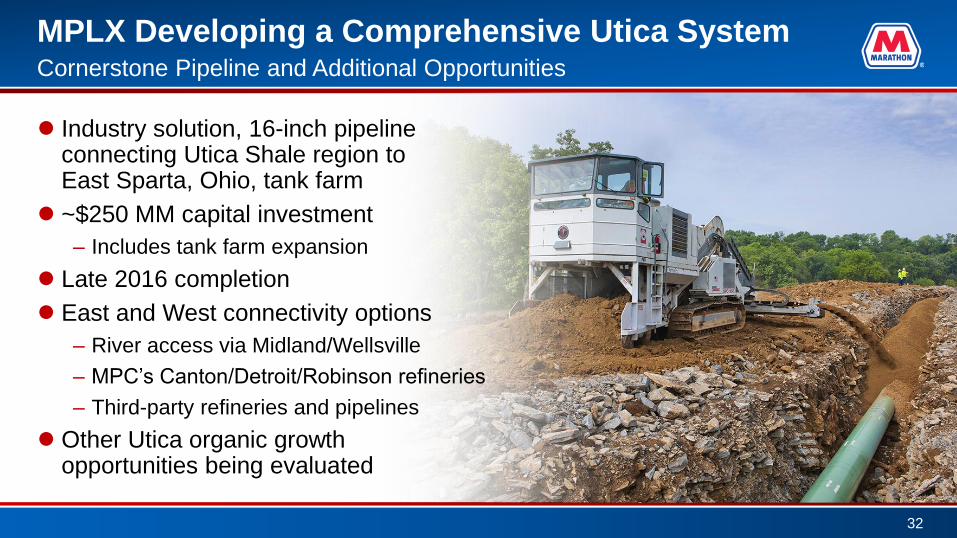
MPLX Developing a Comprehensive Utica System Cornerstone Pipeline and Additional Opportunities
Industry solution, 16-inch pipeline connecting Utica Shale region to East Sparta, Ohio, tank farm
~$250 MM capital investment
– Includes tank farm expansion
Late 2016 completion
East and West connectivity options
– River access via Midland/Wellsville
– MPC’s Canton/Detroit/Robinson refineries
– Third-party refineries and pipelines
Other Utica organic growth opportunities being evaluated
32

MPLX Distributions and Sales Proceeds to MPC*
($MM) 2013 2014 2015
1Q 2Q 3Q 4Q 1Q 2Q 3Q 4Q 1Q
GP Distributions, including IDRs 0.3 0.4 0.4 0.5 0.6 0.8 1.1 1.5 2.4
LP Distributions 9.5 14.7 15.4 16.1 16.9 17.7 18.6 19.2 21.7
Total Cash Distributions Received 9.8 15.1 15.8 16.6 17.5 18.5 19.7 20.7 24.1
Cash Sales Proceeds - 100.0 - - 310.0 - - 600.0 -
Equity Value from MPLX - - - - - - - 200.0 -
Value to MPC from Drop-down Transactions - 100.0 - - 310.0 - - 800.0 -
9.8
15.1 15.8 16.6 17.5 18.5 19.7 20.7 24.1
0
5
10
15
20
25
30
1Q13 2Q13 3Q13 4Q13 1Q14 2Q14 3Q14 4Q14 1Q15
$M
M
LP Distributions GP Distributions, including IDRs
*Based on quarter in which distributions were received
33

Focused Return of Capital to Shareholders
3,534
2,152
2,188
2,772
0
1,000
2,000
3,000
4,000
5,000
6,000
7,000
8,000
$M
M
Hess Retail Acquisition
Dividends and sharerepurchases*
Investments, Excluding HessAcquisition**
Net cash provided by operations
*$537 MM dividends plus $1,651 MM share repurchases
**Includes cash capital expenditures, acquisitions, investments and contingent consideration, excluding $2,772 MM for the acquisition of Hess’ retail operations and related assets.
***Cash flow provided by operations less cash used for investments, excluding $2,772 MM for the acquisition of Hess’ retail operations and related assets.
Dividends and share
repurchases ~1.6x of
Adj. Free Cash Flow***
$1,382 Adjusted
Free Cash Flow***
LTM Ended 3/31/15
34

Sustaining Capital Returns Since Spin
0
2,000
4,000
6,000
8,000
10,000
$M
M
Cumulative Return of Capital Since July 1, 2011
Dividends Share repurchases
$8.2 B
35

Generating Significant Cash Flow Through All Cycles
Pro forma EBITDA adjusted for current configuration
0
2,000
4,000
6,000
8,000
2009 2010 2011 2012 2013 2014 2009 thru2014 Mid-
Cycle
$M
M
Pro forma EBITDA
Pipeline Transportation Speedway
Depr. & Amort. less corporate expense Refining and Marketing
GME DHOUP
Galveston Bay Hess Retail
36

Sustaining Core Liquidity Needs Minimum cash balance of $500 MM - $1.0 B
Requirements
Liquidity Sources
Implied Cash and Near-Cash Equivalents
Ongoing Operating Cash-Flow Requirements
– Maintenance/Sustaining Capital
– Interest Payments
– Dividend Payments
Contingent Calls on Corporate Liquidity - Probability Adjusted
– Contingent and Uncommitted Letters of Credit
– MPC Credit Shock and Impact on Unsecured Lines (Crude Purchases)
– Major Operating Upset
– Working Capital Shock
Reduced by - Cash Flow from Operations Under Stressed Scenario
Committed Facilities – MPC Revolving Credit Facility $2,500 MM – Trade Receivables Facility* $1,300 MM
Targeted Cash and Near-Cash Equivalents *Availability is a function of refined product selling prices.
37

Growing Global Product Demand
Distillate and gasoline
demand continues to
rise
Fuel oil continues
to decline on
economics and
emissions issues
Sources: BP Statistical Review Estimate of World Energy, MPC
Gasoline
Distillate
Fuel Oil
Other +1.2%
-1.1%
+1.3%
+0.8%
Compounded
Annual
Growth Rates
2030 vs. 2014
“Other” consists of refinery gas, liquefied petroleum gas (LPG), solvents, petroleum coke, lubricants, wax, and other refined products and refinery fuel
“Distillate” includes jet fuel
“Gasoline” includes naphtha
0
20
40
60
80
100
120Forecast Actual
Gasoline
Distillate
Fuel Oil
Other
MM
BD
38

Rising North American Crude & NGLs Production
Sources: EIA, CAPP, MPC
0
5
10
15
20
25
1985 1990 1995 2000 2005 2010 2015 2020 2025 2030
MM
BD
U.S.
Canada
Forecast Actual
2014
39
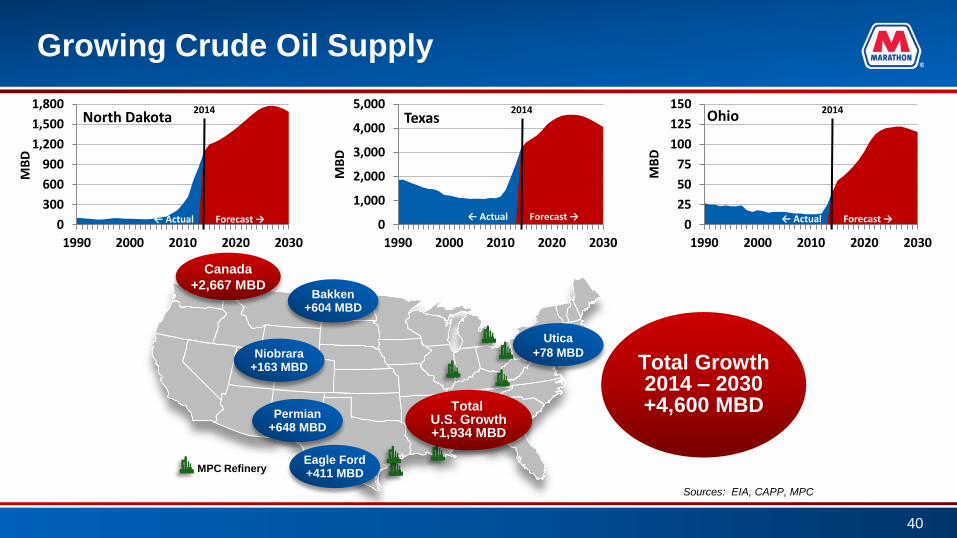
0
300
600
900
1,200
1,500
1,800
1990 2000 2010 2020 2030
MB
D
North Dakota
← Actual Forecast →
2014
0
1,000
2,000
3,000
4,000
5,000
1990 2000 2010 2020 2030
MB
D
Texas
← Actual Forecast →
2014
0
25
50
75
100
125
150
1990 2000 2010 2020 2030
MB
D
Ohio
← Actual Forecast →
2014
Total Growth 2014 – 2030 +4,600 MBD
MPC Refinery
Utica
+78 MBD
Growing Crude Oil Supply
Canada
+2,667 MBD Bakken
+604 MBD
Permian +648 MBD
Eagle Ford +411 MBD
Total U.S. Growth +1,934 MBD
Niobrara +163 MBD
Sources: EIA, CAPP, MPC
40
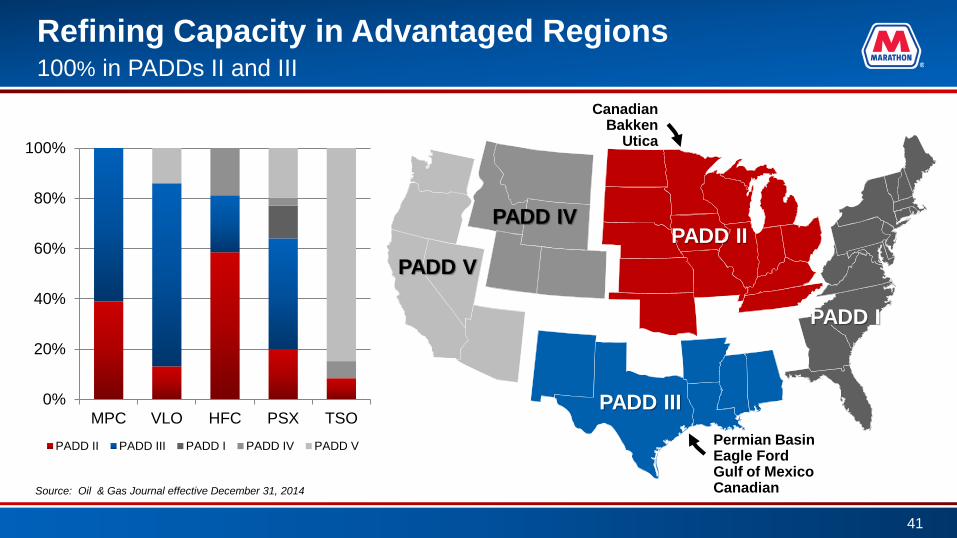
Refining Capacity in Advantaged Regions 100% in PADDs II and III
PADD III
PADD V
PADD IV PADD II
Canadian Bakken
Utica
Permian Basin Eagle Ford Gulf of Mexico Canadian
PADD I
0%
20%
40%
60%
80%
100%
MPC VLO HFC PSX TSO
PADD II PADD III PADD I PADD IV PADD V
Source: Oil & Gas Journal effective December 31, 2014
41

Refinery Capacity
BPCD NCI*
Garyville 522,000 11.4
Galveston Bay 451,000 13.3
Catlettsburg 242,000 10.2
Robinson 212,000 10.1
Detroit 130,000 9.8
Canton 90,000 8.0
Texas City 84,000 8.0
Total 1,731,000 11.1**
The Nelson Complexity Index is a construction cost-based measurement used to describe the investment cost of a refinery in terms of the process operations being
conducted. It is basically the ratio of the process investment downstream of the crude unit to the investment of the crude unit itself.
This index has many limitations as an indicator of value and is not necessarily a useful tool in predicting profitability. There is no consideration for operating,
maintenance or energy efficiencies and no consideration of non-process assets such as tanks, docks, etc. Likewise it does not consider the ability to take advantage of
market related feedstock opportunities.
Source: MPC data as reported in the Oil & Gas Journal effective December 31, 2014
*Nelson Complexity Index calculated per Oil & Gas Journal NCI Formula
**Weighted Average NCI
42

Balance in Refining Network
Midwest Capacity
674,000 BPCD
Louisiana Capacity
522,000 BPCD Texas Capacity
535,000 BPCD
Source: MPC data as reported in the Oil & Gas Journal effective December 31, 2014
Canton (Ohio) 90,000
Catlettsburg (Ky.) 242,000
Detroit (Mich.) 130,000
Robinson (Ill.) 212,000
Galveston Bay
(Texas) 451,000
Texas City (Texas) 84,000
Garyville (La.) 522,000
Total 1,731,000
43

U.S./Canada Key Existing and Planned Pipelines
MBPD Pipeline In Service
Date
300 Line 9 Reversal 2015
300 SAX 2015
200 Diamond 2016
450 Dakota Access 2016
450 ETCO
(Trunkline Conversion)
2016
225-375 Sandpiper 2017
300
+590
Trans Mountain
Trans Mountain Expansion
Current
2017
830 Keystone XL 2018
1,100 Energy East 2018
525 Northern Gateway 2018+
Sources: Publicly available Information
44

Key Strengths Balanced Operations
39%
61%
Crude Oil Refining Capacity
PADD II
PADD III
56% 44%
Crude Slate
Sour Crude
Sweet Crude
~70% ~30%
Assured Sales
Wholesale andOther Sales
Assured Sales of Gasoline Production (Speedway + Brand + Wholesale Contract Sales)
1Q 2015
As of March 31, 2015 1Q 2015
45

Forward Curves
46
Sources: CME, ICE, futures as of May 26, 2015
$50
$60
$70
$80
$90
$100
$110
3Q
14
4Q
14
1Q
15
2Q
15
Pro
mp
t
3Q
15
4Q
15
1Q
16
2Q
16
3Q
16
4Q
16
1Q
17
2Q
17
3Q
17
4Q
17
$/B
BL
Brent
$40
$50
$60
$70
$80
$90
$100
3Q
14
4Q
14
1Q
15
2Q
15
Pro
mp
t
3Q
15
4Q
15
1Q
16
2Q
16
3Q
16
4Q
16
1Q
17
2Q
17
3Q
17
4Q
17
$/B
BL
WTI
$3
$4
$5
$6
$7
$8
3Q
14
4Q
14
1Q
15
2Q
15
Pro
mp
t
3Q
15
4Q
15
1Q
16
2Q
16
3Q
16
4Q
16
1Q
17
2Q
17
3Q
17
4Q
17
$/B
BL
Brent-WTI

Compelling Advantage for Pipeline and Marine
All costs shown as $/BBL
Pipeline costs exclude any storage or transfer fees and line loss
Sources: MPC, publicly available information
47
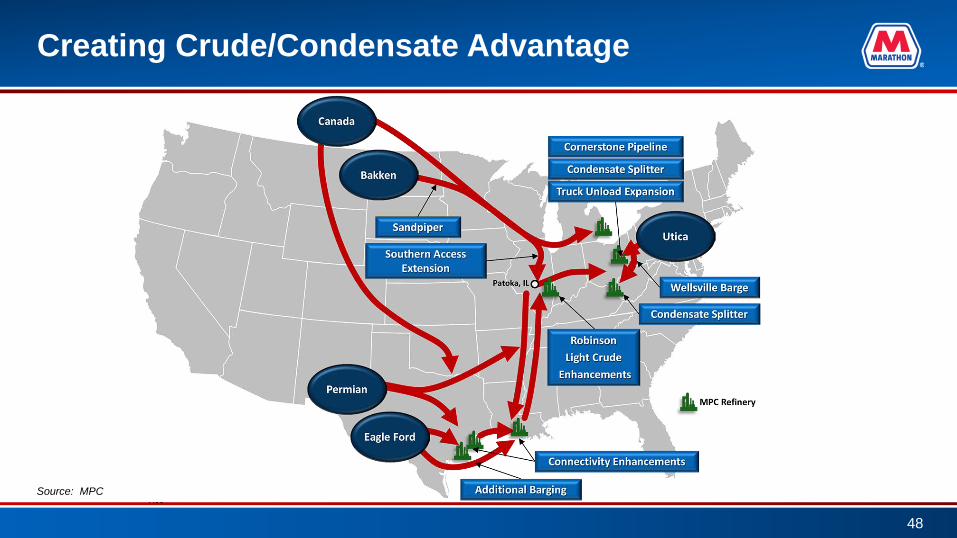
Creating Crude/Condensate Advantage
Source: MPC
48
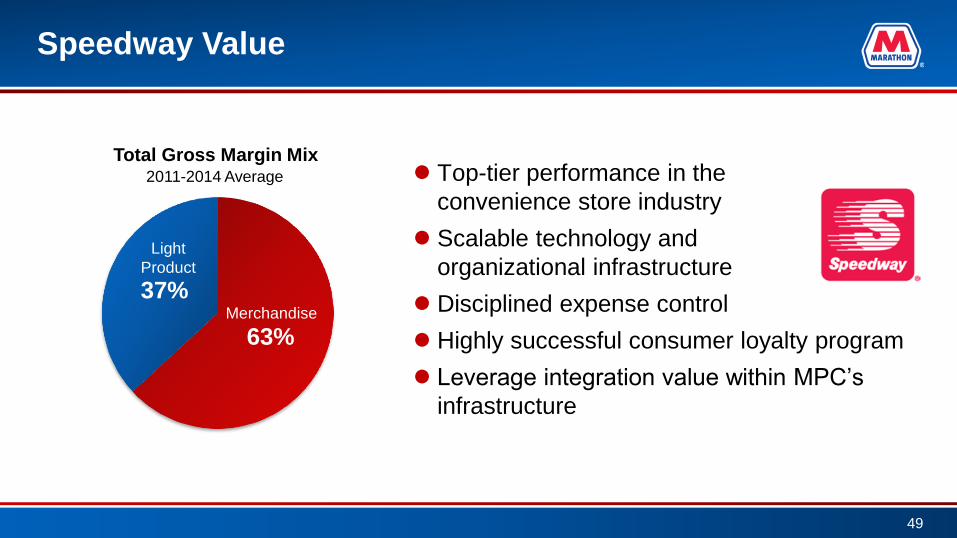
Speedway Value
Top-tier performance in the
convenience store industry
Scalable technology and
organizational infrastructure
Disciplined expense control
Highly successful consumer loyalty program
Leverage integration value within MPC’s
infrastructure
63%
37%
Total Gross Margin Mix
Light
Product
Merchandise
2011-2014 Average
49

Acquisition of Hess Retail Transaction Overview
Hess retail acquisition included:
– 1,245 company operated locations
– Transport fleet with capacity to transport ~1 B gal/yr.
– Pipeline shipper history in various pipelines,
including ~40 MBPD on Colonial Pipeline
– Prime undeveloped real estate bank for organic growth
Total consideration of $2.82 B
– $2.37 B base purchase price
– $191 MM working capital
– $263 MM capital leases cash settled
Unique acquisition opportunity of premier
East Coast locations
Financed with a combination of debt and available cash
Transaction closed on September 30, 2014
50
Transformative Transaction for MPC and Speedway
Accelerates strategy to grow
higher valued and stable cash-flow
businesses
Provides larger integrated platform
for growth in new markets
Meaningfully expands scale and
provides multiple levels of strategic
optionality
Continued commitment to balance
value enhancing investments in the
business with capital returns to
shareholders
51

Enhances Strategic Value for Integrated System
Refined Product Placement Opportunities Incremental 200 MBPD of refined products placement capacity,
increases assured gasoline
Incremental supply of MPC Gulf Coast refined products to northeast
and southeast markets
Logistics Opportunities Increases utilization and optimization of MPC terminals with
incremental 70 MBPD of throughput
Marketing Potential Growth platform for further expanding Speedway, Marathon Brand
and Wholesale
Light Product Supply Strategy Existing supply and terminal agreements provide near term
competitive supply with upside potential to aggregate volumes and
further reduce costs
Optimize supply in southeast market through existing production and
logistics assets
Leverage Midwest and Gulf Coast production to provide supply to
the New York Harbor
Note: Includes owned and third-party terminals
Water Terminals
Light Product Terminals
Connecting Pipelines
Refineries
Hess Marketing Area
Speedway Marketing Area
Dual Marketing Area
52
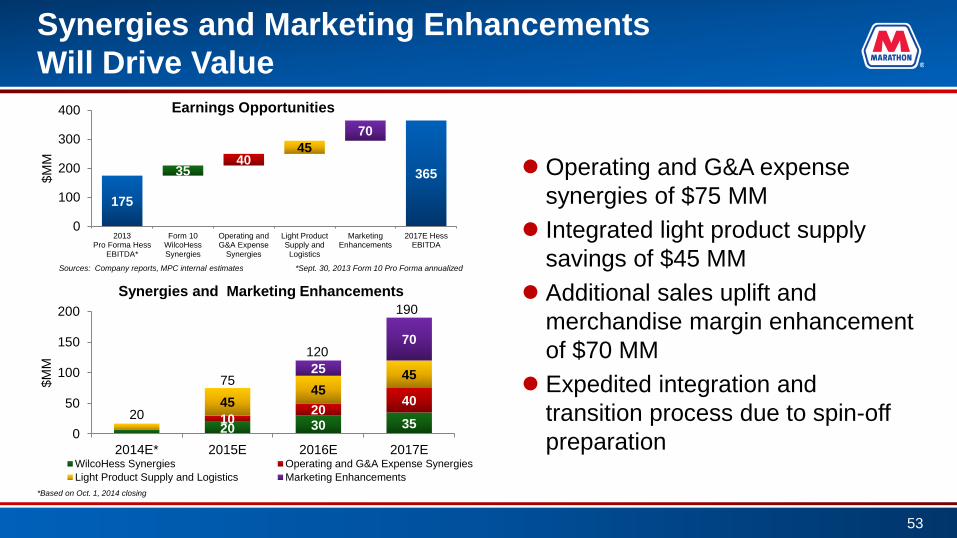
Synergies and Marketing Enhancements
Will Drive Value
Operating and G&A expense
synergies of $75 MM
Integrated light product supply
savings of $45 MM
Additional sales uplift and
merchandise margin enhancement
of $70 MM
Expedited integration and
transition process due to spin-off
preparation
175
365 35 40
45
70
0
100
200
300
400
2013Pro Forma Hess
EBITDA*
Form 10WilcoHessSynergies
Operating andG&A Expense
Synergies
Light ProductSupply and
Logistics
MarketingEnhancements
2017E HessEBITDA
$M
M
Earnings Opportunities
20 30 35 10 20
40 45 45
45 25
70
0
50
100
150
200
2014E* 2015E 2016E 2017E
$M
M
Synergies and Marketing Enhancements
WilcoHess Synergies Operating and G&A Expense Synergies
Light Product Supply and Logistics Marketing Enhancements
Sources: Company reports, MPC internal estimates *Sept. 30, 2013 Form 10 Pro Forma annualized
*Based on Oct. 1, 2014 closing
20
75
120
190
53
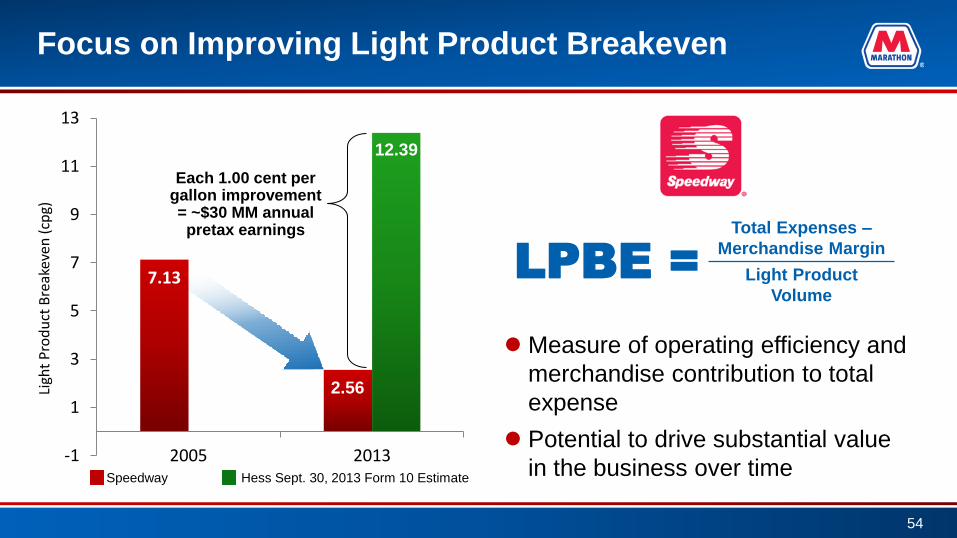
Focus on Improving Light Product Breakeven
Measure of operating efficiency and
merchandise contribution to total
expense
Potential to drive substantial value
in the business over time
7.13
-1
1
3
5
7
9
11
13
2005 2013
Ligh
t P
rod
uct
Bre
akev
en (
cpg)
2.56
12.39
Each 1.00 cent per gallon improvement = ~$30 MM annual pretax earnings
Speedway Hess Sept. 30, 2013 Form 10 Estimate
LPBE =
Total Expenses –
Merchandise Margin
Light Product
Volume
54

Speedway and Hess Side-by-Side Comparison
Speedway generates an incremental $17,300 of merchandise margin per store per month
~$250 MM of additional annual merchandise margin potential across Hess retail
Hessa Speedwayb
Company Operated Sites 1,255 1,478
Fuel Sales (gallons/store/month)
198,500 177,400
Fuel Margin ($/gallon)
$0.137 $0.144
Merchandise Sales ($/store/month)
$111,000 $176,800
Merchandise Margin ($/store/month)
$29,200 $46,500
a) 2013PF data provided in Hess retail Corporation Form 10 SEC filing
b) 2013 data provided in Marathon Petroleum Company 10K SEC filing
55

Renewable Fuels
Corn Ethanol Plants
– 67% equity interest* in Greenville, Ohio
• 110 MM gallon/year capacity
– 60% equity interest in Clymers, Indiana
• 110 MM gallon/year capacity
– 43% equity interest in Albion, Michigan
• 55 MM gallon/year capacity
– The Andersons operates the plants and provides all
the facility services
Biodiesel Refinery
– 100% owner in Cincinnati, Ohio
– 60 MM gallon/year capacity
– Generates 90 MM RINs per year
– Supplied by both truck and rail, with river access in
close proximity
*Direct and indirect
56

Allocating Capital to Higher Valued Businesses
Excludes Galveston Bay and Hess retail acquisitions
0
500
1,000
1,500
2,000
2,500
3,000
2012 2013 2014 2015E
$M
M
Refining & Marketing, excluding Midstream Midstream Pipeline Transportation Speedway Other
57
2012 – 2015 Capital Investment Profile
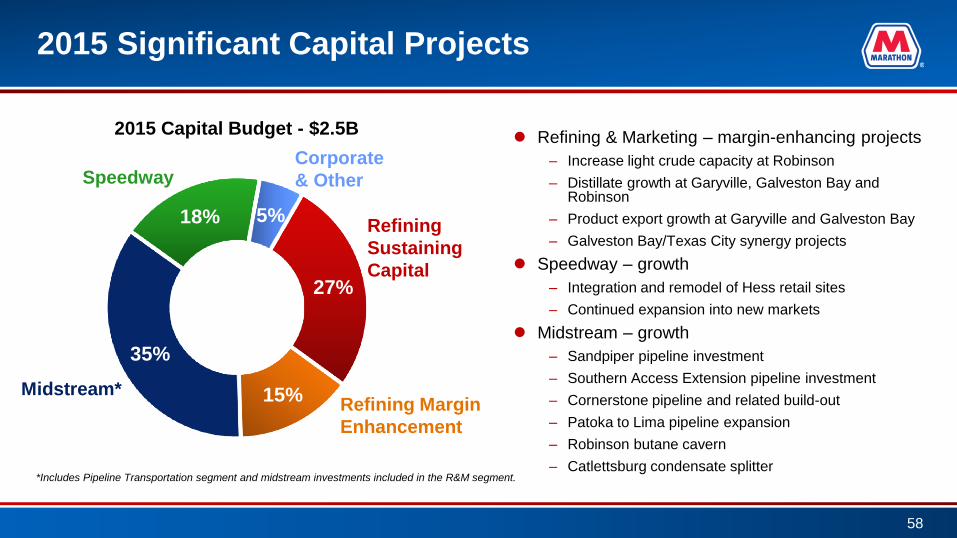
2015 Significant Capital Projects
Refining & Marketing – margin-enhancing projects
– Increase light crude capacity at Robinson
– Distillate growth at Garyville, Galveston Bay and Robinson
– Product export growth at Garyville and Galveston Bay
– Galveston Bay/Texas City synergy projects
Speedway – growth
– Integration and remodel of Hess retail sites
– Continued expansion into new markets
Midstream – growth
– Sandpiper pipeline investment
– Southern Access Extension pipeline investment
– Cornerstone pipeline and related build-out
– Patoka to Lima pipeline expansion
– Robinson butane cavern
– Catlettsburg condensate splitter
27%
15%
35%
18% 5%
2015 Capital Budget - $2.5B
*Includes Pipeline Transportation segment and midstream investments included in the R&M segment.
Midstream*
Speedway
Refining Margin
Enhancement
Corporate
& Other
Refining
Sustaining
Capital
58

Capital Expenditures & Investments
Note: Excludes capitalized interest
($MM) MPLX 2015 Budget 1Q 2015
Growth 222 3
Maintenance 38 32
Total Capital Expenditures & Investments 260 35
*Includes MPLX
Note: Excludes capitalized interest
($MM) MPC 2015 Budget 1Q 2015
Refining & Marketing (R&M) 1,042 182
Midstream included in R&M 234 47
Speedway 452 45
Pipeline Transportation* 659 81
Corporate and Other 140 21
Total Capital Expenditures & Investments 2,527 376
59
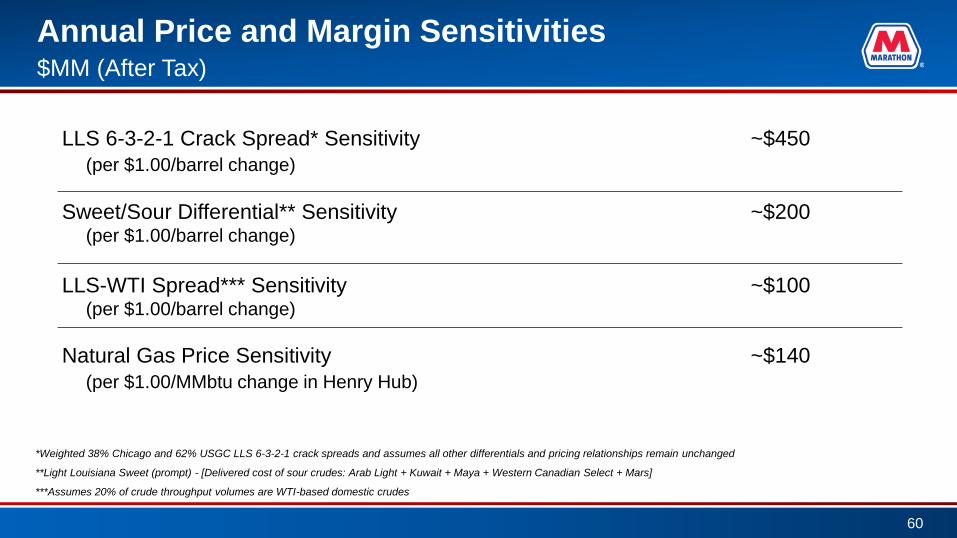
Annual Price and Margin Sensitivities $MM (After Tax)
LLS 6-3-2-1 Crack Spread* Sensitivity ~$450
(per $1.00/barrel change)
Sweet/Sour Differential** Sensitivity ~$200 (per $1.00/barrel change)
LLS-WTI Spread*** Sensitivity ~$100 (per $1.00/barrel change)
Natural Gas Price Sensitivity ~$140
(per $1.00/MMbtu change in Henry Hub)
*Weighted 38% Chicago and 62% USGC LLS 6-3-2-1 crack spreads and assumes all other differentials and pricing relationships remain unchanged
**Light Louisiana Sweet (prompt) - [Delivered cost of sour crudes: Arab Light + Kuwait + Maya + Western Canadian Select + Mars]
***Assumes 20% of crude throughput volumes are WTI-based domestic crudes
60

MPLX’s Priorities for Investors
Maintain Safe and Reliable Operations
Sustain Long-term Distribution Growth; Mid 20% for
the Next Five Years
Focus on Fee-Based Businesses
Pursue Organic Growth Opportunities
Grow Through Acquisitions
$20
$30
$40
$50
$60
$70
$80
$90
Oct-
12
De
c-1
2
Feb
-13
Ap
r-1
3
Ju
n-1
3
Au
g-1
3
Oct-
13
De
c-1
3
Feb
-14
Apr-
14
Jun-1
4
Au
g-1
4
Oct-
14
De
c-1
4
Feb
-15
Ap
r-1
5
Unit Price
IPO
Source: Thomson Reuters
61

MPLX and MPC are Aligned
MPC views MPLX as integral to its
operations and is aligned with its
success and incentivized to grow MPLX
MPLX assets consist of a 99.5% GP
interest in Pipe Line Holdings, as well
as 100% ownership in the Neal, W.Va.,
Butane Cavern
MPC retains the remaining 0.5% LP
interest in Pipe Line Holdings
MPC also owns 69.5% LP interest and
100% of MPLX’s GP interest
and IDRs
0.5% limited partner interest
100.0% ownership interest
100.0% ownership interest
MPLX Operations LLC
r
MPLX Terminal and Storage LLC
100.0% ownership
interest Public
100.0% ownership interest
2.0% GP interest 28.5% LP interest
Marathon Pipe Line LLC (“MPL”)
99.5% GP interest
Ohio River Pipe Line LLC (“ORPL”)
MPLX GP LLC (our General Partner)
69.5% LP interest
100.0% ownership interest
MPLX LP (NYSE: MPLX)
(the “Partnership”)
MPLX Pipe Line Holdings LP (“Pipe Line Holdings”)
Marathon Petroleum Corporation and Affiliates
(NYSE: MPC)
MPLX Organizational Structure
As of March 31, 2015
62

MPLX Deficiency Payment Effect Example For illustrative purposes only
($MM) Quarter
1 Quarter
2 Quarter
3 Quarter
4 Quarter
5 Quarter
6 Quarter
7
Quarterly deficiency payment 2 5 3 5 - - -
Use or expiration of credit (on or before) - - - - 2 5 3
Cumulative deferred revenue 2 7 10 15 13 8 5
Distributable cash flow Yes Yes Yes Yes No No No
Adjusted EBITDA No No No No Yes Yes Yes
63

Incentive Distribution Rights
1Q 2015 distribution of $0.4100/unit is in top tier of IDRs
64

2Q 2015 Outlook
*Region throughput data includes inter-refinery transfers, but MPC totals exclude transfers
**Includes utilities, labor, routine maintenance and other operating costs
***Includes $5 MM of pension settlement expense in 2Q 2014
****$/BBL throughput
Crude
Throughput*
Other
Charge/
Feedstocks
Throughput*
Total
Throughput*
Percent of WTI-
priced Crude
Turnaround
and Major
Maintenance
Depreciation
and
Amortization
Other
Manufacturing
Cost**
Total
Direct
Operating
Costs
Corporate
and Other
Unallocated
Items***
in MBD Refinery Direct Operating Costs****
Pro
jecte
d
2Q
2015
Gulf Coast Region
1,100 175 1,275 7% $0.55 $1.10 $3.80 $5.45
Midwest Region
675 25 700 39% $1.15 $1.80 $4.45 $7.40
MPC Total 1,775 150 1,925 20% $0.80 $1.35 $4.15 $6.30 $75 MM
2Q
2014
Gulf Coast Region
1,031 156 1,187 2% $0.57 $1.13 $4.77 $6.47
Midwest Region
643 45 688 40% $1.53 $1.75 $4.47 $7.75
MPC Total 1,674 158 1,832 17% $0.94 $1.39 $4.77 $7.10 $66 MM
Speedway Light Product Sales Volume – Projected 2Q 2015 1.5 billion gallons
65

MPLX Adjusted EBITDA Reconciliation
from Net Income
($MM) 2013 20141Q 2015
Annualized
Dec. 2015
Annualized
Net income 146 178 184 305
Less: Net income attributable to MPC-
retainretained interest 68 57 1 1
Net income attributable to MPLX LP 78 121 183 304
Plus: Net income attributable to MPC-
retained interest 68 57 1 1
Depreciation 49 50 51 71
Provision for income taxes - - - 4
Non-cash equity-based compensation 1 2 2 -
Net interest and other financial costs 1 5 21 71
Adjusted EBITDA 197 235 258 451
Less: Adjusted EBITDA attributable to MPC-
retainretained interest 86 69 1 1
Adjusted EBITDA attributable to MPLX LP 111 166 257 450
66
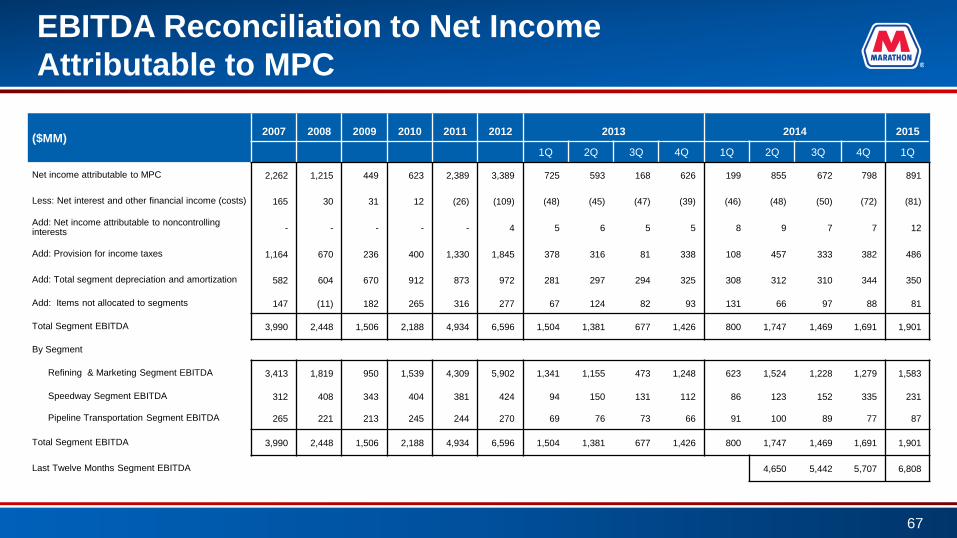
EBITDA Reconciliation to Net Income
Attributable to MPC
($MM) 2007 2008 2009 2010 2011 2012 2013 2014 2015
1Q 2Q 3Q 4Q 1Q 2Q 3Q 4Q 1Q
Net income attributable to MPC 2,262 1,215 449 623 2,389 3,389 725 593 168 626 199 855 672 798 891
Less: Net interest and other financial income (costs) 165 30 31 12 (26) (109) (48) (45) (47) (39) (46) (48) (50) (72) (81)
Add: Net income attributable to noncontrolling interests - - - - - 4 5 6 5 5 8 9 7 7 12
Add: Provision for income taxes 1,164 670 236 400 1,330 1,845 378 316 81 338 108 457 333 382 486
Add: Total segment depreciation and amortization 582 604 670 912 873 972 281 297 294 325 308 312 310 344 350
Add: Items not allocated to segments 147 (11) 182 265 316 277 67 124 82 93 131 66 97 88 81
Total Segment EBITDA 3,990 2,448 1,506 2,188 4,934 6,596 1,504 1,381 677 1,426 800 1,747 1,469 1,691 1,901
By Segment
Refining & Marketing Segment EBITDA 3,413 1,819 950 1,539 4,309 5,902 1,341 1,155 473 1,248 623 1,524 1,228 1,279 1,583
Speedway Segment EBITDA 312 408 343 404 381 424 94 150 131 112 86 123 152 335 231
Pipeline Transportation Segment EBITDA 265 221 213 245 244 270 69 76 73 66 91 100 89 77 87
Total Segment EBITDA 3,990 2,448 1,506 2,188 4,934 6,596 1,504 1,381 677 1,426 800 1,747 1,469 1,691 1,901
Last Twelve Months Segment EBITDA 4,650 5,442 5,707 6,808
67

Reconciliation Adjusted Free Cash Flow to Net Cash Provided by Operations
*Represents cash paid, excludes acquisition of Hess’ retail operations and related assets.
($MM) 2014 2015
(For the Quarter) 2Q 3Q 4Q 1Q
Net cash provided by operating activities 878 1,078 388 1,190
Additions to property, plant and equipment (302) (383) (528) (389)
Acquisitions* (42) (4) - -
Investments (41) (177) (72) (42)
Contingent Consideration - (172) - -
Adjusted free cash flow 493 342 (212) 759
Last twelve months free cash flow 1,382
68

EBITDA Reconciliation to Net Income for Hess
($MM) 2013* 2017E
Net Income 47 138
Less: Net interest and other financial income (costs) (12) -
Add: Provision for income taxes 22 78
Add: Depreciation and amortization 94 149
EBITDA 175 365
*Based on Hess Sept. 30, 2013 Form 10 data annualized
69

Market Indicators Used in Project EBITDA
Calculations
2015-2019
ULSD (USGC; $/BBL) $121.80-$128.98
Sour Gas Oil ($/BBL) $118.41
Sweet Gas Oil ($/BBL) $121.35
WTI 3:2:1 Crack Spread ($/BBL) $13.81
70