raymond james 36 th annual institutional investors conference bill rutherfordcfo and executive vice...
TRANSCRIPT

Raymond James36th Annual Institutional Investors ConferenceBill Rutherford CFO and Executive Vice PresidentDr. Ravi Chari Senior Vice President, Clinical ExcellenceMark Kimbrough Vice President, Investor Relations
March 3, 2015, Orlando, FL

22
2
FORWARD-LOOKING STATEMENTS AND NON-GAAP FINANCIAL MEASURES
This presentation may contain certain forward-looking statements provided by Company management. These statements are intended to be covered by the safe-harbor provisions of the Private Securities Litigation Reform Act of 1995. Forward-looking statements include all statements that do not relate solely to historical or current facts, including statements regarding future operations, financial results, cash flows, costs and cost management initiatives, capital structure management, growth rates, and operational and strategic initiatives, and can also be identified by the use of words like “may,” “believe,” “will,” “expect,” “project,” “estimate,” “anticipate,” “intend,” “plan,” “initiative,” “continue” or words or phrases of similar meaning. These forward-looking statements speak only as of the date hereof and are based on our current plans and expectations and are subject to a number of known and unknown uncertainties and risks, many of which are beyond our control. These risks and uncertainties are described in headings such as “Risk Factors” in our annual report on Form 10-K for the year ended December 31, 2014 and other reports to be filed with the Securities and Exchange Commission. As a consequence, current plans, anticipated actions and future financial position and results of operations may differ significantly from those expressed in any forward-looking statements in today’s presentation. You are cautioned not to unduly rely on such forward-looking statements when evaluating the information presented and we do not intend to update any of these forward-looking statements.
The presentation may contain certain non-GAAP measures, including Adjusted EBITDA. The Company’s earnings release for the year ended December 31, 2014, located on the Company’s investor relations page at www.hcahealthcare.com, includes reconciliations of the difference between certain non-GAAP financial measures with the most directly comparable financial measure calculated in accordance with GAAP. These non-GAAP financial measures should not be considered alternatives to the GAAP financial measures.
References to “Company” used herein refer to HCA Holdings, Inc. and its affiliates, unless otherwise stated or indicated by context.
33
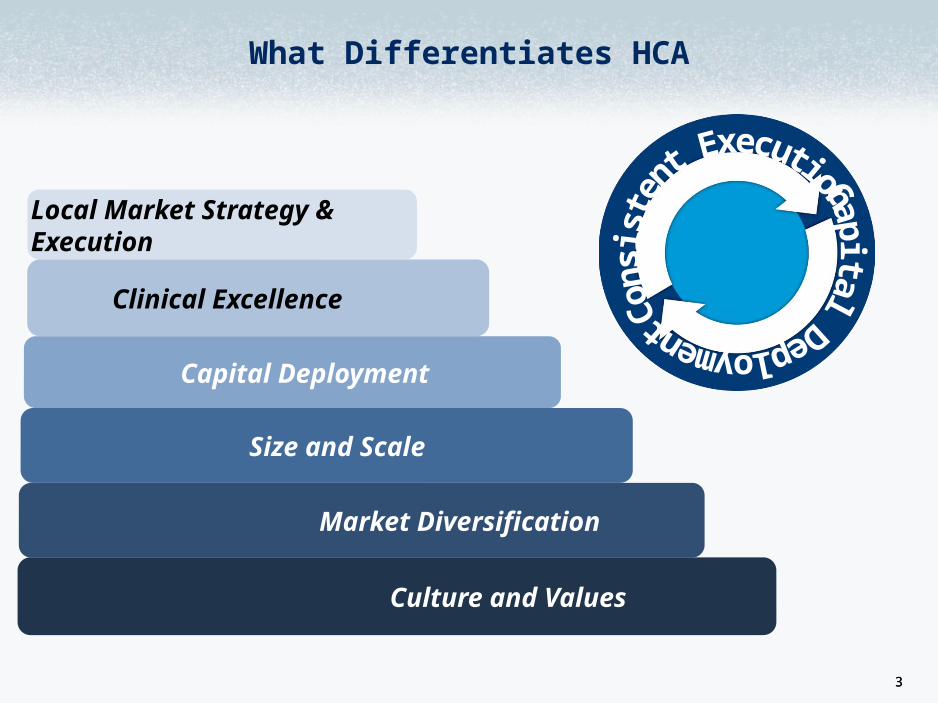
What Differentiates HCA
Local Market Strategy & Execution
Culture and Values
Clinical Excellence
Market Diversification
Capital Deployment
Size and Scale

44
What Differentiates HCA
$1.56B of Adjusted EBITDA Growth from 2010 – 2014
2010 2011 2012 2013 2014 $5.0
$5.5
$6.0
$6.5
$7.0
$7.5
$8.0
$5.87$6.06
$6.53 $6.57
$7.43Adjusted EBITDA (in Billions)
Adjusted EBITDA (in Billions)
55
5
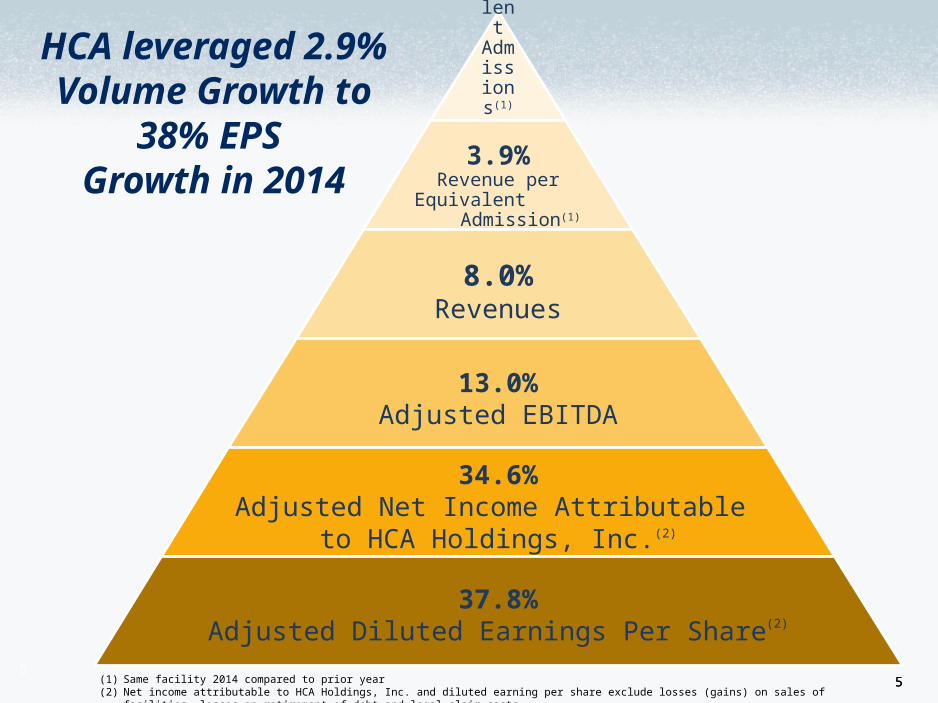
2.9%Equivalent
Admissions(1)
3.9%Revenue per
Equivalent Admission(1)
8.0%Revenues
13.0%Adjusted EBITDA
34.6%Adjusted Net Income Attributable
to HCA Holdings, Inc.(2)
37.8%Adjusted Diluted Earnings Per Share(2)
(1) Same facility 2014 compared to prior year(2) Net income attributable to HCA Holdings, Inc. and diluted earning per share exclude losses (gains) on sales of facilities, losses on retirement of debt and legal claim costs.
HCA leveraged 2.9% Volume Growth to
38% EPS Growth in 2014
66
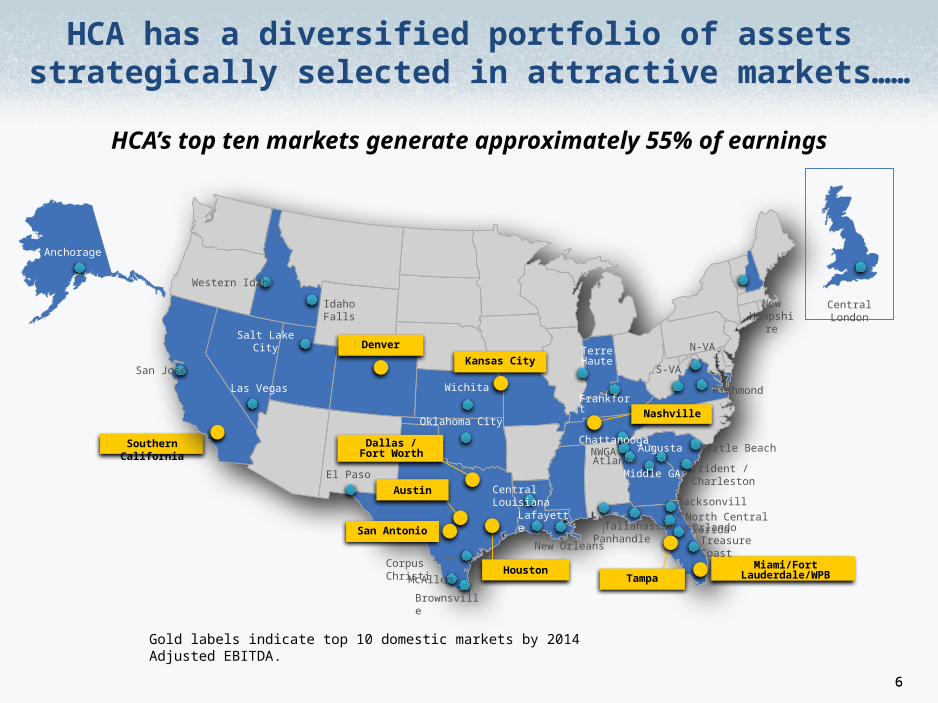
HCA has a diversified portfolio of assets strategically selected in attractive markets……
Salt Lake City Denver
Kansas City
Miami/Fort Lauderdale/WPB
Dallas /Fort Worth
San Antonio
New Hampshire
Western Idaho
San Jose
Southern California
Las Vegas
Idaho Falls
Myrtle Beach
Trident / Charleston
JacksonvilleNorth Central Florida
OrlandoTreasure Coast
N-VA
Richmond
S-VA
Augusta
Tallahassee
Wichita
Oklahoma City
Central Louisiana
Lafayette
New OrleansPanhandle
El Paso
Corpus Christi
McAllen
Brownsville
TerreHaute
Frankfort
ChattanoogaNWGAAtlanta
Middle GA
Anchorage
Nashville
HoustonTampa
Austin
Central London
Gold labels indicate top 10 domestic markets by 2014 Adjusted EBITDA.
HCA’s top ten markets generate approximately 55% of earnings
77
7
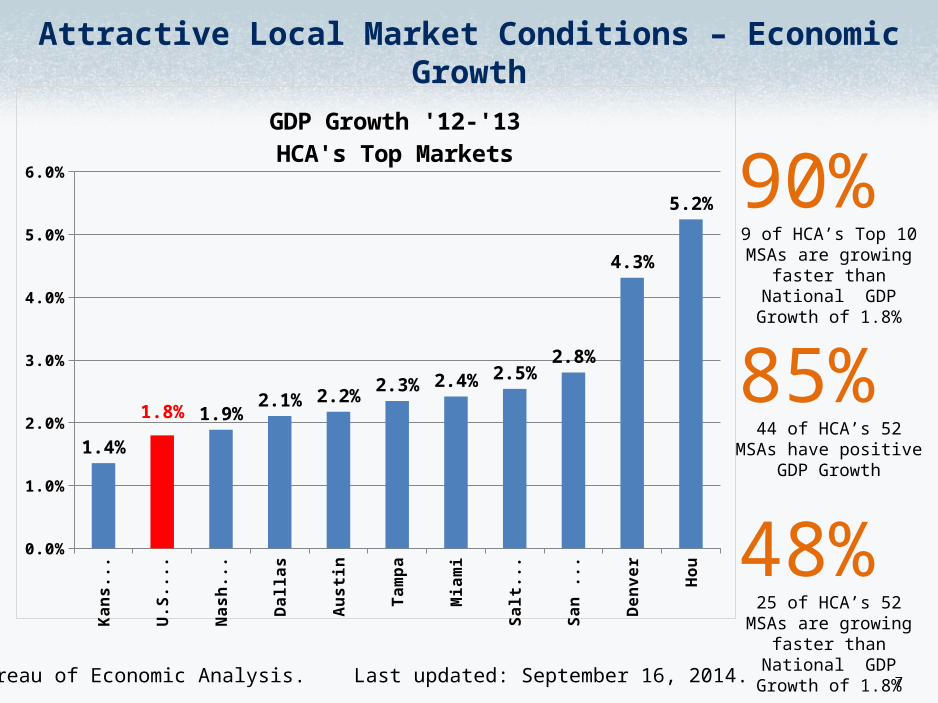
Attractive Local Market Conditions – Economic Growth
Source: Bureau of Economic Analysis. Last updated: September 16, 2014.
90% 9 of HCA’s Top 10 MSAs are
growing faster than National GDP Growth of
1.8%
85% 44 of HCA’s 52 MSAs have
positive GDP Growth
48% 25 of HCA’s 52 MSAs are
growing faster than National GDP Growth of
1.8%Kans
as ..
.
U.S
. GD
P
Nas
hvill
e
Dal
las
Aus
tin
Tam
pa
Mia
mi
Salt
Lak
e
San
An.
..
Den
ver
Hou
ston
0.0%
1.0%
2.0%
3.0%
4.0%
5.0%
6.0%
1.4%
1.8% 1.9%2.1% 2.2% 2.3% 2.4% 2.5%
2.8%
4.3%
5.2%
GDP Growth '12-'13HCA's Top Markets
88
Salt Lake City Denver
Kansas City
Miami/Fort Lauderdale/WPB
Dallas /Fort Worth
San Antonio
New Hampshire
Western Idaho
San Jose
Southern California
Las Vegas
Idaho Falls
Myrtle Beach
Trident / Charleston
JacksonvilleNorth Central Florida
OrlandoTreasure Coast
N-VA
Richmond
S-VA
Augusta
Tallahassee
Wichita
Oklahoma City
Central Louisiana
Lafayette
New OrleansPanhandle
El Paso
Corpus Christi
McAllen
Brownsville
TerreHaute
Frankfort
ChattanoogaNWGAAtlanta
Middle GA
Anchorage
Nashville
HoustonTampa
Austin
Central London
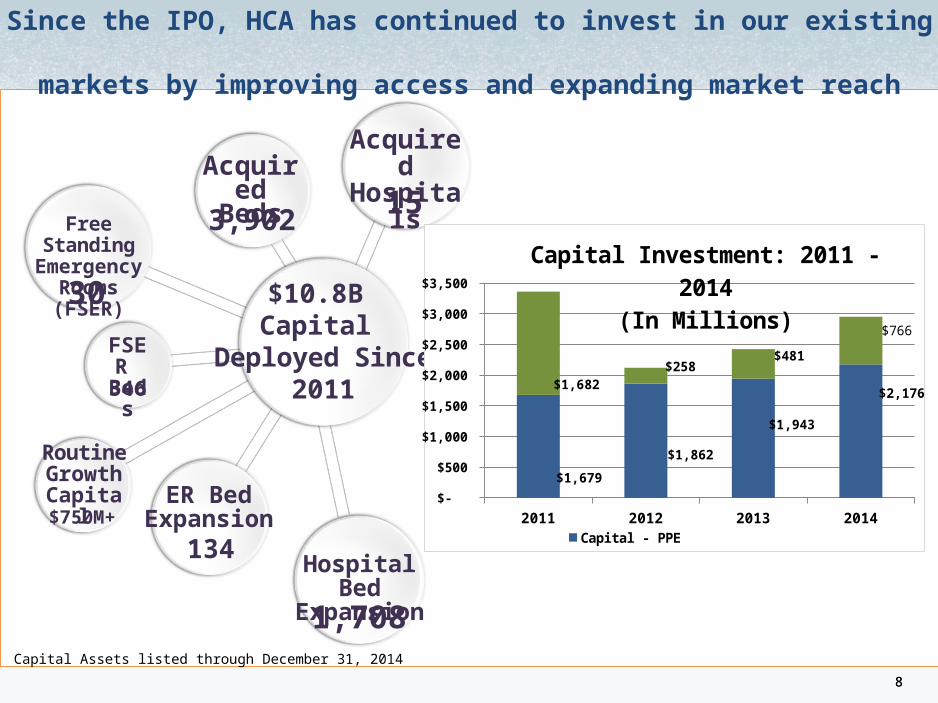
Since the IPO, HCA has continued to invest in our existing markets by improving access and expanding market reach
Acquired Hospitals
Free Standing Emergency
Rooms (FSER)
15
$10.8B Capital
Deployed Since2011
30
AcquiredBeds3,902
FSER Beds346
ER Bed Expansion
134
Routine Growth Capital$750M+
Hospital Bed Expansion1,708
2011 2012 2013 2014 $-
$500
$1,000
$1,500
$2,000
$2,500
$3,000
$3,500
$1,679
$1,862
$1,943
$2,176 $1,682
$258 $481
$766
Capital Investment: 2011 - 2014(In Millions)
Capital - PPE Capital - Acquisitions
Capital Assets listed through December 31, 2014

99
HCA’s Sustainable Growth Agenda
“Be the Preferred Provider System in the Market”
Industry leading quality and service
Profitable growth through distinctive MD and patient relationships and value
Efficiency levels that continue to lead the industry
A well-informed response to evolving market environment
Unparalleled development of future leaders

1010
10
Industry leading quality and service
Setting the Standard for Clinical Excellence in Support of HCA’s Strategic Agenda
o Create Patient-Centered Care Models
o Reduce Variation in Care Delivery
o Deliver Industry-Leading Outcomes
o Set Industry Standards for Care Delivery
o Support and Engage Clinicians
o Deploy Best-in-Class IT Tools
o Gain External Affirmation
Generating Value for:
Informed consumers with high deductible health plans
Physicians seeking high quality, efficient places to practice
Payers desiring innovative collaboration
Employers managing benefit costs
1111
11
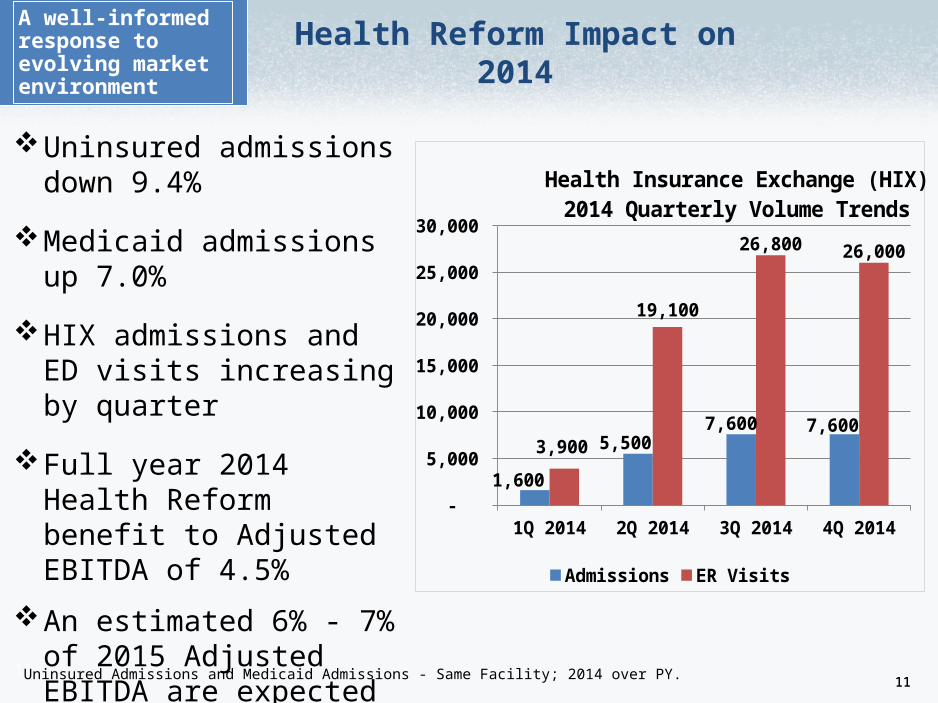
Health Reform Impact on 2014
Uninsured admissions down 9.4%
Medicaid admissions up 7.0%
HIX admissions and ED visits increasing by quarter
Full year 2014 Health Reform benefit to Adjusted EBITDA of 4.5%
An estimated 6% - 7% of 2015 Adjusted EBITDA are expected to be related to the benefits of health reform
A well-informed response to evolving market environment
Uninsured Admissions and Medicaid Admissions - Same Facility; 2014 over PY.
1Q 2014 2Q 2014 3Q 2014 4Q 2014 -
5,000
10,000
15,000
20,000
25,000
30,000
1,600
5,500 7,600 7,600
3,900
19,100
26,800 26,000
Health Insurance Exchange (HIX)2014 Quarterly Volume Trends
Admissions ER Visits
1212
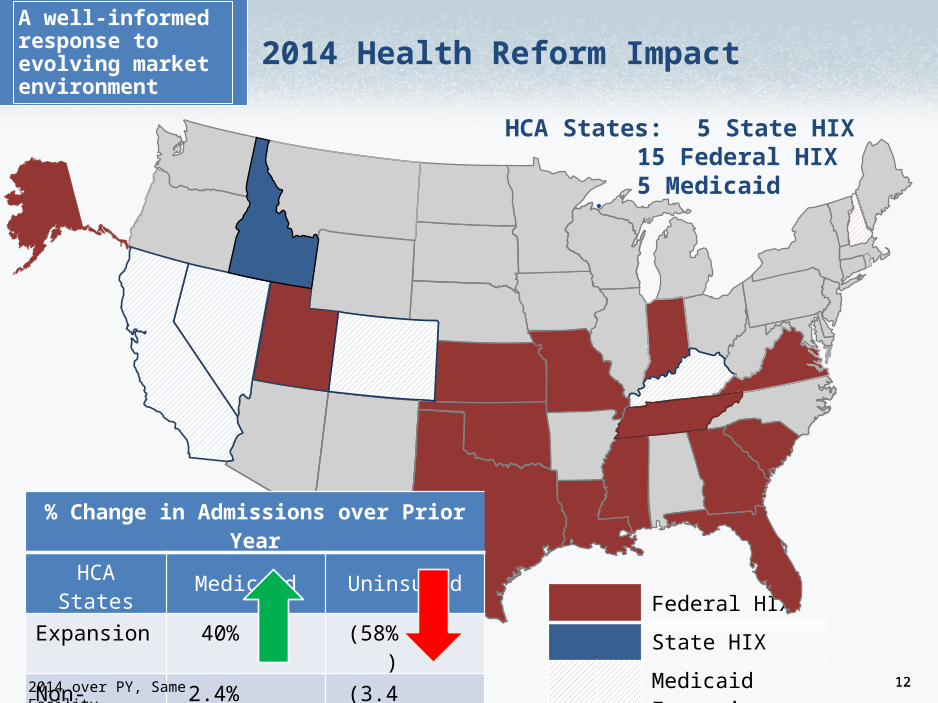
HCA States: 5 State HIX 15 Federal HIX
5 Medicaid Expansion
Federal HIX
State HIX
Medicaid Expansion
A well-informed response to evolving market environment
2014 Health Reform Impact
% Change in Admissions over Prior Year
HCA States Medicaid Uninsured
Expansion 40% (58%)
Non-Expansion 2.4% (3.4%)
All 7.0% (9.4%)
2014 over PY, Same Facility
1313
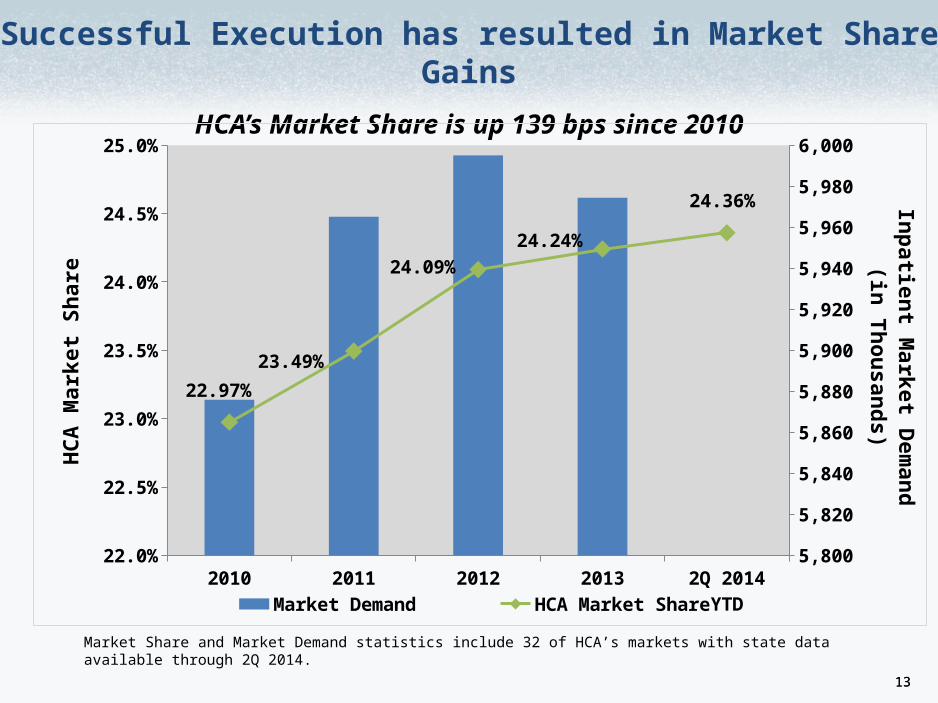
Successful Execution has resulted in Market Share Gains
HCA’s Market Share is up 139 bps since 2010
Market Share and Market Demand statistics include 32 of HCA’s markets with state data available through 2Q 2014.
2010 2011 2012 2013 2Q 2014 YTD5,800
5,820
5,840
5,860
5,880
5,900
5,920
5,940
5,960
5,980
6,000
22.0%
22.5%
23.0%
23.5%
24.0%
24.5%
25.0%
22.97%
23.49%
24.09%24.24%
24.36%
Market Demand HCA Market Share
Inpatient Market Dem
and(in Thousands)
HCA
Mar
ket S
hare

1414
Equivalent Admissions and Emergency Room Visits
Consistent Volume Growth2014 % Change
Equivalent Admits: 4.0%ER Visits: 6.9%
2010 2011 2012 2013 20140
1,000,000
2,000,000
3,000,000
4,000,000
5,000,000
6,000,000
7,000,000
8,000,000
2,468,400 2,595,900 2,832,100 2,844,700 2,958,700
5,706,200 6,143
6,912,000 6,968,100 7,450,700
Equivalent Admissions ER Visits

1515
Acquisitions
Cash Flow from Operations
Capital Expenditures
Special Dividends
Share Repurchases1
$15.3 B
$7.3 B
$3.2 B
$3.2B
$3.8B
Cash Flow Trends from March 2011 IPO through 2014
1 Share repurchases does not include newly announced $1B share repurchase in February 2015

1616
What Differentiates HCA
Local Market Strategy & Execution
Culture and Values
Clinical Excellence
Market Diversification
Capital Deployment
Size and Scale

Raymond James36th Annual Institutional Investors ConferenceBill Rutherford CFO and Executive Vice PresidentDr. Ravi Chari Senior Vice President, Clinical ExcellenceMark Kimbrough Vice President, Investor Relations
March 3, 2015, Orlando, FL