raw oyster technical report final - issc raw oyster...regarding the consumption of raw oysters. the...
TRANSCRIPT


RRAAWW OOYYSSTTEERR CCOONNSSUUMMEERR FFOOLLLLOOWW--UUPP SSUURRVVEEYY:: 22000044
TTEECCHHNNIICCAALL RREEPPOORRTT
Prepared by
126 College Street Burlington, VT 05401

TABLE OF CONTENTS SURVEY METHODOLGY.....................................................................................4
I. Introduction ................................................................................................4 II. Sample Design and Eligibility Requirements..............................................4
Population......................................................................................................4 Sample Design ..............................................................................................5 Sampling plan ................................................................................................5 Sample management.....................................................................................6
III. Questionnaire Design .............................................................................7 IV. Data Collection Protocol .........................................................................8
Interviewing Protocol .....................................................................................8 Contacting Respondents ...............................................................................8
V. Interviewer Training....................................................................................9 VI. Quality Assurance Protocol ..................................................................11
Data Collection Quality Control....................................................................11 Interviewer Monitoring .................................................................................12
VII. Issues with Survey Implementation ......................................................13 VIII. Weighting Methods...............................................................................13
Weighting Design.........................................................................................13 IX. The Final Deliverables ..........................................................................16 X. Response Rates.......................................................................................17
SURVEY RESULTS............................................................................................18 I. Introduction ..............................................................................................18 II. Who Eats Raw Oysters ............................................................................18
Overall .........................................................................................................18 Age ..............................................................................................................18 Race ............................................................................................................19 Ethnicity .......................................................................................................19 Sex ..............................................................................................................20 High Risk Respondents ...............................................................................20
III. Consumption Patterns ..........................................................................21 Recent Consumption ...................................................................................21 Frequency....................................................................................................21 Behavior ......................................................................................................22
IV. Consumer Knowledge ..........................................................................22 Liver Disease ...............................................................................................23 Diabetes ......................................................................................................23 Weak Immunity ............................................................................................24 Media Type..................................................................................................24 Media Exposure...........................................................................................26
V. Risk Reduction .........................................................................................26 No Recent Consumption..............................................................................26 Reduced Consumption ................................................................................26 Risk Reduction Methods..............................................................................27
Appendix A: Final Disposition Table...............................................................28

Appendix B: Response Rate Formulas...........................................................30 CASRO Response Rate ..............................................................................31 Overall Response Rate................................................................................31 Cooperation Rate.........................................................................................32
Appendix C: Open-End Responses.................................................................33 Appendix D: Survey.........................................................................................50 Appendix E: Question-Level Frequencies .....................................................63

2004 Raw Oyster Consumer Follow-up Survey: 2004 —Technical Report 4
SURVEY METHODOLGY
I. INTRODUCTION
This report describes the survey implementation for the 2004 Raw Oyster Consumer Survey. The Raw Oyster Consumer Survey was conducted to obtain detailed data regarding the prevalence of raw oyster consumption in four states: California, Louisiana, Texas and Florida. The data collected will reveal people’s Oyster-consumption knowledge, exposure to health-risks associated with oyster consumption, and opinions regarding the consumption of raw oysters. The data serve as a follow-up measure by which the impact of raw oyster consumption prevention and control activities funded by the Interstate Shellfish Sanitation Conference’s (ISSC) will be assessed. The Raw Oyster Consumer Survey methodology was similar to the ISSC’s baseline survey, conducted in 2002. This data provides information about the prevalence of oyster consumption, opinions regarding health effects, and oyster consumption opinions on a variety of topics.
Through a competitive application process, the ISSC contracted with ORC Macro, located in Burlington, Vermont, to perform the survey’s data collection. The 2004 Raw Oyster Consumer Survey was implemented in September 2004 through January 2005. Data collection was conducted via telephone surveys with randomly selected adults in randomly selected, telephone-equipped households of California, Louisiana, Texas and Florida as outlined in the sample frame.
II. SAMPLE DESIGN AND ELIGIBILITY REQUIREMENTS Population
The Interstate Shellfish Sanitation Conference is conducting a follow-up to the 2002 baseline survey of raw oyster consumers. The four states under surveillance are Southern California, Florida, Louisiana, and Texas. The 2004 survey is largely similar in design to the baseline, with some modifications for enhancing sampling efficiencies. The target number of interviews with oyster consumers in each area is 500 (2000 total.) For targeting oyster consumers, coastal areas of Southern California and Texas are oversampled at ratios of 4:1 and 2:1 respectively. Counties defined the coastal areas in the baseline survey. These relatively large geographic entities were insufficient in delineating between a high and low oyster eating population. For 2004, we are defining coastal areas via zip codes. Specifically zip codes within roughly 25 miles of the shoreline are defined as coastal areas. The remaining zip codes are defined as non-coastal areas.
The Raw Oyster Consumer Survey sample was drawn from the total non-institutionalized adult population (ages 18 and over) residing in telephone-equipped dwelling units (DUs). This population excluded adults: (1) in penal, mental, or other institutions; (2) living in other group quarters such as dormitories, barracks, convents, or boarding houses (with

2004 Raw Oyster Consumer Follow-up Survey: 2004 —Technical Report 5
ten or more unrelated residents); (3) contacted at their second DU during a stay of less than 30 days; (4) living in a DU without a telephone and (5) who do not speak English or Spanish well enough to be interviewed.
Sample Design
In each geographic area, sample is selected with a double sampling for stratification approach. By matching sampled phone numbers to a database of listed telephone numbers, we establish the listing status for each number in sample. Then, the listed phone numbers are stratified into the high-density stratum, while those that are unlisted are stratified into the low-density stratum. We expect the hit rate is higher in the high-density stratum, thus oversampling in this stratum results in a more efficient design for obtaining completed interviews. This stratification is done through a two-phase sampling process: Phase 1: An initial list-assisted RDD sample of phone numbers is drawn from all 100 blocks of numbers with at least 1 listed phone number (1+ blocks.) A 100 block is the group of 100 phone numbers defined by the last two digits of a 10-digit phone number. Holding the first eight digits fixed, the last two digits range from 00-99, which is 100 numbers or one 100 block. To further enhance efficiency (and reduce costs) zero-blocks, or 100 blocks with 0 listed phone numbers, are excluded from the sampling frame. The resulting phase 1 sample of phone numbers is then matched to a database of listed phone numbers to identify whether the phone number is listed or unlisted. Those listed are stratified into the high-density stratum and those unlisted into the low-density stratum. Phase 2: Numbers are then subsampled from the two strata. To take advantage of the efficiency gains in the high-density stratum, these numbers are oversampled relative to the low-density stratum. To maintain sampling weights that are relatively close in magnitude, the subsampling is a relatively modest 1.5:1 ratio.
Sampling plan
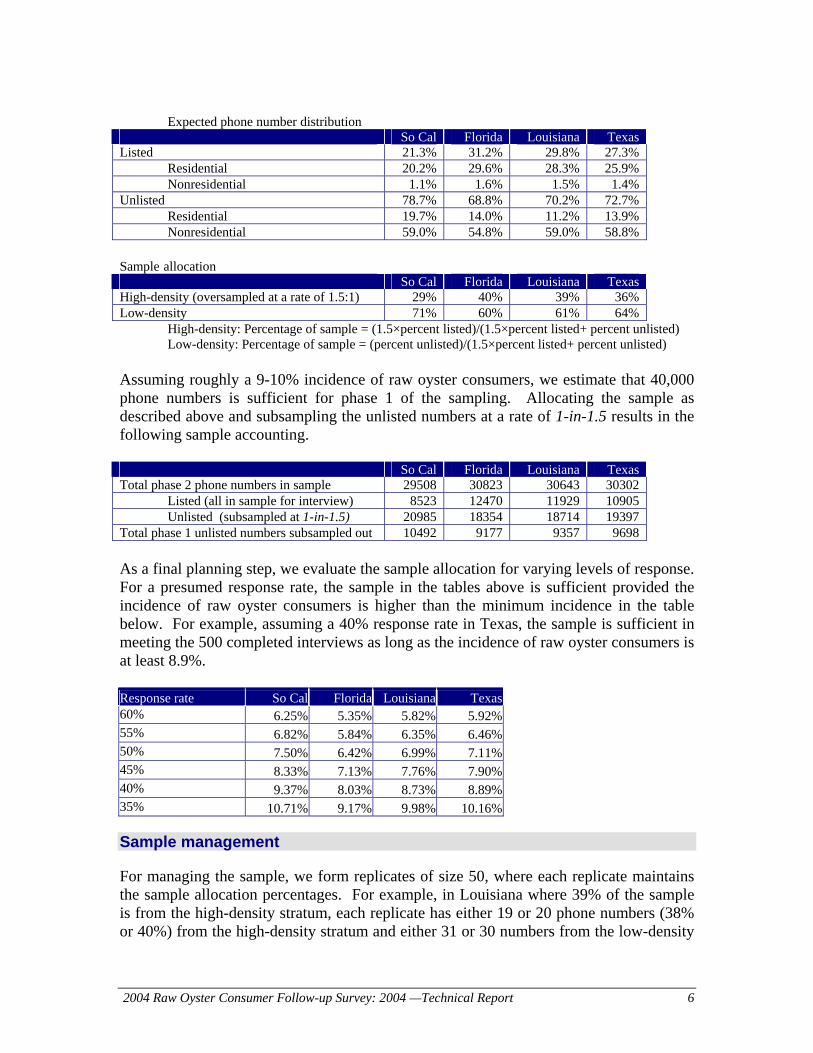
Planning the above design involves many assumptions based on a preliminary analysis of the working residential numbers in the four states. These assumptions are: So Cal Florida Louisiana Texas Percentage of working residential numbers 39.9% 43.6% 39.5% 39.8% Percentage of residential listed numbers 53.4% 71.5% 75.5% 68.5% Percentage of invalid listed residential numbers 95.0% 95.0% 95.0% 95.0% With these assumptions we form a table of the expected distributions of phone numbers with respect to residential and listed status. Then, using this expected distribution, we can form the expected phase 2 sample allocation.
2004 Raw Oyster Consumer Follow-up Survey: 2004 —Technical Report 6
Expected phone number distribution
So Cal Florida Louisiana Texas Listed 21.3% 31.2% 29.8% 27.3%
Residential 20.2% 29.6% 28.3% 25.9% Nonresidential 1.1% 1.6% 1.5% 1.4%
Unlisted 78.7% 68.8% 70.2% 72.7% Residential 19.7% 14.0% 11.2% 13.9% Nonresidential 59.0% 54.8% 59.0% 58.8%
Sample allocation So Cal Florida Louisiana Texas High-density (oversampled at a rate of 1.5:1) 29% 40% 39% 36% Low-density 71% 60% 61% 64%
High-density: Percentage of sample = (1.5×percent listed)/(1.5×percent listed+ percent unlisted) Low-density: Percentage of sample = (percent unlisted)/(1.5×percent listed+ percent unlisted)
Assuming roughly a 9-10% incidence of raw oyster consumers, we estimate that 40,000 phone numbers is sufficient for phase 1 of the sampling. Allocating the sample as described above and subsampling the unlisted numbers at a rate of 1-in-1.5 results in the following sample accounting. So Cal Florida Louisiana Texas Total phase 2 phone numbers in sample 29508 30823 30643 30302
Listed (all in sample for interview) 8523 12470 11929 10905 Unlisted (subsampled at 1-in-1.5) 20985 18354 18714 19397
Total phase 1 unlisted numbers subsampled out 10492 9177 9357 9698 As a final planning step, we evaluate the sample allocation for varying levels of response. For a presumed response rate, the sample in the tables above is sufficient provided the incidence of raw oyster consumers is higher than the minimum incidence in the table below. For example, assuming a 40% response rate in Texas, the sample is sufficient in meeting the 500 completed interviews as long as the incidence of raw oyster consumers is at least 8.9%. Response rate So Cal Florida Louisiana Texas60% 6.25% 5.35% 5.82% 5.92%55% 6.82% 5.84% 6.35% 6.46%50% 7.50% 6.42% 6.99% 7.11%45% 8.33% 7.13% 7.76% 7.90%40% 9.37% 8.03% 8.73% 8.89%35% 10.71% 9.17% 9.98% 10.16%
Sample management
For managing the sample, we form replicates of size 50, where each replicate maintains the sample allocation percentages. For example, in Louisiana where 39% of the sample is from the high-density stratum, each replicate has either 19 or 20 phone numbers (38% or 40%) from the high-density stratum and either 31 or 30 numbers from the low-density

2004 Raw Oyster Consumer Follow-up Survey: 2004 —Technical Report 7
stratum (62% or 60%.) The average number of phone numbers from the high- density stratum is 19.5 (39%) over all the replicates. This method preserves the 1.5:1 sampling ratio and allows for the sample size targets to be most efficiently met.
III. QUESTIONNAIRE DESIGN ORC Macro worked with ISSC to design the questionnaire. The questionnaire was designed to collect data regarding the oyster-consumption habits of residents in the four states, and opinions toward oyster-consumption.
The questionnaire contains four sections.
• An introduction and screening section.
• First “core” section, which contained the following types of questions:
Respondent’s oyster-consumption patterns Opinions and beliefs about consuming raw oysters Media exposure to raw oyster consumption health risks Risk Perception
• Second “core” section, which consisted of questions related to:
General Demographic Items o Respondent’s health status
• Closing statement.
The survey questionnaire contained 19 items, 1 of which was a multi-part question. The questionnaire that was administered to respondents can be found in Appendix A: The 2004 Raw Oyster Questionnaire.

2004 Raw Oyster Consumer Follow-up Survey: 2004 —Technical Report 8
IV. DATA COLLECTION PROTOCOL
A computer-assisted telephone interviewing (CATI) approach was implemented for data collection.
Interviewing Protocol
The sample design called for a total of 2,000 completed interviews, 500 in each of the four states. In all, 2,006 interviews were collected.
The telephone survey was fielded from ORC Macro’s Reno, Nevada CATI Research Center. The telephone survey followed a 15-attempt protocol, in which attempts were made until a final disposition was obtained. A final disposition was attained when:
• The respondent completed the interview; • The telephone number was found to be invalid; • The record reached 15 attempts distributed among three different day parts; or • The respondent gave a final refusal.
Experienced, supervised personnel conducted the Raw Oyster interviews using Computers for Marketing Corporation’s (CfMC’s) CATI software package. To maximize response rates, ORC Macro concentrated calls between 5 p.m. - 9 p.m. Monday through Friday, and between 10 a.m. – 9:00 p.m. on Saturday and Sunday, relative to respondent time zones. In ORC Macro’s experience, this is when most respondents are available to complete interviews. A portion of calls was conducted between 9 a.m. - 5 p.m. Monday through Friday, in order to complete interviews with respondents who were only at home during the day
The average interview length was 6 minutes across all states.
Contacting Respondents
The following protocols were followed when contacting households and potential respondents:
Treatment of No Answers. If a call to a sampled telephone number was not answered, the number was repeatedly called at different times, during daytime and evening hours (9 a.m. to 9 p.m. Monday–Friday; 10 a.m. to 9 p.m. Saturday; 1 p.m. to 9 p.m. Sundays), on different days of the week, in a pattern designed to maximize the likelihood of contact with a minimum number of calls. At least 15 contact attempts, over a minimum five-day period (typically 15 days), were made to reach a sampled number. Once any contact was made at a residence, as many calls as necessary were made to reach the selected adult (within the permitted time schedule).
2004 Raw Oyster Consumer Follow-up Survey: 2004 —Technical Report 9
Rings Per Attempt. The telephone rang a minimum of five times on each attempt made on a record.
Busy Lines. Busy lines were called back at least twice at 10-minute intervals. If the line was still busy after the third attempt, the number was assigned a “busy” disposition and called during the next shift.
Respondent Selection. Once a household was contacted, an adult was selected for participation in the study if there was at least one adult oyster consumer (18 years or older) in the household. If the person who answered the phone was an adult oyster consumer, that person was selected for the interview. In following instances, no interview was conducted if:
1) The adult was: unavailable during the survey period; unable or unwilling to participate; or did not speak English or Spanish well enough to be interviewed.
2) A randomly sampled number was not residential – in other words, it was:
a business; an institution; group quarters; or other strictly non-residential space.
Language of Interviewing. Interviewing for the Raw Oyster Consumer Survey was conducted in English and Spanish.
Converting Initial Refusals. In order to maximize response rates, a two refusal protocol was employed. Households that initially refused were called back by a specially-trained interviewer. Upon the second refusal, the number was removed from calling.
V. INTERVIEWER TRAINING
Interviewers underwent extensive training, specific to the Raw Oyster Consumer Survey, prior to data collection. The training, in conjunction with ORC Macro’s quality control measures (discussed in the next chapter), assured consistent, high quality interviewing during data collection.
ORC Macro recognizes that the quality of data collection depends largely on the performance of the interviewing staff. Interviewers on this study were specifically recruited for health-related research. A description of interviewers’ qualifications for this survey can be found in Appendix B: Qualifications of Interviewers. ORC Macro’s training sessions for the Raw Oyster Consumer Survey focused on these important aspects of the survey research process:

2004 Raw Oyster Consumer Follow-up Survey: 2004 —Technical Report 10
Introduction to the Project. The first part of ORC Macro’s training introduced the interviewers to the purpose and scope of the survey. This part of the training included explanation of the significance of a high response rate, the effect that a high number of refusals has on the study, the importance of confidentiality, the purpose of this study, and any terminology specific to the project. (All ORC Macro employees sign a statement of confidentiality on the date of hire. A copy of ORC Macro’s confidentiality statement can be found in Appendix C: Confidentiality Agreement.)
Introduction to Sampling. The second section discussed the type of sampling being used in the Raw Oyster Consumer Survey, and described the interview targets. In this section, the importance of making multiple attempts and converting refusals was stressed.
The Role of ORC Macro. In this training section, the role of each member of ORC Macro’s staff was explained to the interviewers. Specifically, the role of the project managers, the data collections management team, the interviewers, the quality assurance assistants, and the data processing team were discussed.
Overview of the Questionnaire. The next step in the training process was an overview of the questionnaire and a brief review of the most important pieces of information related to administering the survey, such as survey length, verification of telephone numbers, protocol, and question type overviews.
Approaches to Interviewing. During the Raw Oyster Consumer Survey training, a brief refresher on interviewing techniques was conducted. This section focused on how to move a respondent through a survey and ask the questions appropriately. Also emphasized in this section was keeping question non-response to a minimum and avoiding respondent refusals. Probing techniques included clarification of respondent responses, open-end verification, and re-reading of response categories.
Hands-on Practice. This part of the training dealt specifically with administering the Raw Oyster Consumer Survey. This included a word-for-word review of the questionnaire, done interactively with the CATI program. Each interviewer worked on a terminal and completed each screen of the CATI program. Many different scenarios, such as respondent reactions, skip pattern scenarios, and disposition protocols, gave the interviewer a better understanding of the CATI program and the questionnaire.
Raw Oyster Consumer Survey Protocols. Protocols unique to the Raw Oyster Consumer Survey were emphasized in this section, such as reading verbatim, respondent selection procedures, assuring respondent confidentiality, probing and clarifying, and dealing with refusals.

2004 Raw Oyster Consumer Follow-up Survey: 2004 —Technical Report 11
VI. QUALITY ASSURANCE PROTOCOL
ORC Macro implements stringent quality assurance protocols to ensure the highest quality data for our clients.
Data Collection Quality Control
ORC Macro programmed the English questionnaire using the CfMC’s Survent software package, which is designed specifically for programming and managing CATI studies. CfMC software, used by ORC Macro to program all of its CATI surveys, is a powerful questionnaire programming language that provides:
• Call management; • Quota controls; • In-bound calling capabilities; • Multilingual interviewing capabilities; • Data back-up; • Monitoring; and • Incidence tracking1.
ORC Macro’s programmers have customized this package by adding a suite of database management and statistical analysis routines to support complex sampling, telephone sample management, and reporting requirements that are not met by the off-the-shelf product. Upon programming completion, ORC Macro project managers rigorously tested the survey. Testing included:
• Developing scenarios to test all possible paths through the questionnaire; • Checking frequencies of randomly generated data; and • Verifying frequencies of the data after the first day of interviewing.
To track quality control indicators in the call center, ORC Macro generated reports that read the survey data file, generating summary statistics on the following:
• Interviewer efficiencies (completes/hour, both on an individual and project level);
• Demographics on completed interviews; and • All call dispositions (both interim and final).
These reports were generated by the survey manager and immediately distributed to the project management team for daily review. This enabled the management team to quickly detect and resolve any problems.
1 Incidence is the proportion of the survey sample that is eligible to participate in the survey.
2004 Raw Oyster Consumer Follow-up Survey: 2004 —Technical Report 12
Interviewer Monitoring
ORC Macro monitors interviewer performance through supervisors and quality assurance (QA) assistants, as well as with formal and informal performance evaluations.
The quality control team for this survey included the survey manager, data collection manager, supervisors, and QA assistants. Monitoring was primarily conducted by ORC Macro’s special quality control staff, called QA assistants. QA assistants monitored interviews by tapping into interviewers’ telephone lines and using the CATI system’s monitoring module to follow the course of the interview on a computer screen. Interviewers were scored on several measures of interview performance designed to reinforce proper interviewer protocol:
• Verbatim response entry; • Dispositioning calls, leaving messages, and scheduling callbacks; • Reading scales properly; • Knowing the mechanics of CfMC and the Raw Oyster Consumer Survey; • Reading and probing on open-ended questions; • Reading multiple response lists; • Reading the introduction and persuading respondents to complete interviews; • Pace of reading the survey; • Clarity and/or tone of voice while interviewing; • Probing and/or clarifying responses that are not clear; • Keeping control of the interview; • Converting refusals on specific questions; • Overall professionalism • Being neutral while interviewing, not leading respondent; and • Overall dialing habits.
QA staff also assured that interviewers:
• Coded incomplete interviews properly; • Left useful messages for the next interviewer; and • Made every attempt to complete an interview on every contact.
Monitoring forms were completed for each monitored interview; these forms rate interviewers on up to 16 areas of performance. For each of the areas, interviewers are scored on a scale of 1 to 10, where 1 is “May require verbal/written warning. Must show immediate improvement!” and 10 is “Perfect! Makes every appropriate and professional effort.” An example of the interviewer monitoring form is attached as Appendix E: Quality Assurance Form.
Of the Raw Oyster Consumer Survey interviews monitored, the average score was 83 out of 100, with a low score of 52 and a high of 99. Interviewers do not receive a perfect score of 10 on each aspect they are rated on if:
2004 Raw Oyster Consumer Follow-up Survey: 2004 —Technical Report 13
• They have to backtrack and change an item that they coded incorrectly; • The first time they type an open-ended response, they need to revise after
rereading it to the respondent; • When they ask a clarification question (i.e., “just to make sure I recorded this
correctly, you stated you smoke 5 cigarettes a day on average”), the respondent changes their answer and the response is changed; or
• The response to a follow-up question conflicts with a prior question, and one or both responses must be changed.
It is important to note that a score on the low end of the range does not mean that the data collected by that interviewer is not valid; an interviewer could obtain a low score because he or she was not effective at refusal conversion, moved through the questions with hesitation, or did not keep an appropriate pace for the survey. ORC Macro’s policy is to remove interviewers whose interviewing technique may be detrimental to data quality. No problems of this kind were encountered with interviewers during data collection for the Raw Oyster Consumer Survey.
VII. ISSUES WITH SURVEY IMPLEMENTATION During the analysis and report preparation, we discovered that there are some respondents from Northern California. Although this error was unintentional, there is a benefit to having these cases--the scope of the estimates can be expanded to include the entire state of California. Since all phone numbers in the state had a probability of selection, all residents (with a phone) were eligible, thus the sample is representative of all of California. Analysis for Southern California respondents is still valid and there is only a slight loss in precision when using the 408 Southern California interviews compared to the full 500. The margin of error should be just slightly higher when using the 408 Southern California interviews - at about 5%. Using the total 500 interviews, the error would be approximately 4.5%.
VIII. WEIGHTING METHODS Weighting Design
For each state, we calculate survey weights using these four steps: 1. Base weight - a base weight is calculated to account for the geographic and
density-based oversampling. 2. Screening adjustment - the weighted (by base weight) sample of 18 and over
adults as measured in the screening is adjusted to conform to population totals. 3. Estimate oyster eating population - using the weight calculated in step 2, we
estimate the population of oyster eaters for 18 and over males and females as measured in the screening.

2004 Raw Oyster Consumer Follow-up Survey: 2004 —Technical Report 14
4. Interview adjustment - we calculate the final adjustment by ratio adjusting the weighted (by screening weight) sample of oyster eaters to the incidences population of oyster eaters as measured in step 3.
Base weight In Texas and S. California, telephone numbers in the coastal stratum were oversampled relative to the noncoastal stratum at rates of 4:1 and 2:1, respectively. This geographic oversampling is adjusted for with the calculation of a base weight, which equals the total number of eligible telephone numbers divided by the number of telephone numbers selected in each area. In addition to the geographic oversampling, listed telephone numbers were oversampled relative to unlisted telephone numbers in all four states. This oversampling is accomplished via a double sampling for stratification approach (i.e. stratification based on a sample), thus we must estimate the total number of eligible listed and unlisted telephone numbers in each geographic stratum based on sample information,
listlist pNN ˆˆ = and )ˆ1(ˆlistunlist pNN −= , where N is the total number of eligible telephone
numbers in the geographic stratum and listp̂ is the proportion of listed telephone numbers based on the original RDD sample of telephone numbers. These calculations are in the table below. Estimated Listed and Unlisted Eligible phone numbers
State
Geographic Stratum (COASTAL)
Eligible Numbers
Estimated Proportion
listedEstimated
Total Listed
Estimated Total
Unlisted Texas 1=Coastal 3,279,100 32.62% 1,069,775 2,209,325 2=Noncoastal 17,478,500 27.93% 4,880,988 12,597,512 California 1=Coastal 14,279,100 22.06% 3,149,342 11,129,758 2=Noncoastal 17,202,500 24.82% 4,270,152 12,932,348 Florida 16,845,100 32.14% 5,414,752 11,430,348 Louisiana 4,432,500 30.33% 1,344,403 3,088,097 To calculate the base weights in each stratum, we divide the estimated total number of listed telephone numbers by the number of listed telephone numbers selected and estimated number of unlisted telephone numbers by the total number of unlisted telephone numbers selected:
list
listlist n
Nw′
=ˆ
,1 and unlist
unlistunlist n
Nw′
=ˆ
,1 ,
where listn′ = total selected telephone numbers where LISTED=1, and unlistn′ = Total selected phone numbers where LISTED=2.

2004 Raw Oyster Consumer Follow-up Survey: 2004 —Technical Report 15
Screening adjustment The number of adults in each household was asked during the household screening. Using the responses for this variable, we adjust the number of adults in the screened households to match population totals for 18+ adults as defined by Census 2000. The population totals are listed in the table in the next section. To calculate the screening adjustment for each state, sum the weighted number of adults (HHadults) from screening question ADULTS.
∑=screened
adults ADULTSwHH 1
Next, calculate the screening adjustment by dividing the population counts by the weighted screening estimate:
adultsadults HH
Adultsadjs +=
18
We calculate the screening weight (w2) as w2=w1×adjsadults. Estimate oyster eating population In addition to asking the number of adults in each household during the household screening, the number of male oyster eaters (MOYS) and the number of female oyster eaters (WOYS) were also asked in households with 2 or more people. In households with only one person, the respondent was asked whether they ate oysters or not (ADULTS3b). From these questions and the screening weights, we can estimate the total number oyster eaters in each state: For households with 2 or more adults:
MOYSwOadultsscreened
males ∑>
=
1
2ˆ and WOYSwO
adultsscreened
females ∑>
=
1
2ˆ
For households with a single adult:
OYSwO
adultsscreened
gle ∑=
=
1
2sinˆ , where OYS=1 if the adult eats oysters and 0 otherwise.
18+ Adults Percentage
oyster eatersTexas 15878347 16.2%California 26064483 16.3%Florida 13094945 19.5%Louisiana 3318779 19.8%

2004 Raw Oyster Consumer Follow-up Survey: 2004 —Technical Report 16
Interview Adjustment For each state, the interview adjustment is calculated by ratio adjusting the weighted interview sample to the estimates oyster eating population: For households with 2 or more adults:
∑>
=
1
2
ˆ
adultsmales
malesmales w
Oadji and ∑
>
=
1
2
ˆ
adultsfemales
femalesfemales w
Oadji
For households with a single adult:
∑=
=
12
sinsin
ˆ
adults
glegle w
Oadji
We calculate the final weight (FINWT) as FINWT=w2×adjimales for interviewed males in households with 2 or more adults, FINWT=w2×adjifemales for interviewed females in households with 2 or more adults, and FINWT=w2×adjisingle for interviews in households with a single adult.
IX. THE FINAL DELIVERABLES Upon project completion, ORC Macro provided ISSC with the following deliverables:
• Combined report describing methods and findings (this document) • Codebook in text format • Data for all completed interviews in SAS format • File of verbatim responses in text format

2004 Raw Oyster Consumer Follow-up Survey: 2004 —Technical Report 17
X. RESPONSE RATES
Response rates provide a measure of interviewing success. There are a number of ways to calculate survey response rates. ORC Macro applied the response rate formulas used by the CDC for the 2004 BRFSS studies. Response rate formulas and calculations can be found in Appendix F: Response Rate Formulas. Overall response rates are presented in Table 1 and by state in Table 2.
Table 1. Response Rates CASRO 47.63% Overall 29.19% Cooperation 89.86% Table 2. State Response Rates
CASRO 43.37% Overall 26.22% CA Cooperation 88.42%
CASRO 44.93% Overall 26.73% FL Cooperation 91.45%
CASRO 52.94% Overall 33.57% LA Cooperation 90.02%
CASRO 50.18% Overall 31.47% TX Cooperation 89.59%

2004 Raw Oyster Consumer Follow-up Survey: 2004 —Technical Report 18
SURVEY RESULTS
I. INTRODUCTION
This report presents the results for the 2004 Raw Oyster Consumer Survey. The 2004 Raw Oyster Consumer Survey was conducted to assess the awareness, attitudes, and procedures—related to oyster consumption - within California, Florida, Louisiana and Texas, in order to monitor raw-oyster consumption patterns and risk awareness in selected US coastal regions. General findings, using the weighted data, are presented in the following section. For more detailed results for each question, please refer to Appendix E.
II. WHO EATS RAW OYSTERS Overall
The estimated percentage of households with at least one oyster eater is broken out by state in the table below. To calculate the prevalence, we only looked at households that went through the oyster-eating screening process. California, Southern California and Texas have a little less than a quarter of households with at least one raw oyster eater, and Florida and Louisiana both report an estimated 27% of households to have at lest one raw oyster eater.
Age
The average age for an oyster eater in all four states that were surveyed was 43 years old, and the median age was 41 years old. Compared to the data collected in 2002 by ISSC, the median age rose slightly from 40 years to 41 years. Looking at the individual states, Texas raw oyster eaters tended to be almost equal to the median age of 41; California and Southern California consumers were younger (38 years old); both Florida and Louisiana consumers were older (45 years and 46 years). Age by State State Mean Age in Years Median Age in YearsOverall 43 41 California 41 38 California-South 40 37
State Households w/ > 1 Raw Oyster Consumer (%)CA 23.90 CA-So. 24.00 FL 27.20 LA 27.30 TX 23.00

2004 Raw Oyster Consumer Follow-up Survey: 2004 —Technical Report 19
Florida 46 45 Louisiana 47 46 Texas 43 42
Race
As was done in 2002, race and ethnicity was measured separately so that they could be cross-analyzed. Respondents were asked which racial background best describes them: White, Black, Asian, Pacific Islander, American Indian, Alaska Native, or Other. The next question asked respondents if they were of Spanish or Hispanic origin. By asking the questions separately, we can then look at who identified themselves as being Black-Hispanic, White-Hispanic, Non-Hispanic, and so on. A majority (69%) of respondents self-identify as White; and less than 10% identify as being African American (7%), Asian/Pacific Islander (5%) , American Indian/Alaska Native (2%). These numbers are only slightly different then what was reported by the ISSC in 2002. The number of White consumers was 6 percentage points less in 2004 (75% in 2002 to 69% in 2004). African-Americans reported a similar percentage, 7% in 2004 compared to 6% in 2002; and Asian consumers rose from 2% in 2002 to 5% in 2004. Race by State Race Overall
(%) CA (%)
CA-South (%)
FL (%)
LA (%)
TX (%)
White 69.40 59.61 56.22 81.79 86.12 69.31 Black 6.75 6.28 5.26 8.47 10.03 5.03 Asian/Pacific Island Consumers
4.95 8.84 9.52 1.46 1.04 3.25
American Indian/Alaska Native Consumers
1.74 1.74 2.27 1.43 0.58 2.35
Other 16.89 23.54 26.72 6.86 2.22 20.08
Ethnicity
The question after “Race” asks respondents “Are you of Spanish or Hispanic origin?” Nearly a quarter (24%) of respondents from the four surveyed states identified themselves as being of Spanish or Hispanic Origin. Almost one out three respondents from California (31%) and Texas (29%) and approximately one out of ten respondents from Florida (13%) and Louisiana (9%) reported that they were of Spanish or Hispanic origin. The table below shows the percentage of respondents within each racial group who also identified with being of Spanish or Hispanic origin. Hispanic Ethnicity by Race

2004 Raw Oyster Consumer Follow-up Survey: 2004 —Technical Report 20
Sex
Overall, the majority of oyster consumers were males (56%) This percentage is down slightly from 2002, which reported male oyster consumers to make up 60% of overall consumers. All four states reported a majority of respondents to be males: California (57%), Florida (55%), Louisiana (52%) and Texas (58%). This table shows the breakdown of gender by race. Gender distribution by Race
High Risk Respondents
Out of all the respondents surveyed, 13.83% were part of one of the three “at risk” groups: liver disease, diabetes, or weakened immunity. This table shows how many oyster consumers were considered “at risk” versus the U.S. “At risk” population. Oyster Consumers and U.S. Population with Health-Related Risk. Risk Factor Oyster Consumers (%) U.S. Population (%)Liver Disease 3.72 10.00* Diabetes 5.89 18.20** Weak Immunity 5.61 N/A
*American Liver Association **American Diabetes Association
Race Hispanic (%) Non-Hispanic (%)White 9.79 90.22 African American 8.61 91.39 Asian/Pacific Islander 8.18 91.82 American Indian/Alaska Native 37.09 62.91 Other 85.94 14.06
Race Males (%) Females (%)OVERALL 56.28 43.72 White 57.29 42.71 African American 52.92 47.08 Asian/Pacific Islander 48.34 51.66 American Indian/Alaska Native 64.50 35.50 Other 57.48 42.52 Hispanic 59.28 40.72

2004 Raw Oyster Consumer Follow-up Survey: 2004 —Technical Report 21
3.7% of respondents had been told by a doctor that they had liver disease, which is well below the U.S. population average of 10%. The percentage decreased slightly from 4.3% in 2002 to 3.7% in 2004. Overall, 5.9% of respondents reported that a doctor had told them they had diabetes. This percentage declined slightly from 6.6% in 2002 to 5.9% in 2004. Nationally, the prevalence of diabetes increased significantly from 6.2% in 2002 to 18.2% in 2004. Despite the national increase, the percent of oyster consumers with diabetes decreased in the four targeted states. 5.6% of respondents had been told by a doctor that they had weak immunity. In the 2004 survey, “weak immunity” was defined as transplant recipients, cancer patients undergoing treatment, and those with a disease affecting the immune system such as HIV/AIDS, lupus, and sickle cell anemia. This percentage increased slightly from 4% in 2002. A single national average does not exist because this definition consists of many different, but sometimes overlapping, groups.
III. CONSUMPTION PATTERNS Recent Consumption
Overall, a majority (68%) of respondents reported that they have eaten raw oysters in the past 12 months. This percentage is down from the three-quarters of respondents reported in 2002. Males reported eating oysters in the past 12 months slightly more than females (69% vs. 67% respectively). More than half (60%) of “at-risk” consumers reported that they had consumed raw oysters within the past 12 months.
Oyster Consumption in Past 12 Months Among Gender and Risk groups.
Frequency
Overall, respondents consumed raw oysters 6 times in the past 12 months. This frequency is the same average stated in 2002. High-risk consumers, however consumed raw oysters much less in 2004 (an average of 7 times) than compared to 2002 (an average of 10 times). The table below outlines the average consumption rate by state.
Oyster-Eating Occasions by State and Risk Group State/Risk Average Annual Number CA 6.20 FL 6.35
Gender/Risk Yes Consumed (%) No Did Not Consume (%)Male 69.29 30.71 Female 66.79 33.21 At Risk 60.49 39.51
2004 Raw Oyster Consumer Follow-up Survey: 2004 —Technical Report 22
LA 7.15 TX 5.66 At Risk 6.95
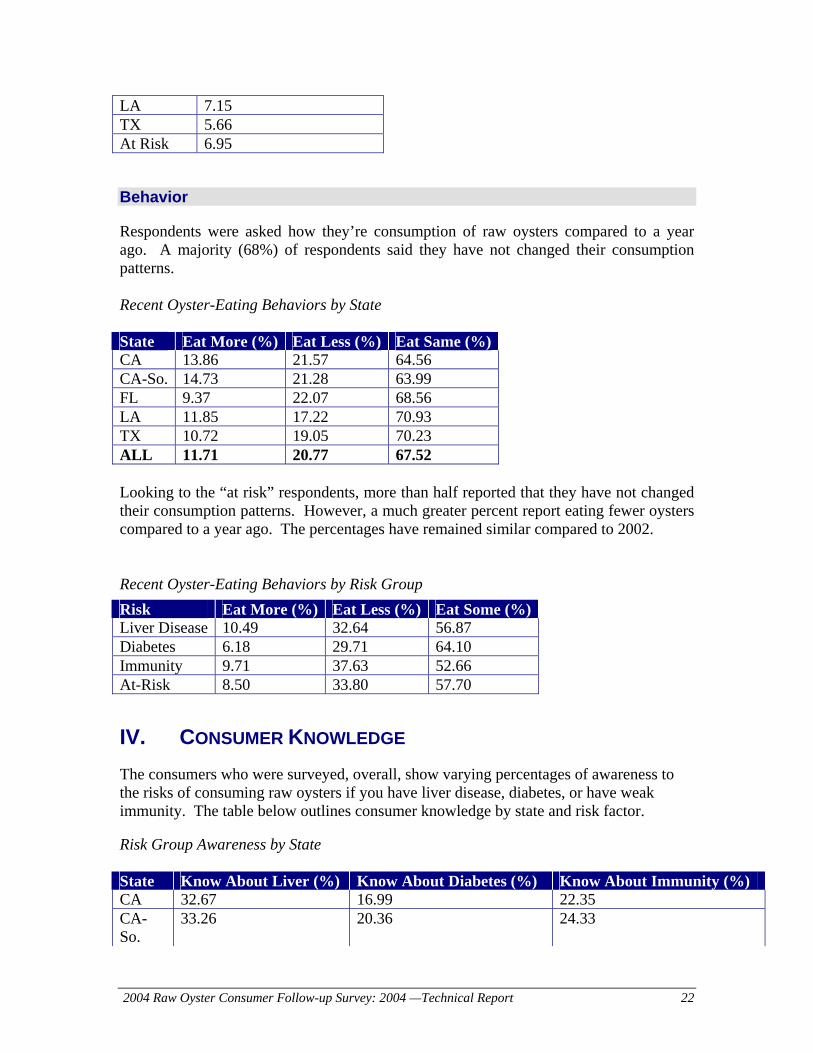
Behavior
Respondents were asked how they’re consumption of raw oysters compared to a year ago. A majority (68%) of respondents said they have not changed their consumption patterns. Recent Oyster-Eating Behaviors by State State Eat More (%) Eat Less (%) Eat Same (%)CA 13.86 21.57 64.56 CA-So. 14.73 21.28 63.99 FL 9.37 22.07 68.56 LA 11.85 17.22 70.93 TX 10.72 19.05 70.23 ALL 11.71 20.77 67.52 Looking to the “at risk” respondents, more than half reported that they have not changed their consumption patterns. However, a much greater percent report eating fewer oysters compared to a year ago. The percentages have remained similar compared to 2002. Recent Oyster-Eating Behaviors by Risk Group
IV. CONSUMER KNOWLEDGE The consumers who were surveyed, overall, show varying percentages of awareness to the risks of consuming raw oysters if you have liver disease, diabetes, or have weak immunity. The table below outlines consumer knowledge by state and risk factor. Risk Group Awareness by State State Know About Liver (%) Know About Diabetes (%) Know About Immunity (%) CA 32.67 16.99 22.35 CA-So.
33.26 20.36 24.33
Risk Eat More (%) Eat Less (%) Eat Some (%)Liver Disease 10.49 32.64 56.87 Diabetes 6.18 29.71 64.10 Immunity 9.71 37.63 52.66 At-Risk 8.50 33.80 57.70

2004 Raw Oyster Consumer Follow-up Survey: 2004 —Technical Report 23
FL 55.20 24.27 44.31 LA 62.75 26.70 47.83 TX 43.01 16.01 28.30
Liver Disease
Just under half (43%) of respondents had heard that people with liver disease may get extremely ill from eating raw oysters. This percent has fallen since 2002, when it was reported that half of the consumers who were surveyed knew that people with liver disease should not consume raw oysters. Awareness varied among race, ethnic and age agroups. Peoapl of Hispanic ethnicity tended to have the least awareness (52%); as did the youngest age group (31%). Awareness around Live Disease by Race/Ethnicity/Age Groups Race Know (%) Did Not Know (%)White 47.88 52.12 African American 41.08 58.92 Asian/Pacific Islander 40.34 59.66 American Indian/Alaska Native 29.56 70.44 Other 28.06 71.94 Hispanic 32.33 67.67 Age Under 30 years old 31.31 68.69 30 - 44 years old 44.35 55.65 45 - 64 years old 46.95 53.05 65 years old or older 48.26 51.74 The level of liver disease-related awareness varied by state. California and Southern CA had the lowest level of awareness (33% each). Louisiana respondents had the highest degree of awareness (63%); Texas and Florida were slightly lower at 43% and 55% respectively. Florida and Louisiana still remain more aware compared to Texas and California, but these percentages also have fallen when compared to 2002 data.
Diabetes
A strong majority of respondents (81%) said they had not heard that people with diabetes could become extremely ill from eating raw oysters. This percentage is identical to that collected in 2002, suggesting that awareness has not increased, but has remained static for the past 2 years. Overall, one-fifth (19%) of consumers said they had heard that people with diabetes could become extremely ill from eating raw oysters. Diabetes-related awareness was highest in African-American (25%) respondents and lowest among Hispanics (18%).

2004 Raw Oyster Consumer Follow-up Survey: 2004 —Technical Report 24
Diabetes-Related Awareness by Race and Age Race Know (%) Did Not Know (%)White 18.54 81.46 African American 24.81 75.19 Asian/Pacific Islander 23.22 76.78 American Indian/Alaska Native 18.49 81.51 Other 19.75 80.25 Hispanic 17.93 82.07 Age Under 30 years old 16.42 83.58 30 - 44 years old 21.87 78.13 45 - 64 years old 17.95 82.05 65 years old or older 18.83 81.17
Weak Immunity
Overall, just over two-thirds of respondents (69%) said they had not heard that people with weakened immune systems could become extremely ill from eating raw oysters. This is consistent with the data collected in 2002. Immunity-related awareness varied by race and age. Asian/Pacific Islanders were the most aware (36%) of the risks to people with weak immune systems, while American Indian/Alaska Natives were least aware (15%). The 30-44 year olds were most aware (35%) and the youngest respondents were less aware (23%). Weak-Immunity Related Awareness by Race and Age Race Know (%) Did Not Know (%)White 34.44 65.56 African American 28.56 71.44 Asian/Pacific Islander 35.87 64.13 American Indian/Alaska Native 14.92 85.08 Other 20.91 79.09 Hispanic 21.53 78.47 Age Under 30 years old 22.79 77.21 30 - 44 years old 34.86 65.14 45 - 64 years old 33.28 66.72 65 years old or older 31.13 68.87
Media Type
Respondents were asked where they heard at-risk people should not eat oysters. This question allowed respondents to pick more than one response, meaning they could say

2004 Raw Oyster Consumer Follow-up Survey: 2004 —Technical Report 25
they heard that at risk people should not eat oysters at both their doctor’s office and on television. “Posted Notices” was the most common technique for respondents to learn about risk factors and eating raw oysters (44%), followed closely by “Television” (39%) and the “Newspaper” (39%). In 2002, the “Newspaper” ranked highest at 54%, which is much higher than the 39% reported in 2004. Media Source for At-Risk Messages
The way respondents learned about risks associated with eating oysters differed by state. In Southern California, most people reported learning from “Posted Notice” (51%). This was the most common source for Florida as well (58%), followed closely by “Newspaper” (48%). Posted Notices worked well in Louisiana (47%), but were nearly matched by “Newspaper (48%) and “television” (48%). Texas, however was very different. Awareness was lower in Texas and the predominant media sources were “television” and “magazines”, each reported by 42% of respondents. Media Source for At-Risk Messages by State Media State CA (%) CA-So. (%) FL (%) LA (%) TX (%)Television 32.24 35.34 44.63 47.59 42.38 Radio 16.85 19.76 16.07 19.14 19.76 Newspaper 30.80 38.46 47.80 48.33 38.40 Magazine 34.08 33.02 33.13 27.21 41.95 Doctor 26.69 30.21 22.14 23.03 25.50 Posted Notice 42.02 51.49 49.86 47.40 37.66 At-risk respondents reported “Television” as their primary source of information on the risk factors of eating raw oysters. “Posted notices” were less noticed by at-risk respondents. However, as expected, “Doctors” were more frequently cited as a source of information for those at-risk than those not at-risk (37% vs. 22%). The percent dropped slightly from 39% in 2002 to 37% in 2004. Media Source for At-Risk Messages by Risk Group Media At-Risk (%) Not-at-Risk (%)Television 42.73 39.70 Posted Notice 40.83 44.58 Newspaper 38.81 39.89 Doctor 36.64 22.35 Magazine 36.40 34.79
Media % Posted Notice 43.99 Television 39.44 Newspaper 38.94 Magazine 34.70 Doctor 24.49 Radio 17.35

2004 Raw Oyster Consumer Follow-up Survey: 2004 —Technical Report 26
Radio 15.97 17.78
Media Exposure
Of those respondents who said they heard or read that people with liver disease, diabetes, or weak immunity can get extremely ill from eating raw oysters, nearly half of respondents (40%) said they had heard or read the messages within the past six months. Slightly more respondents (43%) said that they heard or read the message more than a year ago. Looking to “at-risk” respondents, just over one-third (36%) had heard or read that people with liver disease, diabetes or weak immunity can get extremely ill from eating raw oysters within the past six months. Timing of At-Risk Message GROUP 6 months or less (%) 7 months to 1 year (%) More than a year (%)OVERALL 40.45 16.20 43.35 At-Risk 35.71 22.55 41.75
V. RISK REDUCTION No Recent Consumption
One-third of respondents (34%) reported that they had not eaten raw oysters within the past 12 months. California and Texas reported nearly identical non-consumption rates of raw oysters in the past 12 months, (34% and 35%) and approximately one-quarter of respondents from Southern California (30%), Louisiana (24%) and Florida (27%) reported to have eaten raw oysters within the past 12 months.
Recent Consumption by State
Reduced Consumption
Of those respondents who reported eating raw oysters, approximately one-fifth (21%) say they eat raw oysters less often than a year ago. More women than men reported eating fewer oysters in the past year (women 23%; men 19%). There were no discernable state-related differences in reduced oyster consumption. Older age groups seemed to report less oyster-eating than their younger counterparts.
State Consumed (%) Not Consumed (%)California 65.85 34.15 Southern California 70.05 29.95 Florida 72.60 27.40 Louisiana 76.26 23.74 Texas 65.41 34.59

2004 Raw Oyster Consumer Follow-up Survey: 2004 —Technical Report 27
Recent Oyster Consumption by Age
The primary reason that people said they ate less raw oysters than the past year was “Some other reason” (29%) followed by a tie between “Personal health concerns” (23%) and “Availability” (23%). In 2002, the main reason was “personal health concerns” (48%).
Risk Reduction Methods
When respondents were asked what steps they had taken to reduce the health risks related to eating raw oysters, “None/I have done nothing” (46%) was the highest method followed by “Other” (17%) and “Choose restaurants carefully” (10%). Looking at 2002 data, 42% of raw oyster consumers were doing “nothing” to reduce their risk of eating raw oysters. One percent reported that they “don’t eat them/stopped eating raw oysters” as the method they use to reduce the health risks related to eating raw oysters. Method to Reduce Risk Response % Avoid/eat fewer oysters in Summer months 3.86 Avoid/eat fewer oysters in months without an “R” 2.75 Avoid oysters from polluted waters/places with recent outbreaks 1.76 Choose retail markets carefully 4.52 Choose restaurants carefully 9.99 Check the way oysters look or smell 7.41 Buy only oysters with closed shell 1.14 Eat oysters with Tabasco sauce 7.24 Eat oysters while drinking alcoholic beverage 6.01 Don’t eat them/stopped eating raw oysters 1.03 Cook them 3.82 Eat less often 1.78 Other 16.99 None/I have done nothing 45.52
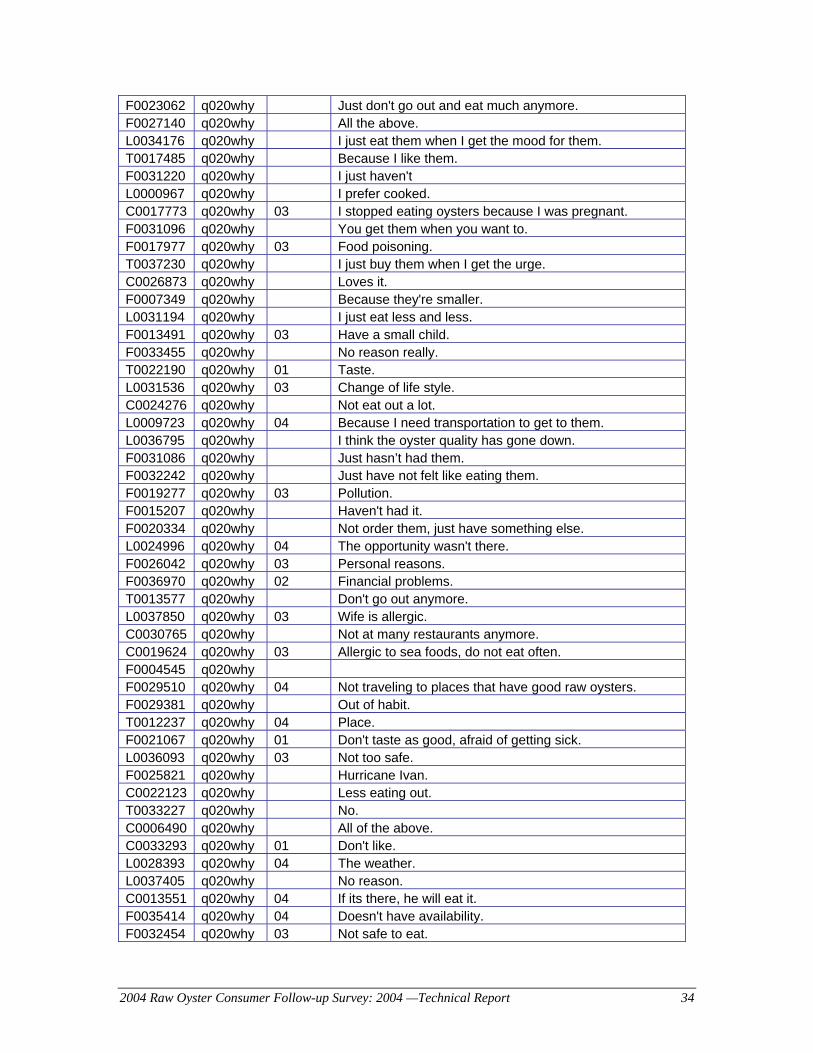
A listing of the “Other” responses to question 42 is included in Appendix C: Open-End Responses.
Age More often than before (%) Less often than before (%) About the same (%) Under 30 years old
18.30 20.39 61.32
30 - 44 years old 11.83 17.89 70.28 45 - 64 years old 9.03 23.92 67.05 65 years old or older
5.25 23.09 71.66

2004 Raw Oyster Consumer Follow-up Survey: 2004 —Technical Report 28
AAPPPPEENNDDIIXX AA:: FFIINNAALL DDIISSPPOOSSIITTIIOONN TTAABBLLEE

2004 Raw Oyster Consumer Follow-up Survey: 2004 —Technical Report 29
All response rates in the appendix are calculated based on the numbers in the table below.
Disposition Code Disposition Description Frequency % 110 Complete 2006 3.13 120 Partial Complete 0 0.00 210 Termination within questionnaire 44 0.07 220 Refused after respondent selection 169 0.26 230 Selected respondent never reached or never started 185 0.29 240 Selected respondent away from residence during
entire interviewing period 251 0.39
250 Language problem after respondent selection 28 0.04
260 Selected respondent physically or mentally unable to
complete an interview during entire interviewing period
1 0.00
305 Household unavailable in time period. 10 0.02 320 Language barrier before selection 1155 1.80 325 Impairment before selection 95 0.15 330 Refused, indefinite private residence 10770 16.79 332 Postponed, indefinite private residence 1434 2.23 335 Telephone answering device, message confirms
private residential status 3096 4.82
340 Telecommunication technological barrier, message confirms private residential status
93 0.14
345 Telephone answering device, not sure if private residence
33 0.05
350 Telecommunication technological barrier, not sure if private residence
179 0.28
355 Telephone number is no longer in service or has been changed
2145 3.34
360 No answer 4175 6.51 365 Busy 372 0.58 410 Household, no eligible respondent 425 0.66 415 No oyster eater 6945 10.82 420 Not a private residence 5317 8.29 430 Dedicated fax/data/modem line with no human
contact, or fast busy 2610 4.07
440 Fast Busy 346 0.54 450 Non-working number/disconnected number 22,282 34.73
TOTAL 64,166 100.00
2004 Raw Oyster Consumer Follow-up Survey: 2004 —Technical Report 30
AAPPPPEENNDDIIXX BB:: RREESSPPOONNSSEE RRAATTEE FFOORRMMUULLAASS

2004 Raw Oyster Consumer Follow-up Survey: 2004 —Technical Report 31
CASRO Response Rate
Completes = Completed or Partially Completed Interviews Completes = (110 + 120 + (210 * .32)) Completes = (2006 + 0 + (44* .32) = 2,020.08 Eligible = (110 + 120 + 210 + 220 + 230 + 240 + 250 + 260 + 270 + 280) Eligible = (2006 + 0 + 44 + 169 + 185 + 251 + 28 + 1+ 0 + 0) = 2,684 Ineligible = All respondents with known eligibility status categorized as ineligible Ineligible = (405 + 410 + 415 + 420 + 430 + 440 + 450) Ineligible = (0 + 425 + 5317 + 2610 + 346 + 22,282 + 6945) = 37,925 Unknown = All respondents with unknown eligibility status Unknown = (305 + 310 + 315 + 320 + 325 + 330 + 332 + 335 + 340 + 345 + 350 + 355 + 360 + 365 + 370) Unknown = (10 + 0 + 0 +1155 + 95 + 10770 + 1434 + 3096 + 93 + 33 + 179 + 2145 + 4175 + 372 + 0) = 23,557 UNKNDNOM = Unknown respondents added to the denominator UNKNDNOM = (Eligible/(Eligible + Ineligible)) * Unknown UNKNDNOM = (2684/(2684 + 37925)) * 23557 = 1556.97 CASRO = (Completes / (Eligible + UNKNDNOM)) CASRO = (2,020.08 / 4240.97 = 47.6325%
Overall Response Rate
Completes = Completed or Partially Completed Interviews Completes = (110 + 120 + (210 * .32)) Completes = (2006 + 0 + (44 * .32) = 2,020.08 Break-offs and Refusals = ((210 * .68) + 220) Break-offs and Refusals = ((44 * .32) + 169) = 198.92 Known Households = (230 + 240 + 250 + 260 + 335) Known Households = (185 + 251 + 28 + 1 + 0 + 0 + 10 + 0 + 3096) = 3,571 Ineligible Households = 410 + 415 Ineligible Households = (425 + 6945) = 7370 All Likely Households = (345 + 350 + 320 + 325 + 330 + 332 + 340 + 370 + 355) All Likely Households = (33 + 179 + 1155 + 95 + 10770 + 1434 + 93 + 0 + 2145) =
15,904

2004 Raw Oyster Consumer Follow-up Survey: 2004 —Technical Report 32
Households = (Known Households + Ineligible Households + Completes +Break-offs and Refusals + (.90 * All Likely Households)) Households = (3571 + 7370 + 2020.08 + 198.92 + (.90 * 15,904) = 27,473.60 Eligible Households = (.2519 * Households) Eligible Households = (.2519 * 27,473.60) = 6920.60 Overall Response Rate = (Completes / Eligible Households) Overall Response Rate= (2,020.08 /6,920.60) = 29.19%
Cooperation Rate
Completes = Completed or Partially Completed Interviews Completes = (110 + 120 + (210 * .32)) Completes = (2006 + 0 + (44 * .32) = 2,020.08 Break-offs and Refusals = ((210 * .68) + 220) Break-offs and Refusals = ((44 * .68) + 169) = 198.92 Cooperation Rate = (Completes / (Completes + Break-offs and Refusals + 250 + 260)) Cooperation Rate = (2,020.08 / (2,020.08 + 198.92 + 28 + 1) = 89.86%
2004 Raw Oyster Consumer Follow-up Survey: 2004 —Technical Report 33
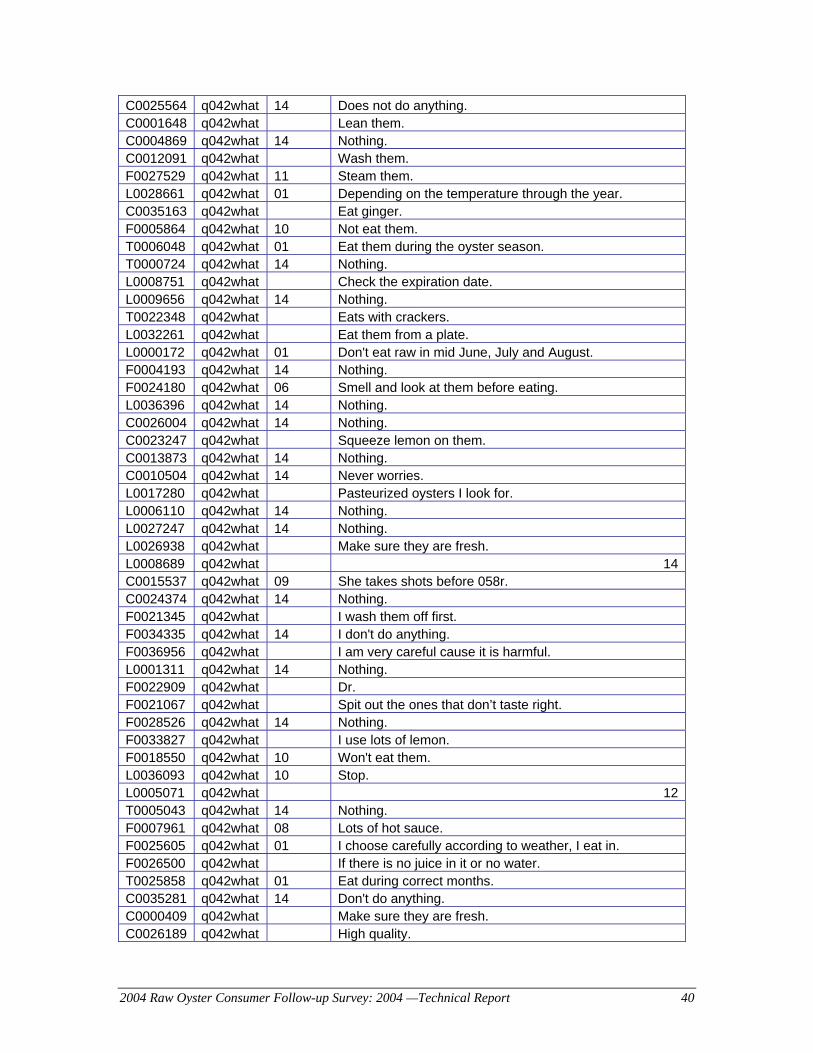
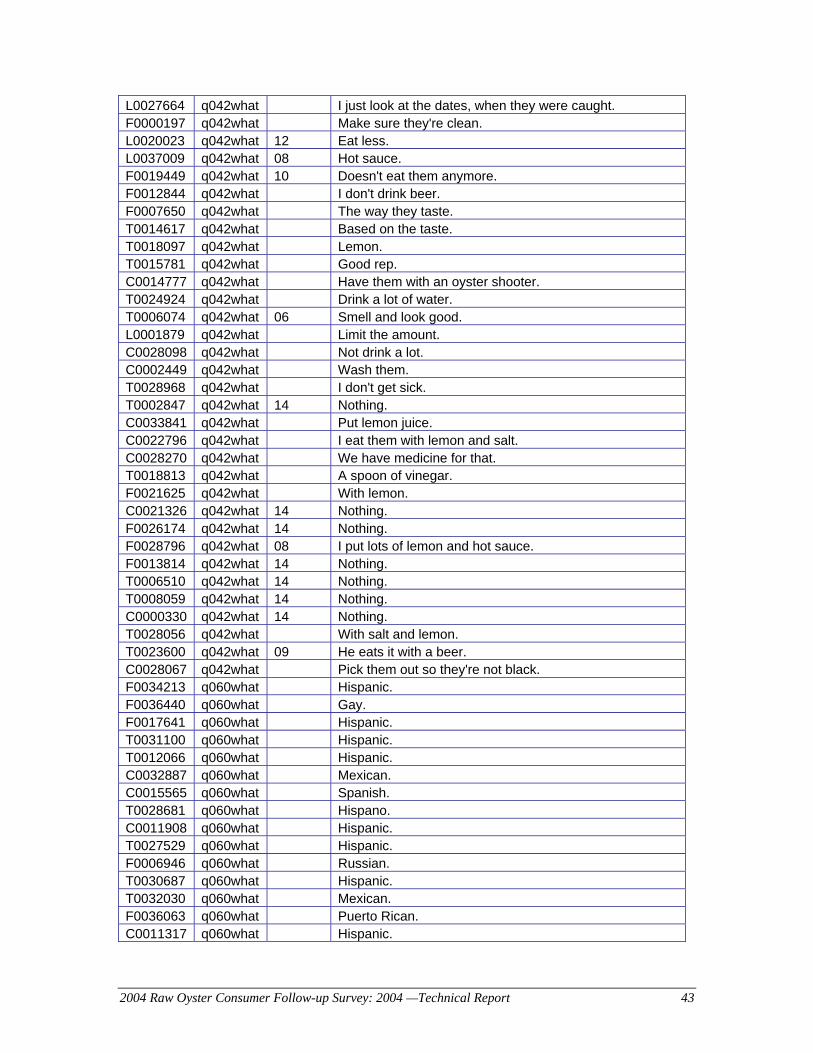
AAPPPPEENNDDIIXX CC:: OOPPEENN--EENNDD RREESSPPOONNSSEESS
2004 Raw Oyster Consumer Follow-up Survey: 2004 —Technical Report 34
F0023062 q020why Just don't go out and eat much anymore. F0027140 q020why All the above. L0034176 q020why I just eat them when I get the mood for them. T0017485 q020why Because I like them. F0031220 q020why I just haven't L0000967 q020why I prefer cooked. C0017773 q020why 03 I stopped eating oysters because I was pregnant. F0031096 q020why You get them when you want to. F0017977 q020why 03 Food poisoning. T0037230 q020why I just buy them when I get the urge. C0026873 q020why Loves it. F0007349 q020why Because they're smaller. L0031194 q020why I just eat less and less. F0013491 q020why 03 Have a small child. F0033455 q020why No reason really. T0022190 q020why 01 Taste. L0031536 q020why 03 Change of life style. C0024276 q020why Not eat out a lot. L0009723 q020why 04 Because I need transportation to get to them. L0036795 q020why I think the oyster quality has gone down. F0031086 q020why Just hasn’t had them. F0032242 q020why Just have not felt like eating them. F0019277 q020why 03 Pollution. F0015207 q020why Haven't had it. F0020334 q020why Not order them, just have something else. L0024996 q020why 04 The opportunity wasn't there. F0026042 q020why 03 Personal reasons. F0036970 q020why 02 Financial problems. T0013577 q020why Don't go out anymore. L0037850 q020why 03 Wife is allergic. C0030765 q020why Not at many restaurants anymore. C0019624 q020why 03 Allergic to sea foods, do not eat often. F0004545 q020why F0029510 q020why 04 Not traveling to places that have good raw oysters. F0029381 q020why Out of habit. T0012237 q020why 04 Place. F0021067 q020why 01 Don't taste as good, afraid of getting sick. L0036093 q020why 03 Not too safe. F0025821 q020why Hurricane Ivan. C0022123 q020why Less eating out. T0033227 q020why No. C0006490 q020why All of the above. C0033293 q020why 01 Don't like. L0028393 q020why 04 The weather. L0037405 q020why No reason. C0013551 q020why 04 If its there, he will eat it. F0035414 q020why 04 Doesn't have availability. F0032454 q020why 03 Not safe to eat.
2004 Raw Oyster Consumer Follow-up Survey: 2004 —Technical Report 35
C0016474 q020why Because I was in San Francisco and had a raw oyster. T0008024 q020why Don't go out as often. F0024508 q020why 03 Health reasons. F0031248 q020why Roasted. C0035811 q020why 01 Not as good as in Australia. C0030671 q020why Dinner. F0008170 q020why 04 Only supposed to eat at certain times. C0000168 q020why Cranins. L0025495 q020why Just hadn't. F0009572 q020why 04 Don't get a chance to eat them. T0026990 q020why Don’t go to restaurant lately. L0029957 q020why 03 Pregnant. T0036613 q020why I just don’t go to restaurants. T0025023 q020why 04 Opportunity. C0005180 q020why 03 I had a bad experience. T0002641 q020why I just don’t want to eat it. L0019087 q020why Not priority. F0017055 q020why 03 Health scare in the news. C0000740 q020why He has to have a taste for them. L0030668 q020why 04 I eat at a certain time of the year. T0005333 q020why 03 Because of all the things you hear about them. F0009537 q020why Haven't been out to eat oysters. T0029903 q020why Because we don't go to restaurants. L0012033 q020why Because we don't go out as much. T0012051 q020why Because I don't go out to dinner as much. C0031096 q020why To busy on his job. C0005985 q020why Being lazy. F0018567 q020why Bad advertisement. C0013055 q020why 03 I just had a baby. F0018626 q020why I don't frequently go out to eat Oysters. F0001454 q020why Vacation got cut short. T0008733 q020why I don't know how to prepare for it. L0003539 q020why 03 Media notification. L0014754 q020why We just do it very often. F0027131 q020why 04 When opportunity comes up. C0026462 q020why 03 Pregnancy. C0006917 q020why 04 Availability. C0024431 q020why I don’t go on vacation that often. F0005388 q408wher 04 Medical journal. F0012232 q408wher 05 I work in a pharmacy. L0035353 q408wher The internet. C0017330 q408wher 04 Professional Magazine. L0026693 q408wher 03 Newspaper articles. L0009365 q408wher Micro Biologist. T0010864 q408wher The internet. T0003574 q408wher A college textbook. C0037333 q408wher 07 Friends and (a/e)n. F0006946 q408wher 07 Work.

2004 Raw Oyster Consumer Follow-up Survey: 2004 —Technical Report 36
F0026515 q408wher 05 FDA, International Shellfish Commission. C0010634 q408wher 05 My sister and my doctor. F0033228 q408wher In undergraduate school biology class. F0015782 q408wher Someone in contact with oyster research. L0017936 q408wher 07 Word of mouth. T0000872 q408wher Internet. L0027117 q408wher 04 In a magazine. T0027811 q408wher Internet. T0014722 q408wher Internet. C0023385 q408wher Internet. C0002413 q408wher His own info. C0029777 q408wher Psychic. L0014533 q408wher Textbook. L0014743 q408wher 06 On menus. T0009902 q408wher My job. C0024064 q408wher Internet. L0005105 q408wher In the internet. L0008193 q408wher Internet. T0037563 q408wher 04 Local magazine, Golf Coast Conn. C0007116 q408wher 06 Owner of restaurant. F0016512 q408wher 04 Magazines. T0019601 q408wher 06 From the oyster capital of world Apalachicola. L0028259 q408wher At work. T0005517 q408wher Internet. L0034684 q408wher Don't ask me what. C0012091 q408wher San Francisco. C0009445 q408wher The internet. L0035751 q408wher In school. F0005864 q408wher 07 Other people. C0027747 q408wher Internet. T0007199 q408wher 99 N/a. L0023147 q408wher 07 Had a friend who had passed. L0017277 q408wher 07 Friends. L0033028 q408wher School. T0012444 q408wher Texas parks and wild life booklets. L0001289 q408wher The Department of Agriculture. C0009488 q408wher The American Red Cross. C0013732 q408wher Internet. F0027759 q408wher On the internet. F0030350 q408wher 06 On a container of oysters. F0024679 q408wher From people passing. L0011018 q408wher College. T0032855 q408wher Law suit. F0025273 q408wher On line. L0004221 q408wher 07 Fishermen. L0009108 q408wher 06 Labeling. C0035281 q408wher 07 Friend ate raw oyster and died. C0026077 q408wher 06 Store.

2004 Raw Oyster Consumer Follow-up Survey: 2004 —Technical Report 37
C0018977 q408wher 05 He is scientist, microbiologist reads all of this. C0000409 q408wher School. L0033283 q408wher 07 From customers in my restaurant. L0013670 q408wher 03 In a article. T0030560 q408wher Internet. T0013762 q408wher Internet. T0000982 q408wher 06 In oyster stores. F0000368 q408wher Fg. L0002655 q408wher 01 Television. C0030190 q408wher School. F0004943 q408wher People who ride the bus; she overhears. F0029578 q408wher Internet. T0012563 q408wher 01 On TV and friends. T0037558 q408wher From me. F0017854 q408wher Internet. F0007876 q408wher From traveling around the world. C0030361 q408wher 07 Friends from Europe. F0037728 q408wher In a warning. F0033994 q408wher From the internet. C0015279 q408wher 04 Journals and textbooks. C0010665 q408wher Books; alternative healing. C0033049 q408wher Statements. T0024948 q408wher Internet. C0029658 q408wher Internet. L0023449 q408wher 06 The jar label. F0018929 q408wher Web, md.com. T0016143 q408wher 06 Right off the oyster boat. L0028242 q408wher Culinary school. C0003265 q408wher Internet. L0037918 q408wher 04 A magazine. T0031033 q408wher Posters. F0021871 q408wher Internet. L0011099 q408wher 06 Labels on cans or containers. F0027365 q408wher 06 A package of oysters that they come in. C0016300 q408wher I don't remember. L0036256 q408wher 07 A family member. F0018175 q408wher 07 Family. L0023286 q408wher 04 It is posted in Fishing Landing. L0031622 q408wher 05 Discuss with other physicians. C0006843 q408wher 07 Friend. T0002830 q408wher Internet. C0035476 q408wher 06 Fish market. T0015454 q408wher I can’t, but I think from a nutrients book. L0034795 q408wher Online. F0027270 q408wher 01 Television, Fisherman. L0005819 q408wher Me. F0011996 q408wher 04 Food magazines. C0033314 q408wher 05 Health class for his job.

2004 Raw Oyster Consumer Follow-up Survey: 2004 —Technical Report 38
C0034234 q408wher 07 Friends. L0001411 q408wher 07 People. T0013418 q408wher Don't know. F0018486 q408wher Internet. L0021164 q408wher 07 Friends.
F0020986 q408wher 07 Some guy I met and his father died from eating raw oysters.
L0022703 q408wher 07 Word of mouth. C0016153 q408wher Internet. C0010890 q408wher 06 Label on the can. C0005557 q408wher 06 Fish market. T0019551 q408wher 05 Health department. C0021287 q408wher From some brochures. T0018813 q408wher Internet. F0013220 q408wher Doesn't remember. T0031439 q408wher Companieros en el day care. T0023802 q408wher Internet. T0007819 q408wher Talks. F0007292 q408wher 07 Amigo. T0028128 q408wher Internet. F0028629 q042what Keep them on ice, if smell won't eat them. F0008970 q042what ++ F0012388 q042what 06 Look and smell them. F0004269 q042what 14 Nothing. L0035892 q042what 09 Drink cold beer. F0027140 q042what 06 Smell them. T0031100 q042what 14 Nothing. F0027457 q042what 14 Nothing. T0015396 q042what 05 Order from a restaurant. T0005634 q042what 14 Nothing. L0013280 q042what 14 Nothing. T0017485 q042what 14 I don't do anything. C0011908 q042what 14 Nothing. L0037735 q042what 09 Eat with beer. L0011700 q042what 14 Nothing. C0030889 q042what 14 Nothing. C0014080 q042what 09 Eat with vodka. T0012886 q042what 14 Nothing. F0001929 q042what 14 Nothing. F0014213 q042what 10 Haven't ate them. L0037417 q042what 10 Try not to eat raw oyster. F0014722 q042what Eats them where they come from. F0031220 q042what 14 Nothing. C0027019 q042what I put lemon and salt on them. L0000967 q042what 02 The months that end r. C0036161 q042what 06 Make sure they are fresh. C0022013 q042what 11 I cook them with water. L0025440 q042what 08 Louisiana hot sauce. F0031096 q042what 14 You don't do nothing.

2004 Raw Oyster Consumer Follow-up Survey: 2004 —Technical Report 39
T0022668 q042what I eat them all at once without saving them. T0001759 q042what 01 I eat during certain months of the year. T0005924 q042what 14 Nothing. T0037230 q042what I don't get sick eating them. C0025837 q042what 04 I go to a place that specializes in them. C0026873 q042what Put lime. L0031194 q042what Dip them in ketchup and horseradish. L0036732 q042what 08 Keep them chilled with cocktail sauce. L0035163 q042what I am not eating anything that’s given to me. F0025849 q042what 04 Make sure they come from a good place. F0031526 q042what Clean them. C0005978 q042what Lemon juice. C0037041 q042what Make sure they're cold and fresh. C0023964 q042what Make sure they are clean. C0029777 q042what C0015280 q042what 11 Cook them with lemon. L0002599 q042what 10 I don't eat very many. T0005202 q042what You check on the freshness. L0035614 q042what Firsh. L0002652 q042what They're usually pasteurized. L0031561 q042what 14 I don't do anything. L0018371 q042what 14 I do nothing. F0019719 q042what 14 Nothing. L0024712 q042what I don't drink. F0013886 q042what Clean them. F0030019 q042what 13F0031086 q042what 11 Heats them up a little bit so they're not cold. F0018147 q042what Refer to the state. L0033858 q042what 14 Nothing. F0025161 q042what 14 Nothing. L0033804 q042what 14 Nothing. F0002652 q042what Make sure they are fresh. C0022039 q042what 14 Nothing. L0030677 q042what Put in refrigerator at once. L0029707 q042what 04 Buy from fisherman and eat right away. L0033801 q042what 04 Make sure they are fresh and from good source. L0034604 q042what Puts lemon juice on them. F0035775 q042what Put in refrigerator at once. F0026413 q042what Eat cracker with them. T0007897 q042what 04 Only where they are farmed. L0001595 q042what 04 Check the source. F0011290 q042what Eat them with crackers. F0005093 q042what She takes a turn. T0019664 q042what 14 Nothing. L0028099 q042what Lime. L0027287 q042what 08 Hot sauce and ketchup. L0001122 q042what 14 Nothing. L0026214 q042what Never got sick off them.
2004 Raw Oyster Consumer Follow-up Survey: 2004 —Technical Report 40
C0025564 q042what 14 Does not do anything. C0001648 q042what Lean them. C0004869 q042what 14 Nothing. C0012091 q042what Wash them. F0027529 q042what 11 Steam them. L0028661 q042what 01 Depending on the temperature through the year. C0035163 q042what Eat ginger. F0005864 q042what 10 Not eat them. T0006048 q042what 01 Eat them during the oyster season. T0000724 q042what 14 Nothing. L0008751 q042what Check the expiration date. L0009656 q042what 14 Nothing. T0022348 q042what Eats with crackers. L0032261 q042what Eat them from a plate. L0000172 q042what 01 Don't eat raw in mid June, July and August. F0004193 q042what 14 Nothing. F0024180 q042what 06 Smell and look at them before eating. L0036396 q042what 14 Nothing. C0026004 q042what 14 Nothing. C0023247 q042what Squeeze lemon on them. C0013873 q042what 14 Nothing. C0010504 q042what 14 Never worries. L0017280 q042what Pasteurized oysters I look for. L0006110 q042what 14 Nothing. L0027247 q042what 14 Nothing. L0026938 q042what Make sure they are fresh. L0008689 q042what 14C0015537 q042what 09 She takes shots before 058r. C0024374 q042what 14 Nothing. F0021345 q042what I wash them off first. F0034335 q042what 14 I don't do anything. F0036956 q042what I am very careful cause it is harmful. L0001311 q042what 14 Nothing. F0022909 q042what Dr. F0021067 q042what Spit out the ones that don’t taste right. F0028526 q042what 14 Nothing. F0033827 q042what I use lots of lemon. F0018550 q042what 10 Won't eat them. L0036093 q042what 10 Stop. L0005071 q042what 12T0005043 q042what 14 Nothing. F0007961 q042what 08 Lots of hot sauce. F0025605 q042what 01 I choose carefully according to weather, I eat in. F0026500 q042what If there is no juice in it or no water. T0025858 q042what 01 Eat during correct months. C0035281 q042what 14 Don't do anything. C0000409 q042what Make sure they are fresh. C0026189 q042what High quality.

2004 Raw Oyster Consumer Follow-up Survey: 2004 —Technical Report 41
L0024606 q042what I go see my dr. L0013670 q042what Just eat them often. T0033227 q042what 03 Check where oysters were harvested. F0030761 q042what 14 I do nothing. L0003408 q042what 02 Only eat months with r in name. L0029727 q042what Make sure they're fresh. L0013945 q042what 14 Not a thing. L0031726 q042what I am not concerned about that. T0005439 q042what 12 Try not to eat as many oysters. F0026980 q042what Good color and stay on ice. C0006490 q042what 12 I don't eat too many of them. F0026688 q042what 01 Wait until winter time to eat them. F0018287 q042what Check shell if dirty. F0029578 q042what Eat a lot of limes or lemons with them. C0015983 q042what 05 I order them from good restaurants. T0010905 q042what I just have to trust the vendor. F0017854 q042what Clean them very well. C0014506 q042what Seasons depends in Mexico, in lemon salt. C0013551 q042what 14 Does nothing. F0021422 q042what 08 Tabasco sauce with lemon juice. T0008653 q042what 01 Only eat in winter times. C0031165 q042what Upset stomach smoke a joint. C0016474 q042what I never knew I’d get sick from eating them. T0029075 q042what All of the above. F0009680 q042what When I have a cold I won't eat them. L0025395 q042what I don’t eat them out of a can. C0030745 q042what Ranch dressing and salt. T0006114 q042what Take care where I buy them from. C0029074 q042what C0015387 q042what Never get sick. C0014794 q042what 14 Nothing. C0017370 q042what Lime juice. F0025982 q042what Eating farm oysters. C0019545 q042what Eat them fresh and use ice to eat. F0014494 q042what Call doctor or go to hospital. F0008170 q042what 14 None. C0014008 q042what Check if they look fresh. C0025643 q042what 09 Have with alcohol. F0009572 q042what 09 Drink alcohol. T0026990 q042what 14 Nothing. T0037512 q042what Rinse them off and put lemon sauce on it. L0037760 q042what 14 Nothing (ne)n. T0015219 q042what Make sure I know where they come from. F0021641 q042what I have them with crackers. C0008253 q042what Wash them real good. C0005180 q042what Alka-Seltzer acid. T0022879 q042what 03 Eat them from the gulf coast. T0011511 q042what 09 I drink beer.

2004 Raw Oyster Consumer Follow-up Survey: 2004 —Technical Report 42
T0013333 q042what I make sure they're cold. F0002740 q042what Don't know. T0006874 q042what Dump in horse radish. F0009029 q042what Drink a lot of water. C0033343 q042what Drain out the oil. F0026939 q042what Careful where I eat them. L0036256 q042what 02 Avoid during months without r. F0001476 q042what They're fresh and cold. C0017973 q042what Eat crackers with them. T0031677 q042what Put lemon and salt. F0003173 q042what He uses lemon. C0013602 q042what 14 Nothing. T0025888 q042what Wash them off. L0006161 q042what Just eat them. L0010035 q042what Just eat them. L0026341 q042what Swallow fast. T0000181 q042what I just don't over-eat them. T0030688 q042what Know where they are coming from. T0003401 q042what 13T0000809 q042what 05 Eat at a restaurant. L0034106 q042what Wash them good. L0019260 q042what I tasted it and spit it out. C0005548 q042what Wash my hands. T0015454 q042what Eat fresh ones. L0015665 q042what 14 Nothing. F0031683 q042what 01 Don't eat them during hot months. C0028714 q042what I don’t, I didn’t know they got you sick. T0022831 q042what Wash my hands. T0001494 q042what 14 Nothing. C0005450 q042what 14 Nothing. F0037426 q042what Seek medical help. T0000312 q042what 14 Nothing. L0021354 q042what Doesn't drink while eating them. T0006925 q042what 14L0031685 q042what 08 High levels of Tabasco. T0003735 q042what I eat them with crackers. F0024712 q042what 14 Nothing. F0011996 q042what 01 Get them during the season. L0031751 q042what 02 Eat in months that end with a r. T0011653 q042what Eat them with lemon. L0002312 q042what I use ketchup, pepper and horse radish. T0008733 q042what Make sure they are clean and fresh. T0023984 q042what Check the can for defects and reputable company. L0024763 q042what 12 Only eat one or two. T0034061 q042what 04 I ask if they were farm raised. F0025655 q042what I wash them and rinse them. L0012110 q042what Wash them. L0006693 q042what 12 I just don eat that many of them at 3 doz I cut.
2004 Raw Oyster Consumer Follow-up Survey: 2004 —Technical Report 43
L0027664 q042what I just look at the dates, when they were caught. F0000197 q042what Make sure they're clean. L0020023 q042what 12 Eat less. L0037009 q042what 08 Hot sauce. F0019449 q042what 10 Doesn't eat them anymore. F0012844 q042what I don't drink beer. F0007650 q042what The way they taste. T0014617 q042what Based on the taste. T0018097 q042what Lemon. T0015781 q042what Good rep. C0014777 q042what Have them with an oyster shooter. T0024924 q042what Drink a lot of water. T0006074 q042what 06 Smell and look good. L0001879 q042what Limit the amount. C0028098 q042what Not drink a lot. C0002449 q042what Wash them. T0028968 q042what I don't get sick. T0002847 q042what 14 Nothing. C0033841 q042what Put lemon juice. C0022796 q042what I eat them with lemon and salt. C0028270 q042what We have medicine for that. T0018813 q042what A spoon of vinegar. F0021625 q042what With lemon. C0021326 q042what 14 Nothing. F0026174 q042what 14 Nothing. F0028796 q042what 08 I put lots of lemon and hot sauce. F0013814 q042what 14 Nothing. T0006510 q042what 14 Nothing. T0008059 q042what 14 Nothing. C0000330 q042what 14 Nothing. T0028056 q042what With salt and lemon. T0023600 q042what 09 He eats it with a beer. C0028067 q042what Pick them out so they're not black. F0034213 q060what Hispanic. F0036440 q060what Gay. F0017641 q060what Hispanic. T0031100 q060what Hispanic. T0012066 q060what Hispanic. C0032887 q060what Mexican. C0015565 q060what Spanish. T0028681 q060what Hispano. C0011908 q060what Hispanic. T0027529 q060what Hispanic. F0006946 q060what Russian. T0030687 q060what Hispanic. T0032030 q060what Mexican. F0036063 q060what Puerto Rican. C0011317 q060what Hispanic.

2004 Raw Oyster Consumer Follow-up Survey: 2004 —Technical Report 44
L0013265 q060what Dominican. F0031096 q060what 99 Refused. T0000497 q060what Hispanic. T0016830 q060what 2 African American. T0009729 q060what Hispanic. C0034955 q060what 1 Mexican/White. T0011922 q060what Hispanic. L0026691 q060what 2 Black/Spanish. T0013617 q060what Hispanic. C0005978 q060what Europe. T0004167 q060what Hispanic. C0016406 q060what French/Mexican. T0012872 q060what 99 Refused. T0006731 q060what Hispanic. C0015280 q060what Hispanic. T0003020 q060what Hispanic. T0028834 q060what Hispanic. T0001716 q060what Hispanic. C0032647 q060what Hispanic. C0007837 q060what 99 Can't tell me. C0034239 q060what Hispanic. T0034591 q060what Hispanic. F0025161 q060what 5 Chinese and Indian. F0002652 q060what Hispanic. F0021942 q060what Hispanic. T0022030 q060what Hispanic. C0036090 q060what Hispanic. T0018870 q060what Hispanic. C0026473 q060what Mexican. C0006841 q060what Hispanic(sp)Hispanic. L0016984 q060what Creole. T0010793 q060what Puerto Rico ,de la Cruz. T0017176 q060what Hispanic. T0000724 q060what Hispanic. C0034362 q060what Hispanic. F0012303 q060what Hispanic. F0036970 q060what Latin. T0013577 q060what Hispanic. L0036951 q060what American. L0030410 q060what 1 White Hispanic. C0014932 q060what Hispanic. T0015764 q060what Mexicano. C0006736 q060what Mexican. F0027585 q060what 1 White/American Indian. C0029381 q060what Mexicana. C0030646 q060what Spanish. C0011530 q060what Mexican. C0015537 q060what Mexican.

2004 Raw Oyster Consumer Follow-up Survey: 2004 —Technical Report 45
C0019624 q060what Hispanic/Latino. F0034335 q060what 2 Black/White/Asian. F0036956 q060what Spanish. F0008525 q060what Jamaican. F0024679 q060what 2 Black/Indian. F0017537 q060what 1 Hispanic/Black/White. F0033827 q060what Hispanic. L0035227 q060what Hispanic. T0001411 q060what 1 White/Hispanic/Native American. C0005612 q060what Hispanic. C0027085 q060what 4 Asian Pacific Islander. C0000391 q060what Mexican. C0023127 q060what 1 White/American Indian/Black. C0012706 q060what Hispanic. C0030117 q060what Hispanic. L0024606 q060what Hispanic. F0029130 q060what Mexicana. F0023984 q060what Caribbean. T0034316 q060what Hispanic. T0030699 q060what Hispanic. T0018855 q060what Hispanic. L0025794 q060what 4 American Asian. T0010755 q060what Hispanic. T0008206 q060what Puerto Rican. T0000982 q060what Mexican. T0010674 q060what Hispanic. C0013660 q060what Hispanic. C0000323 q060what Hispanic. C0012297 q060what Guatemalan. C0033293 q060what 99 Won't clarify. T0011555 q060what Hispanic. C0027080 q060what Hispanic. C0013765 q060what Middle easterner. F0004943 q060what Haba. T0012563 q060what Hispanic. C0005841 q060what Latino. C0010456 q060what Mexican. T0010905 q060what Mexican/American. C0005879 q060what Latino. C0026520 q060what Mexican. T0019464 q060what Hispanic/Mexican. F0018551 q060what Mexican. T0034814 q060what Hispanic. T0009805 q060what Mexican. C0037514 q060what Mexican. C0014506 q060what American. F0035414 q060what Latin. T0031011 q060what Hispanic.

2004 Raw Oyster Consumer Follow-up Survey: 2004 —Technical Report 46
T0019203 q060what Mexican. C0015042 q060what Hispanic. C0034882 q060what Mexican. C0016474 q060what 1 Native white. C0029306 q060what Hispanic. T0001504 q060what Hispanic. F0006261 q060what Hispanic. T0029075 q060what Polish T0008024 q060what Mexican. L0003734 q060what 1 White and Hispanic. C0017191 q060what Hispanic. C0020576 q060what Hispanic. C0017370 q060what Mexican. F0033994 q060what Hispanic. T0033395 q060what Hispanic. C0021974 q060what Hispanic. F0001937 q060what Polish. T0027594 q060what Hispanic. C0014008 q060what Hispanic. C0015533 q060what Hispanic. C0026389 q060what Hispanic. T0012344 q060what 5 Native American. T0034464 q060what Mexican. T0000129 q060what Hispanic. C0010421 q060what Chinese. T0032765 q060what Hispanic. C0008253 q060what Hispanic. T0035231 q060what 5 Irish and American Indian. T0002641 q060what Latin. T0004697 q060what Hispanic. T0006523 q060what Latino. T0011511 q060what Hispanic. T0015995 q060what Hispanic. F0021871 q060what Hispanic. T0032139 q060what Hispanic. C0015357 q060what North American. T0027927 q060what Hispanic. F0026275 q060what 99 Refused. C0002185 q060what Latino. C0005776 q060what Hispanic. T0011800 q060what Hispanic. T0020504 q060what Hispanic. C0023720 q060what Mexican American. F0004222 q060what Hispanic. T0027806 q060what Hispanic. C0028851 q060what Hispanic. C0035659 q060what Mexican. T0031677 q060what Hispanic.

2004 Raw Oyster Consumer Follow-up Survey: 2004 —Technical Report 47
F0003173 q060what Hispanic. F0012157 q060what British West Indian. T0001485 q060what Mexican. T0012051 q060what Hispanic. C0008036 q060what Latino. C0020397 q060what Latin. T0001012 q060what Mixed race. T0000181 q060what Hispanic. C0017020 q060what Latin. C0036372 q060what Middle Easterner. C0036531 q060what Hispanic. C0034898 q060what Latino. C0009352 q060what Hispanic. C0005548 q060what 5 American Indian Hispanic. L0023746 q060what Gumbol. L0027126 q060what Hispanic. C0014930 q060what Hispanic. C0028714 q060what Hispanic. T0007237 q060what Hispana. T0001494 q060what Latino. C0005855 q060what Hispanic. C0034150 q060what Latino. T0036540 q060what Hispanic. L0019034 q060what American. T0011653 q060what Honduras. L0002312 q060what French. L0032309 q060what 5 Indian/Spanish/Native American. T0032672 q060what Hispanic. T0027906 q060what Hispanic. C0017972 q060what Latina. T0032730 q060what Hispanic. C0035527 q060what French. C0015455 q060what Hispanic. C0018335 q060what Hispanic. T0033298 q060what Hispanic. C0013292 q060what Hispanic. C0029238 q060what Hispanic. T0032482 q060what Hispanic. T0001232 q060what Hispanic. C0018401 q060what Hispanic. C0014777 q060what Hispanic. T0024924 q060what Hispanic. C0029500 q060what Mexican/Irish C0026462 q060what Hispanic. C0028098 q060what Latin. C0005557 q060what Latino. T0034740 q060what Hispanic. T0006445 q060what Hispanic.

2004 Raw Oyster Consumer Follow-up Survey: 2004 —Technical Report 48
T0028164 q060what 1 White/Hispanic. C0016250 q060what 4 Hispanic/Native to the Pacific Islands. C0036014 q060what 1 White/Hispanic. C0008877 q060what Hispanic. L0035059 q060what Purple. C0016090 q060what American. C0003422 q060what Hispanic. T0002847 q060what Hispanic. C0012160 q060what Hispano (sp) Hispanic. F0023366 q060what Hispanic(sp) Hispanic. C0002792 q060what Hispanic(sp)Hispanic. T0012602 q060what Hispanic(sp) Hispanic T0031428 q060what Hispanic(sp)Hispanic. T0028236 q060what Hispanic(sp)Hispanic. T0028781 q060what Hispanic(sp)Hispanic. C0033171 q060what Hispanic(sp)Hispanic. C0000878 q060what Hispanic. T0023863 q060what American. C0033034 q060what Hispanic. C0019655 q060what Hispanic. C0022796 q060what Hispano y indio de Mexico. C0029506 q060what Latino. C0006658 q060what Hispanic(sp)Hispanic. T0028411 q060what Hispanic. T0024551 q060what Hispano. C0020444 q060what Hispanic(sp)Hispanic. C0007872 q060what Hispanic. C0030166 q060what Hispanic. C0014325 q060what Hispanic. F0011693 q060what Hispanic. T0018415 q060what Salvadorian. C0025710 q060what Mexicano. C0021326 q060what Hispanic. C0002069 q060what Hispanic. T0031391 q060what Mexicano. C0033043 q060what Mexicana. C0011729 q060what Hispanic(sp)Hispanic F0004236 q060what Hispanic(sp)Hispanic. T0032459 q060what Hispanic(sp)Hispanic. T0024610 q060what Hispanic(sp)Hispanic. C0031021 q060what Hispanic(sp)Hispanic. F0028796 q060what Hispanic. T0008023 q060what Latino. T0008059 q060what Hispanic. C0000330 q060what Hispanic. T0028056 q060what Hispanic. T0023800 q060what Mexican. T0023803 q060what Mexican.

2004 Raw Oyster Consumer Follow-up Survey: 2004 —Technical Report 49
T0031439 q060what Mexican. T0013971 q060what Latino. F0021128 q060what Mexican. C0018530 q060what Hispanic. C0014456 q060what Latino. T0031521 q060what Mexican. T0024609 q060what Mexican. T0005884 q060what Mexican. L0031585 q060what Latino. T0023600 q060what Mexican. F0028346 q060what Mexican. T0023802 q060what Hispanic. T0007819 q060what Latina. C0019590 q060what Hispanic. C0029320 q060what Hispanic. C0007667 q060what Hispanic. F0007292 q060what Hispanso. F0029154 q060what Hispanic. C0005154 q060what Hispanic. C0017598 q060what Hispanic. C0028067 q060what Hispanic. F0032986 q060what Hispanic. C0011877 q060what Mexican. T0021462 q060what Hispanic. C0024504 q060what Hispanic. T0028128 q060what Hispanic. C0020407 q060what Mexican/Hispanic. T0018174 q060what 1 White/Hispanic. C0005827 q060what Latina. C0024431 q060what Mexican/Hispanic. C0028971 q060what Hispanic/Latino.

2004 Raw Oyster Consumer Follow-up Survey: 2004 —Technical Report 50
AAPPPPEENNDDIIXX DD:: SSUURRVVEEYY

2004 Raw Oyster Consumer Follow-up Survey: 2004 —Technical Report 51
Raw Oyster Consumer Survey
Questionnaire
-------------------------------------------------------------------------------IntroQ -----------------------------------------------------------------------Hello, my name is <Your Name> calling on behalf of the Interstate Shellfish Sanitation Conference. We are conducting a food-related health survey in <STATE> and your participationis very important. This telephone number was chosen at random to be included for the short survey. To confirm, is this <repeat phone number >? 1. CORRECT NUMBER (GO TO PRIVRES) 2. NO ANSWER 3. NORMAL BUSY 4. ANSWERING MACHINE (LEAVE MESSAGE USE SCRIPT ON FOURTH ATTEMPT ONLY) 5. DO NOT WISH TO DIAL THIS NUMBER (NULL ATTEMPT) 6. NUMBER IS NOT THE SAME SHOW ANSWER MACHINE SCRIPT: Hello, my name is <Your Name> calling on behalf of the Interstate Shellfish Sanitation Conference. We are interviewing adults in <STATE> about food and health. I will call back in the next few days. Thank you. -------------------------------------------------------------------------------PrivRes ----------------------------------------------------------------------- Is this a private residence? 1. YES, CONTINUE – SKIP TO ADULTS 2. NO, NON-RESIDENTIAL -------------------------------------------------------------------------------NonRes - Only get this if PrivRes = 2 (Non-Residential) ----------------------------------------------------------------------- Thank you very much, but we are only interviewing private residences. STOP -------------------------------------------------------------------------------WrongNum - ONLY GET THIS IF INTROQ = 6 (NUMBER IS NOT THE SAME)

2004 Raw Oyster Consumer Follow-up Survey: 2004 —Technical Report 52
----------------------------------------------------------------------- Thank you very much, but I seem to have dialed the wrong number. It’s possible that your number may be called at a later time. Stop --------HHAGE EVERYONE GETS For this short survey, I need to speak to an adult in the household. What is your age? [IF RESPONDENT REFUSES, SAY: “Are you over 18 years of age?”; IF YES, CODE 888] __ __years old 888 Over 18 years old 777 Don’t Know 999 Refused ---------If HHAGE<18; else go to Adults May I speak with a person age 18 years or older please? 1 Yes, adult coming to the phone 2 No {go to termination screen--schedule callback} -------------------------------------------------------------------------------NewAdult ----------------------------------------------------------------------- Hello, my name is <Your Name> calling on behalf of the Interstate Shellfish Sanitation Conference. We are conducting a health survey of adults in <STATE>. 1. PERSON INTERESTED, CONTINUE 2. PERSON NOT INTERESTED, PRESS CTRL END AND SCHEDULE A CALL-BACK. -------------------------------------------------------------------------------Adults ----------------------------------------------------------------------- Our survey requires that we pick an adult to be interviewed who lives in your household. How many people living in your household, including yourself, are 18 years of age or older?
_ _ ENTER THE NUMBER OF ADULTS IF ANS = 1 SKIP TO HHSEX

2004 Raw Oyster Consumer Follow-up Survey: 2004 —Technical Report 53
-------------------------------------------------------------------------------Adults3a - ONLY IF ADULTS > 1; ELSE GO TO HHSEX ----------------------------------------------------------------------- How many of these adults are men and how many are women? __ Number of men __ Number of women ----------------------------------------------------------------------- --------WrongTot ONLY GET IF ADULTS>1 AND MEN+WOMEN<>ADULTS ----------------------------------------------------------------------- I’m sorry, something is not right. Number of Men - Number of Women - --------------- Number of Adults – 1. CORRECT THE NUMBER OF MEN 2. CORRECT THE NUMBER OF WOMEN 3. CORRECT THE NUMBER OF ADULTS -------------------------------------------------------------------------------HHSEX ----------------------------------------------------------------------- Are you male or female? INTERVIEWER: Ask only if you can’t determine.
1. RESPONDENT IS A MALE
2. RESPONDENT IS A FEMALE -------MOYS - If Men>0; Else go to WOYS A raw oyster is any oyster that’s uncooked, such as oysters on the half shell or raw oysters from a jar or can. How many of the men have eaten raw oysters in the past three years? __ Number of men
2004 Raw Oyster Consumer Follow-up Survey: 2004 —Technical Report 54
-------WOYS – If Women>0; Else go to Adults3b IF MEN=0 A raw oyster is any oyster that’s uncooked, such as oysters on the half shell or raw oysters from a jar or can. How many of the women have eaten raw oysters in the past three years? __ Number of women If MOYS = 0 and WOYS = 0 go to Closing2; Else Continue -------------------------------------------------------------------------------Adults3b - IF ADULTS = 1 or [(HHSEX=1 and MOYS>0) or (HHSEX=2 and WOYS>0)]; Else go to Selected ----------------------------------------------------------------------- IF ADULTS=1 A raw oyster is any oyster that’s uncooked, such as oysters on the half shell or raw oysters from a jar or can. Have you eaten raw oysters in the past three years? 1. YES – Go to You’re the One 2. NO – If Adults=1 go to Closing2; Else Continue 7. DON’T KNOW/I DON’T UNDERSTAND 9. REFUSED -------------------------------------------------------------------------------Selected – ONLY GET THIS IF MORE THAN ONE ADULT IN HOUSEHOLD ----------------------------------------------------------------------- I need to speak with someone in the household who has eaten raw oysters May I speak with him or her? 1. YES, ADULT COMING TO THE PHONE Go to NewAdult 2. NO, SCHEDULE A CALL-BACK -------------------------------------------------------------------------------YOURTHE1 - ONLY GET IF ADULTS3b = 1 (YES) ----------------------------------------------------------------------- Then you are the person I need to speak with. Your participation is voluntary, but it is very important because you represent many other people in your community. We will hold your responses in the strictest confidence. You may decline to answer any question you wish and you may terminate the interview at any time. If you have any questions at any point, please let me know. This survey should take less than 5 minutes

2004 Raw Oyster Consumer Follow-up Survey: 2004 —Technical Report 55
1. PERSON INTERESTED, CONTINUE – SKIP TO FIRST SECTION 2. GO BACK TO ADULTS QUESTION. WARNING:A NEW RESPONDENT MAY BE SELECTED -------------------------------------------------------------------------------NewAdult –ONLY GET THIS IF SELECTED=1 ----------------------------------------------------------------------- Hello, my name is <Your Name> calling on behalf of the Interstate Shellfish Sanitation Conference. We are conducting a health survey among adults in <STATE>. Your participation is voluntary, but it is very important because you represent many other people in your community. We will hold your responses in the strictest confidence. You may decline to answer any question you wish and you may terminate the interview at any time. If you have any questions at any point, please let me know. This survey should take less than 5 minutes. 1. PERSON INTERESTED, CONTINUE 2. PERSON NOT INTERESTED, CLOSING2
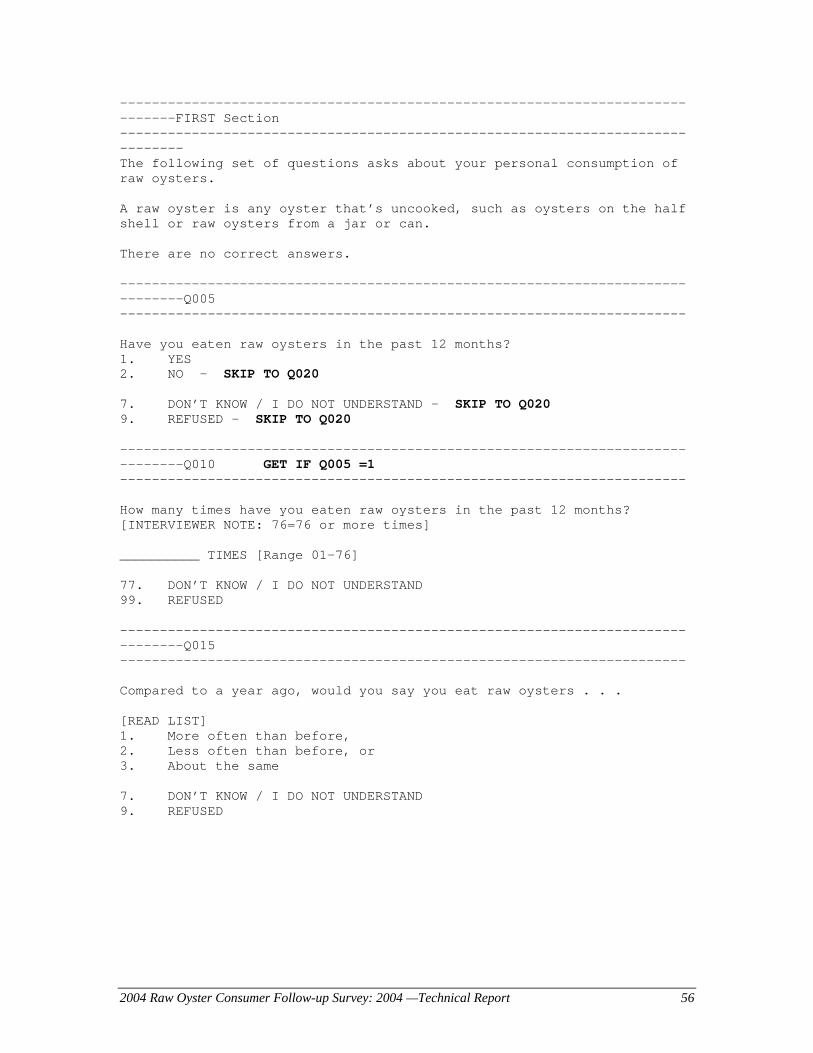
2004 Raw Oyster Consumer Follow-up Survey: 2004 —Technical Report 56
------------------------------------------------------------------------------FIRST Section ------------------------------------------------------------------------------- The following set of questions asks about your personal consumption of raw oysters. A raw oyster is any oyster that’s uncooked, such as oysters on the half shell or raw oysters from a jar or can. There are no correct answers. -------------------------------------------------------------------------------Q005 ----------------------------------------------------------------------- Have you eaten raw oysters in the past 12 months? 1. YES 2. NO - SKIP TO Q020 7. DON’T KNOW / I DO NOT UNDERSTAND - SKIP TO Q020 9. REFUSED - SKIP TO Q020 -------------------------------------------------------------------------------Q010 GET IF Q005 =1 ----------------------------------------------------------------------- How many times have you eaten raw oysters in the past 12 months? [INTERVIEWER NOTE: 76=76 or more times] __________ TIMES [Range 01-76] 77. DON’T KNOW / I DO NOT UNDERSTAND 99. REFUSED -------------------------------------------------------------------------------Q015 ----------------------------------------------------------------------- Compared to a year ago, would you say you eat raw oysters . . . [READ LIST] 1. More often than before, 2. Less often than before, or 3. About the same 7. DON’T KNOW / I DO NOT UNDERSTAND 9. REFUSED
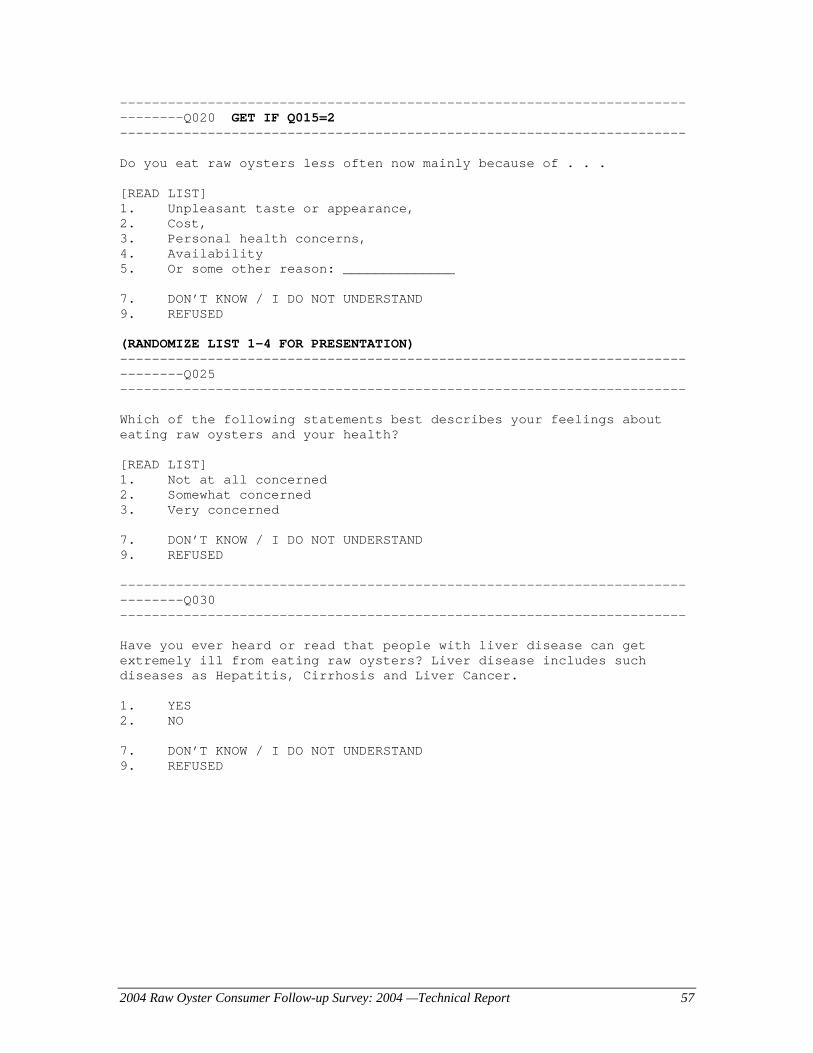
2004 Raw Oyster Consumer Follow-up Survey: 2004 —Technical Report 57
-------------------------------------------------------------------------------Q020 GET IF Q015=2 ----------------------------------------------------------------------- Do you eat raw oysters less often now mainly because of . . . [READ LIST] 1. Unpleasant taste or appearance, 2. Cost, 3. Personal health concerns, 4. Availability 5. Or some other reason: ______________ 7. DON’T KNOW / I DO NOT UNDERSTAND 9. REFUSED (RANDOMIZE LIST 1-4 FOR PRESENTATION) -------------------------------------------------------------------------------Q025 ----------------------------------------------------------------------- Which of the following statements best describes your feelings about eating raw oysters and your health? [READ LIST] 1. Not at all concerned 2. Somewhat concerned 3. Very concerned 7. DON’T KNOW / I DO NOT UNDERSTAND 9. REFUSED -------------------------------------------------------------------------------Q030 ----------------------------------------------------------------------- Have you ever heard or read that people with liver disease can get extremely ill from eating raw oysters? Liver disease includes such diseases as Hepatitis, Cirrhosis and Liver Cancer. 1. YES 2. NO 7. DON’T KNOW / I DO NOT UNDERSTAND 9. REFUSED
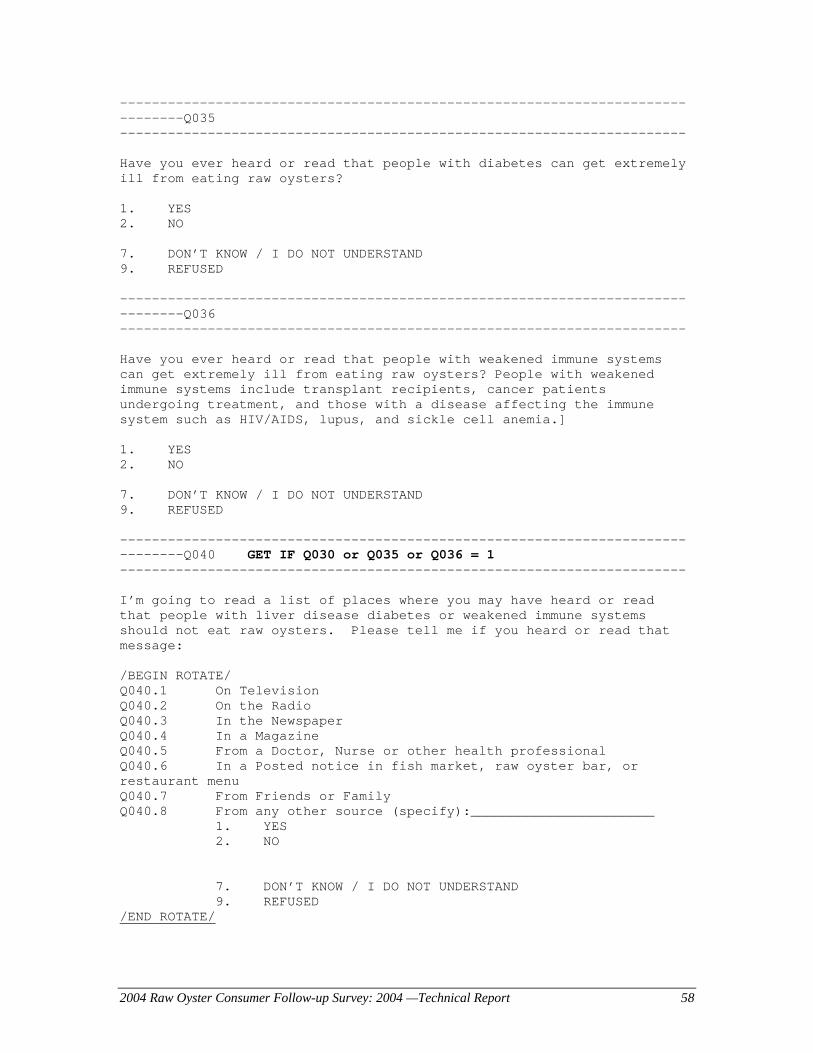
2004 Raw Oyster Consumer Follow-up Survey: 2004 —Technical Report 58
-------------------------------------------------------------------------------Q035 ----------------------------------------------------------------------- Have you ever heard or read that people with diabetes can get extremely ill from eating raw oysters? 1. YES 2. NO 7. DON’T KNOW / I DO NOT UNDERSTAND 9. REFUSED -------------------------------------------------------------------------------Q036 ----------------------------------------------------------------------- Have you ever heard or read that people with weakened immune systems can get extremely ill from eating raw oysters? People with weakened immune systems include transplant recipients, cancer patients undergoing treatment, and those with a disease affecting the immune system such as HIV/AIDS, lupus, and sickle cell anemia.] 1. YES 2. NO 7. DON’T KNOW / I DO NOT UNDERSTAND 9. REFUSED -------------------------------------------------------------------------------Q040 GET IF Q030 or Q035 or Q036 = 1 ----------------------------------------------------------------------- I’m going to read a list of places where you may have heard or read that people with liver disease diabetes or weakened immune systems should not eat raw oysters. Please tell me if you heard or read that message: /BEGIN ROTATE/ Q040.1 On Television Q040.2 On the Radio Q040.3 In the Newspaper Q040.4 In a Magazine Q040.5 From a Doctor, Nurse or other health professional Q040.6 In a Posted notice in fish market, raw oyster bar, or restaurant menu Q040.7 From Friends or Family Q040.8 From any other source (specify):_______________________
1. YES 2. NO 7. DON’T KNOW / I DO NOT UNDERSTAND 9. REFUSED
/END ROTATE/
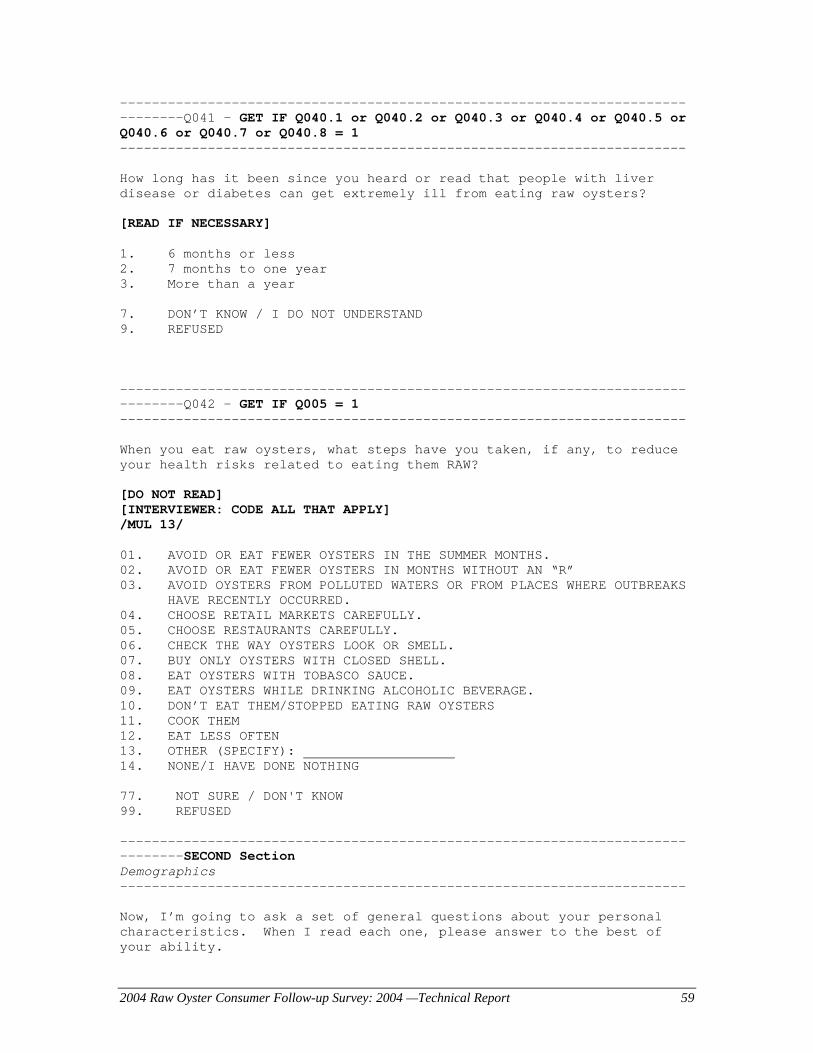
2004 Raw Oyster Consumer Follow-up Survey: 2004 —Technical Report 59
-------------------------------------------------------------------------------Q041 – GET IF Q040.1 or Q040.2 or Q040.3 or Q040.4 or Q040.5 or Q040.6 or Q040.7 or Q040.8 = 1 ----------------------------------------------------------------------- How long has it been since you heard or read that people with liver disease or diabetes can get extremely ill from eating raw oysters? [READ IF NECESSARY] 1. 6 months or less 2. 7 months to one year 3. More than a year 7. DON’T KNOW / I DO NOT UNDERSTAND 9. REFUSED -------------------------------------------------------------------------------Q042 - GET IF Q005 = 1 ----------------------------------------------------------------------- When you eat raw oysters, what steps have you taken, if any, to reduce your health risks related to eating them RAW? [DO NOT READ] [INTERVIEWER: CODE ALL THAT APPLY] /MUL 13/ 01. AVOID OR EAT FEWER OYSTERS IN THE SUMMER MONTHS. 02. AVOID OR EAT FEWER OYSTERS IN MONTHS WITHOUT AN “R” 03. AVOID OYSTERS FROM POLLUTED WATERS OR FROM PLACES WHERE OUTBREAKS
HAVE RECENTLY OCCURRED. 04. CHOOSE RETAIL MARKETS CAREFULLY. 05. CHOOSE RESTAURANTS CAREFULLY. 06. CHECK THE WAY OYSTERS LOOK OR SMELL. 07. BUY ONLY OYSTERS WITH CLOSED SHELL. 08. EAT OYSTERS WITH TOBASCO SAUCE. 09. EAT OYSTERS WHILE DRINKING ALCOHOLIC BEVERAGE. 10. DON’T EAT THEM/STOPPED EATING RAW OYSTERS 11. COOK THEM 12. EAT LESS OFTEN 13. OTHER (SPECIFY): 14. NONE/I HAVE DONE NOTHING 77. NOT SURE / DON'T KNOW 99. REFUSED -------------------------------------------------------------------------------SECOND Section Demographics ----------------------------------------------------------------------- Now, I’m going to ask a set of general questions about your personal characteristics. When I read each one, please answer to the best of your ability.

2004 Raw Oyster Consumer Follow-up Survey: 2004 —Technical Report 60
-------------------------------------------------------------------------------Q045 ----------------------------------------------------------------------- /IF (HHAGE>18) AND (HHAGE NE 888) AND YOURTHE1=1, FILL IN DATA AUTOMATICALLY AND SKIP TO Q055/ What is your age?
_____ Code age in years [RANGE 18-99]
07. DON’T KNOW/NOT SURE 09. REFUSED -------------------------------------------------------------------------------Q050 GET IF Q045 = 999 ----------------------------------------------------------------------- I understand this may be a sensitive question. Would you be willing to tell me which of the following best describes your age range? [READ 1 – 4 ONLY]. 1. Under 30 2. 30 to 44 3. 45 to 64 4. 65 or older 7. DON’T KNOW / NOT SURE 9. REFUSED -------------------------------------------------------------------------------Q055 ----------------------------------------------------------------------- [RECORD GENDER, VERIFY IF NECESSARY] 1. MALE 2. FEMALE 7. DON’T KNOW / NOT SURE 9. REFUSED

2004 Raw Oyster Consumer Follow-up Survey: 2004 —Technical Report 61
-------------------------------------------------------------------------------Q060 ----------------------------------------------------------------------- Which racial or ethnic background best describes you? Would you say: White, Black, Asian, Pacific Islander, American Indian, Alaska Native, or Other? [INTERVIEWER: IF RESPONDENT SAYS 'Hispanic', ASK 'Are you white-Hispanic, black-Hispanic, Asian or Pacific Islander and Hispanic, American Indian or Alaska Native and Hispanic, or other race and Hispanic?] 1. White (Caucasian) 2. Black (African-American) 4. Asian or Pacific Islander 5. American Indian or Alaska Native (including Aleut) 6. OTHER (Specify?): 7. DON’T KNOW / NOT SURE 9. REFUSED -------------------------------------------------------------------------------Q065 ----------------------------------------------------------------------- [INTERVIEWER: IF RESPONDENT REPLIED 'Hispanic' TO THE PREVIOUS QUESTION, CODE THIS QUESTION “YES” AND CONTINUE] Are you of Spanish or Hispanic origin? 1. YES 2. NO 7. NOT SURE / DON'T KNOW 9. REFUSED -------------------------------------------------------------------------------Q070 ----------------------------------------------------------------------- Has a doctor ever told you that you have liver disease, such as hepatitis, cirrhosis, or liver cancer? 1. YES 2. NO 7. NOT SURE / DON'T KNOW 9. REFUSED -------------------------------------------------------------------------------Q075 -----------------------------------------------------------------------
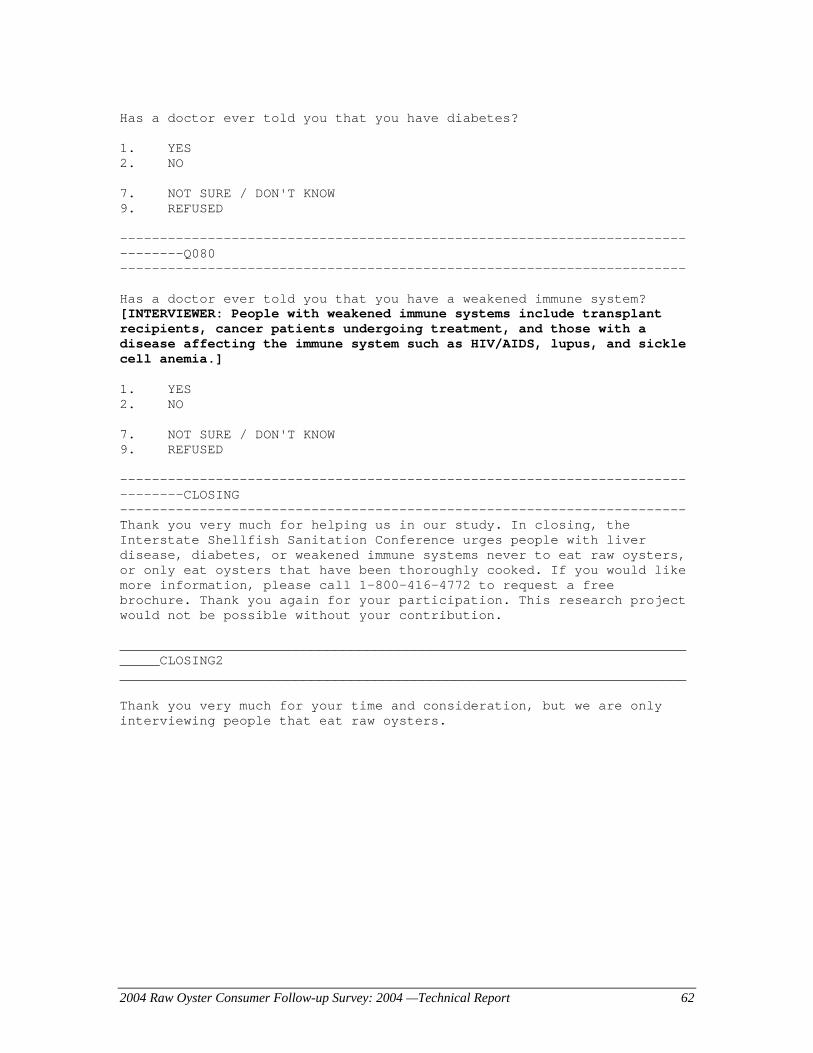
2004 Raw Oyster Consumer Follow-up Survey: 2004 —Technical Report 62
Has a doctor ever told you that you have diabetes? 1. YES 2. NO 7. NOT SURE / DON'T KNOW 9. REFUSED -------------------------------------------------------------------------------Q080 ----------------------------------------------------------------------- Has a doctor ever told you that you have a weakened immune system? [INTERVIEWER: People with weakened immune systems include transplant recipients, cancer patients undergoing treatment, and those with a disease affecting the immune system such as HIV/AIDS, lupus, and sickle cell anemia.] 1. YES 2. NO 7. NOT SURE / DON'T KNOW 9. REFUSED -------------------------------------------------------------------------------CLOSING ----------------------------------------------------------------------- Thank you very much for helping us in our study. In closing, the Interstate Shellfish Sanitation Conference urges people with liver disease, diabetes, or weakened immune systems never to eat raw oysters, or only eat oysters that have been thoroughly cooked. If you would like more information, please call 1-800-416-4772 to request a free brochure. Thank you again for your participation. This research project would not be possible without your contribution. ____________________________________________________________________________CLOSING2 _______________________________________________________________________ Thank you very much for your time and consideration, but we are only interviewing people that eat raw oysters.

2004 Raw Oyster Consumer Follow-up Survey: 2004 —Technical Report 63
AAPPPPEENNDDIIXX EE:: QQUUEESSTTIIOONN--LLEEVVEELL FFRREEQQUUEENNCCIIEESS
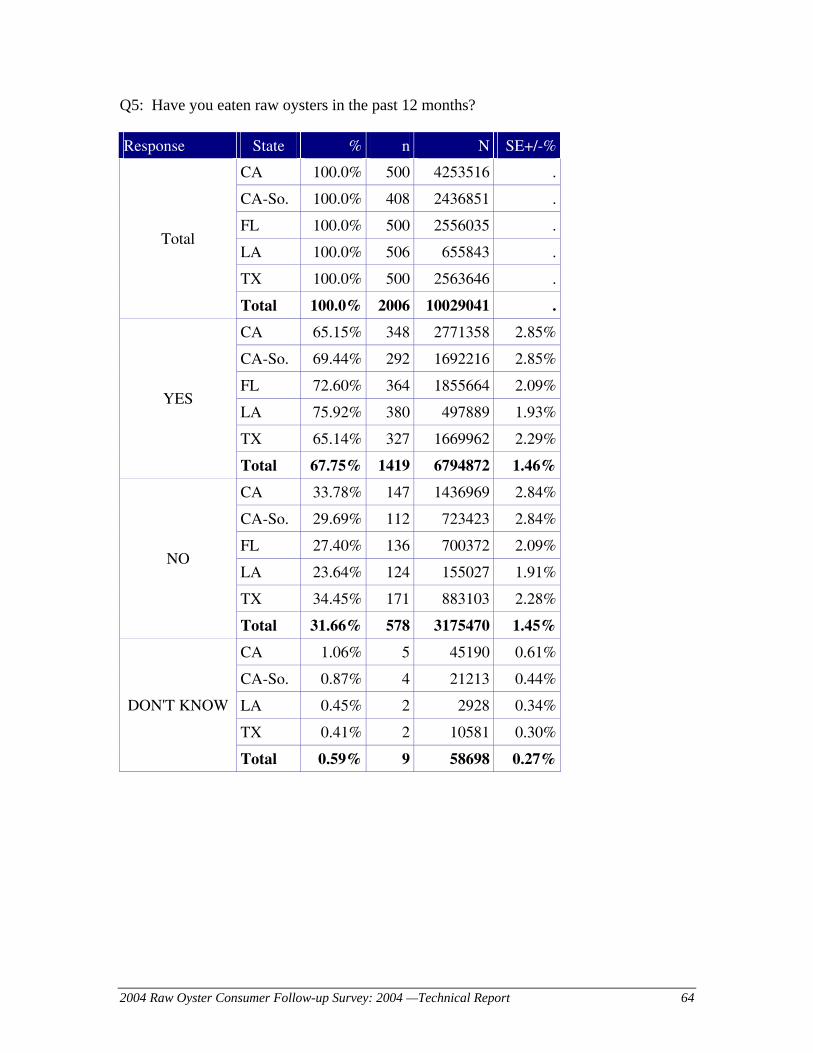
2004 Raw Oyster Consumer Follow-up Survey: 2004 —Technical Report 64
Q5: Have you eaten raw oysters in the past 12 months? Response State % n N SE+/-%
CA 100.0% 500 4253516 .
CA-So. 100.0% 408 2436851 .
FL 100.0% 500 2556035 .
LA 100.0% 506 655843 .
TX 100.0% 500 2563646 .
Total
Total 100.0% 2006 10029041 .
CA 65.15% 348 2771358 2.85%
CA-So. 69.44% 292 1692216 2.85%
FL 72.60% 364 1855664 2.09%
LA 75.92% 380 497889 1.93%
TX 65.14% 327 1669962 2.29%
YES
Total 67.75% 1419 6794872 1.46%
CA 33.78% 147 1436969 2.84%
CA-So. 29.69% 112 723423 2.84%
FL 27.40% 136 700372 2.09%
LA 23.64% 124 155027 1.91%
TX 34.45% 171 883103 2.28%
NO
Total 31.66% 578 3175470 1.45%
CA 1.06% 5 45190 0.61%
CA-So. 0.87% 4 21213 0.44%
LA 0.45% 2 2928 0.34%
TX 0.41% 2 10581 0.30%
DON'T KNOW
Total 0.59% 9 58698 0.27%
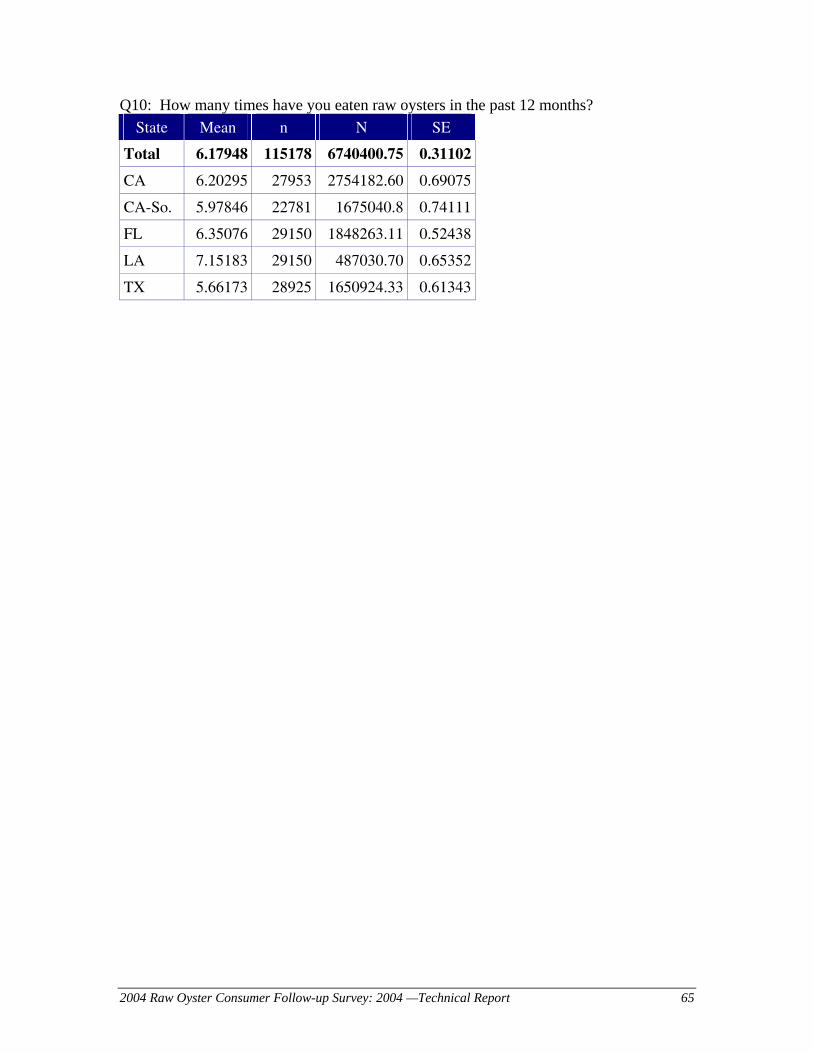
2004 Raw Oyster Consumer Follow-up Survey: 2004 —Technical Report 65
Q10: How many times have you eaten raw oysters in the past 12 months? State Mean n N SE
Total 6.17948 115178 6740400.75 0.31102
CA 6.20295 27953 2754182.60 0.69075
CA-So. 5.97846 22781 1675040.8 0.74111
FL 6.35076 29150 1848263.11 0.52438
LA 7.15183 29150 487030.70 0.65352
TX 5.66173 28925 1650924.33 0.61343

2004 Raw Oyster Consumer Follow-up Survey: 2004 —Technical Report 66
Q15: Compared to a year ago, would you say you eat raw oysters…
Response State % n N SE+/-%
CA 100.0% 348 2771358 .
CA-So. 100.0% 292 1692216 .
FL 100.0% 364 1855664 .
LA 100.0% 380 497889 .
TX 100.0% 327 1669962 .
Total
Total 100.0% 1419 6794872 .
CA 13.81% 51 382852 2.42%
CA-So. 14.65% 44 247894 2.56%
FL 9.37% 35 173794 1.56%
LA 11.77% 42 58577 1.76%
TX 10.72% 31 179066 1.91%
MORE OFTEN THAN BEFORE
Total 11.69% 159 794289 1.18%
CA 21.50% 79 595891 2.80%
CA-So. 21.17% 67 358177 2.71%
FL 22.07% 83 409576 2.22%
LA 17.09% 66 85087 1.98%
TX 19.05% 67 318112 2.27%
LESS OFTEN THAN BEFORE
Total 20.73% 295 1408665 1.42%
CA 64.35% 216 1783271 3.31%
CA-So. 63.63% 179 1076801 3.35%
FL 68.56% 246 1272294 2.50%
LA 70.39% 269 350489 2.42%
TX 70.23% 229 1172784 2.70%
ABOUT THE SAME
Total 67.39% 960 4578838 1.66%
CA 0.34% 2 9344 0.24%
CA-So. 0.55% 2 9344 0.39%
LA 0.75% 3 3736 0.43% DON'T KNOW
Total 0.19% 5 13080 0.10%

2004 Raw Oyster Consumer Follow-up Survey: 2004 —Technical Report 67
Q20: Do you eat raw oysters less often now mainly because of … Response State % n N SE+/-%
CA 100.0% 79 595891 .
CA-So. 100.0% 67 358177 .
FL 100.0% 83 409576 .
LA 100.0% 66 85087 .
TX 100.0% 67 318112 .
Total
Total 100.0% 295 1408665 .
CA 18.83% 11 112231 6.52%
CA-So. 22.76% 10 81520 7.37%
FL 2.02% 2 8260 1.42%
LA 7.07% 4 6017 3.49%
TX 12.44% 8 39562 4.46%
UNPLEASANT TASTE OR APPEARANCE
Total 11.79% 25 166071 3.05%
CA 18.87% 14 112459 5.97%
CA-So. 10.81% 10 38719 3.57%
FL 14.93% 12 61138 4.12%
LA 11.25% 8 9571 3.84%
TX 7.24% 5 23020 3.23%
COST
Total 14.64% 39 206189 2.92%
CA 20.47% 16 121995 5.99%
CA-So. 16.79% 13 60144 4.63%
FL 32.65% 27 133743 5.33%
LA 31.64% 21 26917 5.90%
TX 32.55% 22 103539 6.11%
PERSONAL HEALTH CONCERNS
Total 27.42% 86 386194 3.30%
CA 23.12% 21 137765 5.36%
CA-So. 30.22% 19 108228 6.27%
FL 27.49% 22 112591 5.18%
LA 29.52% 20 25115 5.81%
TX 29.58% 20 94109 6.09%
AVAILABILITY
Total 26.24% 83 369580 3.11%
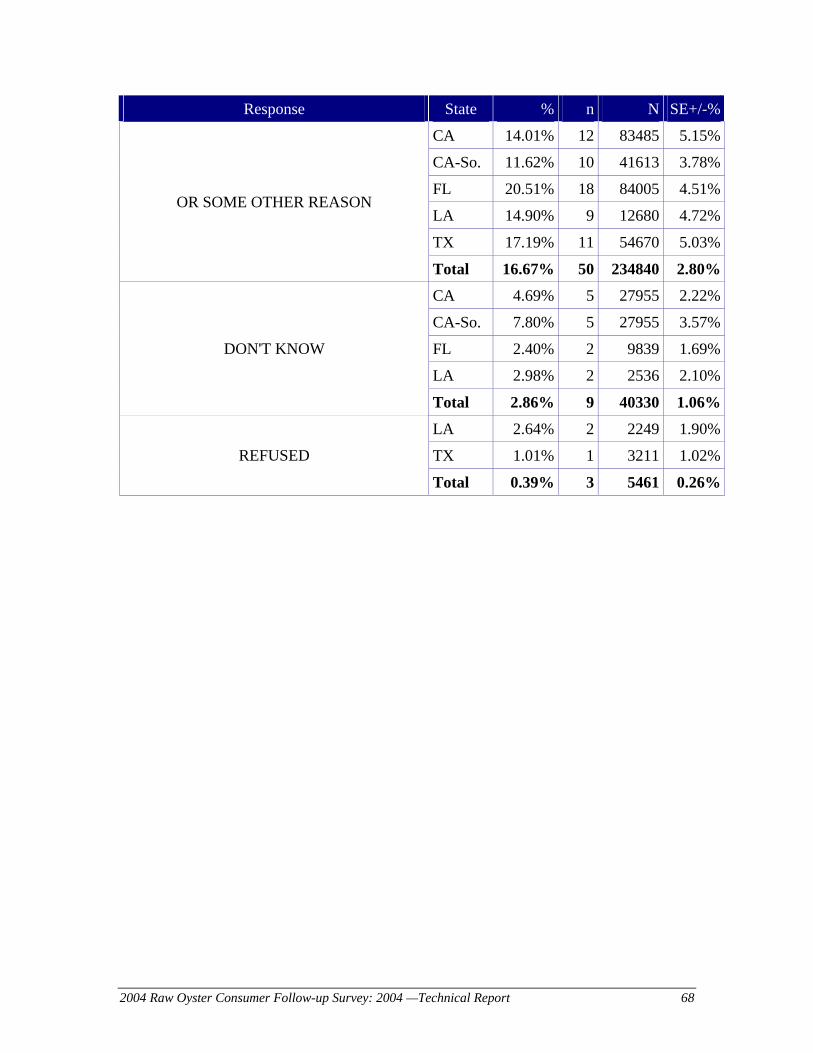
2004 Raw Oyster Consumer Follow-up Survey: 2004 —Technical Report 68
Response State % n N SE+/-%
CA 14.01% 12 83485 5.15%
CA-So. 11.62% 10 41613 3.78%
FL 20.51% 18 84005 4.51%
LA 14.90% 9 12680 4.72%
TX 17.19% 11 54670 5.03%
OR SOME OTHER REASON
Total 16.67% 50 234840 2.80%
CA 4.69% 5 27955 2.22%
CA-So. 7.80% 5 27955 3.57%
FL 2.40% 2 9839 1.69%
LA 2.98% 2 2536 2.10%
DON'T KNOW
Total 2.86% 9 40330 1.06%
LA 2.64% 2 2249 1.90%
TX 1.01% 1 3211 1.02%REFUSED
Total 0.39% 3 5461 0.26%
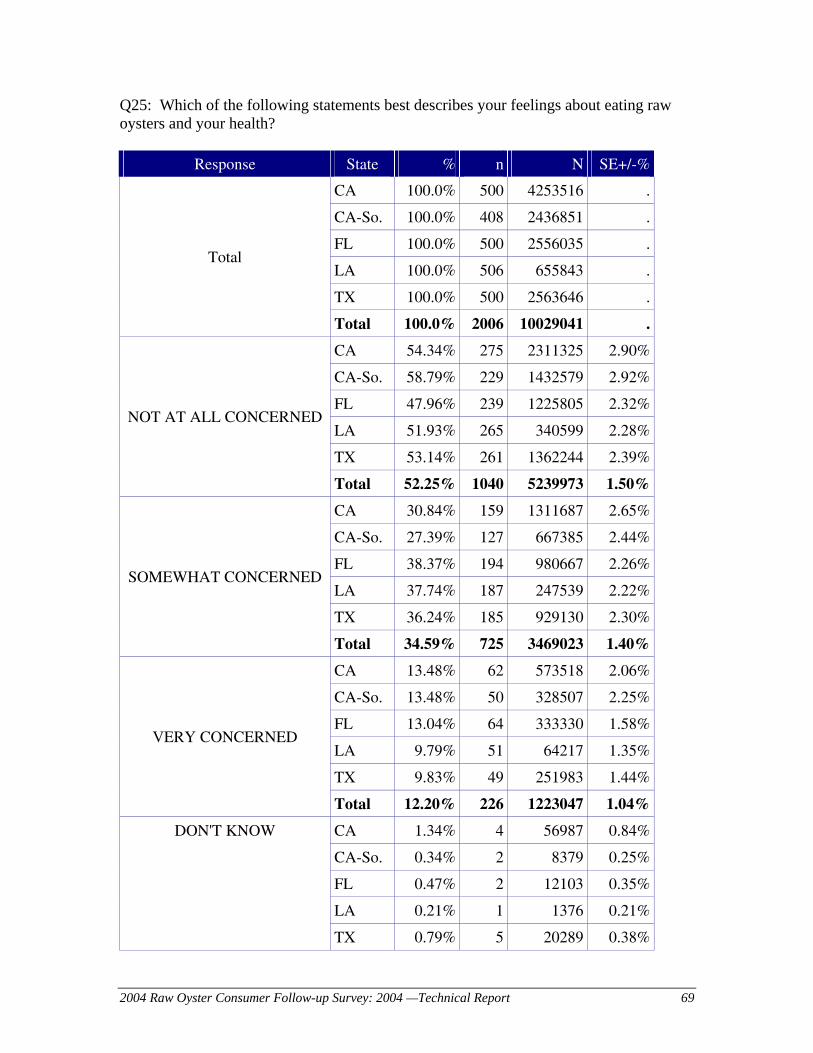
2004 Raw Oyster Consumer Follow-up Survey: 2004 —Technical Report 69
Q25: Which of the following statements best describes your feelings about eating raw oysters and your health?
Response State % n N SE+/-%
CA 100.0% 500 4253516 .
CA-So. 100.0% 408 2436851 .
FL 100.0% 500 2556035 .
LA 100.0% 506 655843 .
TX 100.0% 500 2563646 .
Total
Total 100.0% 2006 10029041 .
CA 54.34% 275 2311325 2.90%
CA-So. 58.79% 229 1432579 2.92%
FL 47.96% 239 1225805 2.32%
LA 51.93% 265 340599 2.28%
TX 53.14% 261 1362244 2.39%
NOT AT ALL CONCERNED
Total 52.25% 1040 5239973 1.50%
CA 30.84% 159 1311687 2.65%
CA-So. 27.39% 127 667385 2.44%
FL 38.37% 194 980667 2.26%
LA 37.74% 187 247539 2.22%
TX 36.24% 185 929130 2.30%
SOMEWHAT CONCERNED
Total 34.59% 725 3469023 1.40%
CA 13.48% 62 573518 2.06%
CA-So. 13.48% 50 328507 2.25%
FL 13.04% 64 333330 1.58%
LA 9.79% 51 64217 1.35%
TX 9.83% 49 251983 1.44%
VERY CONCERNED
Total 12.20% 226 1223047 1.04%
CA 1.34% 4 56987 0.84%
CA-So. 0.34% 2 8379 0.25%
FL 0.47% 2 12103 0.35%
LA 0.21% 1 1376 0.21%
DON'T KNOW
TX 0.79% 5 20289 0.38%
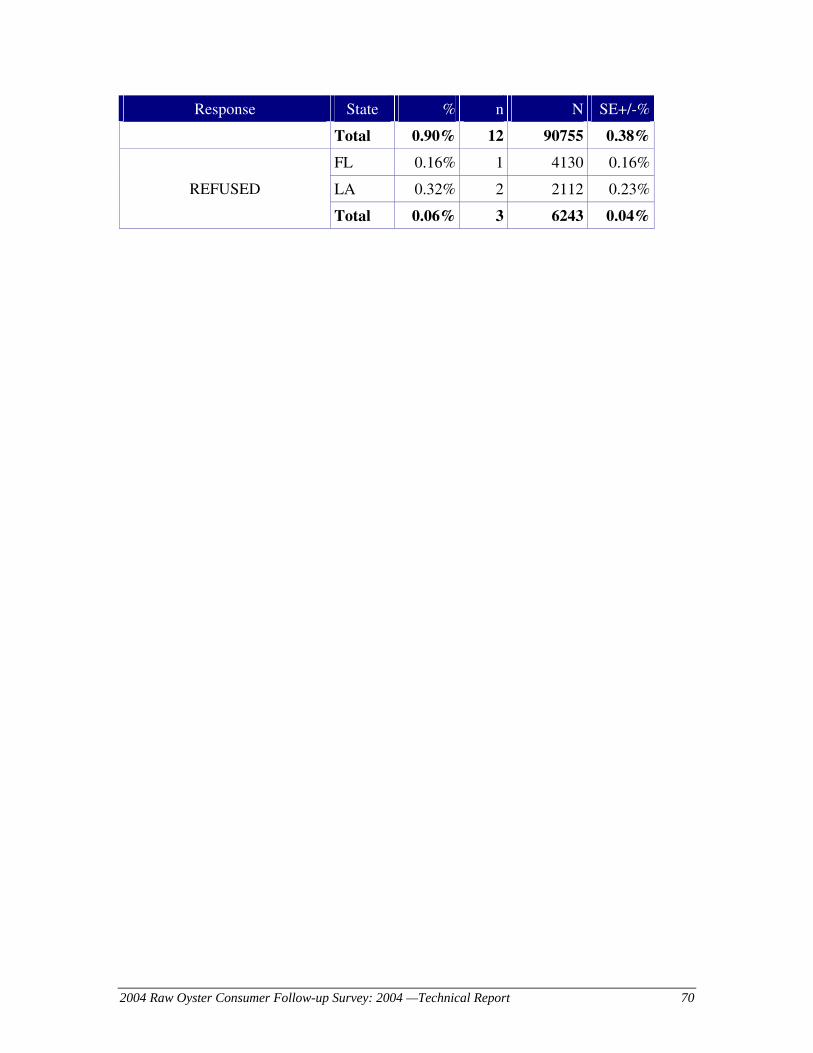
2004 Raw Oyster Consumer Follow-up Survey: 2004 —Technical Report 70
Response State % n N SE+/-%
Total 0.90% 12 90755 0.38%
FL 0.16% 1 4130 0.16%
LA 0.32% 2 2112 0.23% REFUSED
Total 0.06% 3 6243 0.04%

2004 Raw Oyster Consumer Follow-up Survey: 2004 —Technical Report 71
Q30: Have you ever heard or read that people with liver disease can get extremely ill from eating raw oysters?
Response State % n N SE+/-%
CA 100.0% 500 4253516 .
CA-So. 100.0% 408 2436851 .
FL 100.0% 500 2556035 .
LA 100.0% 506 655843 .
TX 100.0% 500 2563646 .
Total
Total 100.0% 2006 10029041 .
CA 32.61% 167 1387187 2.71%
CA-So. 33.16% 138 807947 2.82%
FL 54.99% 275 1405536 2.31%
LA 62.66% 316 410947 2.21%
TX 42.93% 220 1100481 2.37%
YES
Total 42.92% 978 4304151 1.45%
CA 67.21% 332 2858727 2.72%
CA-So. 66.53% 269 1621302 2.82%
FL 44.62% 223 1140535 2.31%
LA 37.20% 189 243983 2.21%
TX 56.88% 279 1458188 2.37%
NO
Total 56.85% 1023 5701434 1.45%
CA 0.18% 1 7602 0.18%
CA-So. 0.31% 1 7602 0.31%
FL 0.26% 1 6693 0.26%
LA 0.14% 1 913 0.14%
TX 0.19% 1 4978 0.19%
DON'T KNOW
Total 0.20% 4 20185 0.11%
FL 0.13% 1 3270 0.13% REFUSED
Total 0.03% 1 3270 0.03%

2004 Raw Oyster Consumer Follow-up Survey: 2004 —Technical Report 72
Q35: Have you ever heard or read that people with diabetes can get extremely ill from eating raw oysters?
Response State % n N SE+/-%
CA 100.0% 500 4253516 .
CA-So. 100.0% 408 2436851 .
FL 100.0% 500 2556035 .
LA 100.0% 506 655843 .
TX 100.0% 500 2563646 .
Total
Total 100.0% 2006 10029041 .
CA 16.93% 96 720018 2.12%
CA-So. 20.22% 86 492711 2.36%
FL 24.22% 124 619081 1.97%
LA 26.60% 134 174457 2.02%
TX 16.01% 79 410532 1.75%
YES
Total 19.19% 433 1924088 1.13%
CA 82.69% 401 3517230 2.13%
CA-So. 79.11% 319 1927872 2.38 %
FL 75.59% 375 1932034 1.98%
LA 73.01% 370 478849 2.03%
TX 83.99% 421 2153115 1.75%
NO
Total 80.58% 1567 8081229 1.14%
CA 0.38% 3 16268 0.22%
CA-So. 0.67% 3 16268 0.39%
FL 0.19% 1 4920 0.19%
LA 0.39% 2 2536 0.27%
DON'T KNOW
Total 0.24% 6 23724 0.11%

2004 Raw Oyster Consumer Follow-up Survey: 2004 —Technical Report 73
Q36: Have you ever heard or read that people with weakened immune systems can get extremely ill from eating raw oysters?
Response State % n N SE+/-%
CA 100.0% 500 4253516 .
CA-So. 100.0% 408 2436851 .
FL 100.0% 500 2556035 .
LA 100.0% 506 655843 .
TX 100.0% 500 2563646 .
Total
Total 100.0% 2006 10029041 .
CA 22.20% 127 944336 2.30%
CA-So. 24.29% 109 591889 2.39%
FL 44.24% 227 1130668 2.31%
LA 47.74% 241 313068 2.28%
TX 28.30% 143 725541 2.15%
YES
Total 31.05% 738 3113613 1.29%
CA 77.13% 371 3280805 2.34%
CA-So. 75.53% 298 1840563 2.39%
FL 55.60% 272 1421237 2.31%
LA 52.06% 264 341438 2.28%
TX 71.70% 357 1838105 2.15%
NO
Total 68.62% 1264 6881586 1.30%
CA 0.67% 2 28375 0.57%
CA-So. 0.18% 1 4399 0.16%
FL 0.16% 1 4130 0.16%
LA 0.20% 1 1337 0.20%
DON'T KNOW
Total 0.34% 4 33842 0.25%

2004 Raw Oyster Consumer Follow-up Survey: 2004 —Technical Report 74
Q40_1: Please tell me if you heard or read that message: On Television?
Response State % n N SE+/-%
CA 100.0% 212 1727904 .
CA 100.0% 179 1055372 .
FL 100.0% 325 1652789 .
LA 100.0% 353 458523 .
TX 100.0% 242 1219404 .
Total
Total 100.0% 1132 5058620 .
CA 31.24% 74 539764 4.09%
CA-So. 35.14% 66 370831 4.20%
FL 44.25% 139 731410 2.88%
LA 46.77% 164 214438 2.73%
TX 41.79% 100 509590 3.41%
YES
Total 39.44% 477 1995203 1.91%
CA 65.64% 135 1134251 4.26%
CA-So. 64.30% 112 678607 4.22%
FL 54.90% 183 907409 2.88%
LA 51.49% 183 236114 2.73%
TX 56.82% 140 692838 3.43%
NO
Total 58.72% 641 2970612 1.95%
CA 3.12% 3 53888 1.95%
CA-So. 0.56% 1 5935 0.56%
FL 0.85% 3 13969 0.49%
LA 1.74% 6 7970 0.72%
TX 1.39% 2 16977 0.98%
DON'T KNOW
Total 1.83% 14 92804 0.73%
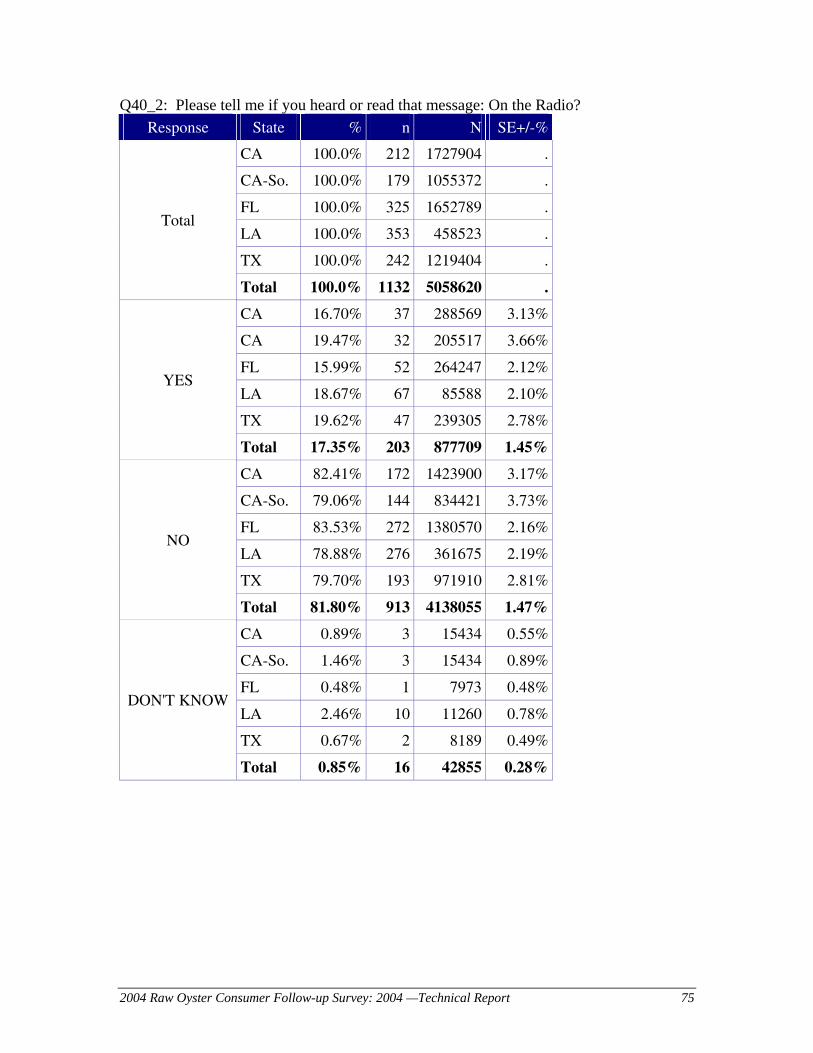
2004 Raw Oyster Consumer Follow-up Survey: 2004 —Technical Report 75
Q40_2: Please tell me if you heard or read that message: On the Radio? Response State % n N SE+/-%
CA 100.0% 212 1727904 .
CA-So. 100.0% 179 1055372 .
FL 100.0% 325 1652789 .
LA 100.0% 353 458523 .
TX 100.0% 242 1219404 .
Total
Total 100.0% 1132 5058620 .
CA 16.70% 37 288569 3.13%
CA 19.47% 32 205517 3.66%
FL 15.99% 52 264247 2.12%
LA 18.67% 67 85588 2.10%
TX 19.62% 47 239305 2.78%
YES
Total 17.35% 203 877709 1.45%
CA 82.41% 172 1423900 3.17%
CA-So. 79.06% 144 834421 3.73%
FL 83.53% 272 1380570 2.16%
LA 78.88% 276 361675 2.19%
TX 79.70% 193 971910 2.81%
NO
Total 81.80% 913 4138055 1.47%
CA 0.89% 3 15434 0.55%
CA-So. 1.46% 3 15434 0.89%
FL 0.48% 1 7973 0.48%
LA 2.46% 10 11260 0.78%
TX 0.67% 2 8189 0.49%
DON'T KNOW
Total 0.85% 16 42855 0.28%
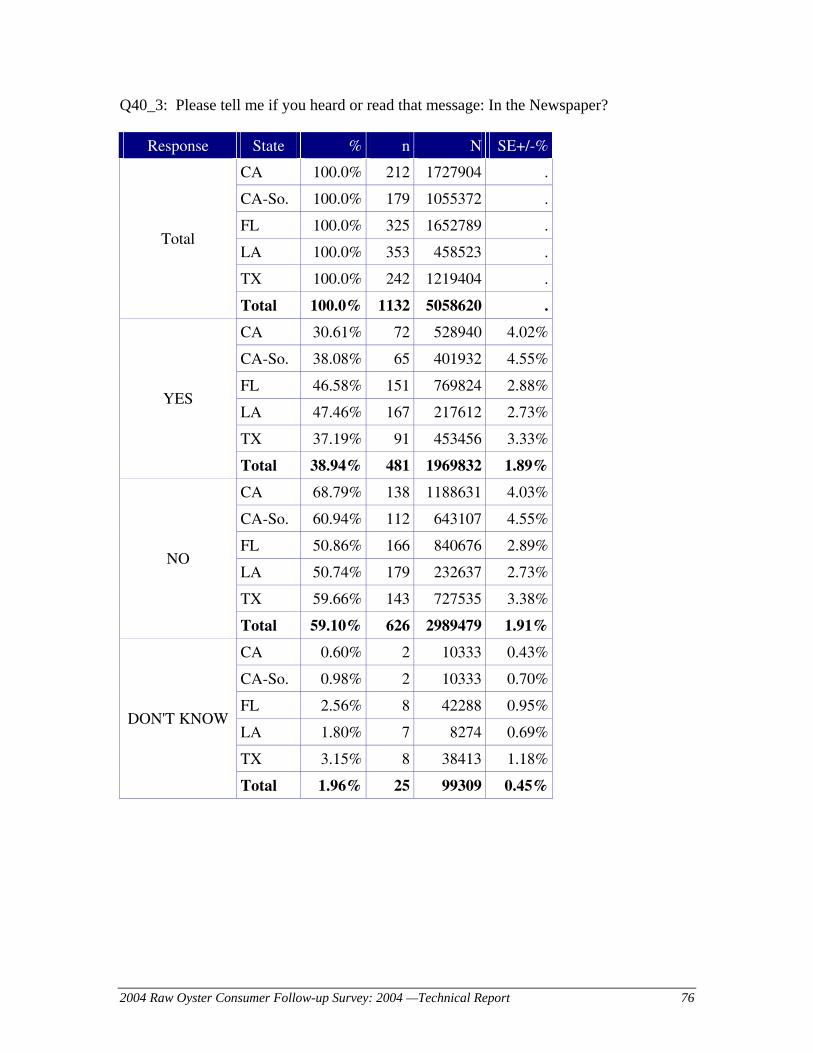
2004 Raw Oyster Consumer Follow-up Survey: 2004 —Technical Report 76
Q40_3: Please tell me if you heard or read that message: In the Newspaper?
Response State % n N SE+/-%
CA 100.0% 212 1727904 .
CA-So. 100.0% 179 1055372 .
FL 100.0% 325 1652789 .
LA 100.0% 353 458523 .
TX 100.0% 242 1219404 .
Total
Total 100.0% 1132 5058620 .
CA 30.61% 72 528940 4.02%
CA-So. 38.08% 65 401932 4.55%
FL 46.58% 151 769824 2.88%
LA 47.46% 167 217612 2.73%
TX 37.19% 91 453456 3.33%
YES
Total 38.94% 481 1969832 1.89%
CA 68.79% 138 1188631 4.03%
CA-So. 60.94% 112 643107 4.55%
FL 50.86% 166 840676 2.89%
LA 50.74% 179 232637 2.73%
TX 59.66% 143 727535 3.38%
NO
Total 59.10% 626 2989479 1.91%
CA 0.60% 2 10333 0.43%
CA-So. 0.98% 2 10333 0.70%
FL 2.56% 8 42288 0.95%
LA 1.80% 7 8274 0.69%
TX 3.15% 8 38413 1.18%
DON'T KNOW
Total 1.96% 25 99309 0.45%
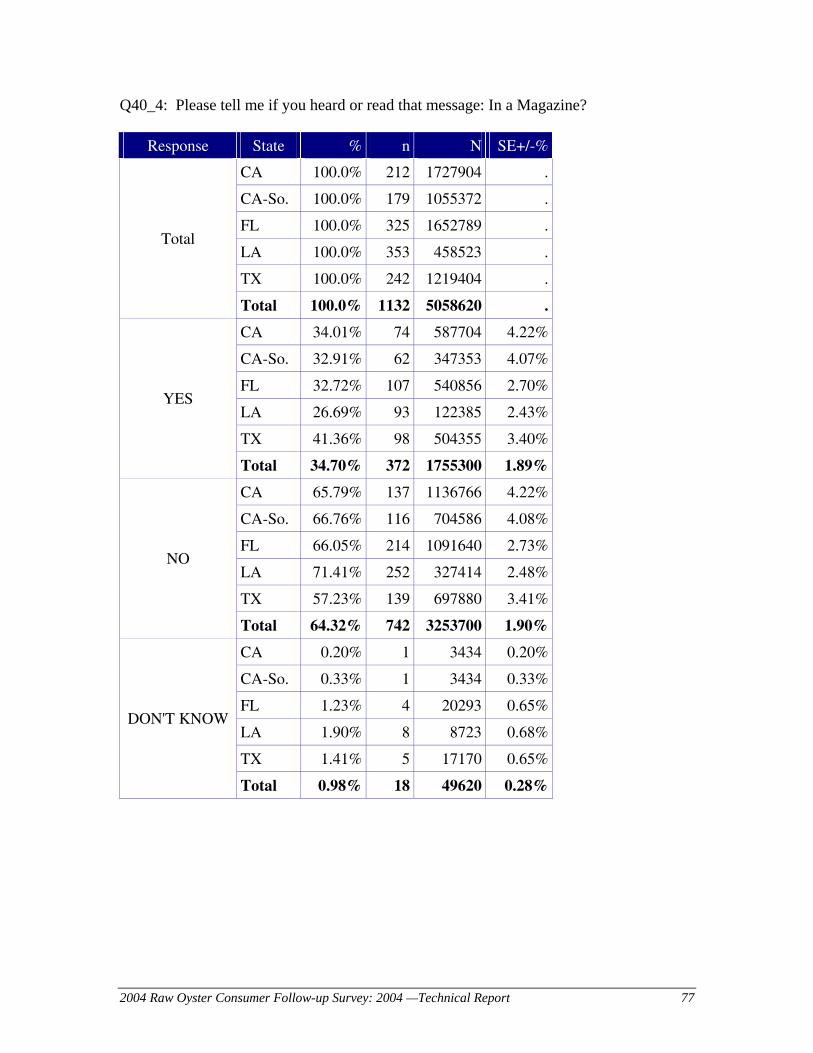
2004 Raw Oyster Consumer Follow-up Survey: 2004 —Technical Report 77
Q40_4: Please tell me if you heard or read that message: In a Magazine?
Response State % n N SE+/-%
CA 100.0% 212 1727904 .
CA-So. 100.0% 179 1055372 .
FL 100.0% 325 1652789 .
LA 100.0% 353 458523 .
TX 100.0% 242 1219404 .
Total
Total 100.0% 1132 5058620 .
CA 34.01% 74 587704 4.22%
CA-So. 32.91% 62 347353 4.07%
FL 32.72% 107 540856 2.70%
LA 26.69% 93 122385 2.43%
TX 41.36% 98 504355 3.40%
YES
Total 34.70% 372 1755300 1.89%
CA 65.79% 137 1136766 4.22%
CA-So. 66.76% 116 704586 4.08%
FL 66.05% 214 1091640 2.73%
LA 71.41% 252 327414 2.48%
TX 57.23% 139 697880 3.41%
NO
Total 64.32% 742 3253700 1.90%
CA 0.20% 1 3434 0.20%
CA-So. 0.33% 1 3434 0.33%
FL 1.23% 4 20293 0.65%
LA 1.90% 8 8723 0.68%
TX 1.41% 5 17170 0.65%
DON'T KNOW
Total 0.98% 18 49620 0.28%

2004 Raw Oyster Consumer Follow-up Survey: 2004 —Technical Report 78
Q40_5: Please tell me if you heard or read that message: From a Doctor, Nurse or other health professional?
Response State % n N SE+/-%
CA 100.0% 212 1727904 .
CA-So. 100.0% 179 1055372 .
FL 100.0% 325 1652789 .
LA 100.0% 353 458523 .
TX 100.0% 242 1219404 .
Total
Total 100.0% 1132 5058620 .
CA 26.69% 59 461182 3.99%
CA-So. 30.21% 52 318782 4.41%
FL 22.04% 74 364232 2.37%
LA 22.97% 80 105318 2.31%
TX 25.28% 64 308276 2.94%
YES
Total 24.49% 277 1239008 1.74%
CA 73.31% 153 1266722 3.99%
CA-So. 69.79% 127 736591 4.41%
FL 77.48% 250 1280584 2.40%
LA 76.77% 272 352005 2.32%
TX 73.84% 176 900444 2.98%
NO
Total 75.11% 851 3799755 1.74%
FL 0.48% 1 7973 0.48%
LA 0.26% 1 1200 0.26%
TX 0.88% 2 10684 0.67% DON'T KNOW
Total 0.39% 4 19856 0.23%

2004 Raw Oyster Consumer Follow-up Survey: 2004 —Technical Report 79
Q40_6: Please tell me if you heard or read that message: In a Posted Notice in fish market, raw oyster bar, or restaurant menu?
Response State % n N SE+/-%
CA 100.0% 212 1727904 .
CA-So. 100.0% 179 1055372 .
FL 100.0% 325 1652789 .
LA 100.0% 353 458523 .
TX 100.0% 242 1219404 .
Total
Total 100.0% 1132 5058620 .
CA 42.02% 96 725998 4.42%
CA-So. 30.21% 52 318782 4.41%
FL 49.14% 158 812109 2.89%
LA 47.06% 164 215797 2.73%
TX 37.56% 88 457999 3.37%
YES
Total 43.73% 506 2211903 1.97%
CA 57.98% 116 1001906 4.42%
CA-So. 69.79% 127 736591 4.41%
FL 49.40% 163 816544 2.89%
LA 52.24% 187 239511 2.73%
TX 62.18% 153 758194 3.37%
NO
Total 55.67% 619 2816156 1.98%
FL 1.46% 4 24135 0.76%
LA 0.70% 2 3215 0.51%
TX 0.26% 1 3211 0.26% DON'T KNOW
Total 0.60% 7 30561 0.26%

2004 Raw Oyster Consumer Follow-up Survey: 2004 —Technical Report 80
Q40_7: Please tell me if you heard or read that message: From Friends or Family? Response State % n N SE+/-%
CA 100.0% 212 1727904 .
CA-So. 100.0% 179 1055372 .
FL 100.0% 325 1652789 .
LA 100.0% 353 458523 .
TX 100.0% 242 1219404 .
Total
Total 100.0% 1132 5058620 .
CA 54.48% 118 941377 4.51%
CA-So. 55.76% 101 588484 4.55%
FL 52.24% 171 863387 2.89%
LA 51.29% 180 235192 2.73%
TX 54.43% 129 663686 3.43%
YES
Total 53.45% 598 2703641 2.00%
CA 45.32% 93 783093 4.51%
CA-So. 43.91% 77 463454 4.55%
FL 46.68% 151 771591 2.88%
LA 48.71% 173 223331 2.73%
TX 45.31% 112 552507 3.43%
NO
Total 46.07% 529 2330521 2.00%
CA 0.20% 1 3434 0.20%
CA-So. 0.33% 1 3434 0.33%
FL 1.08% 3 17812 0.64%
TX 0.26% 1 3211 0.26%
DON'T KNOW
Total 0.48% 5 24457 0.23%

2004 Raw Oyster Consumer Follow-up Survey: 2004 —Technical Report 81
Q40_8: Please tell me if you heard or read that message: From any other source? Response State % n N SE+/-%
CA 100.0% 212 1727904 .
CA-So. 100.0% 179 1055372 .
FL 100.0% 325 1652789 .
LA 100.0% 353 458523 .
TX 100.0% 242 1219404 .
Total
Total 100.0% 1132 5058620 .
CA 18.16% 33 313714 3.65%
CA-So. 14.92% 25 157416 3.53%
FL 9.45% 29 156143 1.74%
LA 9.90% 34 45383 1.66%
TX 11.12% 29 135548 2.09%
YES
Total 12.86% 125 650788 1.48%
CA 81.84% 179 1414190 3.65%
CA-So. 85.08% 154 897956 3.53%
FL 89.82% 294 1484543 1.80%
LA 89.54% 317 410564 1.70%
TX 88.62% 212 1080645 2.10%
NO
Total 86.78% 1002 4389942 1.49%
FL 0.73% 2 12103 0.54%
LA 0.26% 1 1200 0.26%
TX 0.26% 1 3211 0.26% DON'T KNOW
Total 0.33% 4 16514 0.19%
LA 0.30% 1 1376 0.30% REFUSED
Total 0.03% 1 1376 0.03%
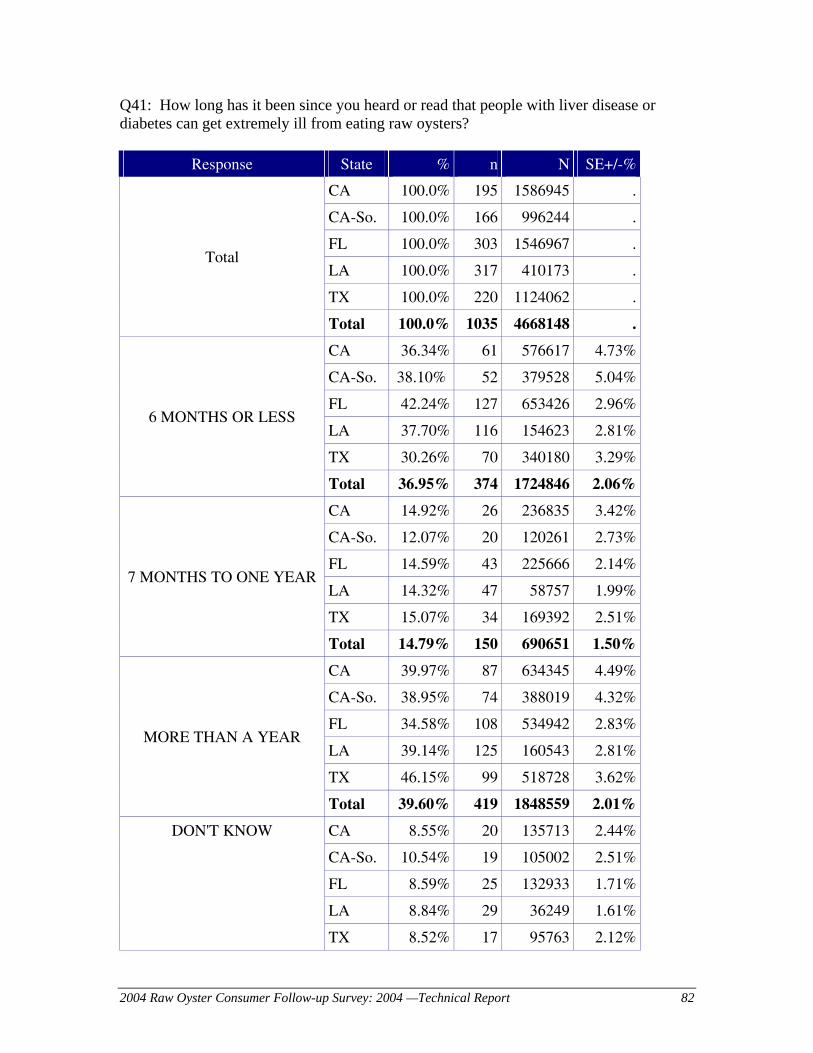
2004 Raw Oyster Consumer Follow-up Survey: 2004 —Technical Report 82
Q41: How long has it been since you heard or read that people with liver disease or diabetes can get extremely ill from eating raw oysters?
Response State % n N SE+/-%
CA 100.0% 195 1586945 .
CA-So. 100.0% 166 996244 .
FL 100.0% 303 1546967 .
LA 100.0% 317 410173 .
TX 100.0% 220 1124062 .
Total
Total 100.0% 1035 4668148 .
CA 36.34% 61 576617 4.73%
CA-So. 38.10% 52 379528 5.04%
FL 42.24% 127 653426 2.96%
LA 37.70% 116 154623 2.81%
TX 30.26% 70 340180 3.29%
6 MONTHS OR LESS
Total 36.95% 374 1724846 2.06%
CA 14.92% 26 236835 3.42%
CA-So. 12.07% 20 120261 2.73%
FL 14.59% 43 225666 2.14%
LA 14.32% 47 58757 1.99%
TX 15.07% 34 169392 2.51%
7 MONTHS TO ONE YEAR
Total 14.79% 150 690651 1.50%
CA 39.97% 87 634345 4.49%
CA-So. 38.95% 74 388019 4.32%
FL 34.58% 108 534942 2.83%
LA 39.14% 125 160543 2.81%
TX 46.15% 99 518728 3.62%
MORE THAN A YEAR
Total 39.60% 419 1848559 2.01%
CA 8.55% 20 135713 2.44%
CA-So. 10.54% 19 105002 2.51%
FL 8.59% 25 132933 1.71%
LA 8.84% 29 36249 1.61%
DON'T KNOW
TX 8.52% 17 95763 2.12%
2004 Raw Oyster Consumer Follow-up Survey: 2004 —Technical Report 83
Response State % n N SE+/-%
Total 8.58% 91 400659 1.14%
CA 0.22% 1 3434 0.22%
CA-So. 0.34% 1 3434 0.35% REFUSED
Total 0.07% 1 3434 0.07%

2004 Raw Oyster Consumer Follow-up Survey: 2004 —Technical Report 84
Q42_1: When you eat raw oysters, what steps have you taken, if any, to reduce your health risks related to eating them RAW? Avoid or eat fewer oysters in the summer months.
Response State % n N SE+/-%
CA 100.0% 348 2771358 .
CA-So. 100.0% 292 1692216 .
FL 100.0% 364 1855664 .
LA 100.0% 380 497889 .
TX 100.0% 327 1669962 .
Total
Total 100.0% 1419 6794872 .
CA 1.98% 5 54893 1.05%
CA-So. 1.83% 4 30917 1.01%
FL 5.29% 19 98104 1.22%
LA 2.06% 8 10250 0.74%
TX 5.93% 20 99111 1.41%
YES
Total 3.86% 52 262358 0.65%
CA 98.02% 343 2716464 1.05%
CA-So. 98.17% 288 1661299 1.01%
FL 94.71% 345 1757559 1.22%
LA 97.94% 372 487639 0.74%
TX 94.07% 307 1570851 1.41%
NO
Total 96.14% 1367 6532514 0.65%
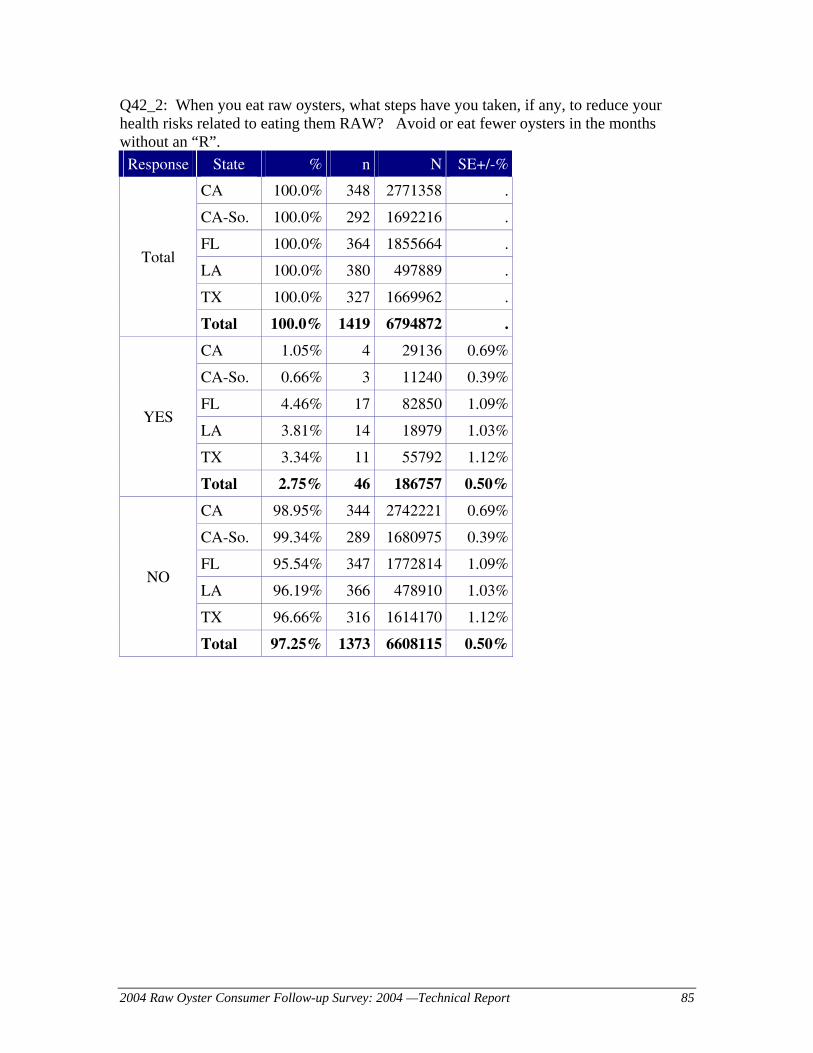
2004 Raw Oyster Consumer Follow-up Survey: 2004 —Technical Report 85
Q42_2: When you eat raw oysters, what steps have you taken, if any, to reduce your health risks related to eating them RAW? Avoid or eat fewer oysters in the months without an “R”.
Response State % n N SE+/-%
CA 100.0% 348 2771358 .
CA-So. 100.0% 292 1692216 .
FL 100.0% 364 1855664 .
LA 100.0% 380 497889 .
TX 100.0% 327 1669962 .
Total
Total 100.0% 1419 6794872 .
CA 1.05% 4 29136 0.69%
CA-So. 0.66% 3 11240 0.39%
FL 4.46% 17 82850 1.09%
LA 3.81% 14 18979 1.03%
TX 3.34% 11 55792 1.12%
YES
Total 2.75% 46 186757 0.50%
CA 98.95% 344 2742221 0.69%
CA-So. 99.34% 289 1680975 0.39%
FL 95.54% 347 1772814 1.09%
LA 96.19% 366 478910 1.03%
TX 96.66% 316 1614170 1.12%
NO
Total 97.25% 1373 6608115 0.50%

2004 Raw Oyster Consumer Follow-up Survey: 2004 —Technical Report 86
Q42_3: When you eat raw oysters, what steps have you taken, if any, to reduce your health risks related to eating them RAW? Avoid oysters from polluted waters or from places where outbreaks have recently occurred.
Response State % n N SE+/-%
CA 100.0% 348 2771358 .
CA-So. 100.0% 292 1692216 .
FL 100.0% 364 1855664 .
LA 100.0% 380 497889 .
TX 100.0% 327 1669962 .
Total
Total 100.0% 1419 6794872 .
CA 1.36% 5 37703 0.75%
CA-So. 1.17% 4 19807 0.62%
FL 1.50% 5 27846 0.69%
LA 1.75% 7 8720 0.67%
TX 2.70% 9 45125 0.97%
YES
Total 1.76% 26 119393 0.43%
CA 98.64% 343 2733655 0.75%
CA-So. 98.83% 288 1672409 0.62%
FL 98.50% 359 1827818 0.69%
LA 98.25% 373 489169 0.67%
TX 97.30% 318 1624837 0.97%
NO
Total 98.24% 1393 6675479 0.43%
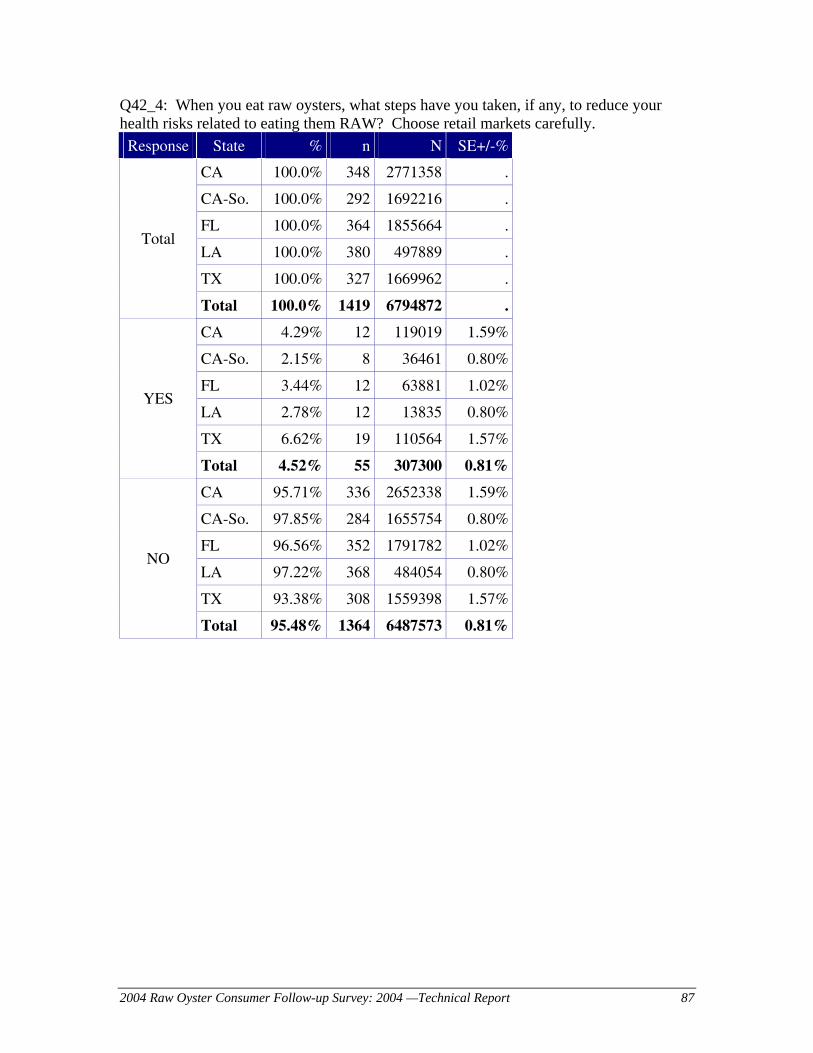
2004 Raw Oyster Consumer Follow-up Survey: 2004 —Technical Report 87
Q42_4: When you eat raw oysters, what steps have you taken, if any, to reduce your health risks related to eating them RAW? Choose retail markets carefully.
Response State % n N SE+/-%
CA 100.0% 348 2771358 .
CA-So. 100.0% 292 1692216 .
FL 100.0% 364 1855664 .
LA 100.0% 380 497889 .
TX 100.0% 327 1669962 .
Total
Total 100.0% 1419 6794872 .
CA 4.29% 12 119019 1.59%
CA-So. 2.15% 8 36461 0.80%
FL 3.44% 12 63881 1.02%
LA 2.78% 12 13835 0.80%
TX 6.62% 19 110564 1.57%
YES
Total 4.52% 55 307300 0.81%
CA 95.71% 336 2652338 1.59%
CA-So. 97.85% 284 1655754 0.80%
FL 96.56% 352 1791782 1.02%
LA 97.22% 368 484054 0.80%
TX 93.38% 308 1559398 1.57%
NO
Total 95.48% 1364 6487573 0.81%

2004 Raw Oyster Consumer Follow-up Survey: 2004 —Technical Report 88
Q42_5: When you eat raw oysters, what steps have you taken, if any, to reduce your health risks related to eating them RAW? Choose restaurants carefully.
Response State % n N SE+/-%
CA 100.0% 348 2771358 .
CA-So. 100.0% 292 1692216 .
FL 100.0% 364 1855664 .
LA 100.0% 380 497889 .
TX 100.0% 327 1669962 .
Total
Total 100.0% 1419 6794872 .
CA 11.53% 46 319497 2.02%
CA-So. 12.16% 40 205799 1.99%
FL 8.36% 28 155141 1.57%
LA 6.13% 25 30525 1.22%
TX 10.39% 30 173508 1.90%
YES
Total 9.99% 129 678671 1.04%
CA 88.47% 302 2451861 2.02%
CA-So. 87.84% 252 1486416 1.99%
FL 91.64% 336 1700523 1.57%
LA 93.87% 355 467364 1.22%
TX 89.61% 297 1496454 1.90%
NO
Total 90.01% 1290 6116201 1.04%

2004 Raw Oyster Consumer Follow-up Survey: 2004 —Technical Report 89
Q42_6: When you eat raw oysters, what steps have you taken, if any, to reduce your health risks related to eating them RAW? Check the way oysters look or smell?
Response State % n N SE+/-%
CA 100.0% 348 2771358 .
CA-So. 100.0% 292 1692216 .
FL 100.0% 364 1855664 .
LA 100.0% 380 497889 .
TX 100.0% 327 1669962 .
Total
Total 100.0% 1419 6794872 .
CA 6.58% 24 182476 1.71%
CA-So. 5.90% 20 99918 1.37%
FL 10.41% 36 193195 1.70%
LA 5.35% 20 26653 1.19%
TX 6.04% 20 100944 1.43%
YES
Total 7.41% 100 503267 0.92%
CA 93.42% 324 2588882 1.71%
CA-So. 94.10% 272 1592298 1.37%
FL 89.59% 328 1662469 1.70%
LA 94.65% 360 471236 1.19%
TX 93.96% 307 1569018 1.43%
NO
Total 92.59% 1319 6291605 0.92%
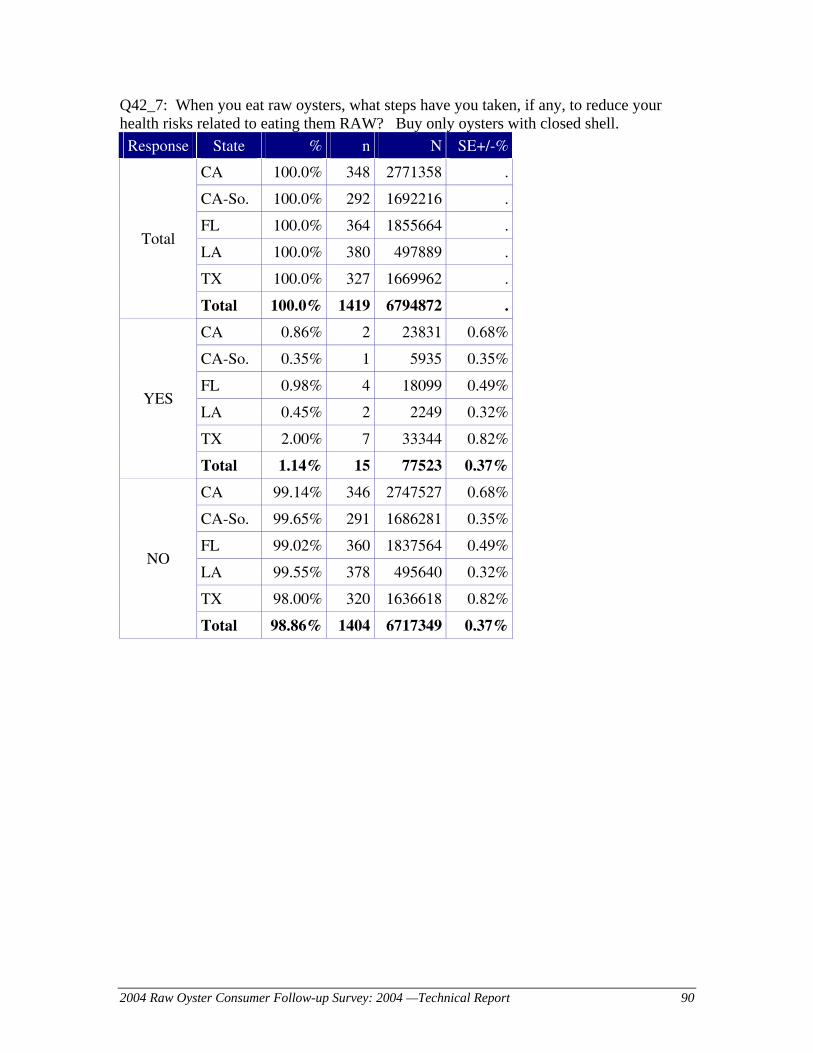
2004 Raw Oyster Consumer Follow-up Survey: 2004 —Technical Report 90
Q42_7: When you eat raw oysters, what steps have you taken, if any, to reduce your health risks related to eating them RAW? Buy only oysters with closed shell.
Response State % n N SE+/-%
CA 100.0% 348 2771358 .
CA-So. 100.0% 292 1692216 .
FL 100.0% 364 1855664 .
LA 100.0% 380 497889 .
TX 100.0% 327 1669962 .
Total
Total 100.0% 1419 6794872 .
CA 0.86% 2 23831 0.68%
CA-So. 0.35% 1 5935 0.35%
FL 0.98% 4 18099 0.49%
LA 0.45% 2 2249 0.32%
TX 2.00% 7 33344 0.82%
YES
Total 1.14% 15 77523 0.37%
CA 99.14% 346 2747527 0.68%
CA-So. 99.65% 291 1686281 0.35%
FL 99.02% 360 1837564 0.49%
LA 99.55% 378 495640 0.32%
TX 98.00% 320 1636618 0.82%
NO
Total 98.86% 1404 6717349 0.37%

2004 Raw Oyster Consumer Follow-up Survey: 2004 —Technical Report 91
Q42_8: When you eat raw oysters, what steps have you taken, if any, to reduce your health risks related to eating them RAW? Eat oysters with Tabasco sauce.
Response State % n N SE+/-%
CA 100.0% 348 2771358 .
CA-So. 100.0% 292 1692216 .
FL 100.0% 364 1855664 .
LA 100.0% 380 497889 .
TX 100.0% 327 1669962 .
Total
Total 100.0% 1419 6794872 .
CA 7.71% 26 213796 1.89%
CA-So. 8.28% 22 140056 2.21%
FL 6.35% 21 117806 1.39%
LA 8.15% 32 40577 1.42%
TX 7.19% 23 120109 1.54%
YES
Total 7.24% 102 492288 0.94%
CA 92.29% 322 2557562 1.89%
CA-So. 91.72% 270 1552160 2.21
FL 93.65% 343 1737858 1.39%
LA 91.85% 348 457312 1.42%
TX 92.81% 304 1549853 1.54%
NO
Total 92.76% 1317 6302584 0.94%

2004 Raw Oyster Consumer Follow-up Survey: 2004 —Technical Report 92
Q42_9: When you eat raw oysters, what steps have you taken, if any, to reduce your health risks related to eating them RAW? Eat oysters while drinking alcoholic beverage.
Response State % n N SE+/-%
CA 100.0% 348 2771358 .
CA-So. 100.0% 292 1692216 .
FL 100.0% 364 1855664 .
LA 100.0% 380 497889 .
TX 100.0% 327 1669962 .
Total
Total 100.0% 1419 6794872 .
CA 8.82% 22 244437 2.27%
CA-So. 9.96% 18 168614 2.97%
FL 3.68% 13 68197 1.04%
LA 3.89% 15 19380 1.00%
TX 4.55% 15 76037 1.22%
YES
Total 6.01% 65 408051 1.03%
CA 91.18% 326 2526920 2.27%
CA-So. 90.04% 274 1523601 2.97%
FL 96.32% 351 1787467 1.04%
LA 96.11% 365 478509 1.00%
TX 95.45% 312 1593926 1.22%
NO
Total 93.99% 1354 6386821 1.03%

2004 Raw Oyster Consumer Follow-up Survey: 2004 —Technical Report 93
Q42_10: When you eat raw oysters, what steps have you taken, if any, to reduce your health risks related to eating them RAW? Don’t eat them/stopped eating raw oysters. Response State % n N SE+/-%
CA 100.0% 348 2771358 .
CA-So. 100.0% 292 1692216 .
FL 100.0% 364 1855664 .
LA 100.0% 380 497889 .
TX 100.0% 327 1669962 .
Total
Total 100.0% 1419 6794872 .
CA 1.02% 2 28375 0.87%
CA-So. 0.26% 1 4399 0.26%
FL 1.83% 8 34000 0.66%
LA 1.00% 4 4970 0.52%
TX 0.15% 1 2525 0.15%
YES
Total 1.03% 15 69871 0.40%
CA 98.98% 346 2742982 0.87%
CA-So. 99.74% 291 1687817 0.26%
FL 98.17% 356 1821664 0.66%
LA 99.00% 376 492918 0.52%
TX 99.85% 326 1667437 0.15%
NO
Total 98.97% 1404 6725002 0.40%

2004 Raw Oyster Consumer Follow-up Survey: 2004 —Technical Report 94
Q42_11: When you eat raw oysters, what steps have you taken, if any, to reduce your health risks related to eating them RAW? Cook them. Response State % n N SE+/-%
CA 100.0% 348 2771358 .
CA-So. 100.0% 292 1692216 .
FL 100.0% 364 1855664 .
LA 100.0% 380 497889 .
TX 100.0% 327 1669962 .
Total
Total 100.0% 1419 6794872 .
CA 5.47% 16 151706 1.72%
CA-So. 3.85% 12 65150 1.16%
FL 3.62% 13 67173 1.01%
LA 2.54% 8 12622 0.91%
TX 1.67% 5 27935 0.81%
YES
Total 3.82% 42 259436 0.79%
CA 94.53% 332 2619652 1.72%
CA-So. 96.15% 280 1627066 1.16%
FL 96.38% 351 1788490 1.01%
LA 97.46% 372 485267 0.91%
TX 98.33% 322 1642027 0.81%
NO
Total 96.18% 1377 6535436 0.79%

2004 Raw Oyster Consumer Follow-up Survey: 2004 —Technical Report 95
Q42_12: When you eat raw oysters, what steps have you taken, if any, to reduce your health risks related to eating them RAW? Eat less often. Response State % n N SE+/-%
CA 100.0% 348 2771358 .
CA-So. 100.0% 292 1692216 .
FL 100.0% 364 1855664 .
LA 100.0% 380 497889 .
TX 100.0% 327 1669962 .
Total
Total 100.0% 1419 6794872 .
CA 2.88% 7 79926 1.37%
CA-So. 1.16% 4 19677 0.59%
FL 0.80% 4 14801 0.40%
LA 1.09% 5 5411 0.49%
TX 1.25% 4 20905 0.69%
YES
Total 1.78% 20 121043 0.60%
CA 97.12% 341 2691431 1.37%
CA-So. 98.84% 288 1672539 0.59%
FL 99.20% 360 1840863 0.40%
LA 98.91% 375 492478 0.49%
TX 98.75% 323 1649058 0.69%
NO
Total 98.22% 1399 6673829 0.60%

2004 Raw Oyster Consumer Follow-up Survey: 2004 —Technical Report 96
Q42_13: When you eat raw oysters, what steps have you taken, if any, to reduce your health risks related to eating them RAW? Other. Response State % n N SE+/-%
CA 100.0% 348 2771358 .
CA-So. 100.0% 292 1692216 .
FL 100.0% 364 1855664 .
LA 100.0% 380 497889 .
TX 100.0% 327 1669962 .
Total
Total 100.0% 1419 6794872 .
CA 15.32% 59 424660 2.40%
CA-So. 15.51% 51 262528 2.24%
FL 18.73% 70 347499 2.10%
LA 17.25% 67 85868 1.98%
TX 17.75% 58 296443 2.24%
YES
Total 16.99% 254 1154470 1.27%
CA 84.68% 289 2346698 2.40%
CA-So. 84.49% 241 1429688 2.24%
FL 81.27% 294 1508164 2.10%
LA 82.75% 313 412021 1.98%
TX 82.25% 269 1373519 2.24%
NO
Total 83.01% 1165 5640402 1.27%
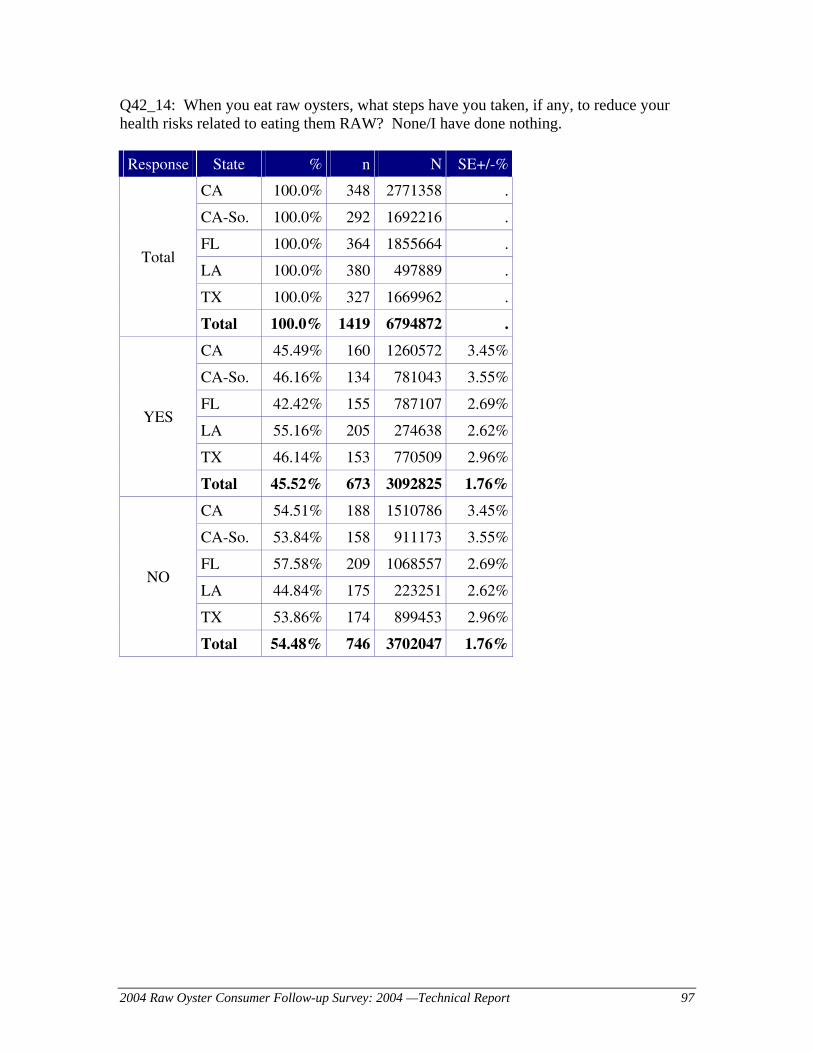
2004 Raw Oyster Consumer Follow-up Survey: 2004 —Technical Report 97
Q42_14: When you eat raw oysters, what steps have you taken, if any, to reduce your health risks related to eating them RAW? None/I have done nothing. Response State % n N SE+/-%
CA 100.0% 348 2771358 .
CA-So. 100.0% 292 1692216 .
FL 100.0% 364 1855664 .
LA 100.0% 380 497889 .
TX 100.0% 327 1669962 .
Total
Total 100.0% 1419 6794872 .
CA 45.49% 160 1260572 3.45%
CA-So. 46.16% 134 781043 3.55%
FL 42.42% 155 787107 2.69%
LA 55.16% 205 274638 2.62%
TX 46.14% 153 770509 2.96%
YES
Total 45.52% 673 3092825 1.76%
CA 54.51% 188 1510786 3.45%
CA-So. 53.84% 158 911173 3.55%
FL 57.58% 209 1068557 2.69%
LA 44.84% 175 223251 2.62%
TX 53.86% 174 899453 2.96%
NO
Total 54.48% 746 3702047 1.76%
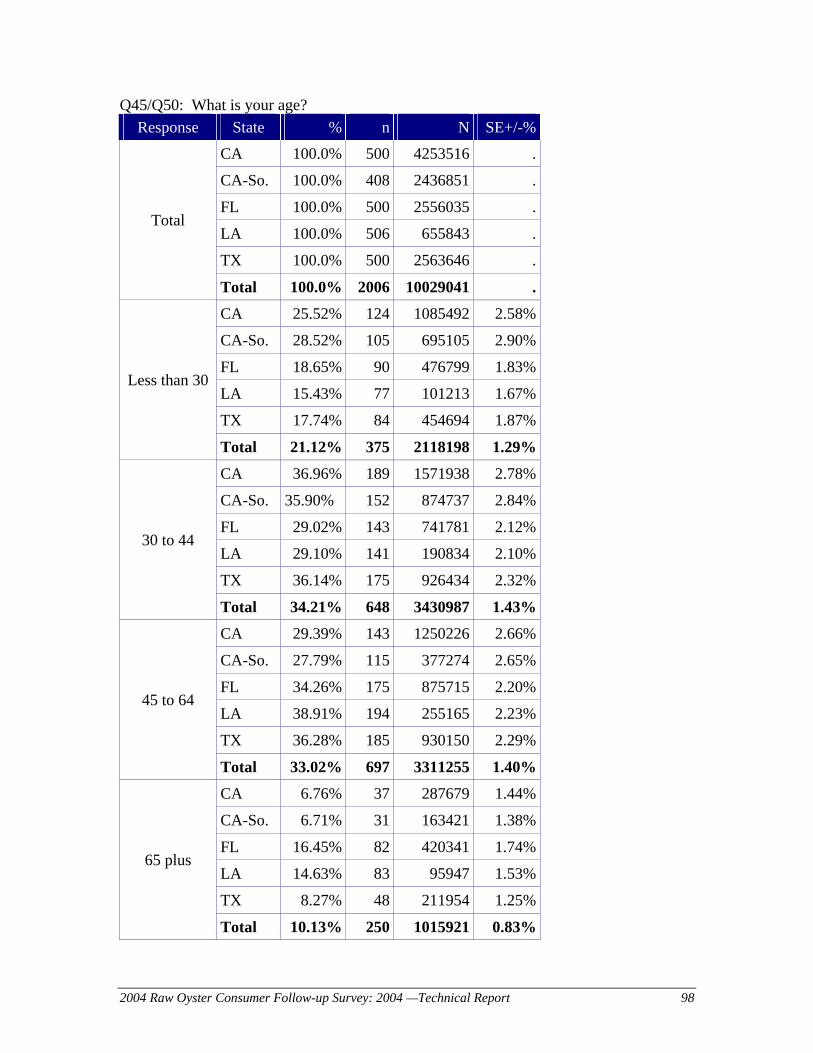
2004 Raw Oyster Consumer Follow-up Survey: 2004 —Technical Report 98
Q45/Q50: What is your age? Response State % n N SE+/-%
CA 100.0% 500 4253516 .
CA-So. 100.0% 408 2436851 .
FL 100.0% 500 2556035 .
LA 100.0% 506 655843 .
TX 100.0% 500 2563646 .
Total
Total 100.0% 2006 10029041 .
CA 25.52% 124 1085492 2.58%
CA-So. 28.52% 105 695105 2.90%
FL 18.65% 90 476799 1.83%
LA 15.43% 77 101213 1.67%
TX 17.74% 84 454694 1.87%
Less than 30
Total 21.12% 375 2118198 1.29%
CA 36.96% 189 1571938 2.78%
CA-So. 35.90% 152 874737 2.84%
FL 29.02% 143 741781 2.12%
LA 29.10% 141 190834 2.10%
TX 36.14% 175 926434 2.32%
30 to 44
Total 34.21% 648 3430987 1.43%
CA 29.39% 143 1250226 2.66%
CA-So. 27.79% 115 377274 2.65%
FL 34.26% 175 875715 2.20%
LA 38.91% 194 255165 2.23%
TX 36.28% 185 930150 2.29%
45 to 64
Total 33.02% 697 3311255 1.40%
CA 6.76% 37 287679 1.44%
CA-So. 6.71% 31 163421 1.38%
FL 16.45% 82 420341 1.74%
LA 14.63% 83 95947 1.53%
TX 8.27% 48 211954 1.25%
65 plus
Total 10.13% 250 1015921 0.83%

2004 Raw Oyster Consumer Follow-up Survey: 2004 —Technical Report 99
Response State % n N SE+/-%
CA 1.26% 6 53783 0.59%
CA-So. 0.90% 4 21915 0.47%
FL 0.79% 5 20101 0.36%
LA 1.06% 7 6963 0.40%
TX 0.98% 5 25142 0.45%
Don't Know
Total 1.06% 23 105988 0.29%
CA 0.10% 1 4399 0.10%
CA-So. 0.18% 1 4399 0.18%
FL 0.83% 5 21299 0.38%
LA 0.87% 4 5721 0.44%
TX 0.60% 3 15274 0.40%
Refused
Total 0.47% 13 46692 0.15%

2004 Raw Oyster Consumer Follow-up Survey: 2004 —Technical Report 100
Q55: Gender. Response State % n N SE+/-%
CA 100.0% 500 4253516 .
CA-So. 100.0% 408 2436851 .
FL 100.0% 500 2556035 .
LA 100.0% 506 655843 .
TX 100.0% 500 2563646 .
Total
Total 100.0% 2006 10029041 .
CA 56.87% 280 2419082 2.86%
CA-So. 60.95% 237 1485181 2.93%
FL 54.48% 253 1392581 2.30%
LA 52.28% 250 342851 2.28%
TX 57.96% 269 1485810 2.33%
MALE
Total 56.24% 1052 5640324 1.48%
CA 43.13% 220 1834434 2.86%
CA-So. 39.05% 171 951670 2.93%
FL 45.21% 246 1155481 2.30%
LA 47.72% 256 312992 2.28%
TX 42.04% 231 1077837 2.33%
FEMALE
Total 43.68% 953 4380744 1.48%
FL 0.31% 1 7973 0.31% DON'T KNOW
Total 0.08% 1 7973 0.08%
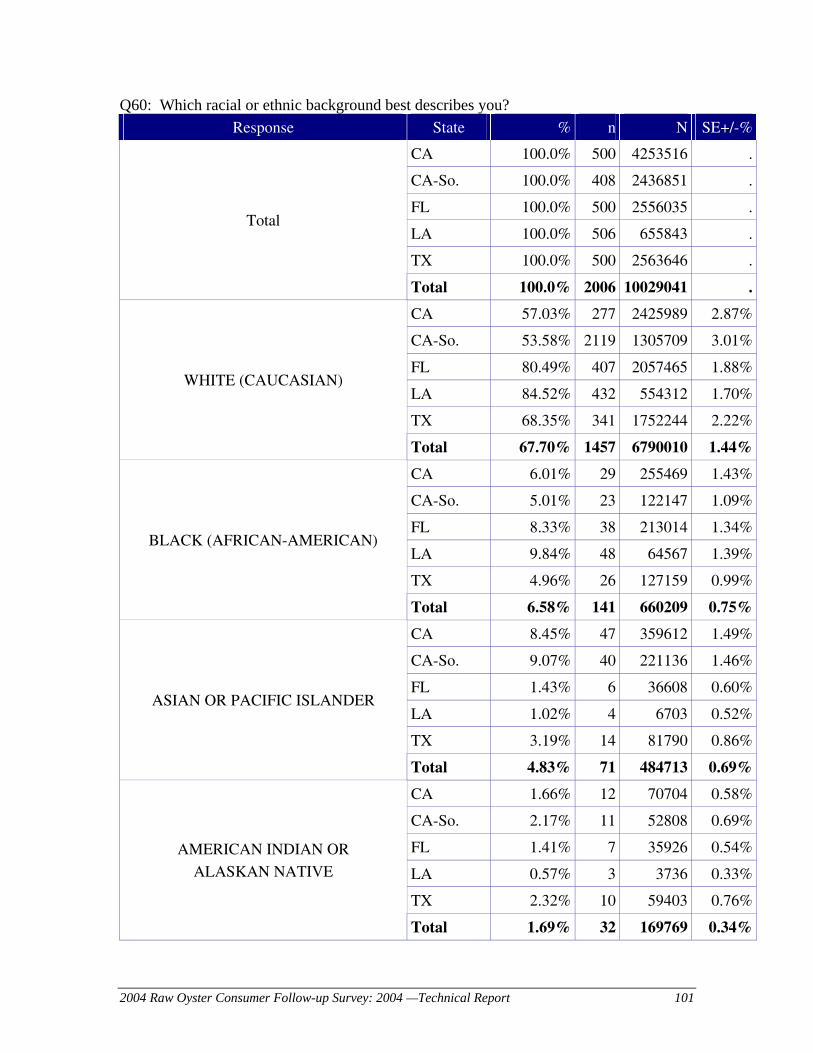
2004 Raw Oyster Consumer Follow-up Survey: 2004 —Technical Report 101
Q60: Which racial or ethnic background best describes you? Response State % n N SE+/-%
CA 100.0% 500 4253516 .
CA-So. 100.0% 408 2436851 .
FL 100.0% 500 2556035 .
LA 100.0% 506 655843 .
TX 100.0% 500 2563646 .
Total
Total 100.0% 2006 10029041 .
CA 57.03% 277 2425989 2.87%
CA-So. 53.58% 2119 1305709 3.01%
FL 80.49% 407 2057465 1.88%
LA 84.52% 432 554312 1.70%
TX 68.35% 341 1752244 2.22%
WHITE (CAUCASIAN)
Total 67.70% 1457 6790010 1.44%
CA 6.01% 29 255469 1.43%
CA-So. 5.01% 23 122147 1.09%
FL 8.33% 38 213014 1.34%
LA 9.84% 48 64567 1.39%
TX 4.96% 26 127159 0.99%
BLACK (AFRICAN-AMERICAN)
Total 6.58% 141 660209 0.75%
CA 8.45% 47 359612 1.49%
CA-So. 9.07% 40 221136 1.46%
FL 1.43% 6 36608 0.60%
LA 1.02% 4 6703 0.52%
TX 3.19% 14 81790 0.86%
ASIAN OR PACIFIC ISLANDER
Total 4.83% 71 484713 0.69%
CA 1.66% 12 70704 0.58%
CA-So. 2.17% 11 52808 0.69%
FL 1.41% 7 35926 0.54%
LA 0.57% 3 3736 0.33%
TX 2.32% 10 59403 0.76%
AMERICAN INDIAN OR
ALASKAN NATIVE
Total 1.69% 32 169769 0.34%
2004 Raw Oyster Consumer Follow-up Survey: 2004 —Technical Report 102
Response State % n N SE+/-%
CA 22.52% 113 957800 2.48%
CA-So. 25.47% 97 620676 2.80%
FL 6.75% 33 172575 1.17%
LA 2.18% 11 14307 0.67%
TX 19.80% 101 507645 1.90%
OTHER
Total 16.48% 258 1652327 1.21%
CA 0.46% 3 19602 0.27%
CA-So. 0.80% 3 19602 0.48%
TX 0.29% 2 7462 0.21% DON'T KNOW
Total 0.27% 5 27063 0.13%
CA 3.86% 19 164340 1.10%
CA-So. 3.89% 15 94772 1.25%
FL 1.58% 9 40448 0.56%
LA 1.86% 8 12218 0.66%
TX 1.09% 6 27944 0.46%
REFUSED
Total 2.44% 42 244949 0.50%
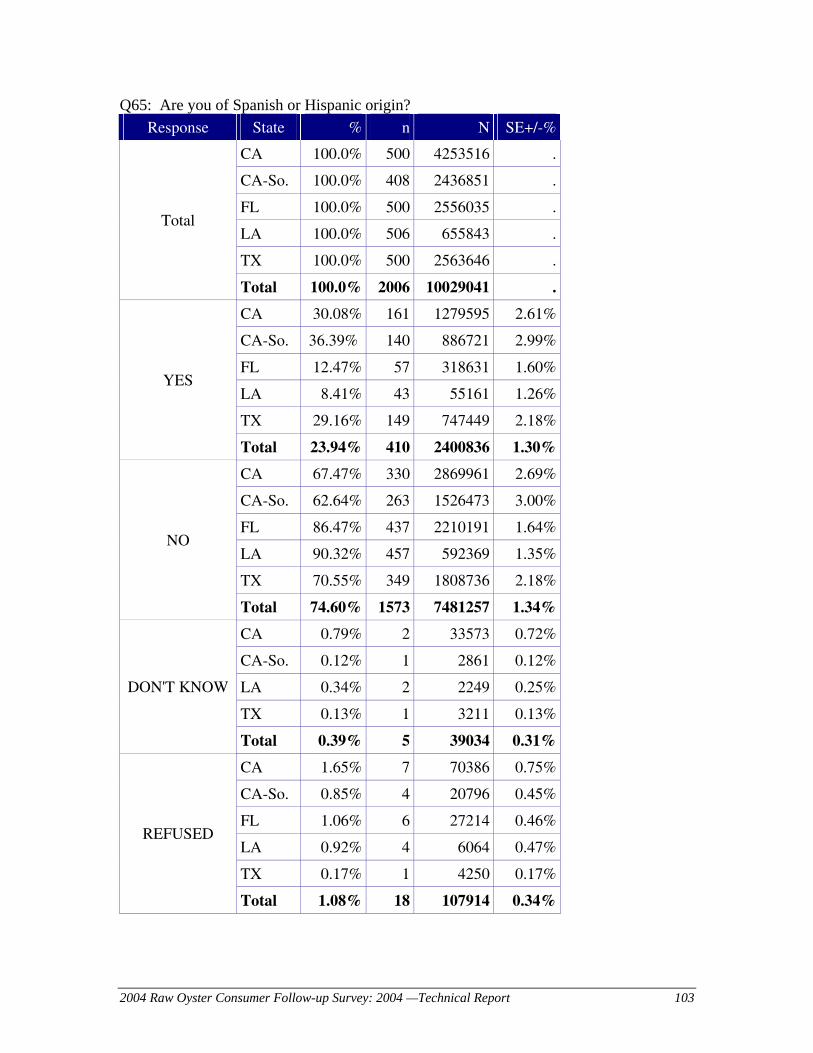
2004 Raw Oyster Consumer Follow-up Survey: 2004 —Technical Report 103
Q65: Are you of Spanish or Hispanic origin? Response State % n N SE+/-%
CA 100.0% 500 4253516 .
CA-So. 100.0% 408 2436851 .
FL 100.0% 500 2556035 .
LA 100.0% 506 655843 .
TX 100.0% 500 2563646 .
Total
Total 100.0% 2006 10029041 .
CA 30.08% 161 1279595 2.61%
CA-So. 36.39% 140 886721 2.99%
FL 12.47% 57 318631 1.60%
LA 8.41% 43 55161 1.26%
TX 29.16% 149 747449 2.18%
YES
Total 23.94% 410 2400836 1.30%
CA 67.47% 330 2869961 2.69%
CA-So. 62.64% 263 1526473 3.00%
FL 86.47% 437 2210191 1.64%
LA 90.32% 457 592369 1.35%
TX 70.55% 349 1808736 2.18%
NO
Total 74.60% 1573 7481257 1.34%
CA 0.79% 2 33573 0.72%
CA-So. 0.12% 1 2861 0.12%
LA 0.34% 2 2249 0.25%
TX 0.13% 1 3211 0.13%
DON'T KNOW
Total 0.39% 5 39034 0.31%
CA 1.65% 7 70386 0.75%
CA-So. 0.85% 4 20796 0.45%
FL 1.06% 6 27214 0.46%
LA 0.92% 4 6064 0.47%
TX 0.17% 1 4250 0.17%
REFUSED
Total 1.08% 18 107914 0.34%
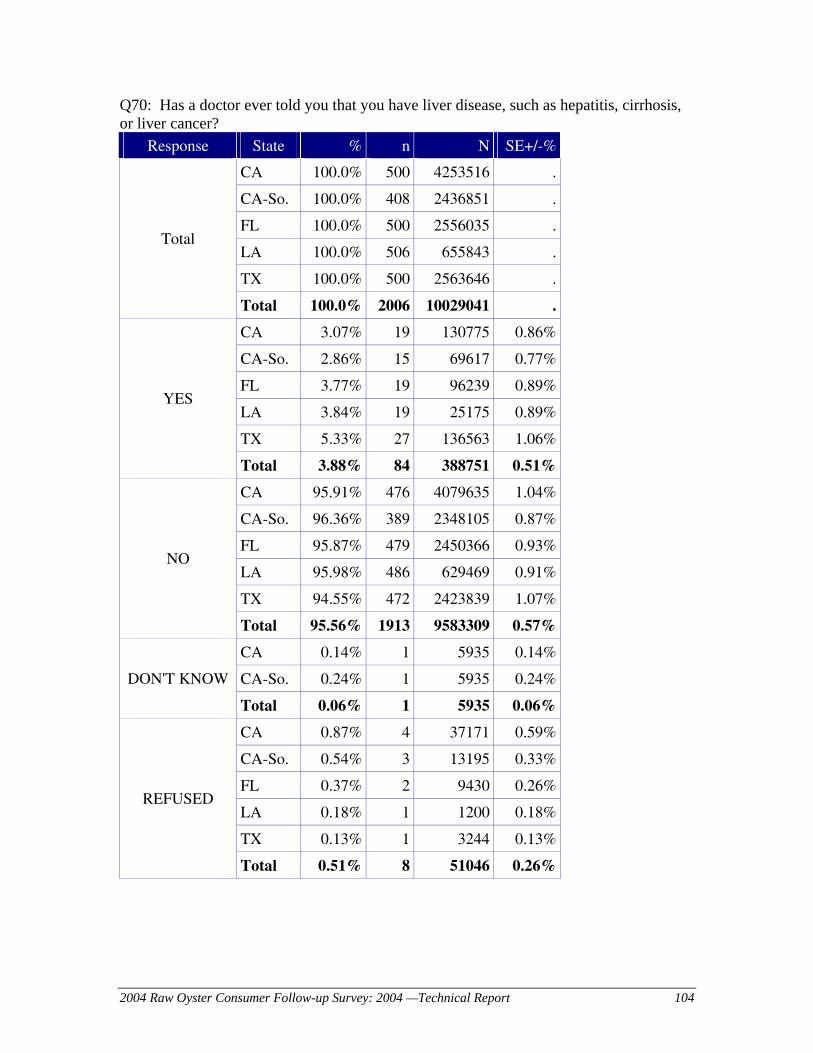
2004 Raw Oyster Consumer Follow-up Survey: 2004 —Technical Report 104
Q70: Has a doctor ever told you that you have liver disease, such as hepatitis, cirrhosis, or liver cancer?
Response State % n N SE+/-%
CA 100.0% 500 4253516 .
CA-So. 100.0% 408 2436851 .
FL 100.0% 500 2556035 .
LA 100.0% 506 655843 .
TX 100.0% 500 2563646 .
Total
Total 100.0% 2006 10029041 .
CA 3.07% 19 130775 0.86%
CA-So. 2.86% 15 69617 0.77%
FL 3.77% 19 96239 0.89%
LA 3.84% 19 25175 0.89%
TX 5.33% 27 136563 1.06%
YES
Total 3.88% 84 388751 0.51%
CA 95.91% 476 4079635 1.04%
CA-So. 96.36% 389 2348105 0.87%
FL 95.87% 479 2450366 0.93%
LA 95.98% 486 629469 0.91%
TX 94.55% 472 2423839 1.07%
NO
Total 95.56% 1913 9583309 0.57%
CA 0.14% 1 5935 0.14%
CA-So. 0.24% 1 5935 0.24% DON'T KNOW
Total 0.06% 1 5935 0.06%
CA 0.87% 4 37171 0.59%
CA-So. 0.54% 3 13195 0.33%
FL 0.37% 2 9430 0.26%
LA 0.18% 1 1200 0.18%
TX 0.13% 1 3244 0.13%
REFUSED
Total 0.51% 8 51046 0.26%

2004 Raw Oyster Consumer Follow-up Survey: 2004 —Technical Report 105
Q75: Has a doctor ever told you that you have diabetes?
Response State % n N SE+/-%
CA 100.0% 500 4253516 .
CA-So. 100.0% 408 2436851 .
FL 100.0% 500 2556035 .
LA 100.0% 506 655843 .
TX 100.0% 500 2563646 .
Total
Total 100.0% 2006 10029041 .
CA 7.12% 34 303031 1.52%
CA-So. 7.75% 28 188779 1.78%
FL 6.66% 33 170144 1.17%
LA 8.44% 45 55380 1.23%
TX 8.84% 51 226613 1.28%
YES
Total 7.53% 163 755168 0.79%
CA 92.00% 462 3913314 1.61%
CA-So. 91.71% 377 2234877 1.80%
FL 92.97% 465 2376461 1.19%
LA 91.03% 458 597014 1.26%
TX 90.66% 447 2324285 1.33%
NO
Total 91.84% 1832 9211074 0.83%
LA 0.34% 2 2249 0.25%
TX 0.37% 1 9504 0.37% DON'T KNOW
Total 0.12% 3 11753 0.10%
CA 0.87% 4 37171 0.59%
CA-So. 0.54% 3 13195 0.33%
FL 0.37% 2 9430 0.26%
LA 0.18% 1 1200 0.18%
TX 0.13% 1 3244 0.13%
REFUSED
Total 0.51% 8 51046 0.26%

2004 Raw Oyster Consumer Follow-up Survey: 2004 —Technical Report 106
Q80: Has a doctor ever told you that you have a weakened immune system? Response State % n N SE+/-%
CA 100.0% 500 4253516 .
CA-So. 100.0% 408 2436851 .
FL 100.0% 500 2556035 .
LA 100.0% 506 655843 .
TX 100.0% 500 2563646 .
Total
Total 100.0% 2006 10029041 .
CA 4.73% 27 201258 1.13%
CA-So. 4.41% 22 107539 0.99%
FL 6.33% 33 161733 1.12%
LA 4.72% 24 30964 0.97%
TX 5.99% 32 153627 1.08%
YES
Total 5.46% 116 547583 0.63%
CA 94.22% 468 4007485 1.28%
CA-So. 94.73% 382 2308515 1.08%
FL 93.30% 465 2384872 1.15%
LA 95.10% 481 623679 0.98%
TX 93.50% 465 2396965 1.12%
NO
Total 93.86% 1879 9413000 0.68%
CA 0.18% 1 7602 0.18%
CA-So. 0.31% 1 7602 0.31%
TX 0.38% 2 9810 0.27% DON'T KNOW
Total 0.17% 3 17412 0.10%
CA 0.87% 4 37171 0.59%
CA-So. 0.54% 3 13195 0.33%
FL 0.37% 2 9430 0.26%
LA 0.18% 1 1200 0.18%
TX 0.13% 1 3244 0.13%
REFUSED
Total 0.51% 8 51046 0.26%

2004 Raw Oyster Consumer Follow-up Survey: 2004 —Technical Report 107
At-Risk Respondents from all 4 states: Response State % n N SE+/-%
CA 100.0% 500 4253516 .
FL 100.0% 500 2556035 .
LA 100.0% 506 655843 .
TX 100.0% 500 2563646 .
Total
Total 100.0% 2006 10029041 .
CA 12.13% 66 516136 1.84%
FL 15.46% 77 395161 1.70%
LA 14.61% 76 95788 1.59%
TX 14.83% 84 380099 1.61%
YES
Total 13.83% 303 1387185 0.99%
CA 87.87% 434 3737380 1.84%
FL 84.54% 423 2160874 1.70%
LA 85.39% 430 560055 1.59%
TX 85.17% 416 2183547 1.61%
NO
Total 86.17% 1703 8641856 0.99%