rational preparation of faceted platinum nanocrystals ... · carbon nanotubes with remarkably...
TRANSCRIPT
Supplementary Information for
Rational Preparation of Faceted Platinum Nanocrystals Supported on
Carbon Nanotubes with Remarkably Enhanced Catalytic Performance
Ziyin Lin, Haibin Chu, Yihong Shen, Li Wei, Haichao Liu, and Yan Li*
Beijing National Laboratory for Molecular Sciences, State Key Laboratory of Rare Earth
Materials Chemistry and Application, Key Laboratory for the Physics and Chemistry of
Nanodevices, College of Chemistry and Molecular Engineering, Peking University, Beijing
100871, China
1. Synthesis and characterization of highly faceted platinum nanocrystals (HFNCs)
Multi-walled carbon nanotubes (CNTs) were purchased from Shenzhen Nanotech Port
Co. Ltd, China. A sonochemical oxidation process was performed to introduce more
carboxylic groups into CNTs. Typically 0.5 g as-received CNTs was dispersed in a
concentrated H2SO4-HNO3 mixture (80ml and 94 ml respectively together with 8ml deionized
water) and then sonicated in an ultrasonic bath (100W) at 60°C for 1 hour. After being
washed with deionized water, functionalized CNTs can be used in following steps.
A polyol method was used to prepare the highly faceted Pt nanocrystals (HFNCs), in
which ethylene glycol was the only solvent. In a typical synthesis, 3mg CNTs was dispersed
in 4.5 mL solution containing 60 mM NaNO2, and 30mM PVP (MW = 30k). The solution was
kept at 140°C for 2h. Then 0.5 mL 100 mM H2PtCl6 solution was added into the solution. The
reaction mixture was kept at 140°C for 1 hour and then cooled to room temperature. The
dispersing of HFNCs strongly depends on the solvent. When acetone was added into the
Supplementary Material (ESI) for Chemical CommunicationsThis journal is (c) The Royal Society of Chemistry 2009

solution, Pt nanoparticles were separated from the reaction solution through 10 min of
centrifugation at 6000 rpm. After dried in air, the HFNCs were dispersed in ethanol at desired
concentration. CNTs could be added to this dispersion to obtain CNT-HFNC composites with
different loading of Pt.
The morphology and crystalline structure of the products were characterized by a
JEOL-200 CX transmission electron microscope (TEM) and a Tecnai F30 high resolution
transmission electron microscope (HRTEM). The side lengths of each nanocrystal in the TEM
image were measured and the average length was used to represent the size of the
corresponding nanoparticle. The X-ray diffraction (XRD) data were recorded using a Rigaku
Dmax-2000 X-ray diffractometer by Cu kα radiation (λ=1.5406 Å) with an accelerating
voltage of 40 kV.
Figure S1 gives the TEM images of HFNC/CNT composites prepared with the NO2-/Pt
molar ratios of 5 and 7. It shows that the particle size increased with the increase of NO2-
concentration. The XRD pattern of HFNC prepared at the NO2-/Pt molar ratio of 6 is shown in
Figure S2.
Figure S1. TEM images of HFNC/CNT composites formed when the molar ratio of NO2-/Pt
is 5 (a) and 7 (b). The HFNCs’ average diameters are 7.1nm ±1.4nm (a) and 9.0nm ±1.2nm
(b), respectively.
Supplementary Material (ESI) for Chemical CommunicationsThis journal is (c) The Royal Society of Chemistry 2009

Figure S2. XRD Pattern of HFNCs
2. Discussion about the roles of NaNO2 and CNTs in the synthesis
Reactant Mixture
Figure S3. UV-vis spectra of samples taken from reaction solutions at different stage of
reaction. The inset is the spectrum of each starting materials and the mixture of them.
The ethylene glycol served as both the solvent and reductant. The reducing rate depended
strongly on the shape-controlling reagents, so did the morphology of the products. At 140°C,
the reduction was very fast without the addition of NO2-, resulting in the formation of small Pt
Supplementary Material (ESI) for Chemical CommunicationsThis journal is (c) The Royal Society of Chemistry 2009

nanospheres (Figure S4d). With the addition of NO2-, the reduction rate became smaller,
leading to the formation of HFNCs. In order to track the reaction mechanism, we conducted
the UV-Vis measurements of samples at different evolution time (Figure S3). The peak around
210 nm was a combination of the absorption of H2PtCl6, NO2-, and PVP, while the peak
around 280 was attributed to the absorption of H2PtCl6. In a typical synthesis, after the
H2PtCl6 solution was injected into the solution, the absorbance continuously decreased till the
reaction time of 210 s and the reaction solution changed from orange to light yellow. This was
ascribed to the consuming of H2PtCl6 and the formation of Pt(II) species.1 During the period
of ~ 250 s - 330 s, the color of the solution was becoming darker, indicating the formation of
HFNCs.
igure S4. TEM images of Pt nanocrystals from controlled experiments: a) N2 was bubbled F
into the solution to exclude O2; b) Instead of NaNO2, NaCl was introduced into the solution
with a Cl-/Pt molar ration of 6; c) Instead of NaNO2, NaClO4 was introduced into the solution
with a ClO4-/Pt molar ratio of 6; d) No any salt was introduced into the solution.
Supplementary Material (ESI) for Chemical CommunicationsThis journal is (c) The Royal Society of Chemistry 2009

The reduction of Pt(IV) and the formation of Pt(0) can be divided into two steps:
Pt(IV) ⇔ Pt(II) ⇔ Pt(0) (1) (2)
When the reduction rate is low, Pt(0) atoms continuously and slowly accumulate until
reaching a critical concentration. The nucleation occurs then, decreasing the concentration of
Pt atoms and halting further nucleation. However, if the formation of Pt(0) is still faster than
the consumption after the initial nucleation, the nucleation will last for a period, leading to the
formation of Pt nanoparticles with a very broad size distribution. The formation rate of Pt(0)
is determined by both step (1) and step (2). We performed several control experiments to
verify the mechanism of this system. Firstly, when N2 was bubbled into the reaction solution
to exclude the dissolved O2, it showed a relatively quicker color change and the formation of
polydispersed nanocrystals even with the presence of NO2- (Figure S4a). It is known that the
dissolved oxygen can oxidize Pt atoms to Pt (II) or Pt(II) to Pt(IV) with the aid of anions
which can form complex with Pt(II) and Pt(IV) therefore reduce the formation of Pt(0). This
indicates that oxygen etching is a key factor in slowing the reaction and the formation of
monodispersed nanoparticles with certain morphology. Secondly, when no NaNO2 was added
into the solution, once again polydispersed nanocrystals were obtained (Figure S4d). This
indicates that the presence of NO2- is another important factor. Then, what is the role of NO2
-
in the formation of HFNCs? It is predictable that Pt(IV) and Pt(II) may form complexes with
NO2- and lower the formation rate of Pt(0). Also, the oxidation property of NO2
- may further
reduce the formation of Pt(0). It was reported that Pt(NO2)62- exhibited a lower reduction rate
than PtCl62-.2 We replaced NO2
- with non-oxidative Cl-, which can also coordinate with Pt(IV)
and Pt(II) just as NO2-. As shown in Figure S4b, multi-armed Pt nanoparticles other than
HFNCs were prepared, indicating a change in reacting mechanism. Then we replaced NO2-
with ClO4-, which is a bad ligand, the shape of nanocrystals formed is just similar to that with
no salt added.
From the above discussion we can conclude that the oxygen etching, the oxidation and
coordination effect of NO2- work together to slow down the formation of Pt(0), leading to a
sudden nucleation and the formation of monodispersed nanocrystals. These particles mainly
exposed Pt (111), due to its stability in the reaction environment as a low index facet. In
Supplementary Material (ESI) for Chemical CommunicationsThis journal is (c) The Royal Society of Chemistry 2009

addition, PVP, besides serving as a protecting agent preventing nanocrystals from aggregation,
has been proved to be a stabilizing agent for Pt (111), which retards the growth of
nanocrystals along Pt (111) facet.3 Thus the nanocrystals preferentially grow on Pt (110) and
Pt (100) and are finally enclosed by Pt (111). What’s more important, the formation of atom
steps on the nanocrystals’ surface is also due to the oxidation etching of Pt by NO2- and
dissolved oxygen.
Figure S5. TEM image of HFNCs formed a) with CNTs added, and b) without CNTs added.
The ration of NO2-/Pt is 6.
The addition of CNTs into the reaction is important to improve the monodispersity of the
produced HFNCs and the reproducibility of the reaction (Figure S5). The reason is that the
addition of CNTs can introduce heterogeneous nucleation sites, and then lead to a sudden and
uniform nucleation of Pt(0), which is beneficial to the formation of monodispersed
nanoparticles. When carbon black was used instead of CNTs in the preparation of Pt
nanoparticles, similar results were obtained. This indicates that our discussion about the role
of CNTs in the preparation of HFNCs is reasonable.
3. Preparation of Pt nanospheres/CNTs used as a comparison sample in electrocatalytic
study
3mg CNTs was dispersed in 4.8 mL EG solution containing 3mM PVP (MW = 30k). No
Supplementary Material (ESI) for Chemical CommunicationsThis journal is (c) The Royal Society of Chemistry 2009

NaNO2 was added. The solution was placed into an oil bath at 140°C for 2h. 0.05mL of
100mM H2PtCl6 solution was then added. The reaction was held in the oil bath for 1 hour. The
Pt nanosphere/CNT composites were separated by centrifugation, and then washed with
ethanol for 3 times. The TEM image of the sample was shown in Figure S6.
Figure S6. TEM image of Pt nanosphere/CNT sample
4. Electrochemical studies of the HFNC/CNT composites
The electrochemical measurements were conducted in a thermostated standard
three-compartment electrochemical cell, using a disc electrode setup with a potentiostat and
rotation control (Pine). An AgCl/Ag electrode (SCE) was used in all experiments. A Pt wire
was used as the counter electrode. The electrolyte of 0.1 M HClO4 was prepared using
distilled water and concentrated HClO4 (Aldrich).
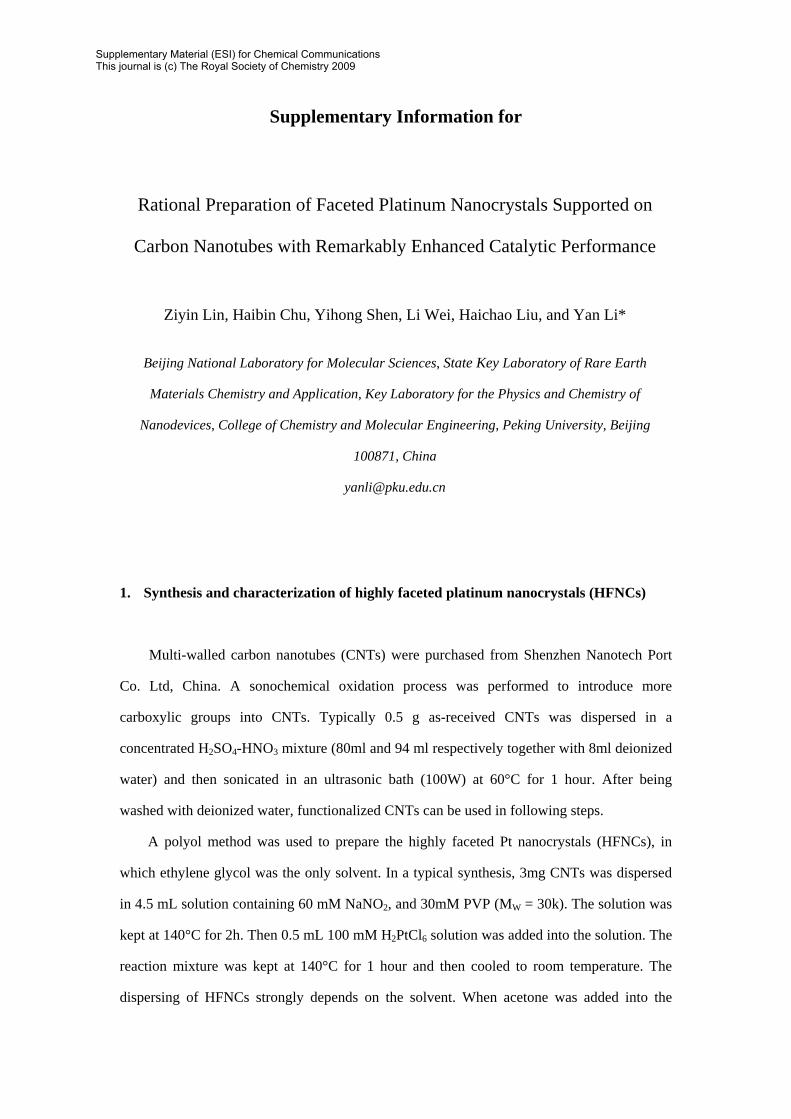
Figure S7 shows the current-potential curves of the HFNC/CNT sample and the
comparison Pt nanosphere/CNT sample for oxygen reduction reaction (ORR) recorded at
room temperature with a scanning rate of 5 mV/s in O2-saturated HClO4 solution (0.1 M) with
the rotation speed of 1600rpm. Figure S8 is the cyclic voltammograms of the two samples
with a scanning rate of 100 mV/s in N2-saturated HClO4 solution (0.1 M).
Supplementary Material (ESI) for Chemical CommunicationsThis journal is (c) The Royal Society of Chemistry 2009
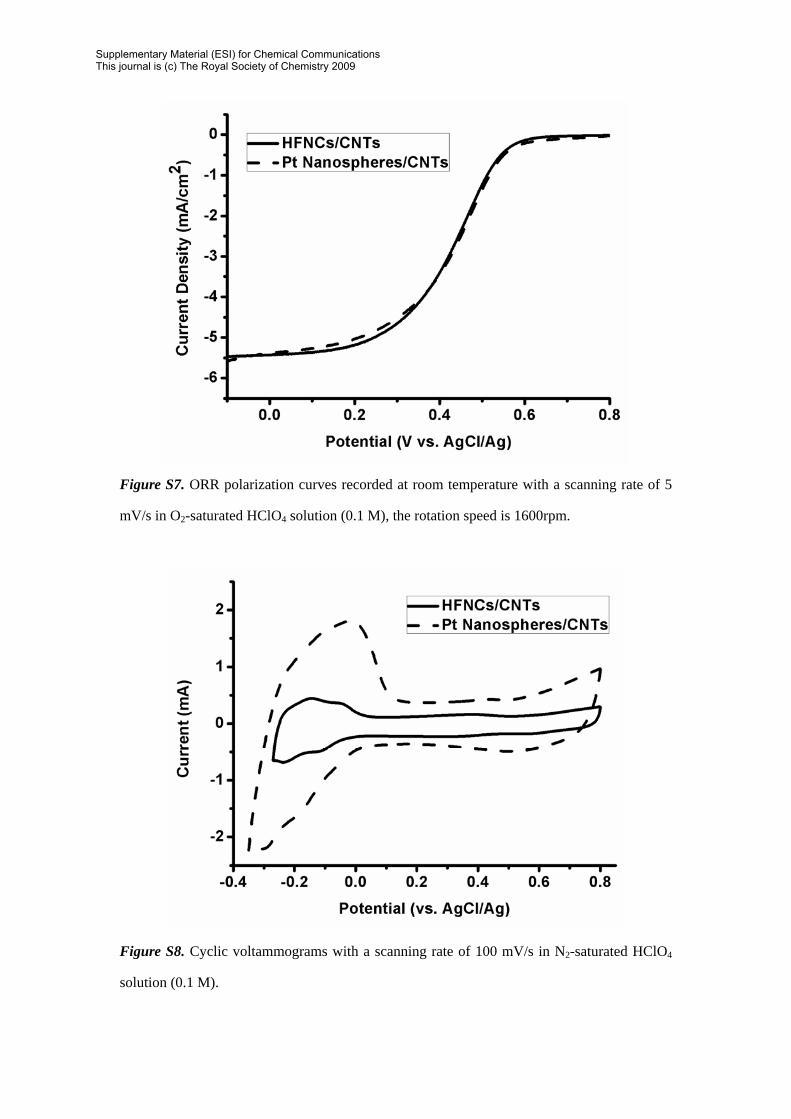
Figure S7. ORR polarization curves recorded at room temperature with a scanning rate of 5
mV/s in O2-saturated HClO4 solution (0.1 M), the rotation speed is 1600rpm.
Figure S8. Cyclic voltammograms with a scanning rate of 100 mV/s in N2-saturated HClO4
solution (0.1 M).
Supplementary Material (ESI) for Chemical CommunicationsThis journal is (c) The Royal Society of Chemistry 2009

5. HFNCs/CNTs as catalysts for selective oxidation of glycerol
Oxidation of glycerol was carried out at atmospheric pressure in a thermostat glass
reactor (100 cm3) equipped with magnetic stirrer, thermocouple, and gas supply system.
About 40 cm3 of 2 wt% of glycerol solution and 0.025 g catalyst were added into the reactor.
Constant flow of oxygen (65 cm3/min) was introduced into the suspension when the
temperature reached 60 oC. The aqueous solution was separated by filtration and analyzed
using a high-performance liquid chromatography with photodiode array detector (PAD) and
Alltech OA-1000 column (HPLC, Shimadzu LC-20A series). All products were confirmed by
the UV spectra and retention times of the standard products purchased from Alfa SIGMA,
Aesar and TCI.
References
1. Herricks T.; Chen J. Y.; Xia Y. N. Nano Lett. 2004, 4, 2367-2371.
2. Turkevich J.; Miner R. S. Jr.; Babenkova L. J. Phys. Chem 1986, 90, 5765-4767.
3. Tao A. R.; Habas S.; Yang P. D. Small 2008, 4, 310-325.
Supplementary Material (ESI) for Chemical CommunicationsThis journal is (c) The Royal Society of Chemistry 2009