rate adaptation in congested wireless networks through real
TRANSCRIPT

1
Rate Adaptation in Congested WirelessNetworks through Real-Time Measurements
Prashanth A.K. Acharya†, Ashish Sharma†, Elizabeth M. Belding†,Kevin C. Almeroth†, Konstantina Papagiannaki‡
†Department of Computer Science, University of California, Santa Barbara CA 93106‡Intel Research, Pittsburgh PA 15213
{acharya, asharma, ebelding, almeroth}@cs.ucsb.edu, [email protected]
✦
Abstract —Rate adaptation is a critical component that impacts theperformance of IEEE 802.11 wireless networks. In congested networks,traditional rate adaptation algorithms have been shown to choose lowerdata-rates for packet transmissions, leading to reduced total networkthroughput and capacity. A primary reason for this behavior is the lackof real-time congestion measurement techniques that can assist in theidentification of congestion related packet losses in a wireless network.In this work, we first propose two real-time congestion measurementtechniques, namely an active probe-based method called ChannelAccess Delay, and a passive method called Channel Busy Time. Weevaluate the two techniques in a testbed network and a large WLANconnected to the Internet. We then present the design and evaluationof Wireless cOngestion Optimized Fallback (WOOF), a rate adaptationscheme that uses congestion measurement to identify congestionrelated packet losses. Through simulation and testbed implementationwe show that, compared to other well-known rate adaptation algorithms,WOOF achieves up to 300% throughput improvement in congestednetworks.
1 INTRODUCTION
The proliferation of IEEE 802.11 networks in recent yearsdemonstrates a dramatic shift in the primary mechanism forInternet access. According to a survey conducted by thePew Internet Project in February 2007, about one-third ofthe population of Internet users in the USA connect viawireless networks [1]. IEEE 802.11 networks, in the formof WLANs or city-wide multihop mesh networks, are nowexpected to support the connectivity requirements of hundredsto thousands of users simultaneously.
The increased usage of 802.11 networks and devices,however, exposes many problems in current networks. IEEE802.11 is a CSMA/CA based medium access scheme. All theusers in the vicinity of each other share the medium as acommon resource. A large number of users in a network canlead to excessive load or congestion in the network. Jardoshet al. present an example case study of a large congestedWLAN and describe the adverse effects of such congestion [2].In this network, more than 1000 clients attempted to use thenetwork simultaneously. The network could not sustain thishigh load: users obtained unacceptably low throughput, andmany users were unable to even maintain association withthe access points (APs). Eventually the network broke down,causing frustration among the users.
Congestion has an adverse impact on currentrate adap-tation algorithms, an important aspect of the IEEE 802.11MAC protocol that determines the network throughput. In amulti-rate 802.11 network, rate adaptation is the operation ofselecting the best transmission rate, and dynamically adaptingthis selection to the channel quality variations. The data ratesoffered by 802.11a/b/g networks vary from a low of 1 Mbpsto the high rate of 54 Mbps. This wide range in the choice ofdata rates makes the behavior of the rate adaptation algorithmcritical to the throughput performance, especially in congestedscenarios. Current rate adaptation solutions are typically de-signed for operation in uncongested networks, where packetloss is more likely to correlate with poor link quality ratherthan congestion. These solutions have been shown to exhibitinferior performance in congested networks [3], [4]. Thesesolutions do not distinguish congestion-related packet lossesfrom those caused by poor link quality, and react to all packetlosses by switching to a lower transmission rate. This rateswitch, in turn, increases the channel occupancy time of packettransmissions and adds to the already existing congestion.
In this work, our goal is to design a rate adaptation schemethat provides high network performance in congested networksas well as lightly-loaded networks. In order to design such arate adaptation scheme, however, our approach is to developmechanisms that can identify and measure the network con-gestion level in real-time. Traditional metrics, such as networkthroughput, do not accurately characterize congestion in awireless network because of the locally shared channel and theuse of multiple transmission rates. Current congestion metricsproposed for wireless networks are processor intensive, and,therefore, are not suitable for real-time operation. Hence, thereis a need for lightweight congestion measurement solutionsthat can identify congestion in a wireless network in real-time. These mechanisms enable the rate adaptation scheme torespond to the network congestion levels and make intelligentdecisions about the choice of transmission rate. In summary,we require congestion measure congestion measurement so-lutions to assist in the development of of a congestion-awarerate adaptation scheme.
To this end, we present a measurement-driven approach tothe characterization of congestion in wireless networks and to
2
the design of a congestion-aware rate adaptation scheme. Ourtwo main contributions are as follows. First, we develop twomeasurement techniques that can identify wireless networkcongestion in real-time. The first technique is active andmeasures thechannel access delay, the minimum time delayfor a packet transmission in the network. The second techniqueis passive and measures thechannel busy time, the fraction oftime for which the medium was utilized during some timeinterval. We evaluate and compare the performance of thesetechniques in a testbed as well as a large WLAN with activeusers connected to the Internet. We show that the channel busytime can accurately measure network congestion in real-time.
Second, we present the design and implementation of a newrate adaptation scheme called Wireless cOngestion OptimizedFallback (WOOF). This scheme uses the channel busy timemetric in real-time to probabilistically differentiate betweenpacket losses due to congestion and those due to poor linkquality. Our testbed evaluations in congested wireless net-work scenarios show that WOOF obtains significantly higherthroughput (up to a three fold improvement) compared tocurrent solutions. Simulations further show that WOOF isable to offer significant performance improvements in largeWLANs with hundreds of users.
In a prior version of this work, we presented the design andevaluation of the channel busy time metric [5]. Further, wepresented the design and initial results from the evaluationof the WOOF rate adaptation algorithm. In this work, weextend our exploration of congestion measurement techniques,and also perform comprehensive performance evaluations tounderstand the robustness and scalability of the WOOF al-gorithm. In particular, we present Channel Access Delay, analternate technique for real-time identification of congestion inwireless networks. In addition, we compare the performanceofWOOF against that of Collision-Aware Rate Adaptation [6], analgorithm designed with goals similar to ours. We demonstratethe utility of incremental adoption of WOOF. Further, wepresent results from simulation-based performance evaluationsof WOOF in large scale networks.
The remainder of the paper is organized as follows. Sec-tion 2 surveys the literature on rate adaptation algorithmsforIEEE 802.11 networks. Section 3 describes the different con-gestion measurement methods. We evaluate the performanceof these methods in Section 4. Sections 5 and 6 describe thedesign and evaluation of the WOOF scheme. We conclude thepaper in Section 7. Throughout the paper, we use the termdata rate to refer to the rate of transmissions in the wirelessnetwork as governed by the physical layer signal modulationscheme.
2 STATE-OF-THE-ART IN RATE ADAPTATION
Rate adaptation in a multi-rate IEEE 802.11 network is thetechnique of choosing the best data rate for packet transmis-sion under the current channel conditions. The IEEE 802.11standard does not specify the details of the rate adaptationalgorithm to be used. Thus IEEE 802.11 card vendors andresearchers have proposed and implemented a variety of rateadaptation algorithms.
The probability of successful transmission of a packet for agiven data rate can be modeled as a function of the Signal-to-Noise Ratio (SNR) of the packet at the receiver [7]. A packetcan be transmitted at a high data rate if the SNR at the receiveris high and the packet can be received without errors. On theother hand, if the SNR is not high, a lower data rate helpsachieve more robust communication. Therefore, one of theideal metrics to base the choice of transmission data rate istheSNR of a packet at the receiver. However, under current IEEE802.11 implementations, it is not trivial for the transmitter toaccurately estimate the SNR at the receiver because signalstrength exhibits significant variations on a per-packet basis.This has led to the development of various solutions thatattempt to estimate link quality through other metrics.
Receiver-Based Auto Rate (RBAR) [8] is a rate adaptationscheme that proposes use of the RTS-CTS handshake by areceiver node to communicate the signal strength of receivedframes. The receiver measures the signal strength of the RTSmessage and uses this information to select an appropriatedata rate for transmission of the data frame. The transmitter isinformed of the selected data rate through the CTS message.A drawback of this scheme is that it cannot be used in modern802.11 networks where the RTS-CTS messaging is generallydisabled. Additionally, RBAR requires modification to theformat of the CTS message, which in many cases necessitatesmodification of hardware and is thus infeasible.
A recent work by Judd et. al. uses the property of channelreciprocity to estimate the signal strength at the receiver, basedon local measurements of received signal strength [9]. Thisapproach requires exchange of information such as noise floor,transmit power among the nodes in the network, similar to theRTS-CTS messaging of RBAR.
At the transmitter node, the most commonly used infor-mation to help in choosing a data rate is the packet lossinformation (i.e., when an ACK is not received). Auto-RateFallback (ARF) was among the first rate adaptation schemesthat was practically implemented [10]. ARF interprets patternsof packet loss (e.g., four consecutive losses) as triggers tochange the data rate. Several other rate adaptation schemes,such as AARF [11], also use packet loss patterns for rateadaptation decisions. Most current 802.11 devices implementARF or variations of ARF [6]. Recent work such as Sam-pleRate [12] shows that ARF and AARF perform poorly forlinks that are not always 100% reliable. Therefore SampleRateuses a statistical view of packet loss rates over a periodof time (e.g. 2s in [12]) to choose the rate with the leastexpected transmission time. We describe SampleRate in detailin Section 5.3.
A common feature among all the above described rateadaptation schemes is that they consider all packet losses tobe due to poor link quality. They do not distinguish betweenpacket losses caused by channel quality and packet lossescaused by either hidden terminal transmission or congestion.Ideally, the rate adaptation algorithm should only consider thepacket losses due to poor channel conditions, multipath effects,fading, etc. Packet losses due to hidden terminals or congestionshould not affect the rate adaptation algorithm. On observingpacket loss, a rate adaptation scheme that does not distinguishthe cause of the packet loss reduces the transmission data

3
rate. In the case of packet loss due to congestion or hiddenterminals, such a reduction of data rate is unnecessary. Evenworse, the lower data rate increases the duration of packettransmission, therebyincreasingcongestion and the probabil-ity of a packet collision. Additional collisions result in packetloss, which leads to further reduction in data rate.
The challenge for a rate adaptation algorithm is to be ableto identify the cause of a packet loss, i.e., whether a packetwas lost because of a bad link, hidden terminal or congestion.In the absence of such a distinction, rate adaptation algorithmsmay actually compound network congestion [4]. In our work,we attempt to probabilistically identify congestion-relatedpacket losses and minimize their impact on rate adaptation.
Two rate adaptation algorithms, namely Robust Rate Adap-tation Algorithm (RRAA) [13] and Collision-Aware RateAdaptation (CARA) [6], are designed to minimize the im-pact of packet losses that are not due to channel errors.RRAA selectively uses RTS-CTS handshaking to avoid hiddenterminal collisions. RRAA was not designed to explicitlyhandle congestion-related losses in the network. On the otherhand, CARA builds upon ARF [10] and suggests the use ofan adaptive RTS-CTS mechanism to prevent losses due tocontention. However, CARA requires turning on the RTS-CTS mechanism for the first retransmission of a packet, i.e.,upon failure of the first transmission attempt. Most currenthardware does not support this facility and thus may requiremodification. In contrast, our solution is implemented purelyin software. Moreover, CARA is built upon ARF and thusinherits the problems of ARF, where it uses patterns of packetloss for adaptation decisions. This has been shown to lead toincorrect rate selection [13].
An orthogonal approach to address the problem is tomodify the contention resolution mechanism of IEEE 802.11and minimize the congestion-related losses. The Idle Senseprotocol [14] adjusts the contention-window parameters ofa node to reduce packet collisions. This method enables anode to estimate collision rate, from which it can estimate theframe error rate due to poor channel conditions. Idle Sense,however, requires each node to measure the number of idleslots between transmissions - this requires a firmware update,and is not possible on many hardware platforms. Further, IdleSense requires modification to the 802.11 DCF mechanism; itsinteraction with other existing 802.11 devices is not clear. Acomparison of our solution with that of Idle Sense is beyondthe scope of this work.
Based on the above discussion, we note that while metricssuch as SNR and idle slots provide valuable input for arate adaptation algorithm, the complexity of implementationand the associated overhead makes it difficult to develop apractical solution. On the other hand, we show that the networkutilization metric can measure congestion locally, in real-time,and with low overhead. Therefore, it serves as a suitable metricthat can be used in the design of a congestion-aware rateadaptation algorithm. Our scheme, Wireless cOngestion Opti-mized Fallback (WOOF) is implemented on existing hardware,and we show that WOOF can coexist with current 802.11implementations.
We next discuss two techniques to measure congestionlevels in a wireless network in real-time. Later, in Section5,
we describe the design of a rate adaptation scheme that usesthese measurement techniques to adapt to congestion.
3 CONGESTION MEASUREMENT
Congestion on the wired Internet is caused when the offeredload on a link approaches the capacity of the network link.Similarly, congestion in IEEE 802.11 wireless networks maybe defined as a state where the shared wireless medium is closeto being fully utilized by the nodes, because of given channelconditions and/or external interference, while operatingwithinthe constraints of the 802.11 protocol [4].
Identification of congestion in wireless networks presentsnew challenges as compared to wired networks. The sharednature of the wireless medium causes a node to sharethe transmission channel not just with other nodes in thenetwork, but also with external sources of interference. Unlikewired networks, where throughput degradation on a networklink is indicative of congestion, throughput degradation inwireless networks can occur due to a lossy channel, increasedpacket collisions during congestion or external interference.In addition, throughput of a wireless link is also directlyinfluenced by the rate adaptation algorithm through its choiceof transmission data rate. Clearly, if a lower data rate is inuse, the throughput for a given time interval will be lowerthan with a high data rate. Traditional rate adaptation schemesfor 802.11 networks fail to identify congestion related packetlosses from poor channel quality and resort to the use oflower data rates. In the case when the medium is heavilyutilized by a large number of users, packet losses occurprimarily due to congestion. The use of a lower data rateincreases the transmission time for the same packet size,further degrading network performance [3], [15].
For the above reasons, the time available to a node fortransmission, governed by the current medium utilizationlevel, characterizes congestion in a wireless network betterthan the observed throughput. Several studies have proposedthe use of medium utilization as a measure of congestion inthe wireless medium [4], [16], [17]. Jardosh et al. show thatmedium utilization can be used to classify network state asuncongested, moderately congestedandhighly congested[4].Hu and Johnson suggest the use of MAC layer utilizationinformation as one of the metrics for route selection ina multi-hop wireless network [16]. They also suggest useof the utilization metric to trigger the Explicit CongestionNotification (ECN) feature of TCP for better throughput incongested wireless networks. AQOR is an admission controlscheme for multihop wireless networks that uses mediumutilization information for flow admission decisions [17].
There are two possible approaches to measuring mediumutilization in real time:active probingand passive measure-ment. While an active approach relies on sending probe pack-ets to determine the state of the network, a passive approachmonitors a system variable, and then uses that to determinethe current network state.
In this paper, we implement and evaluate two real-time con-gestion measurement techniques for wireless networks. Thefirst is an active technique that measures thechannel accessdelay, the minimum time delay for a packet transmission in
4
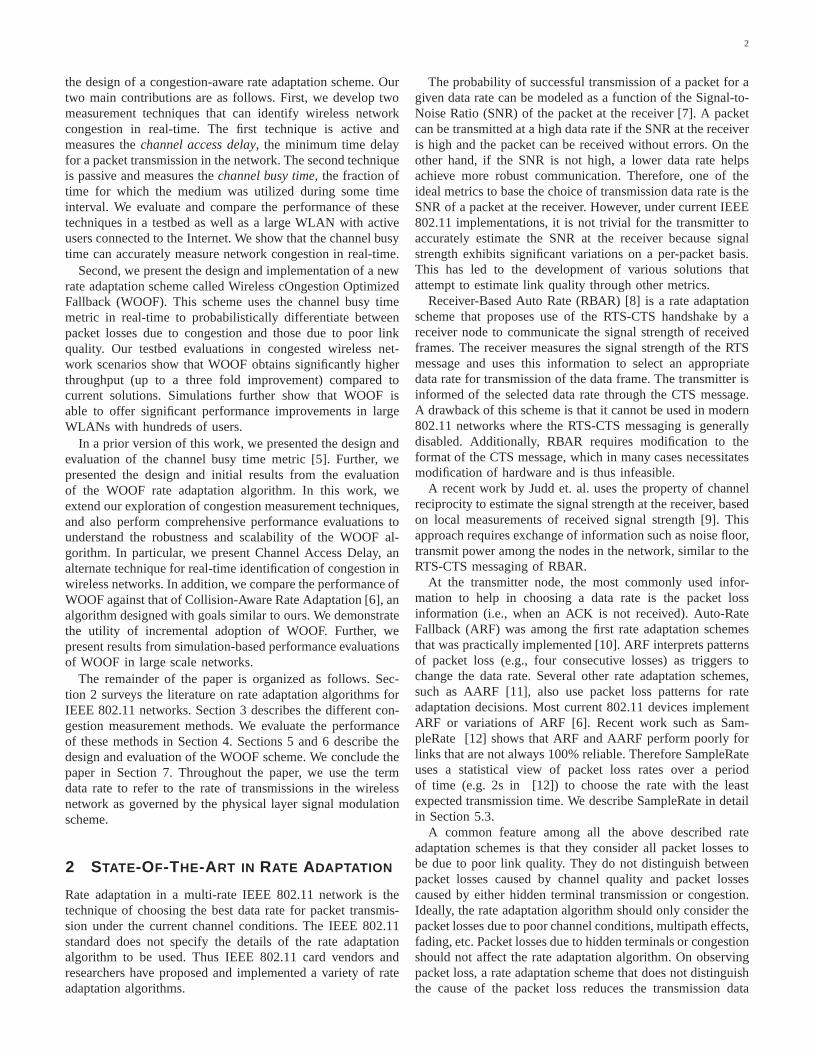
(a) Channel access delay (b) Total delay experienced by an 802.11 node
Fig. 1. Per packet channel access delay vs total delay for an 802.11 node.
the network at any instant. The second technique is passive innature and measureschannel busy time, the fraction of timefor which the medium was utilized, during some time interval.
3.1 Channel Access Delay: An Active ApproachChannel Access Delay (CAD) refers to the minimum delaybetween the time a packet is delivered to the 802.11 hardwareby the device driver and the time when the medium isfirst detected to be idle for transmission. Intuitively, if themedium is heavily utilized, the probablity that the probingnode experiences a higher channel access delay will be higheras compared to a scenario when the medium utilization is low.Thus, CAD values in a given time period can provide usefulinsight into the cause of packet loss experienced by a nodeand may be used in network debugging, rate adaptation andcongestion measurement. We evaluate the utility of channelaccess delay to obtain an estimate of the current congestionlevel in the vicinity of the node by monitoring the CAD valuesfor transmitted probe packets sent at regular intervals.
As shown in Figure 1, the definition of the channel accessdelay is different from the total delay an 802.11 node ex-periences to transmit a packet successfully. The latter valueincludes the time spent by the node in the random backoffphase and the delays experienced by the packet in the devicedriver and hardware queues. Thus it is necessary to isolate theindividual backoff and queuing delay values before calculatingchannel access delay.
To this end, we developed a tool to accurately computethe channel access delay, based on the framework providedby MadMAC [18], an extension to the open source Mad-Wifi driver for Atheros chipset-based 802.11 devices. UsingMadMAC, we control the random backoff by setting theCWmin and CWmax parameters to one (minimum allowed fordata queues) and disable retransmission of packets. Queuingdelay at the hardware queues is avoided by limiting thequeue size to one. This is achieved by controlling the rate atwhich the device driver delivers the packets to the hardwarefor transmission. We measure the channel access delay bytimestamping two network events for the transmission of eachprobe packet:
1) The local time (Tx) at a node when the device driverdelivers a packet to the 802.11 card for transmission.
2) The local time (TxStart) at a node when an interrupt isreceived from the 802.11 device indicating successfulinitiation of transmission of the probe packet by thehardware.
The channel access delay can then be computed as:
CAD = TxStart − Tx (1)
We use fixed-size broadcast packets (to prevent retransmis-sions) for probing that are transmitted at a fixed bit-rate. Theabsolute value of CAD also depends on the Distributed InterFrame Spacing (DIFS) interval and the slot time which maydiffer based on the 802.11a/b/g mode of operation.
It is important to note that channel access delay for anyprobe packet is dependent on the instantaneous network activ-ity in the wireless medium. For instance, if a packet is deliv-ered to the hardware for transmission during an ongoing neigh-boring transmission, the channel access delay will depend onthe time it takes for the neighboring transmission to finish.Thus individual values are susceptible to high variabilityandare unlikely to accurately reflect current medium utilizationlevels. However, the distribution of a number of CAD valuesmeasured within a short time interval enables us to estimatethecurrent congestion level of the network. While on one hand,the distribution of CAD values obtained from a large numberof samples yields a more representative statistical view ofthecurrent channel conditions, this also adds to the overhead dueto probe packets. Clearly, such an active probing techniquehas an inherent tradeoff between the estimation accuracy andthe overhead of probe packets in a time interval further addingto congestion.
We use theBaumgartner-Weiß-Schindler (BWS)statisticaltest [19] to estimate if the medium utilization is abovea given threshold. This is achived by comparing the em-pirical distribution of CAD values obtained during a liveexperiment with a known distribution for different mediumutilization levels and data rates at which the packets aresent, obtained during the training session on our testbed.The BWS test is a well known nonparametric statisticaltechnique used in the field of biometrics to determine theprobability that two individually collected sets of empiricaldata belong to the same underlying distribution. This nonpara-metric test uses the difference between empirical distributionfunctions, and this quantity is weighed by its variance. Sucha test avoids any assumptions on the distribution under-lying the observed data. It also performs well even withsmall sample sizes in complex systems where there is noa priori information available about the distribution fromwhich the measured data originate. Section 4.3.1 describesour methodology and the performance of the BWS test indetail.
5
3.2 Channel Busy Time: A Passive Approach
Channel Busy Time (CBT) refers to the fraction of time forwhich the wireless channel is busy within a given interval.As measured at a wireless device, it includes the time fortransmission of packets from the device, reception of packets,packet transmissions from neighbors, the delays that precedethe transmission of data and control frames called Inter-FrameSpacings, and environmental noise.
Jardosh et al. outline a method to calculate medium uti-lization by adding the transmission duration ofall data,management, and control frames recorded by a sniffer [4].However, one drawback of this approach is that it involvessignificant processing overhead for each received packet, as itrequires sniffing the network inmonitor mode and accountingfor transmission delays of data and ACK packets, and the SIFSand DIFS intervals that precede frame transmissions. Thesecomplexities make it unsuitable for congestion identificationin real-time.
In this paper, we present a practical light-weight imple-mentation of the CBT metric for 802.11 networks using afeature provided in Atheros chipset-based wireless devices,and compare its performance with the technique proposed byJardosh et al. [4].
To measure the channel busy time, we use the reverse-engineered Open HAL1 implementation of the MadWifi driverfor Atheros AR5212 chipset radios. Atheros maintains 32-bit register counters to track “medium busy time” and “cycletime”. The cycle time counter is incremented at every clocktick of the radio, and the medium busy counter represents thenumber of clock ticks for which the medium was sensed busy.The medium is considered busy if the measured signal strengthis greater than the Clear Channel Assessment (CCA). ForAtheros radios, the CCA has been found to be -81dBm [20].time” counter,
The ratio of the “medium busy time” and the “cycle time”counters gives the fraction of time during which the channelwas busy. We found that the counters were reset (to a randomvalue) about once every minute. In our implementation weexpose an interface in the/proc filesystem to read thecounter values from the registers periodically at an intervalof one second.
Our implementation of channel busy time measurementis based on the Atheros chipset. The CBT functionality isnow supported for all Atheros chipsets via the open-sourceath5k Linux driver [21]. Based on a study of open-sourcecode and SNMP MIB specifications, we believe that chipsetsfrom other vendors such as Prism and Cisco support CBT-like functionality [22], [21]. Further, the 802.11h Radio Re-source Management extension recommends APs to supportmeasurement ofChannelLoad, a metric similar to channelutilization [23]. Therefore we expect the CBT functionalityto be supported by a large number of hardware vendors. Aswe show later in this paper, the CBT metric can provide veryuseful information for network protocol designers. We believethat other hardware vendors should also expose a similarinterface and facilitate cross-layered wireless protocoldesignsthat maximize network performance.
1. http://madwifi.org/wiki/OpenHal (Dec 2006)
Delay Component Duration (µsec.)DIFS 50SIFS 10
Preamble (short) 96
Frame Preamble +8·frame sizerate
TABLE 1Delay parameters for calculation of medium utilization.
4 EVALUATION OF CONGESTION METRICS
In Section 3, we proposed two techniques to measure con-gestion in a wireless network in real time. While channelaccess delay is an active technique that requires the node toactively transmit data packets in the network, channel busytime involves passive measurements without actually requiringdata transmission.
To evaluate the performance of the two techniques, we useas a benchmark the medium utilization as seen by a snifferoperating in monitor mode. In order to calculate mediumutilization, we use the methodology proposed by Jardosh et al.to account for the transmission duration ofall management,control and data frames, along with the SIFS and DIFS du-rations preceding each transmission [4]. This helps determinethe accuracy of our low overhead implementations of channelaccess delay and channel busy time by comparing against afairly comprehensive but high overhead mechanism.
We first describe the experimental setup used to measuremedium utilization using the two proposed techniques aswell as the benchmark technique, which relies on analysisof packets captured by a sniffer. We then describe in detailthe two test environments where we conduct our experiments.Next, we present the performance results of the two techniquesin each of the test environments. Finally, we discuss therelative merits and limitations of the two techniques.
4.1 Experimental Setup
In our experiments, we use four Linux laptops equipped withAtheros chipset IEEE 802.11a/b/g cards, and an access pointtoevaluate both the active (CAD) and passive (CBT) congestionmeasurement techniques as described below.
Sniffer: One laptop acts as the sniffer and is placed close tothe AP to performvicinity sniffing [24]. As part of vicinitysniffing, the radio on the sniffer laptop operates in mon-itor mode and captures all packet transmissions using thetethereal utility. This technique allows us to study thewireless network activity in the vicinity of the AP. The traffictrace from the sniffer is used for the offline calculation ofmedium utilization values during the experiment. The calcu-lated value of utilization is then used to compare against theCAD and CBT values during the corresponding time intervalof the experiment.
We calculate the medium utilization value using the method-ology proposed by Jardosh et al. [4]. In the interest ofspace, we briefly summarize the technique as follows. Themedium utilization for a given time interval is the sum of thetime required for all data, management, and control framestransmitted in the interval and the necessary MAC delaycomponents for each frame. The time required for a frame

6
transmission is determined by the data rate and the size of theframe in addition to the fixed duration preamble. The delaycomponents include the Inter-Frame Spacings such as SIFSand DIFS. Table 1 lists the parameters used for our calculationof medium utilization. We use the short preamble delay of96µs to estimate the minimum such delay in a network with amix of devices that use a short preamble of 96µs and devicesthat use a long preamble of 192µs.
Channel Access Delay: To accurately measure the channelaccess delay, two laptops run our CAD measurement tool usingMadMAC [18] as their driver. Both nodes broadcast fixed sizeprobe packets (98 bytes each) at a fixed bit-rate (54 Mbps) andmeasure the channel access delay for each probe. These nodesare not connected to the AP and hence are not part of thewireless network under test. We fix the contention parametersto a minimum (CWmin = CWmax = 1).
Channel Busy Time: A fourth laptop, also placed close tothe AP, continuously measures and records the channel busytime as described in Section 3.2.
In order to compare CAD and CBT values with mediumutilization values during the corresponding time intervals, thelaptops are time synchronized to a millisecond granularityusing NTP. Note that both laptops are tuned to the samechannel as the AP.
We next describe the two test environments where the abovedescribed experimental setup is used for the performanceevaluation.
4.2 Testing Scenarios
We evaluate the CAD and CBT congestion measurement tech-niques in two different environments. The first is a controlledtestbed involving eight client laptops connected to an accesspoint. The other is a real world large scale deployment of awireless network providing connectivity to more than 1000clients. We choose the two environments because of theirvastly different characteristics. The controlled environmentof a testbed allows us the flexibility to vary network loadto generate a range of medium utilization values and limitexternal sources of interference. A real world deployment,on the other hand, serves to verify the performance of ourtools in an environment characterized by live Internet traffic,a large number of heterogeneous wireless devices, dynamicuser behavior and other environmental factors.
4.2.1 Testbed
We conduct two phases of experiments on an indoor wirelesstestbed of eight client laptops connected to an access point.Each client initiates a bidirectional UDP traffic flow with theAP. The rate of data traffic is controlled at each client togenerate a range of medium utilization levels.
In the first phase we generate the training data set for theBWS test, based on the CAD values observed for differentmedium utilization levels, as described in Sections 3.1 and4.3. This training data is then used to estimate the mediumutilization level in the second phase of experiments on thetestbed as described in Section 4.3.1, as well as the IETFexperiments as described below.
We use UDP traffic as opposed to TCP in our testbedexperiments because TCP’s congestion control and backoffmechanisms prevent us from controlling the rate at whichdata is injected in the network. Each client exchanges UDPdata with the access point bidirectionally. This creates bothincoming and outgoing traffic from the AP and provides uswith a mechanism to create a range of medium utilization andcongestion levels in the testbed.
4.2.2 IETF Wireless LAN
To verify the performance of the two congestion estimationtechniques in a real world scenario with live Internet traffic, weconducted experiments at the 67th IETF meeting held in SanDiego in November 2006. The network at the IETF meetingconsisted of a large WLAN connected to the Internet with 38physical AP devices that provided connectivity to more than1000 clients. The APs were dual-radio devices with one radiotuned to the 802.11a spectrum and the other to the 802.11b/gspectrum. The APs were tuned to orthogonal channels toenable spatial reuse. We chose to perform our experimentswith 802.11b/g as there were approximately three times asmany users on the 2.4GHz spectrum as the 5GHz spectrum of802.11a. The APs advertized the following as accepted datarates (Mbps): 11, 12, 18, 24, 36, 48 and 54. This restriction onacceptable data rates enables limiting the cell-size of each AP.
We conducted experiments during several sessions at theIETF, each characterized by a different number of clientsconnected to the AP. For example, a working group meetingis typically held in a small room and is attended by about 50-100 people on average. On the other hand, a plenary sessionis attended by approximately 1000 people. The room for theplenary session at the 67th IETF was serviced by eight dualradio physical AP devices. The 2.4GHz APs were tuned to thethree non-overlapping channels of the 802.11b/g spectrum.Forthe evaluation of our congestion measurement techniques, wefocused on Day 3 of the meeting, a day that included a plenarysession.
4.3 Congestion Estimation Results
We now present performance results for both the congestionmeasurement techniques in each of the two test environments.There are four sets of results, corresponding to each combi-nation of the two measurement techniques, CAD and CBT,paired with the two test environments, testbed and IETF.
The active probing technique of calculating channel accessdelays requires sampling of a set of values within a shorttime interval, following which this set is compared with aknown distribution, to determine whether the current mediumutilization is above or below a specified threshold value.Channel busy time measured during an interval bears a directcorrelation with the medium utilization, and predicts a rangefor the current medium utilization level.
Due to the difference in the nature of results obtainedfrom each of these techniques, we do not compare the twoquantitatively. We first present the results for CAD in bothtest environments followed by those for CBT.

7
10
100
1000
10000
100000
1e+06
0 0.2 0.4 0.6 0.8 1
Channel A
ccess D
ela
y(m
icro
s)
Medium Utilization Fraction
(a) Testbed: CAD vs medium utilization.
10
100
1000
10000
100000
1e+06
0 0.2 0.4 0.6 0.8 1
Channel A
ccess D
ela
y(m
icro
s)
Medium Utilization Fraction
(b) IETF: CAD vs medium utilization.
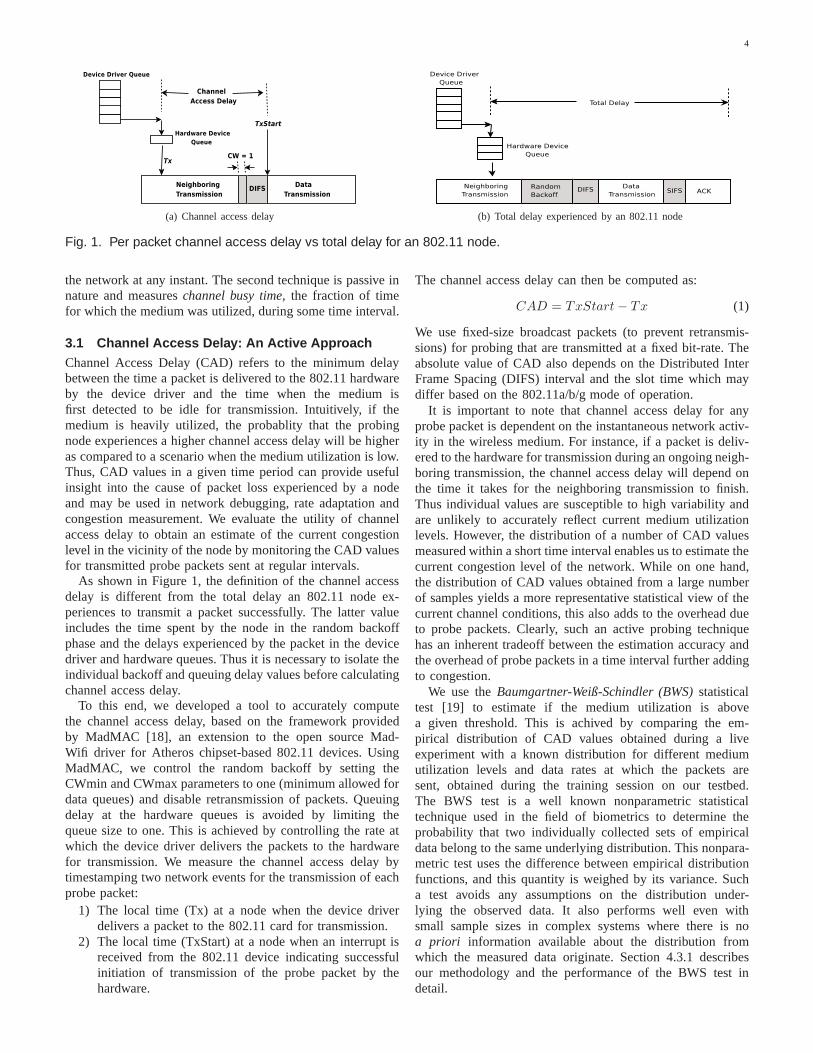
Fig. 2. Correlation between CAD (active probe technique) and medium utilization.
0
0.2
0.4
0.6
0.8
1
0 0.2 0.4 0.6 0.8 1
Channel B
usy T
ime
Medium Utilization Fraction
(a) Testbed: CBT vs medium utilization
0
0.2
0.4
0.6
0.8
1
0 0.2 0.4 0.6 0.8 1C
hannel B
usy T
ime
Medium Utilization Fraction
(b) IETF: CBT vs medium utilization
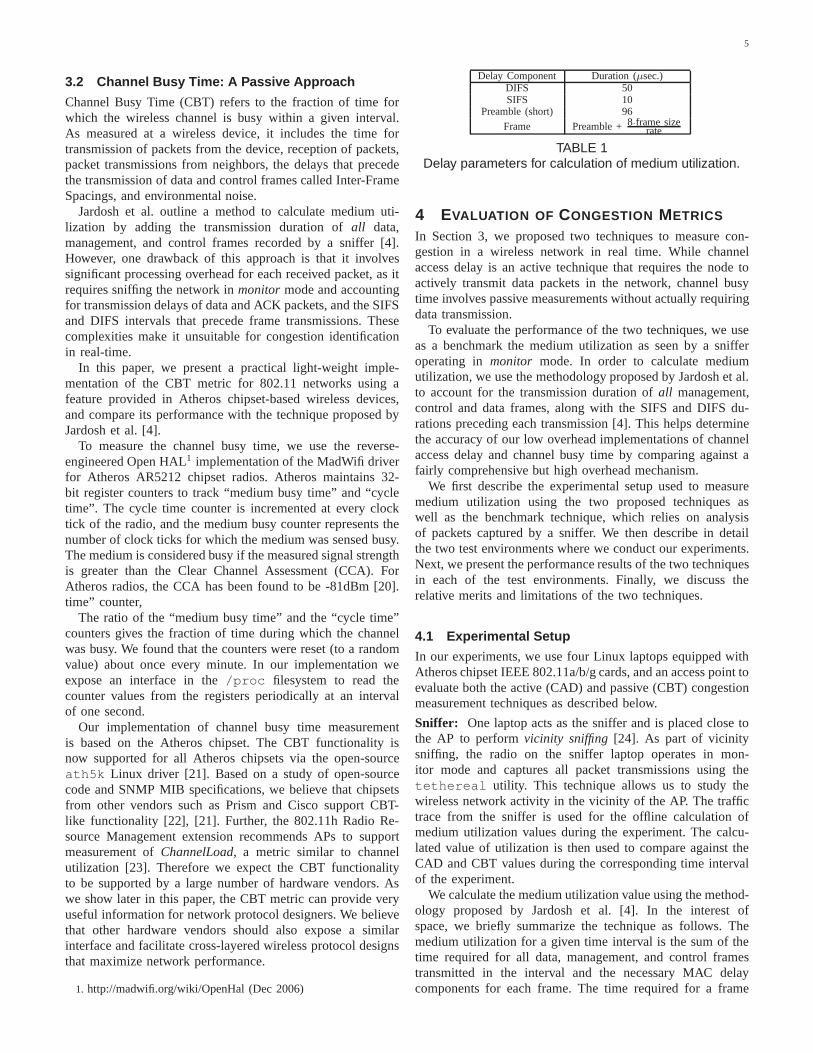
Fig. 3. Correlation between CBT (passive measurement technique) and medium utilization.
4.3.1 Channel Access Delay
As explained in Section 3, the channel access delay for apacket depends on the instantaneous state of the networkwhen the measurement was made. For example, if the devicedriver delivers a packet to the hardware for transmissionduring an ongoing packet transmission in the channel, thenthe CAD value depends on the time required for the ongoingtransmission to finish. As can be seen in Figures 2(a) and(b), for a given medium utilization level, individual CADvalues observed show no obvious trends. The exception is thelower bound on the measured CAD values (≈80 µs), whichcorresponds to the minimum channel access delay observedif the medium is idle at the instant when the probe packet isdelivered to the hardware for transmission. Figures 2(a) and (b)show average CAD values over one second intervals for fourprobe packets (98 bytes each) sent at a data rate of 54 Mbps.
While individual CAD values are susceptible to noisy esti-mates, the BWS technique allows us to estimate the channelconditions based on a distribution of samples taken during aninterval. The BWS test compares two distribution samples andassigns a probability measure (p-value) to the event that thetwo samples originate from the same underlying distribution.
We first train our prediction system during a training phase,in which we obtain an expected distribution for each 10%bin of medium utilization values ranging from 0 to 100%(bin(0,10), bin(10,20), ..., bin(90,100)). In the real-time experi-ment, we obtain a distributiond of the CAD values fromthe active probe packets and use the nonparametric BWS testto obtain ap-value for the event thatd and bin(i,j) have
the same underlying distribution. Next, we choose the binbin(a,b) with the highestp-value and determine whether therange (a, b) is above or below the specified threshold (Tc)for medium utilization that defines congestion. If the range(a, b) lies above the thresholdTc, we declare the medium to becongested and un-congested otherwise. We verify the accuracyof our threshold-based congestion estimation by determiningwhether the value of medium utilization obtained from thesniffer during post-analysis was also observed to be above orbelow the medium utilization thresholdTc.
Medium Utilization BWS accuracy (%)Threshold (%) Testbed IETF
10 64.69 67.6320 70.39 65.8930 76.09 63.5840 77.50 57.5150 83.22 57.2260 88.11 69.7970 92.78 81.2180 94.23 85.8490 95.65 94.50100 100 100
TABLE 2BWS test prediction accuracy with varying medium
utilization threshold values.
Table 2 shows the accuracy of the real-time made by thethe CAD congestion estimation tool, in both test scenarios,for varying CAD values collected over one second intervals.The accuracy of the BWS test predictions was slightly higher
8
in the testbed environment as compared to the IETF. This isbecause the number of CAD samples collected in the testbedwas higher (10 packets/second) than the IETF experiment (4packets/second).
In conclusion, the accuracy of the BWS test results variesdepending on the number of CAD samples available during aninterval. In a general setting, we expect a node to calculatethechannel access delay for a majority of its transmitted packets,which will yield a sufficiently large number of CAD valueswithin a short interval. However, in our experiments at theIETF meeting, we limited the number of packets sent by thetest nodes to a maximum of 4 packets/second to limit theimpact of our experiment on the network.
4.3.2 Channel Busy Time
In Figures 3(a) and (b), we plot the CBT metric againstthe medium utilization calculated based on sniffer datafor each second, for experiments conducted on the testbedand at the IETF meeting, respectively. Every point in thegraph represents the measured CBT value compared to thecalculated medium utilization value during the correspond-ing time interval. Both Figures 3(a) and 3(b) (b) showa strong linear correlation between CBT and medium uti-lization, with a linear correlation coefficient of 0.97 forthe testbed network and 0.925 for the IETF network.This high degree of correlation indicates that channel busytime estimates the medium utilization with high accu-racy.
From the graphs, we observe that the CBT metric some-times indicates a higher value than medium utilization. Thisbehavior is because CBT accounts for the time during whichthe medium was busy, but a packet was not necessarilyreceived (e.g., channel noise, packet collisions). ThereforeCBT represents a more accurate picture of the channel insuch scenarios. Also, it can be seen from Figure 3(b) that theCBT metric sometimes under-estimates the channel utilizationvalue. The specification for the Atheros chipset quotes theradio sensitivity for some data rates (e.g., -95dBm for 1Mbps)to be lower than the CCA threshold. Thus, some low data ratepackets are received correctly at the sniffer at a signal strengththat is below the CCA threshold.
4.4 Discussion
The results in the previous section indicate that channel busytime is an effective technique to determine channel utilizationat a low overhead. Channel access delays experienced by anode can be used to estimate whether medium utilization ishigh or low depending on a specified threshold value. Whilethe results of the CAD technique do not provide us with theexact value of medium utilization, the decision on whether themedium utilization is above or below any specified thresholdis sufficient for most applications involving rate adaptation,admission control and network debugging. On the other hand,the CBT metric provides a medium utilization estimation withhigh accuracy, using a feature exported by the Atheros-based802.11 devices.
For its ease of use and low overhead, we use the CBT metricin the rest of the paper to design a novel congestion-aware
rate adaptation scheme for wireless networks. However, inscenarios where the CBT metric functionality is not availablein the 802.11 cards, the scheme could be easily modified touse the channel access delay metric.
5 WIRELESS CONGESTION OPTIMIZEDFALLBACK (WOOF)We now demonstrate the utility of real-time congestionmetrics in improving the performance of wireless networksin congested scenarios. Our focus is on rate adaptation inwireless networks. In the following sections, we analyze theperformance of rate adaptation schemes in a large WLAN con-nected to the Internet. Based on this analysis, we then describethe design of our congestion-aware rate adaptation scheme.
5.1 Rate Adaptation during Congestion
We now analyze the behavior of current rate adaptationschemes in a congested network. Our focus is on the packetloss rates in such networks and their impact on rate adaptation.In addition, we explore the relationship between packet lossand congestion levels in the network. The traffic traces fromthe 67th IETF are used for this analysis.
We focus on the Wednesday plenary session of the IETFmeeting. This session had more than 1000 attendees in onelarge room with 16 APs. We choose this session in orderto study the packet loss behavior in a network with a highnumber of users and a high load on the network. We assumethe original transmission of a packet to be lost if, in the trace,we observe a packet transmission with the retry flag set. Thistechnique, however, does not account for retransmitted packetsthat were not captured by the sniffer. Thus the estimate is alower bound for the number of packet losses. The fractionof lost packets is calculated as the ratio of the number ofretransmitted packets to the sum of the number of packetstransmitted and the number of packets lost.
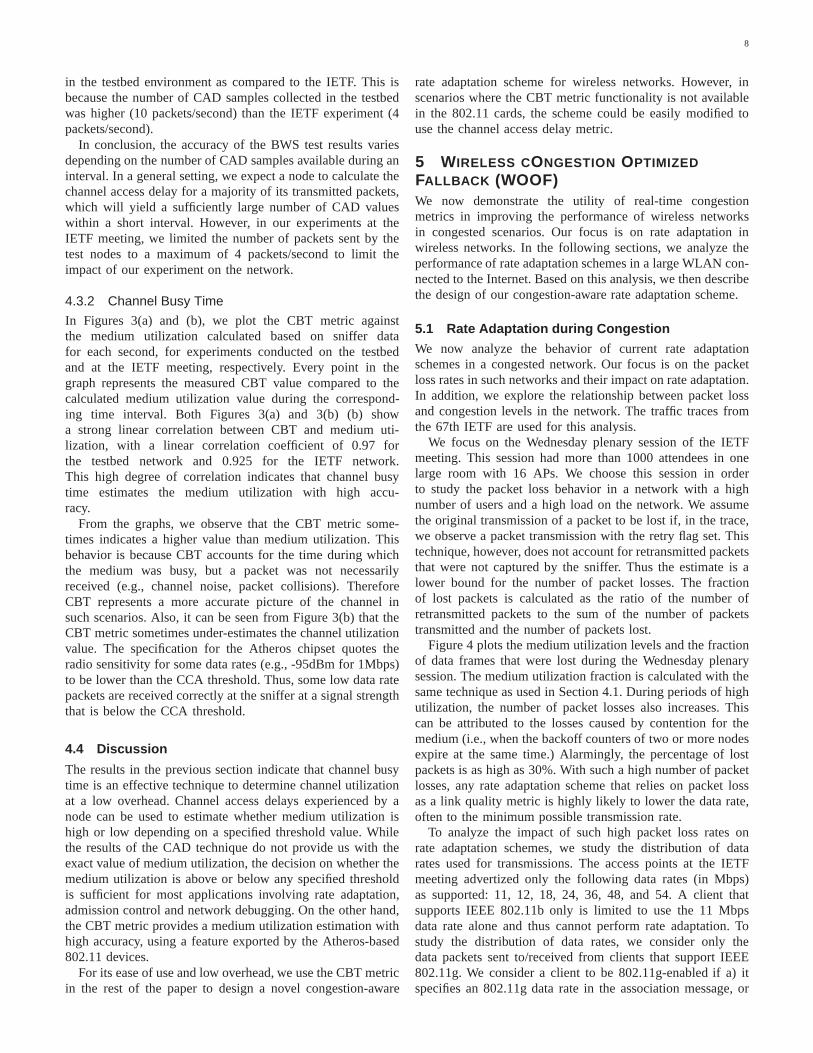
Figure 4 plots the medium utilization levels and the fractionof data frames that were lost during the Wednesday plenarysession. The medium utilization fraction is calculated with thesame technique as used in Section 4.1. During periods of highutilization, the number of packet losses also increases. Thiscan be attributed to the losses caused by contention for themedium (i.e., when the backoff counters of two or more nodesexpire at the same time.) Alarmingly, the percentage of lostpackets is as high as 30%. With such a high number of packetlosses, any rate adaptation scheme that relies on packet lossas a link quality metric is highly likely to lower the data rate,often to the minimum possible transmission rate.
To analyze the impact of such high packet loss rates onrate adaptation schemes, we study the distribution of datarates used for transmissions. The access points at the IETFmeeting advertized only the following data rates (in Mbps)as supported: 11, 12, 18, 24, 36, 48, and 54. A client thatsupports IEEE 802.11b only is limited to use the 11 Mbpsdata rate alone and thus cannot perform rate adaptation. Tostudy the distribution of data rates, we consider only thedata packets sent to/received from clients that support IEEE802.11g. We consider a client to be 802.11g-enabled if a) itspecifies an 802.11g data rate in the association message, or

9
0
20
40
60
80
100
11/0900:00
11/0900:30
11/0901:00
11/0901:30
11/0902:00
11/0902:30
Pe
rce
nta
ge
Time (UTC)
Medium Utilization Packet Loss
Fig. 4. Medium utilization and packet loss rate in acongested 802.11 network.
Rate (Mbps) Percentage of Data Packets1 0%2 0%
5.5 0%6 0%9 0%11 72.94%12 3.95%18 1.53%24 2.76%36 3.90%48 3.59%54 11.51%
TABLE 3Data rate distribution for 802.11g clients during the
Wednesday plenary session.
b) in the entire traffic trace, we observe at least one packetto/from the client using an IEEE 802.11g data rate. Table 3shows the distribution of data rates for only the 802.11g clientsobserved during the session. We see that a majority of thetransmissions (73%) used the lowest possible data rate2. Thisbehavior can be attributed to the rate adaptation schemes usedby the wireless devices in the network. The high rate of packetloss forces the rate adaptation scheme to consider the link tobe of poor quality and, thus, use lower data rates. A study ofthe SNRs shows that during this period 67% of the 11Mbpstransmissions had higher SNR than the average SNR of a54Mbps transmissions. This shows that higher data rates couldbe used in this scenario.
Previous work has also observed a similar effect of conges-tion on rate adaptation [3], [24]. In a congested network, a ma-jority of the 802.11 transmissions occur at the lowest possiblerate. Such transmissions also consume a large fraction of themedium time, since the packets take longer to be transmitted.Switching to a lower rate as a result of contention losses is notonly unnecessary but also increases the medium utilization.The packet transmissions take longer to complete and aremore susceptible to collisions (e.g. from hidden terminals).The above problem of rate adaptation is similar to the behaviorof TCP reducing its congestion window in response to all
2. An 802.11g capable client may have been incorrectly classifiedas an 802.11b client if it used only the 11 Mbps data rate andthe association message was not captured by the sniffer. Accurateclassification of such clients would increase the fraction of datapackets at 11 Mbps.
0
0.05
0.1
0.15
0.2
0.25
0.3
0 0.1 0.2 0.3 0.4 0.5 0.6 0.7
Pa
cke
t L
oss R
ate
Channel Busy Time Fraction
Fig. 5. Relationship between channel busy time andpacket loss rate during the Wednesday plenary session.
types of packet losses, which leads to reduced throughput eventhough the losses are not related to congestion [3]. Thus, itisimportant to understand the cause of a packet loss, and respondappropriately in the rate adaptation algorithm.
Based on the above discussion, we conclude that rateadaptation schemes must identify the cause of a packet lossand account only for packet losses that are not congestion-related. To this end, we now discuss the design and implemen-tation of Wireless cOngestion Optimized Fallback (WOOF),a rate adaptation scheme that identifies the cause of packetlosses. Packet losses related to congestion are omitted in thedetermination of an appropriate transmission data rate. Thusthe decision relies only on losses due to poor link quality.
5.2 Identification of Congestion-related Packet Loss
In Section 4 we noted that channel busy time was a goodpredictor of network congestion levels. We now explore therelationship between the channel busy time metric and packetloss rate.
Figure 5 plots a graph of the packet loss rate as a functionof the Channel Busy Time during the corresponding timeinterval of the Wednesday Plenary session. The plotted ratesare averaged over 30s time windows. In other words, a point(x,y) represents a 30s window wherein the with x ChannelBusy Time and y packet loss rate. We observe a strong linearcorrelation with the packet loss rate and the observed channelbusy time values. In other words, as the channel busy timeincreases, the probability of a packet loss due to congestionalso increases.
Unfortunately, a similar study of packet loss versus channelbusy time values for other sessions in the 67th IETF did notexhibit such strong correlation. However, we note that theaverage packet loss rate was higher during periods of highutilization in these sessions. These observations lead us toconclude that the channel busy time information can be usedas a good indicator of packet loss caused by the congestionlevel in the network. However, the exact relationship ofchannel busy time (and therefore medium utilization) mayvary depending on the environmental factors in the wirelessnetwork. A rate-adaptation scheme that uses channel busy timeas a heuristic to identify congestion-related packet losses musttherefore be dynamic and capable of adapting to changes inthe wireless network environment. In the design of our rateadaptation scheme WOOF, we initiate our prediction heuristic

10
with the initial setting of a linear relationship between packetloss and observed utilization level. We then dynamically adaptthe weight of this relationship based on the observed networkperformance to model the current environment in the wirelessnetwork.
The channel busy time metric only helps in identifying thecause of packet loss, i.e., whether it was congestion-related.The rate adaptation scheme must continue to deal with packetlosses caused by other factors such as poor link quality. Thuswe claim that Channel Busy Time provides supplementaryinformation that a rate adaptation scheme can use in additionto packet loss information. We, therefore, borrow the basicframework of the design of SampleRate [12] scheme in orderto handle the packet loss information in WOOF. WOOF buildson SampleRate through the incorporation of channel busy timeand its relationship with congestion related packet loss. Wenow outline the operation of SampleRate, and then discussthe design of WOOF.
5.3 SampleRateSampleRate is a rate adaptation scheme that accounts for thetime required for successful transmission of a packet [12].Theunderlying idea of SampleRate is to choose the data rate thatis expected to require the least time for transmission, i.e., thedata rate with maximum throughput. Note that this rate neednot always be the highest possible rate (i.e., 54 Mbps) becauseof poor link SNR and variable link quality. SampleRate usesfrequent probing of different data rates in addition to thecurrently used data rate to calculate the Expected TransmissionCount (ETX) [25] for each data rate. The ETX represents theaverage number of transmission attempts required for success-ful reception of a packet. A link has ETX=1 if a packet can besuccessfully received on the first transmission attempt. Ontheother hand, if the packet is lost and subsequent retransmissionsare required for successful packet delivery, then ETX>1. TheETX is calculated using either a sliding-window time averageor using EWMA. The Expected Transmission Time (ETT) iscalculated using ETX information at a given data rate andaccounts for the backoff times when the ETX metric predictsthat a retransmission is required (i.e., ETX>1). SampleRatethen chooses to transmit data packets using the data rate withthe lowest expected transmission time.
While SampleRate is able to successfully adapt the datarate in the presence of link variability, it does not respondappropriately when congestion occurs. In particular, it doesnot distinguish the cause of packet loss; all packet lossescontribute towards the calculation of ETX. Previous researchhas observed this phenomenon of SampleRate’s data ratereduction [26]. Congestion losses impact SampleRate’sestimation of ETX at the different data rates and lead to asub-optimal choice of transmission rate.
5.4 Design of WOOFWe base the design of the WOOF scheme on the design ofSampleRate. In particular, we build on SampleRate’s frame-work of calculation of Expected Transmission Time and usethis information to choose an appropriate data rate for trans-mission. In addition, we incorporate the ability to discernthe
cause of packet loss, in order to enable operation in congestednetworks.
In Section 5.1 we observed that channel busy time can beused as a metric to predict congestion-related packet loss.Weincorporate this insight into the design of WOOF with thefollowing enhancement to SampleRate. We useeffective packetlossinstead of the observed packet loss for calculation of ETXand the resulting calculation of ETT. Whenever we observe apacket loss, we associate a probabilityPCL that the loss wasdue to congestion. We then account for the fraction of packetloss that was not due to congestion in the calculation of ETX.In other words, we weigh every packet loss proportionally tothe probability that it was not a congestion-related loss.
EffectiveLoss= ObservedLoss· (1 − PCL)
For the calculation ofPCL, we use the following equationto capture the relationship between Channel Busy Time andpacket loss:
PCL = β · CBT
where CBT represents Channel Busy Time fraction andβ
represents the confidence factor,0 ≤ β ≤ 1. The ChannelBusy Time values are measured over intervals of time of sizeW seconds.
The confidence factorβ is a measure of the degree of corre-lation betweenCBTF and congestion-related packet loss. Theconfidence factor is adaptively varied based on the observednetwork performance. The value ofβ is calculated as follows.At the end of each measurement interval,W , we comparethe performance of rate adaptation in the current interval tothat during the previous interval. The metric for performancecomparison is the transmission time consumed during theinterval. To enable comparison of transmissions using a diverseset of data rates, we normalize the measured transmissiontime with respect to the corresponding time using a fixeddata rate on a reliable channel, e.g., 54 Mbps. In other words,the metric is analogous to the transmission time required perbyte of successfully transferred data. If the metric indicates animprovement in performance in comparison with the previousinterval of measurement, the value ofβ is increased in stepsof 0.05. This increase inβ models the increased confidence inusingCBTF to distinguish packet losses due to congestion.Similarly, when the metric indicates a drop in network perfor-mance,β is decreased in steps of 0.05. The confidence factorβ enables WOOF to adapt to different network environments.In particular, this enables WOOF to ensure good performance(at least as good as SampleRate) in situations of low SNRlinks and high congestion. In Section 6.5, we examine theimpact of the measurement window,W , and its effect on theconvergence time forβ values. In Section 6.3, we evaluate theperformance of WOOF under different combinations of linkSNR and congestion
5.5 ImplementationWe implemented WOOF as a rate adaptation module forthe MadWifi driver v0.9.2 for Atheros chipsets on Linux.We chooseW = 1s as the window of observation andrecalibration. A large value ofW reduces the responsivenessof WOOF to changes in the environment utilization. Smaller

11
values ofW increase the load on the driver due to the needfor frequent recalibration. We set the initial value ofβ to0.5. At each interval ofW seconds, the driver reads theAtheros registers described in Section 3.2 to calculate theChannel Busy Fraction. In addition, the normalized networkperformance is calculated as described in Section 5.4. Theβ values are also updated at each interval. In the followingsection we use our implementation of WOOF to study thebenefit of WOOF in a congested wireless network.
6 EVALUATION
We evaluate the performance of WOOF in two testbed net-works as well as through simulation. The testbed networksrepresent two scenarios, a WLAN and a multihop meshnetwork. These testbeds help us to evaluate WOOF on real802.11 devices and networks. The simulations enable us toscale the performance evaluation to networks larger than thetestbed networks. We first present results from the testbedexperiments, followed by the simulation-based experiments.
Among the two testbeds, we first use the WLAN scenariosince it allows us to control the experiment parameters andthe environment. The WLAN consists of one laptop actingas an AP and eight laptops as client devices. Each laptop isequipped with an IEEE 802.11b/g radio based on the Atheroschipset. The laptops use Linux (kernel version 2.6) as theirOS. The wireless radio is controlled by the MadWifi driverv0.9.2 along with the WOOF rate adaptation module.
We compare the performance of WOOF against that of Sam-pleRate. Previous work has shown that SampleRate performsbetter than ARF and AARF in most network scenarios [12],[13]. Thus we expect WOOF to provide better performancethan ARF and AARF in all cases where WOOF performsbetter than SampleRate3. We also compare the performanceof WOOF with that of CARA [6]. As described in Section 2,CARA is built upon ARF, and uses RTS-CTS to combatcollision losses. We implement CARA for Madwifi and useit for our comparison. In addition, for the WLAN scenario,we also compare performance against a scenario wherein thedata rate of the client-AP link is fixed at the best possiblerate. This scenario, called the StaticBest scenario, givesus anestimate of the upper-bound on the network performance. Thebest static rate is determined by running a simple performancetest at each data rate immediately prior to the correspondingtests with SampleRate, CARA, and WOOF.
6.1 Impact of Network Load
In the following set of experiments, we examine the impactof network load on the rate adaptation schemes. The clientsimplement either SampleRate, CARA, WOOF or use the fixeddata rate (StaticBest). The load on each of the eight clientsisvaried from 100 Kbps to 7 Mbps to vary the overall load on thenetwork from 800 Kbps to 56 Mbps. The AP operates using802.11b/g and thus the maximum theoretical raw bandwidth
3. Implementation of RRAA [13] requires a specialized pro-grammable AP platform. Therefore, we are unable to compare WOOFagainst RRAA. However, we note that RRAA was designed for betterperformance in hidden terminal scenarios and not specifically forcongested networks.
0
10
20
30
40
50
0 10 20 30 40 50 60
Ne
two
rk T
hro
ug
hp
ut
(Mb
ps)
Offered Load (Mbps)
StaticBestWOOFCARA
SampleRate
Fig. 6. Impact of network load.
of the network is 54 Mbps. However the mandatory MAC andPHY layer overheads limit the achievable network throughputto lower values. The network performance for each offeredload is measured using theiperf utility and UDP trafficwith 1500 byte packets for 5 minutes. For each trial of theexperiment, the drivers on the AP and clients are reset. Thisis followed by an initial warm-up period of 60 seconds for eachclient during which clients transmit low-rate traffic (10Kbps)to the AP.
Figure 6 graphs the total network throughput as a functionof the offered load. Each data-point is an average basedon five trials of the experiment. The error-bars indicate theminimum and the maximum throughput values over differentexperiment trials. We observe that the network throughput forStaticBest saturates at about 32 Mbps and for Sample-Rateat 7 Mbps. The throughput for WOOF is around 29 Mbps,close to that of Static-Best. From the graph, we observethat for non-congested scenarios (offered load<8 Mbps),all four schemes are able to sustain the offered load. Inother words, WOOF matches the performance of the otherschemes in low congestion environments. With the increaseof congestion (offered load>8 Mbps), SampleRate is affectedby the congestion-related packet losses and, thus, begins touse lower data rates. WOOF correctly identifies these packetlosses as congestion-related and continues to use high datarates, resulting in better throughput. CARA provides higherthroughput than SampleRate, but less than that of WOOF.CARA identifies congestion-related losses, uses RTS-CTSto protect transmissions at higher data rates, and obtainsmore throughput than SampleRate. However, the additionaloverhead of the RTS-CTS handshake restricts the networkthroughput to less than that of WOOF.
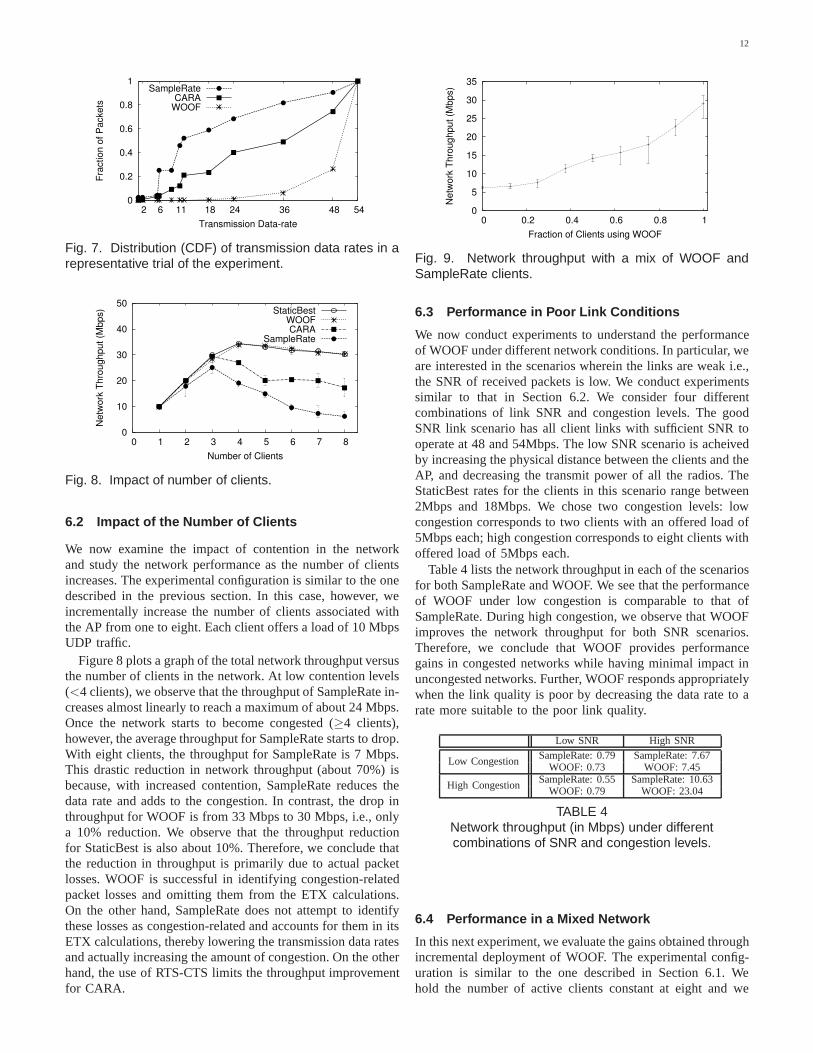
Figure 7 plots a CDF of the data rates used in a representa-tive trial of the experiment with an offered load of 40 Mbps.The graph shows that a majority of the packet transmissionswith WOOF use high data rates of 48 Mbps and 54 Mbps. Onthe other hand, SampleRate transmits about 50% of the packetsusing 11 Mbps or lower data rates. We note that althoughCARA uses higher data rates for transmissions, the overallthroughput is less than that of WOOF. This, again, points tothe overhead of the RTS-CTS handshake at the 1 Mbps datarate to avoid the collision of a data packet at a higher datarate.
12
0
0.2
0.4
0.6
0.8
1
2 6 11 18 24 36 48 54
Fra
ctio
n o
f P
acke
ts
Transmission Data-rate
SampleRateCARA
WOOF
Fig. 7. Distribution (CDF) of transmission data rates in arepresentative trial of the experiment.
0
10
20
30
40
50
0 1 2 3 4 5 6 7 8
Ne
two
rk T
hro
ug
hp
ut
(Mb
ps)
Number of Clients
StaticBestWOOFCARA
SampleRate
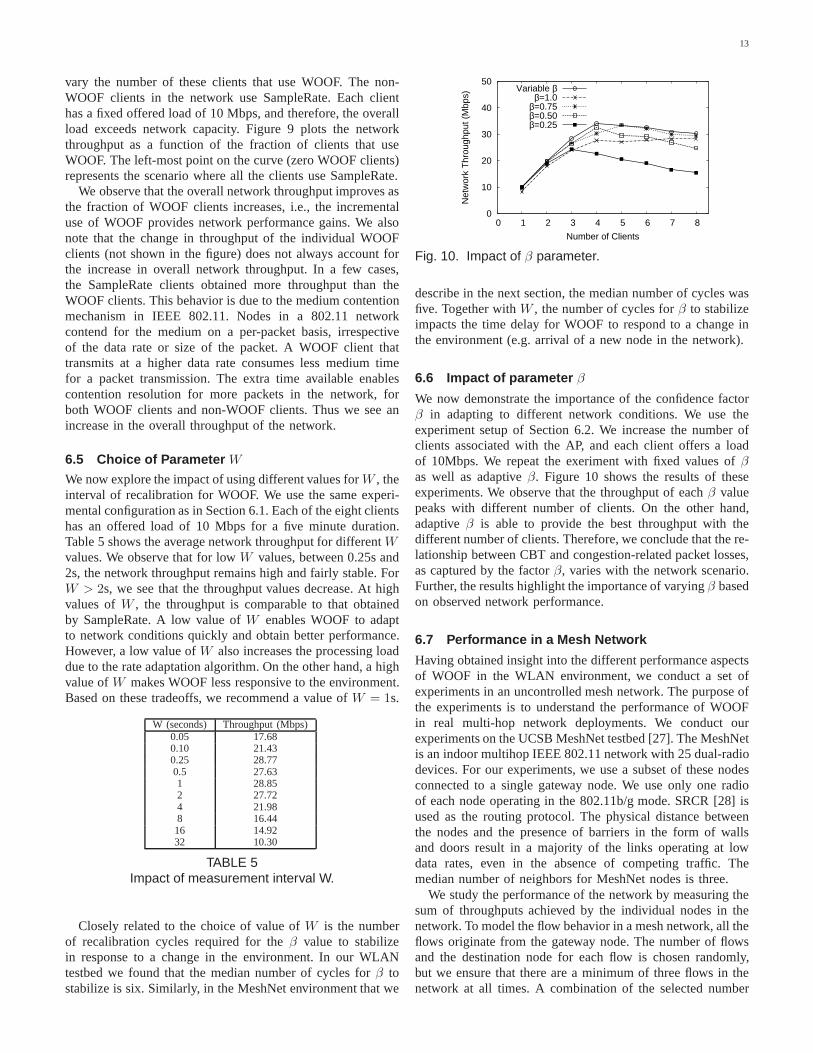
Fig. 8. Impact of number of clients.
6.2 Impact of the Number of Clients
We now examine the impact of contention in the networkand study the network performance as the number of clientsincreases. The experimental configuration is similar to theonedescribed in the previous section. In this case, however, weincrementally increase the number of clients associated withthe AP from one to eight. Each client offers a load of 10 MbpsUDP traffic.
Figure 8 plots a graph of the total network throughput versusthe number of clients in the network. At low contention levels(<4 clients), we observe that the throughput of SampleRate in-creases almost linearly to reach a maximum of about 24 Mbps.Once the network starts to become congested (≥4 clients),however, the average throughput for SampleRate starts to drop.With eight clients, the throughput for SampleRate is 7 Mbps.This drastic reduction in network throughput (about 70%) isbecause, with increased contention, SampleRate reduces thedata rate and adds to the congestion. In contrast, the drop inthroughput for WOOF is from 33 Mbps to 30 Mbps, i.e., onlya 10% reduction. We observe that the throughput reductionfor StaticBest is also about 10%. Therefore, we conclude thatthe reduction in throughput is primarily due to actual packetlosses. WOOF is successful in identifying congestion-relatedpacket losses and omitting them from the ETX calculations.On the other hand, SampleRate does not attempt to identifythese losses as congestion-related and accounts for them initsETX calculations, thereby lowering the transmission data ratesand actually increasing the amount of congestion. On the otherhand, the use of RTS-CTS limits the throughput improvementfor CARA.
0
5
10
15
20
25
30
35
0 0.2 0.4 0.6 0.8 1
Ne
two
rk T
hro
ug
hp
ut
(Mb
ps)
Fraction of Clients using WOOF
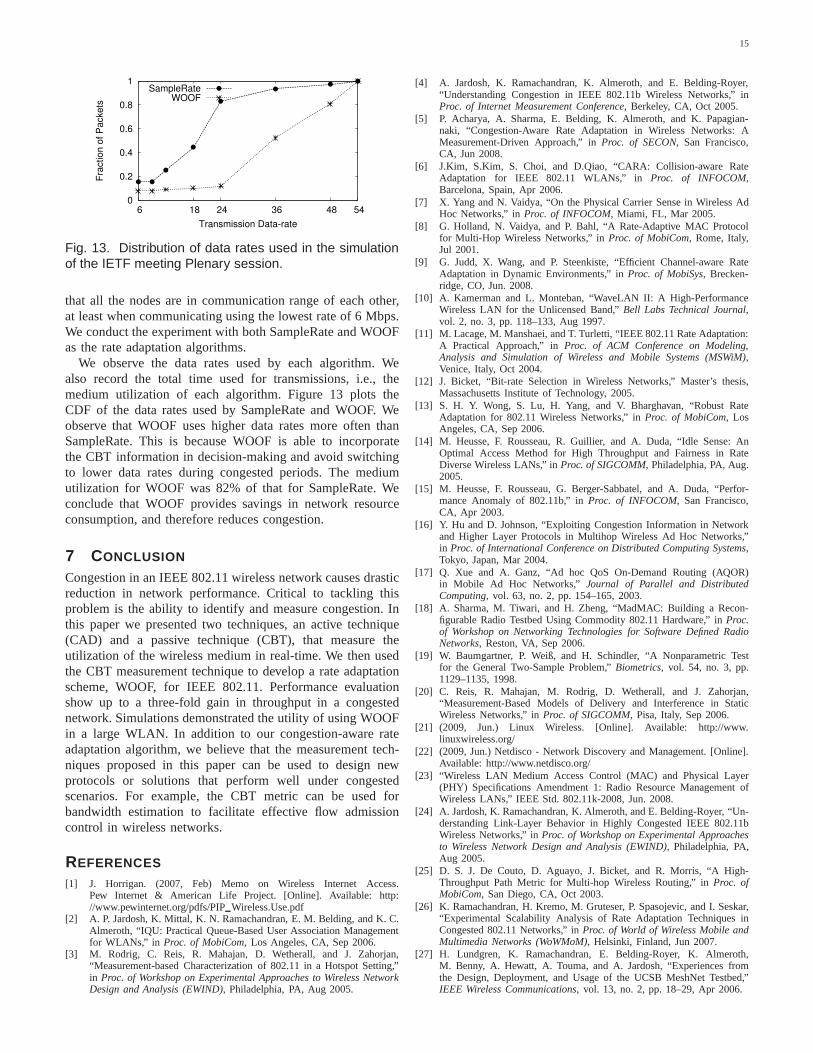
Fig. 9. Network throughput with a mix of WOOF andSampleRate clients.
6.3 Performance in Poor Link Conditions
We now conduct experiments to understand the performanceof WOOF under different network conditions. In particular,weare interested in the scenarios wherein the links are weak i.e.,the SNR of received packets is low. We conduct experimentssimilar to that in Section 6.2. We consider four differentcombinations of link SNR and congestion levels. The goodSNR link scenario has all client links with sufficient SNR tooperate at 48 and 54Mbps. The low SNR scenario is acheivedby increasing the physical distance between the clients andtheAP, and decreasing the transmit power of all the radios. TheStaticBest rates for the clients in this scenario range between2Mbps and 18Mbps. We chose two congestion levels: lowcongestion corresponds to two clients with an offered load of5Mbps each; high congestion corresponds to eight clients withoffered load of 5Mbps each.
Table 4 lists the network throughput in each of the scenariosfor both SampleRate and WOOF. We see that the performanceof WOOF under low congestion is comparable to that ofSampleRate. During high congestion, we observe that WOOFimproves the network throughput for both SNR scenarios.Therefore, we conclude that WOOF provides performancegains in congested networks while having minimal impact inuncongested networks. Further, WOOF responds appropriatelywhen the link quality is poor by decreasing the data rate to arate more suitable to the poor link quality.
Low SNR High SNR
Low Congestion SampleRate: 0.79 SampleRate: 7.67WOOF: 0.73 WOOF: 7.45
High Congestion SampleRate: 0.55 SampleRate: 10.63WOOF: 0.79 WOOF: 23.04
TABLE 4Network throughput (in Mbps) under differentcombinations of SNR and congestion levels.
6.4 Performance in a Mixed Network
In this next experiment, we evaluate the gains obtained throughincremental deployment of WOOF. The experimental config-uration is similar to the one described in Section 6.1. Wehold the number of active clients constant at eight and we
13
vary the number of these clients that use WOOF. The non-WOOF clients in the network use SampleRate. Each clienthas a fixed offered load of 10 Mbps, and therefore, the overallload exceeds network capacity. Figure 9 plots the networkthroughput as a function of the fraction of clients that useWOOF. The left-most point on the curve (zero WOOF clients)represents the scenario where all the clients use SampleRate.
We observe that the overall network throughput improves asthe fraction of WOOF clients increases, i.e., the incrementaluse of WOOF provides network performance gains. We alsonote that the change in throughput of the individual WOOFclients (not shown in the figure) does not always account forthe increase in overall network throughput. In a few cases,the SampleRate clients obtained more throughput than theWOOF clients. This behavior is due to the medium contentionmechanism in IEEE 802.11. Nodes in a 802.11 networkcontend for the medium on a per-packet basis, irrespectiveof the data rate or size of the packet. A WOOF client thattransmits at a higher data rate consumes less medium timefor a packet transmission. The extra time available enablescontention resolution for more packets in the network, forboth WOOF clients and non-WOOF clients. Thus we see anincrease in the overall throughput of the network.
6.5 Choice of Parameter W
We now explore the impact of using different values forW , theinterval of recalibration for WOOF. We use the same experi-mental configuration as in Section 6.1. Each of the eight clientshas an offered load of 10 Mbps for a five minute duration.Table 5 shows the average network throughput for differentW
values. We observe that for lowW values, between 0.25s and2s, the network throughput remains high and fairly stable. ForW > 2s, we see that the throughput values decrease. At highvalues ofW , the throughput is comparable to that obtainedby SampleRate. A low value ofW enables WOOF to adaptto network conditions quickly and obtain better performance.However, a low value ofW also increases the processing loaddue to the rate adaptation algorithm. On the other hand, a highvalue ofW makes WOOF less responsive to the environment.Based on these tradeoffs, we recommend a value ofW = 1s.
W (seconds) Throughput (Mbps)0.05 17.680.10 21.430.25 28.770.5 27.631 28.852 27.724 21.988 16.4416 14.9232 10.30
TABLE 5Impact of measurement interval W.
Closely related to the choice of value ofW is the numberof recalibration cycles required for theβ value to stabilizein response to a change in the environment. In our WLANtestbed we found that the median number of cycles forβ tostabilize is six. Similarly, in the MeshNet environment that we
0
10
20
30
40
50
0 1 2 3 4 5 6 7 8
Net
wor
k T
hrou
ghpu
t (M
bps)
Number of Clients
Variable ββ=1.0
β=0.75β=0.50β=0.25
Fig. 10. Impact of β parameter.
describe in the next section, the median number of cycles wasfive. Together withW , the number of cycles forβ to stabilizeimpacts the time delay for WOOF to respond to a change inthe environment (e.g. arrival of a new node in the network).
6.6 Impact of parameter β
We now demonstrate the importance of the confidence factorβ in adapting to different network conditions. We use theexperiment setup of Section 6.2. We increase the number ofclients associated with the AP, and each client offers a loadof 10Mbps. We repeat the exeriment with fixed values ofβ
as well as adaptiveβ. Figure 10 shows the results of theseexperiments. We observe that the throughput of eachβ valuepeaks with different number of clients. On the other hand,adaptiveβ is able to provide the best throughput with thedifferent number of clients. Therefore, we conclude that the re-lationship between CBT and congestion-related packet losses,as captured by the factorβ, varies with the network scenario.Further, the results highlight the importance of varyingβ basedon observed network performance.
6.7 Performance in a Mesh Network
Having obtained insight into the different performance aspectsof WOOF in the WLAN environment, we conduct a set ofexperiments in an uncontrolled mesh network. The purpose ofthe experiments is to understand the performance of WOOFin real multi-hop network deployments. We conduct ourexperiments on the UCSB MeshNet testbed [27]. The MeshNetis an indoor multihop IEEE 802.11 network with 25 dual-radiodevices. For our experiments, we use a subset of these nodesconnected to a single gateway node. We use only one radioof each node operating in the 802.11b/g mode. SRCR [28] isused as the routing protocol. The physical distance betweenthe nodes and the presence of barriers in the form of wallsand doors result in a majority of the links operating at lowdata rates, even in the absence of competing traffic. Themedian number of neighbors for MeshNet nodes is three.
We study the performance of the network by measuring thesum of throughputs achieved by the individual nodes in thenetwork. To model the flow behavior in a mesh network, all theflows originate from the gateway node. The number of flowsand the destination node for each flow is chosen randomly,but we ensure that there are a minimum of three flows in thenetwork at all times. A combination of the selected number

14
0
2
4
6
8
10
12
0 1 2 3 4 5 6 7 8
Ne
two
rk T
hro
ug
hp
ut
(Mb
ps)
Flow Topology
SampleRate-UDPWOOF-UDP
SampleRate - TCPWOOF - TCP
Fig. 11. Network throughput with UDP and TCP fordifferent flow topologies in the UCSB MeshNet.
of flows and the corresponding destination nodes constitutes aflow topology. The experiment is conducted for seven differentflow topologies, and for both SampleRate and WOOF. Werepeat the experiment for both TCP and 10 Mbps UDP flows.
Figure 11 compares the throughput of SampleRate andWOOF for these experiments. From the graph we see thatWOOF provides higher network throughput for both UDPand TCP as compared to SampleRate. The median increase inthroughput for UDP is 54.49%. The throughput gains for TCP,however, are less pronounced, with a median improvementof 20.52%. This behavior can be attributed to the dynamicsof TCP congestion control mechanisms and its sensitivity topacket loss.
6.8 Simulation-based EvaluationTo better understand the performance of WOOF in a widervariety of networks, we use the Qualnet simulator [29]. In par-ticular, we are interested in the performance of WOOF in sce-narios similar to those found in the IETF network, e.g., the ple-nary session with hundreds of clients connected to a single AP.
Our implementation of WOOF for Qualnet consists of threemain components. First, we extend the 802.11 MAC imple-mentation to consult a rate adaptation module to select a datarate for packet transmissions. We implement SampleRate asthe base rate adaptation algorithm. Second, we implement theChannel Busy Time metric by tracking the durations of packettransmissions, packet receptions, and busy channel scenariosat each node. Third, we implement WOOF by extending thebase SampleRate module.
We first validate our Qualnet implementation of Sam-pleRate and WOOF by simulating a scenario similar to ourexperimental setup in Section 6.2. A key difference in thesimulation setup is that Qualnet supports only pure 802.11bor pure 802.11g networks. In other words, the 802.11b/gmixed mode operation of the Atheros radios cannot be fullycaptured by the simulator. Therefore, we choose to performrate selection among the eight data rates of 802.11g (6 Mbps to54 Mbps) rather than the 12 data rates of 802.11b/g (1 Mbps to54 Mbps). We use the default parameters provided by Qualnetfor all the 802.11g nodes in the simulation, as listed in Table 6.We disable the use of RTS-CTS to mimic our testbed network.Similar to the experiment in Section 6.2, we simulate a WLANenvironment with one AP and an increasing number of clients,each with 10 Mbps offered load.
0
10
20
30
40
50
0 5 10 15 20
Ne
two
rk T
hro
ug
hp
ut
(Mb
ps)
Number of Clients
WOOFSampleRate
Fig. 12. Simulation-based evaluation of network perfor-mance with increasing number of clients.
Parameter Name ValuePHY IEEE 802.11gDIFS 40µsSIFS 16µs
Slot Time 9µsData Rates 6, 9, 12, 18, 24, 36, 48, 54 (Mbps)
Transmit Power @6Mbps 20 dBmReceiver Sensitivity @6Mbps -85 dBm
TABLE 6Simulation Parameters.
Figure 12 plots the average network throughout for 10 trialsof these experiments. From the graph, we observe that theoverall trends obtained from the simulation are similar to thatof the testbed. WOOF consistently provides higher networkthroughput, even in the presence of 20 contending clients. Forexample, WOOF provides about 6.2 Mbps more throughputthan SampleRate. We note that the drop in throughput forSampleRate is not as steep as observed in the testbed exper-iments. This is because the lowest possible data rate in thesimulation is 6 Mbps compared to 1 Mbps in the testbed. Inthe testbed, the use of lower data rates decreases the effectivenetwork capacity, and results in reduced throughput.
Next, we evaluate the scalability and performance of WOOFin a large WLAN with hundreds of clients. In this experiment,we characterize the gains obtained with the use of WOOF interms of the reduction in channel utilization. For this purpose,we refer to the Wednesday plenary session of the 67th IETFmeeting described earlier. We consider the traffic on oneparticular channel (channel 6), and use it as a traffic traceto input to the simulator. In other words, for every packetfound in the trace we schedule an equivalent transmission inthe simulation. However, the traffic trace was captured by asingle sniffer from actual transmissions on the channel. Thetrace therefore is the result of contention-resolution algorithmsused by the devices in the network and therefore represents aperfect collision-free transmission schedule. In order tocreatecontention among the packets in the trace, we perturb thepacket generation time to be a random value within a timewindow of 5ms before the actual time found in the trace. Wechoose a representative one hour of the meeting for simulation.Each MAC address in the trace (except broadcast and multicastaddresses) is represented by a node in the simulation. Therewere 592 unique MAC addresses in the chosen trace. Thelocation of the nodes is chosen randomly. However, we ensure
15
0
0.2
0.4
0.6
0.8
1
6 18 24 36 48 54
Fra
ctio
n o
f P
acke
ts
Transmission Data-rate
SampleRateWOOF
Fig. 13. Distribution of data rates used in the simulationof the IETF meeting Plenary session.
that all the nodes are in communication range of each other,at least when communicating using the lowest rate of 6 Mbps.We conduct the experiment with both SampleRate and WOOFas the rate adaptation algorithms.
We observe the data rates used by each algorithm. Wealso record the total time used for transmissions, i.e., themedium utilization of each algorithm. Figure 13 plots theCDF of the data rates used by SampleRate and WOOF. Weobserve that WOOF uses higher data rates more often thanSampleRate. This is because WOOF is able to incorporatethe CBT information in decision-making and avoid switchingto lower data rates during congested periods. The mediumutilization for WOOF was 82% of that for SampleRate. Weconclude that WOOF provides savings in network resourceconsumption, and therefore reduces congestion.
7 CONCLUSION
Congestion in an IEEE 802.11 wireless network causes drasticreduction in network performance. Critical to tackling thisproblem is the ability to identify and measure congestion. Inthis paper we presented two techniques, an active technique(CAD) and a passive technique (CBT), that measure theutilization of the wireless medium in real-time. We then usedthe CBT measurement technique to develop a rate adaptationscheme, WOOF, for IEEE 802.11. Performance evaluationshow up to a three-fold gain in throughput in a congestednetwork. Simulations demonstrated the utility of using WOOFin a large WLAN. In addition to our congestion-aware rateadaptation algorithm, we believe that the measurement tech-niques proposed in this paper can be used to design newprotocols or solutions that perform well under congestedscenarios. For example, the CBT metric can be used forbandwidth estimation to facilitate effective flow admissioncontrol in wireless networks.
REFERENCES
[1] J. Horrigan. (2007, Feb) Memo on Wireless Internet Access.Pew Internet & American Life Project. [Online]. Available:http://www.pewinternet.org/pdfs/PIPWireless.Use.pdf
[2] A. P. Jardosh, K. Mittal, K. N. Ramachandran, E. M. Belding, and K. C.Almeroth, “IQU: Practical Queue-Based User Association Managementfor WLANs,” in Proc. of MobiCom, Los Angeles, CA, Sep 2006.
[3] M. Rodrig, C. Reis, R. Mahajan, D. Wetherall, and J. Zahorjan,“Measurement-based Characterization of 802.11 in a Hotspot Setting,”in Proc. of Workshop on Experimental Approaches to Wireless NetworkDesign and Analysis (EWIND), Philadelphia, PA, Aug 2005.
[4] A. Jardosh, K. Ramachandran, K. Almeroth, and E. Belding-Royer,“Understanding Congestion in IEEE 802.11b Wireless Networks,” inProc. of Internet Measurement Conference, Berkeley, CA, Oct 2005.
[5] P. Acharya, A. Sharma, E. Belding, K. Almeroth, and K. Papagian-naki, “Congestion-Aware Rate Adaptation in Wireless Networks: AMeasurement-Driven Approach,” inProc. of SECON, San Francisco,CA, Jun 2008.
[6] J.Kim, S.Kim, S. Choi, and D.Qiao, “CARA: Collision-aware RateAdaptation for IEEE 802.11 WLANs,” inProc. of INFOCOM,Barcelona, Spain, Apr 2006.
[7] X. Yang and N. Vaidya, “On the Physical Carrier Sense in Wireless AdHoc Networks,” inProc. of INFOCOM, Miami, FL, Mar 2005.
[8] G. Holland, N. Vaidya, and P. Bahl, “A Rate-Adaptive MAC Protocolfor Multi-Hop Wireless Networks,” inProc. of MobiCom, Rome, Italy,Jul 2001.
[9] G. Judd, X. Wang, and P. Steenkiste, “Efficient Channel-aware RateAdaptation in Dynamic Environments,” inProc. of MobiSys, Brecken-ridge, CO, Jun. 2008.
[10] A. Kamerman and L. Monteban, “WaveLAN II: A High-PerformanceWireless LAN for the Unlicensed Band,”Bell Labs Technical Journal,vol. 2, no. 3, pp. 118–133, Aug 1997.
[11] M. Lacage, M. Manshaei, and T. Turletti, “IEEE 802.11 Rate Adaptation:A Practical Approach,” inProc. of ACM Conference on Modeling,Analysis and Simulation of Wireless and Mobile Systems (MSWiM),Venice, Italy, Oct 2004.
[12] J. Bicket, “Bit-rate Selection in Wireless Networks,”Master’s thesis,Massachusetts Institute of Technology, 2005.
[13] S. H. Y. Wong, S. Lu, H. Yang, and V. Bharghavan, “Robust RateAdaptation for 802.11 Wireless Networks,” inProc. of MobiCom, LosAngeles, CA, Sep 2006.
[14] M. Heusse, F. Rousseau, R. Guillier, and A. Duda, “Idle Sense: AnOptimal Access Method for High Throughput and Fairness in RateDiverse Wireless LANs,” inProc. of SIGCOMM, Philadelphia, PA, Aug.2005.
[15] M. Heusse, F. Rousseau, G. Berger-Sabbatel, and A. Duda, “Perfor-mance Anomaly of 802.11b,” inProc. of INFOCOM, San Francisco,CA, Apr 2003.
[16] Y. Hu and D. Johnson, “Exploiting Congestion Information in Networkand Higher Layer Protocols in Multihop Wireless Ad Hoc Networks,”in Proc. of International Conference on Distributed Computing Systems,Tokyo, Japan, Mar 2004.
[17] Q. Xue and A. Ganz, “Ad hoc QoS On-Demand Routing (AQOR)in Mobile Ad Hoc Networks,” Journal of Parallel and DistributedComputing, vol. 63, no. 2, pp. 154–165, 2003.
[18] A. Sharma, M. Tiwari, and H. Zheng, “MadMAC: Building a Recon-figurable Radio Testbed Using Commodity 802.11 Hardware,” in Proc.of Workshop on Networking Technologies for Software DefinedRadioNetworks, Reston, VA, Sep 2006.
[19] W. Baumgartner, P. Weiß, and H. Schindler, “A Nonparametric Testfor the General Two-Sample Problem,”Biometrics, vol. 54, no. 3, pp.1129–1135, 1998.
[20] C. Reis, R. Mahajan, M. Rodrig, D. Wetherall, and J. Zahorjan,“Measurement-Based Models of Delivery and Interference inStaticWireless Networks,” inProc. of SIGCOMM, Pisa, Italy, Sep 2006.
[21] (2009, Jun.) Linux Wireless. [Online]. Available: http://www.linuxwireless.org/
[22] (2009, Jun.) Netdisco - Network Discovery and Management. [Online].Available: http://www.netdisco.org/
[23] “Wireless LAN Medium Access Control (MAC) and PhysicalLayer(PHY) Specifications Amendment 1: Radio Resource Management ofWireless LANs,” IEEE Std. 802.11k-2008, Jun. 2008.
[24] A. Jardosh, K. Ramachandran, K. Almeroth, and E. Belding-Royer, “Un-derstanding Link-Layer Behavior in Highly Congested IEEE 802.11bWireless Networks,” inProc. of Workshop on Experimental Approachesto Wireless Network Design and Analysis (EWIND), Philadelphia, PA,Aug 2005.
[25] D. S. J. De Couto, D. Aguayo, J. Bicket, and R. Morris, “A High-Throughput Path Metric for Multi-hop Wireless Routing,” inProc. ofMobiCom, San Diego, CA, Oct 2003.
[26] K. Ramachandran, H. Kremo, M. Gruteser, P. Spasojevic,and I. Seskar,“Experimental Scalability Analysis of Rate Adaptation Techniques inCongested 802.11 Networks,” inProc. of World of Wireless Mobile andMultimedia Networks (WoWMoM), Helsinki, Finland, Jun 2007.
[27] H. Lundgren, K. Ramachandran, E. Belding-Royer, K. Almeroth,M. Benny, A. Hewatt, A. Touma, and A. Jardosh, “Experiences fromthe Design, Deployment, and Usage of the UCSB MeshNet Testbed,”IEEE Wireless Communications, vol. 13, no. 2, pp. 18–29, Apr 2006.
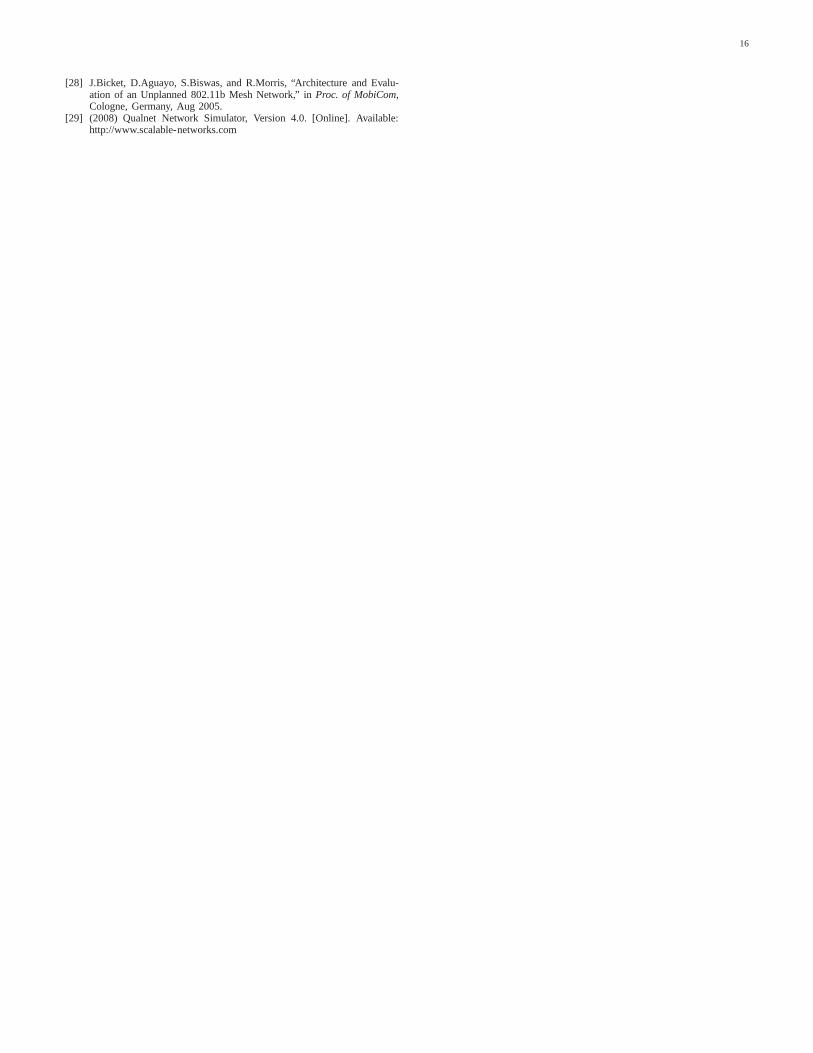
16
[28] J.Bicket, D.Aguayo, S.Biswas, and R.Morris, “Architecture and Evalu-ation of an Unplanned 802.11b Mesh Network,” inProc. of MobiCom,Cologne, Germany, Aug 2005.
[29] (2008) Qualnet Network Simulator, Version 4.0. [Online]. Available:http://www.scalable-networks.com