rasterstereography-based classification of normal corneas
TRANSCRIPT

Rasterstereography-based classification of normal corneas
Sandra C. Naufal, MD, Joycelyn S. Hess, MD, Miles H. Friedlander, MD, Nicole S. Granet
ABSTRACT
Purpose: To attempt to classify the topographic patterns identified by rasterstereography in a population with normal corneas.
Setting: Tulane Medical Center Clinic, New Orleans, Louisiana.
Methods: Corneal elevation pictures of 100 eyes of 50 volunteers were taken using the PAR Corneal Topography System™. The volunteers had no history of eye injury, disease, or surgery, and none wore contact lenses. Three observers independently assigned the images to one of five subgroups.
Results: Five categories were identified: unclassified, regular ridge, irregular ridge, incomplete ridge, and island. There were significant statistical differences in the degree of astigmatism between the irregular ridge and incomplete ridge groups (P = .0419) and between the irregular ridge and island groups (P = .017).
Conclusion: The topographic patterns identified by rasterstereography in normal comeas can be classified into five distinct groups. J Cataract Refract Surg 1997; 23:222-230
T he evolution and advancement of refractive surgery procedures have underscored the need for accurate
analysis of the entire corneal surface before and after surgical intervention. Instruments that measure and describe the corneal surface can be divided into two general rypes: Placido disk (using reflected mires) and elevation/ depression.
surface in terms of curvature. At the simplest level, this consists of a keratometer reflecting a single ring onto the surface and measuring four data points on the cornea. The videokeratographer is a more advanced version that reflects multiple rings and samples thousands of poi~ts across the corneal surface. The process in both instances is essentially the same: Mires are aligned with the cornea, and their reflection is imaged. Curvature is determined by analyzing the size and shape of each mire. In general, this analysis is done by extending radial hemimeridians at regular intervals from the measurement axis at the center of the reflected concentric rings. The position of the intersection of these meridians with either die center or edges of each ring is used to calculate curvature at that point. The technique used in this calibration determines whether the mapped result is displayed as tangential (instantaneous) or axial radius of curvature.
Historically, systems using reflected mires have been the most widely used to measure the anterior corneal surface. These systems include keratometers (both qualitative and quantitative), photokeratographers, and videokeratographers. Instruments of this type, typically based on Placido disk methodology, define the corneal
From the Department o/Ophthalmology, Tulane Medical Center, New Orleans, Louisiana, USA.
Reprint requests to Miles H. Friedlander, MD, Department o/Ophthalmology, Tulane Medical Center, 1430 Tulane Avenue, New Orleans, Louisiana 70112, USA.
Present instrumentation to measure corneal elevation and depression is subdivided into three basic types:
222 J CATARACT REFRACT SURG-VOL 23. MARCH 1997

RASTERSTEREOGRAPHY OF NORMAL CORNEAS
side-band interferometry, optical beam scanning, and rasterstereography. Side-band interferometry, used by the CLAS® unit, measures the anterior corneal surface using wave-interference techniques (laser holography). A laser beam is reflected off the corneal surface and directed onto a grid. A perfectly spherical surface causes no distortion of the grid. Asphericity and surface irregularities alter the grid's appearance. The image is captured by a high-resolution array camera and is transmitted to a video frame grabber. These images are digitized, and the optical path differences are calculated. The data derived from these calculations are translated into a three-dimensional model of the cornea.
In optical beam scanning, an extension of slitlamp corneal photography that is used by the Orbscan® unit, an image of a slit of light intersecting the cornea is used to get a localized impression of the surface profile. Multiple images of that same slit at different positions on the cornea are used to obtain an impression of a wider area. This system automatically scans a slit of light across the cornea and periodically captures images from an oblique angle. The sequence of corneal slices is pieced together to provide a surface model that can be viewed in a variety of modes. This optical beam measures both the anterior and posterior corneal curvature. The distance between the anterior and posterior surfaces defines the thickness of the cornea. This simultaneous measurement of the anterior and posterior surfaces allows assessment of pachymetry across the area of the cornea imaged by the system.
The PAR CTSTM (Corneal Topography System) uses a variation of stereophotogrammetry termed rasterstereography.1-4 Unlike most commercially accepted systems, this instrument constructs an elevation/ depression rather than a curvature-based model of the corneal surface. This definition is produced by projecting a grid pattern onto the anterior corneal surface, imaging the resultant scene from an oblique angle; and then deriving elevation with respect to a reference plane.
Because of the recent introduction of the PAR CTS system, the elevation/depression maps it produces are still relatively unfamiliar to the ophthalmic community. Normal patterns using this technology must be comprehensively identified before deviations from the norm can be properly evaluated. To this end, the authors evaluated and classified the PAR CTS elevation maps from 100 consecutive normal corneas of 50 volunteers.
Subjects and Methods We prospectively analyzed 100 normal corneas of
50 volunteers drawn from the Tulane University Medical Center Department of Ophthalmology staff members, employees, medical students, patients, and their companions. No volunteer was excluded from the analysis. Criteria for entry into the study included no history of ocular surgery, trauma, or contact lens wear and a normal corneal appearance by slidamp microscopy examination with no evidence of trauma or corneal disease.
Recruitment was neither formally randomized nor consecutive because we sought to examine persons of all ages with normal corneas (no evidence of trauma/scar or corneal disease) with a wide range of refractive errors. We did not attempt to analyze a true demographic cross section of the population. All volunteers had a routine examination by the corneal fellow (S.C.N.) that included demographic and ocular history; slitlamp microscopy (Haag-Streit 900); keratometry (Humphrey autokeratometer); corneal topography (PAR CTS); intraocular pressure (Haag-Streit AT), performed after corneal analysis to avoid distortion of the corneal surface. No artificial method for widening the palpebral fissure (e.g., an eyelid spectrum) was used.
All participants gave informed consent, were informed of the objectives of the examinations and the study, and agreed in writing to the publication of their data and images.
Topographic Examination All topographic examinations were done by the
same observer (S.C.N.) using the following sequence: A drop of fluorescein (Fluress®) was placed in the inferior fornix to stain the tear film. The participant was asked to blink to distribute the fluorescein over the entire corneal surface and then to look at the red fixation target of the PAR CTS unit. After proper fixation was achieved, the operator focused and aligned the grid. The projected grid was focused and aligned, and an image was captured.
Following standard PAR CTS image acceptance criteria, the observer accepted or rejected the examination image. If rejected, additional examinations were done until a suitable image was generated. When accepted, the image was automatically processed by the CTS sys-
J CATARACT REFRACT SURG---VOL 23, MARCH 1997 223

RASTERSTEREOGRAPHY OF NORMAL CORNEAS
tern software, and the elevation information it contained was extracted. The corneal model was displayed as an elevation/depression map and was output to a color printer (HP1200C) for analysis.
Topographic Pattern Classification All corneal models were displayed using the PAR
CTS elevation display mode to derive qualitative classification of the topographic patterns in the study group. 5
The topographic map normalizes the corneal surface to a best-fit sphere, essentially removing the spherical form of the cornea and permitting a view of how the surface deviates from the "ideal." These deviations are revealed as elevations and depressions from the dynamically calculated best-fit sphere.
The elevation maps for all models were presented using an absolute gradient to ensure valid comparison of the patterns and features from the large number of corneal samples. This scale covers a fixed range from +0.065 to -0.060 mm and has uniform steps of 0.005 mm. It provides a consistent means of color coding the elevation deviations of the corneal surface. Areas of the cornea that rise above the best-fit sphere (positive elevations) are assigned warm colors ranging from green through red. Conversely, points lying below the mean (depressions or negative elevations) are assigned cool colors ranging from blue-green through violet.
The maps were randomly and individually reviewed by three independent observers (S.C.N., M.H.F., l.S.H.). The criteria for acceptance of individual color maps were good picture quality and the inclusion of at least 8.0 mm of cornea in all directions. Separate classifications were developed and then reconciled among the reviewers. The patterns defined by the 12 intermediate colors in the 25-color scale were selected for classification. In many cases, the extreme periphery of the cornea included colors at the upper limits of the scale. These outliers did not modifY the overall classification.
Both Placido disk videokeratography and classical keratometry were performed on each cornea. The Placido patterns of these normal corneas were characterized as round, oval, symmetrical and asymmetrical bow tie, and unclassifiable. Astigmatism usually presented a symmetrical or asymmetrical bow-tie pattern, although some low degrees of astigmatism were also found in round patterns.
Topographical elevation/depression maps, unlike the Placido-disk-generated topographical displays, measure the distance above and below the surface of the best-fit sphere for the particular cornea. The computer calculates this best-fit sphere from data generated from the central 8.0 mm of the cornea. The observers identified five basic distributions of the elevation maps: unclassified, regular ridge, irregular ridge, incomplete ridge, and island (Figure O.
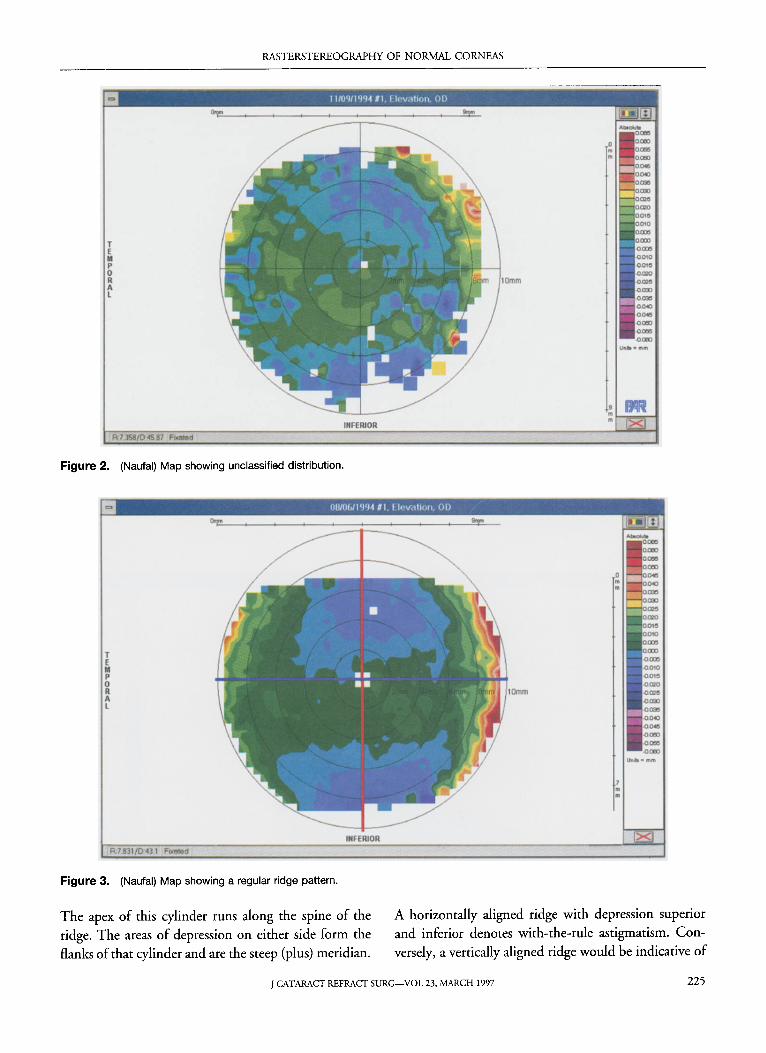
In the unclassified distribution (Figure 2), no specific pattern or form is evident in the map. The areas of elevation and depression that appear on the map do not conform to any other category. Corneas that fall into this classification are fairly spherical in shape and typically have little if any keratometric cylinder. The elevation differences seen in the map are typically of the magnitude of ±5.0 /Lm.
The regular ridge pattern (Figure 3) is a uniform green strip of elevation that extends completely across a given meridian. It does not have areas oflocalized elevation. The ridge is approximately twice as long as wide, and its width is more or less constant. Clinically, the elevated portion or ridge represents the flatter astigmatic cylinder of the cornea. If the cornea is a spherocylinder, this ridge is the flatter (minus) cylindrical component that is superimposed on the spherical form of the cornea.
Regular Ridge
Incomplete Ridge
Figure 1. (Naufal) The five basic distributions identified on the elevation maps.
224 J CATARACT REFRACT SURG-VOL 23, MARCH 1997
RASTERSTEREOGRAPHY OF NORMAL CORNEAS
Figure 2. (Naufal) Map showing unclassified distribution.
Figure 3. (Naufal) Map showing a regular ridge pattern.
The apex of this cylinder runs along the spine of the ridge. The areas of depression on either side form the flanks of that cylinder and are the steep (plus) meridian.
A horizontally aligned ridge with depression superior and inferior denotes with-the-rule astigmatism. Conversely, a vertically aligned ridge would be indicative of
J CATARACT REFRACT SURG-VOL 23. MARCH 1997 225

RASTERSTEREOGRAPHY OF NORMAL CORNEAS
against-the-rule astigmatism. Alignment of the ridge at
other than the horizontal or vertical axis would connote
oblique astigmatism.
The irregular ridge (Figure 4) is a variation of the
regular ridge pattern. It is usually oriented in a horizon
tal direction across a meridian, although like the regular
ridge it can also be arranged vertically or obliquely. It consists of two peripheral areas of elevation that are con
nected at the center by a band that is less than one
quarter the width of the widest area. The relative sizes of
the opposed areas of elevation as well as the height of
these areas and their centration are asymmetric.
The incomplete ridge (Figure 5) is identical to the
irregular ridge pattern except that the green central band
that connects the peripheral areas of elevation is not
contiguous.
The island (Figure 6) is an area of green elevation
surrounded by blue depression. The elevated portion
covers not more than 75% of the corneal surface and has
minimal depressions within its borders. The relation
ship between the horizontal and vertical dimensions of
the island ranges from approximately equal to not less
than half the opposing dimension.
Figure 4. (Naufal) Map showing an irregular ridge pattern.
Results One hundred eyes of 50 volunteers were examined;
22 were men and 28, women. Mean keratometric astig
matism was 0.937 diopters (D) ::!::: 0.637 (SD) (range
o to 3.12 D). Mean patient age was 35.58 ::!::: 13.9 years
(range 14 to 88 years). There was no statistical difference
in sex or age of the participants.
Five distinct patterns were identified. Table 1 shows
the number of corneas exhibiting each pattern and the
mean corneal astigmatism in each group. Lower degrees
of astigmatism were found in four of the five groups,
with slightly higher degrees of astigmatism in the irreg
ular ridge eyes.
A two-tailed t-test revealed significant statistical dif
ferences in degree of astigmatism between the irregular
ridge and the incomplete ridge eyes (P = .0419) and the
irregular ridge and the island eyes (P = .017).
There were 14 right and 3 left eyes in the regular
ridge group and 22 left and 6 right eyes in the irregular
ridge group. Only 11 participants had similar patterns in
both eyes. In selected cases, we repeated the topogra
phies on a different day. In all cases, the maps were
unchanged.
226 J CATARACT REFRACT SURG-VOL23, MARCH 1997

RASTERSTEREOGRAPHY OF NORMAL CORNEAS
INFERIOR
Figure 5. (Naufal) Map showing an incomplete ridge pattern.
Figure 6. (Naufal) Map showing an island pattern.
Discussion When analyzing elevation/depression maps of the
cornea, it is important to differentiate between elevation
U .... ·"'m
and curvature. On these maps, two radii of curvature are
superimposed (Figure 7). The more anterior line repre
sents the flatter curve (greatest radius of curvature or the
J CATARACT REFRACT SURG-VOL 23. MARCH 1997 227
RASTERSTEREOGRAPHY OF NORMAL CORNEAS
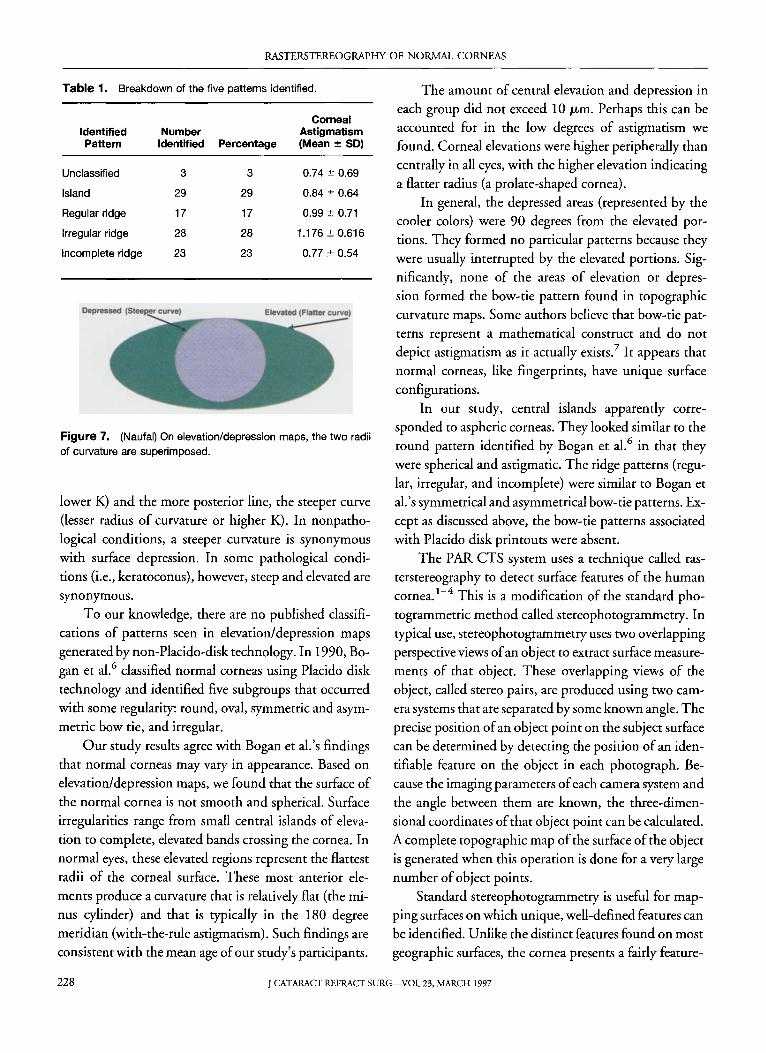
Table 1. Breakdown of the five patterns identified.
Corneal Identified Number Astigmatism Pattern Identified Percentage (Mean ± 50)
Unclassified 3 3 0.74::':: 0.69
Island 29 29 0.84::':: 0.64
Regular ridge 17 17 0.99::':: 0.71
Irregular ridge 28 28 1.176 ::':: 0.616
Incomplete ridge 23 23 0.77 ::':: 0.54
Figure 7. (Naufal) On elevation/depression maps, the two radii
of curvature are superimposed.
lower K) and the more posterior line, the steeper curve (lesser radius of curvature or higher K). In nonpathological conditions, a steeper curvature is synonymous with surface depression. In some pathological conditions (i.e., keratoconus), however, steep and elevated are synonymous.
To our knowledge, there are no published classifications of patterns seen in elevation/depression maps generated by non-Placido-disk technology. In 1990, Bogan et al.6 classified normal corneas using Placido disk technology and identified five subgroups that occurred with some regularity: round, oval, symmetric and asymmetric bow tie, and irregular.
Our study results agree with Bogan et al.'s findings that normal corneas may vary in appearance. Based on elevation/depression maps, we found that the surface of the normal cornea is not smooth and spherical. Surface irregularities range from small central islands of elevation to complete, elevated bands crossing the cornea. In normal eyes, these elevated regions represent the flattest radii of the corneal surface. These most anterior elements produce a curvature that is relatively flat (the minus cylinder) and that is typically in the 180 degree meridian (with-the-rule astigmatism). Such findings are consistent with the mean age of our study's participants.
The amount of central elevation and depression in
each group did not exceed 1 ° /Lm. Perhaps this can be accounted for in the low degrees of astigmatism we found. Corneal elevations were higher peripherally than centrally in all eyes, with the higher elevation indicating a flatter radius (a prolate-shaped cornea).
In general, the depressed areas (represented by the cooler colors) were 90 degrees from the elevated portions. They formed no particular patterns because they were usually interrupted by the elevated portions. Significantly, none of the areas of elevation or depression formed the bow-tie pattern found in topographic curvature maps. Some authors believe that bow-tie patterns represent a mathematical construct and do not depict astigmatism as it actually exists? It appears that normal corneas, like fingerprints, have unique surface configurations.
In our study, central islands apparently corresponded to aspheric corneas. They looked similar to the round pattern identified by Bogan et al.6 in that they were spherical and astigmatic. The ridge patterns (regular, irregular, and incomplete) were similar to Bogan et al.' s symmetrical and asymmetrical bow-tie patterns. Except as discussed above, the bow-tie patterns associated with Placido disk printouts were absent.
The PAR CTS system uses a technique called rasterstereography to detect surface features of the human cornea. I
-4 This is a modification of the standard pho
togrammetric method called stereophotogrammetry. In typical use, stereophotogrammetry uses two overlapping perspective views of an object to extract surface measurements of that object. These overlapping views of the object, called stereo pairs, are produced using two camera systems that are separated by some known angle. The precise position of an object point on the subject surface can be determined by detecting the position of an identifiable feature on the object in each photograph. Because the imaging parameters of each camera system and the angle between them are known, the three-dimensional coordinates of that object point can be calculated. A complete topographic map of the surface of the bbject is generated when this operation is done for a very large number of object points.
Standard stereophotogrammetry is useful for mapping surfaces on which unique, well-defined features can be identified. Unlike the distinct features found on most geographic surfaces, the cornea presents a fairly feature-
228 J CATARACT REFRACT SURG-VOL 23, MARCH 1997

RASTERSTEREOGRAPHY OF NORMAL CORNEAS
less terrain. It is therefore necessary to create artificial features that can be used later for topographic mapping of the corneal surface. This is accomplished by using rasterstereography, a variation of stereophotogrammetry, in which one of the camera systems is replaced by a projection system consisting of a light source and projection pattern of known geometry. Rather than capturing a second image of the scene, the projector casts a structured light pattern of known geometry onto the object. The object and overlapping projected pattern are then imaged by the camera system (Figure 8). The structured light pattern falling across the object provides artificial landmarks to determine surface elevation and eliminates the need to detect landmarks that are intrinsic features of the object.
Rasterstereography will not work if the image of the structured light pattern is created by reflection. Instead, the surface must be diffuse enough to permit the pattern of the grid that falls across the surface to be viewed from any arbitrary angle. In PAR CTS, this is accomplished by staining the tear film with fluorescein and then projecting a grid pattern onto the surface using a cobalt-blue light source. The captured image is a secondary one created when the cobalt-blue light strikes the surface and stimulates the fluorescein into fluorescence. It is not formed by reflection or dispersion of the projected beam. Grid lines cast shadows on the surface resulting in areas where there is little excitation of the dye. The areas
Projector Principle Point
Fixation Point
~
Corneal Surface
Figure 8. (Naufal) PAR CTS triangulation geometry.
between the lines are illuminated and provide a higher level of fluorescence.
Once the image is captured, it is inspected to verify alignment, focus, and degree of coverage. Ifit is satisfactory, it is accepted and the process of extraction of elevation data initiated. First, the image-processing algorithm locates one of the two reference or fiducial marks. The gaps in the grid allow the algorithm to orient itself within the coordinate system of the projected grid. In PAR CTS, it is not the displacement of grid squares but rather the position of an individual grid intersection within the captured image that determines the elevation at that point. Basically, one ray (Figure 8, ray 10) can be traced from the location of a given grid intersection in the image (and therefore a location on the CCD chip) to that intersection's position on the corneal surface. Another ray (Figure 8, ray OP) can be traced from the corneal surface back to the location of that intersection in the actual grid pattern within the projector. Using this information, the actual three-dimensional coordinates of the intersection on the corneal surface are determined through triangulation. The collection of coordinate values for the approximately 1600 grid intersections that are imaged on the typical cornea provides a detailed description of the surface. Each intersection is reported in terms of its elevation above or below a reference plane (best-fit sphere) that is fixed with respect to the PAR CTS optical head.
The PAR CTS topograph measures the entire corneal surface and provides quantitative and qualitative information.8
,9 It is accurate to within 0.18 D when measured against aligned calibrated test spheres and to within 0.09 D when measured against misaligned calibrated test spheres. The points at which the image is not captured or where distortion occurs are purposefully left blank. There is no attempt to interpolate findings from adjacent areas. Because the PAR CTS uses a projected image, nose and eyelid shadows do not occur.
Conclusion Normal corneas display a range of patterns. At least
in the low to moderate range of astigmatism, these patterns do not reflect the actual amount of astigmatism. Statistically, eyes with the irregular ridge pattern had more astigmatism than those with an incomplete ridge or the island pattern. The patterns were the same in both
J CATARACT REFRACT SURG-VOL 23, MARCH 1997 229

RASTERSTEREOGRAPHY OF NORMAL CORNEAS
eyes in only 11 % of cases. In this smaH sampling, two groups (irregular ridge and regular ridge) had an unexplained predominance of right or left eyes.
Topographic analysis of the cornea based on elevation/depression technology is relatively new compared with curvature imaging. Placido-based technology measures the rate of change on the corneal surface, not curvature; curvature is actually derived from the rate of change data. Similarly, in the elevation/depression system, the direct clinical information provided by the raw model is limited because the basic spherical shape of the cornea masks the topographic details that are of interest. This problem is overcome by normalizing the data to an idealized spherical surface that has been mathematically selected to best fit the calculated data. The topography is thus displayed in terms of elevation above or below the idealized sphere.
Several significant questions about the elevation/ depression system remain. The correlation between the specific elevation/depression pattern and actual vision has yet to be addressed. Our ability to use this technology as a predictor of surgical outcome has not been established. We have not even determined the accuracy of converting elevation/depression data to curvature and vice versa, nor have we conclusively shown the superiority of one system in depicting corneal topography. Finally, we have yet to ascertain the relevance of either technology in advancing refractive surgery.
References
1. Warnicki J, RehkopfP, Curtin S, et al. Corneal topography using computer analyzed rasterstereographic images. Appl Opt 1988; 27:1135-1140
2. Arffa RC, Warnicki JW, Rehkopf PG. Corneal topography using rasterstereography. Refract Corneal Surg 1989; 5:414-417
3. Warnicki JW, RehkopfPG, Arffa RC, Stuart Je. Corneal topography using a projected grid. In: Schanzlin DJ, Robin JB, eds, Corneal Topography; Measuring and Modifying the Cornea. New York, Springer-Verlag, 1992; 25-32
4. Belin MW, Cam bier JL, Nabors JR. PAR corneal topography system. In: Gills JP, Sanders DR, Thornton SP, et ai, eds, Corneal Topography; the State of the Art. Thorofare, NJ, Slack, 1995; 105-120
5. Belin MW, LitoffD, Strods SJ, et al. The PAR Technology Corneal Topography System. Refract Corneal Surg 1992; 8:88-96
6. Bogan SJ, Waring GO III, Ibrahim 0, et al. Classification of normal corneal topography based on computer-assisted videokeratography. Arch Ophthalmol 1990; 108: 945-949
7. Bores LD. Refractive Eye Surgery. Boston, Oxford, Blackwell Scientific Publications, 1993; 169-171
8. Belin MW, Zloty P. Accuracy of the PAR Corneal T opography System with spatial misalignment. CLAO J 1993; 19:64 - 68
9. Belin M. Intraoperative raster photogrammetry-the PAR Corneal Topography System. J Cataract Refract Surg 1993; 19:188-192
230 J CATARACT REFRACT SURG-VOL23. MARCH 1997