rasg-pa - icaonacc.org · rasg-pa project gsi/12 - use of technology to enhance safety: a project...
TRANSCRIPT
RASG-PA Annual Safety Report – Second Edition
RASG-PA
ANNUAL SAFETY REPORT – Second Edition
INFORME ANUAL DE SEGURIDAD OPERACIONAL – Segunda Edición
Regional Aviation Safety Group – Pan America (RASG-PA)
Grupo Regional de Seguridad Operacional de la Aviación – Pan América (RASG-PA)
September/Setiembre 2011
Information produced with data from 2000 to 2010 / Información producida con datos de 2000 a 2010

This document is disseminated under the sponsorship of the Regional Aviation Safety Group – Pan America (RASG-PA) in the interest of information exchange. The RASG-PA assumes no liability for its contents or use thereof. Este documento es difundido bajo el auspicio del Grupo Regional de Seguridad Operacional de la Aviación – Pan América (RASG-PA) con el interés de intercambiar información. El RASG-PA no asume ninguna responsabilidad por su contenido o uso.
RASG-PA Annual Safety Report – Second Edition
RASG-PA
Annual Safety Report
Table of contents
1. Foreword .................................................................................................................................. - 1 -
2. Introduction .............................................................................................................................. - 4 -
3. Executive Summary ................................................................................................................. - 5 -
4. Safety Information ................................................................................................................... - 6 -
4.1 Reactive Safety Information ................................................................................................... - 6 -
4.1.1 Worldwide Information ............................................................................................................ - 7 -
4.1.2 Regional Information ............................................................................................................. - 11 -
4.1.2.1 Reporting Culture and Accidents in the Pan American Region ....................................... - 11 -
4.1.2.2 Aircraft Category – Fatal Accidents ..................................................................................... - 14 -
4.1.3 Main findings .......................................................................................................................... - 15 -
4.1.3.1 Contributing Factors to 2010 Accidents in NAM and LATAM Regions (IATA) ................ - 15 -
4.1.3.2 Most Frequent Categories .................................................................................................... - 17 -
4.1.3.2.1 In-depth Analysis of Runway Excursion (RE) Data ............................................................ - 19 -
4.1.3.2.2 In-Depth Analysis of Controlled Flight Into Terrain (CFIT) Data ....................................... - 21 -
4.1.3.2.3 In-depth Analysis of Loss of Control In-flight (LOC-I) Data .............................................. - 23 -
4.1.3.2.4 In-depth Analysis of System-component Failure/malfunction (non-powerplant) (SCF-NP)
Data ................................................................................................................................. - 24 -
4.2 Proactive Safety Information ................................................................................................ - 26 -
4.2.1 ICAO Universal Safety Oversight Audit Programme Continuous Monitoring Approach
(USOAP CMA) ........................................................................................................................ - 26 -
4.2.2 IOSA NAM/LATAM Regions Summary ................................................................................ - 30 -
4.2.2.1 Findings in the Pan American Region ................................................................................. - 31 -
4.2.2.1.1 Top Findings in NAM Region ............................................................................................... - 31 -
4.2.2.1.2 Top Findings in LATAM Region ........................................................................................... - 32 -
4.3 Predictive Safety Information ............................................................................................... - 32 -
5. Final Conclusions .................................................................................................................. - 33 -
List of Acronyms ................................................................................................................... - 34 -

RASG-PA Annual Safety Report – Second Edition
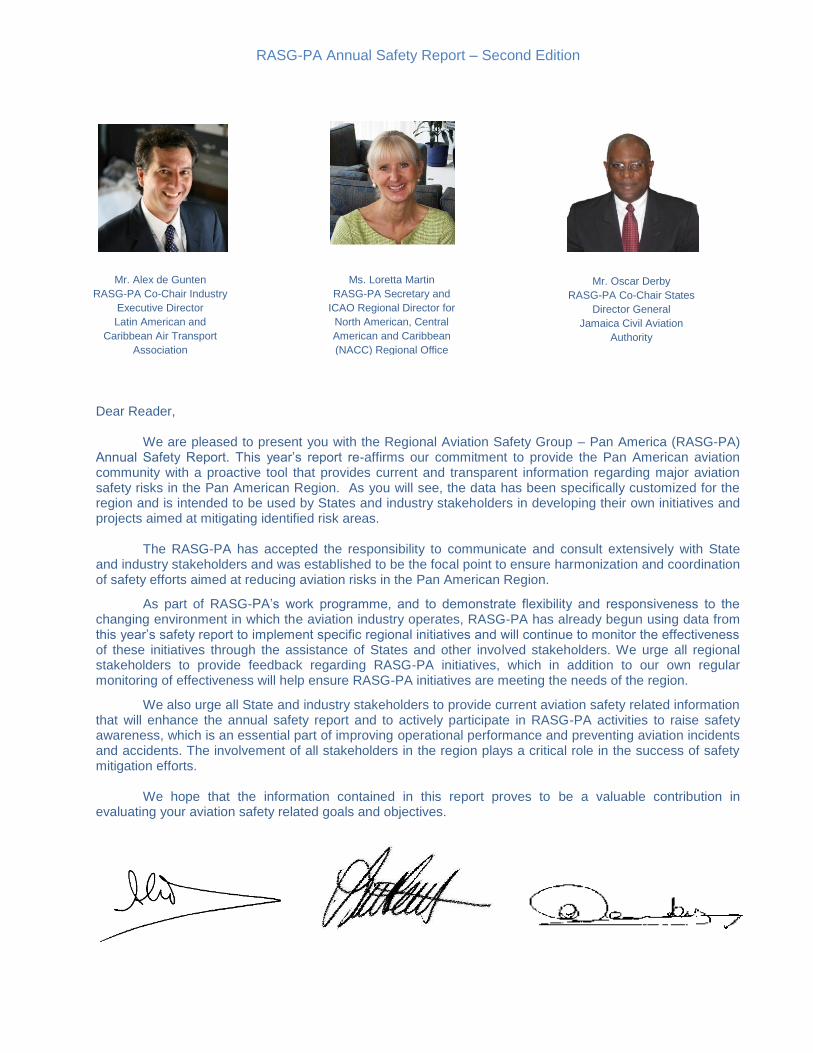
Ms. Loretta Martin
RASG-PA Secretary and
ICAO Regional Director for
North American, Central
American and Caribbean
(NACC) Regional Office
Mr. Alex de Gunten
RASG-PA Co-Chair Industry
Executive Director
Latin American and
Caribbean Air Transport
Association
(ALTA)
Mr. Oscar Derby
RASG-PA Co-Chair States
Director General
Jamaica Civil Aviation
Authority
Dear Reader, We are pleased to present you with the Regional Aviation Safety Group – Pan America (RASG-PA) Annual Safety Report. This year’s report re-affirms our commitment to provide the Pan American aviation community with a proactive tool that provides current and transparent information regarding major aviation safety risks in the Pan American Region. As you will see, the data has been specifically customized for the region and is intended to be used by States and industry stakeholders in developing their own initiatives and projects aimed at mitigating identified risk areas. The RASG-PA has accepted the responsibility to communicate and consult extensively with State and industry stakeholders and was established to be the focal point to ensure harmonization and coordination of safety efforts aimed at reducing aviation risks in the Pan American Region.
As part of RASG-PA’s work programme, and to demonstrate flexibility and responsiveness to the changing environment in which the aviation industry operates, RASG-PA has already begun using data from this year’s safety report to implement specific regional initiatives and will continue to monitor the effectiveness of these initiatives through the assistance of States and other involved stakeholders. We urge all regional stakeholders to provide feedback regarding RASG-PA initiatives, which in addition to our own regular monitoring of effectiveness will help ensure RASG-PA initiatives are meeting the needs of the region.
We also urge all State and industry stakeholders to provide current aviation safety related information that will enhance the annual safety report and to actively participate in RASG-PA activities to raise safety awareness, which is an essential part of improving operational performance and preventing aviation incidents and accidents. The involvement of all stakeholders in the region plays a critical role in the success of safety mitigation efforts. We hope that the information contained in this report proves to be a valuable contribution in evaluating your aviation safety related goals and objectives.


RASG-PA Annual Safety Report – Second Edition
- 1 -
1. Foreword
Regional Aviation Safety Group – Pan America (RASG-PA)
Background
The Regional Aviation Safety Group – Pan America (RASG-PA) was established in November 2008 as the
focal point to ensure harmonization and coordination of efforts aimed at reducing aviation safety risks for the
Pan American region.
RASG-PA supports implementation of the ICAO Global Aviation Safety Plan (GASP) and the Industry Safety
Strategy Group (ISSG) Global Aviation Safety Roadmap (GASR). In addition, it was the first multi-regional
body in the world unifying government aviation agencies and industry that is established to address flight
safety issues.
RASG-PA complies with the ICAO Council approval of Regional Aviation Safety Groups (RASGs) with the
objective to address global aviation safety matters from a regional perspective.
Organizational Structure
RASG-PA membership includes representatives from all ICAO NAM/CAR/SAM States/Territories, ICAO,
International Organizations and industry, which are detailed under the Executive Steering Committee (ESC)
description. Other members are the Civil Air Navigation Services Organization (CANSO), Flight Safety
Foundation (FSF), International Coordinating Council of Aerospace Industries Associations (ICCAIA), Latin
American Civil Aviation Commission (LACAC), and NAM/CAR/SAM regional safety oversight organizations.
The ESC is composed of two Co-Chairpersons, which represent States and international organizations and
industry. Current Co-Chairpersons are from Jamaica and the Latin American and Caribbean Air Transport
Association (ALTA), respectively. RASG-PA has four Vice-Chairpersons from: Brazil, Chile, Costa Rica, and
United States, representing NAM/CAR/SAM States, ICAO NACC and SAM Regional Directors (NACC
Regional Office serves as Secretary) and a representative from ICAO/ANB, representing ICAO
Headquarters. Additional RASG-PA ESC members include: Airbus, Airports Council International (ACI),
Boeing, Caribbean Aviation Safety and Security Oversight System (CASSOS), Corporación Centroamericana
de Servicios de Navegación Aérea (COCESNA), International Air Transport Association (IATA), International
Federation of Airline Pilots Associations (IFALPA) and International Federation of Air Traffic Controllers
Associations (IFATCA).
RASG-PA has established three working groups in order to implement its work programme:
1. Regional Aviation Safety Team - Pan America (RAST-PA)
2. Aviation Safety Training Team (ASTT)
3. Annual Safety Report Team (ASRT)
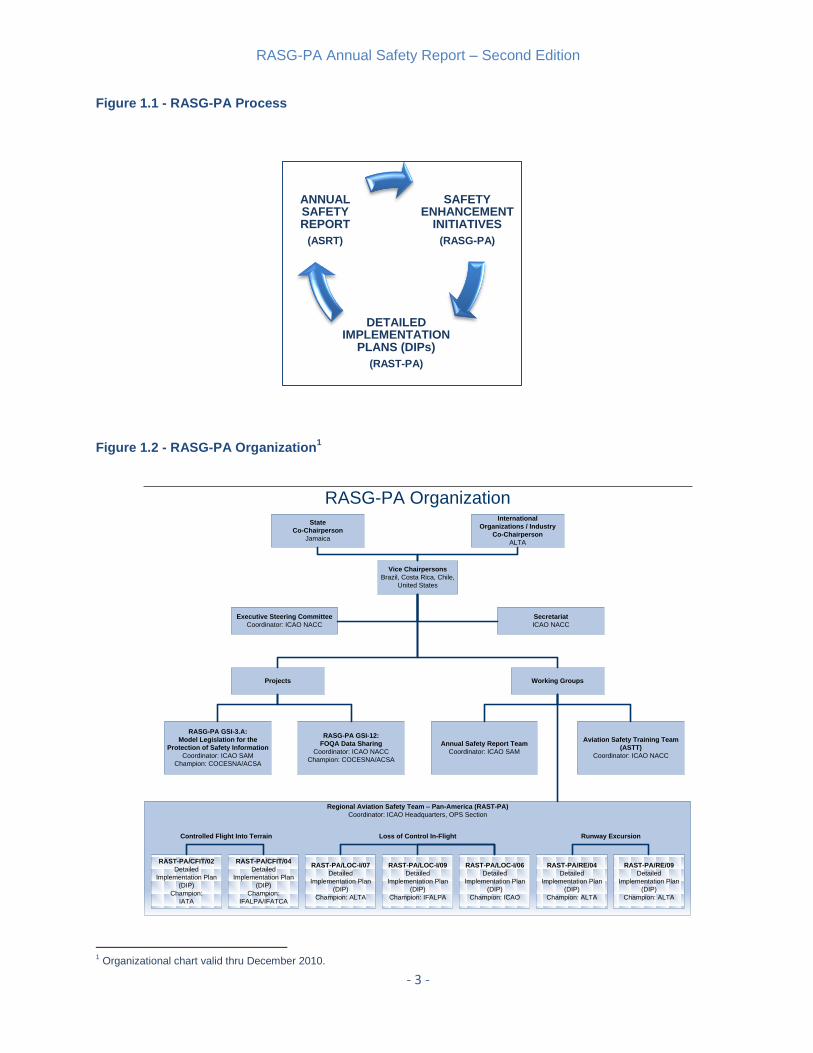
The RASG-PA process is depicted in Figure 1.1 and the organization in Figure 1.2.
Activities
Safety Enhancement Initiatives (SEIs): RASG-PA has performed an analysis of the three main risk areas
based on Pan American regional data. As a result, various Safety Enhancement Initiatives (SEIs) were
developed to reduce the rate of fatal accidents for the three main risk areas, namely: Runway Excursion
(RE), Controlled Flight Into Terrain (CFIT) and Loss of Control In-Flight (LOC-I). To implement the SEIs,
RASG-PA Annual Safety Report – Second Edition
- 2 -
RASG-PA developed Detailed Implementation Plans (DIPs) which are championed the member
States/organizations who have volunteered to lead the specific initiative based on their area of expertise.
2009 Annual Safety Report: The 2009 Annual Safety Report developed and published by RASG-PA, was
the first exclusive Safety Report for the Pan American Region based on data provided by ICAO, Boeing and
IATA. The analysis of this aviation safety data was completed through in-kind contributions of aviation safety
personnel from RASG-PA member States. This exclusive Pan American report, which has a consolidated
vision of aviation safety using sources of information from regional stakeholders, is the first of its kind in the
world. This report is envisioned to be an annual publication providing updated yearly aviation safety
information.
RASG-PA Project GSI/3A - Effective Errors and Incident Reporting: A project focused on developing and
proposing a model legal framework to protect safety information. The draft document developed by this
working group was distributed to all Pan American States, for comment, by the RASG-PA Secretariat through
a State Letter in 2010. Current activity for this project will provide a revised and restructured version of the
initial document, which is currently being reviewed by RASG-PA stakeholders. In addition, the project
participants will work closely with an ICAO established multidisciplinary group, the Safety Information
Protection Task Force (SIP TF), which is supported by Member States and international organizations, to
progress activities regarding the protection of safety data and safety information to ensure the availability of
safety information to mitigate aviation safety risks
RASG-PA Project GSI/12 - Use of Technology to Enhance Safety: A project championed by
COCESNA/ACSA focused on airline’s Flight Operations Quality Assurance (FOQA) Program. The objective
is to share information between aircraft operators, Air Traffic Services and State CAA’s to facilitate early
recognition of risks related to routine operations and how to manage and mitigate those risks. This project is
currently being conducted by the DGAC of Costa Rica and a regional air operator; it is facilitated by
COCESNA/ACSA with participation of ALTA and Airbus. As a result of this collaborative effort, early data
suggests a reduction of unstabilized approaches at the project airport.
First Pan American Aviation Safety Summit 2010: More than 200 attendees participated in the Summit on
April 19 – 23, 2010, in Sao Paulo, Brazil, including representatives from 50 companies, and civil aviation
authorities from 10 countries, as well as executives from more than 30 airlines that represent more than 90
percent of all seats flown by airlines in the region sponsored by the ICAO Regional Aviation Safety Group –
Pan America (RASG-PA) in partnership with the Latin American and Caribbean Air Transport Association
(ALTA).
Safety Training Seminar: This RASG-PA sponsored activity was conducted immediately after the First Pan
American Aviation Safety Summit in Brazil to promote training and aviation safety focused on mitigation
strategies for the top three data-driven risk areas in the region.
Meeting, Training and other RASG-PA documentation: RASG-PA meeting reports, as well as other
important material related to official activities of the group including training material, can be downloaded at:
www.mexico.icao.int/RASGPA.html. For additional information contact: [email protected]
Summary
RASG-PA is fulfilling the objective of enhancing safety in the Pan American Region by reducing
duplication of efforts, and reducing human and financial resource expenditure.
The success of RASG-PA is dependent on the commitment, participation and contributions of its members
from States and industry alike through financial and in-kind support. Results to-date have been achieved only
through the support of RASG-PA members.
RASG-PA Annual Safety Report – Second Edition
- 3 -
Figure 1.1 - RASG-PA Process
Figure 1.2 - RASG-PA Organization1
State
Co-Chairperson
Jamaica
Vice Chairpersons
Brazil, Costa Rica, Chile,
United States
Executive Steering Committee
Coordinator: ICAO NACC
Secretariat
ICAO NACC
Projects Working Groups
RASG-PA GSI-3.A:
Model Legislation for the
Protection of Safety Information
Coordinator: ICAO SAM
Champion: COCESNA/ACSA
RASG-PA GSI-12:
FOQA Data Sharing
Coordinator: ICAO NACC
Champion: COCESNA/ACSA
Annual Safety Report Team
Coordinator: ICAO SAM
Aviation Safety Training Team
(ASTT)
Coordinator: ICAO NACC
Regional Aviation Safety Team – Pan-America (RAST-PA)
Coordinator: ICAO Headquarters, OPS Section
RAST-PA/CFIT/04
Detailed
Implementation Plan
(DIP)
Champion:
IFALPA/IFATCA
RAST-PA/LOC-I/06
Detailed
Implementation Plan
(DIP)
Champion: ICAO
RAST-PA/RE/04
Detailed
Implementation Plan
(DIP)
Champion: ALTA
RAST-PA/CFIT/02
Detailed
Implementation Plan
(DIP)
Champion:
IATA
RAST-PA/RE/09
Detailed
Implementation Plan
(DIP)
Champion: ALTA
RAST-PA/LOC-I/09
Detailed
Implementation Plan
(DIP)
Champion: IFALPA
RAST-PA/LOC-I/07
Detailed
Implementation Plan
(DIP)
Champion: ALTA
Controlled Flight Into Terrain Loss of Control In-Flight Runway Excursion
RASG-PA OrganizationInternational
Organizations / Industry
Co-Chairperson
ALTA
1 Organizational chart valid thru December 2010.
SAFETY ENHANCEMENT
INITIATIVES
(RASG-PA)
DETAILED IMPLEMENTATION
PLANS (DIPs)
(RAST-PA)
ANNUAL SAFETY REPORT
(ASRT)

RASG-PA Annual Safety Report – Second Edition
- 4 -
2. Introduction
The objective of the Regional Aviation Safety Group – Pan America (RASG-PA) Annual Safety Report is to
gather safety information from different stakeholders and to identify the main aviation safety risks in the
Pan American Region in order to deploy mitigation actions for enhancing aviation safety in a coordinated
manner
Every entity involved in aviation safety collects safety data and produces safety information with a different
perspective. To ensure that all safety efforts are properly coordinated, the region must first agree on the key
risks areas.
The safety information presented in this report is based on the compilation and analysis of data provided by:
Boeing, the International Air Transport Association (IATA) and the International Civil Aviation Organization
(ICAO).
The report is aimed at directors and safety managers of States, international organizations, airlines, air
navigation services providers, airports, manufacturers, safety organizations and other key players in the
aviation sector.
The RASG-PA Annual Safety Report comprises three main sections, one for each safety information
category:
1. Reactive Information
2. Proactive Information
3. Predictive Information
It should be noted that the Reactive Information represents the largest portion of the report. As systems function to gather and process proactive and predictive information for the Pan American Region to achieve maturity, balance between the contents in each section will be reached.
Figure 2.1 - Pan American Region (ICAO NACC and ICAO SAM)

RASG-PA Annual Safety Report – Second Edition
- 5 -
3. Executive Summary
The RASG-PA 2011 Annual Safety Report collates and presents the analysis made by the Group about
aviation accidents in the Pan American Region by extracting safety information collected from ICAO, Boeing
and IATA.
The analysis of this information showed a strong correlation in the following categories as the top fatal
accident categories for the 2001-2010 period:
1. Loss of Control In-flight (LOC-I)
2. Runway Excursion (RE)
3. Controlled Flight Into Terrain (CFIT)
Although there are different points of view among the stakeholders, this fact relies on the amount of data
available and the criterions for analysis used by them. The users of this report are invited to extract and use
the information presented according to their own safety concerns and operational reality.
In the Pan American Region, the number of accidents in 2010 was 34.4% below 2009, and 46.3% below the
10 year average. The fatalities on board in 2010 were 5.5% below the previous year, and 41.0% below the 10
year average.
PAN AMERICA Accidents2 Fatal Accidents Fatalities on
board Fatalities on
ground
2000-2009 avg. 379.7 93.3 404.8 7.8
2009 311 59 253 2
2010 204 53 239 3
Moreover, 9 of the 53 fatal accidents in 2010 involved aircraft with maximum takeoff mass above 5,700 kg, 2
of them occurred in Colombia, 1 in Cuba, 1 in Mexico, 1 in Suriname, 2 in the United States of America and 2
in Venezuela.
It should be noted that LOC-I and CFIT showed decreasing trends, meanwhile System-component
failure/malfunction (non powerplant) (SCF-NP) and Unknown (UNK) occurrences are emerging categories in
the Region. The monitoring of the behavior of these occurrences should be maintained to determine the
impact of mitigation strategies.
On the other hand, proactive safety information from the results of the ICAO USOAP shows a high level of
lack of effective implementation (LEI) of ICAO SARPs in some States of the Region. Moreover, qualification
and training of the technical staff became the most affected critical element in the Region. It would be
worthwhile to determine if there is a correlation among this critical element and UNK categorized occurrences
(showing an increasing trend), in order to develop strategies supported in the Global Safety Initiative # 4 (GSI
#4) of the GASP (to address effective incident and accident investigation).
The implementation of systems to capture and analyze information by the States, such as
ADREP3/ECCAIRS
4, will allow appropriate application of safety strategies applicable to the Region and to
each State. Currently, only 44% of the reports belonging to the Pan American Region are officially notified to
ICAO.
2 Source: ICAO ADREP/ECCAIRS. Accidents as defined in ICAO Annex 13. Only aircraft maximum takeoff mass above 2,250 kg
included. 3 ADREP: Accident/Incident Data Reporting System (ICAO). Receives, stores and provide States with occurrence data.
4 ECCAIRS is a system developed and maintained by the European Co-ordination Centre to assist organizations in collecting, sharing
and analyzing safety information. This system was adopted by ICAO for reporting according ADREP requirements.
RASG-PA Annual Safety Report – Second Edition
- 6 -
4. Safety Information
Information is the input of any safety management process; hazards can be identified through processing and
analysis by these means, after hazards are identified the associated risk and consequences will be assessed
and recommended mitigation actions will be provided to decision-makers for the final decision to implement
and allocate resources.
RASG-PA can be viewed as a regional safety management process or a regional safety program (RSP) in
the same way a State Safety Program (SSP) is a national safety management process and a Safety
Management System is a service provider’s safety management program.
The following sections show the results of safety information analysis gathered by different stakeholders and
grouped as reactive, proactive and predictive safety information.
4.1 Reactive Safety Information
ICAO established a reduction in the number of fatal accidents and fatalities worldwide as Safety Targets
for 2008-20115 irrespective of the volume of air traffic to achieve a significant decrease in accident rates
particularly for regions where those numbers remain high and to reduce regional accident rates so that no
region has a rate above twice the worldwide rate by the end of 2011. This section will assist with
comprehending behaviour of the Pan American Region in regard to accidents on a world-region-state basis.
The process followed by the Annual Safety Report Team (ASRT) to analyze reactive information consisted of
retrieving safety data from ICAO, IATA and Boeing, narrowing the search to include the States/Territories of
North America, Central America, the Caribbean and South America.
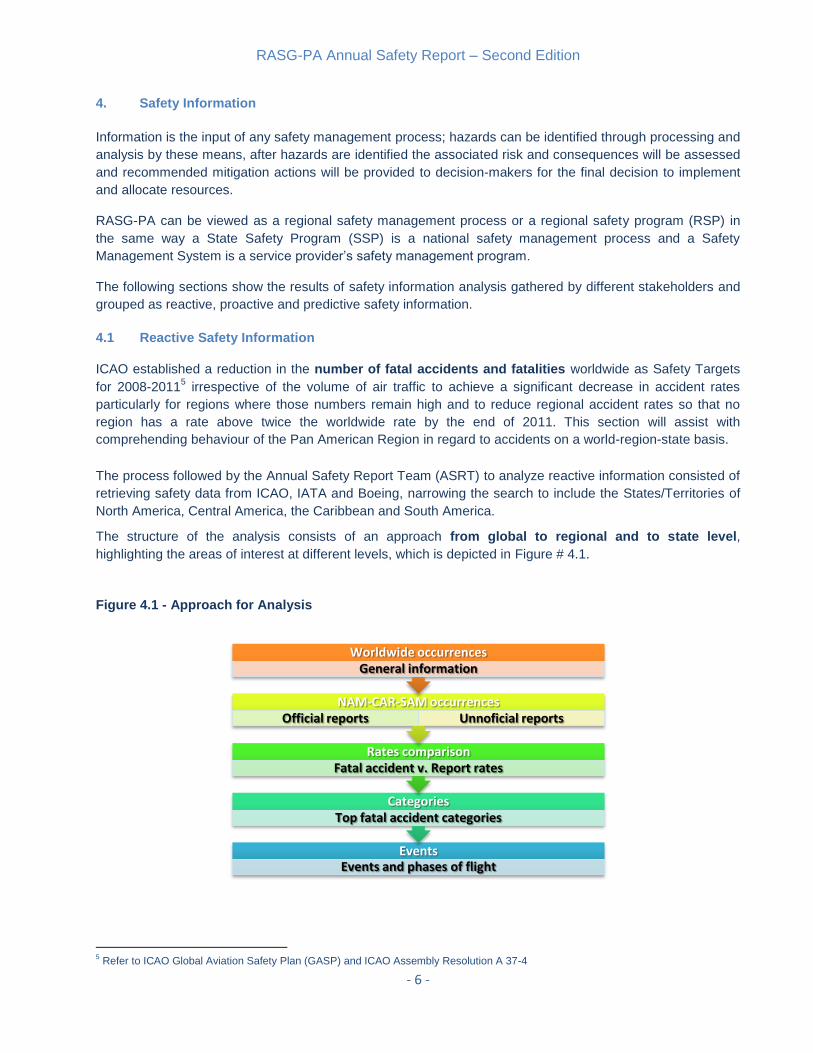
The structure of the analysis consists of an approach from global to regional and to state level,
highlighting the areas of interest at different levels, which is depicted in Figure # 4.1.
Figure 4.1 - Approach for Analysis
5 Refer to ICAO Global Aviation Safety Plan (GASP) and ICAO Assembly Resolution A 37-4
Events Events and phases of flight
Categories Top fatal accident categories
Rates comparison Fatal accident v. Report rates
NAM-CAR-SAM occurrences Official reports Unnoficial reports
Worldwide occurrences General information

RASG-PA Annual Safety Report – Second Edition
- 7 -
4.1.1 Worldwide Information
There were 14,950 occurrences reports in the ICAO ADREP/ECCAIRS database for the period from 2001-2010: 6,156 from the NAM Region, 179 from the CAR Region, 843 from the SAM Region and the rest from other Regions, which is shown in Figure 4.2:
Figure 4.2 – Reports – General Distribution per Region 2001 - 2010
The registered occurrences showed the following distribution across the same period:
Figure 4.3 - Reports Distribution per Year 2001 - 2010
41.18%
1.20%
5.64%
51.99%
Reports - General Distribution per Region 2001 - 2010
Source: ICAO ADREP/ECCAIRS
NAM CAR SAM Other Regions
0
500
1000
1500
2000
2500
2001 2002 2003 2004 2005 2006 2007 2008 2009 2010
Nu
mb
er
of
Re
po
rts
Year
Reports Distribution per Year 2001 - 2010 Source: ICAO ADREP/ECCAIRS
NAM CAR SAM Other Regions
RASG-PA Annual Safety Report – Second Edition
- 8 -
The most significant variation in the period was registered in two of the States of the NAM Region due to
the reduction of the number of occurrences reported. On the other hand, at the end of the period, the number
of reports in other Regions increased from 834 in the year 2009 to 2,242 in the year 2010. It should be noted
that the number of reports over this period does not necessarily mean high rates of accidents, serious
incidents or incidents. They can be associated with the level of the aeronautical activity and reporting
policies, especially those related to incident reporting.
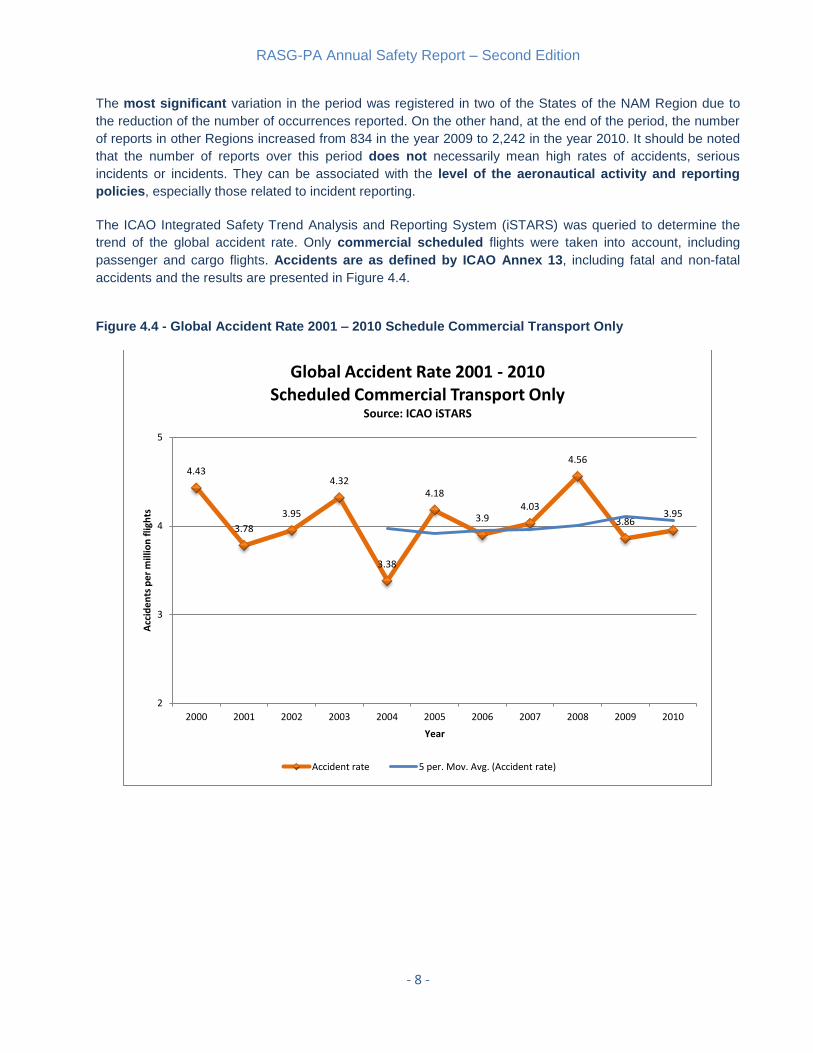
The ICAO Integrated Safety Trend Analysis and Reporting System (iSTARS) was queried to determine the
trend of the global accident rate. Only commercial scheduled flights were taken into account, including
passenger and cargo flights. Accidents are as defined by ICAO Annex 13, including fatal and non-fatal
accidents and the results are presented in Figure 4.4.
Figure 4.4 - Global Accident Rate 2001 – 2010 Schedule Commercial Transport Only
4.43
3.78
3.95
4.32
3.38
4.18
3.9 4.03
4.56
3.86 3.95
2
3
4
5
2000 2001 2002 2003 2004 2005 2006 2007 2008 2009 2010
Acc
ide
nts
pe
r m
illio
n f
ligh
ts
Year
Global Accident Rate 2001 - 2010 Scheduled Commercial Transport Only
Source: ICAO iSTARS
Accident rate 5 per. Mov. Avg. (Accident rate)
RASG-PA Annual Safety Report – Second Edition
- 9 -
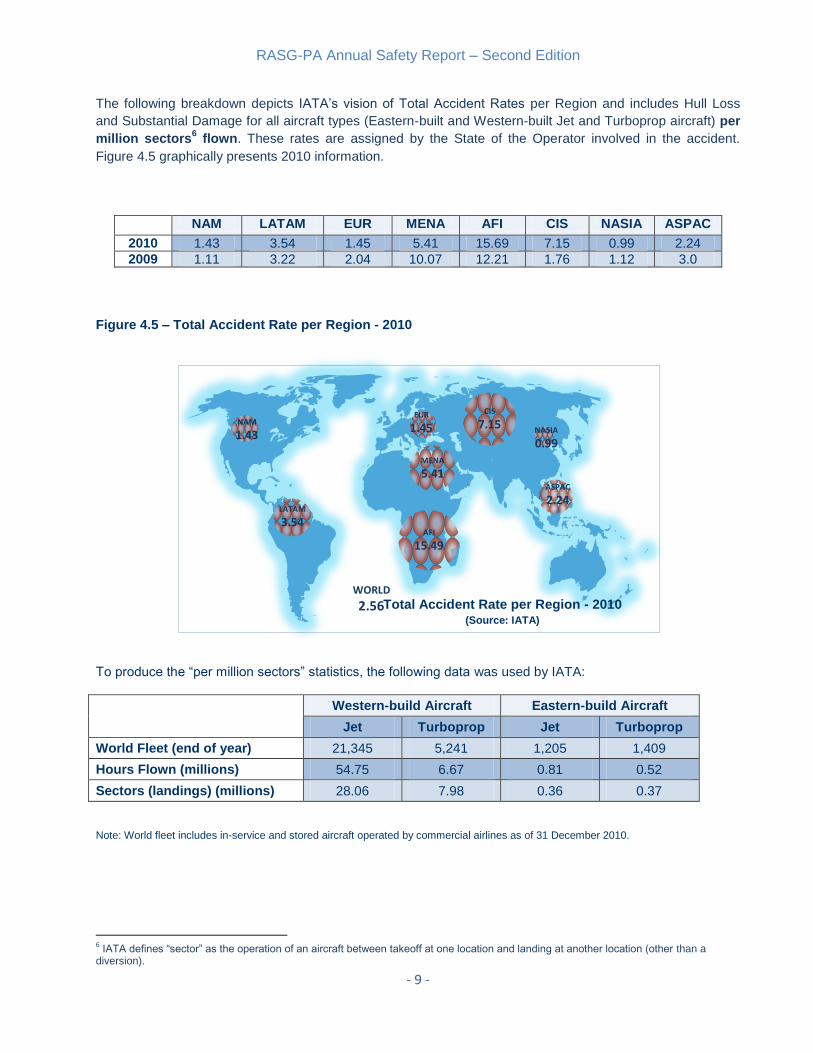
The following breakdown depicts IATA’s vision of Total Accident Rates per Region and includes Hull Loss
and Substantial Damage for all aircraft types (Eastern-built and Western-built Jet and Turboprop aircraft) per
million sectors6 flown. These rates are assigned by the State of the Operator involved in the accident.
Figure 4.5 graphically presents 2010 information.
NAM LATAM EUR MENA AFI CIS NASIA ASPAC
2010 1.43 3.54 1.45 5.41 15.69 7.15 0.99 2.24
2009 1.11 3.22 2.04 10.07 12.21 1.76 1.12 3.0
Figure 4.5 – Total Accident Rate per Region - 2010
To produce the “per million sectors” statistics, the following data was used by IATA:
Western-build Aircraft Eastern-build Aircraft
Jet Turboprop Jet Turboprop
World Fleet (end of year) 21,345 5,241 1,205 1,409
Hours Flown (millions) 54.75 6.67 0.81 0.52
Sectors (landings) (millions) 28.06 7.98 0.36 0.37
Note: World fleet includes in-service and stored aircraft operated by commercial airlines as of 31 December 2010.
6 IATA defines “sector” as the operation of an aircraft between takeoff at one location and landing at another location (other than a
diversion).
NAM
1.43
LATAM
3.54
CIS
7.15EUR
1.45
MENA
5.41
NASIA
0.99
AFI
15.49
ASPAC
2.24
WORLD
2.56Total Accident Rate per Region - 2010 (Source: IATA)

RASG-PA Annual Safety Report – Second Edition
- 10 -
According to IATA criteria, there were 94 accidents in 2010. 2008-2010 distribution per Region is presented
in the following breakdown:
AFI ASPAC CIS EUR LATAM MENA NAM NASIA
Accidents 2010 19 12 9 12 12 9 18 3
Accidents 2009 14 15 2 17 10 15 14 3
Accidents 2008 7 19 10 17 19 12 24 1
Fatal Accidents 5 4 3 0 5 2 3 1
Fatalities (Crew and passengers) 129 334 22 0 100 147 12 42
IATA stated that 63% of the accidents involved jet powered aircraft, and the 37% remaining implicated
turboprops. Regarding types of operation involved in accidents, IATA also stated that 73% occurred in
passenger transport, 25% in cargo operations and 2% in ferry flights.
Figure 4.6 shows a comparison of accidents categories worldwide.
Figure 4.6 - Accident Categories Comparison World Wide 2008 - 2010
The Boeing statistics compared the different types of accident and established Runway Excursion,
Controlled Flight into Terrain and Loss of Control In-flight as the three most frequent categories. The
following figure shows the distribution of the accident categories in percentage of total accidents. Fatality risk
is intended to represent the portion of fatalities occurred per a specific type of accident.
0.00% 10.00% 20.00% 30.00% 40.00% 50.00% 60.00% 70.00% 80.00%
Mid Air Collision
Runway Collision
Other
Tailstrike
Off Airport Landing/Ditching
Hard Landing
Controlled Flight into Terrain
Undershoot
In-flight damage
Loss of Control in-flight
Ground Damage
Gear-up Landing/Gear Collapse
Runway Excursion
Accident Categories Comparison World Wide 2008 - 2010 (Source: IATA)
2008 2009 2010

RASG-PA Annual Safety Report – Second Edition
- 11 -
Figure 4.7 –World Wide Hull Loss and Fatal Accidents 1987 – 2009
Figure 4.7 also shows that occurrences during landing such as runway excursions and abnormal runway
contact represent almost 30% of the total accidents (1987-2009), being consistent with the analysis
conducted by IATA, which shows that the most common phases of flight for the 94 worldwide accidents
(IATA, 2010) were landing (45.8%) and approach (13.8%), as presented in figure 4.8.
Figure 4.8 – World Wide Accidents per Phase of Flight - 2010
4.1.2 Regional Information
4.1.2.1 Reporting Culture and Accidents in the Pan American Region
The following information provides a metric for the reporting culture in the Pan American Region. The
ICAO ADREP/ECCAIRS database was queried to retrieve official and unofficial records. Official reports are
based on information provided by the States in compliance with the international standards of ICAO Annex
13. On the other hand, unofficial reports include occurrences where there is sufficient information to code
0.0%
5.0%
10.0%
15.0%
20.0%
25.0%
30.0%
35.0%
40.0%
45.0% P
erc
en
tage
of
Tota
l
World Wide Hull Loss and Fatal Accidents* 1987 -2009 Source: Boeing
Fatality Risk Accidents
*Western built airplanes, Part 121 equivalent operations
0 3 3
1
8
0
6 4 5
0
13
1
43
5
0 0 0 2
0
10
20
30
40
50
FLP PRF ESD TXO TOF RTO ICL ECL CRZ DST APR GOA LND TXI AES PSF FLC GDS
Nu
mb
er
of
acci
de
nts
Phase of Flight
World Wide Accidents per Phase of Flight 2010 Source: IATA
RASG-PA Annual Safety Report – Second Edition
- 12 -
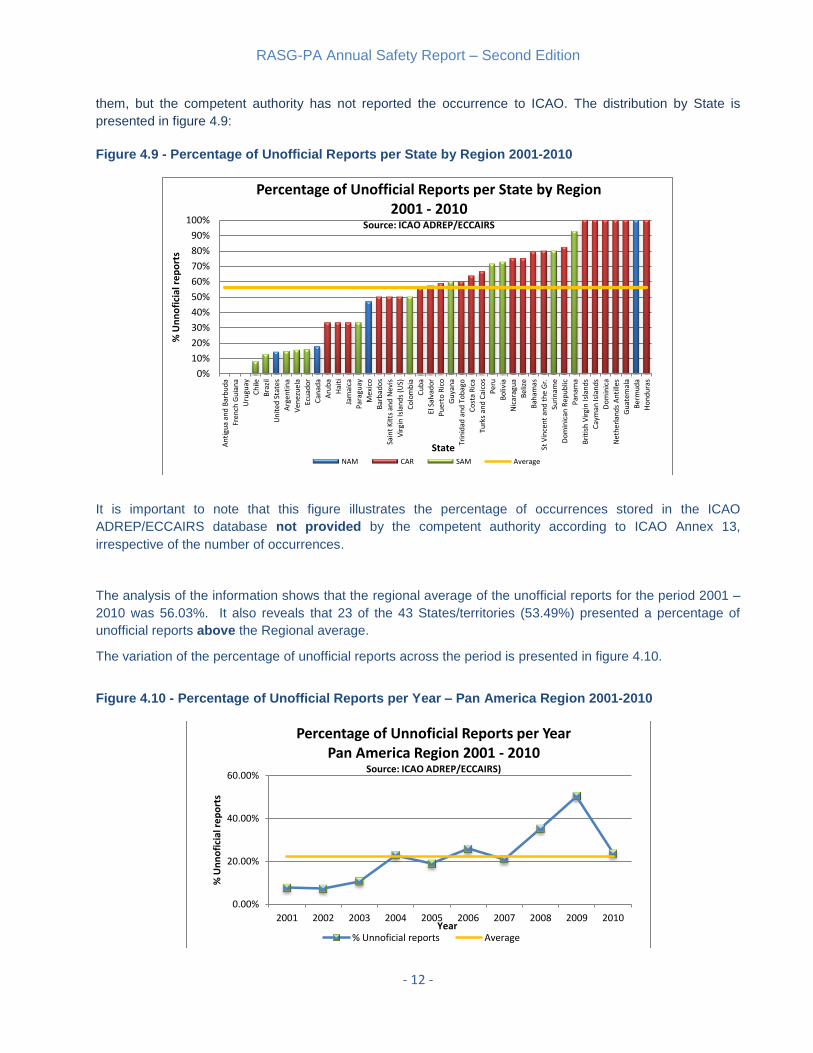
them, but the competent authority has not reported the occurrence to ICAO. The distribution by State is
presented in figure 4.9:
Figure 4.9 - Percentage of Unofficial Reports per State by Region 2001-2010
It is important to note that this figure illustrates the percentage of occurrences stored in the ICAO
ADREP/ECCAIRS database not provided by the competent authority according to ICAO Annex 13,
irrespective of the number of occurrences.
The analysis of the information shows that the regional average of the unofficial reports for the period 2001 –
2010 was 56.03%. It also reveals that 23 of the 43 States/territories (53.49%) presented a percentage of
unofficial reports above the Regional average.
The variation of the percentage of unofficial reports across the period is presented in figure 4.10.
Figure 4.10 - Percentage of Unofficial Reports per Year – Pan America Region 2001-2010
0%
10%
20%
30%
40%
50%
60%
70%
80%
90%
100% A
nti
gua
and
Bar
bu
da
Fren
ch G
uia
na
Uru
guay
Ch
ile
Bra
zil
Un
ited
Sta
tes
Arg
enti
na
Ven
ezu
ela
Ecu
ado
r
Can
ada
Aru
ba
Hai
ti
Jam
aica
Par
agu
ay
Mex
ico
Bar
bad
os
Sain
t K
itts
an
d N
evis
Vir
gin
Isla
nd
s (U
S)
Co
lom
bia
Cu
ba
El S
alva
do
r
Pu
ert
o R
ico
Gu
yan
a
Trin
idad
an
d T
ob
ago
Co
sta
Ric
a
Turk
s an
d C
aico
s
Pe
ru
Bo
livia
Nic
arag
ua
Bel
ize
Bah
amas
St V
ince
nt
and
th
e G
r.
Suri
nam
e
Do
min
ican
Rep
ub
lic
Pan
ama
Bri
tish
Vir
gin
Isl
and
s
Cay
man
Isla
nd
s
Do
min
ica
Net
her
lan
ds
An
tille
s
Gu
atem
ala
Ber
mu
da
Ho
nd
ura
s
% U
nn
ofi
cial
re
po
rts
State
Percentage of Unofficial Reports per State by Region 2001 - 2010
Source: ICAO ADREP/ECCAIRS
NAM CAR SAM Average
0.00%
20.00%
40.00%
60.00%
2001 2002 2003 2004 2005 2006 2007 2008 2009 2010
% U
nn
ofi
cial
re
po
rts
Year
Percentage of Unnoficial Reports per Year Pan America Region 2001 - 2010
Source: ICAO ADREP/ECCAIRS)
% Unnoficial reports Average

RASG-PA Annual Safety Report – Second Edition
- 13 -
It should be noted that even when the percentage of unofficial reports tends to be higher than the average
from 2004 and on, a significant reduction occurred in 2010. Specific analysis should be conducted to
determine if it was a result of changes in reporting policies or reporting culture associated with the
implementation of reporting technologies in the region.
According to the ICAO ADREP/ECCAIRS database, there were 155 fatal accidents in the Pan American
Region between 2001 and 2010. The criteria used for this query included only accidents as defined by ICAO
Annex 13 involving fatalities and aircraft with Maximum Take-off Mass (MTOM) above 5,700 kilograms. It
was also found that 7 of these accidents occurred in the CAR Region, 51 in the SAM Region and 97 in the
NAM Region. Figure 4.11 shows the distribution per year and region across the period.
Figure 4.11- Fatal Accidents Distribution per Year - Pan America Region 2001-2010
To establish a relationship between reporting and fatal accidents per million departures, a more in-depth
analysis was conducted considering the previously identified accidents and the number of departures of
aircraft with Maximum Take-off Mass (MTOM) above 5,700 kg.
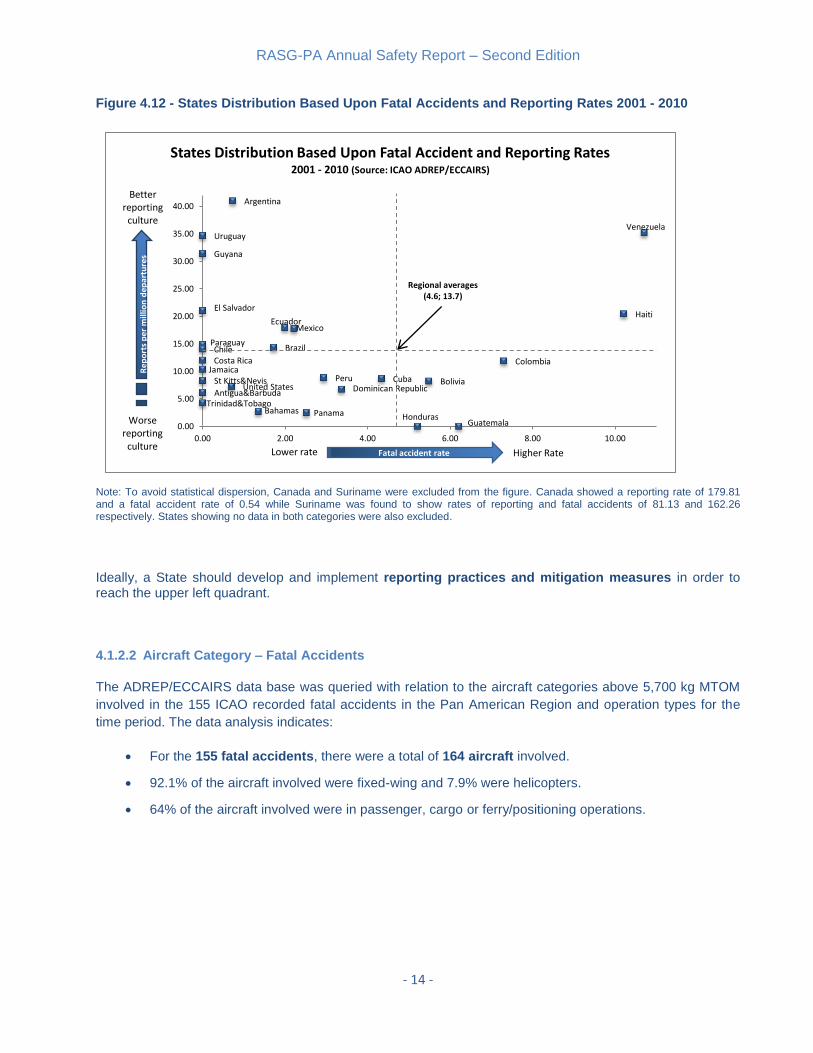
The Pan American Region averages for fatal accidents and report rates were 4.60 and 13.70 per million
departures, respectively. A new breakdown was created defining four quadrants over the averages as
presented in figure 4.12.
0
5
10
15
20
2001 2002 2003 2004 2005 2006 2007 2008 2009 2010
Fata
l acc
ide
nts
Year
Fatal Accidents Distribution per Year Pan America Region 2001 - 2010
Source: ICAO ADREP/ECCAIRS
NAM CAR SAM
RASG-PA Annual Safety Report – Second Edition
- 14 -
Figure 4.12 - States Distribution Based Upon Fatal Accidents and Reporting Rates 2001 - 2010
Note: To avoid statistical dispersion, Canada and Suriname were excluded from the figure. Canada showed a reporting rate of 179.81 and a fatal accident rate of 0.54 while Suriname was found to show rates of reporting and fatal accidents of 81.13 and 162.26 respectively. States showing no data in both categories were also excluded.
Ideally, a State should develop and implement reporting practices and mitigation measures in order to reach the upper left quadrant.
4.1.2.2 Aircraft Category – Fatal Accidents
The ADREP/ECCAIRS data base was queried with relation to the aircraft categories above 5,700 kg MTOM
involved in the 155 ICAO recorded fatal accidents in the Pan American Region and operation types for the
time period. The data analysis indicates:
For the 155 fatal accidents, there were a total of 164 aircraft involved.
92.1% of the aircraft involved were fixed-wing and 7.9% were helicopters.
64% of the aircraft involved were in passenger, cargo or ferry/positioning operations.
Argentina
Venezuela Uruguay
Guyana
El Salvador Haiti
Mexico Ecuador
Paraguay Brazil Chile
Costa Rica Colombia Jamaica
Peru Cuba St Kitts&Nevis Bolivia United States Dominican Republic Antigua&Barbuda
Trinidad&Tobago Bahamas Panama
Guatemala Honduras
0.00
5.00
10.00
15.00
20.00
25.00
30.00
35.00
40.00
0.00 2.00 4.00 6.00 8.00 10.00
Rep
ort
s p
er m
illio
n d
epar
ture
s
Fatal accident rate
States Distribution Based Upon Fatal Accident and Reporting Rates 2001 - 2010 (Source: ICAO ADREP/ECCAIRS)
Fatal accident rate Lower rate Higher Rate
Regional averages (4.6; 13.7)
Better reporting
culture
Worse reporting
culture

RASG-PA Annual Safety Report – Second Edition
- 15 -
Figure 4.13 represents the afore-mentioned and other findings.
Figure 4.13 Aircraft Category by Operation – Fatal Accidents 2001-2010
The above-mentioned information is also consistent with the data provided by IATA for 2010 NAM and
LATAM regions accidents according to which, 72% of the accidents occurred in the NAM were in passenger
operations and the 28% remaining, during cargo flights. In LATAM, 92% of the accidents occurred in
passenger operations and the 8% remaining were cargo operations.
4.1.3 Main findings
4.1.3.1 Contributing Factors to 2010 Accidents in NAM and LATAM Regions (IATA)
This section presents an in-depth analysis of the 2010 IATA recorded occurrences for the NAM and
LATAM Regions to identify common issues that can be shared by operators and States located in the same
region to develop suitable prevention strategies using an IATA developed accident classification system
based on the Threat and Error Management (TEM) framework.
0 10 20 30 40 50 60
Air taxi
Construction/sling load
Coast guard
Illegal
Emergency medical service
Gov. Excluding state flights
Demonstration
Military
Unknown
Agricultural
Flight training/instructional
Logging
Other
State flights
Test/experimental
Fire fighting
Business
Pleasure
Ferry/positioning
Cargo
Passenger
Number of Aircraft
Aircraft Category by Operation Fatal Accidents - Aircraft MTOM above 5,700 kg
Pan America 2001-2010 Source: ICAO ADREP/ECCAIRS
Helicopter
Fixed wing
RASG-PA Annual Safety Report – Second Edition
- 16 -
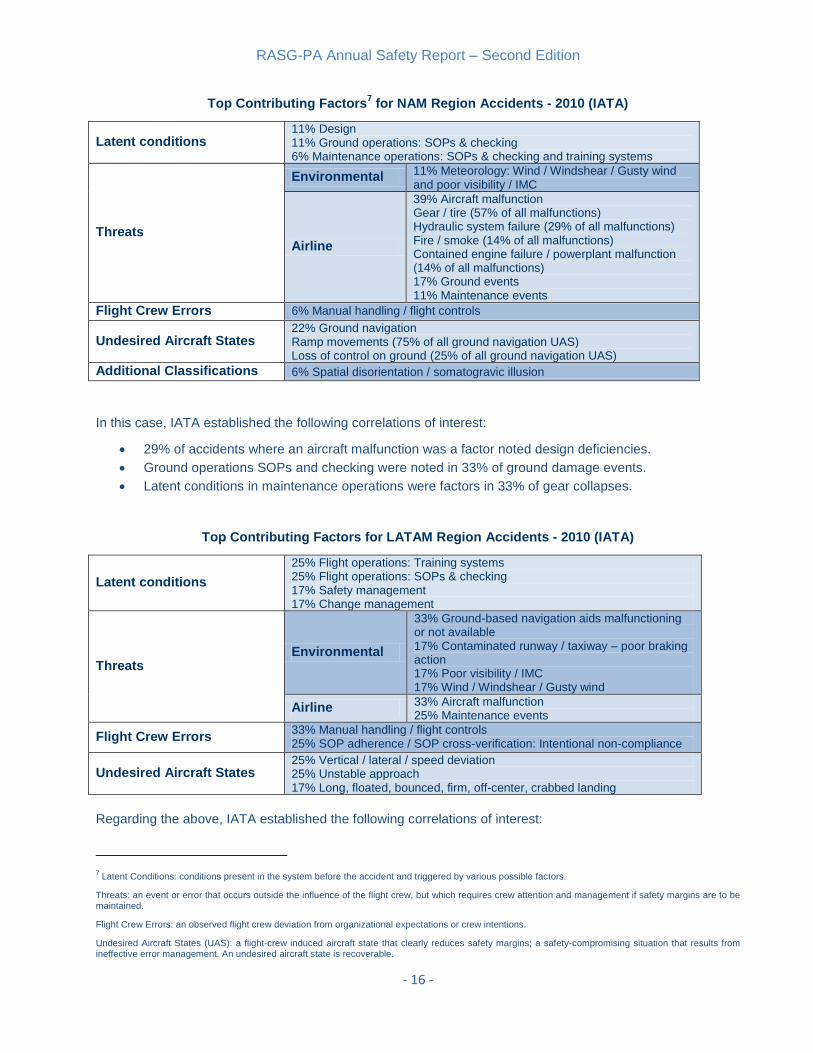
Top Contributing Factors7 for NAM Region Accidents - 2010 (IATA)
Latent conditions 11% Design 11% Ground operations: SOPs & checking 6% Maintenance operations: SOPs & checking and training systems
Threats
Environmental 11% Meteorology: Wind / Windshear / Gusty wind and poor visibility / IMC
Airline
39% Aircraft malfunction Gear / tire (57% of all malfunctions) Hydraulic system failure (29% of all malfunctions) Fire / smoke (14% of all malfunctions) Contained engine failure / powerplant malfunction (14% of all malfunctions) 17% Ground events 11% Maintenance events
Flight Crew Errors 6% Manual handling / flight controls
Undesired Aircraft States 22% Ground navigation Ramp movements (75% of all ground navigation UAS) Loss of control on ground (25% of all ground navigation UAS)
Additional Classifications 6% Spatial disorientation / somatogravic illusion
In this case, IATA established the following correlations of interest:
29% of accidents where an aircraft malfunction was a factor noted design deficiencies.
Ground operations SOPs and checking were noted in 33% of ground damage events.
Latent conditions in maintenance operations were factors in 33% of gear collapses.
Top Contributing Factors for LATAM Region Accidents - 2010 (IATA)
Latent conditions
25% Flight operations: Training systems 25% Flight operations: SOPs & checking 17% Safety management 17% Change management
Threats Environmental
33% Ground-based navigation aids malfunctioning or not available 17% Contaminated runway / taxiway – poor braking action 17% Poor visibility / IMC 17% Wind / Windshear / Gusty wind
Airline 33% Aircraft malfunction 25% Maintenance events
Flight Crew Errors 33% Manual handling / flight controls 25% SOP adherence / SOP cross-verification: Intentional non-compliance
Undesired Aircraft States 25% Vertical / lateral / speed deviation 25% Unstable approach 17% Long, floated, bounced, firm, off-center, crabbed landing
Regarding the above, IATA established the following correlations of interest:
7 Latent Conditions: conditions present in the system before the accident and triggered by various possible factors.
Threats: an event or error that occurs outside the influence of the flight crew, but which requires crew attention and management if safety margins are to be maintained.
Flight Crew Errors: an observed flight crew deviation from organizational expectations or crew intentions.
Undesired Aircraft States (UAS): a flight-crew induced aircraft state that clearly reduces safety margins; a safety-compromising situation that results from ineffective error management. An undesired aircraft state is recoverable.

RASG-PA Annual Safety Report – Second Edition
- 17 -
When lack of available ground-based navigation aids was a factor, 75% of accidents cited
intentional non-compliance with SOPs and vertical / lateral / speed deviations as factors as well.
Deficiencies in SOPs and checking were noted in 75% of accidents where manual handling was a
factor.
The operator’s safety management was cited as a factor in 67% of unstable approaches.
4.1.3.2 Most Frequent Categories
In order to determine the most relevant categories for each region according to ICAO taxonomy (CICTT), a
further analysis of ICAO accident records already mentioned (see 4.1.2.2) was conducted. A breakdown of
the top 17 categories (from the 34 existing) is presented in figure 4.15.
Figure 4.15 – Pan America Top Fatal Accident Categories 2001 - 2010
As observed in the previous figure, ICAO top fatal accident categories are Loss of Control In-flight and
Controlled Flight into Terrain. Nevertheless, both of them show significant reductions in the last time period
(2006-2010). On the other hand, runway excursions, system-component failures/malfunctions (non-
powerplant) and occurrences categorized as unknown/undetermined increased considerably in the last
five-year period.
As explained at the beginning of this chapter, any safety management process depends on the quantity and
quality of information. Thus, reactive information that resulted from accident investigations became extremely
important for improving safety. Further analysis should be conducted to determine and propose means to
facilitate the achievement of the Global Aviation Safety Plan (GASP) GSI # 4 objective to implement effective
incident and accident investigations and, consequently, reduce the number of “unknown” categorised
occurrences.
3 2 2 4 3 2 1
3 2
8 11
7 7
12
4
23 23
1 1 1 2 3
2 3
3
5 9 9
5 20
11 13
0
5
10
15
20
25
30
35
40
Tim
es
rep
ort
ed
Categories
Pan America Top Fatal Accident Categories 2001 - 2010
(Source: ICAO ADREP/ECCAIRS)
2001-2005 2006-2010
RASG-PA Annual Safety Report – Second Edition
- 18 -
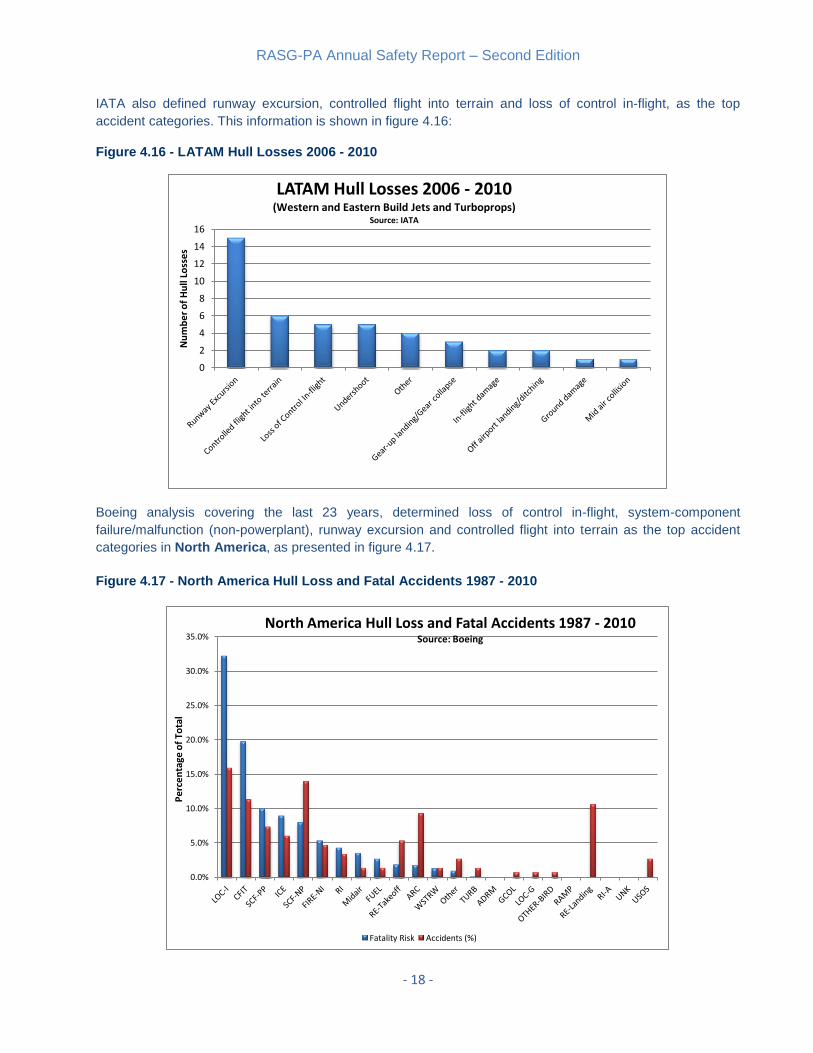
IATA also defined runway excursion, controlled flight into terrain and loss of control in-flight, as the top
accident categories. This information is shown in figure 4.16:
Figure 4.16 - LATAM Hull Losses 2006 - 2010
Boeing analysis covering the last 23 years, determined loss of control in-flight, system-component
failure/malfunction (non-powerplant), runway excursion and controlled flight into terrain as the top accident
categories in North America, as presented in figure 4.17.
Figure 4.17 - North America Hull Loss and Fatal Accidents 1987 - 2010
0
2
4
6
8
10
12
14
16
Nu
mb
er
of
Hu
ll Lo
sse
s LATAM Hull Losses 2006 - 2010
(Western and Eastern Build Jets and Turboprops) Source: IATA
0.0%
5.0%
10.0%
15.0%
20.0%
25.0%
30.0%
35.0%
Pe
rce
nta
ge o
f To
tal
North America Hull Loss and Fatal Accidents 1987 - 2010 Source: Boeing
Fatality Risk Accidents (%)

RASG-PA Annual Safety Report – Second Edition
- 19 -
According to Boeing, the most frequent categories in Latin America and the Caribbean are runway
excursion, controlled flight into terrain and loss of control in-flight, as presented in figure 4.18.
Figure 4.18 - Latin America and Caribbean Hull Loss and Fatal Accidents 1987 - 2010
4.1.3.2.1 In-depth Analysis of Runway Excursion (RE) Data
According to Boeing statistics, the distribution of this type of occurrence from 1987-2010, divided by operator
domicile in the Pan American Region, shows the following trend:
Figure 4.19 - RE – Operator Domicile: North America 1987 - 2010
0.0%
10.0%
20.0%
30.0%
40.0%
50.0%
60.0%
Pe
rce
nta
ge o
f To
tal
Latin America and Caribbean Hull Loss and Fatal Accidents 1987 - 2010
Source: Boeing
Fatality Risk Accidents
0
1
2
3
4
5
1987 1989 1991 1993 1995 1997 1999 2001 2003 2005 2007 2009
Nu
mb
er
of
Acc
ide
nts
RE - Operator Domicile: North America 1987 - 2010 Source: Boeing
RE - Landing RE- Takeoff
RASG-PA Annual Safety Report – Second Edition
- 20 -
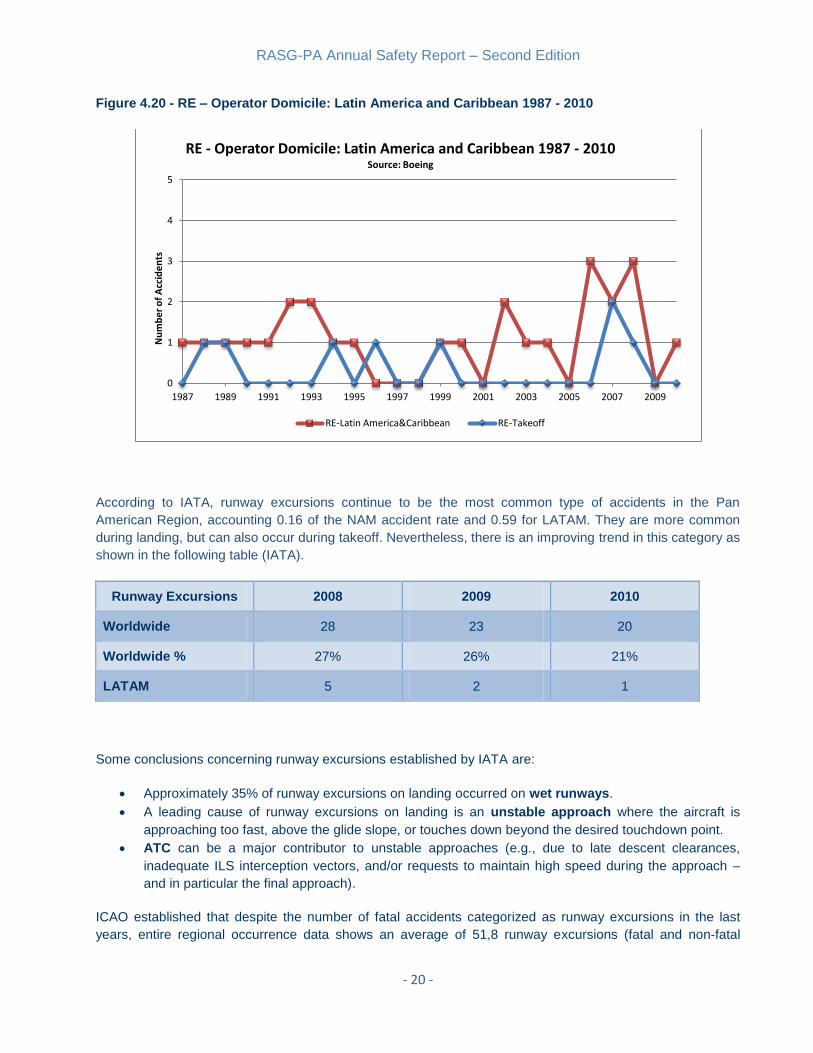
Figure 4.20 - RE – Operator Domicile: Latin America and Caribbean 1987 - 2010
According to IATA, runway excursions continue to be the most common type of accidents in the Pan
American Region, accounting 0.16 of the NAM accident rate and 0.59 for LATAM. They are more common
during landing, but can also occur during takeoff. Nevertheless, there is an improving trend in this category as
shown in the following table (IATA).
Runway Excursions 2008 2009 2010
Worldwide 28 23 20
Worldwide % 27% 26% 21%
LATAM 5 2 1
Some conclusions concerning runway excursions established by IATA are:
Approximately 35% of runway excursions on landing occurred on wet runways.
A leading cause of runway excursions on landing is an unstable approach where the aircraft is
approaching too fast, above the glide slope, or touches down beyond the desired touchdown point.
ATC can be a major contributor to unstable approaches (e.g., due to late descent clearances,
inadequate ILS interception vectors, and/or requests to maintain high speed during the approach –
and in particular the final approach).
ICAO established that despite the number of fatal accidents categorized as runway excursions in the last
years, entire regional occurrence data shows an average of 51,8 runway excursions (fatal and non-fatal
0
1
2
3
4
5
1987 1989 1991 1993 1995 1997 1999 2001 2003 2005 2007 2009
Nu
mb
er
of
Acc
ide
nts
RE - Operator Domicile: Latin America and Caribbean 1987 - 2010
Source: Boeing
RE-Latin America&Caribbean RE-Takeoff
RASG-PA Annual Safety Report – Second Edition
- 21 -
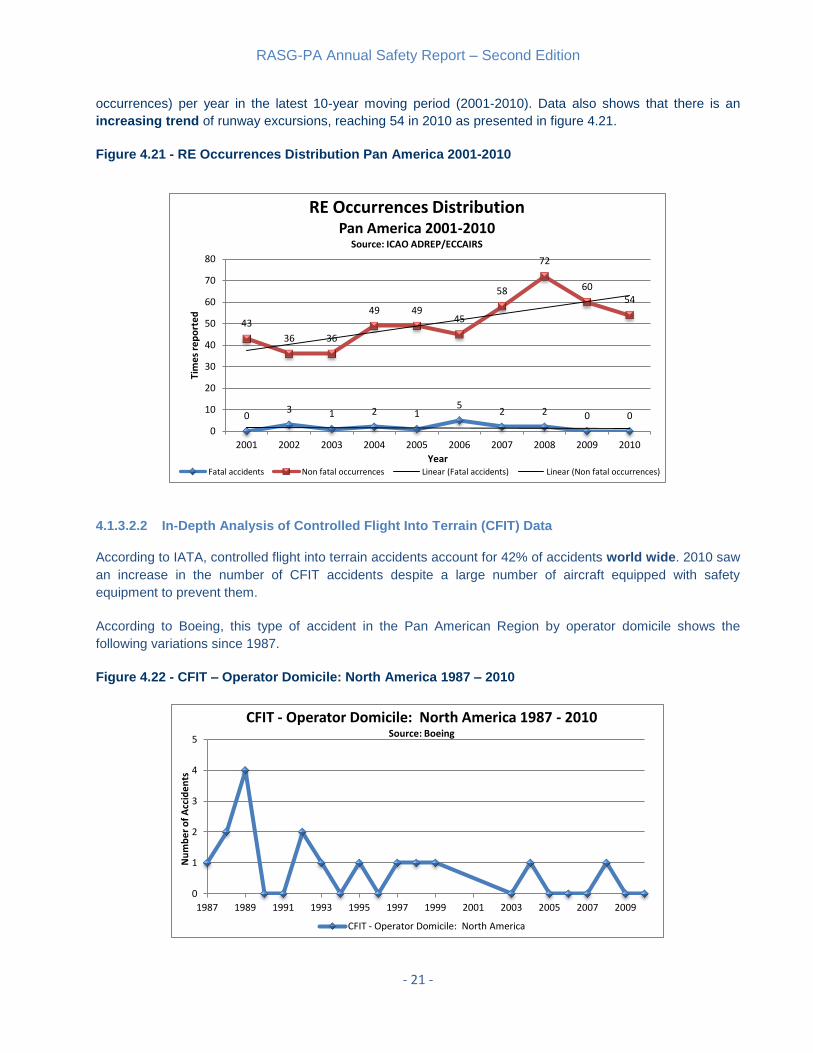
occurrences) per year in the latest 10-year moving period (2001-2010). Data also shows that there is an
increasing trend of runway excursions, reaching 54 in 2010 as presented in figure 4.21.
Figure 4.21 - RE Occurrences Distribution Pan America 2001-2010
4.1.3.2.2 In-Depth Analysis of Controlled Flight Into Terrain (CFIT) Data
According to IATA, controlled flight into terrain accidents account for 42% of accidents world wide. 2010 saw
an increase in the number of CFIT accidents despite a large number of aircraft equipped with safety
equipment to prevent them.
According to Boeing, this type of accident in the Pan American Region by operator domicile shows the
following variations since 1987.
Figure 4.22 - CFIT – Operator Domicile: North America 1987 – 2010
0 3 1 2 1
5 2 2 0 0
43
36 36
49 49 45
58
72
60 54
0
10
20
30
40
50
60
70
80
2001 2002 2003 2004 2005 2006 2007 2008 2009 2010
Tim
es
rep
ort
ed
Year
RE Occurrences Distribution Pan America 2001-2010
Source: ICAO ADREP/ECCAIRS
Fatal accidents Non fatal occurrences Linear (Fatal accidents) Linear (Non fatal occurrences)
0
1
2
3
4
5
1987 1989 1991 1993 1995 1997 1999 2001 2003 2005 2007 2009
Nu
mb
er
of
Acc
ide
nts
CFIT - Operator Domicile: North America 1987 - 2010 Source: Boeing
CFIT - Operator Domicile: North America

RASG-PA Annual Safety Report – Second Edition
- 22 -
Figure 4.23 - CFIT – Operator Domicile: Latin America and Caribbean 1987 - 2010
Items of interest determined by IATA using world wide data are:
CFIT accidents of EGPWS-equipped aircraft were noted issues in 2010.
In 43% of all CFIT accidents, a strong correlation between CFIT and a lack of ground-based
navigation aids was found.
Spatial disorientation was an identified factor in one CFIT accident, while fatigue was a factor in
two CFIT accidents.
Forward knowledge of terrain through prior experience does not eliminate the need to adhere to
Terrain Avoidance Warning System (TAWS) warnings.
Most pilots do not appreciate how close the approaching terrain is when the TAWS alarm
sounds. In 2010, there were CFIT accidents because of pilots disregarding TAWS warnings and
going below minimums.
According to ICAO, CFIT appears to be a category with a decreasing trend in the Pan American Region in
the last years, not only in the previously analysed fatal accidents, but in all occurrences (accidents and
incidents). The following figure shows the number of occurrences reported in this category in the Region per
year.
Figure 4.24 - CFIT Occurrences Distribution Pan America 2001-2010
0
1
2
3
4
5
1987 1989 1991 1993 1995 1997 1999 2001 2003 2005 2007 2009
Nu
mb
er
of
Acc
ide
nts
CFIT - Operator Domicile: Latin America and Caribbean 1987 - 2010
Source: Boeing
CFIT - Operator Domicile: Latin America & Caribbean
4 4 6 7
2 3 3 3 2 0
23
12
17 17
12
24
9
24
12
8
0
5
10
15
20
25
30
2001 2002 2003 2004 2005 2006 2007 2008 2009 2010
Tim
es
rep
ort
ed
Year
CFIT Occurrences Distribution Pan America 2001-2010
Source: ICAO ADREP/ECCAIRS
Fatal accidents Non fatal occurrences Linear (Fatal accidents) Linear (Non fatal occurrences)

RASG-PA Annual Safety Report – Second Edition
- 23 -
4.1.3.2.3 In-depth Analysis of Loss of Control In-flight (LOC-I) Data
Accidents categorized as loss of control in-flight find their roots in different causes. The most important ones
identified by IATA are:
Aircraft technical failures and maintenance safety
Crew training
Automation and crew decision making
According to IATA in the Pan American Region LOC-I accidents show the following distribution per year:
LOC-I 2007 2008 2009 2010
LATAM 8% 5% 10% 33%
NAM 10% 13% 7% 6%
ICAO determined loss of control in-flight shows a slight decrease on a ten-year trend basis. As a reference,
the latest ten year adaptive average for all the occurrences stored in the ICAO ADREP/ECCAIRS database
reporting this category is equal to 41.2; and the specific numbers per year are shown in figure 4.25.
Figure 4.25 - LOC – I Occurrences Distribution Pan America 2001-2010
6 2
7 5
3 4 1
4 1
3
51 48
22
36 34
40 37
49
38
21
0
10
20
30
40
50
60
2001 2002 2003 2004 2005 2006 2007 2008 2009 2010
Tim
es
rep
ort
ed
Year
LOC-I Occurrences Distribution Pan America 2001-2010
Source: ICAO ADREP/ECCAIRS
Fatal accidents Non fatal occurrences Linear (Fatal accidents) Linear (Non fatal occurrences)
RASG-PA Annual Safety Report – Second Edition
- 24 -
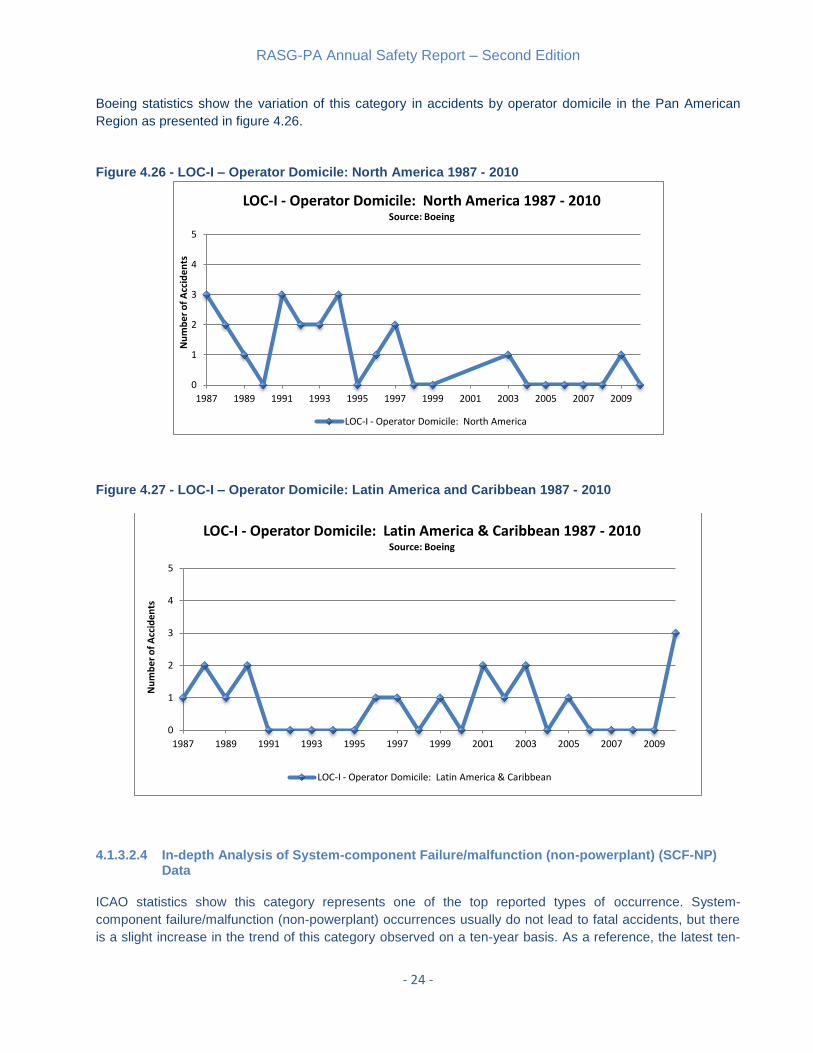
Boeing statistics show the variation of this category in accidents by operator domicile in the Pan American
Region as presented in figure 4.26.
Figure 4.26 - LOC-I – Operator Domicile: North America 1987 - 2010
Figure 4.27 - LOC-I – Operator Domicile: Latin America and Caribbean 1987 - 2010
4.1.3.2.4 In-depth Analysis of System-component Failure/malfunction (non-powerplant) (SCF-NP) Data
ICAO statistics show this category represents one of the top reported types of occurrence. System-
component failure/malfunction (non-powerplant) occurrences usually do not lead to fatal accidents, but there
is a slight increase in the trend of this category observed on a ten-year basis. As a reference, the latest ten-
0
1
2
3
4
5
1987 1989 1991 1993 1995 1997 1999 2001 2003 2005 2007 2009
Nu
mb
er
of
Acc
ide
nts
LOC-I - Operator Domicile: North America 1987 - 2010 Source: Boeing
LOC-I - Operator Domicile: North America
0
1
2
3
4
5
1987 1989 1991 1993 1995 1997 1999 2001 2003 2005 2007 2009
Nu
mb
er
of
Acc
ide
nts
LOC-I - Operator Domicile: Latin America & Caribbean 1987 - 2010 Source: Boeing
LOC-I - Operator Domicile: Latin America & Caribbean

RASG-PA Annual Safety Report – Second Edition
- 25 -
year average of occurrences reporting failure or malfunction of an aircraft system or component other than
the powerplant equals to 90.9.
Figure 4.28 shows the distribution of fatal accidents and other occurrences in the last ten-year period.
Figure 4.28 - SCF-NP Occurrences Distribution Pan America 2001-2010
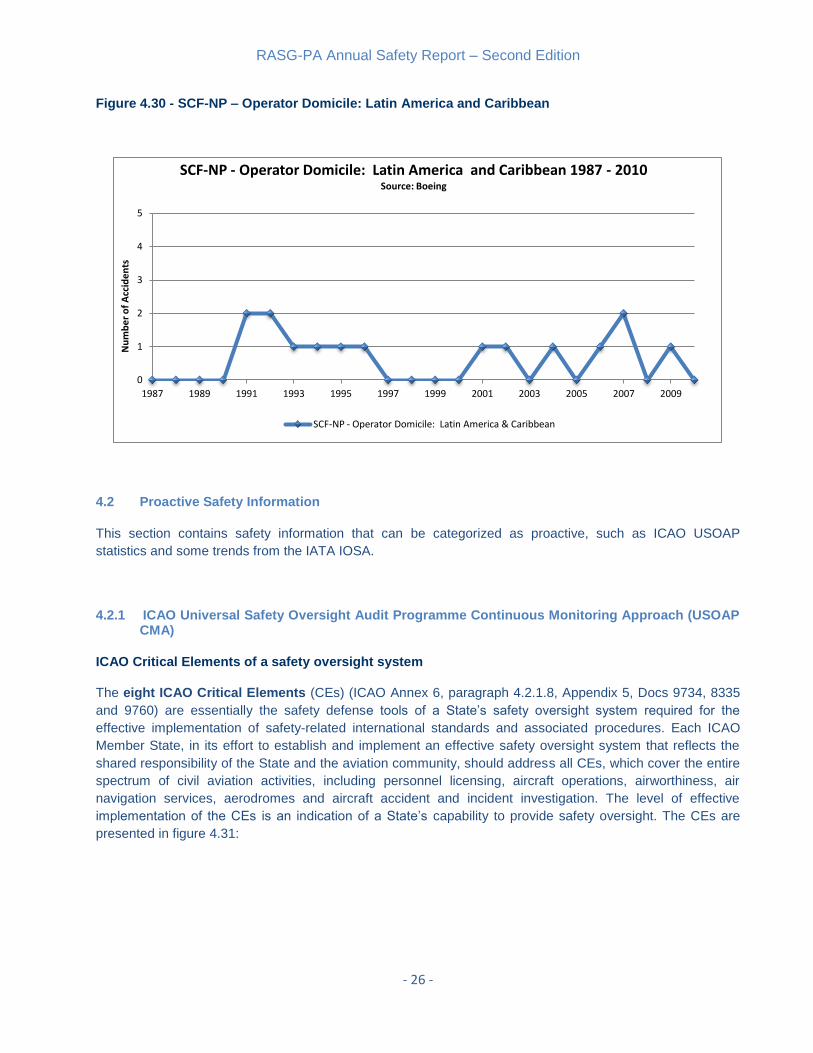
According to Boeing statistics, system-component failure/malfunction (non-powerplant) categorised accidents
showed the following variation in the time period.
Figure 4.29 - SCF-NP – Operator Domicile: North America 1987 – 2010
2 1 2 1 1 3 2 3 0 1
70
145
56 56 57
85 83
160
127
54
0
50
100
150
200
2001 2002 2003 2004 2005 2006 2007 2008 2009 2010
Tim
es
rep
ort
ed
Year
SCF-NP Occurrences Distribution Pan America 2001-2010
Source: ICAO ADREP/ECCAIRS
Fatal accidents Non fatal occurrences Linear (Fatal accidents) Linear (Non fatal occurrences)
0
1
2
3
4
5
1987 1989 1991 1993 1995 1997 1999 2001 2003 2005 2007 2009
Nu
mb
er
of
Acc
ide
nts
SCF-NP - Operator Domicile: North America 1987 - 2010 Source: Boeing
SCF-NP - Operator Domicile: North America
RASG-PA Annual Safety Report – Second Edition
- 26 -
Figure 4.30 - SCF-NP – Operator Domicile: Latin America and Caribbean
4.2 Proactive Safety Information
This section contains safety information that can be categorized as proactive, such as ICAO USOAP
statistics and some trends from the IATA IOSA.
4.2.1 ICAO Universal Safety Oversight Audit Programme Continuous Monitoring Approach (USOAP CMA)
ICAO Critical Elements of a safety oversight system
The eight ICAO Critical Elements (CEs) (ICAO Annex 6, paragraph 4.2.1.8, Appendix 5, Docs 9734, 8335
and 9760) are essentially the safety defense tools of a State’s safety oversight system required for the
effective implementation of safety-related international standards and associated procedures. Each ICAO
Member State, in its effort to establish and implement an effective safety oversight system that reflects the
shared responsibility of the State and the aviation community, should address all CEs, which cover the entire
spectrum of civil aviation activities, including personnel licensing, aircraft operations, airworthiness, air
navigation services, aerodromes and aircraft accident and incident investigation. The level of effective
implementation of the CEs is an indication of a State’s capability to provide safety oversight. The CEs are
presented in figure 4.31:
0
1
2
3
4
5
1987 1989 1991 1993 1995 1997 1999 2001 2003 2005 2007 2009
Nu
mb
er
of
Acc
ide
nts
SCF-NP - Operator Domicile: Latin America and Caribbean 1987 - 2010 Source: Boeing
SCF-NP - Operator Domicile: Latin America & Caribbean
RASG-PA Annual Safety Report – Second Edition
- 27 -
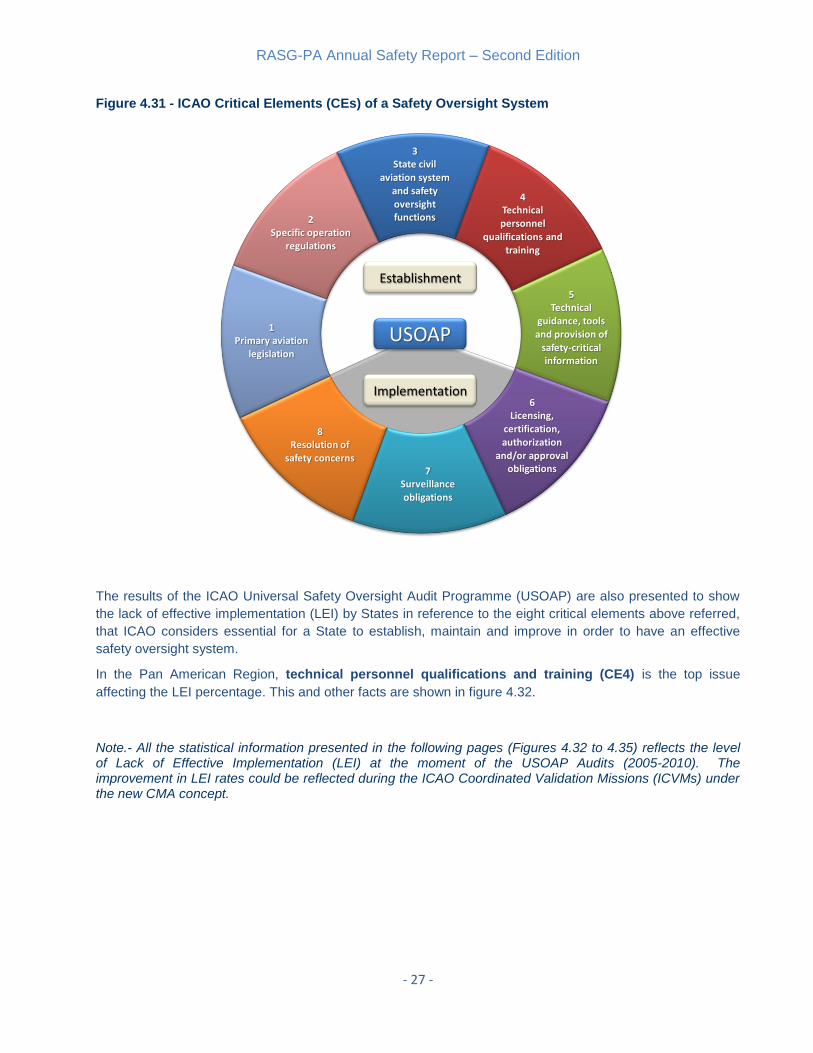
Figure 4.31 - ICAO Critical Elements (CEs) of a Safety Oversight System
The results of the ICAO Universal Safety Oversight Audit Programme (USOAP) are also presented to show
the lack of effective implementation (LEI) by States in reference to the eight critical elements above referred,
that ICAO considers essential for a State to establish, maintain and improve in order to have an effective
safety oversight system.
In the Pan American Region, technical personnel qualifications and training (CE4) is the top issue
affecting the LEI percentage. This and other facts are shown in figure 4.32.
Note.- All the statistical information presented in the following pages (Figures 4.32 to 4.35) reflects the level of Lack of Effective Implementation (LEI) at the moment of the USOAP Audits (2005-2010). The improvement in LEI rates could be reflected during the ICAO Coordinated Validation Missions (ICVMs) under the new CMA concept.
3 State civil
aviation system and safety oversight functions
4 Technical personnel
qualifications and training
5 Technical
guidance, tools and provision of
safety-critical information
6 Licensing,
certification, authorization
and/or approval obligations7
Surveillance obligations
8 Resolution of
safety concerns
1 Primary aviation
legislation
2 Specific operation
regulations
Establishment
Implementation
USOAP

RASG-PA Annual Safety Report – Second Edition
- 28 -
Figure 4.32 – Lack of Effective Implementation (LEI) per Critical Element (CE) by Region
Chart 4.33 shows each region's accident rate with respect to their LEI percentage. For the accident rate, only
commercial scheduled flights were taken into account, including passenger and cargo flights. Accidents are
as defined by Annex 13, including fatal and non-fatal accidents.
Figure 4.33 - Accident Rate and LEI percentage
According to these criteria, the Pan American Region presented a lack of effective implementation below the
world average. Accident rates in the NACC Region remained below the world average, but in the SAM
Region the accident rate was 4.196; higher than the world average (4.137).
0%
10%
20%
30%
40%
50%
60%
70%
Primary Aviation
Legislation
Specific Operating
Regulations
Civil Aviation System and
Safety Oversight Functions
Qualification and Training of Technical Staff
Procedures and Technical
Guidance
Licensing and Certification Obligations
Surveillance Obligations
Resolution of Safety
Concerns
Lack
of
Effe
ctiv
e Im
ple
me
nta
tio
n %
Critical Elements
Lack of Effective (LEI) Implementation per Critical Element (CE) by Region
Source: ICAO iSTARS
NAM CAR SAM
EUR/NAT
SAM MID
NACC APAC
WORLD ESAF
WACAF
0
4
8
12
16
0% 10% 20% 30% 40% 50% 60% 70% 80% 90% 100%
Acc
ide
nt
Rat
e (
pe
r M
illio
n)
LEI %
Accident Rate and LEI % Source: ICAO iSTARS
EUR/NAT SAM MID NACC APAC WORLD ESAF WACAF
RASG-PA Annual Safety Report – Second Edition
- 29 -
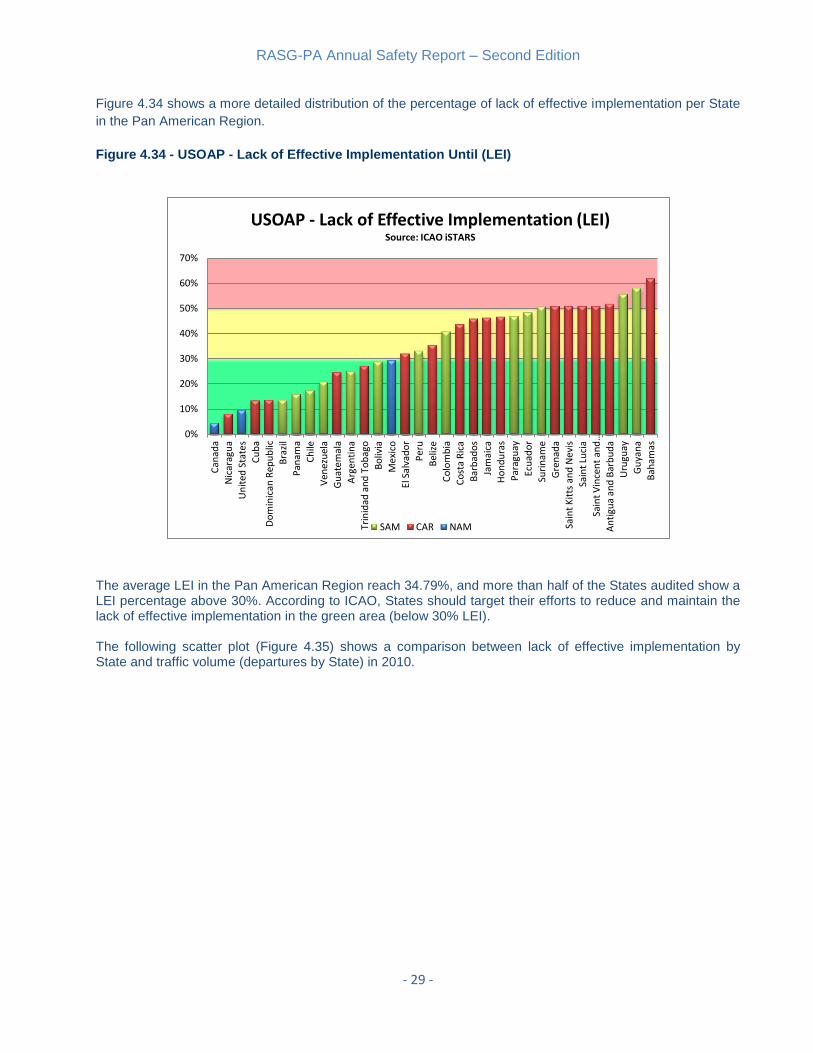
Figure 4.34 shows a more detailed distribution of the percentage of lack of effective implementation per State
in the Pan American Region.
Figure 4.34 - USOAP - Lack of Effective Implementation Until (LEI)
The average LEI in the Pan American Region reach 34.79%, and more than half of the States audited show a LEI percentage above 30%. According to ICAO, States should target their efforts to reduce and maintain the lack of effective implementation in the green area (below 30% LEI). The following scatter plot (Figure 4.35) shows a comparison between lack of effective implementation by State and traffic volume (departures by State) in 2010.
0%
10%
20%
30%
40%
50%
60%
70%
Can
ada
Nic
arag
ua
Un
ited
Sta
tes
Cu
ba
Do
min
ican
Rep
ub
lic
Bra
zil
Pan
ama
Ch
ile
Ven
ezu
ela
Gu
atem
ala
Arg
enti
na
Trin
idad
an
d T
ob
ago
Bo
livia
Mex
ico
El S
alva
do
r
Per
u
Bel
ize
Co
lom
bia
Co
sta
Ric
a
Bar
bad
os
Jam
aica
Ho
nd
ura
s
Par
agu
ay
Ecu
ado
r
Suri
nam
e
Gre
nad
a
Sain
t K
itts
an
d N
evis
Sain
t Lu
cia
Sain
t V
ince
nt
and
…
An
tigu
a an
d B
arb
ud
a
Uru
guay
Gu
yan
a
Bah
amas
USOAP - Lack of Effective Implementation (LEI) Source: ICAO iSTARS
SAM CAR NAM
RASG-PA Annual Safety Report – Second Edition
- 30 -
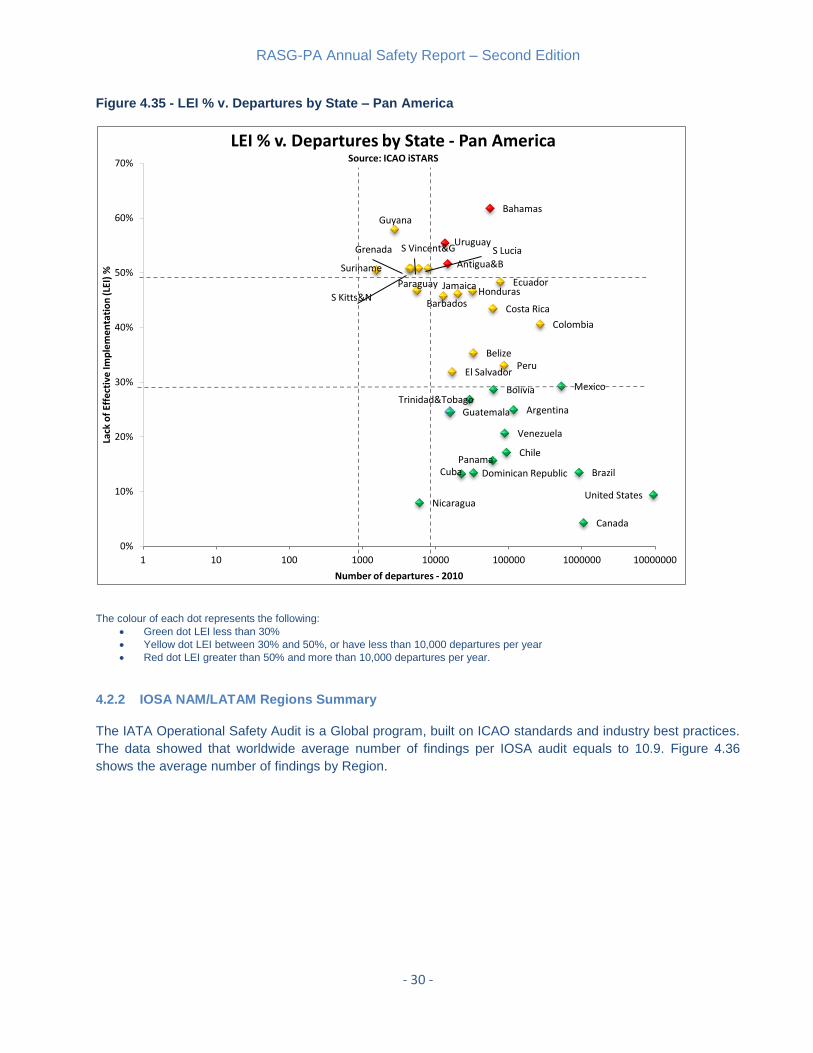
Figure 4.35 - LEI % v. Departures by State – Pan America
The colour of each dot represents the following:
Green dot LEI less than 30%
Yellow dot LEI between 30% and 50%, or have less than 10,000 departures per year
Red dot LEI greater than 50% and more than 10,000 departures per year.
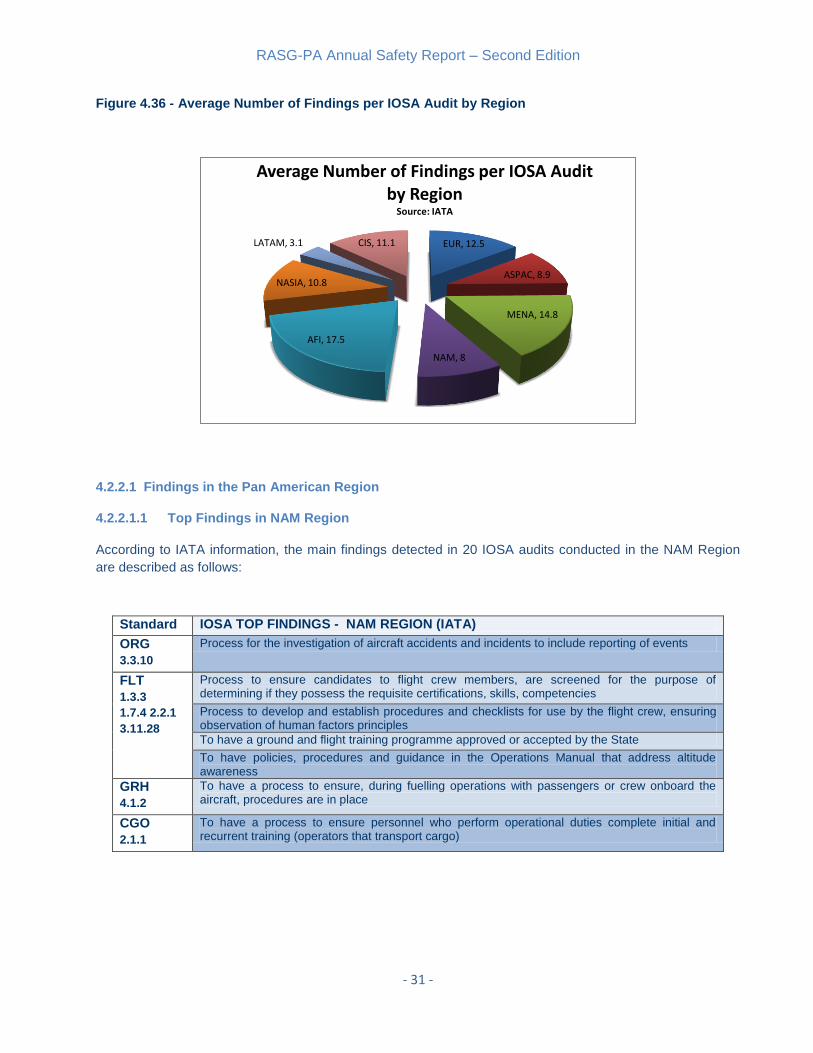
4.2.2 IOSA NAM/LATAM Regions Summary
The IATA Operational Safety Audit is a Global program, built on ICAO standards and industry best practices.
The data showed that worldwide average number of findings per IOSA audit equals to 10.9. Figure 4.36
shows the average number of findings by Region.
Antigua&B
Argentina
Bahamas
Barbados
Belize
Bolivia
Brazil
Canada
Chile
Colombia
Costa Rica
Cuba Dominican Republic
Ecuador
El Salvador
Grenada
Guatemala
Guyana
Honduras Jamaica
Mexico
Nicaragua
Panama
Paraguay
Peru
S Kitts&N
S Lucia S Vincent&G
Suriname
Trinidad&Tobago
United States
Uruguay
Venezuela
0%
10%
20%
30%
40%
50%
60%
70%
1 10 100 1000 10000 100000 1000000 10000000
Lack
of
Effe
ctiv
e Im
ple
me
nta
tio
n (L
EI)
%
Number of departures - 2010
LEI % v. Departures by State - Pan America Source: ICAO iSTARS
RASG-PA Annual Safety Report – Second Edition
- 31 -
Figure 4.36 - Average Number of Findings per IOSA Audit by Region
4.2.2.1 Findings in the Pan American Region
4.2.2.1.1 Top Findings in NAM Region
According to IATA information, the main findings detected in 20 IOSA audits conducted in the NAM Region
are described as follows:
Standard IOSA TOP FINDINGS - NAM REGION (IATA)
ORG
3.3.10
Process for the investigation of aircraft accidents and incidents to include reporting of events
FLT
1.3.3
1.7.4 2.2.1
3.11.28
Process to ensure candidates to flight crew members, are screened for the purpose of determining if they possess the requisite certifications, skills, competencies
Process to develop and establish procedures and checklists for use by the flight crew, ensuring observation of human factors principles To have a ground and flight training programme approved or accepted by the State
To have policies, procedures and guidance in the Operations Manual that address altitude awareness
GRH
4.1.2
To have a process to ensure, during fuelling operations with passengers or crew onboard the aircraft, procedures are in place
CGO
2.1.1
To have a process to ensure personnel who perform operational duties complete initial and recurrent training (operators that transport cargo)
EUR, 12.5
ASPAC, 8.9
MENA, 14.8
NAM, 8
AFI, 17.5
NASIA, 10.8
LATAM, 3.1 CIS, 11.1
Average Number of Findings per IOSA Audit by Region
Source: IATA
RASG-PA Annual Safety Report – Second Edition
- 32 -
4.2.2.1.2 Top Findings in LATAM Region
According to IATA information, the main findings detected in 15 IOSA audits conducted in the LATAM Region
are described as follows:
Standard IOSA TOP FINDINGS - LATAM REGION (IATA)
FLT
2.2.1
To have a ground and flight training programme approved or accepted by the State
DSP 1.10.4
3.7.1
To have a process for addressing findings that result from audits of operational control functions
To have a process to ensure the availability of lists for immediate communication to rescue coordination centres
CAB
2.2.12
To ensure cabin crew members receive training in aviation security
CGO
1.9.2
3.1.3
3.2.3
To have a process for addressing findings resulting from audits of functions within cargo operations
To ensure the reliability of cargo weighing facilities are periodically verified
To have procedures to ensure the Dangerous Goods Acceptance Checklist and shipper documentation are retained
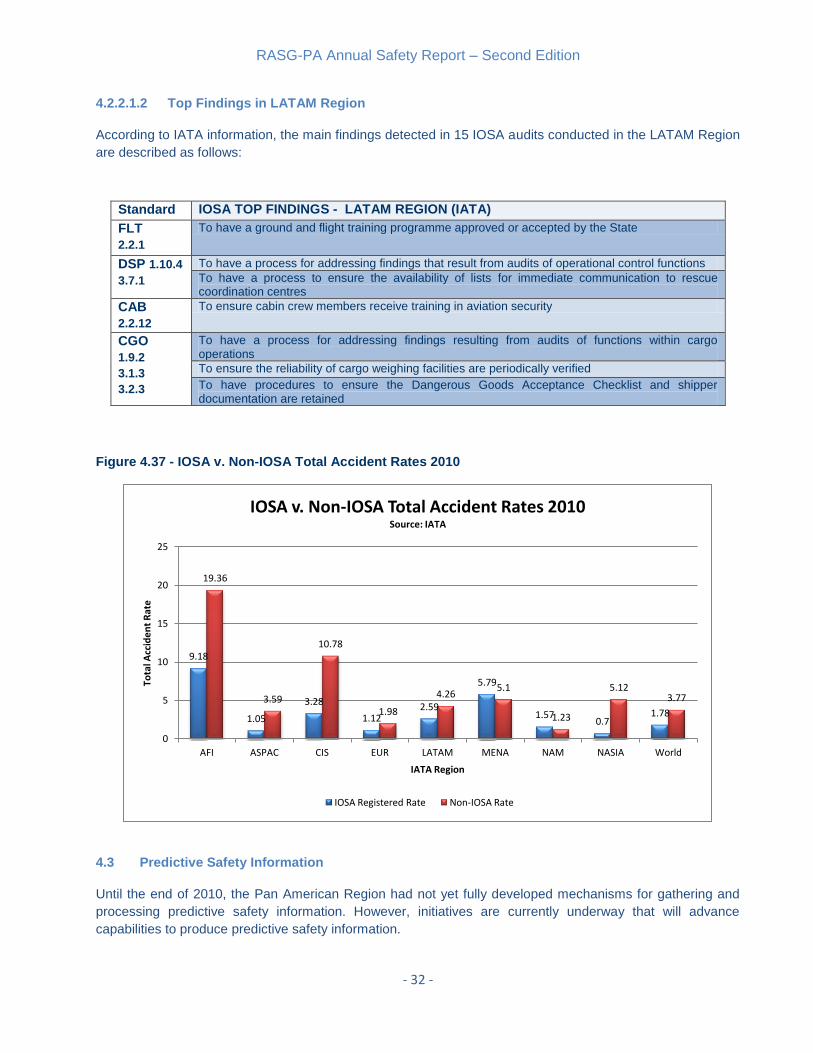
Figure 4.37 - IOSA v. Non-IOSA Total Accident Rates 2010
4.3 Predictive Safety Information
Until the end of 2010, the Pan American Region had not yet fully developed mechanisms for gathering and
processing predictive safety information. However, initiatives are currently underway that will advance
capabilities to produce predictive safety information.
9.18
1.05
3.28
1.12 2.59
5.79
1.57 0.7
1.78
19.36
3.59
10.78
1.98
4.26 5.1
1.23
5.12 3.77
0
5
10
15
20
25
AFI ASPAC CIS EUR LATAM MENA NAM NASIA World
Tota
l Acc
ide
nt
Rat
e
IATA Region
IOSA v. Non-IOSA Total Accident Rates 2010 Source: IATA
IOSA Registered Rate Non-IOSA Rate

RASG-PA Annual Safety Report – Second Edition
- 33 -
5 Final Conclusions
In regard to Reactive Safety Information, the data analyzed for the Pan American Region continues to
identify Loss of Control In-flight (LOC-I), Runway Excursions (RE) and Controlled Flight into Terrain (CFIT) as
the top fatal accident categories for the 2001-2010 period.
Although there are different points of view for each of the top categories among the stakeholders, these
conclusions rely on the amount of data available and the criteria for analysis used by the stakeholders. The
users of this report are invited to extract and use the information presented according to their own safety
concerns and operational reality.
It should be noted that LOC-I and CFIT occurrences appear to have in a decreasing trend during the time
period, which is more clearly noted in the analysis of both fatal and non-fatal occurrences. Monitoring the
trend of these occurrences should be maintained to determine the effective impact of mitigation strategies
adopted in their regard.
The analysis of fatal and non-fatal occurrences also determined system-component failure/malfunction (non-
powerplant) (SCF-NP) and unknown (UNK) occurrences as emerging types of accidents/incidents in the Pan
American Region.
Specifically, SCF-NP occurrences show an increasing trend since 2005, usually not leading to fatal accidents.
Aircraft malfunction and maintenance events were noted threats identified among the top contributing factors
for Pan American accidents in 2010.
Proactive safety information shows high level of lack of effective implementation (LEI) for some States of the
Region. States have already started to develop enhancements to improve their standards, which should be
reflected as lower exposure to risks.
Moreover, LEI regarding qualification and training of the technical staff became the most affected critical
element in the Pan American Region. It may be worthwhile to conduct further analysis to determine if there is
a correlation among the UNK categorized occurrences (showing a significant increasing trend in the last five-
years period) and the qualifications and training of accident investigation personnel in order to develop
strategies supported in the Global Safety Initiative # 4 of the GASP.
ICAO, through the Universal Safety Oversight Audit Programme (USOAP) identifies deficiencies and
encourages States to develop and implement corrective action plans to correct them and to analyze the
results for future safety enhancements.
Transparency and timely sharing of information is another way of improving safety. RASG-PA encourages all
aviation stakeholders to take such action using all the available tools.
The RASG-PA Annual Safety Report is a timely, unbiased and transparent source of safety related
information essential for all aviation stakeholders interested in having a tool to enable sound decision-making
on safety related matters.

RASG-PA Annual Safety Report – Second Edition
- 34 -
List of Acronyms
ACAS Airborne Collision Avoidance Systems
ADRM Aerodrome
AFI Africa (IATA Region)
AIS Aeronautical Information Service
AMAN Abrupt maneuver
ANSP Air Navigation Service Provider
AOC Air Operator Certificate
ARC Abnormal runway contact
ASIAPAC Asia/Pacific (ICAO Region)
ASPAC Asia/Pacific (IATA Region)
ATC Air Traffic Control
ATM Air Traffic Management, Communications,
Surveillance
BIRD Birdstrike
CABIN Cabin safety events
CAR Caribbean (ICAO Region)
CASSOS Caribbean Aviation Security and Safety
Oversight System
CAST Commercial Aviation Safety Team
CFIT Controlled flight into terrain
CICTT CAST/ICAO Common Taxonomy Team
CIS Commonweath of Independent States (IATA
Region)
CMA Continuous monitoring approach
COCESNA/ACSA Corporación Centroamericana de
Servicios de Navegación Aérea/Agencia
Centroamericana para la Seguridad Aeronáutica
CRM Crew Resource Management
CVR Cockpit Voice Recorder
DFDR Digital Flight Data Recorder
DGAC Directorate General of Civil Aviation
DH Decision Height
E-GPWS Enhance Ground Proximity Warning System
ETOPS Extended Range Operations by turbine-engined
aeroplanes
EUR Europe (ICAO and IATA Region)
EVAC Evacuation
FDA Flight Data Analysis
FLP Flight Planning (IATA)
F-NI Fire/smoke (none- impact).
FMS Flight Management System
FOQA Flight Operations Quality Assurance
F-POST Fire/Smoke (post-impact)
FUEL Fuel related
GASP ICAO Global Aviation Safety Plan
GCOL Ground collision
GNSS Global Navigation Satellite System
GPWS Ground Proximity Warning System
GSI Global Safety Initiative
HL Aircraft destroyed or damaged and not repaired
IATA International Air Transport Association
ICAO International Civil Aviation Organization
ICE Icing
IMC Instrument meteorological conditions
INOP Inoperative
IOSA IATA Operational Safety Audit
LALT Low altitude operations
LATAM Latin America and the Caribbean (IATA Region)
LEI Lack of effective implementation
LOC-G Loss of control - ground
LOC-I Loss of control - inflight
LOSA Line Operations Safety Audit
MAC AIRPROX/TCAS alert/loss of separation/near
miss collisions/midair collisions
MDA Minimum Descent Altitude
MEL Minimum Equipment List
MENA Middle East and North Africa (IATA REGION)
NAM North America (ICAO and IATA Region)
NASIA North Asia (IATA Region)
NAVAIDS Navigational Aids
NOTAM Notice to Airman
OTHR Other
RA Resolution Advisory
RAMP Ground handling operations
RE Runway excursion (departure or landing)
RI Runway Incursion
RI-A Runway Incursion – Animal
RI-VAP Runway Incursion – vehicle, aircraft or person
SAM South America (ICAO Region)
SARPS Standards and Recommended Practices (ICAO)
SCF-NP System/component failure or malfunction (non-
powerplant)
SCF-PP Powerplant failure or malfunction
SD Substantial Damage
SEC Security-related
SMS Safety Management System
SOP Standard Operating Procedure
SRVSOP Regional Safety Oversight System
SSP State Safety Programme
TAWS Terrain Awareness Warning System
TCAS Traffic Collision and Avoidance System
TCAS RA Traffic Collision and Avoidance System-
Resolution Advisory
TEM Threat and Error Management
TURB Turbulence encounter
UAS Undesirable Aircraft State
UNK Unknown
USOAP Universal Safety Oversight Audit Programme
USOS Undershoot/Overshoot
UNK Unknown or undetermined
WSTRW Windshear or thunderstorm

RASG-PA Annual Safety Report – Second Edition
- 35 -
CREDITS – CRÉDITOS
RASG-PA thanks the members of the RASG-PA Annual Safety Report Team (ASRT) that contributed to
the elaboration of this RASG-PA Annual Safety Report:
RASG-PA agradece a los miembros del Equipo del Informe Anual de Seguridad Operacional (ASRT) del
RASG-PA que contribuyeron a la elaboración de este Informe Anual de Seguridad Operacional del
RASG-PA:
Winston San Martin
Chile, Dirección General de Aeronaútica Civil
Gerardo Hueto
The Boeing Company
Gabriel Acosta
International Air Transport Association – IATA
Oscar Quesada
International Civil Aviation Organization – ICAO/OACI
Eduardo Chacin
International Civil Aviation Organization – ICAO/OACI
Marcelo Ureña
International Civil Aviation Organization – ICAO/OACI
-oOo-
RASG-PA Annual Safety Report – Second Edition
- 36 -