rapid quantitative analysis of carbendazim in orange juice ... · introduction fungicides in...
TRANSCRIPT

Introduction
Fungicides in imported orange juice have been on the national stage in recent months, creating a need for simple and rapid detection methods.
When a private company alerted the FDA to the presence of the fungicide, carbendazim, in orange juice imported from Brazil, the agency expanded its testing of imports for this residue, which
is illegal in the United States. In response to the increased concern, we have developed a quick and straightforward method of analysis and quantitation of carbendazim at concentrations below 10 parts per billion.
We present a method for detecting both targeted analytes, such as carbendazim, as well as non-targeted components, by taking advantage of the full-spectrum, high mass accuracy data provided by the AxION® 2 time-of-flight (TOF) mass spectrometer (MS) using an Ultraspray™ 2 ionization source with lock mass for on-the-fly calibration. Unlike a triple quadrupole instrument, which requires predefined targets, a TOF instrument collects accurate mass and high resolution data across a full spectrum without a loss in sensitivty allowing analysis and identification of an unlimited number of compounds. Any emerging analytes of concern can be detected in pre-existing data simply by searching for the exact mass of the analyte of interest, and can quickly be confirmed by retention-time matching.
Liquid Chromatography/Mass Spectrometry
a p p l i c a t i o n n o t e
Authors
Courtney Phillips
Avinash Dalmia
PerkinElmer, Inc. Shelton, CT USA
Rapid Quantitative Analysis of Carbendazim in Orange Juice using UHPLC Coupled to the AxION 2 TOF Mass Spectrometer

2
The identification was confirmed by highly accurate mass and retention time matching, as well as by isotopic profile. By calculating the natural abundances of carbendazim isotopes, expected ratios could be compared to measured ratios as seen in Figure 2.
A calibration curve was created by spiking carbendazim standard into orange juice before dilution and analysis. The response is linear over a range of 1 ppb to 300 ppb with a correlation coefficient greater than 0.996 (shown in Figure 3).
By using a superficially-porous particle (SPP) column, a dilute-and-shoot sample preparation was made possible while retaining the resolution and fast run times of a traditional UHPLC column.
Experimental
Instrumental parameters are described in Table 1.
Table 1. Experimental Conditions.
Target Analyte: Carbendazim
Liquid Chromatography Conditions:
Pump Type: Flexar™ FX-15
Column: PerkinElmer Brownlee™ SPP C18 column (2.1 mm x 100 mm, 2.7 μm)
Mobile Phase: A: water containing 5 mM formic acid and 5 mM ammonium formate
B: methanol containing 5 mM formic acid and 5 mM ammonium formate
Flow Rate: 0.3 mL/min
Injection Volume: 10 μL
Gradient: Time (min) %A %B
1.0 67.5 32.5
2.0 45 55
2.0 0 100
Mass Spectrometer Conditions:
Mass Spectrometer: PerkinElmer AxION 2 TOF MS
Ionization: Ultraspray™ 2 Dual ESI source
Scan Range and TrapPulse Mode: 100 – 400 m/z (D7:66, D8:80)
Capillary Exit Voltage: +90 V
Drying Gas Temperature and Flow Rate: 350 °C and 12 L/min
LockMass Calibrant 35 μL/min using m/z 322.04812Flow Rate and Ions: and 622.02896
Sample Preparation
The high resolution and mass accuracy of the AxION 2 TOF MS and the large particle size and rugged nature of the SPP column allow for a simplified sample preparation. Juice samples were diluted 10-fold in water and centrifuged. The supernatant was collected and filtered directly into sample vials through a 0.2 µm PTFE syringe filter.
Results
Using the rapid RP-LC conditions described, carbendazim was found to have a retention time of just 2.2 minutes, with a limit of quantitation (LOQ) in orange juice calculated at 0.75 ppb. Figure 1 shows an extracted ion chromatogram of 100 ppb carbendazim in orange juice.
192.0770
193.0793 194.0849
0
10000
20000
30000
40000
50000
60000
70000
80000
90000
191.0 191.5 192.0 192.5 193.0 193.5 194.0 194.5 195.0
MassRET (02.17841)
Am
plit
ud
e
m/z
[M+H]+
CarbendazimMass Accuracy = 1.56 ppm
Carbendazim A+ 1 Isotope
Expected Rel. Response = 11.2%
Measured Rel. Response = 9.9%
Carbendazim A+ 2 IsotopeExpected Rel. Response =0.97%Measured Rel. Response = 1.5%
Figure 1. Extracted ion chromatogram (EIC) of 100 ppb carbendazim in orange juice.
Figure 2. Isotopic profile afforded by the high resolution of the AxION 2 TOF MS allows an additional confirmation of identity without the need for fragmentation.
Figure 3. Linearity of carbendazim in orange juice from 1 ppb to 300 ppb.
3
By simply reanalyzing the data, a chromatographic peak with a retention time of 4.76 minutes was identified. The EIC of this peak provided a mass spectrum with the isotopic ratios described in Figure 5 and thus the peak was identified as carbaryl.
High mass accuracy and isotopic profile can be used to check the peak identification. Running a standard allowed confirmation by retention time (Figure 6).
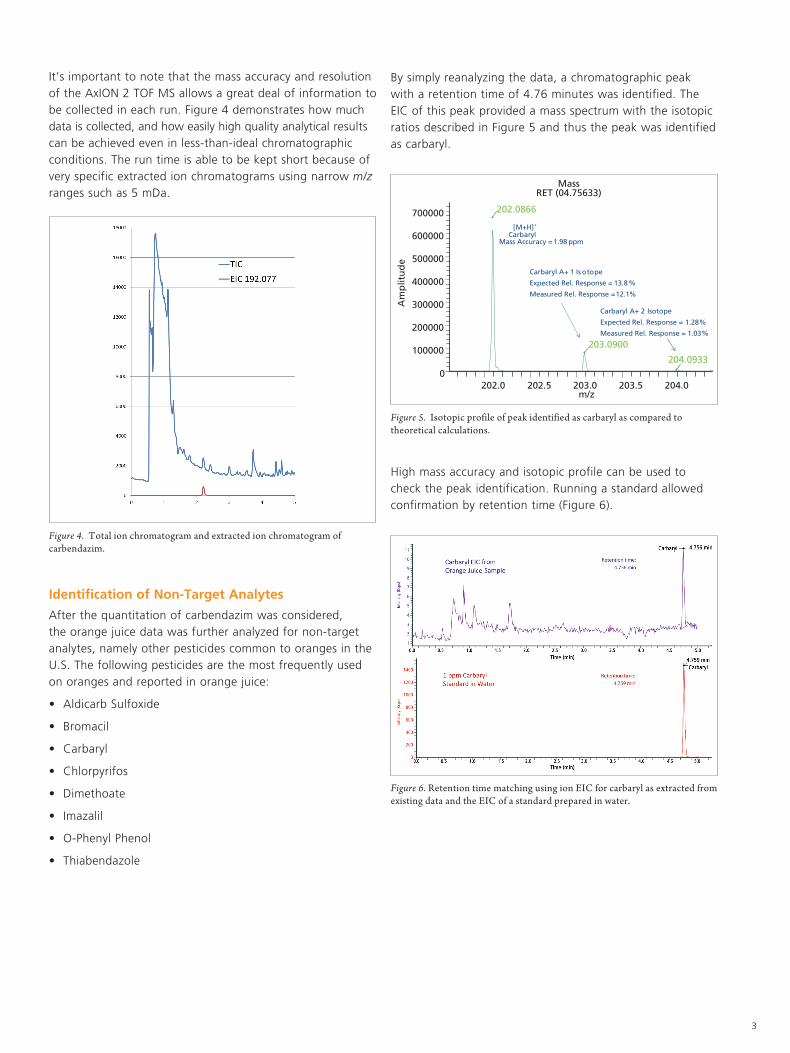
It’s important to note that the mass accuracy and resolution of the AxION 2 TOF MS allows a great deal of information to be collected in each run. Figure 4 demonstrates how much data is collected, and how easily high quality analytical results can be achieved even in less-than-ideal chromatographic conditions. The run time is able to be kept short because of very specific extracted ion chromatograms using narrow m/z ranges such as 5 mDa.
Identification of Non-Target Analytes
After the quantitation of carbendazim was considered, the orange juice data was further analyzed for non-target analytes, namely other pesticides common to oranges in the U.S. The following pesticides are the most frequently used on oranges and reported in orange juice:
• AldicarbSulfoxide
• Bromacil
• Carbaryl
• Chlorpyrifos
• Dimethoate
• Imazalil
• O-PhenylPhenol
• Thiabendazole
Figure 4. Total ion chromatogram and extracted ion chromatogram of carbendazim.
202.0866
203.0900
204.0933 0
100000
200000
300000
400000
500000
600000
700000
202.0 202.5 203.0 203.5 204.0
MassRET (04.75633)
Am
plit
ud
em/z
[M+H]+Carbaryl
Mass Accuracy = 1.98 ppm
Carbaryl A+ 1 Is otope
Expected Rel. Response = 13.8%
Measured Rel. Response = 12.1%
Carbaryl A+ 2 Isotope
Expected Rel. Response = 1.28%
Measured Rel. Response = 1.03%
Figure 5. Isotopic profile of peak identified as carbaryl as compared to theoretical calculations.
Figure 6. Retention time matching using ion EIC for carbaryl as extracted from existing data and the EIC of a standard prepared in water.

For a complete listing of our global offices, visit www.perkinelmer.com/ContactUs
Copyright ©2013, PerkinElmer, Inc. All rights reserved. PerkinElmer® is a registered trademark of PerkinElmer, Inc. All other trademarks are the property of their respective owners. 010244A_01
PerkinElmer, Inc. 940 Winter Street Waltham, MA 02451 USA P: (800) 762-4000 or (+1) 203-925-4602www.perkinelmer.com
Conclusions
A less than 5 minute dilute-and-shoot LC-TOF method was developed for quantifying carbendazim in orange juice. The resultant analysis method was found to be rapid and efficient, rivaling or surpassing sample throughput of other published methods. The collected data was then screened for 8 additional pesticides most likely to be present in orange juice. Carbaryl was found to be present in the juice samples, with identification by exact mass, and confirmation by retention time matching with a standard, demonstrating the advantage of a full-spectrum mass analyzer over a scanning instrument.