rapid mapping and identification of mutations in ... · interval pull-down sequencing sean m....
TRANSCRIPT
INVESTIGATION
Rapid Mapping and Identification of Mutationsin Caenorhabditis elegans by Restriction
Site-Associated DNA Mapping and GenomicInterval Pull-Down Sequencing
Sean M. O’Rourke, John Yochem, Amy A. Connolly, Meredith H. Price, Luke Carter, Joshua B. Lowry,
Douglas W. Turnbull, Nick Kamps-Hughes, Nicholas Stiffler, Michael R. Miller, Eric A. Johnson,
and Bruce Bowerman1
Institute of Molecular Biology, University of Oregon, Eugene, Oregon 97403
ABSTRACT Forward genetic screens provide a powerful approach for inferring gene function on the basis of the phenotypesassociated with mutated genes. However, determining the causal mutation by traditional mapping and candidate gene sequencing isoften the rate-limiting step, especially when analyzing many mutants. We report two genomic approaches for more rapidlydetermining the identity of the affected genes in Caenorhabditis elegans mutants. First, we report our use of restriction site-associatedDNA (RAD) polymorphism markers for rapidly mapping mutations after chemical mutagenesis and mutant isolation. Second, wedescribe our use of genomic interval pull-down sequencing (GIPS) to selectively capture and sequence megabase-sized portions ofa mutant genome. Together, these two methods provide a rapid and cost-effective approach for positional cloning of C. elegansmutant loci, and are also applicable to other genetic model systems.
DETERMINING mutant gene identity is a key step forunderstanding gene function in forward genetic screens
followingmutagenesis and phenotype-basedmutant isolation.In some organisms such as fungi and bacteria, a recessivemutant allele can be complemented with a plasmid-bornewild-type gene to establish gene identification. In organismsthat lack robust DNA transformation methods, mapping withvisible or selected single nucleotide polymorphism (SNP)markers to progressively finer genomic intervals is the tradi-tional route to ascertain identity of the mutant gene. Nowwhole genome sequencing (WGS) methods can significantlyreduce the time required to identify the causal mutation. Forexample, WGS can simply be used to determine all of thesequence alterations present in a mutant strain (Sarin et al.2008; Smith et al. 2008; Srivatsan et al. 2008; Blumenstiel
et al. 2009; Irvine et al. 2009). However, some mapping dataare still required to differentiate the background mutationalload from the causal mutation. More recently, WGS has beenperformed on outcrossed mutant progeny to combine map-ping and sequencing for pinpointing the position of the causalmutation (Doitsidou et al. 2010; Zuryn et al. 2010).
While resequencing a genome to identify mutant alleles isbeing used more frequently, in some cases it is more efficient tosequence only a portion of a genome. For example, sequencingof a single chromosome, a defined genomic interval, exonicsequences, or a single locus can be more cost effective whenthere is evidence that a mutation resides within a specificgenome feature. There have been several throughput-enhancingadvances in capturing targeted regions of a genome using DNAannealing since the first reported use of this methodologywhereby individual microarray spots were physically scrapedfrom the substrate (Ksiazek et al. 2003; Rota et al. 2003; Wanget al. 2003). For example, genomic DNA can be annealed tomicroarrays printed with oligonucleotides covering the region tobe targeted, washed, and then eluted for sequencing (Albertet al. 2007; Hodges et al. 2007; Okou et al. 2007). Alternatively,oligonucleotides can be used to capture homologous genomic
Copyright © 2011 by the Genetics Society of Americadoi: 10.1534/genetics.111.134031Manuscript received June 29, 2011; accepted for publication August 25, 2011Supporting information is available online at http://www.genetics.org/content/suppl/2011/09/06/genetics.111.134031.DC1.1Corresponding author: Institute of Molecular Biology, University of Oregon, 1370Franklin Boulevard, Eugene, OR 97403. E-mail: [email protected]
Genetics, Vol. 189, 767–778 November 2011 767

DNA in solution (Gnirke et al. 2009). While these approachesare extremely high throughput, they also can be prohibitivelyexpensive.
We have developed two Illumina-based sequencingmethods in Caenorhabditis elegans that offer an alternativepipeline for mutation detection. First, we have performedrestriction site associated DNA (RAD) polymorphism map-ping to position the causal mutation to a relatively smallregion of the genome. Second, we have used genome in-terval pull-down sequencing (GIPS) to sequence a definedgenomic interval. Genome intervals are captured by anneal-ing sheared genomic DNA to sheared fosmids containingwild-type C. elegans DNA, eliminating the need for custom-ized microarray or oligonucleotide production. Because mul-tiple RAD mapping and genome interval sequencing samplescan be combined in a single Illumina lane, it is possible topositionally clone and identify the mutant loci rapidly andcost effectively without performing WGS.
Materials and Methods
C. elegans strains and culture
Strains were grown under standard laboratory conditions(Brenner 1974). The temperature-sensitive (ts) mutantswere maintained in a 15� incubator and shifted to a 26�incubator to perform temperature upshifts for determiningembryonic lethality. Mutants were isolated in a lin-2(e1309)background, as previously described (Encalada et al. 2000).
Genetic crosses for RAD mapping
To map or1167ts, we crossed the polymorphic C. elegansstrain CB4856 into the original mutagenized background[or1167ts/or1167ts; lin-2(e1309)/lin-2(e1309)]. After self-fertilization of the heterozygous F1 outcross, we pooled 200of the 1/16 of the F2 progeny that were again or1167ts/or1167ts; lin-2(e1309)/lin-2(e1309), taking advantage ofthe lin-2 egg-laying defect to identify with a stereomicro-scope within F1 self-progeny or1167ts/or1167ts; lin-2(e1309)/lin-2(e1309) F2’s filling up with dead embryos[avoiding laboriously singling out hundreds of F2’s to lookfor production of dead embryos by egg-laying lin-2(+/+ or+/e1309) F2 progeny]. Similarly, for mapping unc-13, wealso performed a cross to CB4856 but selected �200 Unc F2progeny for the genomic DNA preparations. For mappingor1089ts, we crossed the original mutant to CB4856 malesand isolated 800 F2 hermaphrodites that were tested forembryonic lethality. Approximately 200 homozygous or1089tsanimals were recovered and used for the RAD mappingprocedure.
Illumina sequencing for RAD mapping
Genomic DNA was isolated from pools of �200 homozygousunc-13 F2’s, and �200 or1054ts; lin-2(e1309) F2’s as well asthe N2 and CB4856 parental strains using the QiagenDNeasy kit. A total of 150 ng of each sample was digested
with EcoRI and processed into barcoded RAD libraries aspreviously described (Baird et al. 2008) with the minor mod-ification of using the paired end P2 adapter (Hohenloheet al. 2010). Briefly, each sample was individually digestedwith EcoRI, and a P1 adapter (with a 4-bp barcode; seebelow) was ligated to the overhangs. After this step multiplesamples were multiplexed. Next, the DNA was sheared andgel extracted to obtain �400-bp fragments and the IlluminaP2 adapter was ligated. Samples were then run on the Illu-mina flow cell. For RAD mapping, there is no need to use anIllumina kit (for full protocol see Baird et al. 2008). The RADlibrary from the mutant pool was sequenced at $30· cov-erage in an Illumina Genome Analyzer IIx machine. WithSNPs present at about every 1000 bp in the polymorphicCB4856 strain, and sequencing reads of �75 bp from eachEcoRI site, we anticipated detecting a SNP near 1 in 10 EcoRIsites, or about one every 50,000 bp, which was close to theobserved value of one SNP in 64,000 bp achieved, on aver-age. The RAD sequences were aligned to the reference BristolN2 genome using the Bowtie software package (Langmeadet al. 2009). The Bowtie output was then exported to SAMtools(Li et al. 2009) and converted into BAM format. We then pro-duced a pileup file, to which we applied the samtools.plscript “varFilter” command (using default options) to iden-tify SNPs. The varFilter results were then saved as a tab-delimited file for use with graphing software (MicrosoftExcel and Adobe Illustrator). As an alternative method foridentifying N2/CB4856 SNPs, one could use the MAQGeneprogram (Bigelow et al. 2009), which may be more accessibleto nonbioinformaticians (as used by Doitsidou et al. 2010).
Illumina sequencing of genomic intervals
To pull down intervals of genomic DNA to which or195ts,semidominant or600(sd),ts, and or683ts were mapped, weused magnetic bead pull-downs. A total of 5 mg of genomicDNA was purified from each mutant strain using a DNeasyBlood and Tissue kit (Qiagen) and sheared to an averagesize of 500 bp by sonication in a Bioruptor (Diagenode). Theends of the sheared DNA fragments were blunted usinga QuickBlunt kit (New England Biolabs) and the fragmentspurified with a PCR purification kit (Qiagen). A-overhangswere added to the genomic fragments by incubation of thepurified, blunted DNA with 150 units of Klenow DNA poly-merase exo- (New England Biolabs) and dATP at 37� for30 min. The modified fragments were purified witha mini-elute PCR purification kit (Qiagen). A total of 7 mlof 1-mMmodified Illumina sequencing adapters were ligatedto the sheared genomic fragments at 16� for 2 hr using 2000units of T4 DNA ligase (New England Biolabs). [Top strand:59 ACACTCTTTCCCTACACGACGCTCTTCCGATCxxxx*T 39;bottom strand: 59 phosphate xxxxGATCGGAAGAGCGGTT-CAGCAGGAATGCCGAG 39 (where x indicates the barcodebases and *, phosphorotioate bond.) The ligation reactionwas size separated by agarose gel electrophoresis, and frag-ments between 150 and 500 bp in size were purified fromthe gel using a Gel Extraction kit (Qiagen). The purified
768 S. M. O’Rourke et al.
ligation products were PCR amplified using Phusion highfidelity DNA polymerase (New England Biolabs) and the Illu-mina amplification primers 59 AATGATACGGCGACCACCGAGATCTACACTCTTTCCCTACACGACGCTCTTCCGATCT 39 and59 CAAGCAGAAGACGGCATACGAGATCGGTCTCGGCATTCCTGCTGAACCGCTCTTCCGATCT 39. The following cycling con-ditions were used for PCR: 98� for 2 min, 15 cycles of 98� for10 sec, 65� for 30 sec, and 72� for 15 sec. Following amplifi-cation, samples were size separated by agarose gel electropho-resis, and fragments between 150 and 500 bp were purifiedwith a Gel Extraction kit (Qiagen).
Biotinylated probe preparation: DNA preps homologous tothe targeted genomic interval were prepared from genomicfosmids, using a nearly genome-wide fosmid library for C.elegans that was developed by the Genome Sciences Centrein Vancouver, BC, Canada. A total of 100 ng of the fosmidDNA mixtures were combined with 20 ml of 2.5· randomoctamer solution (Life Technologies) and heated to 100� for5 min. The mixture was rapidly cooled in an ice/water bath,following which 5 ml of biotin dNTP mixture [1 mM biotin-14-dCTP, 1 mM dCTP, 2 mM dATP, 2 mM dGTP, and 2 mMdGTP, in 10 mM Tris-HCl (pH 7.5), 1 mM Na2 EDTA] (LifeTechnologies) was added, along with 1 ml of Klenow fragmentDNA polymerase (Life Technologies) and ultrapure water tobring the reaction volume to 50 ml. The reaction was thenincubated at 37� for 1 hr, following which, the products weresize separated on an agarose gel and the predominant 100-bpproduct was purified with a Gel Extraction kit (Qiagen).
Streptavidin bead preparation: A total of 50 ml of M270streptavidin Dynabeads (Life Technologies) were washedthree times with 100 ml of 6· SSC and resuspended in100 ml of bead block buffer [2% I-Block (Tropix), 0.5%SDS, 1· PBS]. Beads were incubated at room temperaturefor 30 min with occasional mixing and were then magneti-cally captured and washed three times with 6· SSC.
Hybridization, immobilization, elution, and sequencing:A total of 5 mg of adapted, purified genomic DNA was com-bined with 150 ng of purified biotinylated probe in 300 ml ofhybridization buffer [54% formamide, 1· SSC, 1% SDS,5.4· Denhardt’s solution (Sigma), 1 mg/ml Salmon spermDNA (Life Technologies)]. The mixture was heated to 100�for 2 min and then transferred to a 42� incubator, where itwas incubated with mixing overnight. Following overnightincubation, biotinylated probe/genomic DNA fragmenthybrids were immobilized by binding to prepared blockedand washed streptavidin beads by combining the hybridiza-tion mixture (300 ml) with the bead/SSC mixture (100 ml),and incubating at room temperature for 15 min with occa-sional mixing. Beads were then magnetically captured, andwashed three times with wash solution 1 (1· SSC, 0.15%SDS), three times with wash solution 2 (0.2· SSC), andthree times with wash solution 3 (0.05· SSC). After the finalwash step, the beads were resuspended in 200 ml of ultra-
pure water, heated to 100� for 2 min, and quickly magnet-ically captured. The supernatant was carefully collected andconcentrated to a volume of 20 ml in a Speedvac concentra-tor (Savant). A total of 10 ml of the concentrated superna-tant was then used as template for a PCR reaction utilizingIllumina amplification primers and Phusion high fidelityDNA polymerase (New England Biolabs) (2 min 98�, 24cycles of 98� for 10 sec, 65� for 30 sec, and 72� for 15sec). The PCR products were purified with a PCR cleanupkit (Qiagen), quantified, and submitted for Illumina se-quencing on an Illumina Genome Analyzer II.
Results
RAD mapping of C. elegans mutations
To rapidly map C. elegans mutations, we have used an Illu-mina sequencing-based genome-wide single nucleotidepolymorphism mapping procedure called RAD polymor-phism mapping (Lewis et al. 2007; Miller et al. 2007; Bairdet al. 2008). RAD markers are SNPs adjacent to restrictionenzyme recognition sequences in the genomes of divergentstrains. In our case, we used the N2 background (isolated inBristol, UK) to isolate mutants and subsequently crossedthem to the polymorphic Hawaiian CB4856 strain for map-ping. The N2 and CB4856 genome sequences have divergedsubstantially but their hybrid progeny are fertile. On aver-age, there is a SNP approximately every 1 kb, allowing phys-ical mapping using a large number of markers.
To experimentally identify RAD tags, we crossed wild-typeN2 hermaphrodites to CB4856 males. F1 hybrid progeny wereisolated and genomic DNA was digested with EcoRI. Afterligation of Illumina adapters and selective amplification ofthe RAD tags (Figure 1), Illumina sequencing was performedwith an Illumina Genome Analyzer IIx system. Selective am-plification was carried out by using a ‘‘Y’’ adapter for the P2adapter, which prevents fragments that lack a P1 adapterfrom being amplified after first round synthesis initiated fromthe P1 site (as described in Coyne et al. 2004; Baird et al.2008). We detected 3,462 SNPs with an average distancebetween them being 29 kb. Most SNPs (95%) were separatedfrom an adjacent SNP by ,100 kb (Figure 2). The largestdistance separating adjacent SNPs occurred near the center ofchromosome V (515 kb). Most of the SNPs we identifiedcould be predicted in silico from the sequence of theCB4856 strain (data not shown). Because the sequencing isdone with purified RAD tags instead of total genomic DNA,multiple samples can be multiplexed on a single lane in anIllumina sequencer, with each sample containing unique bar-codes for subsequent sequence data deconvolution. The bar-codes used for RAD mapping are 6-bp sequences added to theP1 adapter primer. In one test, we used one Illumina GenomeAnalyzer IIx lane to process 13 RAD mapping crosses. Weused single-end sequencing with 80-bp reads, to achieve 50million reads yielding �40· coverage. We tested the applica-bility of RAD mapping coupled with Illumina sequencing us-ing three different approaches.
RAD Mapping and Pull-Down Sequencing 769
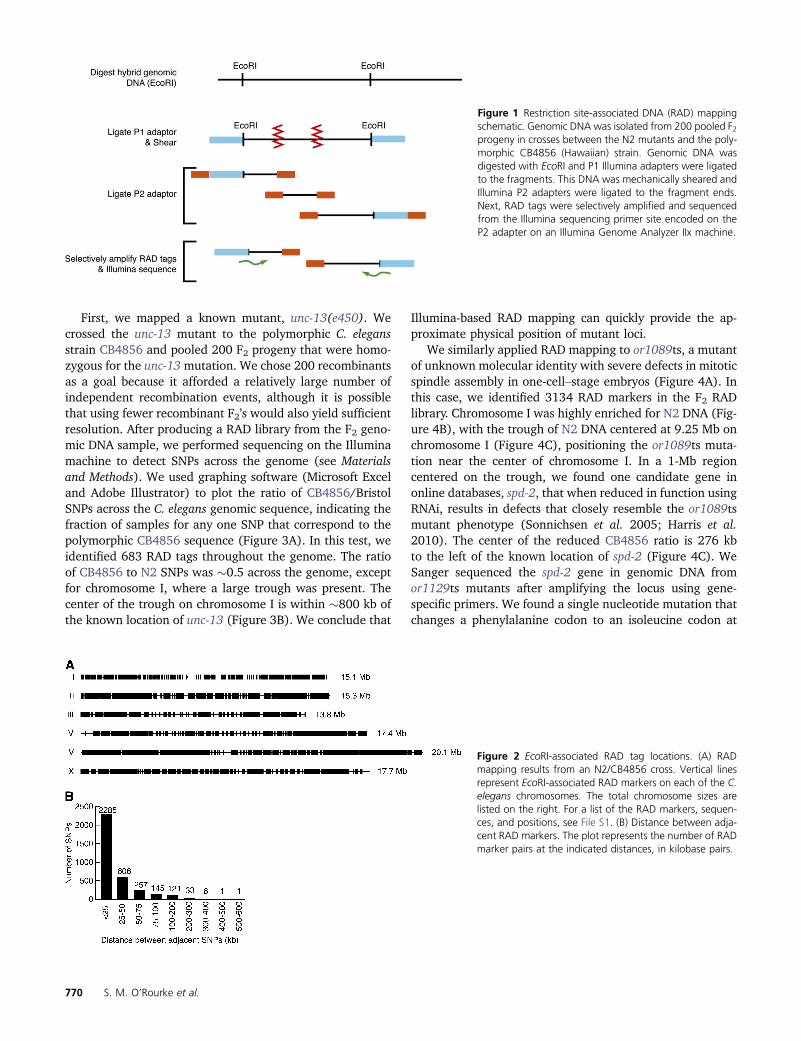
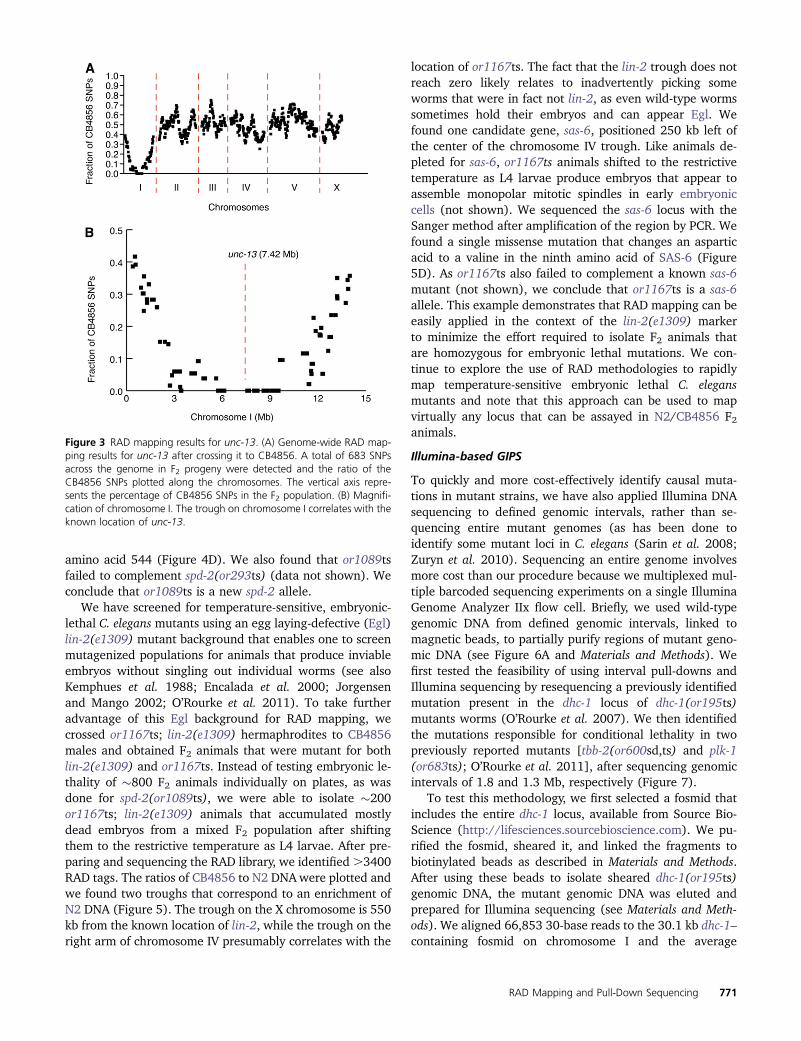
First, we mapped a known mutant, unc-13(e450). Wecrossed the unc-13 mutant to the polymorphic C. elegansstrain CB4856 and pooled 200 F2 progeny that were homo-zygous for the unc-13mutation. We chose 200 recombinantsas a goal because it afforded a relatively large number ofindependent recombination events, although it is possiblethat using fewer recombinant F2’s would also yield sufficientresolution. After producing a RAD library from the F2 geno-mic DNA sample, we performed sequencing on the Illuminamachine to detect SNPs across the genome (see Materialsand Methods). We used graphing software (Microsoft Exceland Adobe Illustrator) to plot the ratio of CB4856/BristolSNPs across the C. elegans genomic sequence, indicating thefraction of samples for any one SNP that correspond to thepolymorphic CB4856 sequence (Figure 3A). In this test, weidentified 683 RAD tags throughout the genome. The ratioof CB4856 to N2 SNPs was �0.5 across the genome, exceptfor chromosome I, where a large trough was present. Thecenter of the trough on chromosome I is within �800 kb ofthe known location of unc-13 (Figure 3B). We conclude that
Illumina-based RAD mapping can quickly provide the ap-proximate physical position of mutant loci.
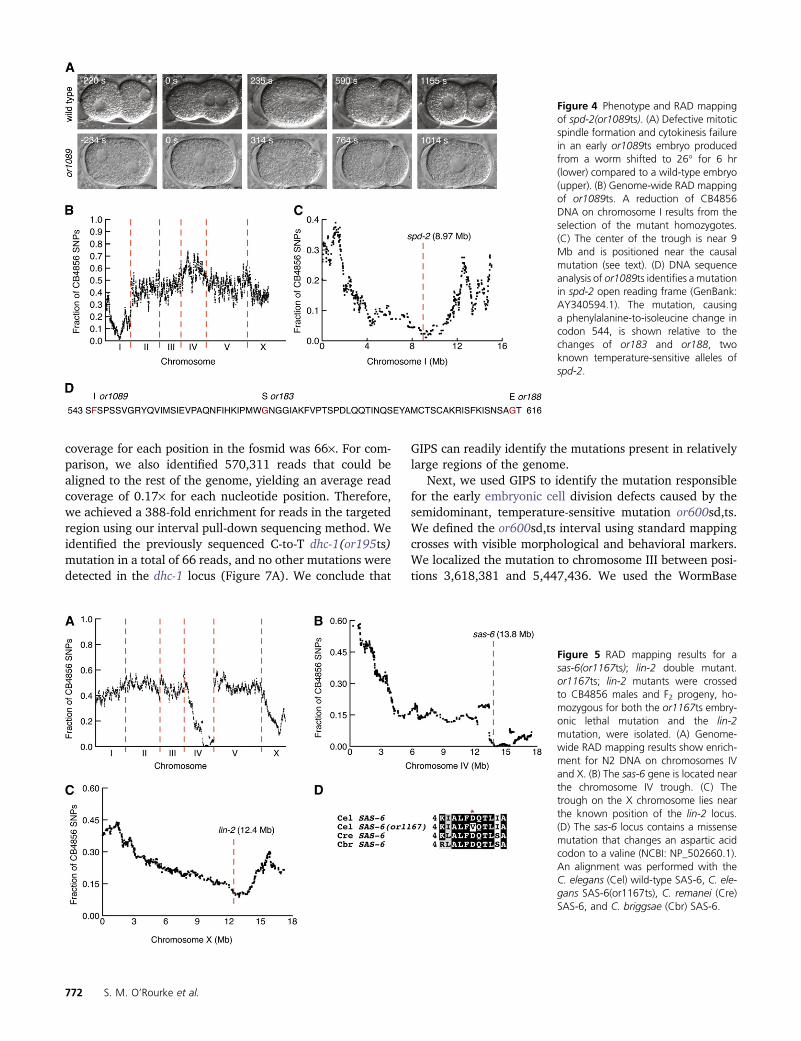
We similarly applied RAD mapping to or1089ts, a mutantof unknown molecular identity with severe defects in mitoticspindle assembly in one-cell–stage embryos (Figure 4A). Inthis case, we identified 3134 RAD markers in the F2 RADlibrary. Chromosome I was highly enriched for N2 DNA (Fig-ure 4B), with the trough of N2 DNA centered at 9.25 Mb onchromosome I (Figure 4C), positioning the or1089ts muta-tion near the center of chromosome I. In a 1-Mb regioncentered on the trough, we found one candidate gene inonline databases, spd-2, that when reduced in function usingRNAi, results in defects that closely resemble the or1089tsmutant phenotype (Sonnichsen et al. 2005; Harris et al.2010). The center of the reduced CB4856 ratio is 276 kbto the left of the known location of spd-2 (Figure 4C). WeSanger sequenced the spd-2 gene in genomic DNA fromor1129ts mutants after amplifying the locus using gene-specific primers. We found a single nucleotide mutation thatchanges a phenylalanine codon to an isoleucine codon at
Figure 1 Restriction site-associated DNA (RAD) mappingschematic. Genomic DNA was isolated from 200 pooled F2progeny in crosses between the N2 mutants and the poly-morphic CB4856 (Hawaiian) strain. Genomic DNA wasdigested with EcoRI and P1 Illumina adapters were ligatedto the fragments. This DNA was mechanically sheared andIllumina P2 adapters were ligated to the fragment ends.Next, RAD tags were selectively amplified and sequencedfrom the Illumina sequencing primer site encoded on theP2 adapter on an Illumina Genome Analyzer IIx machine.
Figure 2 EcoRI-associated RAD tag locations. (A) RADmapping results from an N2/CB4856 cross. Vertical linesrepresent EcoRI-associated RAD markers on each of the C.elegans chromosomes. The total chromosome sizes arelisted on the right. For a list of the RAD markers, sequen-ces, and positions, see File S1. (B) Distance between adja-cent RAD markers. The plot represents the number of RADmarker pairs at the indicated distances, in kilobase pairs.
770 S. M. O’Rourke et al.
amino acid 544 (Figure 4D). We also found that or1089tsfailed to complement spd-2(or293ts) (data not shown). Weconclude that or1089ts is a new spd-2 allele.
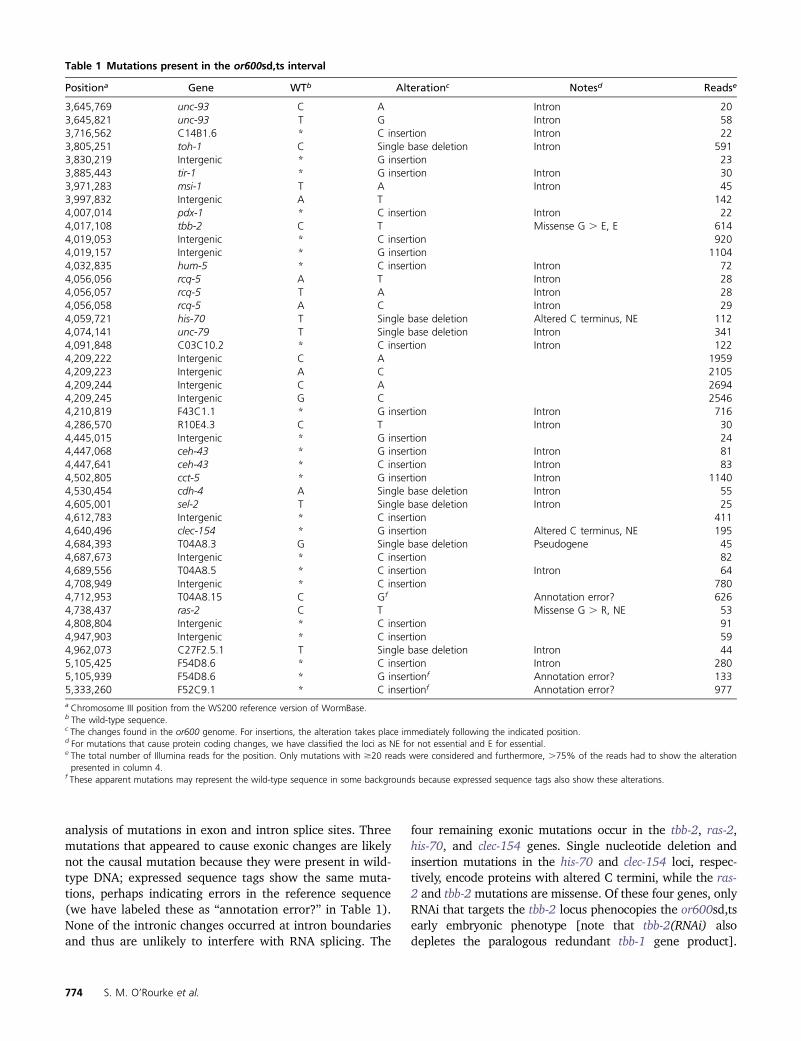
We have screened for temperature-sensitive, embryonic-lethal C. elegans mutants using an egg laying-defective (Egl)lin-2(e1309) mutant background that enables one to screenmutagenized populations for animals that produce inviableembryos without singling out individual worms (see alsoKemphues et al. 1988; Encalada et al. 2000; Jorgensenand Mango 2002; O’Rourke et al. 2011). To take furtheradvantage of this Egl background for RAD mapping, wecrossed or1167ts; lin-2(e1309) hermaphrodites to CB4856males and obtained F2 animals that were mutant for bothlin-2(e1309) and or1167ts. Instead of testing embryonic le-thality of �800 F2 animals individually on plates, as wasdone for spd-2(or1089ts), we were able to isolate �200or1167ts; lin-2(e1309) animals that accumulated mostlydead embryos from a mixed F2 population after shiftingthem to the restrictive temperature as L4 larvae. After pre-paring and sequencing the RAD library, we identified.3400RAD tags. The ratios of CB4856 to N2 DNAwere plotted andwe found two troughs that correspond to an enrichment ofN2 DNA (Figure 5). The trough on the X chromosome is 550kb from the known location of lin-2, while the trough on theright arm of chromosome IV presumably correlates with the
location of or1167ts. The fact that the lin-2 trough does notreach zero likely relates to inadvertently picking someworms that were in fact not lin-2, as even wild-type wormssometimes hold their embryos and can appear Egl. Wefound one candidate gene, sas-6, positioned 250 kb left ofthe center of the chromosome IV trough. Like animals de-pleted for sas-6, or1167ts animals shifted to the restrictivetemperature as L4 larvae produce embryos that appear toassemble monopolar mitotic spindles in early embryoniccells (not shown). We sequenced the sas-6 locus with theSanger method after amplification of the region by PCR. Wefound a single missense mutation that changes an asparticacid to a valine in the ninth amino acid of SAS-6 (Figure5D). As or1167ts also failed to complement a known sas-6mutant (not shown), we conclude that or1167ts is a sas-6allele. This example demonstrates that RAD mapping can beeasily applied in the context of the lin-2(e1309) markerto minimize the effort required to isolate F2 animals thatare homozygous for embryonic lethal mutations. We con-tinue to explore the use of RAD methodologies to rapidlymap temperature-sensitive embryonic lethal C. elegansmutants and note that this approach can be used to mapvirtually any locus that can be assayed in N2/CB4856 F2animals.
Illumina-based GIPS
To quickly and more cost-effectively identify causal muta-tions in mutant strains, we have also applied Illumina DNAsequencing to defined genomic intervals, rather than se-quencing entire mutant genomes (as has been done toidentify some mutant loci in C. elegans (Sarin et al. 2008;Zuryn et al. 2010). Sequencing an entire genome involvesmore cost than our procedure because we multiplexed mul-tiple barcoded sequencing experiments on a single IlluminaGenome Analyzer IIx flow cell. Briefly, we used wild-typegenomic DNA from defined genomic intervals, linked tomagnetic beads, to partially purify regions of mutant geno-mic DNA (see Figure 6A and Materials and Methods). Wefirst tested the feasibility of using interval pull-downs andIllumina sequencing by resequencing a previously identifiedmutation present in the dhc-1 locus of dhc-1(or195ts)mutants worms (O’Rourke et al. 2007). We then identifiedthe mutations responsible for conditional lethality in twopreviously reported mutants [tbb-2(or600sd,ts) and plk-1(or683ts); O’Rourke et al. 2011], after sequencing genomicintervals of 1.8 and 1.3 Mb, respectively (Figure 7).
To test this methodology, we first selected a fosmid thatincludes the entire dhc-1 locus, available from Source Bio-Science (http://lifesciences.sourcebioscience.com). We pu-rified the fosmid, sheared it, and linked the fragments tobiotinylated beads as described in Materials and Methods.After using these beads to isolate sheared dhc-1(or195ts)genomic DNA, the mutant genomic DNA was eluted andprepared for Illumina sequencing (see Materials and Meth-ods). We aligned 66,853 30-base reads to the 30.1 kb dhc-1–containing fosmid on chromosome I and the average
Figure 3 RAD mapping results for unc-13. (A) Genome-wide RAD map-ping results for unc-13 after crossing it to CB4856. A total of 683 SNPsacross the genome in F2 progeny were detected and the ratio of theCB4856 SNPs plotted along the chromosomes. The vertical axis repre-sents the percentage of CB4856 SNPs in the F2 population. (B) Magnifi-cation of chromosome I. The trough on chromosome I correlates with theknown location of unc-13.
RAD Mapping and Pull-Down Sequencing 771
coverage for each position in the fosmid was 66·. For com-parison, we also identified 570,311 reads that could bealigned to the rest of the genome, yielding an average readcoverage of 0.17· for each nucleotide position. Therefore,we achieved a 388-fold enrichment for reads in the targetedregion using our interval pull-down sequencing method. Weidentified the previously sequenced C-to-T dhc-1(or195ts)mutation in a total of 66 reads, and no other mutations weredetected in the dhc-1 locus (Figure 7A). We conclude that
GIPS can readily identify the mutations present in relativelylarge regions of the genome.
Next, we used GIPS to identify the mutation responsiblefor the early embryonic cell division defects caused by thesemidominant, temperature-sensitive mutation or600sd,ts.We defined the or600sd,ts interval using standard mappingcrosses with visible morphological and behavioral markers.We localized the mutation to chromosome III between posi-tions 3,618,381 and 5,447,436. We used the WormBase
Figure 4 Phenotype and RAD mappingof spd-2(or1089ts). (A) Defective mitoticspindle formation and cytokinesis failurein an early or1089ts embryo producedfrom a worm shifted to 26� for 6 hr(lower) compared to a wild-type embryo(upper). (B) Genome-wide RAD mappingof or1089ts. A reduction of CB4856DNA on chromosome I results from theselection of the mutant homozygotes.(C) The center of the trough is near 9Mb and is positioned near the causalmutation (see text). (D) DNA sequenceanalysis of or1089ts identifies a mutationin spd-2 open reading frame (GenBank:AY340594.1). The mutation, causinga phenylalanine-to-isoleucine change incodon 544, is shown relative to thechanges of or183 and or188, twoknown temperature-sensitive alleles ofspd-2.
Figure 5 RAD mapping results for asas-6(or1167ts); lin-2 double mutant.or1167ts; lin-2 mutants were crossedto CB4856 males and F2 progeny, ho-mozygous for both the or1167ts embry-onic lethal mutation and the lin-2mutation, were isolated. (A) Genome-wide RAD mapping results show enrich-ment for N2 DNA on chromosomes IVand X. (B) The sas-6 gene is located nearthe chromosome IV trough. (C) Thetrough on the X chromosome lies nearthe known position of the lin-2 locus.(D) The sas-6 locus contains a missensemutation that changes an aspartic acidcodon to a valine (NCBI: NP_502660.1).An alignment was performed with theC. elegans (Cel) wild-type SAS-6, C. ele-gans SAS-6(or1167ts), C. remanei (Cre)SAS-6, and C. briggsae (Cbr) SAS-6.
772 S. M. O’Rourke et al.

genome browser to identify a minimal tiling path usinggenomic DNA from fosmid clones available from SourceBioScience (http://lifesciences.sourcebioscience.com). We iden-tified 65 fosmids that spanned the region with 7 gaps thattotaled ,45 kb (�2.5% of the region). We purified, sheared,and linked the fosmid fragments to biotinylated beads. Afterusing these beads to isolate sheared or600sd,ts genomicDNA, the mutant genomic DNA was eluted and preparedfor Illumina sequencing (see Materials and Methods). Wefound 1,596,403 48-base reads that could be aligned tothe region, giving an average coverage for each nucleotidein the interval of 42·. The total number of reads correspond-ing to the C. elegans genome was 6,034,221.
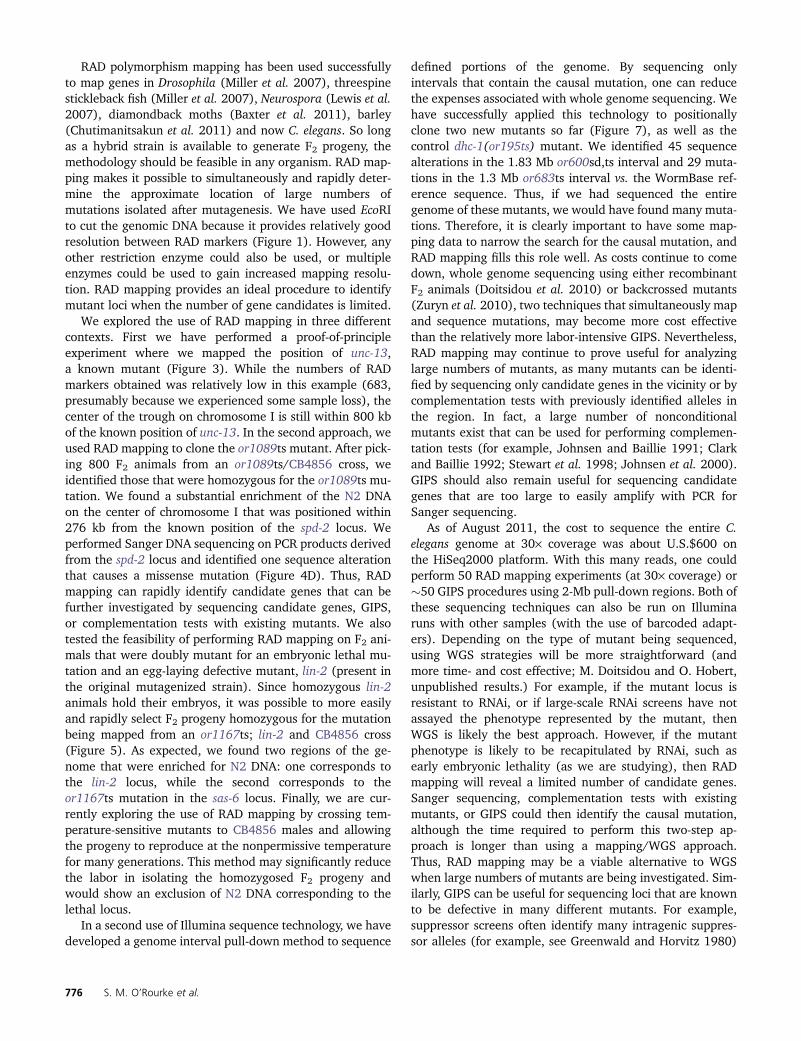
We used software (SAMtools) to output a text file thatlists the mutations identified in the interval. One can alsoview the sequence reads aligned to the reference wild-typegenome sequence with SAMtools (Figure 6B). There were45 mutations in the 1.8-Mb or600sd,ts interval (Figure 7B).We found 14 extragenic changes, 23 intronic changes, onemutation in a pseudogene, two mutations that cause thetranscript to go out of frame, three potential annotationerrors, and two missense mutations (Table 1). As .90%of our identified temperature-sensitive mutations are causedby missense mutations (the remaining are due to prematurestop codons, small deletions, and mutations in splice-siteboundaries) (O’Rourke et al. 2011), we narrowed our
Figure 6 Genome interval pull-downsequencing (GIPS) using the Illuminaplatform. (A) Schematic overview ofthe interval pull-down sequencingmethod. First, fosmids of wild-typeDNA covering a region of the genomeare purified, sheared, and ligated to bio-tinylated adapters. Next, mutant geno-mic DNA is sheared and annealed to thebiotinylated fosmids. After purificationand release of the mutant DNA usingmagnetic beads, the fragments are sub-jected to sequencing on an Illumina ma-chine. Finally, the reads are assembledonto the genome scaffold and polymor-
phisms are identified. (B) Example output of mutant genome assembly. Shown is a small region of the tbb-2 locus with portions of reads alignedbeneath the reference sequence. In this case, each read shows that a cytosine in wild type has been changed to a thymidine in tbb-2(or600sd,ts). Alsoshown is one apparent sequencing error where an A . G change was called in one of the reads. Nucleotides are color coded, uppercase letters, andperiods in the sequence reads represent identity with the reference sequence, while reads containing lowercase letters and commas represent sequencedata obtained from the reverse complement strand.
Figure 7 Analysis of the genome interval pull-down se-quencing. The protocol shown was applied to threemutants. The positions of nucleotide alterations vs. thereference sequence is shown in graphical form. Each linerepresents a single change, diagonal lines attached to thetop of the vertical lines represent multiple changes locatedvery close together. Lines are color coded to show varioustypes of mutations. The ^ in the black bars point to thecausative mutations. (A) Sequencing results for the 15 kbdhc-1(or195ts) locus purified using a single genomic fos-mid clone. The previously identified missense mutationwas found. (B) Sequencing results for a 1.82-Mb regionon chromosome III in the or600sd,ts genome. We identi-fied 45 total mutations in the region including the mis-sense mutation in tbb-2 (see Table 1 for details). (C)Sequencing results for a 1.3-Mb region on chromosomeIII in the or683ts genome. We identified 29 total mutationsin the region including the missense mutation in plk-1 (seeTable 2 for details).
RAD Mapping and Pull-Down Sequencing 773
analysis of mutations in exon and intron splice sites. Threemutations that appeared to cause exonic changes are likelynot the causal mutation because they were present in wild-type DNA; expressed sequence tags show the same muta-tions, perhaps indicating errors in the reference sequence(we have labeled these as “annotation error?” in Table 1).None of the intronic changes occurred at intron boundariesand thus are unlikely to interfere with RNA splicing. The
four remaining exonic mutations occur in the tbb-2, ras-2,his-70, and clec-154 genes. Single nucleotide deletion andinsertion mutations in the his-70 and clec-154 loci, respec-tively, encode proteins with altered C termini, while the ras-2 and tbb-2 mutations are missense. Of these four genes, onlyRNAi that targets the tbb-2 locus phenocopies the or600sd,tsearly embryonic phenotype [note that tbb-2(RNAi) alsodepletes the paralogous redundant tbb-1 gene product].
Table 1 Mutations present in the or600sd,ts interval
Positiona Gene WTb Alterationc Notesd Readse
3,645,769 unc-93 C A Intron 203,645,821 unc-93 T G Intron 583,716,562 C14B1.6 * C insertion Intron 223,805,251 toh-1 C Single base deletion Intron 5913,830,219 Intergenic * G insertion 233,885,443 tir-1 * G insertion Intron 303,971,283 msi-1 T A Intron 453,997,832 Intergenic A T 1424,007,014 pdx-1 * C insertion Intron 224,017,108 tbb-2 C T Missense G . E, E 6144,019,053 Intergenic * C insertion 9204,019,157 Intergenic * G insertion 11044,032,835 hum-5 * C insertion Intron 724,056,056 rcq-5 A T Intron 284,056,057 rcq-5 T A Intron 284,056,058 rcq-5 A C Intron 294,059,721 his-70 T Single base deletion Altered C terminus, NE 1124,074,141 unc-79 T Single base deletion Intron 3414,091,848 C03C10.2 * C insertion Intron 1224,209,222 Intergenic C A 19594,209,223 Intergenic A C 21054,209,244 Intergenic C A 26944,209,245 Intergenic G C 25464,210,819 F43C1.1 * G insertion Intron 7164,286,570 R10E4.3 C T Intron 304,445,015 Intergenic * G insertion 244,447,068 ceh-43 * G insertion Intron 814,447,641 ceh-43 * C insertion Intron 834,502,805 cct-5 * G insertion Intron 11404,530,454 cdh-4 A Single base deletion Intron 554,605,001 sel-2 T Single base deletion Intron 254,612,783 Intergenic * C insertion 4114,640,496 clec-154 * G insertion Altered C terminus, NE 1954,684,393 T04A8.3 G Single base deletion Pseudogene 454,687,673 Intergenic * C insertion 824,689,556 T04A8.5 * C insertion Intron 644,708,949 Intergenic * C insertion 7804,712,953 T04A8.15 C Gf Annotation error? 6264,738,437 ras-2 C T Missense G . R, NE 534,808,804 Intergenic * C insertion 914,947,903 Intergenic * C insertion 594,962,073 C27F2.5.1 T Single base deletion Intron 445,105,425 F54D8.6 * C insertion Intron 2805,105,939 F54D8.6 * G insertionf Annotation error? 1335,333,260 F52C9.1 * C insertionf Annotation error? 977a Chromosome III position from the WS200 reference version of WormBase.b The wild-type sequence.c The changes found in the or600 genome. For insertions, the alteration takes place immediately following the indicated position.d For mutations that cause protein coding changes, we have classified the loci as NE for not essential and E for essential.e The total number of Illumina reads for the position. Only mutations with $20 reads were considered and furthermore, .75% of the reads had to show the alterationpresented in column 4.
f These apparent mutations may represent the wild-type sequence in some backgrounds because expressed sequence tags also show these alterations.
774 S. M. O’Rourke et al.

Depletion of the other three genes by RNAi does not result inany lethal phenotypes (WormBase). On the basis of sequencedata, the embryonic phenotype and genetic interactions witha previously isolated tbb-2 allele, or362sd,ts (O’Rourke et al.2011), we conclude that or600sd,ts is a tbb-2 allele.
We also identified a recessive temperature-sensitiveembryonic lethal mutant, or683ts, that mapped between6,862,157 and 8,214,712 on chromosome III, on the basisof mapping crosses with visible markers and some PCR-based SNP mapping (not shown). To identify all of themutations in the interval, we again performed GIPS, as de-tailed for dhc-1(or195ts) and tbb-2(or600sd,ts). There were197,752 48-base reads (from a total of 5,616,109 reads)that aligned to the region, giving an average coverage of7· for the interval. Even though the sequencing coveragewas greatly reduced compared to the dhc-1(or195ts) andor600sd,ts results, we were still able to identify 29 muta-tions in the interval after performing Illumina sequencing(Figure 7C). We found nine intergenic changes, eight muta-tions in introns, two mutations in 39-untranslated regions,one mutation in a transposon, six insertions or deletions that
caused frame shifting, two potential annotation errors, andone missense allele (Table 2). The annotation errors mayrepresent the wild-type sequence because expressed se-quence tags show this same alteration. The single missensemutation changes a methionine codon to a lysine codon inthe plk-1 gene. Since or683ts contains a mutation in the plk-1 gene and fails to complement a known allele of plk-1(O’Rourke et al. 2011), we conclude that or683ts is a novelplk-1 allele.
Discussion
The utility of C. elegans as an animal model, in which onecan readily isolate temperature-sensitive mutations in essen-tial genes, and the power of next generation DNA sequenc-ing for greatly reducing the time required to positionallyclone mutant loci, now make it possible to much more rap-idly isolate experimentally useful conditional mutations inessential genes. Our two new Illumina-based sequencingmethods should allow for increased throughput when ana-lyzing large numbers of mutants.
Table 2 Mutations present in the or683ts interval
Positiona Gene WTb Alterationc Notesd Readse
7,029,617 Intergenic * A insertion 117,047,283 Intergenic * C insertion 207,063,069 R01H2.4 * C insertion Altered C terminus, NE 157,214,105 R151.2 A Cf Annotation error? 277,228,289 R151.8 AAC Deletion Intron 117,272,182 psd-1 * G insertion Intron 267,297,779 B0361.2 * AA insertion Intron 107,318,365 F56C9.8 * TT insertion Intron 117,587,395 cup-5 G Deletion Intron 127,628,358 fbn-1 TG Deletion Altered C terminus, E 117,686,828 C18H2.3 * TA insertion 39-UTR 107,696,424 C18H2.4 TA Deletion Altered C terminus, NE 127,712,933 Intergenic * G insertion 177,781,836 mab-5 AG Deletion Intron 117,864,173 C02C2.4 C Deletion Intron 237,919,577 tag-250 * GA insertion Altered C terminus, NE 127,937,298 ran-2 TC Deletion 39-UTR 117,958,664 F54H12.3 C T Transposon 158,042,705 K12H4.6 * G insertion Altered C terminus, NE 328,053,797 Intergenic C Deletion 108,059,766 Intergenic C T 218,064,605 Intergenic C T 178,068,402 ceh-26 * G insertionf Annotation error? 118,070,697 ceh-26 * G insertion Intron 258,075,189 dcr-1 * GG insertion Altered C terminus, E 198,103,295 plk-1 T A Missense M . K, E 128,127,908 Intergenic * T insertion 128,128,979 Intergenic * C insertion 308,154,518 Intergenic T A 10a Chromosome III position from the WS200 reference version of Wormbase.b The wild-type sequence.c The changes found in the or683 genome. For insertions, the alteration takes place immediately following the indicated position.d For mutations that cause protein coding changes, we have classified the loci as NE for not essential and E for essential.e The total number of Illumina reads for the position. Only mutations with $10 reads were considered and furthermore, .90% of the reads had to show the alterationpresented in column 4.
f These apparent mutations may represent the wild-type sequence in some backgrounds because expressed sequence tags available from WormBase also show thesealterations.
RAD Mapping and Pull-Down Sequencing 775
RAD polymorphism mapping has been used successfullyto map genes in Drosophila (Miller et al. 2007), threespinestickleback fish (Miller et al. 2007), Neurospora (Lewis et al.2007), diamondback moths (Baxter et al. 2011), barley(Chutimanitsakun et al. 2011) and now C. elegans. So longas a hybrid strain is available to generate F2 progeny, themethodology should be feasible in any organism. RAD map-ping makes it possible to simultaneously and rapidly deter-mine the approximate location of large numbers ofmutations isolated after mutagenesis. We have used EcoRIto cut the genomic DNA because it provides relatively goodresolution between RAD markers (Figure 1). However, anyother restriction enzyme could also be used, or multipleenzymes could be used to gain increased mapping resolu-tion. RAD mapping provides an ideal procedure to identifymutant loci when the number of gene candidates is limited.
We explored the use of RAD mapping in three differentcontexts. First we have performed a proof-of-principleexperiment where we mapped the position of unc-13,a known mutant (Figure 3). While the numbers of RADmarkers obtained was relatively low in this example (683,presumably because we experienced some sample loss), thecenter of the trough on chromosome I is still within 800 kbof the known position of unc-13. In the second approach, weused RAD mapping to clone the or1089ts mutant. After pick-ing 800 F2 animals from an or1089ts/CB4856 cross, weidentified those that were homozygous for the or1089ts mu-tation. We found a substantial enrichment of the N2 DNAon the center of chromosome I that was positioned within276 kb from the known position of the spd-2 locus. Weperformed Sanger DNA sequencing on PCR products derivedfrom the spd-2 locus and identified one sequence alterationthat causes a missense mutation (Figure 4D). Thus, RADmapping can rapidly identify candidate genes that can befurther investigated by sequencing candidate genes, GIPS,or complementation tests with existing mutants. We alsotested the feasibility of performing RAD mapping on F2 ani-mals that were doubly mutant for an embryonic lethal mu-tation and an egg-laying defective mutant, lin-2 (present inthe original mutagenized strain). Since homozygous lin-2animals hold their embryos, it was possible to more easilyand rapidly select F2 progeny homozygous for the mutationbeing mapped from an or1167ts; lin-2 and CB4856 cross(Figure 5). As expected, we found two regions of the ge-nome that were enriched for N2 DNA: one corresponds tothe lin-2 locus, while the second corresponds to theor1167ts mutation in the sas-6 locus. Finally, we are cur-rently exploring the use of RAD mapping by crossing tem-perature-sensitive mutants to CB4856 males and allowingthe progeny to reproduce at the nonpermissive temperaturefor many generations. This method may significantly reducethe labor in isolating the homozygosed F2 progeny andwould show an exclusion of N2 DNA corresponding to thelethal locus.
In a second use of Illumina sequence technology, we havedeveloped a genome interval pull-down method to sequence
defined portions of the genome. By sequencing onlyintervals that contain the causal mutation, one can reducethe expenses associated with whole genome sequencing. Wehave successfully applied this technology to positionallyclone two new mutants so far (Figure 7), as well as thecontrol dhc-1(or195ts) mutant. We identified 45 sequencealterations in the 1.83 Mb or600sd,ts interval and 29 muta-tions in the 1.3 Mb or683ts interval vs. the WormBase ref-erence sequence. Thus, if we had sequenced the entiregenome of these mutants, we would have found many muta-tions. Therefore, it is clearly important to have some map-ping data to narrow the search for the causal mutation, andRAD mapping fills this role well. As costs continue to comedown, whole genome sequencing using either recombinantF2 animals (Doitsidou et al. 2010) or backcrossed mutants(Zuryn et al. 2010), two techniques that simultaneously mapand sequence mutations, may become more cost effectivethan the relatively more labor-intensive GIPS. Nevertheless,RAD mapping may continue to prove useful for analyzinglarge numbers of mutants, as many mutants can be identi-fied by sequencing only candidate genes in the vicinity or bycomplementation tests with previously identified alleles inthe region. In fact, a large number of nonconditionalmutants exist that can be used for performing complemen-tation tests (for example, Johnsen and Baillie 1991; Clarkand Baillie 1992; Stewart et al. 1998; Johnsen et al. 2000).GIPS should also remain useful for sequencing candidategenes that are too large to easily amplify with PCR forSanger sequencing.
As of August 2011, the cost to sequence the entire C.elegans genome at 30· coverage was about U.S.$600 onthe HiSeq2000 platform. With this many reads, one couldperform 50 RAD mapping experiments (at 30· coverage) or�50 GIPS procedures using 2-Mb pull-down regions. Both ofthese sequencing techniques can also be run on Illuminaruns with other samples (with the use of barcoded adapt-ers). Depending on the type of mutant being sequenced,using WGS strategies will be more straightforward (andmore time- and cost effective; M. Doitsidou and O. Hobert,unpublished results.) For example, if the mutant locus isresistant to RNAi, or if large-scale RNAi screens have notassayed the phenotype represented by the mutant, thenWGS is likely the best approach. However, if the mutantphenotype is likely to be recapitulated by RNAi, such asearly embryonic lethality (as we are studying), then RADmapping will reveal a limited number of candidate genes.Sanger sequencing, complementation tests with existingmutants, or GIPS could then identify the causal mutation,although the time required to perform this two-step ap-proach is longer than using a mapping/WGS approach.Thus, RAD mapping may be a viable alternative to WGSwhen large numbers of mutants are being investigated. Sim-ilarly, GIPS can be useful for sequencing loci that are knownto be defective in many different mutants. For example,suppressor screens often identify many intragenic suppres-sor alleles (for example, see Greenwald and Horvitz 1980)
776 S. M. O’Rourke et al.
which, depending on size, can be very time consuming toSanger sequence; yet performing WGS may be too expensivewith many alleles to sequence. GIPS fills this gap and allowsthe simultaneous sequencing of many different mutant locion the same Illumina lane with the use of barcoded samples.In conclusion, we offer two new strategies for mutant iden-tification in C. elegans that can fill roles not currently pro-vided by WGS for certain applications.
The following additional data are available with theonline version of this paper: File S1 is a table listing thegenomic positions and sequence of the EcoRI-associatedRAD tags present in the N2 and CB4856 strains using theWS190 referential version of WormBase.
Acknowledgments
We thank members of the Bowerman and Johnson labs forhelp in isolating conditional mutants and developing map-ping and sequencing protocols. This work was supported bya Leukemia and Lymphoma Society of America fellowship toS.M.O. and National Institutes of Health grants GM050817and GM049869 to B.B.
Literature Cited
Albert, T. J., M. N. Molla, D. M. Muzny, L. Nazareth, D. Wheeleret al., 2007 Direct selection of human genomic loci by micro-array hybridization. Nat. Methods 4: 903–905.
Baird, N. A., P. D. Etter, T. S. Atwood, M. C. Currey, A. L. Shiveret al., 2008 Rapid SNP discovery and genetic mapping usingsequenced RAD markers. PLoS ONE 3: e3376.
Baxter, S. W., J. W. Davey, J. S. Johnston, A. M. Shelton, D. G.Heckel et al., 2011 Linkage mapping and comparative ge-nomics using next-generation RAD sequencing of a non-modelorganism. PLoS ONE 6: e19315.
Bigelow, H., M. Doitsidou, S. Sarin, and O. Hobert,2009 MAQGene: software to facilitate C. elegans mutant ge-nome sequence analysis. Nat. Methods 6: 549.
Blumenstiel, J. P., A. C. Noll, J. A. Griffiths, A. G. Perera, K. N.Walton et al., 2009 Identification of EMS-induced mutationsin Drosophila melanogaster by whole-genome sequencing. Ge-netics 182: 25–32.
Brenner, S., 1974 The genetics of Caenorhabditis elegans. Genetics77: 71–94.
Chutimanitsakun, Y., R. W. Nipper, A. Cuesta-Marcos, L. Cistue, A.Corey et al., 2011 Construction and application for QTL anal-ysis of a restriction site associated DNA (RAD) linkage map inbarley. BMC Genomics 12: 4.
Clark, D. V., and D. L. Baillie, 1992 Genetic analysis and comple-mentation by germ-line transformation of lethal mutations inthe unc-22 IV region of Caenorhabditis elegans. Mol. Gen. Genet.232: 97–105.
Coyne, K. J., J. M. Burkholder, R. A. Feldman, D. A. Hutchins, andS. C. Cary, 2004 Modified serial analysis of gene expressionmethod for construction of gene expression profiles of micro-bial eukaryotic species. Appl. Environ. Microbiol. 70: 5298–5304.
Doitsidou, M., R. J. Poole, S. Sarin, H. Bigelow, and O. Hobert,2010 C. elegans mutant identification with a one-step whole-genome-sequencing and SNP mapping strategy. PLoS ONE 5:e15435.
Encalada, S. E., P. R. Martin, J. B. Phillips, R. Lyczak, D. R. Hamillet al., 2000 DNA replication defects delay cell division anddisrupt cell polarity in early Caenorhabditis elegans embryos.Dev. Biol. 228: 225–238.
Gnirke, A., A. Melnikov, J. Maguire, P. Rogov, E. M. LeProust et al.,2009 Solution hybrid selection with ultra-long oligonucleoti-des for massively parallel targeted sequencing. Nat. Biotechnol.27: 182–189.
Greenwald, I. S., and H. R. Horvitz, 1980 unc-93(e1500): a be-havioral mutant of Caenorhabditis elegans that defines a genewith a wild-type null phenotype. Genetics 96: 147–164.
Harris, T. W., I. Antoshechkin, T. Bieri, D. Blasiar, J. Chan et al.,2010 WormBase: a comprehensive resource for nematode re-search. Nucleic Acids Res. 38: D463–D467.
Hodges, E., Z. Xuan, V. Balija, M. Kramer, M. N. Molla et al.,2007 Genome-wide in situ exon capture for selective resequencing.Nat. Genet. 39: 1522–1527.
Hohenlohe, P. A., S. Bassham, P. D. Etter, N. Stiffler, E. A. Johnsonet al., 2010 Population genomics of parallel adaptation inthreespine stickleback using sequenced RAD tags. PLoS Genet.6: e1000862.
Irvine, D. V., D. B. Goto, M. W. Vaughn, Y. Nakaseko, W. R. McCombieet al., 2009 Mapping epigenetic mutations in fission yeastusing whole-genome next-generation sequencing. Genome Res.19: 1077–1083.
Johnsen, R. C., and D. L. Baillie, 1991 Genetic analysis of a majorsegment [LGV(left)] of the genome of Caenorhabditis elegans.Genetics 129: 735–752.
Johnsen, R. C., S. J. Jones, and A. M. Rose, 2000 Mutationalaccessibility of essential genes on chromosome I(left) in Caeno-rhabditis elegans. Mol. Gen. Genet. 263: 239–252.
Jorgensen, E. M., and S. E. Mango, 2002 The art and design of geneticscreens: Caenorhabditis elegans. Nat. Rev. Genet. 3: 356–369.
Kemphues, K. J., M. Kusch, and N. Wolf, 1988 Maternal-effectlethal mutations on linkage group II of Caenorhabditis elegans.Genetics 120: 977–986.
Ksiazek, T. G., D. Erdman, C. S. Goldsmith, S. R. Zaki, T. Peretet al., 2003 A novel coronavirus associated with severe acuterespiratory syndrome. N. Engl. J. Med. 348: 1953–1966.
Langmead, B., C. Trapnell, M. Pop, and S. L. Salzberg,2009 Ultrafast and memory-efficient alignment of short DNAsequences to the human genome. Genome Biol. 10: R25.
Lewis, Z. A., A. L. Shiver, N. Stiffler, M. R. Miller, E. A. Johnsonet al., 2007 High-density detection of restriction-site-associ-ated DNA markers for rapid mapping of mutated loci in Neuros-pora. Genetics 177: 1163–1171.
Li, H., B. Handsaker, A. Wysoker, T. Fennell, J. Ruan et al.,2009 The Sequence Alignment/Map format and SAMtools. Bi-oinformatics 25: 2078–2079.
Miller, M. R., J. P. Dunham, A. Amores, W. A. Cresko, and E. A.Johnson, 2007 Rapid and cost-effective polymorphism identi-fication and genotyping using restriction site associated DNA(RAD) markers. Genome Res. 17: 240–248.
Okou, D. T., K. M. Steinberg, C. Middle, D. J. Cutler, T. J. Albertet al., 2007 Microarray-based genomic selection for high-throughput resequencing. Nat. Methods 4: 907–909.
O’Rourke, S. M., M. D. Dorfman, J. C. Carter, and B. Bowerman,2007 Dynein modifiers in C. elegans: light chains suppress con-ditional heavy chain mutants. PLoS Genet. 3: e128.
O’Rourke, S. M., C. Carter, L. Carter, S. N. Christensen, M. P. Joneset al., 2011 A survey of new temperature-sensitive, embryonic-lethal mutations in C. elegans: 24 alleles of thirteen genes. PLoSONE 6: e16644.
Rota, P. A., M. S. Oberste, S. S. Monroe, W. A. Nix, R. Campagnoliet al., 2003 Characterization of a novel coronavirus associatedwith severe acute respiratory syndrome. Science 300: 1394–1399.
RAD Mapping and Pull-Down Sequencing 777

Sarin, S., S. Prabhu, M. M. O’Meara, I. Pe’er, and O. Hobert,2008 Caenorhabditis elegans mutant allele identification bywhole-genome sequencing. Nat. Methods 5: 865–867.
Smith, D. R., A. R. Quinlan, H. E. Peckham, K. Makowsky, W. Tao et al.,2008 Rapid whole-genome mutational profiling using next-generation sequencing technologies. Genome Res. 18: 1638–1642.
Sonnichsen, B., L. B. Koski, A. Walsh, P. Marschall, B. Neumannet al., 2005 Full-genome RNAi profiling of early embryogene-sis in Caenorhabditis elegans. Nature 434: 462–469.
Srivatsan, A., Y. Han, J. Peng, A. K. Tehranchi, R. Gibbs et al.,2008 High-precision, whole-genome sequencing of laboratorystrains facilitates genetic studies. PLoS Genet. 4: e1000139.
Stewart, H. I., N. J. O’Neil, D. L. Janke, N. W. Franz, H. M.Chamberlin et al., 1998 Lethal mutations defining 112 com-plementation groups in a 4.5 Mb sequenced region of Caenorhab-ditis elegans chromosome III. Mol. Gen. Genet. 260: 280–288.
Wang, D., A. Urisman, Y. T. Liu, M. Springer, T. G. Ksiazek et al.,2003 Viral discovery and sequence recovery using DNA micro-arrays. PLoS Biol. 1: E2.
Zuryn, S., S. Le Gras, K. Jamet, and S. Jarriault, 2010 A strategyfor direct mapping and identification of mutations by whole-genome sequencing. Genetics 186: 427–430.
Communicating editor: O. Hobert
778 S. M. O’Rourke et al.

GENETICSSupporting Information
http://www.genetics.org/content/suppl/2011/09/06/genetics.111.134031.DC1
Rapid Mapping and Identification of Mutationsin Caenorhabditis elegans by Restriction
Site-Associated DNA Mapping and GenomicInterval Pull-Down Sequencing
Sean M. O’Rourke, John Yochem, Amy A. Connolly, Meredith H. Price, Luke Carter, Joshua B. Lowry,Douglas W. Turnbull, Nick Kamps-Hughes, Nicholas Stiffler, Michael R. Miller, Eric A. Johnson,
and Bruce Bowerman
Copyright � 2011 by the Genetics Society of AmericaDOI: 10.1534/genetics.111.134031

S.M.O’Rourkeetal.2SI
FileS1
SupportingData
FileS1isavailablefordownloadasanExcelfileat
http://www.genetics.org/content/suppl/2011/09/06/genetics.111.134031.DC1.