rapid learning of odor value association in the olfactory
TRANSCRIPT

Copyright © 2020 Millman and Murthy
Research Report: Regular Manuscript
Rapid Learning of Odor–Value Association in theOlfactory Striatum
https://doi.org/10.1523/JNEUROSCI.2604-19.2020
Cite as: J. Neurosci 2020; 10.1523/JNEUROSCI.2604-19.2020
Received: 2 November 2019Revised: 30 March 2020Accepted: 6 April 2020
This Early Release article has been peer-reviewed and accepted, but has not been throughthe composition and copyediting processes. The final version may differ slightly in style orformatting and will contain links to any extended data.
Alerts: Sign up at www.jneurosci.org/alerts to receive customized email alerts when the fullyformatted version of this article is published.

1
Rapid Learning of Odor–Value Association in the Olfactory Striatum 1
[Abbreviated title: Rapid Learning in the Olfactory Striatum] 2
3
Daniel J. Millman†1,2 and Venkatesh N. Murthy*2,3 4
5
1Graduate Program in Neuroscience, Harvard University 6
2Department of Molecular & Cellular Biology, Harvard University 7
3Center for Brain Science, Harvard University 8
Cambridge, MA 02138 9
†Current address: Allen Institute for Brain Science, Seattle, WA 98109 10
*Corresponding author: [email protected] 11
12
Number of pages: 35 13
Number of figures: 9 14
Number of tables: 0 15
Number of multimedia and 3D models: 0 16
Number of extended data figures/tables: 0 17
Number of words: Abstract (157), Introduction (714), and Discussion (1499) 18
Conflict of interest statement: The authors declare no competing financial interests. 19
20
Acknowledgements: This work was supported, in part, by a grant from the NIH (R01 DC017311) to 21
VNM. DJM was supported by the National Science Foundation Graduate Research Fellowship under 22
Grant No. (DGE1144152) and NRSA (F31 DC014602) from the NIDCD. Microscopy on fixed tissue 23
samples was performed at the Harvard Center for Biological Imaging. We thank Nuné Martiros, Nao 24
Uchida and Kenneth Blum for critical feedback that significantly improved the manuscript. 25

2
Abstract 26
27
Rodents can successfully learn multiple, novel stimulus-response associations after only a few 28
repetitions when the contingencies predict reward. The circuits modified during such reinforcement 29
learning to support decision making are not known, but the olfactory tubercle (OT) and posterior 30
piriform cortex (pPC) are candidates for decoding reward category from olfactory sensory input and 31
relaying this information to cognitive and motor areas. Through single-cell recordings in behaving male 32
and female C57BL/6 mice, we show here that an explicit representation for reward category emerges 33
in the OT within minutes of learning a novel odor-reward association, whereas the pPC lacks an 34
explicit representation even after weeks of overtraining. The explicit reward category representation in 35
OT is visible in the first sniff (50-100ms) of an odor on each trial, and precedes the motor action. 36
Together, these results suggest that coding of stimulus information required for reward prediction does 37
not occur within olfactory cortex, but rather in circuits involving the olfactory striatum. 38
39
Significance Statement 40
41
Rodents are olfactory specialists and can use odors to learn contingencies quickly and well. We have 42
found that mice can readily learn to place multiple odors into rewarded and unrewarded categories. 43
Once they have learned the rule, they can do such categorization in a matter of minutes (less than 10 44
trials). We found that neural activity in olfactory cortex largely reflects sensory coding, with very little 45
explicit information about categories. By contrast, neural activity in a brain region in the ventral 46
striatum is rapidly modified in a matter of minutes to reflect reward category. Our experiments set up a 47
paradigm for studying rapid sensorimotor reinforcement in a circuit that is right at the interface of 48
sensory input and reward areas. 49
50
51
52

3
53
Introduction 54
55
Reinforcement learning can quickly improve decision making by discovering and emphasizing features 56
of the environment (e.g. sensory inputs) and actions of the animal (e.g. motor outputs) that correlate 57
with positive or negative outcomes (Sutton and Barto, 1998; Dayan and Niv, 2008). Rodents can 58
successfully learn to associate odor cues with motor responses following only a few repetitions of trial-59
and-error per odor when the correct response is reinforced by reward (Slotnick et al., 2000; Slotnick, 60
2001). The resulting decision process can be highly odor-specific: mice can accurately determine the 61
presence or absence of a single rewarded odor hidden within previously unexperienced mixtures of 62
more than a dozen distractors with similar molecular features as the target rewarded odor (Rokni et 63
al., 2014). 64
65
Odor information is first collated in the olfactory bulb (OB), and converges on multiple higher order 66
brain regions, including the posterior piriform cortex (pPC) and the olfactory tubercle (OT) (Ikemoto, 67
2007; Wesson and Wilson, 2011; Giessel and Datta, 2014; Yamaguchi, 2017; Zhang et al., 2017b). 68
pPC is an association cortex, with projections to multiple cognitive brain regions, including orbitofrontal 69
cortex, amygdala, medial temporal lobe (Johnson et al., 2000; Diodato et al., 2016). OT is located in 70
the ventral striatum (Heimer et al., 1982; Ikemoto, 2007) and is specialized for olfaction, with a well-71
defined cell body layer that receives input directly from OB and olfactory cortical areas (Wesson and 72
Wilson, 2011; Zhang et al., 2017b). The OT is a heterogeneous structure, with different types of 73
neurons, pallidal and striatal subregions, and mesoscopic structures such the islands of Calleja 74
(Heimer et al., 1982; Wesson and Wilson, 2011; Giessel and Datta, 2014). In turn, OT is by far the 75
largest source of olfactory input to the ventral tegmental area (VTA) (Watabe-Uchida et al., 2012), 76
suggesting a prominent role in reward-related behaviors since midbrain dopaminergic neurons convey 77
reinforcement signals needed for learning (Schultz et al., 1997; Cohen et al., 2012). However, the 78
precise contributions of distinct OT neuron types and subregions to projections to the VTA remains to 79

4
be fully resolved (Heimer et al., 1987; Watabe-Uchida et al., 2012). 80
81
Physiological evidence suggests that an important transformation in odor coding occurs in pPC and 82
OT during sensorimotor decision making. Activity of single-neurons that correlate with choice and 83
reward has been observed in both pPC and OT (Calu et al., 2007; Gadziola et al., 2015; Gadziola and 84
Wesson, 2016). The anterior piriform cortex, which immediately precedes pPC and OT in the 85
anatomical hierarchy of olfactory regions, does not have choice activity in the first sniff of an odor 86
stimulus (Miura et al., 2012), when decision making occurs (Uchida and Mainen, 2003; Abraham et al., 87
2004; Rinberg et al., 2006), although subsequent activity can reflect the decision (Gire et al., 2013). 88
Single-neuron reward-selectivity for single odors emerges prior to the motor response at the level of 89
OT neurons (Gadziola et al., 2015), however it is not known whether this is the case for pPC as well. If 90
reward-selectivity is computed in pPC during decision making, OT could inherit this selectivity. 91
Alternatively, heavy interconnection with the reward system provides the OT with the necessary 92
reinforcement signals and plasticity-inducing dopamine for learning arbitrary odor-reward associations 93
(Gadziola et al., 2015; Wieland et al., 2015). Indeed, responses of neurons to visual stimuli in dorsal 94
striatum strongly reflect a newly learned reward association with a few trials of successful learning 95
(Schultz et al., 2003; Pasupathy and Miller, 2005), so the olfactory striatum could function similarly to 96
learn odor-outcome associations. 97
98
We developed a novel odor-reward categorization task in order to investigate the contributions of pPC 99
and OT to odor-driven sensorimotor learning and decision making. We recorded the activity of single 100
neurons in pPC and OT as mice learned, through trial-and-error, the reward valence assigned to a 101
panel of previously unexperienced odor stimuli. We also measured sniffing in order to focus on the 102
earliest components of sensory processing and decision making during the first sniff of odor cues. 103
Mice reliably learned odor-reward contingencies within a single session, permitting the evolution of 104
neural activity to be monitored throughout the learning process. We observed that reward selectivity 105
was easily found in OT, multiplexed with odor selectivity, whereas explicit reward selectivity was 106

5
largely absent in pPC. Together, these results support a striatal, rather than cortical, model of rodent 107
olfactory sensorimotor learning. 108
109
Methods 110
111
Animals (general). All experimental animals of either sex were C57BL/6 mice obtained from the 112
Charles River Laboratories, aged two to four months at the start of the experiments. Following surgical 113
implantation of a tetrode drive and a custom head plate, all mice we rehoused individually. 114
Experiments were conducted in accordance with Harvard University Animal Care Guidelines. 115
116
Surgery. Surgeries were performed on naive animals and all behavioral training began after recovery 117
from surgery. Mice were anesthetized with an IP injection of a mixture of Xylazine (10 mg/kg) and 118
Ketamine (80 mg/kg). To access sniffing information, airflow was measured through a cannula 119
implanted in the nasal canal. A craniotomy (~1mm) was made over the nasal canal (2mm anterior of 120
nasal/frontal fissure, 1 mm lateral) on the skull, with a goal of implanting a nasal cannula to monitor 121
sniffing during behavioral and physiological experiments. An 18 gauge stainless steel cannula (~5mm 122
in length) was inserted into the craniotomy. To affix the cannula to the skull, superglue was used for 123
initial placement followed by two applications of dental cement to ensure stability of the cannula. 124
Additionally, a craniotomy (~1mm) was made over the dorsal skull at a location directly above the 125
areas targeted for electrophysiological recordings with the goal of implanting a tetrode bundle (6 126
tetrodes plus a 200um-diameter optic fiber to ensure stability). The target locations were: pPC 127
(coordinates: 0.5mm posterior, 3.8mm lateral from bregma, and 3.8mm ventral from brain surface) and 128
OT (coordinates: 1.2mm anterior, 1.5-2mm lateral from bregma, and 4.6mm ventral from brain 129
surface). To ensure stability of the animal’s head during behavior and recording at a later stage, a 130
custom-made head plate (made of light-weight titanium, dimensions of 30 x 10 x 1 mm and weight of 131
0.8 g) was affixed to the skull. A shallow well was drilled over the posterior lateral skull and a single 132
skull screw was affixed at that location. A wire was attached to this skull for grounding 133

6
electrophysiological recordings. At the end of the surgery, a removable plastic cap was placed on the 134
top of the nasal cannula to prevent foreign objects from entering the cannula. In addition, a plastic 135
cone was positioned around the tetrode drive, and capped with a removable lid, to prevent damage to 136
the drive. The nasal cannula and tetrode drive were implanted during the same surgery, but always on 137
opposite (i.e. contralateral) sides. Each lateral olfactory tract delivers sensory input from a single 138
olfactory bulb to the ipsilateral pPC and OT. Implanting the nasal cannula and tetrode drive on 139
opposite sides was intended to avoid altering the natural airflow to the relevant sensory neurons for 140
our recordings. Following the completion of the surgery, mice were given one week to recover. 141
142
Odor stimulus delivery. A custom-made 16-odor olfactometer was used to deliver stimuli during 143
behavioral tasks. The olfactometer had a carrier stream of air calibrated to flow at 1 liter per minute. A 144
single odor at a time could be added onto this carrier stream by opening an odor-specific valve to 145
permit airflow (at 0.1 liters per minute) from an input manifold, through a tube containing liquid-phase 146
odorant, and finally into the carrier stream. One-way check valves prevented flow of odor from 147
odorant-containing tubes into the carrier stream or back into the input manifold when air was not 148
actively being flowed. Odor delivery to the animal was gated by a single (“final”) valve that directed 149
odor to the animal or, between odor presentations, to an exhaust system. Note that this single valve 150
was common to all odors and thus was not informative about odor identity. When odor was not flowed 151
to the animal, a stream of clean air of the same flow-rate was directed to the animal. This ensured 152
active clearing of odors between trials. In addition, an exhaust system cleared odors from the behavior 153
chamber. To ensure immediate delivery of odors, and comparable odor concentration from trial-to-trial, 154
the line to the final valve was primed with odor from the current trial beginning at the end of the 155
previous trial (i.e. minimum of 5 seconds, sufficient to replace the line volume 3-5 times). Sound from 156
the switching of an odor-specific valve to perform selection of an odor for the upcoming trial was 157
masked by a substantially louder non-odor-specific valve turned on simultaneously. The valves 158
corresponding to each odor were randomly switched occasionally between sessions to prevent 159
animals from learning sound, rather than odor, cues. Finally, all tubing that was odor-specific was 160

7
replaced at the same time as new odors were added to the olfactometer in order to prevent odor from 161
previous sessions lingering and being used as cues for task performance. 162
163
Behavioral task. When animals fully recovered from surgery (approximately 7 days), they were placed 164
on a water deprivation schedule for behavioral conditioning. Animals were first acclimated to head 165
restraint (with their implanted head plate held in place) on the behavior rig over the course of 3-5 days. 166
Then, animals were trained to lick for water from a spout positioned 2-3 millimeters from the mouth 167
until satiated (typically 1-1.5mL); licking this spout (or not licking) would subsequently serve as the 168
response for all behavioral tasks (go/no-go). Lick training took approximately 2-4 additional days. 169
Next, odors were presented for one second with a varying (3 seconds minimum plus an exponential 170
distribution with mean of 5 additional seconds) inter-stimulus interval, and reward was only available 171
for a subset (half) of these odors. At first, only two odors (one rewarded, one unrewarded) were 172
presented in order to expedite learning. The number of odors was increased to four and then eight (i.e. 173
full task odor panel). Initially, water reward would be available immediately upon licking during odor 174
presentation. Gradually, the delay between lick/odor presentation and reward delivery was increased 175
until reward delivery occurred at least 500 milliseconds after the conclusion of odor presentation. To 176
discourage a high false alarm rate, a hit was only scored on trials that the mouse licked in at least 177
three out of four 350ms bins, beginning at the time of odor onset. It follows that mice were required to 178
make a decision before the end of the second bin, 700ms into the odor presentation, but this did not 179
seem to force early inaccurate decisions. 180
181
Neural recordings began once the animals reach strong performance (>90%correct) on the full eight-182
odor panel. No odors were replaced during this initial period in order to facilitate the acquisition of task 183
structure. In the final stage of experiments, a subset of odors was replaced between some sessions in 184
order to study learning of novel odor-reward associations. 185
186
Respiration monitoring. Respiration was recorded through a nasal cannula implanted during surgery. 187

8
Following surgery, the nasal cannula was cleaned daily to prevent clogging. In this way, nasal 188
cannulae typically stayed clear continuously for months of recordings. During experiments, a plastic 189
tube connected to a pressure sensor was fitted over the nasal cannula to form a continuous pressure 190
environment. Pressure signals were amplified 10X, bandpass filtered 0.1-100Hz, and recorded at 191
1000 samples per second. For analysis, the start of each inhalation was identified as negative-going 192
zero crossings in the pressure signal. Likewise, the end of each inhalation (i.e. start of exhalation) was 193
identified as a subsequent positive-going zero crossing in the pressure signal. 194
195
Electrophysiology. Neural activity was recorded with drives containing six tetrodes (Gray et al., 1995). 196
The tip of each wire was gold-plated until the impedance was 250-450 kOhms. Electrophysiological 197
signals were acquired and amplified with a custom-made system built on two 16-channel analog chips 198
designed by Intan Technologies. Each channel was digitized, sampled at 20kHz, and bandpass filtered 199
with a 2nd-order Butterworth filter 500-3000Hz. Potential spike events were detected as any activity 200
that crossed 3.7 standard deviations of noise (corresponding to 1:10,000 events by chance). Potential 201
spike events were then manually clustered with MClust software (David Redish) to identify single-unit 202
activity. The quality of clustering was ensured by requiring less than 1 in 1000 spikes to have occurred 203
within a 2 ms refractory period of one another, clear overlap of single spike waveforms, and L-distance 204
below 0.05. To minimize selection bias, all spikes that were visible during each session were recorded, 205
sorted and analyzed. At the end of the recording session each day, the entire bundle of tetrodes was 206
lowered 40um to obtain a new set of neurons for the subsequent day. Following the completion of all 207
behavior and recordings, tetrode placement was confirmed with an electrolytic lesion and postmortem 208
histology. Reconstruction was attempted on all mice, but the electrolytic lesion location was only 209
identifiable in 5/6 pPC and 5/8 OT mice. We note that tetrodes were implanted with stereotactic 210
technique to the same coordinates for each brain region across all animals, and anticipate the 211
remaining locations to also be on target (although we cannot be sure). 212
213
AuROC analysis. To characterize the responses of neurons to odors, we used the metric of area under 214

9
the receiver-operating characteristic curve (auROC) for each cell-odor pair relative to baseline (i.e. 215
pre-stimulus) firing rate. The auROC gives a measure of how well the firing rate at any given time can 216
be discriminated from the baseline firing rate for that cell, independent of the absolute firing rates. 217
Briefly, the value of the auROC for a given time bin indicates the percentile of that time bin in the 218
distribution of baseline firing rates for bins of the same width. Therefore, a firing rate that is exactly the 219
median of the baseline firing rate distribution would have an auROC of 0.5. Excitatory responses 220
(yellow) correspond to an auROC greater than 0.5 but less than or equal to one, whereas inhibitory 221
responses (blue) correspond to an auROC less than 0.5 but greater than or equal to zero. For analysis 222
as well as data visualization, the auROC provides a more consistent measure to compare across 223
neurons than absolute firing rate. 224
225
Decoding. Decoding analysis (both identity and reward category) was done with Support Vector 226
Machines (SVMs) with a linear kernel, using the standard 80% training, 10% validation and 10% test. 227
Random shuffles from the entire population of neurons in a given region allowed many combinations, 228
and therefore error estimates for decoding accuracy. Responses were obtained in a standard window 229
of 200ms from onset of odor and first sniff inhalation (except in Figure 4A, where this window was 230
systematically varied). Shuffle controls for decoding reward category were obtained by scrambling the 231
valence assignment across the odors. 232
233
Experimental Design and Statistical Analysis. Nonparametric Wilcoxon signed rank tests were 234
calculated using the signrank function in MATLAB. Data are available on request. 235
236
Results 237
238
Mice quickly learn to categorize rewarded and unrewarded odors 239
We trained head-restrained mice to decide, based on the identity of an odor stimulus, whether to 240
respond (Go) or not respond (No-Go) by licking a water port (Figure 1A; see Methods). A panel of 241

10
eight odors (four rewarded and four unrewarded) was presented on randomly interleaved trials during 242
each experimental session. This panel size enabled us to characterize the sparseness of odor tuning 243
while yielding 20-30 repetitions per odor to accurately measure behavioral and neural responses to 244
the odor. 245
246
Mice acquired the task structure and reached a high level of performance (>90% correct trials) within 247
three to four sessions from the start of training with odors (one session per day, consecutive days; 248
Figure 1B-D; 14 mice). Among correct behavioral responses, the fraction of go responses on rewarded 249
odor trials (i.e. hit rate) started higher and peaked earlier than the fraction of no-go responses on 250
unrewarded odor trials (i.e. correct rejection rate), reflecting an initial behavioral bias towards licking. 251
Upon further training, mice consistently began licking within 200-400ms of odor onset (Figure 1C) for 252
rewarded odors and maintained licking until reward delivery but did not even initiate licking on most 253
unrewarded odor trials (Figure 1C), indicating that the animals became confident of the reward 254
association early during odor presentation. In a typical session, mice worked for about 300-500 trials 255
and collected 150-250 water rewards before they were satiated. 256
257
Naive mice were initially trained on the task with the same panel of eight odors each day (one session 258
per day) until they achieved successful performance (>90% correct) for two consecutive sessions. 259
Following successful learning of the task structure, we replaced a subset of the odors with novel odors 260
to study learning of odor-reward associations which were typically learned to near-saturating (>90% 261
correct) performance within one or two subsequent sessions. This process was repeated in daily 262
sessions that continued for one to two months in the same mouse. Thus, the rapid learning of novel 263
odor-reward associations permitted the observation of behavior and physiology during the acquisition 264
of many odor-reward pairs. We first present analysis from sessions with odor-reward pairs in which 265
successful learning had already been demonstrated through saturated high behavioral performance in 266
a previous session (“familiar odors”) to characterize odor and reward tuning properties in pPC and OT. 267
Subsequently, we describe the changes in behavioral and neuronal responses during the sessions in 268

11
which novel odor-reward pairs were introduced and learning took place (“novel odors”). 269
270
Since neural responses to odors are aligned to respiration (Cury and Uchida, 2010; Shusterman et al., 271
2011), and behaving rodents can alter the rate of sniffing significantly (Welker, 1964; Kepecs et al., 272
2007; Wesson et al., 2008), we monitored respiration with a cannula implanted over the nasal cavity, 273
contralateral to the side where tetrode recordings were performed (Figure 1E). Once familiar with the 274
task structure, mice timed their sniff to the onset of the odor cue, but the average number of sniffs in 275
the 1 second odor period was unaltered (3.8 ± 0.52 s-1 vs. 3.9 ± 0.45 s-1). The distribution of sniff times 276
during odor presentation are shown in Figure 1F. 277
278
Task-related activity in pPC and OT 279
We used multi-tetrode drives (Gray et al., 1995) to isolate and record single units in either pPC (n=6 280
mice; 385 isolated units) or OT (n=8 mice; 270 isolated units). Following the completion of all behavior 281
and recordings, tetrode placement was confirmed with an electrolytic lesion and postmortem histology 282
(Figure 2A). Baseline firing rates were different in the two areas (Figure 2B,C), with pPC neurons 283
having significantly lower firing rates than OT neurons (pPC: median = 0.64 Hz, range = 0 – 43.33 Hz, 284
n = 372 units; OT: median = 9.02 Hz, range = 0 – 107.02 Hz, n = 270 units; rank sum = 85,888; p = 285
2.12x10-64, Wilcoxon Rank Sum). 286
287
Peri-stimulus time histograms (PSTHs) are shown for representative pPC and OT cells in Figure 2D,E. 288
Since inhalation of odors is necessary to evoke sensory responses, all of the remaining analyses were 289
performed using the time of the first sniff as the start time for each trial. Example spike rasters show 290
neuron activity before and after aligning to the first sniff. Example odor responses from a neuron in 291
pPC (Figure 2D) highlights the lower baseline firing rate and sparser responses. More sustained 292
responses can also be found (e.g. see Figure 3C,D). 293
294
Trial-to-trial variability in firing rate changes in response to odors was different in the two brain regions. 295

12
The coefficient of variation was generally higher in pPC (rewarded: median = 2.01, range = 0.54 – 296
10.76; unrewarded: median = 2.14, range = 0.45 – 31.61) than in OT (rewarded: median = 1.11, range 297
= 0.26 – 13.50; unrewarded: median = 1.26, range = 0.32 – 9.09) (Figure 3A). We characterized odor 298
selectivity in the recorded neurons using the lifetime sparseness measure (Willmore and Tolhurst, 299
2001), which does not require thresholding or other selection criteria for determining response 300
significance. Neurons in both regions spanned a wide range of selectivity but neurons in OT had a 301
lower selectivity than those in pPC (pPC: median = 0.45, range = 0.07 – 0.99; OT: median = 0.24, 302
range = 0.00 – 0.67; rank sum = 3,570; p = 2.65x10⁻⁷, Wilcoxon Rank Sum; Figure 3B). These data 303
indicate that pPC neurons have lower baseline firing rates, more variable and more selective 304
responses to odors than neurons in OT. 305
306
Reward-related activity at the single neuron level 307
To characterize the responses of neurons to odors more objectively, we used the metric of area under 308
the receiver-operating characteristic curve (auROC) for each cell-odor pair relative to baseline (i.e. 309
pre-stimulus) firing rate ((Green and Swets, 1966); see Methods). We show the responses for all 310
significant cell-odor pairs (at least one 100ms bin different from baseline at a significance level of p < 311
0.01) in both areas with rewarded and unrewarded odors plotted separately (Figure 3C,D). With this 312
criterion, 69 units in pPC and 177 units in OT responded to at least one odor. This significance 313
measure was used only for visualization and initial characterization, and further analysis (such as 314
decoding) used all recorded neurons. 315
316
Odor responses in pPC were predominantly excitatory (Figure 3C). Many cells continued to respond 317
for the duration of the one second odor presentation, seen as a sustained band of yellow (Figure 3C). 318
Other cells had a strong transient (100-200ms) response well aligned to the first inhalation of an odor, 319
but did not respond for the remainder of the odor presentation despite continued sniffing (Figure 3C). 320
Interestingly, the cells that were inhibited appear to be inhibited by all odors non-selectively, 321
corroborating previous findings (Otazu et al., 2015; Bolding and Franks, 2017). Low baseline firing 322

13
rates made it difficult to detect odor-selective inhibition, if it were present, and suggest that these 323
neurons did not directly contribute to odor discrimination. 324
325
A substantial portion of OT neurons were inhibited during odor presentation, often following a brief 326
period of excitation (Figure 3D). Transient excitatory responses at the beginning of odor presentation 327
were much more prevalent in the OT (Figure 3D). 328
329
We characterized reward coding in the pPC and OT, first focusing on familiar odors (i.e. odors that the 330
mouse successfully learned in a previous session). Responses lasting longer than 500ms were more 331
common in OT for rewarded odors than unrewarded odors (Figure 3D). In contrast, the overall 332
distribution of response profiles did not differ between rewarded and unrewarded odors for the 333
population-averaged response across all pPC neurons (Figure 3E). This difference is visible in the 334
global average responses for rewarded vs. unrewarded odors for both areas, with the population-335
averaged response of OT neurons (but not pPC neurons) showing divergent responses starting 336
around 300 ms after onset of the first sniff (Figure 3E). This late divergence between average 337
rewarded and unrewarded auROCs for OT cannot account for the mouse’s decision, which is made 338
sooner (see below). The overlap of population-averaged peri-stimulus time histograms (PSTHs) to 339
rewarded and unrewarded odors overlapped in both pPC and OT suggests that a naïve readout of 340
average spiking activity from either population is an ineffective strategy for decoding reward value. 341
342
We then examined the extent to which reward information was explicitly available in the firing rate of 343
individual neurons. Firing rates of individual neurons in each area suggested that individual OT 344
neurons may be more discriminating between rewarded and unrewarded odors than pPC neurons 345
(Figure 4A,B). An auROC analysis comparing responses to all rewarded odors versus responses to 346
all unrewarded odors revealed that reward selectivity was substantially more prevalent in OT than pPC 347
both during and after odor presentation (Figure 4C,D). Furthermore, roughly equal numbers of OT 348
cells responded with higher firing rates for rewarded odors than unrewarded odors (yellow in Figure 349

14
4D) versus higher firing rates for unrewarded odors than rewarded odors (blue in Figure 4D). 350
351
We then asked whether reward selectivity emerged at times corresponding to particular task events, 352
such as stimulus onset or reward delivery. In order to measure the significance of reward selectivity, 353
we compared the auROC at times after odor onset against the distribution of auROCs during pre-354
stimulus time. Consistent with a lack of actual reward selectivity for pPC cells, the times at which the 355
reward auROC first reached a very liberal threshold of significance (p < 0.01, 35 comparisons per cell 356
for the 100ms time bins spanning the 3.5s window; family-wise type 1 error rate = 0.296) were 357
scattered throughout the trial and not well-aligned to any task events (Figure 4E: orange). In contrast, 358
reward selectivity emerged in 46% of OT cells within the first 300ms of odor sampling (Figure 4E: 359
blue). The absence of any subsequent peaks indicates that there was not a separate population of OT 360
neurons that responded only to later task events, such as reward delivery. The majority of these 361
selective responses emerged before the mouse began to lick on rewarded odor trials (Figure 4F). In 362
order to focus on pre-decision neural activity, all of the following analyses use a 200ms response 363
window beginning at the start of the first inhalation following odor onset. 364
365
Multiplexing of odor and reward codes in OT at the single neuron level 366
To visualize the relationship between odor and reward selectivity in single neurons, we created a bar 367
code for each neuron that separates responses to each of the eight individual odors but also 368
distinguishes odors based on their reward valence (Figure 5A). The position of each odor in the bar 369
code corresponds to the rank-order of the trial-averaged response during the first 200ms window, from 370
most positive on the left to most negative on the right. The color of each segment corresponds to the 371
valence of the odor (red=rewarded; black=unrewarded) and the intensity of the color corresponds to 372
the odor-evoked response magnitude (i.e. absolute value of spike rate during odor sampling minus 373
baseline) normalized per neuron to the strongest response among the eight odors. The combined 374
barcodes in pPC illustrates that neurons have sparse selectivity for odors that limits the ability of 375
individual neurons to discriminate valence. In OT, neurons respond much more densely to odors with 376

15
the trial-averaged odor responses of 30/81 neurons perfectly discriminating valence (far exceeding 377
chance under a binomial model equal to 1 perfect discriminator out of every 35 neurons) and the 378
majority of OT neurons partially, but not entirely, discriminating valence (Figure 5B). 379
380
The auROC metric for reward selectivity is susceptible to overestimating reward selectivity for cells 381
that respond to only a few odors that happen to be assigned the same reward valence by chance. 382
Indeed, neurons with greater odor selectivity did tend to show greater reward selectivity as measured 383
by auROC, and pPC had more of these odor selective neurons than OT leading to higher apparent 384
reward selectivity in pPC (Figure 5C). To control for odor selectivity, we compared the observed 385
reward selectivity of each cell to a null distribution of 10,000 auROCs generated by sampling, with 386
replacement, responses to eight odors and randomly assigning 4 rewarded labels and 4 unrewarded 387
labels regardless of the actual experimental reward value. This control revealed that pPC cells did not 388
have reward selectivity above chance whereas OT cells did despite lower overall auROC values 389
(Figure 5D; pPC: 4.74%, OT: 48.18% at p<0.05 significance threshold). Therefore, reward selectivity 390
was detectable at the single neuron level in OT but not pPC. 391
392
We then performed a complementary analysis to test whether single neurons in pPC or OT exhibited 393
odor selectivity independent of reward selectivity. In this case, we calculated eight auROCs for each 394
neuron, each auROC comparing one odor against the other three with the same reward valence. We 395
generated two null distributions of 10,000 auROCs for each neuron, one for rewarded odors and one 396
for unrewarded odors, by sampling, with replacement, from the pool of trial responses to odors of the 397
same reward valence; only trials with correct behavioral reports were included in order to control for 398
behavioral variation across odors. Response selectivity for at least one out of eight odors was 399
detectable in a substantial portion of pPC and OT neurons (pPC: 44.74%, OT: 46.36% at p<0.05 400
significance threshold with Bonferroni-correction for eight comparisons). 401
402
Together, these statistically-validated selectivity metrics allowed us to determine whether odor identity 403

16
and reward valence were conveyed by overlapping or distinct sets of OT neurons. The fraction of OT 404
neurons exhibiting both reward and odor selectivity was substantial and indistinguishable from the 405
expectation for statistically-independent (not mutually-exclusive) reward- and odor- selective neuronal 406
populations (OT: 22.73% selective for both odor and reward versus 22.34% expected for statistical 407
independence; pPC: 0.00% selective for both odor and reward versus 2.12% expected for statistical 408
independence). This analysis indicated that single neurons in OT carry information about odor identity 409
multiplexed with reward information. 410
411
Reward coding at the population level 412
Collectively, many individual cells with weak reward valence selectivity could still give rise to reliable 413
valence selectivity at the population level. To determine whether our pPC and OT datasets had this 414
property, we attempted to decode the valence of odors from single trial responses of cells in each area 415
using a support vector machine with a linear kernel (Hastie et al., 2009). For each cell, the trials during 416
the session it was recorded were randomly assigned to training (80%), validation (10%), and test 417
(10%) sets. 418
419
To empirically determine an appropriate time window to analyze, we decoded reward valence from OT 420
activity for a series of windows beginning at the first inhalation of the stimulus; specifically, we used 421
the average firing rate response (i.e. baseline subtracted) for each cell within the window. Decoding 422
performance improved with progressively longer time windows until saturation at ~200ms (Figure 6A). 423
Accordingly, all subsequent decoding analyses were performed using the average firing rate response 424
within a 200ms window beginning at the first sniff of the odor. 425
426
To directly test for an explicit population code for reward valence, we trained linear classifiers (SVMs) 427
to decode reward from the responses to a set of four odors (2 rewarded, 2 unrewarded), then tested 428
the ability of the same classifier to decode reward from the responses to the other set of four odors 429
presented in the same session (Figure 6B). Overall, we found that classifiers trained on OT data 430

17
successfully decoded reward from responses to odors that the classifiers did not see during training. 431
On the other hand, classifiers trained on pPC data did not have this property. Importantly, these results 432
were consistent across individual mice (OT: n=5 mice, pPC: n=3 mice) and odor sets for which 433
populations of at least 5 cells were available (Figure 6B; Methods) 434
435
A single neuron could respond similarly to two odors with the same valence, because the response is 436
valence-specific or strictly due to similar purely sensory-driven responses evoked by the two odors. In 437
turn, the activity of a population of neurons might also falsely appear to discriminate rewarded versus 438
unrewarded odors due to chance (i.e. the presence of sensory but not reward information) when 439
probing with a small number of odors. If population activity explicitly codes for reward valence beyond 440
sensory tuning alone, however, a single classifier should be able to decode the reward valence for 441
increasingly larger number of odors without performance declining because the reward information 442
persists despite the presence of extraneous stimulus-specific information. Therefore, we tested the 443
ability of a decoder to classify reward valence from progressively larger number of odors (e.g. 1 444
rewarded odor versus 1 unrewarded odor, 2 rewarded odors versus 2 unrewarded odors, etc.). To 445
minimize the contribution of stimulus tuning for any single odor to the overall ability to successfully 446
categorize rewarded versus unrewarded odors, we leveraged the fact that the data collected from 447
each mouse comprised many odor-reward associations, aggregated from individual sessions with 8 448
odors each. We therefore trained and tested the classifiers on this pooled dataset with balanced 449
numbers of rewarded and unrewarded odors (14 mice; minimum of 5 sessions per mouse). 450
Importantly, the size of the training set (i.e. number of single-trial responses) was held constant 451
regardless of the number of odors used. 452
453
In this test, the decoder successfully classified pPC responses to two odors (one rewarded and one 454
unrewarded), but performance declined rapidly when challenged to decode valence from responses to 455
larger numbers of odors suggesting that pPC odor responses conveyed little to no linearly-decodable 456
information about valence (Figure 6C). As a control, we compared this result to the decoding 457

18
performance achieved by a classifier that was trained and tested on the same dataset after shuffling 458
the valence labels of the odors. This shuffling procedure would remove any potential explicit reward 459
information and force the decoder to rely on stimulus-tuning alone for classification. Decoding 460
performance on valence-shuffled pPC data followed the same trend as the unshuffled pPC data 461
(Figure 6E), again suggesting the absence of an explicit code for reward in pPC. In contrast, decoder 462
performance for the OT data did not decrease substantially as the number of odors increased (Figure 463
6D), but did decrease for valence-shuffled OT data, confirming that valence-specific information was 464
lost in the shuffling process (Figure 6F). We also limited the decoding analysis to cells with lifetime 465
sparseness between 0.3 and 0.6, which was the range in which pPC and OT most overlapped (Figure 466
5C). We then decoded reward for 2, 4, 6, and 8 odors, and found that OT still performed better than 467
pPC even when lifetime sparseness in the two areas was matched in this way (Figure 6G). As 468
controls, we compared reward decoding performance for 8 odors in OT and pPC for the same data, 469
but with the reward labels shuffled (Figure 6H). While the shuffled data fare very similar to real data for 470
pPC, they are much worse for OT, again confirming that OT neurons have explicit representation of 471
reward category, even after normalizing for response sparsity. 472
473
These results clearly indicate that the reward category of odors could be explicitly read out from small 474
groups of OT neurons, but not from pPC neurons. 475
476
Novel odor learning 477
Next, we investigated the evolution of reward coding during the process of learning novel odor-reward 478
associations, which we were able to do within recording sessions. Approximately every other session 479
following successful learning of the task structure (total of 71 sessions), four of the eight odors that 480
had been used in previous sessions were replaced with four novel odors (two rewarded and two 481
unrewarded) (Figure 7A). Mice were not exposed to the odors prior to training and reward valence was 482
randomly assigned to each odor for every mouse. 483
484

19
We found that across different mice and different novel odors (8 mice, 71 sessions) rapid learning 485
occurs in the very first session, with additional improvement in performance over the next two 486
sessions (Figure 7B). Correct go responses to rewarded odors become frequent earlier than correct 487
no-go responses to unrewarded odors (Figure 7C,D), consistent with a previously observed behavioral 488
bias toward go responses (Figure 1B). High accuracy is maintained in these sessions for the already 489
familiar odors. 490
491
We recorded activity of OT neurons during novel odor learning, with four familiar and four unfamiliar 492
odors presented in randomly interleaved trials (Figure 8A). We asked whether the activity of individual 493
neurons changed during the course of the session by examining the difference in firing rate for the first 494
and last 10 trials of an odor. For each OT cell recorded during learning, we calculated the change in 495
response to each novel odor normalized to the mean and standard deviation of the cell's responses to 496
the four familiar odors used in the same session. Across the population of neurons, we found that the 497
distribution of these normalized response changes for rewarded novel odors (mean change of 0.22 ± 498
0.13 spikes/s, n = 69 cells) was significantly different (p = 0.02, comparison of distributions with a 499
Kolmogorov-Smirnoff test) from the distribution for unrewarded novel odors (mean change of – 0.22 ± 500
0.14 spikes/s, n = 61 cells, Figure 8B). 501
502
To determine whether odor-reward associations were reflected in the activity of populations of OT 503
neurons during learning, we leveraged the fact that only four of the odors were novel in learning 504
sessions and the other four odors were familiar (i.e. learned in a previous session). We therefore 505
compared the evolution of reward selectivity of novel odors using the familiar odors as a reference 506
point (Figure 8C, inset). To this end, we trained a linear decoder to classify single-trial responses 507
(mean firing rate response in first 200ms of odor sampling) to familiar rewarded versus unrewarded 508
odors, then tested the performance on novel rewarded and unrewarded odors. First, we quantified the 509
density of reward valence coding in OT by determining the minimum population size for which this 510
training procedure resulted in decoding accuracy that approximated the average behavioral 511

20
performance of a well-trained mouse (~90%) on familiar odors alone – this size was 20 cells (Figure 512
6D). The average performance of 100 classifiers each trained on a random group of 20 cells out of the 513
73 recorded during single-session learning is shown in Figure 8C. Indeed, there is a highly significant 514
(p<10-6) increase in decoder performance as a function of the presentation number (i.e. trials with the 515
same odor), starting near chance performance at the beginning of the session and reaching 516
comparable performance to familiar odors (>90%) by the end of the very first session with the novel 517
odors. Remarkably, the time course of the improvement in decoding closely tracks the performance of 518
mice in discovering the valence of the novel odors (Figure 8C). Overall, these results establish that 519
reward selectivity in the OT develops in parallel with learning at the behavioral level. 520
521
Relating neural activity and behavior 522
If the activity in OT is used to drive behavior, we would expect a stronger relationship between coding 523
and behavior (i.e. “Consistency”) (Majaj et al., 2015) in OT than other candidate areas, such as pPC. 524
Indeed, the relationship between the decoding accuracy for individual odors and behavioral 525
performance of the mouse for the corresponding odors was closer to statistical significance in OT than 526
pPC (r = 0.40 in OT, p = 0.05; r = 0.19 in pPC, p > 0.2; Figure 9A,B). 527
528
Finally, we sought to rule out the possibility that OT responses were more closely related to the motor 529
decision than the expected reward valence. The go/no-go task structure ties reward valence to motor 530
decision (i.e. go=rewarded, no-go=unrewarded), so we examined OT responses on error trials in order 531
to dissociate these variables. Due to the asymmetry in hit rate versus correct rejection rate in our task, 532
there were too few misses to be used for this analysis; instead, we focused on false alarm trials. We 533
quantified the reward valence coding by calculating the auROC of OT neuron responses across hit 534
versus false alarm trials for which the motor decision was the same but the valence differed (“reward 535
auROC”). Likewise, we quantified the motor decision coding by calculating the auROC of OT 536
responses across correct rejection versus false alarm trials (“motor auROC”), for which the expected 537
reward valence was the same but the motor decision differed. Importantly, we never included 538

21
responses from the same odor among both the false alarm trials and correct rejection trials when 539
calculating the motor auROC. This ensured that we did not artificially decrease the motor auROC by 540
forcing the discrimination of an odor from itself, relative to the reward auROC in which the odors on hit 541
versus false alarm trials were always different, by construction. If motor decision was the main driver 542
of selective responses in OT neurons, the motor auROC should be greater than the reward auROC, 543
but we did not find this relationship (Figure 9C; Wilcoxon Rank Sum Test: p=0.269, n=45 neurons, 544
ranksum=2185). This result indicates that the observed reward tuning is not primarily driven by a 545
difference in motor behavior. 546
547
Discussion 548
549
In this work, we developed an odor-reward categorization task in which mice could flexibly acquire 550
novel odor-reward associations within a single session. We recorded neural activity in behaving 551
animals and discovered that activity in pPC largely reflects sensory coding, with very little explicit 552
information about categories. By contrast, the OT acquires a representation of reward category 553
rapidly in a matter of minutes and this information is expressed within 100 ms of odor sampling (well 554
before motor action). Moreover, reward selectivity and successful behavioral performance developed 555
in parallel as novel odor-reward associations were learned. These results provide important 556
constraints on how odors are processed in the olfactory system during reward-motivated behaviors. 557
558
Identity coding 559
Many previous studies have focused on coding of odor identity in the PC (Illig and Haberly, 2003; 560
Stettler and Axel, 2009; Gottfried, 2010; Wilson and Sullivan, 2011; Bolding and Franks, 2017; Iurilli 561
and Datta, 2017; Roland et al., 2017). By contrast, our experiments were designed to focus on reward-562
related activity and only a small number of neurons were recorded during experimental sessions with 563
a particular set of odors. Previous studies (Bolding and Franks, 2017; Iurilli and Datta, 2017) have 564
indicated that a few dozen cells are necessary for odor identity decoding in the piriform cortex when a 565
22
6-15 odors are considered. Identity decoding was very poor in pPC in our current study, likely due to 566
the sparse odor responses in pPC resulting in few or no responses to a given odor within the relatively 567
small populations of cells available for this analysis (mean: 32 cells per odor set). Individual OT 568
neurons carry some information about both odor identity and reward category. This multiplexing of 569
information in OT may allow rapid and flexible learning of reward-oriented behavior. 570
571
Reward coding 572
A major finding of our study is that neurons in the OT carry an explicit representation of reward 573
category, independent of the identity of the odor. This information can be gleaned reliably from the 574
firing rates of only a few dozen arbitrarily selected neurons, within a brief period (<200 ms) after odor 575
sampling. Remarkably, when mice learn new odor-reward associations, neurons in the OT alter their 576
firing properties to begin coding for reward category in concert with learning during the same session. 577
Importantly, we show that the activity that is correlated with reward valence is not simply a 578
consequence of the motor action. First, the emergence of reward information in the activity of OT 579
neurons precedes the motor action (licking). Second, when using error trials, the ability to decode the 580
reward category for each neuron is not dominated by the ability to decode the mouse’s choice (licking 581
or not licking). Therefore, while OT neurons may also carry information related to the motor action, this 582
would be in addition to the information they carry about reward category. 583
584
The OT is a heterogeneous structure, with different types of neurons and mesoscopic structures such 585
the islands of Calleja (Heimer et al., 1982; Wesson and Wilson, 2011; Giessel and Datta, 2014). Our 586
experimental design did not allow us to distinguish among different cell types, but striatal cells 587
dominate the OT in numbers (Heimer et al., 1982; Millhouse and Heimer, 1984). Additionally, cells in 588
the islands of Calleja have thin and sparse dendrites, which might be unfavorable for generating 589
strong dipoles to be easily detected by extracellular electrodes. Parts of the ventral pallidum can 590
protrude into the OT and we cannot be certain we avoided recording there. We note, however, that we 591
did not find a relationship between the dorsal-ventral position of neurons in the tetrode path (tetrodes 592

23
were lowered every recording session) and reward value selectivity (i.e. | auROC - 0.5 |) in OT 593
(Pearson correlation of depth versus valence selectivity: r = -0.136, p = 0.072; n = 177 neurons). 594
Future work focusing on electrical or optical recordings from specifically labeled neurons can 595
disentangle contributions from different neuron types and subregions. 596
597
There is significant anatomical and pharmacological work implicating the OT in reward and motivated 598
behavior (Heimer et al., 1982; Ikemoto, 2003, 2007). Recent work has implicated the OT in valence 599
coding (Gadziola et al., 2015; Gadziola and Wesson, 2016; Zhang et al., 2017a), though the 600
relationship between valence coding and stimulus tuning was not clear. Here, we used a large number 601
of odors to probe the breadth of stimulus responses when many different odors reliably predict reward 602
or no reward. We find that OT neurons multiplex odor identity and reward category information. 603
Additionally, the mouse’s behavioral performance for an individual odor is correlated with the ability to 604
decode reward category from OT activity in response to that odor. By monitoring sniffing, we could 605
determine the timing of neural responses at high resolution and found that reward category-related 606
activity in the OT arises rapidly (on average, 100ms after onset of sniffing, well before the average 607
onset of the motor act). In contrast, we found little evidence for an explicit representation of reward 608
category information in the pPC, beyond that which is expected merely from sensory tuning. This 609
appears to be at odds with an earlier study (Calu et al., 2007) suggesting that the activity of pPC 610
neurons can be modulated by reward. However, that study used only a few odors and only a few cells 611
(< 5) showed the effect, leaving open the possibility that the responses they observed were due to 612
sensory tuning alone (as demonstrated in our Figure 6) or reflected later-onset brain-wide reward 613
consumption or anticipatory signals (Schultz, 2000). 614
615
How do OT neurons acquire reward-selective responses so early during learning? 616
The emergence of reward-selective responses in the striatum is not unprecedented. Monkeys trained 617
to associate reward with visual stimuli develop reward selectivity in the dorsal striatum that is apparent 618
in the activity of individual neurons within a few trials of successful learning (Schultz et al., 2003; 619

24
Pasupathy and Miller, 2005). In contrast, neurons in the prefrontal cortex took much longer to acquire 620
reward selectivity (Pasupathy and Miller, 2005). OT, at least in rodents, has been suggested to 621
implement similar computations for olfactory information that the rest of striatum implements for other 622
modalities (Wesson and Wilson, 2011; Giessel and Datta, 2014). Indeed, OT and dorsal striatum have 623
a similar composition of cells (e.g. ~98% D1- or D2-receptor-expressing medium spiny neurons), 624
comparable density of input from VTA, and the same output targets (Wesson and Wilson, 2011). Our 625
results strengthen the analogy between OT and dorsal striatum, adding physiological data to the 626
known anatomical and cytoarchitecture similarities. 627
628
Reward-selective responses might emerge in the striatum early during learning to support decision-629
making. Indeed, corticostriatal inputs have been shown to drive decision-making in an auditory 630
discrimination task (Znamenskiy and Zador, 2013), and corticostriatal synapses exhibit plasticity over 631
the course of training (Xiong et al., 2015). Moreover, the strength of olfactory synaptic inputs to the 632
ventral striatum can be modulated by optogenetic release of dopamine in slices (Wieland et al., 2015), 633
and the activation of VTA projections to the OT can induce odor preference in mice (Zhang et al., 634
2017a). 635
636
Sensory processing begins with a dedicated channel (glomerulus) for each olfactory receptor in the 637
OB. An optimal linear readout of these channels is sufficient to determine the presence of any 638
individual odor among at least a moderately-sized (16 odor) panel of structurally similar odors and, 639
thus, decide the appropriate motor action given a complex sensory scene (Mathis et al., 2016). The 640
success of a linear readout implies that any monosynaptic recipient of OB output could learn to make 641
accurate sensorimotor decisions through biologically-plausible mechanisms such as reward-gated 642
Hebbian plasticity (Reynolds and Wickens, 2002; Hung et al., 2005; Loewenstein and Seung, 2006; 643
Pfeiffer et al., 2010). Therefore, one possible model for rapid learning of reward selectivity involves OB 644
or PC inputs that evoke odor responses in OT being subsequently reinforced by dopamine release 645
from VTA projections to the OT upon reward delivery. 646

25
647
A recent study was published during the preparation of this manuscript, which takes a complementary 648
approach to examine the relationship between pPC and OT in coding odor-reward associations 649
(Gadziola et al., 2019). Those authors use reward contingency reversals to demonstrate that odor-650
evoked responses in OT change in response to experimental manipulation of the reward valence 651
predicted by the odor. Their results corroborate the much denser reward coding in OT than pPC 652
observed in our work. In addition, our approach of training each mouse to learn many odor-reward 653
associations enabled the dissociable characterization of odor and reward valence components of the 654
cells’ tuning in the OT. Taken together, along with previous literature, our two studies lend strong 655
support for a central role of the OT in odor-driven reward-motivated behaviors. 656
657
Our study sheds light on the representation of a behaviorally relevant aspect of the environment, 658
reward, and how it relates to sensory coding in the olfactory system. The rapidity of odor-guided 659
learning in mice, and the direct connectivity of the OT to the sensory periphery as well as motor and 660
reward areas, make this behavior and brain region attractive candidates for the dissection of rapid 661
sensorimotor reinforcement. 662
663
664
665
666

26
References 667
668
Abraham NM, Spors H, Carleton A, Margrie TW, Kuner T, Schaefer AT (2004) Maintaining accuracy at 669
the expense of speed: stimulus similarity defines odor discrimination time in mice. Neuron 670
44:865–876. 671
Bolding KA, Franks KM (2017) Complementary codes for odor identity and intensity in olfactory cortex. 672
Elife 6. 673
Calu DJ, Roesch MR, Stalnaker TA, Schoenbaum G (2007) Associative encoding in posterior piriform 674
cortex during odor discrimination and reversal learning. Cereb Cortex 17:1342–1349. 675
Cohen JY, Haesler S, Vong L, Lowell BB, Uchida N (2012) Neuron-type-specific signals for reward and 676
punishment in the ventral tegmental area. Nature 482:85–88. 677
Cury KM, Uchida N (2010) Robust Odor Coding via Inhalation-Coupled Transient Activity in the 678
Mammalian Olfactory Bulb. Neuron 68:570–585. 679
Dayan P, Niv Y (2008) Reinforcement learning: The Good, The Bad and The Ugly. Curr Opin Neurobiol 680
18:1–12. 681
Diodato A, Ruinart de Brimont M, Yim YS, Derian N, Perrin S, Pouch J, Klatzmann D, Garel S, Choi 682
GB, Fleischmann A (2016) Molecular signatures of neural connectivity in the olfactory cortex. Nat 683
Commun 7:12238. 684
Gadziola MA, Stetzik LA, Milton AJ, Arakawa K, Wesson DW (2019) A neural system for encoding 685
odor-reward associations which influences approach behaviors. bioRxiv. 686
Gadziola MA, Tylicki KA, Christian DL, Wesson DW (2015) The Olfactory Tubercle Encodes Odor 687
Valence in Behaving Mice. J Neurosci 35:4515–4527. 688
Gadziola MA, Wesson DW (2016) The Neural Representation of Goal-Directed Actions and Outcomes 689
in the Ventral Striatum’s Olfactory Tubercle. J Neurosci 36:548–560. 690
Giessel AJ, Datta SR (2014) Olfactory maps, circuits and computations. Curr Opin Neurobiol 24:120–691
132. 692
Gire DH, Whitesell JD, Doucette W, Restrepo D (2013) Information for decision-making and stimulus 693

27
identification is multiplexed in sensory cortex. Nat Neurosci 16:991–993. 694
Gottfried JA (2010) Central mechanisms of odour object perception. Nat Rev Neurosci 11:628–641. 695
Gray CM, Maldonado PE, Wilson M, McNaughton B (1995) Tetrodes markedly improve the reliability 696
and yield of multiple single-unit isolation from multi-unit recordings in cat striate cortex. J Neurosci 697
Methods 63:43–54. 698
Green DM, Swets JA (1966) Signal detection theory and psychophysics. New York: Wiley. 699
Hastie T, Tibshirani R, Friedman J (2009) The Elements of Statistical Learning. New York, NY: 700
Springer New York. 701
Heimer L, Switzer RD, Van Hoesen GW (1982) Ventral striatum and ventral pallidum. Trends Neurosci 702
5:83–87. 703
Heimer L, Zaborszky L, Zahm DS, Alheid GF (1987) The ventral striatopallidothalamic projection: I. 704
The striatopallidal link originating in the striatal parts of the olfactory tubercle. J Comp Neurol 705
255:571–591. 706
Hung CP, Kreiman G, Poggio T, DiCarlo JJ (2005) Fast Readout of Object Identity from Macaque 707
Inferior Temporal Cortex. Science (80- ) 310:863–866. 708
Ikemoto S (2003) Involvement of the olfactory tubercle in cocaine reward: intracranial self-709
administration studies. J Neurosci 23:9305–9311. 710
Ikemoto S (2007) Dopamine reward circuitry: Two projection systems from the ventral midbrain to the 711
nucleus accumbens–olfactory tubercle complex. Brain Res Rev 56:27–78. 712
Illig KR, Haberly LB (2003) Odor-evoked activity is spatially distributed in piriform cortex. J Comp 713
Neurol 457:361–373. 714
Iurilli G, Datta SR (2017) Population Coding in an Innately Relevant Olfactory Area. Neuron 93:1180-715
1197.e7. 716
Johnson DM, Illig KR, Behan M, Haberly LB (2000) New features of connectivity in piriform cortex 717
visualized by intracellular injection of pyramidal cells suggest that “primary” olfactory cortex 718
functions like “association” cortex in other sensory systems. J Neurosci 20:6974–6982. 719
Kepecs A, Uchida N, Mainen ZF (2007) Rapid and precise control of sniffing during olfactory 720

28
discrimination in rats. J Neurophysiol 98:205–213. 721
Loewenstein Y, Seung HS (2006) Operant matching is a generic outcome of synaptic plasticity. Proc 722
Natl Acad Sci U S A 103:15224–15229. 723
Majaj NJ, Hong H, Solomon EA, DiCarlo JJ (2015) Simple Learned Weighted Sums of Inferior 724
Temporal Neuronal Firing Rates Accurately Predict Human Core Object Recognition 725
Performance. J Neurosci 35:13402–13418. 726
Mathis A, Rokni D, Kapoor V, Bethge M, Murthy VN (2016) Reading Out Olfactory Receptors: 727
Feedforward Circuits Detect Odors in Mixtures without Demixing. Neuron 91:1110–1123. 728
Millhouse OE, Heimer L (1984) Cell configurations in the olfactory tubercle of the rat. J Comp Neurol 729
228:571–597. 730
Miura K, Mainen ZF, Uchida N (2012) Odor representations in olfactory cortex: distributed rate coding 731
and decorrelated population activity. Neuron 74:1087–1098. 732
Otazu GH, Chae H, Davis MB, Albeanu DF (2015) Cortical Feedback Decorrelates Olfactory Bulb 733
Output in Awake Mice. Neuron 86:1461–1477. 734
Pasupathy A, Miller EK (2005) Different time courses of learning-related activity in the prefrontal cortex 735
and striatum. Nature 433:873–876. 736
Pfeiffer M, Nessler B, Douglas RJ, Maass W (2010) Reward-modulated Hebbian learning of decision 737
making. Neural Comput 22:1399–1444. 738
Reynolds JNJ, Wickens JR (2002) Dopamine-dependent plasticity of corticostriatal synapses. Neural 739
Netw 15:507–521. 740
Rinberg D, Koulakov A, Gelperin A (2006) Speed-accuracy tradeoff in olfaction. Neuron 51:351–358. 741
Rokni D, Hemmelder V, Kapoor V, Murthy VN (2014) An olfactory cocktail party: figure-ground 742
segregation of odorants in rodents. Nat Neurosci 17:1225–1232. 743
Roland B, Deneux T, Franks KM, Bathellier B, Fleischmann A (2017) Odor identity coding by 744
distributed ensembles of neurons in the mouse olfactory cortex. Elife 6. 745
Schultz W (2000) Multiple reward signals in the brain. Nat Rev Neurosci 1:199–207. 746
Schultz W, Dayan P, Montague PR (1997) A neural substrate of prediction and reward. Science 747

29
275:1593–1599. 748
Schultz W, Tremblay L, Hollerman JR (2003) Changes in behavior-related neuronal activity in the 749
striatum during learning. Trends Neurosci 26:321–328. 750
Shusterman R, Smear MC, Koulakov A a, Rinberg D (2011) Precise olfactory responses tile the sniff 751
cycle. Nat Neurosci 14:1039–1044. 752
Slotnick B (2001) Animal cognition and the rat olfactory system. Trends Cogn Sci 5:216–222. 753
Slotnick B, Hanford L, Hodos W (2000) Can rats acquire an olfactory learning set? J Exp Psychol 754
Anim Behav Process 26:399–415. 755
Stettler DD, Axel R (2009) Representations of odor in the piriform cortex. Neuron 63:854–864. 756
Sutton RS, Barto AG (1998) Reinforcement learning : an introduction. MIT Press. 757
Uchida N, Mainen ZF (2003) Speed and accuracy of olfactory discrimination in the rat. Nat Neurosci 758
6:1224–1229. 759
Watabe-Uchida M, Zhu L, Ogawa SK, Vamanrao A, Uchida N (2012) Whole-brain mapping of direct 760
inputs to midbrain dopamine neurons. Neuron 74:858–873. 761
Welker WI (1964) Analysis of Sniffing of the Albino Rat. Behaviour 22:223–244. 762
Wesson DW, Donahou TN, Johnson MO, Wachowiak M (2008) Sniffing Behavior of Mice during 763
Performance in Odor-Guided Tasks. Chem Senses 33:581–596. 764
Wesson DW, Wilson DA (2011) Sniffing out the contributions of the olfactory tubercle to the sense of 765
smell: Hedonics, sensory integration, and more? Neurosci Biobehav Rev 35:655–668. 766
Wieland S, Schindler S, Huber C, Kohr G, Oswald MJ, Kelsch W (2015) Phasic Dopamine Modifies 767
Sensory-Driven Output of Striatal Neurons through Synaptic Plasticity. J Neurosci 35:9946–9956. 768
Willmore B, Tolhurst DJ (2001) Characterizing the sparseness of neural codes. Network 12:255–270. 769
Wilson DA, Sullivan RM (2011) Cortical processing of odor objects. Neuron 72:506–519. 770
Xiong Q, Znamenskiy P, Zador AM (2015) Selective corticostriatal plasticity during acquisition of an 771
auditory discrimination task. Nature 521:348–351. 772
Yamaguchi M (2017) Functional Sub-Circuits of the Olfactory System Viewed from the Olfactory Bulb 773
and the Olfactory Tubercle. Front Neuroanat 11. 774

30
Zhang Z, Liu Q, Wen P, Zhang J, Rao X, Zhou Z, Zhang H, He X, Li J, Zhou Z, Xu X, Zhang X, Luo R, 775
Lv G, Li H, Cao P, Wang L, Xu F (2017a) Activation of the dopaminergic pathway from VTA to the 776
medial olfactory tubercle generates odor-preference and reward. Elife 6. 777
Zhang Z, Zhang H, Wen P, Zhu X, Wang L, Liu Q, Wang J, He X, Wang H, Xu F (2017b) Whole-Brain 778
Mapping of the Inputs and Outputs of the Medial Part of the Olfactory Tubercle. Front Neural 779
Circuits 11. 780
Znamenskiy P, Zador AM (2013) Corticostriatal neurons in auditory cortex drive decisions during 781
auditory discrimination. Nature 497:482–485. 782
783
784
785

31
Figure Legends 786
787
Figure 1: Behavioral task design and mouse performance. A. (top) Mouse in the head-fixed behavior 788
setup. The odor port (red dot) and lick port (yellow dot) are labeled. (bottom) Diagram of the task 789
structure, indicating the periods for odor, response (lick/no-lick), and reward delivery. B. Average task 790
performance over the first four sessions for 14 mice. The hit rate, correct rejection (CR) rate, and 791
overall performance rate are shown separately. C. Raster plots of individual lick times by trial, shown 792
separately for rewarded and unrewarded odors for an expert mouse. D. Lick rate by trial type 793
averaged over sessions in well-trained mice (i.e. after session 5). Shading indicates standard error of 794
the mean. FA: false alarm; CR: correct rejection. For panels C and D, 0 marks onset of odor stimulus. 795
E. (top) An example trace of five seconds of respiration measurements obtained through air pressure 796
from a nasal cannula. Exhalation is positive-going pressure and inhalation is negative-going pressure. 797
(bottom) Average sniff rate over all trials from an example behavior session. F. Histograms of the times 798
of the first, second, third, and fourth sniffs of each trial. 799
800
Figure 2: Putative recording sites and single-unit firing properties in pPC and OT. A. Recording sites 801
estimated from tetrode tracks and electrolytic lesions in histological sections. B, C. Baseline firing 802
rates for all cells recorded in pPC and OT, respectively. Note: the last bin in C shows cells that had a 803
firing rate greater than or equal to 60 spikes per second. D,E. Spike rasters aligned to odor onset (top) 804
and aligned to the first sniff after odor onset (middle) as well as the peri-stimulus time histograms 805
(PSTHs, bottom) with each trial aligned to the first sniff for an exemplar cell from pPC (D) and OT (E). 806
Four PSTHs for the rewarded odors are shown in red and four PSTHs for the unrewarded odors are 807
shown in black. 808
809
Figure 3: Responses of pPC and OT neurons. A. Coefficient of variation of neuronal responses in pPC 810
and OT, separated for rewarded and unrewarded odors. For each panel, the median value is indicated 811
by a dashed red line and number next to it. B. Lifetime sparseness for cells recorded during sessions 812

32
in which the animal was familiar with all eight odors in the stimulus panel. Sparser (more selective) 813
cells have values closer to 1. C, D. auROC timecourse for each cell-odor pair for cells recorded in pPC 814
and OT separated into rewarded and unrewarded odors. Odor onset is at 0s. Yellow indicates that the 815
cell was excited relative to its baseline firing rate, whereas blue indicates that the cell was inhibited 816
relative to its baseline firing rate. For visualization purposes, cell-odor pairs with noisy firing during pre-817
odor time are not shown, resulting in a different number of cell-odor pairs between rewarded and 818
unrewarded odors despite equal number of recorded cell-odor pairs. E. Population-averaged PSTHs 819
for all recorded cell-odor pairs in pPC, split by rewarded and unrewarded odors. Errorbars are SEM. F. 820
Similar plot as in E, for OT neurons. 821
822
Figure 4: Reward valence selectivity during decision-making. A. Responses of three examplar cells 823
from pPC to 8 odors, with no clear reward category information. B. Three exemplar cells from OT, two 824
of which (red and blue) show clear reward selectivity (visualized by dashed lines separating firing 825
rates), and one (black) showing imperfect reward selectivity. C, D. auROC to illustrate cells' ability to 826
discriminate rewarded versus unrewarded odors that had been successfully learned in previous 827
sessions (i.e. familiar odors). Responses are aligned to the first inhalation following odor onset (t=0). 828
The cells (rows) are hierarchically clustered by the first three principal components calculated from the 829
initial (first 200ms) firing rate, delayed response rate (200ms-800ms), and response rate at the time of 830
reward delivery (1500-2000ms). E. Histograms of the first time bin in which the auROC for a cell was 831
significant for cells in pPC and OT. F. Zoom-in of the histograms in E, along with an overlay (hollow 832
black bars) of the mean time of the first lick on hit trials to illustrate the beginning of the motor 833
response. 834
835
Figure 5: Multiplexing of odor and reward codes. A. Single-cell peri-stimulus time histograms are used 836
to produce barcodes that illustrate both odorand reward sensitivity of a cell's response during the first 837
200ms of odor presentation, beginning with the first inhalation. Odors are rank ordered from most 838
positive-going response to most negative-going response, then colored according to valence (red - 839

33
rewarded, black -unrewarded) and the normalized response to the odor. B. Stacks of barcodes for 840
cells recorded in pPCand OT during sessions in which all eight odors in the stimulus panel had been 841
successfully learned in a previous session (i.e. familiar odors). C. Mean reward selectivity, as 842
measured by auROC, as a function of lifetime sparseness. auROC was calculated for the first 200ms 843
from the start of odor sampling (first inhalation following odor onset). Error bars are standard error of 844
the mean. The number of cells used to calculate each point in the plots are indicated in parentheses. 845
D. The percentile of the true valence auROC (from a non-discriminating value of 0.5) among the 846
distribution of auROCs generated from shuffling the valence labels of the odors. Dots are individual 847
cells, the connected lines show medians and the error bars are 90% confidence interval of the median. 848
The dashed line indicates chance; that is, the true auROC falling at the median of the distribution on 849
average. The number of cells used to calculate each point in the plots are indicated in parentheses. 850
851
Figure 6: Decoding reward valence from population data. A. Decoding accuracy for reward 852
valence obtained with a support vector machine, trained and tested on the average response rate 853
of OT cells in a window that began at the time of the first inhalation of an odor and had a duration 854
equal to the time denoted for each curve. B. Training and testing linear classifiers on different sets of 855
odors. Support vector machines with a linear kernel were trained on the single-trial responses to one 856
set of 4 odors and tested on a different set of 4 odors. Each line corresponds to the test performance 857
for a different mouse or set of test odors. pPC (yellow): 3 curves total; each curve is a different mouse 858
(each mouse had a different set of test odors). OT (blue): 5 curves total: 3 curves for three mice with 859
the same test odor set, 1 curve for a second set of test odors for one of the three mice, and 1 curve for 860
a fourth mouse with a different set of odors than the other three mice. C, D. Decoding accuracy for 861
similar classifiers that were trained and tested on the given number of odors (color correspondence 862
indicated in the inset), half of which were rewarded odors and half of which were unrewarded odors. 863
E,F. The same as C and D but for classifiers trained and tested on odor responses with the reward 864
valence label shuffled. G. Decoding of reward in OT and pPC for 2, 4, 6, and 8 odors (same color 865
scheme as C,D) among cells with lifetime sparseness between 0.3 and 0.6. This was the range of 866

34
lifetime sparseness in which pPC and OT most overlapped (Figure 5A). OT still performed better 867
than pPC even when lifetime sparseness in the two areas was matched in this way. H. Comparison of 868
the reward decoding performance for 8 odors in OT (blue) and pPC (yellow) for the same data as G 869
but with the reward labels shuffled. All error bars are standard error of the mean performance across 870
100 classifiers each trained and tested on a random subsample of the dataset corresponding to the 871
population size indicated on the horizontal axis. 872
873
Figure 7: Learning of novel odor-reward associations. A. During the initial phase of training on the task 874
structure, the eight odors in the stimulus panel remained the same. After 5-10 sessions, half of the 875
odors (2 rewarded and 2 unrewarded) were replaced between some sessions (“Novel”). Before 876
changing the stimulus panel again, the stimulus panel was held constant for at least one additional 877
session in order to measure behavioral and neural responses to the newly-familiar odors. Different 878
shapes indicate different sets of odors, with odors represented by the same shape being introduced at 879
the same time. Hollow shapes indicate novel odors that the mouse has not been exposed to in 880
previous sessions. Filled shapes indicate odors that have been learned in a previous session 881
(“Familiar odors”). Red shapes indicate rewarded odors and black shapes indicate unrewarded odors. 882
B. The performance for the 4 novel odors on the first 3 days of learning is shown averaged for all 883
novel odors as a function of presentation number. Each novel odor was presented ~35 times 884
(randomly) in each session. C, D. Go/no-go behavioral responses of mice to novel odors in the first 885
session, red for lick and black for no-lick. Each row is one novel odor. The length of each row 886
corresponds to the total number of presentations of that particular odor during its first session in the 887
odor panel. 888
889
Figure 8: Neural response changes during novel odor learning. A. Responses of an example neuron 890
to the 4 rewarded (S+) and 4 unrewarded (S-) odors, half of each were familiar and novel. Trials were 891
randomly presented, but are shown sorted for visualization. Within each category, trials are displayed 892
in order of presentation in the session, with early trials at bottom (arrow at bottom right). The accuracy 893
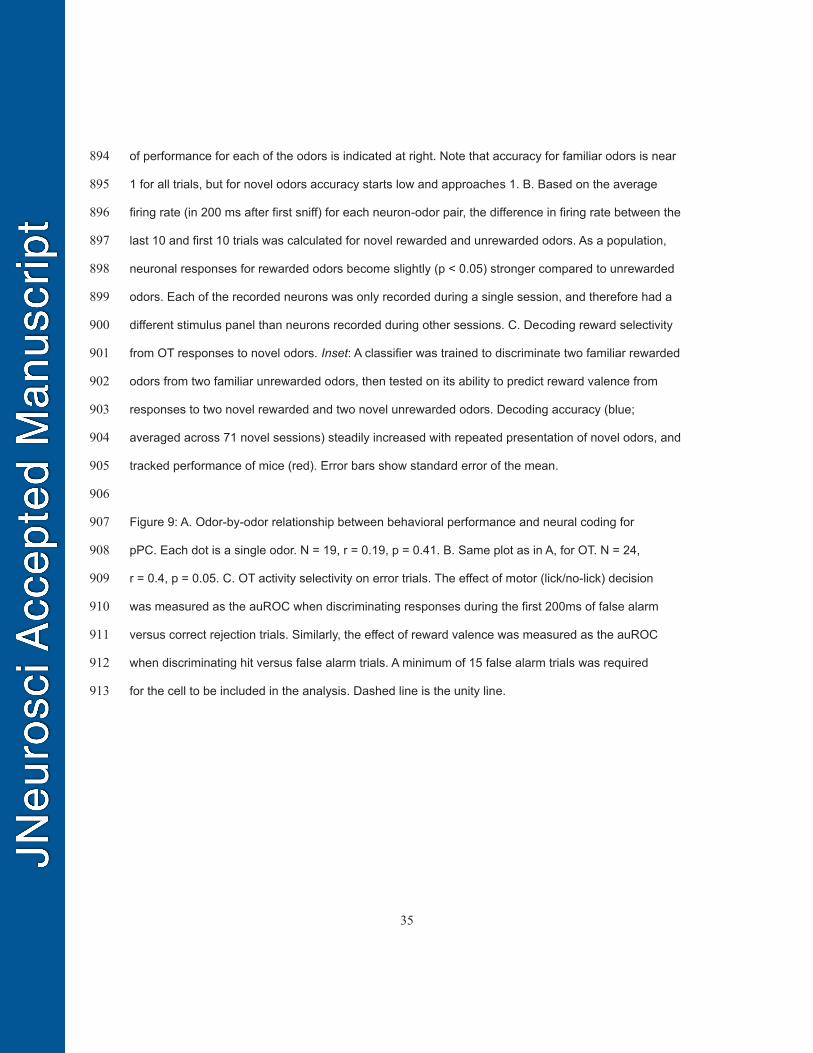
35
of performance for each of the odors is indicated at right. Note that accuracy for familiar odors is near 894
1 for all trials, but for novel odors accuracy starts low and approaches 1. B. Based on the average 895
firing rate (in 200 ms after first sniff) for each neuron-odor pair, the difference in firing rate between the 896
last 10 and first 10 trials was calculated for novel rewarded and unrewarded odors. As a population, 897
neuronal responses for rewarded odors become slightly (p < 0.05) stronger compared to unrewarded 898
odors. Each of the recorded neurons was only recorded during a single session, and therefore had a 899
different stimulus panel than neurons recorded during other sessions. C. Decoding reward selectivity 900
from OT responses to novel odors. Inset: A classifier was trained to discriminate two familiar rewarded 901
odors from two familiar unrewarded odors, then tested on its ability to predict reward valence from 902
responses to two novel rewarded and two novel unrewarded odors. Decoding accuracy (blue; 903
averaged across 71 novel sessions) steadily increased with repeated presentation of novel odors, and 904
tracked performance of mice (red). Error bars show standard error of the mean. 905
906
Figure 9: A. Odor-by-odor relationship between behavioral performance and neural coding for 907
pPC. Each dot is a single odor. N = 19, r = 0.19, p = 0.41. B. Same plot as in A, for OT. N = 24, 908
r = 0.4, p = 0.05. C. OT activity selectivity on error trials. The effect of motor (lick/no-lick) decision 909
was measured as the auROC when discriminating responses during the first 200ms of false alarm 910
versus correct rejection trials. Similarly, the effect of reward valence was measured as the auROC 911
when discriminating hit versus false alarm trials. A minimum of 15 false alarm trials was required 912
for the cell to be included in the analysis. Dashed line is the unity line. 913

odor
resp
reward
1s3-15s
S+ S-
Tria
l 200
1
0
Rewarded Odors
Unrewarded Odors
200
1
Time (s)
0.5 1.0 1.5
1 2 3 40
20
40
60
80
100
Hit RateCR RateOverall
Time (s)4
2
4
6
8Hits
Misses
CRs
FAs
00 1 2 3
chance-level
Pe
rfo
rma
nce
(%
)L
ick r
ate
(1
/s)
Session #
A
C
B
D
Figure 1: Behavioral task design and mouse performance. A. (top) Mouse in the head-fixed behavior
setup. The odor port (red dot) and lick port (yellow dot) are labeled. (bottom) Diagram of the task
structure, indicating the periods for odor, response (lick/no-lick), and reward delivery. B. Average task
performance over the first four sessions for 14 mice. The hit rate, correct rejection (CR) rate, and
overall performance rate are shown separately. C. Raster plots of individual lick times by trial, shown
separately for rewarded and unrewarded odors for an expert mouse. D. Lick rate by trial type averaged
over sessions in well-trained mice (i.e. after session 5). Shading indicates standard error of the mean.
FA: false alarm; CR: correct rejection. For panels C and D, 0 marks onset of odor stimulus. E. (top)
An example trace of five seconds of respiration measurements obtained through air pressure from a
nasal cannula. Exhalation is positive-going pressure and inhalation is negative-going pressure. (bottom)
Average sniff rate over all trials from an example behavior session. F. Histograms of the times of the
first, second, third, and fourth sniffs of each trial.
0
4
8
0
Sniff R
ate
(H
z)
sniff
1
sniff
2sniff
3sniff
4
Time from odor onset (s)
E F
1 2 3 0
Time from odor onset (s)
0.5 1
1 s

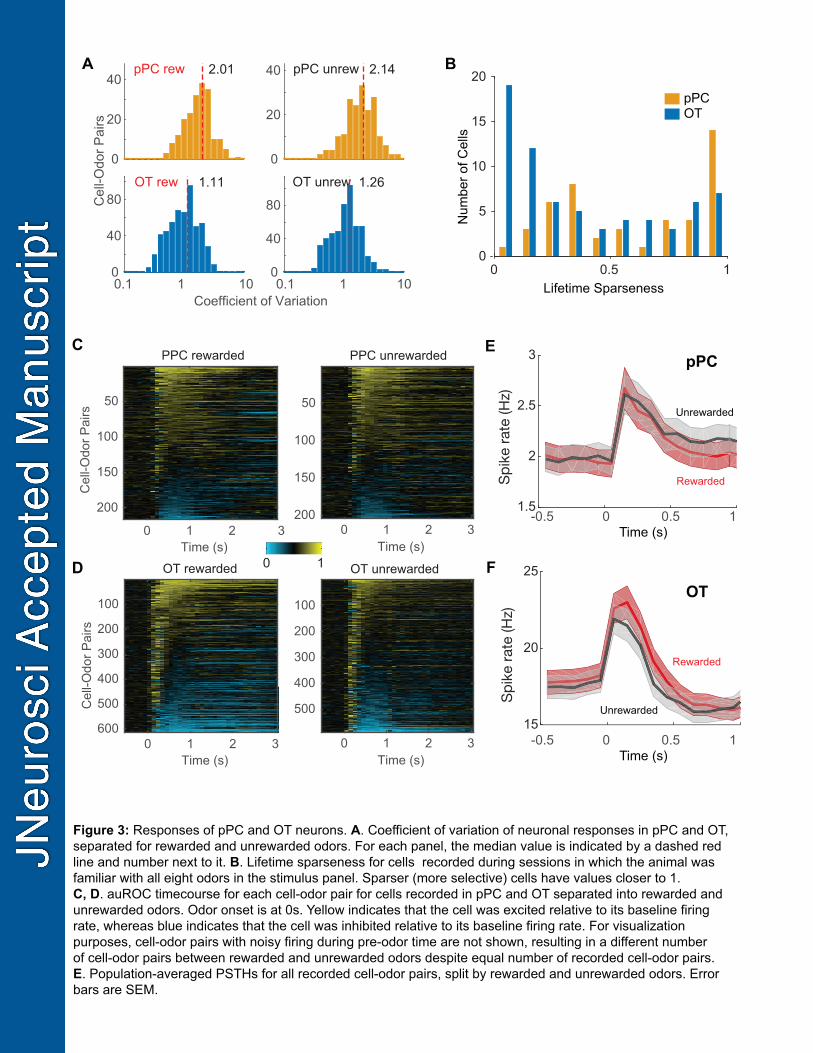
15
20
25
1.5
2
2.5
3PPC rewarded
0 1 2 3
Ce
ll-O
do
r P
airs
50
100
150
200
PPC unrewarded
Time (s)
0 1 2 3
50
100
150
200
OT rewarded
0 1 2 3
100
200
300
400
500
600
OT unrewarded
Time (s)
0 1 2 3
100
200
300
400
500
C
D
Ce
ll-O
do
r P
airs
Time (s)
Time (s)
E
-0.5 0 0.5 1
Time (s)
OT
0 1
Figure 3: Responses of pPC and OT neurons. A. Coefficient of variation of neuronal responses in pPC and OT,
separated for rewarded and unrewarded odors. For each panel, the median value is indicated by a dashed red
line and number next to it. B. Lifetime sparseness for cells recorded during sessions in which the animal was
familiar with all eight odors in the stimulus panel. Sparser (more selective) cells have values closer to 1.
C, D. auROC timecourse for each cell-odor pair for cells recorded in pPC and OT separated into rewarded and
unrewarded odors. Odor onset is at 0s. Yellow indicates that the cell was excited relative to its baseline firing
rate, whereas blue indicates that the cell was inhibited relative to its baseline firing rate. For visualization
purposes, cell-odor pairs with noisy firing during pre-odor time are not shown, resulting in a different number
of cell-odor pairs between rewarded and unrewarded odors despite equal number of recorded cell-odor pairs.
E. Population-averaged PSTHs for all recorded cell-odor pairs, split by rewarded and unrewarded odors. Error
bars are SEM.
-0.5 0 0.5 1
Time (s)
Rewarded
Unrewarded
pPC
10
5
10
15
20
pPCOT
Nu
mb
er
of C
ells
Lifetime Sparseness
B
0
20
40pPC rew 2.01
0
20
40 pPC unrew 2.14
0.1 1 10
Coefficient of Variation
0
40
80Ce
ll-O
do
r P
airs
OT rew 1.11
0.1 1 10 0
40
80
OT unrew 1.26
A
0 0.5
Sp
ike r
ate
(H
z)
Sp
ike r
ate
(H
z)
Rewarded
Unrewarded
F

0
1
Time (s)0 1 2 3
Time (s)0 0.2 0.4
rew
ard
ed
>
un
rew
ard
ed
un
rew
ard
ed
>
rew
ard
ed
20
40
60
Cell
Index
50
100
150
0 1 2 3Time (s)
0 1 2 3Time (s)
0
10
20
Perc
ent of cells
0
10
20
Perc
ent of cells
start of
licking
Pro
port
ion o
f tr
ials
0
0.1
C D
OTpPC
first significant
deviation in auROC
OTpPC
E F
A B
Rewarded
40
20
0
-20
Unrewarded
Response (
Hz)
OTpPC
30
20
10
0
Response (
Hz)
Rewarded Unrewarded
Figure 4: Reward valence selectivity during decision-making. A. Responses of three examplar
cells from pPC to 8 odors, with no clear reward category information. B. Three exemplar cells from
OT, two of which (red and blue) show clear reward selectivity (visualized by dashed lines separating
firing rates), and one (black) showing imperfect reward selectivity. C, D. auROC to illustrate cells'
ability to discriminate rewarded versus unrewarded odors that had been successfully learned in
previous sessions (i.e. familiar odors). Responses are aligned to the first inhalation following odor
onset (t=0). The cells (rows) are hierarchically clustered by the first three principal components
calculated from the initial (first 200ms) firing rate, delayed response rate (200ms-800ms), and
response rate at the time of reward delivery (1500-2000ms). E. Histograms of the first time bin in
which the auROC for a cell was significant for cells in pPC and OT. F. Zoom-in of the histograms
in E, along with an overlay (hollow black bars) of the mean time of the first lick on hit trials to
illustrate the beginning of the motor response.

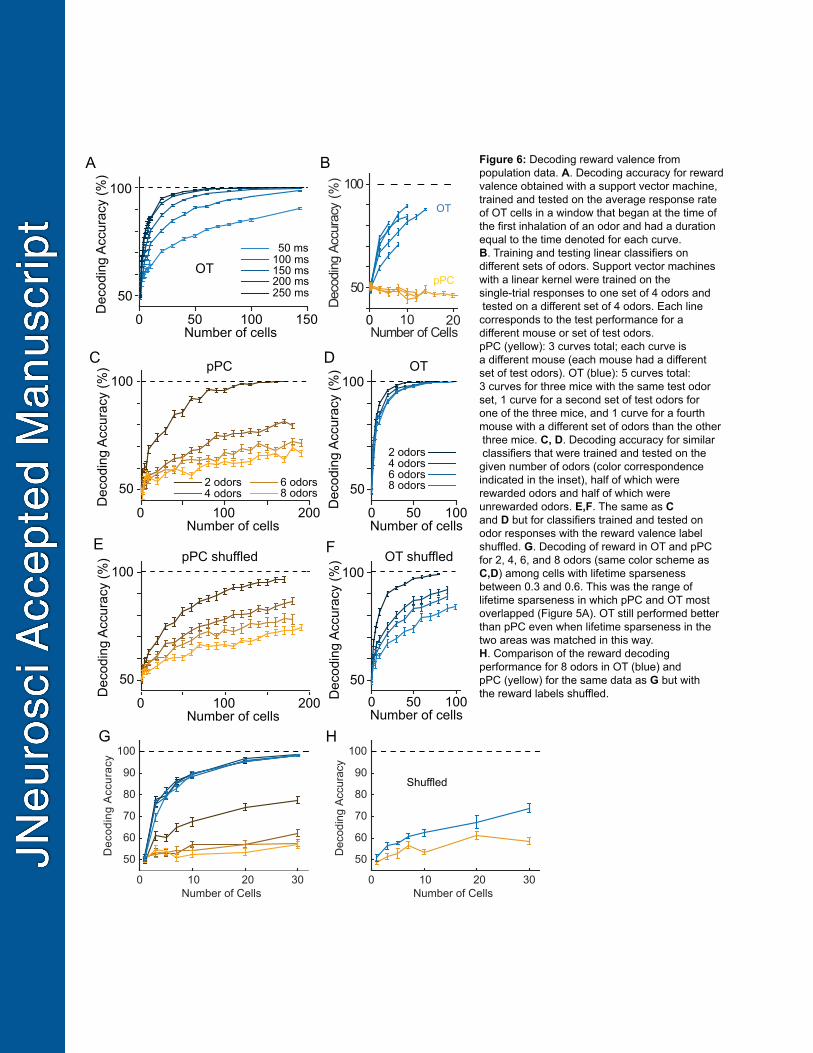
E
A B
2 odors4 odors6 odors8 odors
2000 100Number of cells
pPC
Dec
odin
g Ac
cura
cy (%
)
50
100OT
100500Number of cells
50
100
2 odors4 odors
6 odors8 odors
Dec
odin
g Ac
cura
cy (%
)
2000 100Number of cells
Dec
odin
g Ac
cura
cy (%
)
50
100
100500Number of cells
50
100pPC shuffled OT shuffled
Dec
odin
g Ac
cura
cy (%
)
F
C D
Figure 6: Decoding reward valence from population data. A. Decoding accuracy for reward valence obtained with a support vector machine, trained and tested on the average response rateof OT cells in a window that began at the time of the first inhalation of an odor and had a duration equal to the time denoted for each curve.B. Training and testing linear classifiers on different sets of odors. Support vector machines with a linear kernel were trained on the single-trial responses to one set of 4 odors and tested on a different set of 4 odors. Each line corresponds to the test performance for a different mouse or set of test odors. pPC (yellow): 3 curves total; each curve is a different mouse (each mouse had a different set of test odors). OT (blue): 5 curves total: 3 curves for three mice with the same test odor set, 1 curve for a second set of test odors for one of the three mice, and 1 curve for a fourth mouse with a different set of odors than the other three mice. C, D. Decoding accuracy for similar classifiers that were trained and tested on the given number of odors (color correspondence indicated in the inset), half of which were rewarded odors and half of which were unrewarded odors. E,F. The same as C and D but for classifiers trained and tested on odor responses with the reward valence label shuffled. G. Decoding of reward in OT and pPCfor 2, 4, 6, and 8 odors (same color scheme as C,D) among cells with lifetime sparseness between 0.3 and 0.6. This was the range of lifetime sparseness in which pPC and OT most overlapped (Figure 5A). OT still performed better than pPC even when lifetime sparseness in the two areas was matched in this way. H. Comparison of the reward decoding performance for 8 odors in OT (blue) and pPC (yellow) for the same data as G but with the reward labels shuffled.
Number of Cells0 10 20 30
ycaruccA gnidoce
D 50
60
70
80
90
100
Number of Cells0 10 20 30
Dec
odin
g Ac
cura
cy
50
60
70
80
90
100
Shuffled
G H
1500 50 100Number of cells
OT
Dec
odin
g Ac
cura
cy (%
)
50
100
250 ms200 ms
100 ms50 ms
150 ms
Number of Cells10
Deco
ding
Accu
racy
(%)
50
100
OT
pPC
200
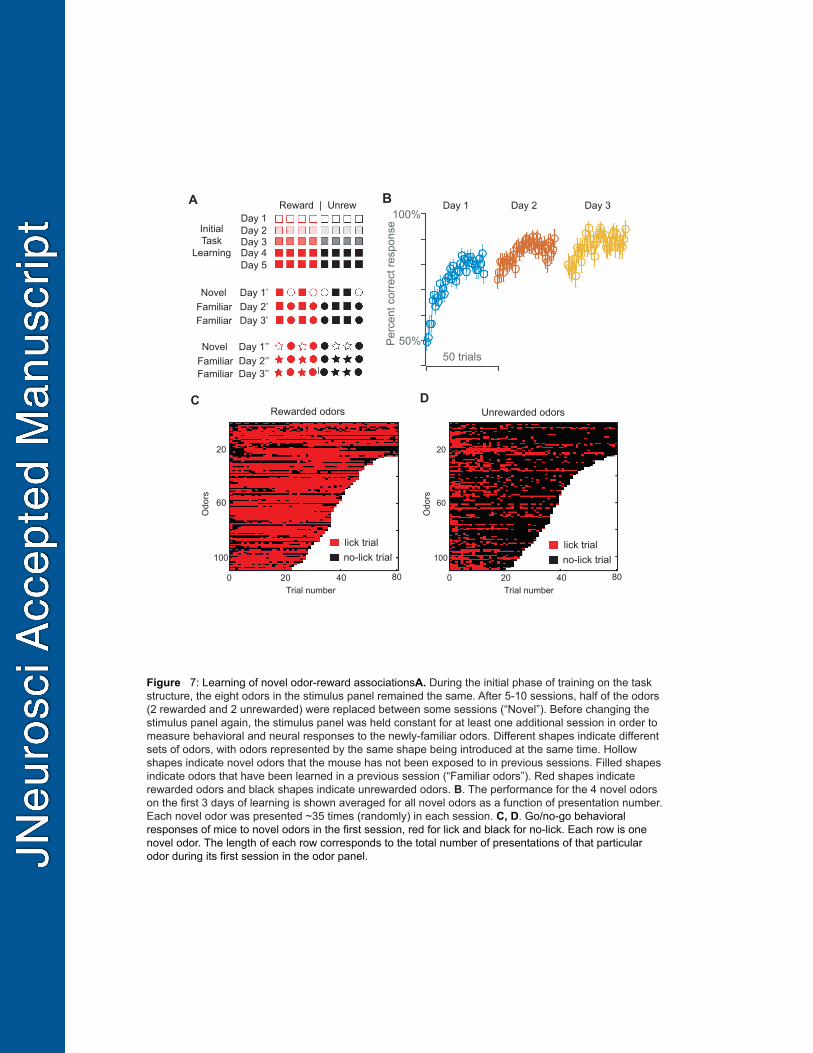
Figure 7: Learning of novel odor-reward associations. A. During the initial phase of training on the task structure, the eight odors in the stimulus panel remained the same. After 5-10 sessions, half of the odors (2 rewarded and 2 unrewarded) were replaced between some sessions (“Novel”). Before changing the stimulus panel again, the stimulus panel was held constant for at least one additional session in order to measure behavioral and neural responses to the newly-familiar odors. Different shapes indicate different sets of odors, with odors represented by the same shape being introduced at the same time. Hollow shapes indicate novel odors that the mouse has not been exposed to in previous sessions. Filled shapes indicate odors that have been learned in a previous session (“Familiar odors”). Red shapes indicate rewarded odors and black shapes indicate unrewarded odors. B. The performance for the 4 novel odors on the first 3 days of learning is shown averaged for all novel odors as a function of presentation number. Each novel odor was presented ~35 times (randomly) in each session. C, D. Go/no-go behavioral responses of mice to novel odors in the first session, red for lick and black for no-lick. Each row is one novel odor. The length of each row corresponds to the total number of presentations of that particular odor during its first session in the odor panel.
C D
B
20
100
60
20 80400
Odo
rs
20
100
60
20 80400Trial number
Reward | Unrew
InitialTask
Learning
Day 1Day 2Day 3Day 4Day 5
Day 1’Day 2’
Day 1’’Day 2’’
NovelFamiliar
NovelFamiliar
Rewarded odors Unrewarded odors
lick trialno-lick trial
lick trialno-lick trial
A
Trial number
50%
100%
50 trials
Day 1 Day 2 Day 3
Perc
ent c
orre
ct re
spon
se
Odo
rs
Day 3’Familiar
Day 3’’Familiar
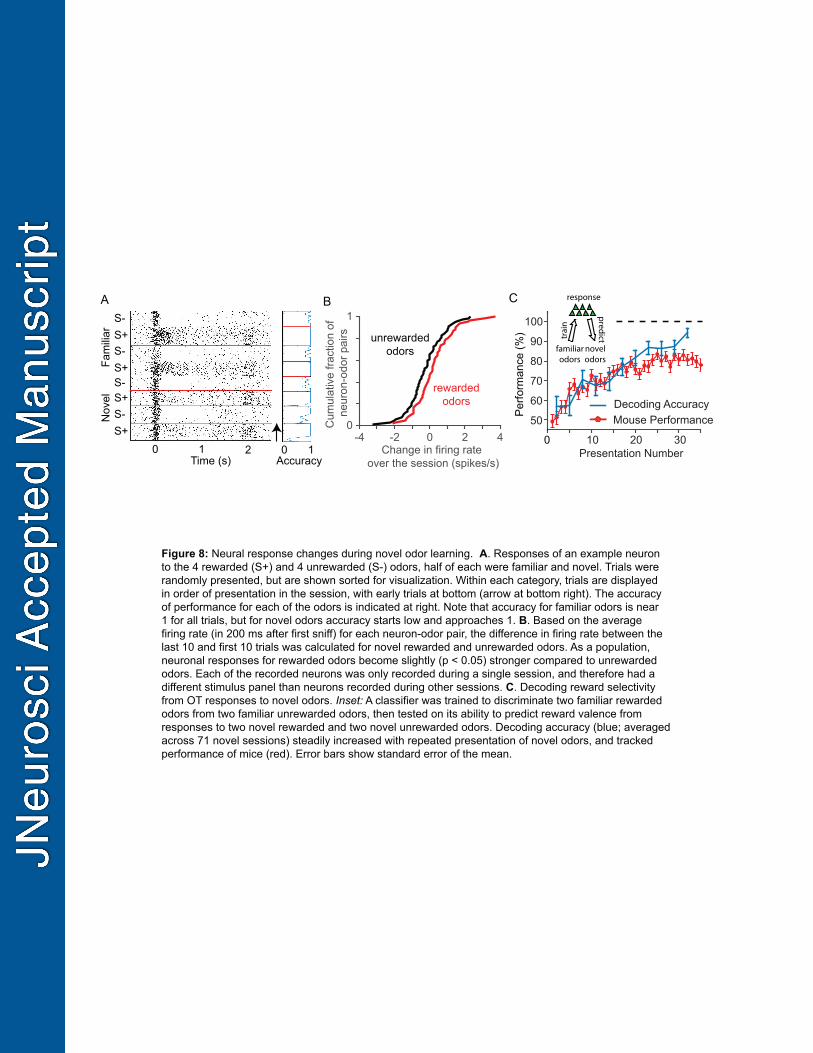
Presentation Number30
50
60
70
80
90
100
Decoding AccuracyMouse Performance
0 2010
C
-4 -2 0 2 4Change in firing rate
over the session (spikes/s)
0
1C
umul
ativ
e fra
ctio
n of
ne
uron
-odo
r pai
rsS+
S+
S+
S+
S-
S-
S-
S-Nov
elFa
milia
r
Time (s)0 1 2
A B
0 1Accuracy
Figure 8: Neural response changes during novel odor learning. A. Responses of an example neuron to the 4 rewarded (S+) and 4 unrewarded (S-) odors, half of each were familiar and novel. Trials were randomly presented, but are shown sorted for visualization. Within each category, trials are displayed in order of presentation in the session, with early trials at bottom (arrow at bottom right). The accuracy of performance for each of the odors is indicated at right. Note that accuracy for familiar odors is near 1 for all trials, but for novel odors accuracy starts low and approaches 1. B. Based on the average firing rate (in 200 ms after first sniff) for each neuron-odor pair, the difference in firing rate between the last 10 and first 10 trials was calculated for novel rewarded and unrewarded odors. As a population, neuronal responses for rewarded odors become slightly (p < 0.05) stronger compared to unrewarded odors. Each of the recorded neurons was only recorded during a single session, and therefore had a different stimulus panel than neurons recorded during other sessions. C. Decoding reward selectivity from OT responses to novel odors. Inset: A classifier was trained to discriminate two familiar rewarded odors from two familiar unrewarded odors, then tested on its ability to predict reward valence from responses to two novel rewarded and two novel unrewarded odors. Decoding accuracy (blue; averaged across 71 novel sessions) steadily increased with repeated presentation of novel odors, and tracked performance of mice (red). Error bars show standard error of the mean.
rewardedodors
unrewardedodors
train
response
predict
familiarodors
novelodors
Perfo
rman
ce (%
)

Behavioral Performance100
ecnamrofreP gnidoce
D 50
100
Behavioral Performance100
Dec
odin
g Pe
rform
ance
50
100OTpPC
BA
8080
C
Figure 9: A. Odor-by-odor relationship between behavioral performance and neural coding for pPC. Each dot is a single odor. N = 19, r = 0.19, p = 0.41. B. Same plot as in A, for OT. N = 24, r = 0.4, p = 0.05. C. OT activity selectivity on error trials. The effect of motor (lick/no-lick) decision was measured as the auROC when discriminating responses during the first 200ms of false alarm versus correct rejection trials. Similarly, the effect of reward valence was measured as the auROCwhen discriminating hit versus false alarm trials. A minimum of 15 false alarm trials was required for the cell to be included in the analysis. Dashed line is the unity line.
0 0.5 1Motor auROC
0
0. 5
1
Rew
ard
auRO
C