rapid antidepressant effects of nmda receptor blockade ...usdbiology.com/cliff/courses/advanced...
TRANSCRIPT
Supporting Online Materials for
Rapid Antidepressant Effects of NMDA Receptor Blockade Require Synaptic
Protein Synthesis and Spine Formation
Nanxin Li, Boyoung Lee, Rong-Jian Liu, Mounira Banasr, Jason Dwyer, Masaaki Iwata, Xiao-
Yuan Li, George Aghajanian, and Ronald S. Duman
Laboratory of Molecular Psychiatry, Center for Genes and Behavior, Departments of Psychiatry
and Neurobiology, Yale University School of Medicine, 34 Park Street, New Haven, CT 06508,
USA.
To whom correspondence should be addressed. E-mail: [email protected].
Material and Methods
Animals Male Sprague–Dawley rats weighing 150–250 g were pair-housed and maintained in standard conditions with a 12-h light/dark cycle and ad libitum access to food and water. Animal use and procedures were in accordance with the National Institutes of Health guidelines and approved by the Yale University Animal Care and Use Committees. Drug administration and Surgical procedures Animals received a single acute intraperitoneal (i.p.) injection of saline, ketamine, or Ro 25-6981 at the doses indicated. The influence of fluoxetine (10 mg/kg, i.p.) or imipramine (10 mg/kg, i.p.), administered either acutely (1 hr) or chronically (21 d), on mTOR signaling was determined for comparison with ketamine. Tissue was collected for molecular and cellular assays or animals were tested in behavioral paradigms as described below. For experiments involving central administration of inhibitors or local infusion of ketamine, rats were implanted with guide cannula (22GA) into the lateral ventricles [coordinates from bregma: -0.9 anterior/posterior (AP), -1.5 medial/lateral (ML), -3.3 dorsal/ventral (DV) from dura] or medial prefrontal cortex (coordinates from bregma: +3.2 AP, ±1.0 ML, -3.5 DV from dura). The surgical procedures were carried out under the anesthesia of Nembutal (i.p. 55mg/kg). Postoperative care consisted in peri-surgerical administration of carprofen (5 mg/kg) and topical triple antibiotic during which animals carried a dummy cannula. After a 7-day recovery period, rapamycin (100 nmol in 2 µL for ICV infusion, and 10 nmol in 1µL for PFC infusion), U0126 (10 µmol in 2µL for ICV infusion), LY294002 (10 µmol in 2µL for ICV infusion) or a vehicle (DMSO) was delivered at the rate of 0.25 µl/min with a injection cannula (26GA) protruding 0.5mm beyond the guide cannula 30 minutes before drug injections. These doses were chosen based on previous reports demonstrating effective and selective inhibition of the respective targets (1-3). The injection cannula stayed in the guide cannula for 1 minute after infusions. Animals received either acute intraperitoneal injection of ketamine, Ro 25-6981, or saline injections and were tested for behavioral and molecular assays at different time points. Electroconvulsive Shock (ECS) ECS was administered via ear clip electrodes with a pulse generator (55–60 mA, 0.5 s duration, 100 Hz frequency) to induce a generalized grand mal seizure lasting for <15 s. Acute animals received one ECS and sham groups were handled identically but received no shock. Animals were killed at the indicated times and tissue was collected for analysis of signaling proteins. Synaptosome Preparation and Western Blotting
To purify a crude synaptoneurosome, prefrontal cortex from adult rats were dissected and homogenized in a solution containing 0.32 M sucrose, 20 mM HEPES (pH 7.4), 1 mM EDTA, 1X protease inhibitor cocktail, 5 mM NaF, and 1 mM sodium vanadate. The homogenate was centrifuged for 10 min at 2,800 rpm at 4 ºC. The pellet (nuclear fraction) contains nuclei and large cell debris. The supernatant was centrifuged at 12,000 rpm for 10 min. After centrifugation, the supernatant (cytosolic fraction) was removed and the pellet (crude synaptosomal fraction) was resuspended and sonicated in protein lysis buffer (50 mM Tris-HCl (pH 7.5), 150 mM NaCl, 1% Triton X-100, 0.1% SDS, 2 mM EDTA, 1 mM NaVO3, 5 mM NaF and 1X protease inhibitor cocktail). Protein concentration was determined by BCA protein assay. For western blotting, equal amount of proteins (10-20 µg) for each sample were loaded into 10-15% SDS PAGE gel for electrophoresis. Polyvinylidene difluoride (PVDF) membranes with transferred proteins were blocked with 2% BSA in PBST (PBS + 0.1% Tween-20) for 1 hr and kept with primary antibodies overnight at 4 ºC. The following primary antibodies were used: phosphor-Akt (Ser473), total Akt, phosphor ERK (Thr202/Tyr204), total ERK, phosphor-4E-BP1, phosphor-p70S6K, total p70S6K, phosphor-mTOR, total mTOR, total ARC, total Synapsin I and PSD95, total GluR1, total GAPDH. The next day, blots were washed three times in PBST and incubated with horseradish peroxidase conjugated anti-mouse or anti-rabbit secondary antibody (1:5000 to 1:10000) for 1 hr. After final three washes with PBST, bands were detected using enhanced chemiluminescence (ECL). The blots then were incubated in the stripping buffer (2% SDS, 100mM beta-mercaptoethanol, 50mM Tris pH 6.8) for 30 min at 50-55 ºC followed by three time washes with PBST. The stripped blots were kept blocking solution for 1 hr and incubated with the primary antibody directed against total levels of the respective protein or GAPDH for loading control. Densitometric analysis of phospho- and total immunoreactivity for each protein was conducted using NIH Image J software. Immunoreactivity was normalized to saline-treated control group for each protein. Brain Slice Preparation and Electrophysiological Recordings Brain slices were prepared as previously described (4). Briefly, one day after drug treatments, rats were anesthetized (chloral hydrate, 400 mg/kg, i.p.) and brains removed and placed in ice-cold (4°C) artificial cerebrospinal fluid (ACSF) in which sucrose (252 mM) was substituted for NaCl (sucrose-ACSF). A block of tissue containing prefrontal cortex and coronal slices (400 µm) were cut in sucrose-ACSF with an oscillating-blade tissue slicer. Slices were placed in a submerged recording chamber; bath temperature was then raised to 32 °C. Known concentrations of drugs in ACSF were applied through a stopcock arrangement (~4 ml/min) to reach the slice within 7–10 s. The standard ACSF (pH 7.35), equilibrated with 95% O2/5% CO2, contained 128 mM NaCl, 3 mM KCl, 2 mM CaCl2, 2 mM MgSO4, 24 mM NaHCO3, 1.25 mM NaH2PO4, and 10 mM, d-glucose. There was recovery period of 1–2 hr before recording.
Pyramidal neurons in layer V were visualized by videomicroscopy using microscope (60x IR lens) with infrared differential interference contrast (IR/DIC). Patch pipettes (3–5 MΩ) were pulled from patch-clamp glass tubing by using a Flaming-Brown Horizontal Puller. The pipette solution contained the following: 115 mM K gluconate, 5 mM KCl, 2 mM MgCl2, 2 mM Mg-ATP, 2 mM Na2ATP, 10 mM Na2-phosphocreatine, 0.4 mM Na2GTP, and 10 mM Hepes, pH 7.33. Neurobiotin (0.3%) was added to the pipette solution to mark cells for later imaging. Whole-cell recordings were with an Axoclamp-2B amplifier. The output signal was low-pass-filtered at 3 KHz and digitized at 15 kHz; data was acquired by pClamp 9.2/Digidata 1320 software. Series resistance, which was monitored throughout the experiment, was usually between 4 and 8 MΩ. To minimize series resistance errors, cells were discarded if series resistance rose above 10 Ω. Postsynaptic currents were studied in the continuous single-electrode voltage-clamp mode (3000 Hz low-pass filter) clamped near resting potential (75 mV ± 5 mV). After completion of recording, slices were transferred to 4% paraformaldehyde (0.1 M phosphate buffer) and stored overnight at 4°C. Slices were then processed with streptavidin conjugated to Alexa 594 (1:1000) for visualization of labeled cells. Spine density analysis Labeled neurons within layer V of anterior cingulate and prelimbic mPFC were imaged with a dual-photon Ti:sapphire laser scanning system (810 nM; Mai Tai) coupled to direct detection laser scanner mounted on a microscope; a 60x (0.9 N.A.) water-immersion objective was used. For spine density analysis, Z-stacks usually consisted of 2–5 scans at high zoom at 1-µm steps in the z axis. Spine density was sampled in two zones: (i) tips of tuft branches as they approach the pial membrane and (ii) proximal tuft dendrites just distal to the bifurcation. Results were expressed in terms of spine density/10µ. Behavioral tests Forced Swim Test (FST) Animals were subjected to a FST on days 1 and 2 (5, 6). In the first test, each animal was immersed in water for 15 min, followed 24 hrs later with drug treatments, and tested with second swim 24 hrs later. The rat was placed in a Plexiglas cylinder (65 cm height, 30 cm diameter) filled with 25°C water to a height of 45 cm. After the test, animals were dried under a lamp for 30 min. All FST experiments were filmed by a camcorder and only the first 5 min of the second swim was scored offline for the duration of immobility. Immobility was defined as floating or remaining motionless without leaning against the wall of the cylinder.
Novelty-Suppressed Feeding Test (NSFT) The NSFT was performed as previously described (7, 8). Rats were food-deprived for 24 hrs and placed in an open field (76.5 cm X 76.5 cm X 40 cm, Plexiglas) with a small amount of food in the center. Animals were allowed to explore the open field for 8 min. The sessions were filmed by a camcorder from above and the latency to feed, specifically, the time it took for the animal to approach and take its first bite of the food, was recorded offline by a stopwatch in minutes. Home cage food intake was also measured as a control. Learned-Helplessness (LH) A standard LH paradigm was used as described in previous studies (9). Testing was conducted in commercial shuttle boxes divided into two equal compartments by a central barrier. A computer-operated guillotine door built into the central barrier allowed passage between compartments. On day 1, inescapable footshock (IES) was administered at one side of the shuttle box with the guillotine door closed (60 footshocks, 0.85 mA intensity, 15 sec average duration, 60 sec average intershock interval). This intensity of IES presentation has been shown to be effective in inducing helpless behavior in rats (9). Nonstressed control animals were exposed to the chambers but did not receive footshock (NS treatment). Helpless behavior was evaluated by analyzing rats’ performance in an active avoidance paradigm. Active avoidance testing consisted of 30 trials of escapable footshock (0.65 mA intensity, 35 sec maximum duration, 90 sec average intertrial interval) with the guillotine door open. Each trial used a fixed-ratio 1 schedule, during which one shuttle crossing by rats terminated the shock. Shock was terminated automatically if rats did not escape after 35 sec. A computer automatically recorded the number of escape failures. The drug delivery was conducted 24 hrs after the IES or NS treatment. The active avoidance test was conducted 24 hrs after the drug treatment.
Supplementary Figures
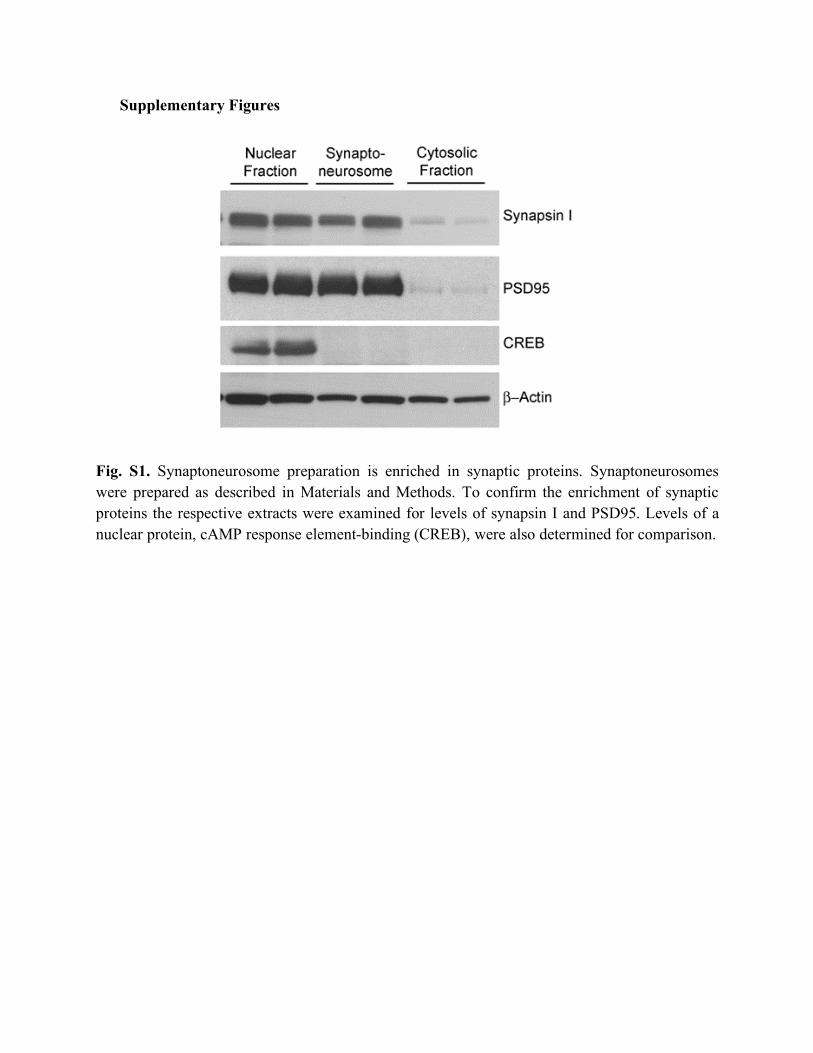
Fig. S1. Synaptoneurosome preparation is enriched in synaptic proteins. Synaptoneurosomes were prepared as described in Materials and Methods. To confirm the enrichment of synaptic proteins the respective extracts were examined for levels of synapsin I and PSD95. Levels of a nuclear protein, cAMP response element-binding (CREB), were also determined for comparison.
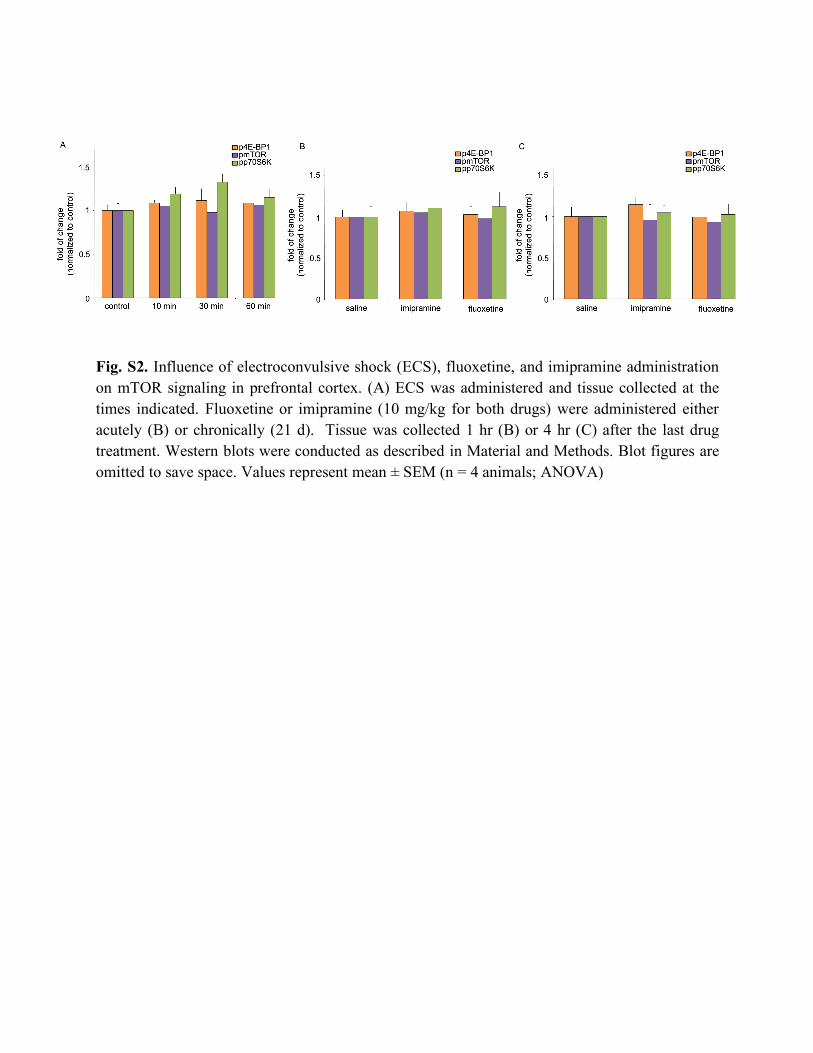
Fig. S2. Influence of electroconvulsive shock (ECS), fluoxetine, and imipramine administration on mTOR signaling in prefrontal cortex. (A) ECS was administered and tissue collected at the times indicated. Fluoxetine or imipramine (10 mg/kg for both drugs) were administered either acutely (B) or chronically (21 d). Tissue was collected 1 hr (B) or 4 hr (C) after the last drug treatment. Western blots were conducted as described in Material and Methods. Blot figures are omitted to save space. Values represent mean ± SEM (n = 4 animals; ANOVA)

Fig. S3. Ketamine transiently and dose-dependently increases phospho-ERK (pERK) and phospho-Akt (pAkt). Time course (A) and dose response (B) for ketamine-induction of p-ERK and p-Akt in synaptoneurosomes of prefrontal cortex. Ketamine (10 mg/kg, i.p.) was administered and tissue collected at the times indicated. For dose response, the indicated doses of ketamine were administered and tissue collected 1 hr later. Western blots were conducted as described in Material and Methods. Representative blots are shown, and individual bands were quantified by densitometry. Values represent mean ± SEM (n = 4 animals; * P < 0.05; ** P < 0.01, ANOVA)
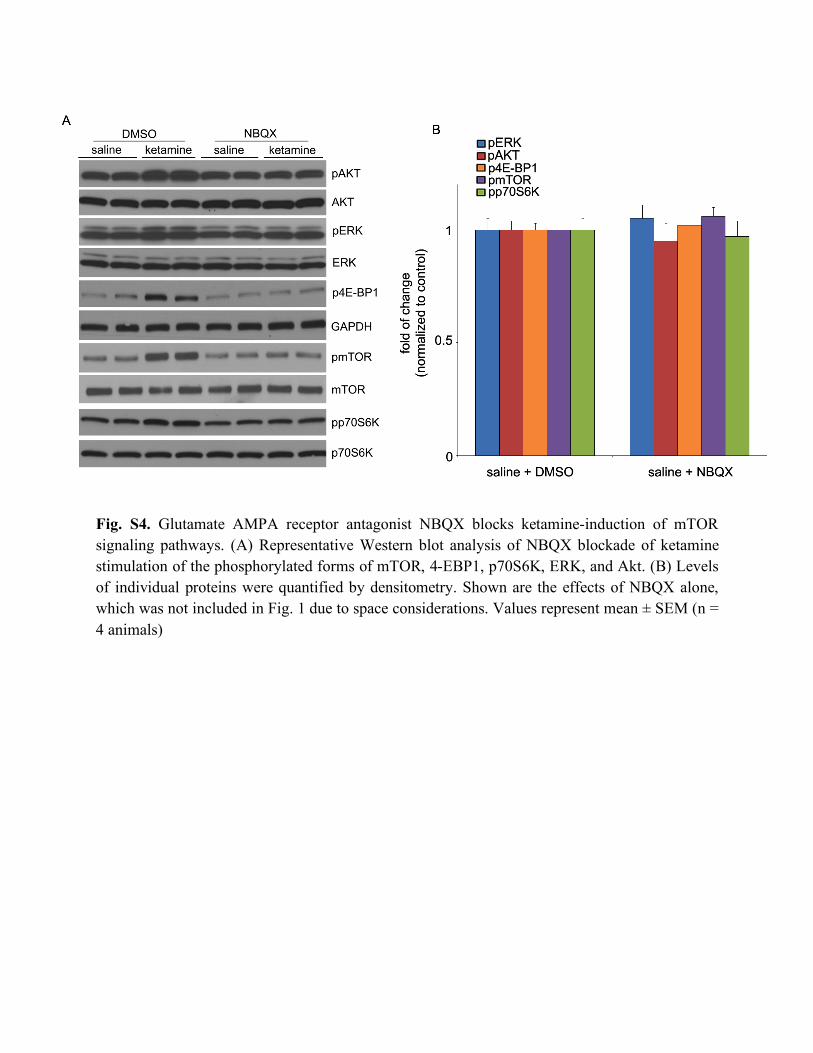
Fig. S4. Glutamate AMPA receptor antagonist NBQX blocks ketamine-induction of mTOR signaling pathways. (A) Representative Western blot analysis of NBQX blockade of ketamine stimulation of the phosphorylated forms of mTOR, 4-EBP1, p70S6K, ERK, and Akt. (B) Levels of individual proteins were quantified by densitometry. Shown are the effects of NBQX alone, which was not included in Fig. 1 due to space considerations. Values represent mean ± SEM (n = 4 animals)
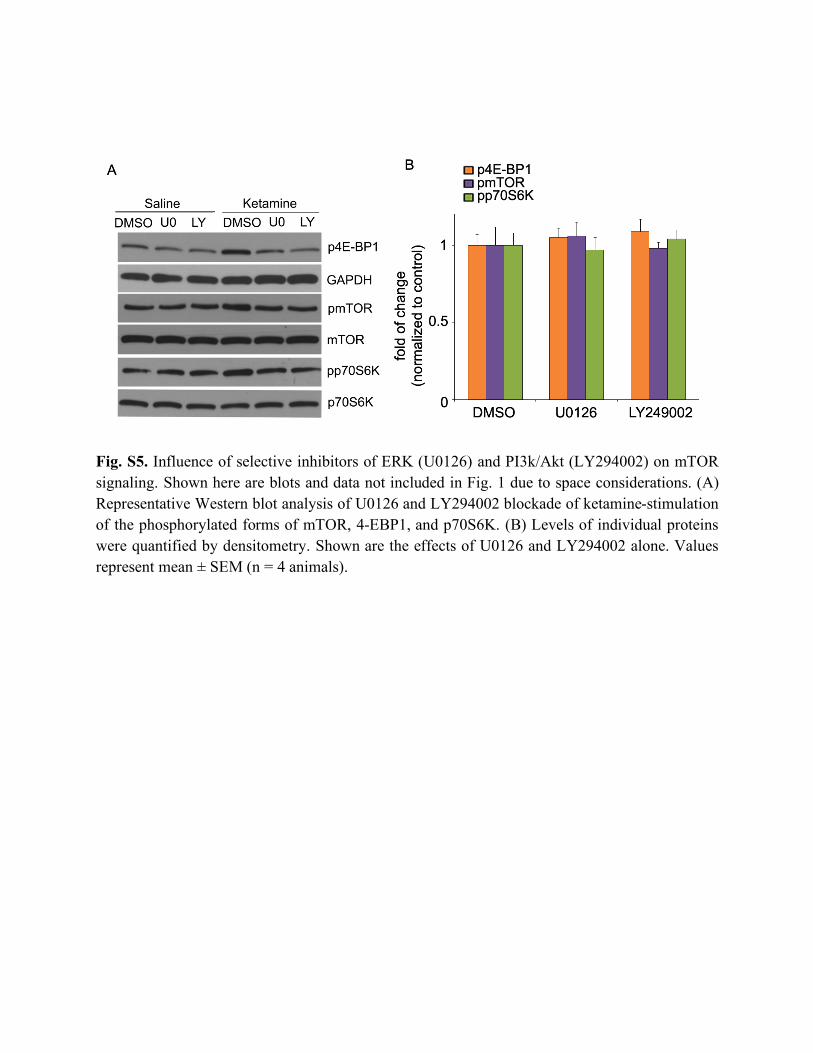
Fig. S5. Influence of selective inhibitors of ERK (U0126) and PI3k/Akt (LY294002) on mTOR signaling. Shown here are blots and data not included in Fig. 1 due to space considerations. (A) Representative Western blot analysis of U0126 and LY294002 blockade of ketamine-stimulation of the phosphorylated forms of mTOR, 4-EBP1, and p70S6K. (B) Levels of individual proteins were quantified by densitometry. Shown are the effects of U0126 and LY294002 alone. Values represent mean ± SEM (n = 4 animals).
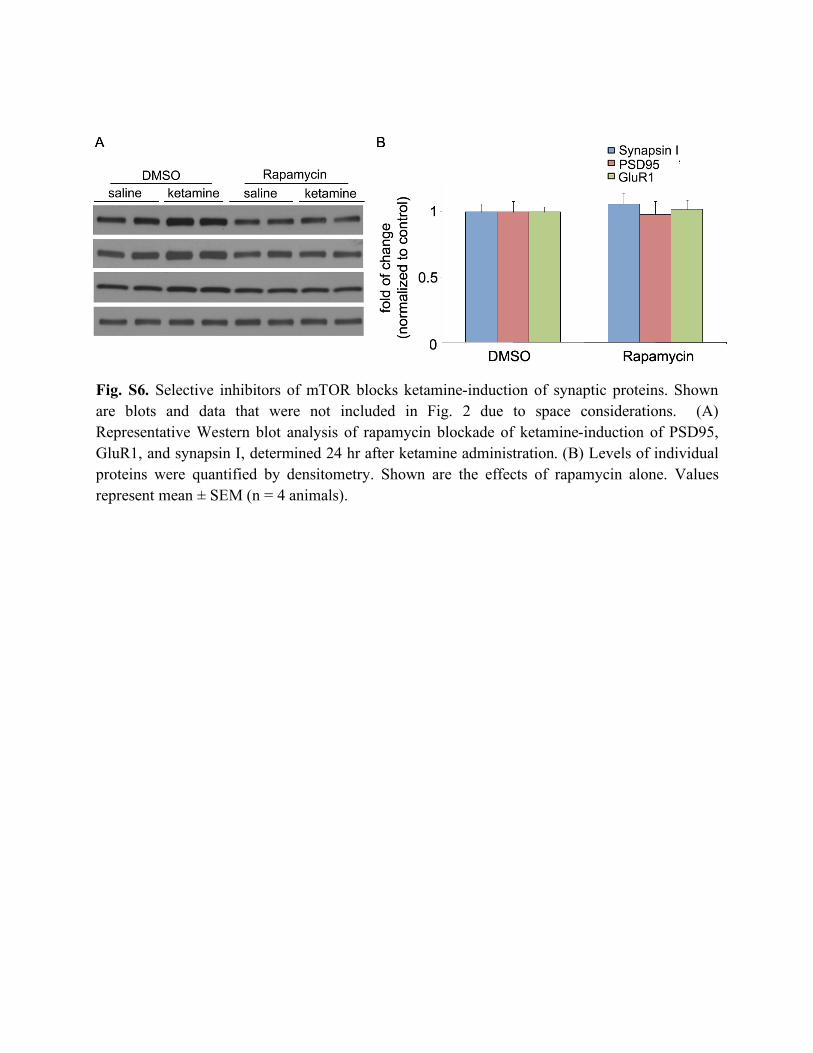
Fig. S6. Selective inhibitors of mTOR blocks ketamine-induction of synaptic proteins. Shown are blots and data that were not included in Fig. 2 due to space considerations. (A) Representative Western blot analysis of rapamycin blockade of ketamine-induction of PSD95, GluR1, and synapsin I, determined 24 hr after ketamine administration. (B) Levels of individual proteins were quantified by densitometry. Shown are the effects of rapamycin alone. Values represent mean ± SEM (n = 4 animals).
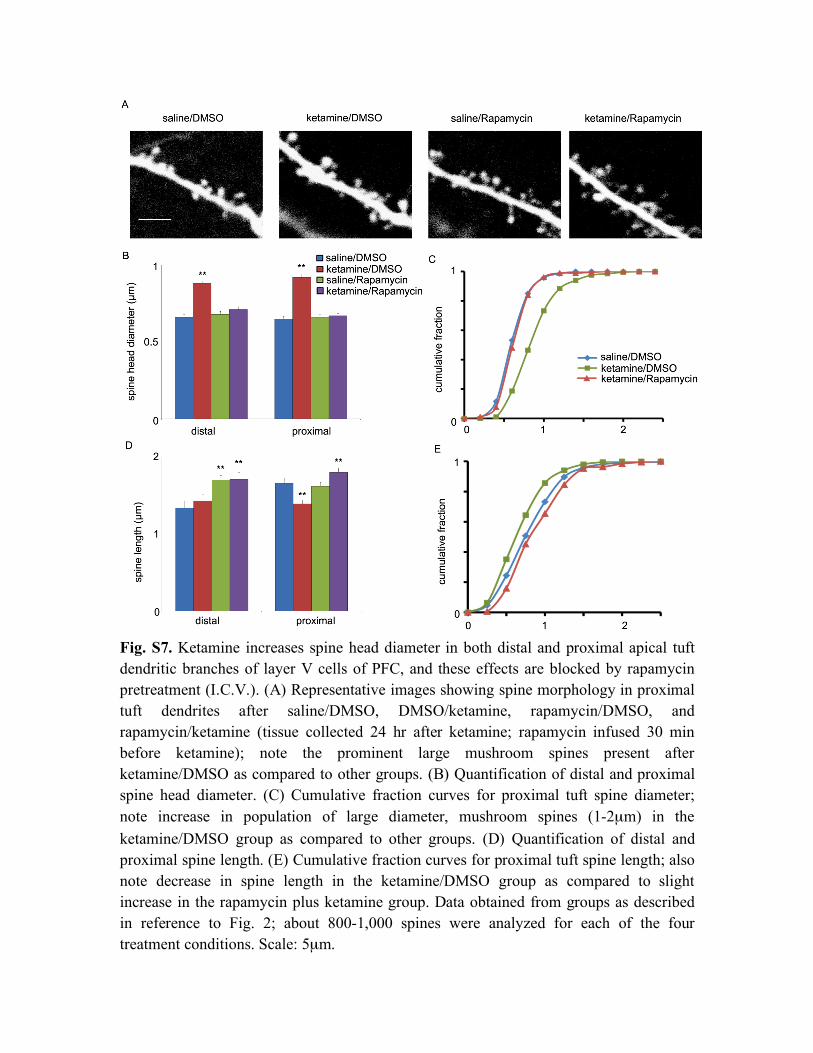
Fig. S7. Ketamine increases spine head diameter in both distal and proximal apical tuft dendritic branches of layer V cells of PFC, and these effects are blocked by rapamycin pretreatment (I.C.V.). (A) Representative images showing spine morphology in proximal tuft dendrites after saline/DMSO, DMSO/ketamine, rapamycin/DMSO, and rapamycin/ketamine (tissue collected 24 hr after ketamine; rapamycin infused 30 min before ketamine); note the prominent large mushroom spines present after ketamine/DMSO as compared to other groups. (B) Quantification of distal and proximal spine head diameter. (C) Cumulative fraction curves for proximal tuft spine diameter; note increase in population of large diameter, mushroom spines (1-2µm) in the ketamine/DMSO group as compared to other groups. (D) Quantification of distal and proximal spine length. (E) Cumulative fraction curves for proximal tuft spine length; also note decrease in spine length in the ketamine/DMSO group as compared to slight increase in the rapamycin plus ketamine group. Data obtained from groups as described in reference to Fig. 2; about 800-1,000 spines were analyzed for each of the four treatment conditions. Scale: 5µm.

Fig. S8. Ketamine reverses inescapable shock (IES)-reduction of synaptic proteins in an mTOR-dependent manner. (A) Representative Western blot showing that exposure to IES decreases Synapsin I, PSD95 and GluR1, and the ability a single dose of ketamine (24 hr after IES) to reverse this effect. This effect of ketamine is blocked by pretreatment with rapamycin (ICV, 30 min before ketamine). Tissue was collected 24 hr after ketamine administration. (B) Levels of individual proteins were quantified by densitometry. Values represent mean ± SEM (n = 4 animals; ** P < 0.01, ANOVA).
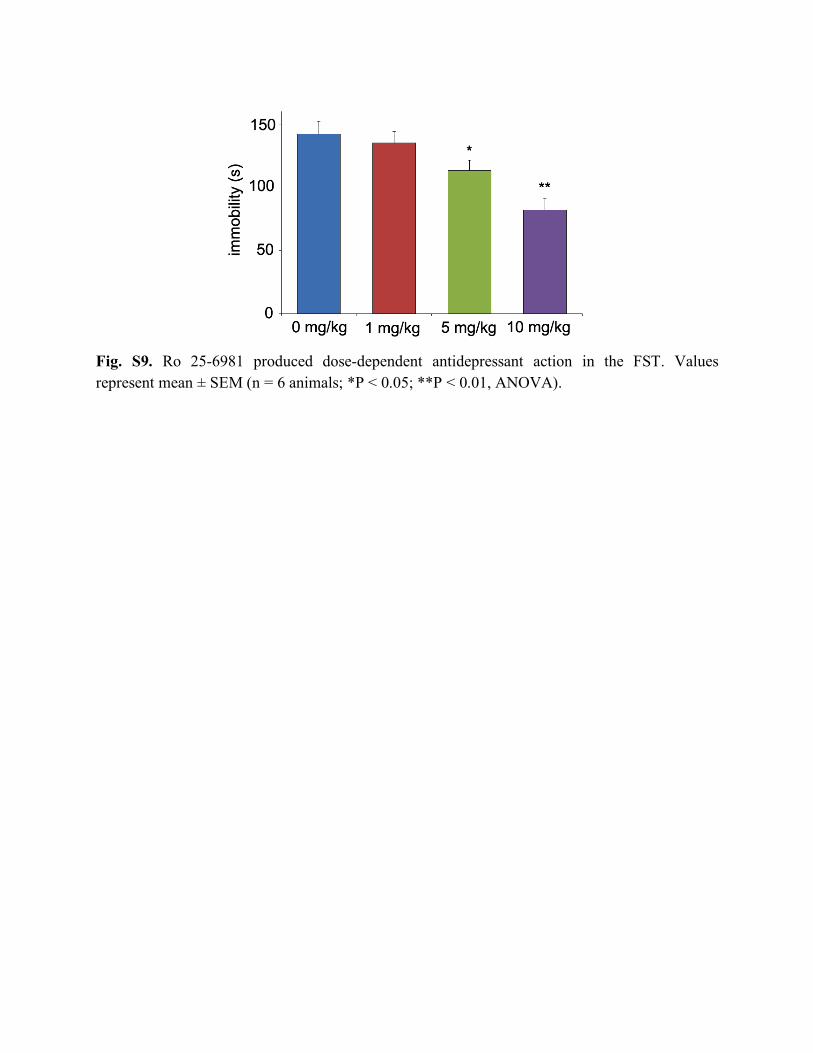
Fig. S9. Ro 25-6981 produced dose-dependent antidepressant action in the FST. Values represent mean ± SEM (n = 6 animals; *P < 0.05; **P < 0.01, ANOVA).
References
S1. K. Rahmouni et al., J Clin Invest 114, 652 (2004). S2. D. Cota et al., Science 312, 927 (2006). S3. L. Sui, J. Wang, B. M. Li, Learn Mem 15, 762 (2008). S4. R. J. Liu, G. K. Aghajanian, Proc Natl Acad Sci U S A 105, 359 (2008). S5. J. F. Cryan, A. Markou, I. Lucki, Trends Pharmacol Sci 23, 238 (2002). S6. H. D. Schmidt, R. S. Duman, Behav Pharmacol 18, 391 (2007). S7. J. L. Warner-Schmidt, R. S. Duman, Proc Natl Acad Sci U S A 104, 4647 (2007). S8. J. Greene, M. Banasr, B. Lee, J. Warner-Schmidt, R. S. Duman,
Neuropsychopharmacology 34, 2459 (2009). S9. T. Hajszan et al., Biol Psychiatry 65, 392 (2009).