rapid and accurate reverse engineering of geometry based
TRANSCRIPT

ORIGINAL ARTICLE
Rapid and accurate reverse engineering of geometrybased on a multi-sensor system
Feng Li & Andrew Peter Longstaff & Simon Fletcher &
Alan Myers
Received: 15 January 2014 /Accepted: 20 May 2014 /Published online: 1 June 2014# The Author(s) 2014. This article is published with open access at Springerlink.com
Abstract The reduction of the lead time in measurement andreverse engineering, and the increased requirements in termsof accuracy and flexibility, have resulted in a great deal ofresearch effort aimed at developing and implementing multi-sensor systems. This paper describes an effective competitiveapproach for using a tactile probe to compensate the data froma laser line scanner to perform accurate reverse engineering ofgeometric features. With the data acquired using laser scan-ning, intelligent feature recognition and segmentation algo-rithms can be exploited to extract the global surface informa-tion of the object. The tactile probe is used to re-measure thegeometric features with a small number of sampling pointsand the obtained information can be subsequently used tocompensate the point data patches which are measured bylaser scanning system. Then, the compensated point data canbe exploited for accurate reverse engineering of a CAD mod-el. The limitations of each measurement system are compen-sated by the other. Experimental results on three parts validatethe rapidity and accuracy of this multi-sensor data fusionapproach.
Keywords Multi-sensor . CMM . Laser scanning . Reverseengineering
1 Introduction
Even though tactile and optical sensing technologies arewidely used in data acquisition in measurement or reverse
engineering (RE), it has been shown that each technique hasits own characteristics and limitations, which lend them toparticular applications [1]. Existing tactile coordinate measur-ing machine (CMM) methods are widely used for industrialdimensional metrology [2], but the digitisation process onsuch systems is very time-consuming for the acquisition ofthe initial set of points on complex or freeform surfaces ifapplied to RE. Another disadvantage in the context of RE isthat a predefined pathmust be specified in advance to cover allfeatures of a workpiece that are to be probed. This requires aprior knowledge of the part, presenting an obstacle to futureautomatic RE strategies. An alternative approach is represent-ed by non-contact digitisation of surfaces based on opticaltechniques, for example laser scanning [3–5]. A laser linesensor is a non-contact probe using the triangulation methodto obtain point cloud data on a measured surface. Laser linescanning can capture dense point clouds efficiently in terms ofspeed and required human intervention. Additionally, it offersthe possibility of measuring surface points from multiplefeatures via a single and relatively simple probing path. Thismakes it a common choice in RE applications and qualitycontrol methods of freeform surfaces. However, laser linescanning is sensitive to issues that are almost irrelevant totactile-based methods such as the high influence of surfacecolour, shininess, transparency, etc. [6]. It also suffers fromproblems of digitization of any non-surface features such asslots or holes, due to occlusions and obscuration of theseartefacts. In general, laser line scanning is considered to beless accurate in comparison with tactile probing [7].
Multi-sensor systems allow the selection of discrete prob-ing or scanning methods to measure different features. Thedecision is often based on the principle that tight toleranceelements should be measured by high-precision contactmethods, while elements with looser tolerance can be scannedvia optical techniques. This combination of sensors enablesthe efficient measurement of a wider range of objects than any
F. Li (*) :A. P. Longstaff : S. Fletcher :A. MyersCentre for Precision Technologies, School of Computing &Engineering, University of Huddersfield, Queensgate,Huddersfield HD1 3DH, UKe-mail: [email protected]
Int J Adv Manuf Technol (2014) 74:369–382DOI 10.1007/s00170-014-5997-y

of the individual sensors alone and the limitations of eachsystem are compensated by the other.
Durrant-Whyte [8] classifies physical sensor configurationin a multi-sensor data fusion system into three categories asfollows:
& A competitive sensor configuration is one where the sen-sors are configured to measure the same feature indepen-dently in order to reduce the measurement uncertainty andto avoid erroneous measurements.
& A complementary sensor configuration is one where thesensors do not directly depend on each other but can becombined in order to give more complete informationabout the object.
& A cooperative sensor configuration uses the informationprovided by two or more independent inhomogeneoussensors to derive data that would not be available fromany sensor individually.
In this paper, we propose an effective competitive integra-tion approach for the compensation of a laser line scanner byusing a tactile probe to perform the reverse engineering ofgeometric features. With the coordinate data acquired usingthe laser scanning, intelligent feature recognition algorithmscan be applied to extract the geometric elements of the object.These key features of elements can be re-measured by theslower tactile probe with a small number of points, and thenthe geometric elements can be described by mathematical andnumerical methods. The obtained information can subse-quently be used to compensate the comprehensive, lower-accuracy point cloud data measured by the laser line sensor.
The remainder of this paper is organized as follows:Section 2 surveys the prior work in multi-sensor coordinatemeasurement, Section 3 gives a brief introduction on datasegmentation methods and Section 4 introduces the leastsquares best fitting methods for the four most common geo-metric features. The proposed method in this paper is de-scribed in Section 5 while Section 6 presents the experimentalresults. Finally, the conclusions of this piece of work anddiscussion of possible future direction is presented inSection 7.
2 Literature review
To meet the requirement of both high-speed and high-accuracy 3D measurement for quality control or RE applica-tions, multi-sensor measuring systems have been developed tomeasure, analyse and rebuild a CAD model of the objects.When using RE methods to reproduce a given shape, thetolerance distribution of the scanned part must be considered[9]. Bradley and Chan [10] and Zexiao et al. [11] each presenta complementary sensor approach for RE. The optical sensor
is applied to scan the profile of a part from different views,while the tactile probe is used to measure the edge and keyfeatures.
Hybrid contact-optical coordinate measuring systems areeach designed by Chan [12], Carbone [13], Tzung-Sz [14] andSladek et al. [15] where the obtained information digitized byan optical sensor is used to guide the touch probe for re-measuring the sample surfaces. The presented systems arecooperative integrations where optical sensors acquire theglobal shape information of objects to guide the touch probesfor automatic point sensing. They are, however, limited todealing with workpieces with relatively simple features.
Only limited research on competitive integration of hybridcontact-optical sensors has been found. Huang and Qian [16]develop a dynamic approach for integrating a laser scannerand a touch probe to improve the measurement speed andquality. A part is first scanned by the laser scanner to capturethe overall shape. It is then probed by a tactile sensor wherethe probing positions are determined dynamically to reducethe measurement uncertainty according to the scanned data.They use a Kalman filter to fuse the data and to incrementallyupdate the surface model based on the dynamically probedpoints. More recently, Bešić et al. [17] introduce a method forimproving the output of a CMM-mounted laser line scannerfor measurement applications. The improvement is achievedby using a median filter to reduce the laser scanner’s randomerror and by simultaneously combining with the reliable butslow tactile probing. The filtered point data is used to estimatethe form deviation of the inspected elements while a fewpoints obtained by the tactile probe are used to compensatefor errors in the point cloud position. Current commercialsystems or software often only focus on processing pointsdata from individual sensors or techniques; the issue of whereand how to effectively and efficiently improve the accuracy offused data is still a challenge. In particular, to the authors’ bestknowledge, no relevant research has provided a method toefficiently handle integrated measurement data in RE to usesparse accurate measurement information to improve the over-all measurement accuracy for RE applications.
3 Point cloud data segmentation
After a part is scanned, the acquired point cloud data should bedivided into several smooth regions for surface fitting pur-poses. This is called the segmentation process. Segmentationis the problem of grouping the points in the original datasetinto subsets, each of which logically belong to a single prim-itive surface. A segmentation that extracts the edges andpartitions the 3D point data plays an important role in fittingsurface patches and applying the measured data to the REprocess. Considerable research activities in shape segmenta-tion have been explored in recent years. The methods for
370 Int J Adv Manuf Technol (2014) 74:369–382
segmenting 3D data in engineering applications can be gen-erally classified into three types: edge-based [18–21], region-growing [22–24] and hybrid-based [25–27] methods. The datasets are segmented into point-based data patches or polygon-based data patches by using different methods. As the discretepoint data is much easier to modify in comparison withpolyhedral surface, this work only considers the segmentationmethods that are able to generate the outputs for point-baseddata patches.
Woo et al. [26] developed an octree approach forsegmenting the scan data. First, the 3D non-uniformgrids are generated by calculating the normal of eachpoint. Then points are assigned in the subdivided cellswith different levels in size. The edge points are ex-tracted by selecting the points contained in the small-sized cells. Finally, the segmented point-based datapatches are obtained after these edge points have beenremoved. This method is able to effectively extract edgeneighbourhood points and group data points and wastherefore selected for performing the data segmentationin this paper.
4 Least squares best fit geometric elements
After the segmentation process, the original point set is divid-ed into subsets which can be broadly classified into twocategories: geometric elements and freeform surfaces. Thevarious geometries that are used to reconstruct a CAD modelfor RE applications and studied in this paper are planes,spheres, cylinders and cones.
4.1 Parameterization
(a) Parameterization of planeA space plane can be specified by a point (xo,yo,zo) on
the plane and the direction cosines (a,b,c) of the normalto the plane.
a x − xoð Þ þ b y − yoð Þ þ c z − zoð Þ ¼ 0 ð1Þ
xo, yo, zo, a, b and c are the desired parameters.
(b) Parameterization of sphereA sphere is specified by its centre (xo,yo,zo) and radius
r. Any point (xi,yi,zi) on the sphere satisfies the equation
x − xoð Þ2 þ y − yoð Þ2 þ z − zoð Þ2 ¼ r2 ð2Þ
Equation (2) can be simplified as
x2 þ y2 þ z2 − ax − ay − czþ ρ ¼ 0 ð3Þ
where a=2xo, b=2yo, c=2zo and ρ=xo2+yo
2+zo2−r2.
a, b, c and ρ are the desired parameters.(c) Parameterization of cylinder
A cylinder can be specified by a point (xo,yo,zo) on itsaxis; a vector (a,b,c) pointing along the axis and itsradius, r.
For a near vertical axis, we can set c=1. Also, if xo andyo are known, then zo can be determined as
zo ¼ −axo−byo ð4Þ
(d) Parameterization of coneA cone can be specified by a point (xo,yo,zo) on its
axis; a vector (a,b,c) pointing along the axis and the apexsemi-angle ϕ.
For a nearly vertical cone, we set c=1 and then axiszo=−axo−byo.
4.2 Least squares best fitting methods
The algorithms for fitting using a least squares method forvarious geometric elements have been studied by severalauthors [28–30]. For linear geometries such as lines andplanes, the parameters can be solved by linear least squaresmethods directly. For nonlinear geometries such as spheres,cylinders and cones, the Levenberg-Marquardt algorithm [30]and Gauss-Newton algorithm [31] have been widely used.Since the least squares best fit geometric elements algorithmsare fully detailed by Forbes [28], his algorithms are exploitedas fitting methods in this paper.
When applying the Levenberg-Marquardt algorithm orGauss-Newton algorithm to fit cylinders and cones, goodstarting values are necessary for fast convergence of thealgorithm and for obtaining the global optimal solution. Inthis paper, the tactile probe on CMM is used to scan twocircles perpendicular to the axis (see Fig. 1). By least squaresbest fitting both 3D circles, the initial estimates for fittingcylinders and cones can be obtained. Then the data set isrotated by applying a 3×3 matrix, U, to align the cylinder orcone along the z-axis (see Fig. 1) to find the desiredparameters.
5 Description of the proposed method
When digitizing an object, all surface geometry is capturedincluding imperfections caused by the manufacturing processand any damage the part may have suffered as well as noiseintroduced by the measurement process. Typically, the partwill be manually remodelled to capture the design intent and
Int J Adv Manuf Technol (2014) 74:369–382 371

to disregard imperfections. There are some reasons for this.Firstly, modelling every defect could be time consuming andtherefore expensive. Secondly, one of the main goals of RE isto reconstruct a CAD model of the workpiece. Therefore, theaim is to create a ‘more perfect’ part representing true designintent rather than simply copying the original product. Thismay require a detailed understanding of the function,
depending on the part being modelled, because only thencan the design intent be correctly interpreted.
After the multi-sensor coordinate system calibration, theoptical scanner and tactile probe measure in nominally thesame absolute coordinate system. However, two data setsmeasured by different sensors are unlikely to coincide abso-lutely, which means there will be a measurement difference
(a) Cylinder (b) Cone
Fig. 1 Points data translation androtation: a cylinder, b cone
Fig. 2 Schematic of the proposed method
372 Int J Adv Manuf Technol (2014) 74:369–382

between the tactile and optical sensor. The final aim of RE isto obtain a comprehensive, accurate CAD reconstructionmodel. To achieve this goal, a data compensation method isproposed to enhance the measurement accuracy of the pointcloud data from the optical scanner. The proposed method istargeted at manufacturing problems where a reverseengineered model with accuracy better than 50 μm is needed.Naturally, the scanned data points must be representative ofthe geometric elements concerned.
5.1 Proposed method
After data segmentation, the data points are grouped into twotypes of data sets: geometric elements and freeform surfaces.The elements which include planes, spheres, cylinders andcones can represent 85 % of machined objects [32]. Due totheir simple mathematical description and ability to model alarge percentage of manufacture objects, they are widely used
in various modelling systems [33, 34]. In RE, the accuracy ofthe final CAD model depends on the measured point data. Asmall amount of discrete point data measured by the highaccuracy, but relatively slow tactile probe, can be used tocompensate the densely scanned data patches that have beenmeasured by the fast, but relatively low accuracy opticalmethod. The specific method follows these logical steps:
(a) Overview of Nikon LK V 15.10.8 HA CMM
(b) Renishaw SP25M probe
and SH25-1 stylus holder
(c) Nikon LC15Dx laser
scanner
Fig. 3 Nikon LK V 15.10.8 HA high accuracy ceramic bridge CMM. a Overview of Nikon LK V 15.10.8 HA CMM, b Renishaw SP25M probe andSH25-1 stylus holder and c Nikon LC15Dx laser scanner
Table 1 Specifications of the Renishaw SP25M probe and NikonLC15Dx laser scanner
Parameter RenishawSP25M probe
Nikon LC15Dxlaser scanner
MPEE (ISO 10360–2:2009) 1.6+L/375 μm 3.6+L/375 μm
Multi-stylus test (MPEAL) 6 μm –
Resolution <0.1 μm 22 μm
Data acquisition (approx.) 4~5 point/s 70,000 points/s
Int J Adv Manuf Technol (2014) 74:369–382 373

1. Use the laser scanner to digitize the entire surface of part,and then exploit a segmentation algorithm, as described inSection 3, to group the point data patches each belongingto a different surface patches; these data patches will becompensated in step 3.
2. Use the tactile probe to re-measure tight-toleranced geo-metric features with a small number of points to minimizethe temporal cost. Then use the least squares method tobest fit these geometric elements to derive the parametersbased on mathematical and numerical principles.
(a) X coordinates (b) Y coordinates
(c) Z coordinates (d) Sphere radius
(f) Standard deviations
Fig. 4 Fitting results of different methods. a X coordinates, b Y coordinates, c Z coordinates, d sphere radius and f standard deviations
374 Int J Adv Manuf Technol (2014) 74:369–382

3. Substitute the x and y coordinates of each point measuredby the laser scanner into the parametric equations(Section 4.1), then the new z coordinate can be updated.Use the x, y, and new z coordinates as new point datacoordinates to build point data sets. Then the compensateddata sets are exploited to reconstruct a CAD model.
Description schematic of the proposed method is shown inFig. 2.
5.2 Algorithms description
The detailed algorithms for compensation of different geomet-ric features are presented as follows:
(a) Plane compensationAccording to Eq. (1), the parameters to be solved are
a, b, c and xo, yo, zo. Here, we define d=−(axo+byo+czo).
According to our proposed method, the new z coordi-nate can be derived by:
zN ¼ −ax − by − dð Þ=c ð5Þ
To compare the normal of the plane, we let d=1.
(b) Sphere compensationAccording to Eq. (2), the parameters to be solved are
xo, yo, zo and r. First, we translate a copy of the data sothat the centre of the sphere is at the origin.
xi; yi; xið Þ ¼ xi; yi; xið Þ− xo; zo; yoð Þ ð6Þ
Then the value of the new z coordinate can be derivedby
zNi ¼ �ffiffiffiffiffiffiffiffiffiffiffiffiffiffiffiffiffiffiffiffir2−xi2−yi2
pð7Þ
Part B to be measured (b) Data measured from laser scanner
Points measured from tactile probe (d) Merged data
(a)
(c)
Fig. 5 Points data measured using multi-sensor system. a Part B to be measured, b data measured from laser scanner, c points measured from tactileprobe and d merged data
Int J Adv Manuf Technol (2014) 74:369–382 375

Here, two values of zN are obtained that will fit thesphere. To determine which one is needed, the value ofz(i) is determined to be positive or negative:
if z ið Þ > 0zN ið Þ ¼ zN ið Þj j;elsezN ið Þ ¼ − zN ið Þj j;end
In some cases, the solving results of zN includesimaginary parts, which means that the original pointsare beyond the scope of the sphere to be fitted. We haveto delete those points in the new point data coordinates.In fact, this is an effective way to exclude noisy data.
Finally, the origin is translated by an amount equaland opposite to the vector in Eq. 6, above.
(c) Cylinder compensationFor cylinder and cone compensation, the proposed
method is inverse shifting of the data so that the point(xo,yo,zo) on the axis lies at the origin. Inverse rotation ofthe data set is then performed using the transpose ofrotation matrix U which rotates (a, b, c) to coincide withz-axis. Again, we will translate and transform the databack after compensation. Then the value of the new yNcoordinate can be obtained by
yNi ¼ �ffiffiffiffiffiffiffiffiffiffiffiffir2−xi2
pð8Þ
The method for determining the positive and negativeof yNi is much the same as that for spheres.
(d) Cone compensationAfter data set translation and rotation, the value of the
new yNi coordinate of cone can be calculated by
yNi ¼ �ffiffiffiffiffiffiffiffiffiffiffiffiffiffiffiffiffiffiffiffiffiffiffiffir−kzið Þ2−xi2
qð9Þ
where k=tan(ϕ).
Plane (b) Sphere
(c) Cylinder (d) Cone
(a)
Fig. 6 Point cloud data segmentation: a plane, b sphere, c cylinder and d cone
376 Int J Adv Manuf Technol (2014) 74:369–382
6 Experimental implementation
In this section, the feasibility and robustness of theproposed approach are first examined. Then a part withcommon geometric features is selected to test the intro-duced method after data segmentation. Finally, a work-piece that contains typical geometric features andfreeform characteristics is investigated to further verifythe proposed method.
The multi-sensor measurement system used for dataacquisition is a Nikon LK V 15.10.8 HA high-accuracyceramic bridge CMM (see Fig. 3a). It operates in atemperature-controlled room, typical of normal CMMapplications, with the environmental temperature con-trolled at 20±0.2 °C.
The multi-sensor system integrates two different sensors: aRenishaw SP25M tactile probe (Fig. 3b) and a NikonLC15Dx single-stripe laser scanner (Fig. 3c). The two sensorsintegrate with the CMM via the Renishaw PH10MQ articu-lating motorized probe head; only one sensor can operate atany given time. The software platform CAMIO7 multi-sensorCMM metrology software is used for measurement planningand data acquisition.
The specifications of the Renishaw SP25M scanning probeand Nikon LC15Dx laser scanner are listed in Table 1.
6.1 Example one
In example one, a sphere (part A) with nominal radius of12.7 mm is used to test the robustness and feasibility of theintroduced method. The sphere is made of solid polypropyl-ene with a matt finish and has good roundness and sphericity.Part A is scanned by the LC15Dx laser scanner five times andSP25M touch probe three times, separately. During laserscanning, the distance between the surface of the artefactand the laser scanner in various orientations is kept constantby using the optimal distance to minimize influence of thescan depth to measurement error. The original point datascanned by the laser sensor is compensated by using data
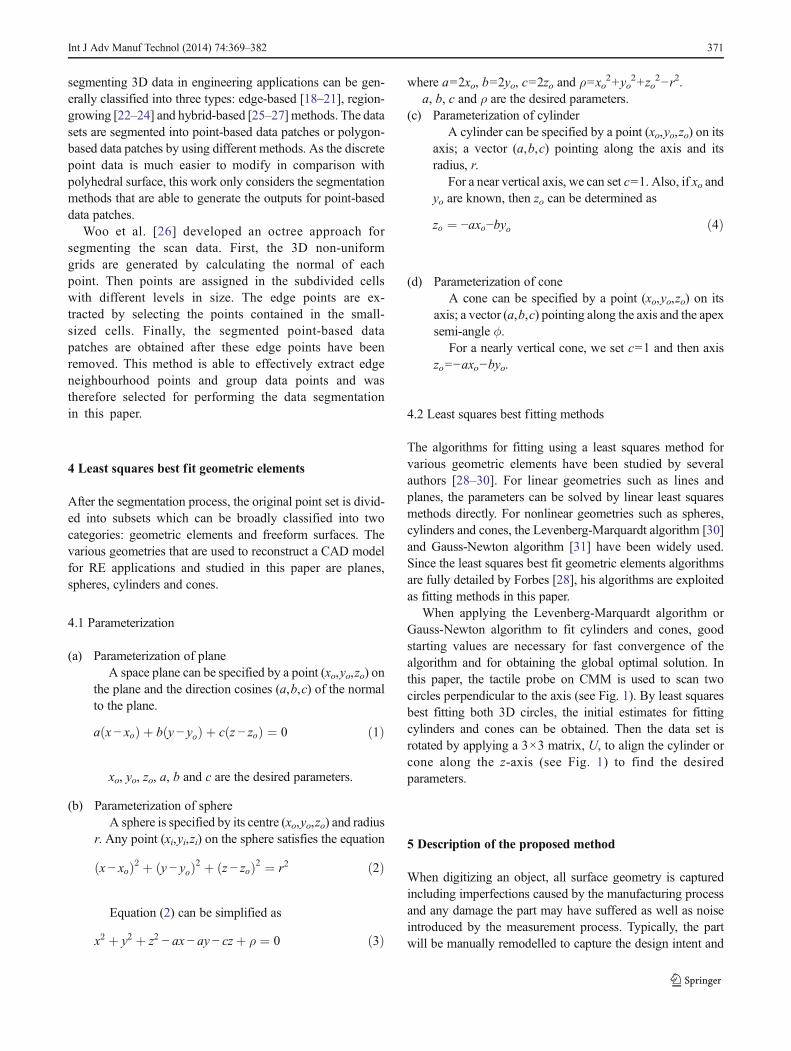
Table 2 Fitting results using dif-ferent methods (dimensions inmm)
Feature Parameter Laser Tactile robe(MIN points)
Tactile probe(more points)
Compensated
Plane Points 59,064 60 1,031 59,064
a −0.0001 0.0000 0.0000 0.0000
b 0.0000 0.0000 0.0000 0.0000
c 1.0000 1.0000 1.0000 1.0000
d 1 1 1 1
Std Dev 1.278×10⁻² 7.4×10⁻⁴ 6.8×10⁻⁴ 0
Sphere Points 45,071 40 930 45,071
xo 0.0061 0.0022 0.0025 0.0027
yo 0.0090 −0.0032 −0.0031 −0.0031zo 51.9679 51.9717 51.9719 51.9716
r 12.0080 12.0006 12.0006 12.0009
Std Dev 9.62×10⁻³ 7.1×10⁻⁴ 6.7×10⁻⁴ 2.67×10⁻³
Cylinder Points 69,426 70 1,270 69,426
a −0.0001 0.0000 0.0000 0.0000
b 0.0001 0.0001 0.0001 0.0001
c 1.0000 1.0000 1.0000 1.0000
r 50.0175 50.0106 50.0107 50.0108
Std Dev 1.448×10⁻² 8.4×10⁻⁴ 8.1×10⁻⁴ 1.37×10⁻³
Cone Points 69,030 70 1,503 69,030
a −0.0001 −0.0002 −0.0003 −0.0001b 0.0001 0.0005 0.0006 0.0006
c 1.0000 1.0000 1.0000 1.0000
ϕ 29.9982 29.9976 29.9975 29.9979
Std Dev 1.522×10⁻² 9.2×10⁻⁴ 1.25×10⁻³ 1.89×10⁻³
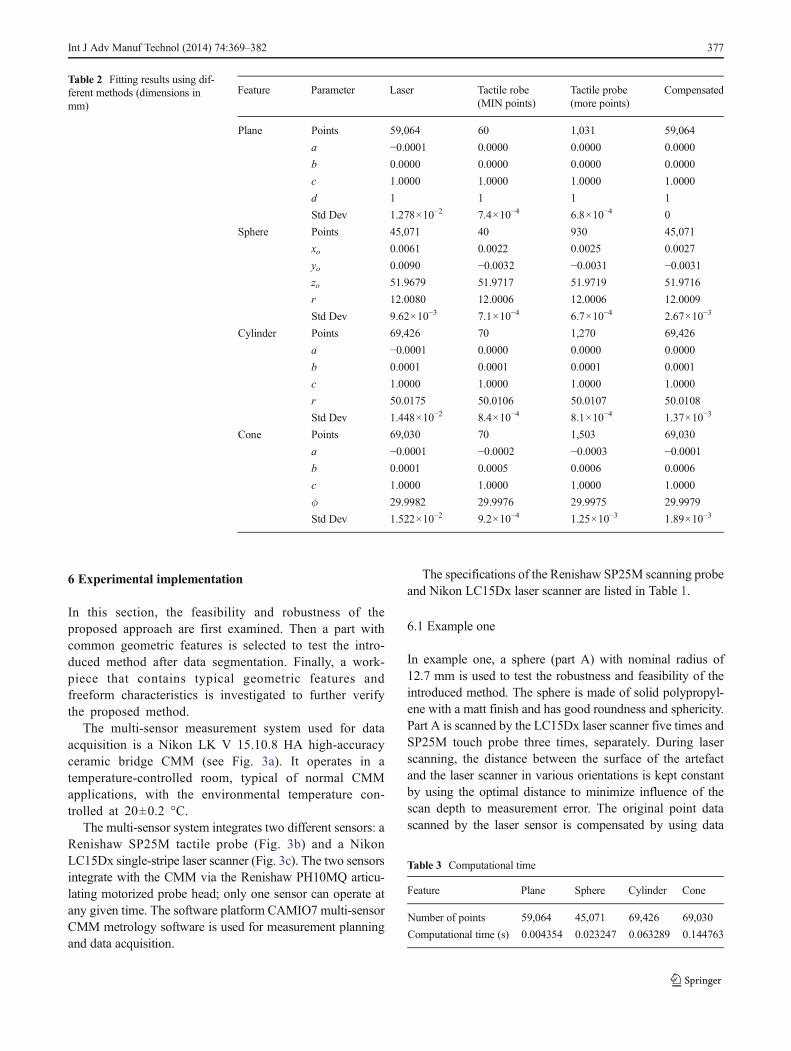
Table 3 Computational time
Feature Plane Sphere Cylinder Cone
Number of points 59,064 45,071 69,426 69,030
Computational time (s) 0.004354 0.023247 0.063289 0.144763
Int J Adv Manuf Technol (2014) 74:369–382 377

measured by the tactile probe. Figure 4 shows the coordinatesof the sphere centre, radii and standard deviations of part Aseparately calculated from the laser, tactile probe and com-pensated data. The fitting results show high stability of thedata measured from tactile probe. The first set of data mea-sured by the tactile probe is used to compensate the datascanned by laser sensor separately. We can see systematicerrors between laser sensor and tactile sensor significant de-crease after the data set is compensated.
6.2 Example two
Part B (see Fig. 5a) is made of aluminium alloy 5083 anddesigned with only geometric features. After data segmenta-tion, these geometric elements are exploited to prove theconcept proposed in this paper. The elements on the partsinclude most typical of geometric features: plane, sphere,cylinder and cone. The workpiece is located on the bed ofthe CMM and fixed by clamps when performing themeasurement.
The laser sensor is used for surface global informationacquisition. Because of the reflection of the surface, the inten-sity of the laser is changed to scan the shiny part. The views ofthe laser scanner are adjusted by the Renishaw PH10MQprobe head to cover the full surface. A trial version of thecommercial software, Geomagic Wrap 2013, is used forperforming the data pre-process tasks of data denoising andreduction, etc. The data scanned by laser and tactile probe areshown in Fig. 5b, c, respectively. Figure 5d displays mergedand organized point cloud data.
The data measured by the laser scanner is segmented by thedescribed feature recognition algorithm (see Fig. 6). Then thelarge amounts of unordered points that belong to differentgeometric element patches can be compensated by a smallamount of point data using the tactile probe.
There is a desire to determine how many points must becaptured by the tactile probe to achieve the desired represen-tation of geometric elements. Traditionally, the number ofsampled points is required to be ten times the number ofparameters in the model [35]. However, in this experiment,we take more sampled points and compare the fitting results.The fitting results for different features using differentmethods and their standard deviations are listed in Table 2.
All the computing tasks are operated on a desktop comput-er with an AMD Phenom II×4970 3.5 GHz processor and8 GB RAM. Table 3 presents the computing time of dataupdating for different features.
The meshed surfaces before and after compensation areillustrated in Fig. 7a, b, respectively. From above fitting resultswe can draw several conclusions:
1. It has been shown that ten times the number of parametersis a sufficient number of measurement points using the
tactile probe, considering its measurement uncertainty.This result is consistent with the conclusion introducedin literature [35].
2. After compensation, the quality of the point data mea-sured from the optical sensor has been greatly improved(see Table 2 and Fig. 7). In theory, the compensated datahas the same accuracy as the data measured from thetactile probe.
3. The compensated data is more robust and more likely tobe identified by recognition algorithms, and is thereforemore conducive to process in the next step of modelreconstruction.
6.3 Example three
Part C is a more complex housing (Fig. 8a) which is modifiedfrom literature [36]. This workpiece has a shiny metal surface.
Mesh surface before compensation
(b)Mesh surface after compensation
(a)
Fig. 7 Mesh surface. a Mesh surface before compensation and b meshsurface after compensation
378 Int J Adv Manuf Technol (2014) 74:369–382

It also contains the typical geometric features and freeformcharacteristic.
The laser sensor is used to scan the global informationof the surface. Two poses of the part are required in orderto acquire entirely the point cloud data from the top andthe bottom of the workpiece. The datum plane and tighttolerance features need to be measured more accurately,and the inner holes are difficult to scan by laser scannerbecause of occlusion. Therefore, an SH25-1 stylus holderwith a M3 40 mm stylus carried by the SP25M tactileprobe is exploited to measure these features (see Fig. 8a).First of all, the top and bottom surface point data wereregistered to the same coordinate system; the methodproposed in reference [37] is exploited to align the twopieces of data. The points scanned by the laser scannerand tactile probe are shown in Fig. 8b, c, respectively. Allpoint cloud data is scanned manually by the operator.Table 4 presents the numbers of points of raw data,scanning views and measurement time.
After data segmentation and compensation, a reconstructedCAD model was rebuilt in the SolidWorks 2013 environmentas shown in Fig. 8d (both uncompensated and compensatedmodels are visually the same).
(a) Measurement speed comparison for sensorsIn the digitizing process for part C, the actual scanning
time is 19 min 19 s and the tactile probing time is 14 min55 s, therefore the total measuring time is 34 min 14 s(Table 4).
(a) Part C and Tactile probing plan (b) Points data scanned from laser
Data captured by tactile probe CAD model constructed in SolidWorks(c) (d)
Fig. 8 RE of part C. a Part C and tactile probing plan, b points data scanned from laser, c data captured by tactile probe, d CAD model constructed inSolidWorks
Table 4 Numbers of points and scanning time
Methods Views Number of points Measuringtime (min:s)
Laser–top 21 6,573,959 12:04
Laser–bottom 12 3,840,678 7:15
Tactile probe – 4,143 14:55
Int J Adv Manuf Technol (2014) 74:369–382 379

Finally 105,122 points scanned by laser sensor areretained after data reduction to generate a satisfactorymesh surface for CAD model reconstruction, and 2,019points measured from tactile probe are exploited to com-pensate the laser scanned data.
In comparison, if we assume that the tactile probesenses the part at the speed of 4–5 points per second,based on the scanning speed presented in Table 4, thetime to digitize the part using only a tactile methodwouldbe a minimum of 6 h. The integration of the laser scannerand CMM therefore leads to much faster measurementthan the tactile method alone.
(b) CAD model accuracy comparisonTo validate the final reconstructed CAD model qual-
ity, we use the root mean square (RMS) error distance tocheck the accuracy of the constructed CAD model SCAD.However, in practice, the actual surface may be difficult
or even impossible to obtain. A large number of accurateCMM probing points can be exploited as the referencepoints on the actual surface. The RMS can then beobtained by
RMS ¼
ffiffiffiffiffiffiffiffiffiffiffiffiffiffiffiffiffiffiffiffiffiffiffiffiffiffiffiffiffiffiffiffiffiffiffiXi¼1
N
d pTi ; pSi
� �� �2
N
vuuutð10Þ
where piT is the sampled point using CMM tactile probe, N is
the number of those sampled points, piS is the projected point
to the constructed surface of CAD model SCAD and d(piT,pi
S) isthe distance between pi
T and piS.
Both uncompensated and compensated models are used asthe nominal geometry for CMM measurement using a tactileprobe. In each case, the same scanning path was used. In thefirst instance, the Nikon CMM with Renishaw SP25M probeused to perform the RE measurements was used to evaluatethe accuracy of bothmodels. Figure 9 presents the comparisonbetween probed points and final reconstructed CAD modelsbefore and after compensation. To further examine perfor-mance of the reconstructed CAD model, an independent,high-accuracy Zeiss PRISMO CMM (MPEE=1.9+L/300 μm (ISO 10360–2:2009)) was used. Table 5 shows theRMS comparisons of reconstructed CAD models for bothsystems.We can see that both results indicate that the accuracyof the geometric elements of reconstructed CAD model hasbeen greatly improved after compensation.
7 Discussion, conclusion and future work
A new competitive approach for rapid and accuratereverse engineering of geometric features from multi-sensor system based on geometric algebra approach isproposed. A set of programs based on the MatlabR2011b platform has been developed for the verificationof the proposed method. Then the compensated data isprocessed to rebuild a CAD model in the SolidWorks2013 environment.
Other existing cooperative multi-sensor configuration ap-proaches only use optical sensors to capture the global surface
CAD model before compensation
CAD model after compensation
(a)
(b)
Fig. 9 The comparison between probed points and reconstructed CADmodel. a CAD model before compensation and b CAD model aftercompensation
Table 5 RMS comparison
RMS (mm) Beforecompensation
Aftercompensation
Nikon CMM with SP25M probe 0.053 0.007
Zeiss PRISMO system 0.045 0.007
380 Int J Adv Manuf Technol (2014) 74:369–382

information of the object and then guide the slower tactileprobe to digitize the surface. In the presented method, themultiple data sets are acquired by laser scanning and tactileprobing in both competitive and complementary multi-sensorconfigurations. With the point cloud data acquired using alaser scanner, intelligent feature recognition and segmentationalgorithms can be applied to extract and segment the pointcloud data. Then, the tactile probe is used to re-measure theholes, which are difficult to measure by laser sensor, and tighttolerance geometric features with a small number of samplingpoints. The obtained information can be subsequently used tocompensate the point data patches which are measured bylaser sensor.
The results of the three case-study experiments show thatthe algorithms provide satisfactory performance and the vastamounts of unordered points measured from optical sensor areconverted to orderly and more accurate point data after com-pensation. In addition, it usually needs several hours to fullydigitize a workpiece by using a tactile sensing device. How-ever, in the presented approach, the total measurement time isdrastically reduced. A case strictly (part C) would take 6 h todigitize using a tactile probe, but only about 30 min using theproposed method, an improvement of 90 % which greatlyimproves measurement efficiency without losing accuracy.
These results compare well to other competitive methods.Huang and Qian’s approach [16] can effectively save mea-surement time and be able to deal with shiny surfaces, butaccording to the experimental results displayed in the litera-ture, this approach does not significantly improve accuracy ofthe fused data. In Bešić et al.’s work [17], the introducedmethod is very intuitive and understandable. However, onlya plane is considered in the literature and, because each pointcloud data must be filtered before shifting, the usability isadversely affected. In general, the method introduced in thispaper reveals a better accuracy of data fusion than aboveapproaches.
The proposed multi-data compensation method has beenproven to work for geometric elements. Multi-sensor datafusion for freeform dimensional measurement or reverse en-gineering applications is another promising avenue for re-search. In addition, a cooperative and competitive integrationof the proposed multi-sensor measuring system would realizethe benefits of automatic digitization and would be especiallyvaluable for reconstruction of complex surfaces.
Acknowledgments The authors gratefully acknowledge the UK’s En-gineering and Physical Sciences Research Council (EPSRC) funding ofthe EPSRCCentre for InnovativeManufacturing in AdvancedMetrology(Grant Ref: EP/I033424/1).
Open Access This article is distributed under the terms of the CreativeCommons Attribution License which permits any use, distribution, andreproduction in any medium, provided the original author(s) and thesource are credited.
References
1. Weckenmann A, Jiang X, Sommer KD, Neuschaefer-Rube U,Seewig J, Shaw L, Estler T (2009) Multisensor data fusion in dimen-sional metrology. CIRPAnn Manuf Technol 58(2):701–721. doi:10.1016/j.cirp.2009.09.008
2. Weckenmann A, Estler T, Peggs G, McMurtry D (2004) Probingsystems in dimensional metrology. CIRPAnn Manuf Technol 53(2):657–684. doi:10.1016/s0007-8506(07)60034-1
3. Fan KC (1997) A non-contact automatic measurement for free-formsurface profiles. Comput Integr Manuf Syst 10(4):277–285. doi:10.1016/s0951-5240(97)00020-7
4. Zexiao X, Jianguo W, Ming J (2007) Study on a full field of viewlaser scanning system. Int J Mach Tools Manuf 47(1):33–43. doi:10.1016/j.ijmachtools.2006.02.015
5. Lee S-J, Chang D-Y (2006) A laser sensor with multiple detectors forfreeform surface digitization. Int J AdvManuf Technol 31(5–6):474–482. doi:10.1007/s00170-005-0212-9
6. Vukašinović N, Bračun D, Možina J, Duhovnik J (2010) Theinfluence of incident angle, object colour and distance onCNC laser scanning. Int J Adv Manuf Technol 50(1–4):265–274
7. Feng H-Y, Liu Y, Xi F (2001) Analysis of digitizing errors of a laserscanning system. Precis Eng 25(3):185–191. doi:10.1016/S0141-6359(00)00071-4
8. Durrant-Whyte HF (1988) Sensor models and multisensor integra-tion. Int J Robot Res 7(6):97–113
9. Várady T, Martin RR, Cox J (1997) Reverse engineering of geomet-ricmodels—an introduction. Comput AidedDes 29(4):255–268. doi:10.1016/s0010-4485(96)00054-1
10. Bradley C, Chan V (2001) A complementary sensor approach toreverse engineering. J Manuf Sci Eng 123(1):74–82
11. Zexiao X, Jianguo W, Qiumei Z (2005) Complete 3D measurementin reverse engineering using a multi-probe system. Int J Mach ToolsManuf 45(12–13):1474–1486. doi:10.1016/j.ijmachtools.2005.01.028
12. Chan VH, Bradley C, Vickers GW (2001) A multi-sensor approachto automating co-ordinate measuring machine-based reverse engi-neering. Comput Ind 44(2):105–115. doi:10.1016/s0166-3615(00)00087-7
13. Carbone V, Carocci M, Savio E, Sansoni G, De Chiffre L (2001)Combination of a vision system and a coordinate measuring machinefor the reverse engineering of freeform surfaces. Int J Adv ManufTechnol 17(4):263–271. doi:10.1007/s001700170179
14. Tzung-Sz S, Jianbing H, Chia-Hsiang M (2000) Multiple-sensorintegration for rapid and high-precision coordinate metrology.Mechatron IEEE/ASME Trans 5(2):110–121
15. Sladek J, Blaszczyk PM, Kupiec M, Sitnik R (2011) The hybridcontact-optical coordinate measuring system. Measurement 44(3):503–510. doi:10.1016/j.measurement.2010.11.013
16. Huang Y, Qian X (2007) A dynamic sensing-and-modeling approachto three-dimensional point-and area-sensor integration. Trans AmSoc Mech Eng J Manuf Sci Eng 129(3):623
17. Bešić I, Van Gestel N, Kruth J-P, Bleys P, Hodolič J (2011) Accuracyimprovement of laser line scanning for feature measurements onCMM. Opt Lasers Eng 49(11):1274–1280
18. Yang M, Lee E (1999) Segmentation of measured point data using aparametric quadric surface approximation. Comput Aided Des 31(7):449–457
19. Huang J, Menq CH (2001) Automatic data segmentation for geomet-ric feature extraction from unorganized 3-D coordinate points. RobotAutom IEEE Trans 17(3):268–279
20. Benkő P, Várady T (2004) Segmentation methods for smooth pointregions of conventional engineering objects. Comput Aided Des36(6):511–523
Int J Adv Manuf Technol (2014) 74:369–382 381
21. Demarsin K, Vanderstraeten D, Volodine T, Roose D (2007)Detection of closed sharp edges in point clouds using normal esti-mation and graph theory. Comput Aided Des 39(4):276–283
22. Besl PJ, Jain RC (1988) Segmentation through variable-order surfacefitting. Pattern Anal Mach Intell IEEE Trans 10(2):167–192
23. Chappuis C, Rassineux A, Breitkopf P, Villon P (2004) Improvingsurface meshing from discrete data by feature recognition. EngComput 20(3):202–209
24. Rabbani T, van DenHeuvel F, VosselmannG (2006) Segmentation ofpoint clouds using smoothness constraint. Int Arch PhotogrammRemote Sens Spat Inf Sci 36(5):248–253
25. Alrashdan A, Motavalli S, Fallahi B (2000) Automatic segmentationof digitized data for reverse engineering applications. IIE Trans 32(1):59–69
26. Woo H, Kang E, Wang S, Lee KH (2002) A new segmentationmethod for point cloud data. Int J Mach Tools Manuf 42(2):167–178
27. Liu Y, Xiong Y (2008) Automatic segmentation of unorganized noisypoint clouds based on the Gaussian map. Comput Aided Des 40(5):576–594
28. Forbes AB (1989) Least-squares best-fit geometric elements. NPLReport DITC 140/89. National Physical Laboratory Teddington,London
29. Lukács G, Martin R, Marshall D (1998) Faithful least-squares fittingof spheres, cylinders, cones and tori for reliable segmentation.In: Burkhardt H, Neumann B (eds) Computer Vision—ECCV′98.Lecture Notes in Computer Science, vol 1406. Springer, Heidelberg,pp 671–686. doi:10.1007/BFb0055697
30. Shakarji CM (1998) Least-squares fitting algorithms of the NISTalgorithm testing system. J Res Ntl Inst Stand Technol 103:633–641
31. Wedderburn RW (1974) Quasi-likelihood functions, generalized lin-earmodels, and theGauss—Newtonmethod. Biometrika 61(3):439–447
32. Hakala D, Hillyard R,Malraison P, Nource B (1981) Natural quadricsin mechanical design. Proc-AUTOFACT West 1:17–20
33. Miller JR (1988) Analysis of quadric-surface-based solid models.Comput Graph Appl IEEE 8(1):28–42
34. MortensonME (2006) Geometric modeling. Industrial Press, New York35. Kurfess TR, Banks DL (1995) Statistical verification of conformance
to geometric tolerance. Comput Aided Des 27(5):353–36136. Zhao H, Kruth J-P, Van Gestel N, Boeckmans B, Bleys P (2012)
Automated dimensional inspection planning using the combinationof laser scanner and tactile probe. Measurement 45(5):1057–1066
37. Li F, Longstaff AP, Fletcher S,Myers A (2014)A practical coordinateunification method for integrated tactile–optical measuring system.Opt Lasers Eng 55:189–196
382 Int J Adv Manuf Technol (2014) 74:369–382